Impact of the New Standard Reinsurance Agreement (SRA) on...
13
Impact of the New Standard Reinsurance Agreement (SRA) on Multi-Peril Crop Insurance (MPCI) Gain and Loss Probabilities Oscar Vergara 1 ([email protected]) Jack Seaquist ([email protected]) Gerhard Zuba ([email protected]) Matt Harrigan ([email protected]) Eric Lee ([email protected]) Selected Paper prepared for presentation at the Agricultural & Applied Economics Association’s 2011 AAEA & NAREA Joint Annual Meeting, Pittsburgh, Pennsylvania, July 24-26, 2011 Copyright 2011 by AIR Worldwide Corporation. All rights reserved. Readers may make verbatim copies of this document for non-commercial purposes by any means, provided that this copyright notice appears on all such copies. 1 Corresponding Author AIR Worldwide Corporation. 131 Dartmouth Street. Boston, MA 02116
Transcript of Impact of the New Standard Reinsurance Agreement (SRA) on...

Impact of the New Standard Reinsurance Agreement (SRA)
on Multi-Peril Crop Insurance (MPCI) Gain and Loss Probabilities
Oscar Vergara1 ([email protected])
Jack Seaquist
Gerhard Zuba ([email protected])
Matt Harrigan
Eric Lee ([email protected])
Selected Paper prepared for presentation at the Agricultural & Applied Economics Association’s 2011 AAEA & NAREA Joint Annual
Meeting, Pittsburgh, Pennsylvania, July 24-26, 2011
Copyright 2011 by AIR Worldwide Corporation. All rights reserved. Readers may
make verbatim copies of this document for non-commercial purposes by any means, provided that this copyright notice appears on all such copies.
1 Corresponding Author AIR Worldwide Corporation. 131 Dartmouth Street. Boston, MA 02116

May 1, 2011
Impact of the New Standard Reinsurance Agreement
on MPCI Gain and Loss Probabilities

Impact of the New SRA on MPCI Gain and Loss Probabilities
2
Copyright
2011 AIR Worldwide. All rights reserved.
Information in this document is subject to change without notice. No part of this document may be
reproduced or transmitted in any form, for any purpose, without the express written permission of
AIR Worldwide (AIR).
Trademarks
AIR Worldwide is a registered trademark.
Confidentiality
AIR invests substantial resources in the development of its models, modeling methodologies and
databases. This document contains proprietary and confidential information and is intended for the
exclusive use of AIR clients who are subject to the restrictions of the confidentiality provisions set forth
in license and other nondisclosure agreements.
Contact Information
If you have any questions regarding this document, contact:
Oscar Vergara
AIR Worldwide
131 Dartmouth Street
Boston, MA 02116-5134
USA
Tel: (617) 954-1906
Email: [email protected]

Impact of the New SRA on MPCI Gain and Loss Probabilities
3
Introduction The United States Department of Agriculture’s Risk Management Agency (RMA) offers protection to crop
insurers in the form of the Standard Reinsurance Agreement (SRA), allowing them to transfer risk to the
government by sharing specified levels of underwriting gains and losses. The 2008 Farm Bill enacted by
Congress allowed the RMA to renegotiate the SRA for the 2011 crop year and beyond, replacing the previous
version from 2005.
The changes, which were crystalized just this year, are significant and structural. One result is that reliance
on historical loss ratios for estimating gains and losses for the coming year—which has always been
problematical at best—is now even more ill-advised. It was in recognition of the limitations of the historical
data that AIR developed probabilisitic modeling techniques for estimating agricultural risk.
The AIR Multiple Peril Crop Insurance (MPCI) Model for the United States is a weather-based crop insurance
risk model that estimates underwriting gains and losses based on crop yield probabilities in the context of
current conditions, including agricultural technology, price volatility, crop insurance policy terms and
premium rates, farmer planting and insurance purchasing patterns, and terms of the government’s Standard
Reinsurance Agreement (SRA). AIR updates the model each year to include the latest data on each of these.
This year, the AIR model will reflect the changes to the Standard Reinsurance Agreement—changes that will
have a substantial impact on MPCI profitability and risk. In this paper, we examine the motivation behind
the change and its impact on MPCI industry gain and loss potential.
AIR MPCI Model Overview The AIR MPCI Model (Figure 1) provides fully probabilistic, county-level crop insurance loss analysis for
each major crop, policy type and coverage level. The model is based on high resolution historical weather
and soil data and the unique AIR Weather Index (AWI), which isolates the effects of weather on crop yields
from the long term trend introduced by technological advances in farming. The resulting detrended yield
probabilities provide significantly improved risk estimates.
Figure 1. Components of the AIR Multiple Peril Crop Insurance Model for the U.S.

Impact of the New SRA on MPCI Gain and Loss Probabilities
4
Market price volatility, a critical factor in revenue-based insurance policies, is captured in the yield/price
component of the AIR model. Incorporated in this component of the model are the most recent insurance
premium rates, selection of policy types, crop planting decisions, and USDA-specified loss thresholds.
Because premium rates by policy type and the mix of policy types have changed significantly over the years,
historical loss ratios are less relevant for determining potential losses for an upcoming year (see Figure 2).
Figure 2. Policy mix and premium rates can change d ramatically from year to year, as shown here for the state of Illinois
The AIR MPCI Model is updated annually to incorporate new data applicable to the upcoming crop year,
and periodically to reflect model enhancements. For the 2011 crop growing season, these updates include:
• Crop yield data at the county level from the National Agricultural Statistics Service (NASS) for the
2008 growing season;
• AWI values reflecting daily weather observations through 2008 are used to revise the technology
trends at the county level by crop, and county-level crop yield distributions were reestimated to
reflect the 2009 industry exposure;
• Industry exposure data through 2009 based on the latest information from the Risk Management
Agency (RMA), including industry premiums, policy type purchases, planted acreage, and SRA
fund allocations;
• Updated pricing model to reflect data up to 2009 and refined to improve the modeling of current
price volatility;
Impact of the New SRA on MPCI Gain and Loss Probabilities
5
• Support for the new Combo insurance policy type, replacing the traditional Revenue Insurance
policies;
• Enhanced relationship between losses from non-modeled crops and losses from detailed (through
AWI) modeled crops, and for losses due to prevented planting.
These changes allow for the most up-to-date analysis of MPCI risk in 2011. However, for 2011 there is an
additional model update that reflects the significant changes made by the RMA to the SRA for the upcoming
and subsequent seasons.
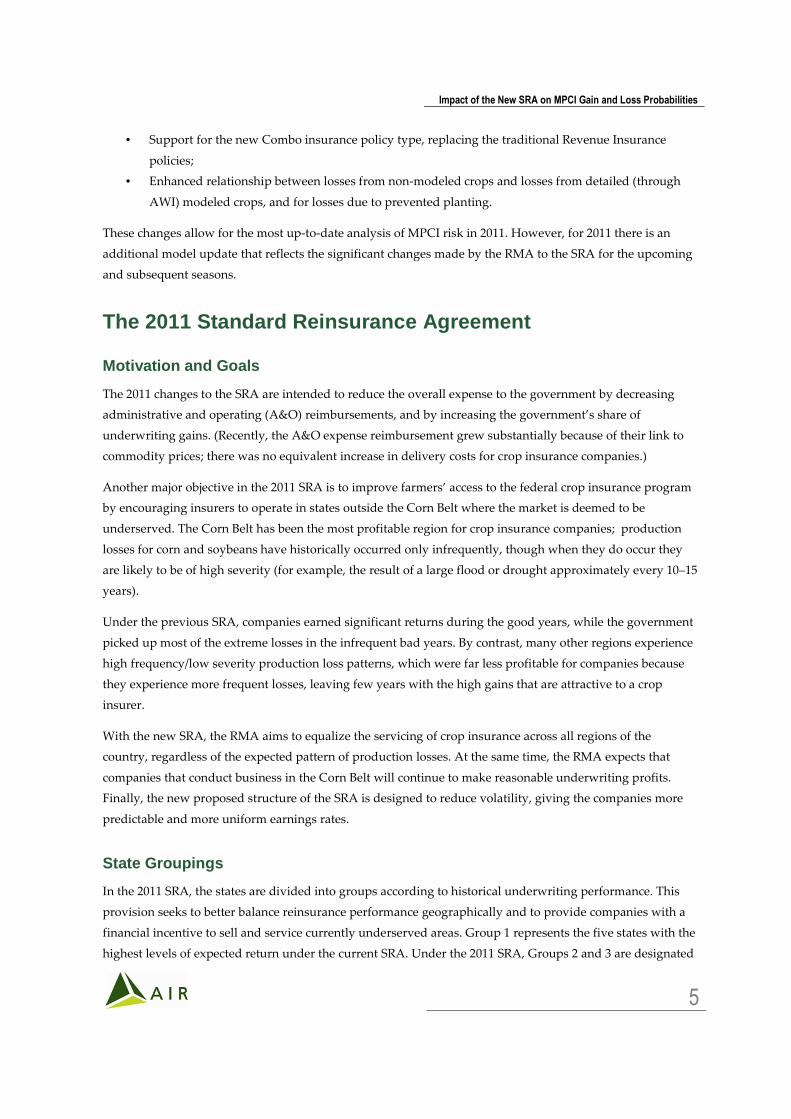
The 2011 Standard Reinsurance Agreement
Motivation and Goals
The 2011 changes to the SRA are intended to reduce the overall expense to the government by decreasing
administrative and operating (A&O) reimbursements, and by increasing the government’s share of
underwriting gains. (Recently, the A&O expense reimbursement grew substantially because of their link to
commodity prices; there was no equivalent increase in delivery costs for crop insurance companies.)
Another major objective in the 2011 SRA is to improve farmers’ access to the federal crop insurance program
by encouraging insurers to operate in states outside the Corn Belt where the market is deemed to be
underserved. The Corn Belt has been the most profitable region for crop insurance companies; production
losses for corn and soybeans have historically occurred only infrequently, though when they do occur they
are likely to be of high severity (for example, the result of a large flood or drought approximately every 10–15
years).
Under the previous SRA, companies earned significant returns during the good years, while the government
picked up most of the extreme losses in the infrequent bad years. By contrast, many other regions experience
high frequency/low severity production loss patterns, which were far less profitable for companies because
they experience more frequent losses, leaving few years with the high gains that are attractive to a crop
insurer.
With the new SRA, the RMA aims to equalize the servicing of crop insurance across all regions of the
country, regardless of the expected pattern of production losses. At the same time, the RMA expects that
companies that conduct business in the Corn Belt will continue to make reasonable underwriting profits.
Finally, the new proposed structure of the SRA is designed to reduce volatility, giving the companies more
predictable and more uniform earnings rates.
State Groupings
In the 2011 SRA, the states are divided into groups according to historical underwriting performance. This
provision seeks to better balance reinsurance performance geographically and to provide companies with a
financial incentive to sell and service currently underserved areas. Group 1 represents the five states with the
highest levels of expected return under the current SRA. Under the 2011 SRA, Groups 2 and 3 are designated

Impact of the New SRA on MPCI Gain and Loss Probabilities
6
to benefit from greater profit potential and lower risk compared to the current SRA and compared to Group 1
states. Figure 3 shows the state groupings under the new SRA.
Figure 3. State Groupings
State Group 1 includes Illinois, Indiana, Iowa, Minnesota, and Nebraska.
State Group 2 includes Alabama, Arizona, Arkansas, California, Colorado, Florida, Georgia, Idaho, Kansas,
Louisiana, Michigan, Missouri, Mississippi, Montana, North Carolina, North Dakota, New Mexico,
Oklahoma, Kentucky, Ohio, Oregon, South Carolina, South Dakota, Tennessee, Texas, Virginia, Washington,
and Wisconsin.
State Group 3 includes Alaska, Connecticut, Delaware, Hawaii, Maine, Maryland, Massachusetts, Nevada,
New Hampshire, New Jersey, New York, Pennsylvania, Rhode Island, Utah, Vermont, West Virginia, and
Wyoming.
Fund Designation and Risk Retention
Under the previous SRA, crop insurers allocated individual policies to one of three state-level funds:
Assigned Risk, Developmental, or Commercial. Within each of the latter two, there were three subfunds for
three types of policies: CAT (minimum yield coverage), Buy-up (yield coverage above the minimum), and
Revenue (revenue protection covering combined yield and price risk). This established seven distinct funds
in each of the 50 states, potentially resulting in a total of 350 funds for each company, each with its own
reinsurance structure.
The new SRA agreement has reduced the total number of potential funds per state from seven to two. The
Developmental Fund, which had been designed for medium risk policies, has been removed, and the three
subfund designations of the Commercial Fund have been removed as well. All policies assigned to the

Impact of the New SRA on MPCI Gain and Loss Probabilities
7
Commercial Fund in a state will be evaluated for gain or loss sharing with the government as a single entity,
instead of individually for each of the three subfunds.
As shown in Figure 4, each policy is designated by the insurer to either the Assigned Risk (for the riskiest
policies) or the Commercial Fund. In each state, the maximum that can be designated to the Assigned Risk
Fund is 75% by premium in that state. In the previous SRA, the maximum percentage varied by state. Once
the policies have been designated to a fund, the crop insurer then decides how much risk to retain for each
state-level Commercial Fund, subject to the rules. The crop insurer must retain 20% of the Assigned Risk
Fund in each state. This percentage previously varied by state over a small range. For the Commercial Fund,
the crop insurer may choose to retain a percentage from 35% to 100% of premium. The retained premium by
state and by fund is used to generate the estimated underwriting gains and losses in the AIR MPCI Model.
Figure 4. New 2011 SRA Fund Allocation Rules
Sharing of Underwriting Gains and Losses
The gain/loss sharing mechanism has also changed in the 2011 SRA. As in the previous SRA, the sharing of
gains and losses from the retained premium between the crop insurer and the government varies by the
performance of each fund in each state, with the measure of performance being the loss ratio. A loss ratio less
than 100% is an underwriting gain; a loss ratio above 100% is a loss. A comparison of crop insurer share
percentages under the new and old SRA is shown in Figure 5.

Impact of the New SRA on MPCI Gain and Loss Probabilities
8
Figure 5. Changes to Insurer’s Share of Retained Ga in/Loss (values under the previous SRA are shown in parentheses)
For the Commercial Fund in the new SRA, the sharing is different for Group 1 states than for Groups 2 and 3.
In Group 1, the portion of any gains between loss ratios of 65 to 100 are shared as follows: 75% to the insurer,
25% to the government. Previously, the crop insurer kept 75% for the CAT subfund and 94% for the Buy-up
and Revenue subfunds. As discussed above, these subfunds no longer exist. For the portion of any gain
representing a loss ratio below 65, the crop insurer keeps 40%, substantially less than under the old SRA.
With respect to losses, the crop insurer now keeps a larger share in Group 1 states, except for any portion of
the loss that exceeds 220% of premium where the share is now lower. For Group 2 and Group 3 states, the
crop insurer keeps more of the gains (except that portion that corresponds to loss ratios of less than 50) and
less of the loss than under the old SRA.
For the Assigned Risk Fund, for the 20% fixed premium retention, the crop insurer retains more gain and
more loss, though the percentages shared by the insurer are small.
The final gain/loss sharing calculation is the Net Book Quota Share (modeled in AIR software as
coinsurance), which applies to the combined net gain or loss across all funds and states. The new Net Book
Quota Share is set at 6.5%, compared to 5% previously, with 1.5 percentage points of any underwriting gain
to be distributed to those companies that service policyholders in 17 Group 3 states. Gains and losses after the
Net Book Quota share represent the exposure offered in the private reinsurance market.
Impact of SRA Changes on Modeled Losses AIR compared the modeled loss ratios under the old SRA with those under the new SRA using the updated
AIR MPCI Model. That is, the results in both cases reflect the updated historical data, including industry

Impact of the New SRA on MPCI Gain and Loss Probabilities
9
exposures, and enhancements to the AIR MPCI Model as described above. For the new SRA, all policies
previously in the Developmental Fund are assumed to be transferred to the Commercial Fund.
Figure 6 shows the change in industry loss ratios, post-SRA, for the entire United States. Nationwide, the
industry benefits from a diversity of climate, weather, and crops. With the incorporation of the new SRA in
the modeled results—in particular, with the new risk sharing rules and regulations—the (long term) average
annual loss ratio is higher, which means lower underwriting gains for the industry. At the 50% exceedance
probability (2-year return period), which is the median year (half of the years are better and half are worse),
the loss ratio is also higher, which again means less gain for the industry. There is little change in loss ratio
for the 10% to 5% exceedance probabilities (10-year to 50-year return periods). At lower exceedance
probabilities (higher return periods), there is a reduction in loss ratios. Thus the new SRA results in lower
gain potential as well as some reduced exposure to risk.
Figure 6. Impact of 2011 SRA Change – Total U.S.
The analysis above is for a fully diversified portfolio as represented by the entire industry. In practice,
however, very few crop insurers have exposures that mimic those of the industry as a whole. As previously
mentioned, insurers have historically flocked to the Group 1 states. Figure 7 compares performance under the
old and new SRA for a single state in Group 1, Illinois. As intended by the government, there is a substantial
increase in loss ratio for the profitable years (as indicated by the average annual and median year loss ratios),
which represents a substantial reduction in the average underwriting gain. There is increased loss at lower
exceedance probabilities up to the 1% (100-year) level, but a slight reduction in loss at the 0.2% exceedance
probability (500-year return period).

Impact of the New SRA on MPCI Gain and Loss Probabilities
10
Figure 7. Impact of 2011 SRA Change – Illinois
Figure 8 shows the change in loss ratios for Texas, a Group 2 state, which the RMA has targeted for increased
profit potential and reduced risk of loss. The model results show a slight decrease in loss ratio for the average
annual and median year values (slightly increased profit). There is little change in risk of loss, however,
except at the lower exceedance probabilities, which do see a slight reduction in loss ratios.
Figure 8. Impact of 2011 SRA Change – Texas
Conclusion Because several of the changes to the 2011 Standard Reinsurance Agreement are structural, the usefulness of
historical loss experience data for estimating crop insurance underwriting gains and losses for the upcoming
year— which was limited to begin with— is yet further diminished. Results from the AIR Multiple Peril Crop

Impact of the New SRA on MPCI Gain and Loss Probabilities
11
Insurance Model indicate that, in general, companies with exposure in Group 1 states should expect reduced
gain and higher losses, while companies with exposure in other states should expect higher gains with little
change in loss potential.
However, typical crop insurance programs consist of multiple states in varying market shares. Each
individual crop insurer’s program will experience different changes in exceedance probabilities depending
on their individual market share by state, mix of policy types written, portion of policies designated to the
Assigned Risk Funds by policy type, and the amount of premium retained in the Commercial Funds.
For the 2011 crop year, the AIR Multiple Peril Crop Insurance Model has been updated with the most current
data and has been reprogrammed to calculate the conditions of the new SRA for analyzing crop insurer
programs, stop-loss and quota share reinsurance programs, and portfolios of reinsurance programs. AIR’s
industry-standard CATRADER® application provides program analysis for all MPCI crop insurer
reinsurance submissions and complete, multi-program portfolio loss analysis (see the AIR Multiple Peril
Crop Model Brochure for a more detailed description of the model). Results from the AIR MPCI model allow
crop insurers to make better decisions in fund allocation and retention level strategies to better manage this
complex risk.

Impact of the New SRA on MPCI Gain and Loss Probabilities
12
About AIR Worldwide AIR Worldwide (AIR) is the scientific leader and most respected provider of risk modeling software and
consulting services. AIR founded the catastrophe modeling industry in 1987 and today models the risk from
natural catastrophes and terrorism in more than 50 countries. More than 400 insurance, reinsurance, financial,
corporate, and government clients rely on AIR software and services for catastrophe risk management,
insurance-linked securities, detailed site-specific wind and seismic engineering analyses, agricultural risk
management, and property replacement-cost valuation. AIR is a member of the ISO family of companies and
is headquartered in Boston with additional offices in North America, Europe, and Asia. For more
information, please visit www.air-worldwide.com.