Impact of Symmetric Vertical Sinusoid Alignments on ...
12
ORIGINAL RESEARCH PAPERS Impact of Symmetric Vertical Sinusoid Alignments on Infrastructure Construction Costs: Optimizing Energy Consumption in Metropolitan Railway Lines Using Artificial Neural Networks J Pineda-Jaramillo 1 • P. Salvador-Zuriaga 2 • P. Martı ´nez-Ferna ´ndez 2 • R. Insa-Franco 2 Received: 11 March 2019 / Revised: 20 December 2019 / Accepted: 1 June 2020 / Published online: 2 July 2020 Ó The Author(s) 2020 Abstract Minimizing energy consumption is a key issue from both an environmental and economic perspectives for railways systems; however, it is also important to reduce infrastructure construction costs. In the present work, an artificial neural network (ANN) was trained to estimate the energy consumption of a metropolitan railway line. This ANN was used to test hypothetical vertical alignments scenarios, proving that symmetric vertical sinusoid align- ments (SVSA) can reduce energy consumption by up to 18.4% compared with a flat alignment. Finally, we ana- lyzed the impact of SVSA application on infrastructure construction costs, considering different scenarios based on top–down excavation methods. When balancing reduction in energy consumption against infrastructure construction costs between SVSA and flat alignment, the extra con- struction costs due to SVSA have a return period of 25–300 years compared with a flat alignment, depending on the soil type and construction method used. Symmetric vertical sinusoid alignment layouts are thus suitable for scattered or soft soils, up to compacted intermediate geomaterials. Keywords Infrastructure construction costs on railways Symmetric vertical sinusoid alignments Optimization of energy consumption Artificial neural networks (ANN) 1 Introduction The International Energy Agency reported up to 9555 million tonnes of oil equivalent (Mtoe) of energy con- sumption in the world in 2016. The transport sector con- sumes 28.8% of that energy, hence demonstrating its significant impact on global energy consumption [1]. Railways are more efficient in terms of energy con- sumption than road transport for both passengers and freight [2–4]. For example, despite carrying about 8% and 17% of passengers and freight across Europe, respectively (EU-28), European railways only represent about 2% of the energy consumed by the transportation sector [5]. How- ever, it is necessary to continue reducing railways energy consumption so as to improve its competitiveness. For this reason, many strategies have been implemented to improve railways efficiency, focused on aspects as diverse as track geometry, rolling stock, driving schemes, or line operation. The most common strategy is to focus on driving schemes because these allow higher rates of efficiency [6–8]. Previous studies have tried to reduce energy con- sumption focusing on manually driven trains [9, 10] and on trains equipped with automatic train operation as well [11]. This kind of strategy has been studied for metropolitan rail lines [12], freight rail lines [13–15], and high-speed rail lines [16]. Alternatively, other authors have proposed to modify rolling stock parameters to optimize energy consumption. For instance, various studies have focused on the imple- mentation of regenerative brake [17, 18], on-board storage systems [19], and consideration of train load variations and delays as well [12]. Finally, some authors have focused on optimizing track geometry to reduce energy consumption [20–24]. & J Pineda-Jaramillo [email protected] 1 Planning Department Office, Government of Antioquia, Medellı ´n, Colombia 2 Department of Transport Infrastructure and Engineering, Universitat Polite `cnica de Vale `ncia, Valencia, Spain Communicated by Xuesong Zhou. 123 Urban Rail Transit (2020) 6:145–156 https://doi.org/10.1007/s40864-020-00130-7 http://www.urt.cn/
Transcript of Impact of Symmetric Vertical Sinusoid Alignments on ...
ORIGINAL RESEARCH PAPERS
Impact of Symmetric Vertical Sinusoid Alignmentson Infrastructure Construction Costs: Optimizing EnergyConsumption in Metropolitan Railway Lines Using ArtificialNeural Networks
J Pineda-Jaramillo1 • P. Salvador-Zuriaga2 • P. Martınez-Fernandez2 •
R. Insa-Franco2
Received: 11 March 2019 / Revised: 20 December 2019 / Accepted: 1 June 2020 / Published online: 2 July 2020
� The Author(s) 2020
Abstract Minimizing energy consumption is a key issue
from both an environmental and economic perspectives for
railways systems; however, it is also important to reduce
infrastructure construction costs. In the present work, an
artificial neural network (ANN) was trained to estimate the
energy consumption of a metropolitan railway line. This
ANN was used to test hypothetical vertical alignments
scenarios, proving that symmetric vertical sinusoid align-
ments (SVSA) can reduce energy consumption by up to
18.4% compared with a flat alignment. Finally, we ana-
lyzed the impact of SVSA application on infrastructure
construction costs, considering different scenarios based on
top–down excavation methods. When balancing reduction
in energy consumption against infrastructure construction
costs between SVSA and flat alignment, the extra con-
struction costs due to SVSA have a return period of
25–300 years compared with a flat alignment, depending
on the soil type and construction method used. Symmetric
vertical sinusoid alignment layouts are thus suitable for
scattered or soft soils, up to compacted intermediate
geomaterials.
Keywords Infrastructure construction costs on railways �Symmetric vertical sinusoid alignments � Optimization of
energy consumption � Artificial neural networks (ANN)
1 Introduction
The International Energy Agency reported up to 9555
million tonnes of oil equivalent (Mtoe) of energy con-
sumption in the world in 2016. The transport sector con-
sumes 28.8% of that energy, hence demonstrating its
significant impact on global energy consumption [1].
Railways are more efficient in terms of energy con-
sumption than road transport for both passengers and
freight [2–4]. For example, despite carrying about 8% and
17% of passengers and freight across Europe, respectively
(EU-28), European railways only represent about 2% of the
energy consumed by the transportation sector [5]. How-
ever, it is necessary to continue reducing railways energy
consumption so as to improve its competitiveness. For this
reason, many strategies have been implemented to improve
railways efficiency, focused on aspects as diverse as track
geometry, rolling stock, driving schemes, or line operation.
The most common strategy is to focus on driving
schemes because these allow higher rates of efficiency
[6–8]. Previous studies have tried to reduce energy con-
sumption focusing on manually driven trains [9, 10] and on
trains equipped with automatic train operation as well [11].
This kind of strategy has been studied for metropolitan
rail lines [12], freight rail lines [13–15], and high-speed rail
lines [16].
Alternatively, other authors have proposed to modify
rolling stock parameters to optimize energy consumption.
For instance, various studies have focused on the imple-
mentation of regenerative brake [17, 18], on-board storage
systems [19], and consideration of train load variations and
delays as well [12]. Finally, some authors have focused on
optimizing track geometry to reduce energy consumption
[20–24].
& J Pineda-Jaramillo
1 Planning Department Office, Government of Antioquia,
Medellın, Colombia
2 Department of Transport Infrastructure and Engineering,
Universitat Politecnica de Valencia, Valencia, Spain
Communicated by Xuesong Zhou.
123
Urban Rail Transit (2020) 6:145–156
https://doi.org/10.1007/s40864-020-00130-7 http://www.urt.cn/
These varied research strategies show that a wide range
of actions may be taken within the railway sector to con-
tinue improving energy efficiency and achieving the
objective of reducing the transport sector carbon footprint.
This will also improve the competitiveness of the railways
sector against other transportation modes within the
framework of a more sustainable world.
Regarding the modeling of energy consumption through
artificial neural network (ANN) models, authors have used
them to disaggregate household electricity consumption
[25] and to predict energy consumption in supermarkets
[26], bioclimatic buildings [27], and hotel rooms [28],
obtaining interesting results.
In the railway field, Aolfazli et al. [29] built an ANN
model to predict oil consumption in the Iranian rail trans-
port, and Feng et al. [30] developed an ANN model to
estimate energy consumption due to traction on a subway
line.
Concerning infrastructure construction costs, authors
have shown that it is hard to find common variables that
influence such costs. This is mainly due to the economic
and geographical differences presented by each case study
[31–35].
Available construction techniques, type of soil, local
prices, or costs for every work unit may also vary the
overall infrastructure construction costs as well [36–38].
A key factor that explains these cost variations among
railway projects is the cost of establishing the corridor,
including expropriations. This cost may be as low as
USD 10 million/km for a railway with no payment for
building permissions or may be more than USD 200 mil-
lion/km for a subway line in a difficult urban topography.
In the latter, high expropriation costs, problematic geology,
high costs of relocation, and compensation for existing
companies and residents must be taken into account [39].
Infrastructure construction costs are also influenced by the
quality of management, environmental limitations, and
safety requirements [40].
The purpose of this paper is to measure the impact of
symmetric vertical sinusoid alignments on infrastructure
construction costs and to compare this with the reduction of
energy consumption provided by such vertical alignments.
The importance of this research lies in the existence of a
knowledge gap in evaluating energy-efficient geometrical
alignments against their extra construction costs.
This paper expands our previous research [21, 41, 42],
where we developed an ANN model able to predict the
energy consumption of a metropolitan railway line using
measured data. In this paper, we use it to compare the
energy consumption of different vertical alignments, aim-
ing to reduce energy consumption between two stations
with the same elevation.
2 Methodology
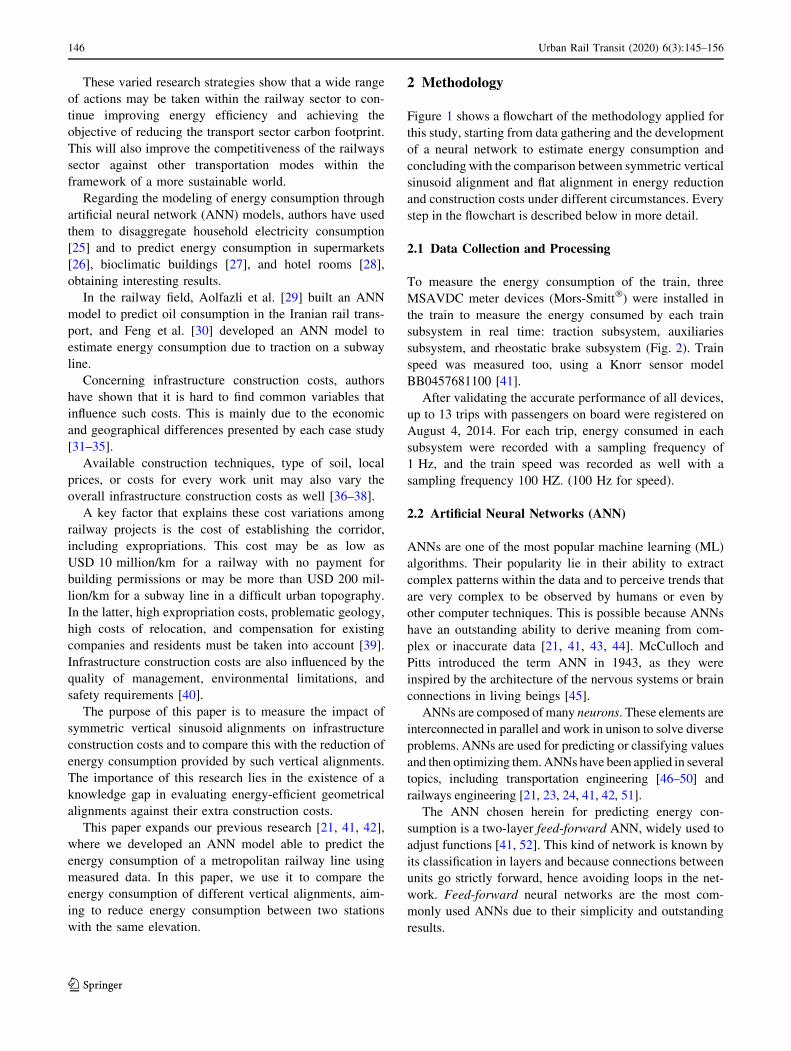
Figure 1 shows a flowchart of the methodology applied for
this study, starting from data gathering and the development
of a neural network to estimate energy consumption and
concluding with the comparison between symmetric vertical
sinusoid alignment and flat alignment in energy reduction
and construction costs under different circumstances. Every
step in the flowchart is described below in more detail.
2.1 Data Collection and Processing
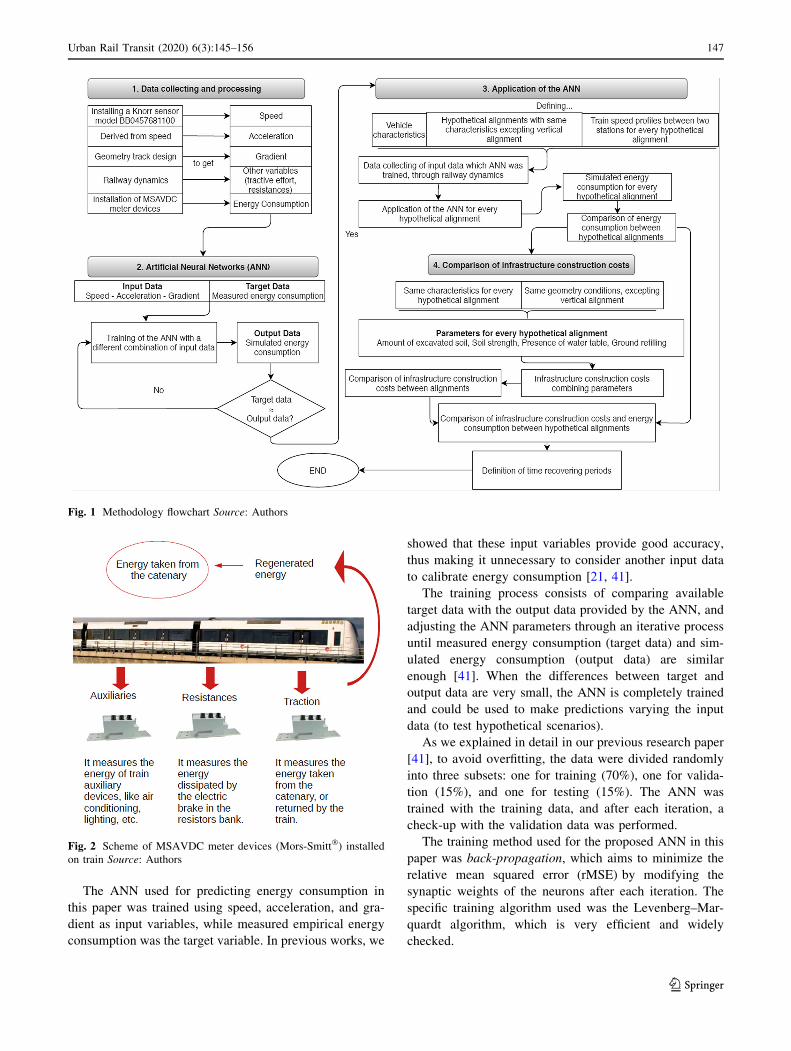
To measure the energy consumption of the train, three
MSAVDC meter devices (Mors-Smitt�) were installed in
the train to measure the energy consumed by each train
subsystem in real time: traction subsystem, auxiliaries
subsystem, and rheostatic brake subsystem (Fig. 2). Train
speed was measured too, using a Knorr sensor model
BB0457681100 [41].
After validating the accurate performance of all devices,
up to 13 trips with passengers on board were registered on
August 4, 2014. For each trip, energy consumed in each
subsystem were recorded with a sampling frequency of
1 Hz, and the train speed was recorded as well with a
sampling frequency 100 HZ. (100 Hz for speed).
2.2 Artificial Neural Networks (ANN)
ANNs are one of the most popular machine learning (ML)
algorithms. Their popularity lie in their ability to extract
complex patterns within the data and to perceive trends that
are very complex to be observed by humans or even by
other computer techniques. This is possible because ANNs
have an outstanding ability to derive meaning from com-
plex or inaccurate data [21, 41, 43, 44]. McCulloch and
Pitts introduced the term ANN in 1943, as they were
inspired by the architecture of the nervous systems or brain
connections in living beings [45].
ANNs are composed of many neurons. These elements are
interconnected in parallel and work in unison to solve diverse
problems. ANNs are used for predicting or classifying values
and then optimizing them.ANNs have been applied in several
topics, including transportation engineering [46–50] and
railways engineering [21, 23, 24, 41, 42, 51].
The ANN chosen herein for predicting energy con-
sumption is a two-layer feed-forward ANN, widely used to
adjust functions [41, 52]. This kind of network is known by
its classification in layers and because connections between
units go strictly forward, hence avoiding loops in the net-
work. Feed-forward neural networks are the most com-
monly used ANNs due to their simplicity and outstanding
results.
146 Urban Rail Transit (2020) 6(3):145–156
123
The ANN used for predicting energy consumption in
this paper was trained using speed, acceleration, and gra-
dient as input variables, while measured empirical energy
consumption was the target variable. In previous works, we
showed that these input variables provide good accuracy,
thus making it unnecessary to consider another input data
to calibrate energy consumption [21, 41].
The training process consists of comparing available
target data with the output data provided by the ANN, and
adjusting the ANN parameters through an iterative process
until measured energy consumption (target data) and sim-
ulated energy consumption (output data) are similar
enough [41]. When the differences between target and
output data are very small, the ANN is completely trained
and could be used to make predictions varying the input
data (to test hypothetical scenarios).
As we explained in detail in our previous research paper
[41], to avoid overfitting, the data were divided randomly
into three subsets: one for training (70%), one for valida-
tion (15%), and one for testing (15%). The ANN was
trained with the training data, and after each iteration, a
check-up with the validation data was performed.
The training method used for the proposed ANN in this
paper was back-propagation, which aims to minimize the
relative mean squared error (rMSE) by modifying the
synaptic weights of the neurons after each iteration. The
specific training algorithm used was the Levenberg–Mar-
quardt algorithm, which is very efficient and widely
checked.
Fig. 1 Methodology flowchart Source: Authors
Fig. 2 Scheme of MSAVDC meter devices (Mors-Smitt�) installed
on train Source: Authors
Urban Rail Transit (2020) 6(3):145–156 147
123

When the validation rMSE begins to increase (while the
training rMSE continues to drop), the network will start to
adjust the data error (overfitting), and the training will be
stopped. At this point, the test data are used to perform a
final check-up for the validity of the ANN.
2.3 Application of ANN Model
After the ANN model being trained, the application of the
ANN model was then carried out. In the application of the
ANN model, three hypothetical scenarios were specified
with their respective speed profile, considering optimal
indications for efficient driving between two stations [52].
The following assumptions were considered to make an
integrated analysis of vertical alignment and speed profiles
for these hypothetical vertical alignments [53]:
• The vertical track layout is symmetrical with respect to
the central axis.
• Parabolic curvatures are applied to vertical curves,
while the gradient cannot exceed the maximum climb-
ing capacity of the train.
• Horizontal curvatures are not considered for this
analysis.
• The train accelerates to its full power unless it surpasses
the comfort-limited acceleration.
• Braking system can provide the maximum allowable
comfort-limited deceleration rate.
The three scenarios have the same characteristics: a
1000-m long track stretch between two stations of equal
elevation. The three scenarios only differ in their vertical
alignment. Figure 3 shows the three hypothetical scenarios.
• The first one is a flat alignment;
• the second one is a symmetric vertical sinusoid
aligment profile with a maximum depth of d = 10 m
(1.0% of the total track length) halfway between both
stations of d = 5 m (0.5% of the total track length); and
• the last scenario is a symmetric vertical sinusoid
aligment profile with a maximum depth of d = 10 m
(1.0% of the total track length) halfway between both
stations of d = 10 m [21].
Once the hypothetical scenarios were determined, the
trained ANN was applied to predict the energy consump-
tion (output) corresponding to each hypothetical alignment
using speed, acceleration, and gradient as input variables.
To do so, a speed profile was defined for each hypo-
thetical scenario based on the theoretical basis of efficient
driving: the train accelerates until reaching a cruising speed
and then coasts without applying traction force until it
begins to apply braking to reach the final station. To cal-
culate the speed profile for each hypothetical scenario, the
characteristics of the Metro Series 4300 (Vossloh) were
considered, and resistance to movement was calculated
using the Davis equation, which is a well-known resistance
formula.
Finally, the energy consumption due to each scenario
calculated using the three input variables defined above
(speed, acceleration, and gradient) were compared among
them to determine the vertical alignment with the lowest
energy consumption. Note that speed optimization was not
considered in this paper, as travel time was verified to be
the same for each vertical alignment.
Also, it is important to mention that the three hypo-
thetical scenarios were chosen in an empirical way. This
paper does not aim to determine the optimal symmetric
vertical sinusoid aligment depth to optimize energy con-
sumption but to analyze the balance between energy sav-
ings and construction costs. A proper depth optimization
could be carried out in future works.
2.4 Comparison of Infrastructure Construction
Costs
Knowing the energy consumption in every hypothetical
alignment [21], the differences in infrastructure construc-
tion costs were then analyzed to find the best hypothetical
alignment as a balance between energy consumption and
infrastructure construction costs. This analysis may help
stakeholders in their decision-making process to find
whether it is worth to potentially increase construction
costs to reduce later operational costs.
The assumptions made for this comparison rely on the
basis that all three alignments are entirely constructed
below the ground level, i.e., in tunnel section, as this is the
most usual situation in metropolitan railways. This is
achieved by means of tunneling and excavation methods.
In such methods, we will consider the amount of excavated
soil, the soil strength, the presence of water table, and the
ground refilling as influent parameters on infrastructure
construction costs. Other parameters such as tunnel length
and section are not considered since these remain invari-
able among the different considered alignments. This
analysis is carried out in Sect. 4.3.
3 Case Study
3.1 Input Data
Line 5 of MetroValencia in Spain has 12.95 km and 18
stations. We studied a 2720-m-long track stretch within
said Line 5 between the Marıtim-Serrerıa and Alameda
stations.
As we showed in previous studies [21, 41], the input
variables chosen to train the ANN model were speed,
acceleration, and gradient.
148 Urban Rail Transit (2020) 6(3):145–156
123

As explained above, speed was directly measured using
a Knorr sensor model BB0457681100. Acceleration was
derived from speed. Figure 4 shows speed and acceleration
signals registered during the first trip.
As for the gradient, there is a maximum gradient of
20 mm/m between the Marıtim-Serrerıa and Alameda sta-
tions (Fig. 5).
3.2 Target Data
The monitored train was a Metro Series 4300 (Vossloh)
with four cars, whose main characteristics are:
• Max. speed: 80 km/h
• Nominal tension: 1500 V DC
• Power: 1480 kW
Energy consumption measured as described above was used
as target data for training ANN. Figure 6 shows an example
of the registered energy consumption on the first trip from
Marıtim-Serrerıa to Alameda. The blue rectangles in Fig. 6
represent the five stations from Marıtim-Serrerıa to Ala-
meda, which are Maritim-Serrerıa, Ayora, Amistat, Aragon,
and Alameda respectively from left to right.
4 Results and Discussion
4.1 Training of the ANN
Different tests were performed by combining the input
variables previously defined to identify which of these
input variables better fit the target data. Two criteria were
used to assess the performance of the ANN model [54]:
-12
-10
-8
-6
-4
-2
0
2
0 100 200 300 400 500 600 700 800 900 1000
Elev
a�on
[m]
Distance [m]
Flat alignment SVSA max depth δ = 5 m SVSA max depth δ = 10 m
Fig. 3 Hypothetical scenarios of vertical alignments of different maximum depths between two stations Source: Authors
-1.500
-1.000
-0.500
0.000
0.500
1.000
1.500
0.000
5.000
10.000
15.000
20.000
25.000
30.000
35.000
40.000
45.000
0 19 38 57 76 95 114
133
152
171
190
209
228
247
266
285
304
323
342
361
380
399
418
437
456
475
494
513
532
551
570
Acc
eler
a�on
[m/s
2]
Spee
d[km
/h]
Time [s]
Speed Accelera�on
Fig. 4 Speed and acceleration of the first trip between Marıtim-Serrerıa and Alameda Source: Line 5 of MetroValencia in Spain, by the Authors
Urban Rail Transit (2020) 6(3):145–156 149
123

• Pearson correlation coefficient (R) between target and
output data must be greater than 90%.
• Mean square error between target and output data must
represent only 20% or less of the target data variance
[or, in other words, relative mean squared error (rMSE)
must be less than 20%].
The training and validation of the ANN model were
performed using the Neural Fitting Tool in MATLAB
R2017a.
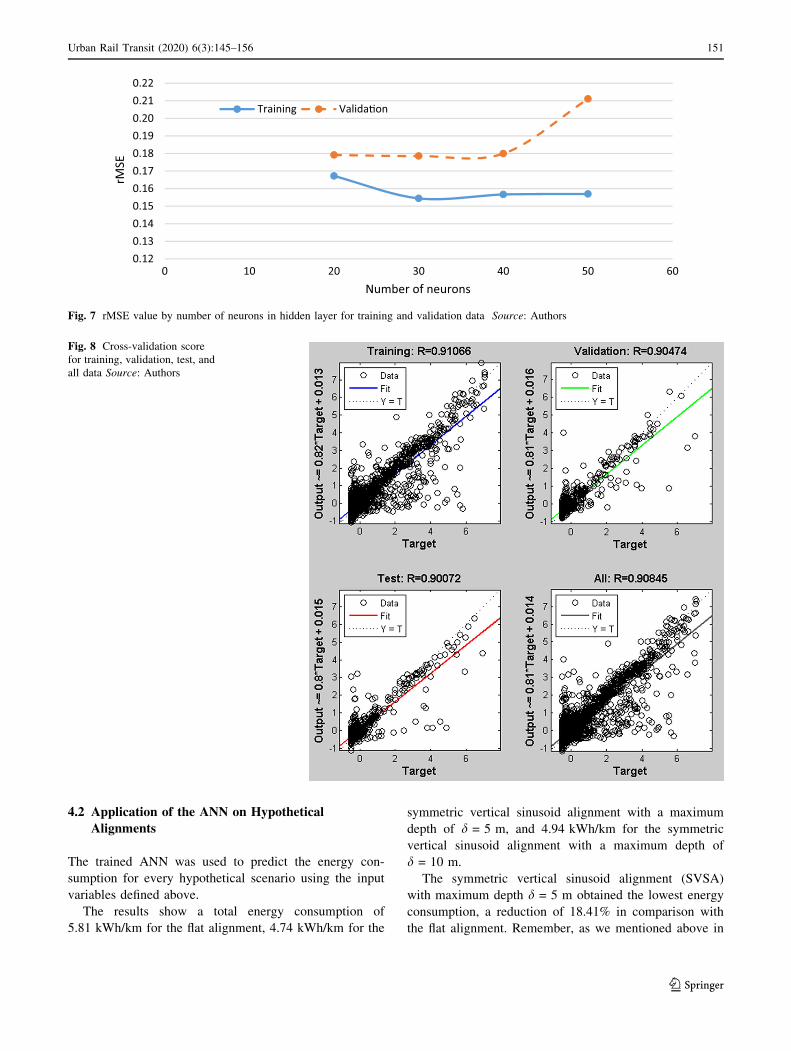
The neural network size was determined studying rMSE
values for training and validation data, with their variation
depending on the number of neurons in the hidden layer.
After testing different number of neurons (Fig. 7), we
found that the optimal network size was 30, because more
neurons will increase validation rMSE [41].
After the training process, we analyzed the cross-vali-
dation score between target and output for training,
validation, and test data, achieving an overall correlation of
90.85% (see Fig. 8).
After several combinations, we have shown in previous
research [41] that the model satisfies both criteria using
speed, acceleration, and gradient as input variables. These
variables have thus a significant impact on energy con-
sumption in metropolitan railway lines.
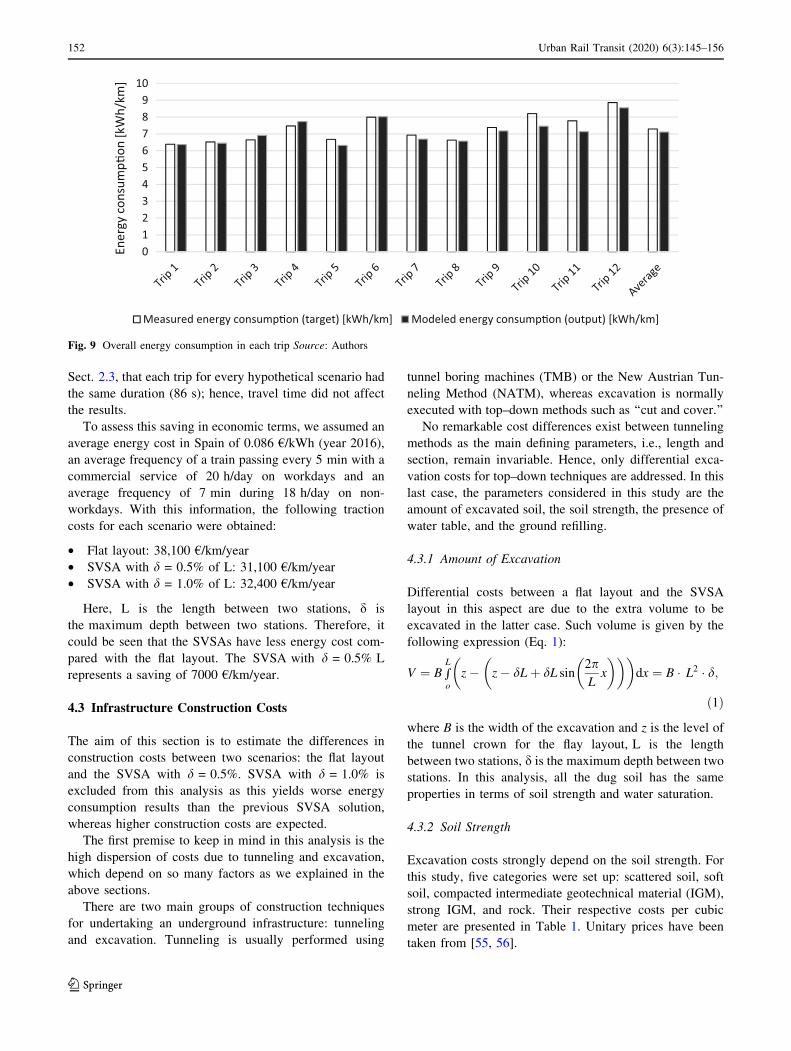
Results show an average registered energy consumption
of 7.29 kWh/km (shown in Fig. 9), while the model pre-
dicts an energy consumption of 7.11 kWh/km: the differ-
ence between both values is just 0.176 kWh/km (2.4%).
Note that every trip was the same in terms of train load and
number of intermediate stops between the first and last
stations (shown in Fig. 6).
Fig. 5 Vertical layout and stations of the studied route Source: Line 5 of MetroValencia in Spain, by the Authors
0
200
400
600
800
1000
1200
1400
1600
0 15 30 45 60 75 90 105
120
135
150
165
180
195
210
225
240
255
270
285
300
315
330
345
360
375
390
405
420
435
450
465
480
495
510
525
540
555
570
Inst
anta
neou
s Po
wer
[kW
]
Time [s]
Fig. 6 An example of the registered energy consumption on the first trip from Marıtim-Serrerıa to Alameda Source: Authors
150 Urban Rail Transit (2020) 6(3):145–156
123
4.2 Application of the ANN on Hypothetical
Alignments
The trained ANN was used to predict the energy con-
sumption for every hypothetical scenario using the input
variables defined above.
The results show a total energy consumption of
5.81 kWh/km for the flat alignment, 4.74 kWh/km for the
symmetric vertical sinusoid alignment with a maximum
depth of d = 5 m, and 4.94 kWh/km for the symmetric
vertical sinusoid alignment with a maximum depth of
d = 10 m.
The symmetric vertical sinusoid alignment (SVSA)
with maximum depth d = 5 m obtained the lowest energy
consumption, a reduction of 18.41% in comparison with
the flat alignment. Remember, as we mentioned above in
0.12
0.13
0.14
0.15
0.16
0.17
0.18
0.19
0.20
0.21
0.22
0 10 20 30 40 50 60
rMSE
Number of neurons
Training Valida�on
Fig. 7 rMSE value by number of neurons in hidden layer for training and validation data Source: Authors
Fig. 8 Cross-validation score
for training, validation, test, and
all data Source: Authors
Urban Rail Transit (2020) 6(3):145–156 151
123
Sect. 2.3, that each trip for every hypothetical scenario had
the same duration (86 s); hence, travel time did not affect
the results.
To assess this saving in economic terms, we assumed an
average energy cost in Spain of 0.086 €/kWh (year 2016),
an average frequency of a train passing every 5 min with a
commercial service of 20 h/day on workdays and an
average frequency of 7 min during 18 h/day on non-
workdays. With this information, the following traction
costs for each scenario were obtained:
• Flat layout: 38,100 €/km/year
• SVSA with d = 0.5% of L: 31,100 €/km/year
• SVSA with d = 1.0% of L: 32,400 €/km/year
Here, L is the length between two stations, d is
the maximum depth between two stations. Therefore, it
could be seen that the SVSAs have less energy cost com-
pared with the flat layout. The SVSA with d = 0.5% L
represents a saving of 7000 €/km/year.
4.3 Infrastructure Construction Costs
The aim of this section is to estimate the differences in
construction costs between two scenarios: the flat layout
and the SVSA with d = 0.5%. SVSA with d = 1.0% is
excluded from this analysis as this yields worse energy
consumption results than the previous SVSA solution,
whereas higher construction costs are expected.
The first premise to keep in mind in this analysis is the
high dispersion of costs due to tunneling and excavation,
which depend on so many factors as we explained in the
above sections.
There are two main groups of construction techniques
for undertaking an underground infrastructure: tunneling
and excavation. Tunneling is usually performed using
tunnel boring machines (TMB) or the New Austrian Tun-
neling Method (NATM), whereas excavation is normally
executed with top–down methods such as ‘‘cut and cover.’’
No remarkable cost differences exist between tunneling
methods as the main defining parameters, i.e., length and
section, remain invariable. Hence, only differential exca-
vation costs for top–down techniques are addressed. In this
last case, the parameters considered in this study are the
amount of excavated soil, the soil strength, the presence of
water table, and the ground refilling.
4.3.1 Amount of Excavation
Differential costs between a flat layout and the SVSA
layout in this aspect are due to the extra volume to be
excavated in the latter case. Such volume is given by the
following expression (Eq. 1):
V ¼ B rL
o
z� z� dLþ dL sin2pLx
� �� �� �dx ¼ B � L2 � d;
ð1Þ
where B is the width of the excavation and z is the level of
the tunnel crown for the flay layout, L is the length
between two stations, d is the maximum depth between two
stations. In this analysis, all the dug soil has the same
properties in terms of soil strength and water saturation.
4.3.2 Soil Strength
Excavation costs strongly depend on the soil strength. For
this study, five categories were set up: scattered soil, soft
soil, compacted intermediate geotechnical material (IGM),
strong IGM, and rock. Their respective costs per cubic
meter are presented in Table 1. Unitary prices have been
taken from [55, 56].
0123456789
10
Ener
gy c
onsu
mp�
on [k
Wh/
km]
Measured energy consump�on (target) [kWh/km] Modeled energy consump�on (output) [kWh/km]
Fig. 9 Overall energy consumption in each trip Source: Authors
152 Urban Rail Transit (2020) 6(3):145–156
123

4.3.3 Water Table
In totally or partially water-saturated soils, it is necessary to
drawdown the water table below the deepest excavation level.
This lowering must be maintained during the whole excava-
tion period until the excavation is waterproofed. Common
drawdown water table methods can be grouped in exclusion
and dewatering methods. The former group includes low-
permeability walls, grouting methods, ground freezing, or
fluid pressure. The latter group includes methods such as
wellpoints, injection wellpoints, or deep wellpoints [57].
Although the most suitable drawdown method varies
depending on the depth, soil nature, and water flow, for this
example, a deep wellpoint method was considered, with an
estimated unitary cost of 4.83 €/h.
4.3.4 Ground Refilling
Whereas, in some cases, the gap left by the SVSA layout
above the tunnel comparedwith the flat layoutmaybeused for
other purposes (e.g., parking, storing, commercial uses, etc.),
in other cases, this volumemust be refilled, which is normally
done with the same soil extracted from the excavation. For
these cases, a refilling cost of 2.02 €/m3 was considered.
4.4 Discussion
Figure 9 shows that the trained ANN model can predict the
energy consumption well enough as we presented in Ref. 41.
This trainedANNmodel with three input variables makes
an accurate prediction of the energy consumption by a train if
each input variable is always within the range considered
during training.With that precaution inmind, theANNcould
be used to test scenarios such as other hypothetical align-
ments, looking for reducing energy consumption.
In this study, the trained ANN was used to obtain the
energy consumed by a train passing along a 1000-m-long
track stretch between two stations with the same elevation
and a different hypothetical alignment. It was found that
the SVSA with a maximum depth of d = 5 m yielded the
lowest energy consumption, reducing it by 18.4% com-
pared with the flat alignment. This reduction is due to
gravity, which contributes both to acceleration and braking
thanks to the gradient variation. For a metro network with a
commercial service such as the one shown in Sect. 4.2, this
means a saving of 7000 €/km/year.
Whereas this saving can be directly computed if the
infrastructure is constructed using the TBM or NATM
methods (since there are no remarkable cost differences
between both layouts), it must be compared with the extra
costs of excavation when a top–down procedure is utilized.
For this last case, together with the five soil classes
described above, four different scenarios were considered:
only excavation (E), excavation plus water table drawdown
(E ? WTD), excavation and refilling (E ? R), and exca-
vation with water table drawdown and refilling (E ?
WTD ? R). Table 2 presents the equivalent time, in years,
after which the energy consumption savings cancel the
former extra excavation costs.
Results from Table 2 are estimative, since these strongly
depend on the real technical and economic conditions of
the worksite and the later train operations. That said, there
is a significant step between compacted IGM and strong
IGM (125–140 years) due to the excavation technique
being more cost intensive. In the same line but at a lower
scale, there are important differences when refilling is
carried out after the excavation. This means increasing the
return period about 20–25 years. The presence of water
table seems to be less significant.
Bearing in mind that metro infrastructures may last more
than 100 years, Symmetric vertical sinusoid alignment
layouts may be a suitable solution for scattered or soft
soils, or even compacted intermediate geomaterials
(IGMs). Particularly suitable are the cases in which there is
no need of refilling the gap above the infrastructure.
5 Conclusions
The aim of this paper is to measure the impact of symmetric
vertical sinusoid alignment on infrastructure construction
costs and compare this with the reduction of energy con-
sumption provided by this type of vertical alignments.
The main reason to investigate this subject is that many
strategies to optimize railways energy consumption have
Table 1 Unitary prices and performances for excavation of different
types of soils
Soil type Unitary prices in (€/m3) Performance in (h/m3)
Scattered soil 2.52 0.046
Soft soil 2.83 0.057
Compacted IGM 3.16 0.068
Strong IGM 14.93 0.269
Rock 23.63 0.366
Table 2 Time (years) to recover extra construction costs with energy
savings
E E ? WTD E ? R E ? WTD ? R
Scattered soil 25 30 50 50
Soft soil 30 35 50 55
Compacted IGM 35 35 55 60
Strong IGM 160 175 180 200
Rock 250 270 275 300
Urban Rail Transit (2020) 6(3):145–156 153
123
been proposed in the past, but only a few rely on track
geometry. However, it is important to analyze these
strategies to maintain low infrastructure construction costs
as well.
In that context, this paper summarizes our previous
research [21, 41, 42], where we trained and validated an
ANN model that predicts the energy consumption of a train
in a metropolitan railway line using three input variables:
speed, acceleration, and gradient. We used this ANN to
compare different vertical alignments and obtain the
energy consumption due to each one between two stations
with the same elevation.
The trained ANN predicts an energy consumption of
7.11 kWh per km, a small difference of 2.4% compared
with the average measured energy consumption of
7.29 kWh per km.
The trained ANN is a useful tool that allows the study of
energy consumption of a metropolitan railway line. This
method may function as a virtual laboratory where it is
possible to test other hypothetical scenarios, modifying
variables such as track layout and train driving style to
reduce energy consumption.
A symmetric vertical sinusoid alignment profile with a
maximum depth of d = 5 m halfway yielded a reduction of
18.4% in energy consumption compared with a completely
flat alignment.
This, for example, in a network with an average fre-
quency service of a train every 5 min and a commercial
service of 20 h/day in labor days, represents a saving in the
costs of traction of 7000 €/km/year.
Comparing the differential construction costs between
flat and 5% SVSA layouts, whereas in tunneling methods
such as TBM or NATM, there are no practical differences,
in a top–down excavation method, the extra excavation
volume for the SVSA layout may lead to substantial cost
increments. These over costs are particularly important in
strong IMGs or rocky grounds. Less relevant is the need of
refilling and the presence of water table. In general, time
recovering periods may range from 25 to 300 years
between the most favorable and the most disadvantageous
cases.
These results demonstrate the importance of designing
energetically efficient geometric alignments. Although this
strategy already allows a significant energy consumption
reduction to be obtained, this can be accompanied by other
strategies such as economic driving to come up with a
better and more efficient transport system in terms of
energy consumption. However, it is important to perform a
detailed assessment of the impact of these geometric
alignments because this could led to overruns in infras-
tructure construction costs, which could never be
recovered.
The main contribution of this research lies in its pro-
posal of a simple ANN model for predicting the energy
consumption with few input variables and, then, in using
said ANN to compare different hypothetical vertical
alignments in terms of energy consumption reduction.
Additionally, we have compared the energy savings of
energy-efficient vertical alignments against the extra costs
of their infrastructure construction, thus obtaining different
time recovering periods for different cases.
Next steps of research will involve an analysis on how
the ANN model can be improved if energy recuperation is
involved. This will allow the testing of other hypothetical
operative scenarios, hence further contributing to minimize
the energy consumption of the system.
Acknowledgements This paper was realized thanks to the collabo-
ration agreement signed between Ferrocarrils de la Generalitat
Valenciana and Universitat Politecnica de Valencia, and funding
obtained by the Spanish Ministry of Economy and Competitiveness
through the project ‘‘Strategies for the design and energy-efficient
operation of railway and tramway infrastructure’’ (Ref. TRA2011-
26602).
Open Access This article is distributed under the terms of the
Creative Commons Attribution 4.0 International License (http://crea
tivecommons.org/licenses/by/4.0/), which permits unrestricted use,
distribution, and reproduction in any medium, provided you give
appropriate credit to the original author(s) and the source, provide a
link to the Creative Commons license, and indicate if changes were
made.
Compliance with Ethical Standards
Conflict of Interest None of the authors has any competing interests
in the manuscript.
References
1. International Energy Agency (2018) Key world energy statistics.
Paris
2. Garcıa Alvarez A (2010) High speed, energy consumption and
emissions. Study and Research Group for Railway Energy and
Emissions, Madrid
3. Kim K, Chien S (2010) Optimal train operation for minimum
energy consumption considering schedule adherence. In: TRB
annual meeting compendium. Transportation Research Board,
Washington, USA
4. Kosinski A, Schipper L, Deakin E (2011) Analysis of high-speed
rail’s potential to reduce CO2 emissions from transportation in the
United States. In: TRB annual meeting compendium. Trans-
portation Research Board, Washington, USA
5. European Comission (2017) EU transport in figures-statistical
Pocketbook 2017
6. Douglas H, Roberts C, Hillmansen S, Schmid F (2015) An
assessment of available measures to reduce traction energy use in
railway networks. Energy Convers Manag 106:1149–1165
7. Dundar S, Sahin I (2011) A genetic algorithm solution for train
scheduling. In: TRB annual meeting compendium. Transportation
Research Board, Washington, USA
154 Urban Rail Transit (2020) 6(3):145–156
123

8. Liu M, Haghani A, Toobaie S (2010) A genetic Algorithm-based
column generation approach to passenger rail crew scheduling.
In: TRB annual meeting compendium. Transportation Research
Board, Washington, USA
9. Salvador P, Garcıa C, Pineda-Jaramillo JD, Insa R (2016) The use
of driving simulators for enhancing train driver’s performance in
terms of energy consumption. In: 12th conference on trans-
portation engineering (CIT 2016), 7–9 June 2016, Valencia,
Spain
10. Sicre C, Cucala P, Fernandez-Cardador A, Lukaszewicz P (2012)
Modeling and optimizing energy-efficient manual driving on high
speed lines. IEEJ Trans Electr Electron Eng 7:633–640
11. Brenna M, Foiadelli F, Longo M (2016) Application of genetic
algorithms for driverless subway train energy optimization. Int J
Veh Technol 2016:8073523. https://doi.org/10.1155/2016/
8073523
12. Fernandez A, Fernandez-Cardador A, Cucala P, Domınguez M,
Gonsalves T (2015) Design of robust and energy-efficient ATO
speed profiles of metropolitan lines considering train load vari-
ations and delays. IEEE Trans Intell Transp Syst 16:2061–2071
13. Lukaszewicz P (2000) Driving techniques and strategies for
freight trains. In: Allan J, Brebbia CA, Hill RJ, Sciutto G, Sone S
(eds) Computers in railways VII. WIT Press, Southampton,
pp 1065–1073
14. Bai Y, Mao B, Zhou F, Ding Y, Dong C (2009) Energy-efficient
driving strategy for freight trains based on power consumption
analysis. J Transp Syst Eng Inf Technol 9(3):43–50
15. Lukaszewicz P (2001) Energy consumption and running time for
trains. Modelling of running resistance and driver behaviour
based on full scale testing. Dissertation, KTH Royal Institute of
Technology
16. Sicre C, Cucala P, Fernandez A, Jimenez J, Ribera I, Serrano A
(2010) A method to optimise train energy consumption com-
bining manual energy efficient driving and scheduling. WIT
Trans Built Environ 114:549–560
17. Bocharnikov YV, Tobias AM, Roberts C, Hillmansen S, Good-
man CJ (2007) Optimal driving strategy for traction energy on
DC suburban railways. IET Electr Power Appl 1(5):675–682
18. Tian Z, Hillmansen S, Roberts C, Weston P, Zhao N, Chen L,
Chen M (2015) Energy evaluation of the power network of a DC
railway system with regenerating trains. IET Electr Syst Transp
6:1–9
19. Domınguez M, Fernandez A, Cucala P, Blanquer J (2010) Effi-
cient design of automatic train operation speed profiles with on
board energy storage devices. WIT Trans Built Environ
114:509–520
20. Kim K, Chien SI (2010) Simulation-based analysis of train
controls under various track alignments. J Transp Eng
136(11):937–948
21. Pineda-Jaramillo JD, Salvador-Zuriaga P, Insa-Franco R (2017)
Comparing energy consumption for rail transit routes through
symmetric vertical sinusoid alignments (SVSA), and applying
artificial neural networks. A case study of MetroValencia (Spain).
DYNA 84(203):17–23
22. Huang S, Sung H, Ma C (2015) Optimize energy of train simu-
lation with track slope data. In: IEEE conference on intelligent
transportation systems, 15–18 Sept 2015, Las Palmas, Spain
23. Lai X, Schonfeld P (2010) Optimizing rail transit alignment
connecting several major stations. In: TRB annual meeting
compendium. Transportation Research Board, Washington, USA
24. Samanta S, Jha MK (2011) Modeling a rail transit alignment
considering different objectives. Transp Res A 45(1):31–45
25. Kelly J, Knottenbelt W (2015) Neural NILM: deep neural net-
works applied to energy disaggregation. In: Proceedings of the
2nd ACM international conference on embedded systems for
energy-efficient built environments, Seoul, South Korea
26. Datta D, Tassou SA, Marriott D (1997) Application of neural
networks for the prediction of the energy consumption in a
supermarket. In Proceedings of the international conference
CLIMA 2000. Brussels, Belgium.
27. Khosravani HR, Castilla MD, Berenguel M, Ruano AE, Ferreira
PM (2016) A comparison of energy consumption prediction
models based on neural networks of a bioclimatic building.
Energies 9(1):57. https://doi.org/10.3390/en9010057
28. Moon JW, Jung SK, Lee YO, Choi S (2015) Prediction perfor-
mance of an artificial neural network model for the amount of
cooling energy consumption in hotel rooms. Energies
8:8226–8243
29. Abolfazli H, Asadzadeh SM, Nazari-Shirkouhi S, Asadzadeh SM,
Rezaie K (2014) Forecasting rail transport petroleum consump-
tion using an integrated model of autocorrelation functions—ar-
tificial neural network. Acta Polytech Hung 11(2):203–214
30. Feng J, Li XM, Xie MQ, Gao LP (2016) A neural network model
for calculating metro traction energy consumption. In: interna-
tional conference on power, energy engineering and management
(PEEM 2016), Bangkok, Thailand
31. Gattuso D, Restuccia A (2014) A tool for railway transport cost
evaluation. Procedia Soc Behav Sci 111:549–558
32. Flyvbjerg B, Bruzelius N, Van-Wee B (2008) Comparison of
capital costs per route-kilometre in urban rail. J Transp Infrasruct
Res 8(1):17–30
33. Von-Brown JT (2011) A planning methodology for railway
construction cost estimation in North America. Dissertation, Iowa
State University
34. Garcıa-Alvarez A (2010) Relationship between rail service
operating direct costs and speed. Fundacion de los Ferrocarriles
Espanoles, Madrid
35. Olsson NOE, Økland A, Halvorsen SB (2012) Consequences of
differences in cost-benefit methodology in railway infrastructure
appraisal—a comparison between selected countries. Transp
Policy 22:29–35
36. Treasury HM (2010) Infrastructure cost review. Infrastructure
UK, London
37. Bernardos A, Paraskevopoulou C, Diederichs M (2013) Assess-
ing and benchmarking the construction cost of tunnels. In: Geo-
Montreal, Montreal, Canada
38. Ming-Guang L, Jin-Jian C, An-Jun X, Xiao-He X, Jian-Hua X
(2014) Case study of innovative top-down construction method
with channel-type excavation. J Construct Eng Manag
140(5):05014003. https://doi.org/10.1061/%28ASCE%29CO.
1943-7862.0000828
39. Fox Halcrow (2000) World bank urban transport strategy review:
mass rapid transit in developing countries, Final report. World
Bank, Washington
40. BB&J Consult (2000) The world bank group urban transport
strategy review: Implementation of rapid transit. Final report.
World Bank, Washington
41. Pineda-Jaramillo JD, Insa R, Martınez P (2018) Modelling the
energy consumption of trains applying neural networks. Proc Inst
Mech Eng F J Rail Rapid Transit 232(3):816–823
42. Pineda-Jaramillo JD (2017) Modelo de optimizacion del consumo
energetico en trenes mediante el diseno geometrico vertical
sinusoidal y su impacto en el coste de la construccion de la
infraestructura Dissertation, Polytechnical University of Valencia
43. Karlik B (2014) Machine learning algorithms for characterization
of EMG signals. Int J Inf Electron Eng 4(3):189–194
44. Bishop C (1995) Neural networks for pattern recognition.
Clarendon Press, Oxford
45. McCulloch W, Pitts W (1943) A logical calculus of the ideas
immanent in nervous activity. Bull Math Biophys 5(4):115–133
46. Karlaftis M, Vlahogianni E (2011) Statistical methods versus
neural networks in transportation research: differences,
Urban Rail Transit (2020) 6(3):145–156 155
123
similarities and some insights. Transp Res C Emerg Technol
19(3):387–399
47. Cantarella G, De Luca S (2003) Modeling transportation mode
choice through artificial neural networks. In: 4th international
symposium on uncertainty modeling and analysis. 21–24 Sept
2003, College Park, MD, USA
48. Celikoglu H (2006) Application of radial basis function and
generalized regression neural networks in non-linear utility
function specification for travel mode choice modelling. Math
Comput Model 44(7):640–658
49. Zhao D, Shao C, Li J, Dong C, Liu Y (2010) Travel mode choice
modeling based on improved probabilistic neural network. In:
Traffic and transportation studies, 3–5 Aug 2010, Kunming,
China
50. Omrani H, Charif O, Gerber P, Awasthi A, Trigano P (2013)
Prediction of individual travel mode with evidential neural net-
work model. In: TRB annual meeting compendium. Transporta-
tion Research Board, Washington, USA
51. Jha MK, Schonfeld P, Samanta S (2007) Optimizing rail transit
routes with genetic algorithms and geographic information sys-
tems. J Urban Plann Dev 133(3):161–171
52. Schmidhuber J (2015) Deep learning in neural networks: an
overview. Neural Netw 61:85–117
53. Yeh S (2003) Integrated analysis of vertical alignment and speed
profiles for rail transit routes. Dissertation, University of
Maryland
54. Molines J (2011) Stability of crown walls of cube and cubipod
armoured mound breakwaters. PIANC E-Mag 144:29–44
55. CYPE Ingenieros SA (2019) Prices database. www.gen
eradordeprecios.info. Accessed 3 March 2019
56. Ministerio de Fomento. Gobierno de Espana (2011) Cuadro de
precios de referencia de la direccion general de carreteras. Madrid
57. Hydraulics of Wells Task Committee (2014) In: Ahmed N,
Taylor S, Sheng Z (eds) Hydraulics of wells: design, construction,
testing and maintenance of water well systems. American Society
of Civil Engineers, Reston
156 Urban Rail Transit (2020) 6(3):145–156
123