Impact of sudden oak death on tree mortality in the Big ...
13
ORIGINAL PAPER Impact of sudden oak death on tree mortality in the Big Sur ecoregion of California R. K. Meentemeyer N. E. Rank D. A. Shoemaker C. B. Oneal A. C. Wickland K. M. Frangioso D. M. Rizzo Received: 15 June 2007 / Accepted: 10 December 2007 Ó Springer Science+Business Media B.V. 2007 Abstract The Big Sur ecoregion in coastal Califor- nia is a botanically and ecologically diverse area that has recently experienced substantial mortality of oak (Quercus spp.) and tanoak (Lithocarpus densiflorus) trees due to the emerging forest disease sudden oak death, caused by the invasive pathogen Phytophthora ramorum. In response to the urgent need to examine environmental impacts and create management response strategies, we quantified the impact of P. ramorum invasion on tree mortality across the Big Sur ecoregion using high-resolution aircraft imagery and field data. Using the imagery, we mapped all detectable oak and tanoak trees possibly killed by P. ramorum infection within redwood- tanoak forests and mixed oak woodlands. To validate and improve our remote assessment, we quantified the number, size, and infection status of host trees in 77 field plots (0.25 ha). The field data showed that our remote assessment underestimated mortality due to the occurrence of dead trees in the forest understory. For each forest type, we developed regression models that adjusted our remote assess- ments of tree mortality in relation to field observations of mortality and local habitat variables. The models significantly improved remote assess- ment of oak mortality, but relationships were stronger for mixed oak woodlands (r 2 = 0.77) than redwood- tanoak forests (r 2 = 0.66). Using the field data, we also modeled the amount of dead tree basal area (m 2 ) in relation to the density of mapped dead trees in mixed oak woodlands (r 2 = 0.73) and redwood- tanoak forests (r 2 = 0.54). Application of the regres- sion models in a GIS estimated 235,678 standing dead trees in 2005 and 12,650 m 2 of tree basal area removed from the ecoregion, with 63% of mortality occurring in redwood-tanoak forests and 37% in mixed oak woodlands. Integration of the remote assessment with population estimates of host abun- dance, obtained from an independent network of 175 field plots (0.05 ha each), indicated similar preva- lence of mortality in redwood-tanoak forests (20.0%) and mixed oak woodlands (20.5%) at this time. This is the first study to quantify a realistic number of dead trees impacted by P. ramorum over a defined ecological region. Ecosystem impacts of such wide- spread mortality will likely be significant. Keywords Big Sur Emerging infectious disease Forest disease Invasive species Landscape epidemiology Phytophthora ramorum Plant-pathogen Tree mortality Remote sensing R. K. Meentemeyer (&) D. A. Shoemaker C. B. Oneal Department of Geography and Earth Sciences, University of North Carolina at Charlotte, Charlotte, NC 28223, USA e-mail: [email protected] N. E. Rank Department of Biology, Sonoma State University, Rohnert Park, CA 94928, USA A. C. Wickland K. M. Frangioso D. M. Rizzo Department of Plant Pathology, University of California, Davis, CA 95616, USA 123 Biol Invasions DOI 10.1007/s10530-007-9199-5
Transcript of Impact of sudden oak death on tree mortality in the Big ...

ORIGINAL PAPER
Impact of sudden oak death on tree mortality in the Big Surecoregion of California
R. K. Meentemeyer Æ N. E. Rank Æ D. A. Shoemaker ÆC. B. Oneal Æ A. C. Wickland Æ K. M. Frangioso ÆD. M. Rizzo
Received: 15 June 2007 / Accepted: 10 December 2007
� Springer Science+Business Media B.V. 2007
Abstract The Big Sur ecoregion in coastal Califor-
nia is a botanically and ecologically diverse area that
has recently experienced substantial mortality of oak
(Quercus spp.) and tanoak (Lithocarpus densiflorus)
trees due to the emerging forest disease sudden oak
death, caused by the invasive pathogen Phytophthora
ramorum. In response to the urgent need to examine
environmental impacts and create management
response strategies, we quantified the impact of
P. ramorum invasion on tree mortality across the
Big Sur ecoregion using high-resolution aircraft
imagery and field data. Using the imagery, we
mapped all detectable oak and tanoak trees possibly
killed by P. ramorum infection within redwood-
tanoak forests and mixed oak woodlands. To validate
and improve our remote assessment, we quantified
the number, size, and infection status of host trees in
77 field plots (0.25 ha). The field data showed that
our remote assessment underestimated mortality due
to the occurrence of dead trees in the forest
understory. For each forest type, we developed
regression models that adjusted our remote assess-
ments of tree mortality in relation to field
observations of mortality and local habitat variables.
The models significantly improved remote assess-
ment of oak mortality, but relationships were stronger
for mixed oak woodlands (r2 = 0.77) than redwood-
tanoak forests (r2 = 0.66). Using the field data, we
also modeled the amount of dead tree basal area (m2)
in relation to the density of mapped dead trees in
mixed oak woodlands (r2 = 0.73) and redwood-
tanoak forests (r2 = 0.54). Application of the regres-
sion models in a GIS estimated 235,678 standing
dead trees in 2005 and 12,650 m2 of tree basal area
removed from the ecoregion, with 63% of mortality
occurring in redwood-tanoak forests and 37% in
mixed oak woodlands. Integration of the remote
assessment with population estimates of host abun-
dance, obtained from an independent network of 175
field plots (0.05 ha each), indicated similar preva-
lence of mortality in redwood-tanoak forests (20.0%)
and mixed oak woodlands (20.5%) at this time. This
is the first study to quantify a realistic number of dead
trees impacted by P. ramorum over a defined
ecological region. Ecosystem impacts of such wide-
spread mortality will likely be significant.
Keywords Big Sur � Emerging infectious disease �Forest disease � Invasive species �Landscape epidemiology � Phytophthora ramorum �Plant-pathogen � Tree mortality � Remote sensing
R. K. Meentemeyer (&) � D. A. Shoemaker � C. B. Oneal
Department of Geography and Earth Sciences, University
of North Carolina at Charlotte, Charlotte, NC 28223, USA
e-mail: [email protected]
N. E. Rank
Department of Biology, Sonoma State University,
Rohnert Park, CA 94928, USA
A. C. Wickland � K. M. Frangioso � D. M. Rizzo
Department of Plant Pathology, University of California,
Davis, CA 95616, USA
123
Biol Invasions
DOI 10.1007/s10530-007-9199-5
Lexi Christensen
State
Lexi Christensen
Two types of species and the cause is an invasive pathogen
Lexi Christensen
Site Name / Region Group
Lexi Christensen
Number of dead trees and the year
Lexi Christensen
Species is Oak
Lexi Christensen
Mortality in FORESTS
Lexi Christensen
# of plots, and size of plots in ha
Lexi Christensen
Another independent study showing data concurred for mortality
Introduction
Infectious diseases can substantially impact the
biodiversity, structure, and function of plant commu-
nities (Gilbert 2002; Burdon et al. 2006). In
particular, diseases caused by exotic plant pathogens
may cause extensive mortality due to the low natural
resistance of native host populations to infection and
lack of natural enemies (Yang et al. 1991; Mack
et al. 2000; Parker and Gilbert 2004). Chestnut
blight, white pine blister rust, and jarrah dieback
are well-known diseases that illustrate impacts inva-
sive pathogens can have on natural communities
through the loss of dominant tree species (Anagno-
stakis 1987; Weste and Marks 1987; Tomback and
Kendall 2001).
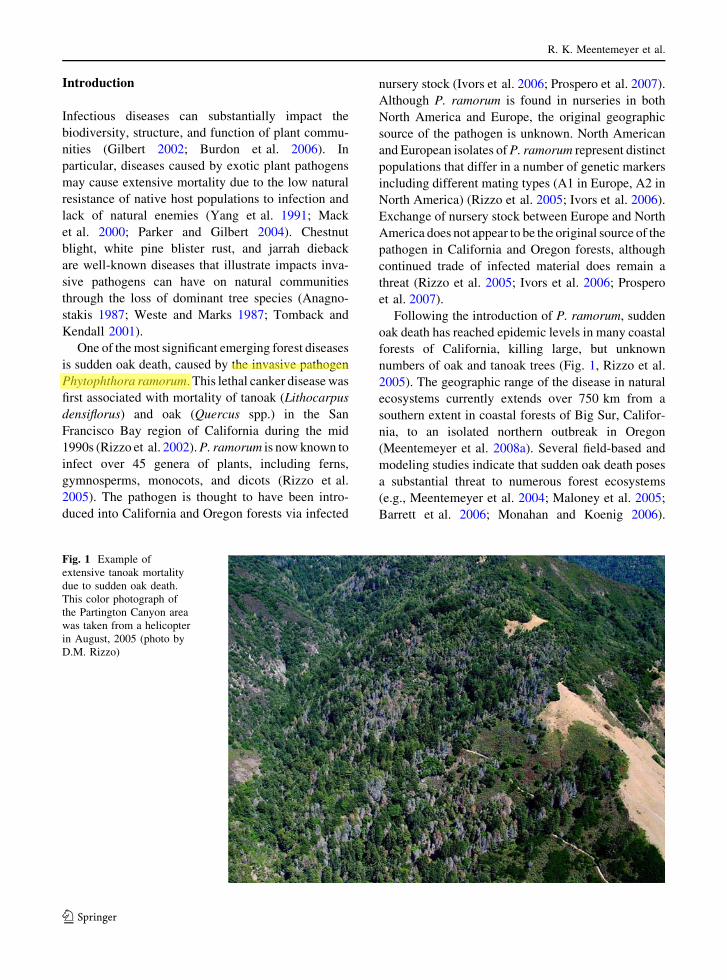
One of the most significant emerging forest diseases
is sudden oak death, caused by the invasive pathogen
Phytophthora ramorum. This lethal canker disease was
first associated with mortality of tanoak (Lithocarpus
densiflorus) and oak (Quercus spp.) in the San
Francisco Bay region of California during the mid
1990s (Rizzo et al. 2002). P. ramorum is now known to
infect over 45 genera of plants, including ferns,
gymnosperms, monocots, and dicots (Rizzo et al.
2005). The pathogen is thought to have been intro-
duced into California and Oregon forests via infected
nursery stock (Ivors et al. 2006; Prospero et al. 2007).
Although P. ramorum is found in nurseries in both
North America and Europe, the original geographic
source of the pathogen is unknown. North American
and European isolates of P. ramorum represent distinct
populations that differ in a number of genetic markers
including different mating types (A1 in Europe, A2 in
North America) (Rizzo et al. 2005; Ivors et al. 2006).
Exchange of nursery stock between Europe and North
America does not appear to be the original source of the
pathogen in California and Oregon forests, although
continued trade of infected material does remain a
threat (Rizzo et al. 2005; Ivors et al. 2006; Prospero
et al. 2007).
Following the introduction of P. ramorum, sudden
oak death has reached epidemic levels in many coastal
forests of California, killing large, but unknown
numbers of oak and tanoak trees (Fig. 1, Rizzo et al.
2005). The geographic range of the disease in natural
ecosystems currently extends over 750 km from a
southern extent in coastal forests of Big Sur, Califor-
nia, to an isolated northern outbreak in Oregon
(Meentemeyer et al. 2008a). Several field-based and
modeling studies indicate that sudden oak death poses
a substantial threat to numerous forest ecosystems
(e.g., Meentemeyer et al. 2004; Maloney et al. 2005;
Barrett et al. 2006; Monahan and Koenig 2006).
Fig. 1 Example of
extensive tanoak mortality
due to sudden oak death.
This color photograph of
the Partington Canyon area
was taken from a helicopter
in August, 2005 (photo by
D.M. Rizzo)
R. K. Meentemeyer et al.
123
Lexi Christensen
Cause

Widespread mortality of oak and tanoak trees will
likely reduce wildlife habitat and food resources, raise
the risk of forest fires, increase water runoff and soil
erosion, and alter the composition and structure of
natural plant, microbial, and aquatic communities
(Rizzo et al. 2005). Possible movement of the patho-
gen through the nursery trade to potentially susceptible
forests in eastern North America and other regions
around the world has resulted in extensive quarantines
of the pathogen (Rizzo et al. 2005).
While our understanding of the biology of
P. ramorum and its mechanisms for dispersal is
increasing (Garbelotto et al. 2003a; Davidson et al.
2005; Condeso and Meentemeyer 2007; Fichtner et al.
2007; Meentemeyer et al. 2008b), there has been no
large-scale quantification of sudden oak death mortal-
ity across a region or across the pathogen’s geographic
range. Plot-based and remote sensing assessments
have observed variable mortality levels (Kelly and
Meentemeyer 2002; Swiecki and Bernhardt 2002;
Maloney et al. 2005), but regional scaling of mortality
figures has not occurred due to the non-random
distribution of field observations and the thus far
patchy nature of the disease. Forest inventory analysis
(FIA) plots have been useful for estimating pathogen-
related tree mortality in other forested regions. How-
ever, relatively few FIA plots are established in coastal
California forests (Barrett et al. 2006).
A quantitative assessment of sudden oak death
mortality is important from a number of perspectives.
An appropriate response to such a widespread
invasive pathogen would require large amounts of
personnel and funding resources. Are the current and
potential impacts great enough to justify such a
response? Second, where are forests most impacted?
Quantifiable mortality data are also greatly needed to
encourage allocation of resources to early detection
and monitoring in uninfected regions.
One of the areas most heavily impacted by sudden
oak death is the Big Sur ecoregion on the central
coast of California (Rizzo and Garbelotto 2003)
(Fig. 2). First observed in 1995, sudden oak death has
now spread through many drainages of coast red-
wood-tanoak forest (Sequoia sempervirens–L.
densiflorus) with over 60% mortality of tanoak in
some stands (Maloney et al. 2005) (Fig. 1). Coast
live oak (Quercus agrifolia) and Shreve’s oak
(Q. parvula var. shrevei) have also experienced high
levels of mortality in Big Sur, but limited access has
hindered examinations of P. ramorum impacts in
mixed oak woodlands (Rizzo et al. 2005). Extensive
tree mortality in Big Sur is especially concerning
because it is one of the most botanically and
ecologically diverse regions of California, recognized
as a global biodiversity hotspot, and thus a high
priority for conservation (Myers et al. 2000). In
addition, the ecoregion represents the southern edge
of P. ramorum’s current geographic range in
California, which may continue to expand southward
over time (Meentemeyer et al. 2004).
Information on the current extent and level of tree
mortality in the Big Sur ecoregion are critically
needed to manage further disease spread, identify
sites for experimental treatments, and minimize the
impacts of tree mortality on biodiversity, nutrient
cycling, and fire risk. In this study we assess the
current spatial distribution and magnitude of sudden
oak death mortality across this unique and valuable
region using high resolution imagery in conjunction
with field data on oak mortality and forest structure.
Specifically, we examine (1) the number of dead trees
and prevalence of mortality in the Big Sur attributed
to P. ramorum; (2) subsequent losses of tree basal
area in the ecoregion, and (3) the distribution of
disease severity by host forest type (redwood-tanoak
forest vs. mixed oak woodland).
Materials and methods
Study system
We established a 79,356 ha study area within the Big
Sur ecoregion, extending 100 km along the Pacific
slope of the Santa Lucia Range, from Point Lobos
south to Salmon Creek, CA (Fig. 2). The topography of
the region is highly dissected by steep slopes and
drainages with elevations ranging from sea level to
1571 m within 5 km of the coast. The environmentally
complex region supports a diversity of plant commu-
nities (Henson and Usner 1996). Upper elevation
slopes and rocky ridges are typified by mixed conif-
erous forests composed primarily of ponderosa pine
(Pinus ponderosa), sugar pine (P. lambertiana),
Jeffrey pine (P. jeffreyii), coulter pine (P. coulteri),
and Santa Lucia Fir (Abies bracteata). Chaparral
shrubland and annual grassland often dominate dry
south-facing slopes and ridges at mid elevations.
Impact of sudden oak death on tree mortality
123
Lexi Christensen
"steep slopes" and elevation ranges
Lexi Christensen
Study site

Fig. 2 Big Sur ecoregion (79,356 ha) extends 100 km along
the Pacific slope of the Santa Lucia range, from Point Lobos to
Ragged Point, CA. A shaded relief map of host and non-host
vegetation types were developed using object-based classifi-
cation and manual editing of high resolution aerial imagery
shown in Fig. 3
R. K. Meentemeyer et al.
123
Mixed oak woodland consisting of coast live oak,
Shreve’s oak, bay laurel (Umbellularia californica),
and madrone (Arbutus menziesii) occur on moister
slopes, giving way to riparian corridors of redwood-
tanoak forest at lower elevations. Low elevation south-
and west-facing slopes support drought deciduous
coastal sage scrub vegetation (Borchert et al. 2004).
The plant communities composing primary habitat for
P. ramorum in this region are mixed oak woodland and
redwood-tanoak forests (Maloney et al. 2005).
Host vegetation and oak mortality mapping
Complete cloudless aerial photography of the study
area was digitally captured in red, green, and blue
bands at a 0.33 m spatial resolution on April 19, April
25, and May 12, 2005 (AirPhoto USA). The imagery
was collected during late spring to avoid mistaking
winter and summer deciduous leaf drop for P. ramo-
rum caused tree mortality (Kelly and Meentemeyer
2002). A total of 118 image frames were acquired and
geo-rectified with an average positional error of less
than 1 m.
Using this imagery, we first mapped the distribution
of two vegetation communities known to contain host
tree species of P. ramorum (redwood-tanoak forest and
mixed oak woodland) and several non-host habitats
based on vegetation descriptions in the Manual of
California Vegetation (Table 1, Sawyer and Keeler-
Wolf 1997). The plant communities were mapped in
three stages. Imagery was first processed using image
segmentation, an object-based classification method
which iteratively grouped pixels into spectrally
homogenous patches of vegetation (minimum area =
1.0 ha), using a region-growing segmentation
algorithm (Espindola et al. 2006). Object-based clas-
sification is especially useful for generalizing spectral
information in high resolution imagery while main-
taining its spatial detail (Luscier et al. 2006; Yu et al.
2006). We next used supervised classification to assign
a cover type label to each patch, based on spectral
signatures of 400 photo-interpreted polygons of veg-
etation cover (Jensen 1996). Finally, we manually
edited boundaries and land-cover type label of each
patch as needed using on-screen digitizing tools in a
geographic information system (GIS). For redwood-
tanoak forest and mixed oak woodland, we calculated
total number and area of patches and measured the size
of each patch using ArcGIS 9.1 software (ESRI).
Using the imagery a single photo interpreter man-
ually digitized point locations of every dead tree within
each of the two host vegetation communities (Fig. 3).
The spectral signature of sudden oak death mortality is
distinct in high resolution imagery due to the charac-
teristic ‘‘freeze-dried’’ appearance of foliage of dead
trees and those that have cast foliage (Kelly and
Meentemeyer 2002). Trees with partially dead or
fading crowns were not included in the assessment.
Care was also taken to distinguish tree mortality
associated with sudden oak death from other types of
physical disturbances, such as fire and slope instability.
To prepare for remote assessment of mortality, the
photo interpreter interviewed local land managers,
made numerous field assessments across the study
region, and extensively examined local fire history data
(Fire Resource and Assessment Program1). The final
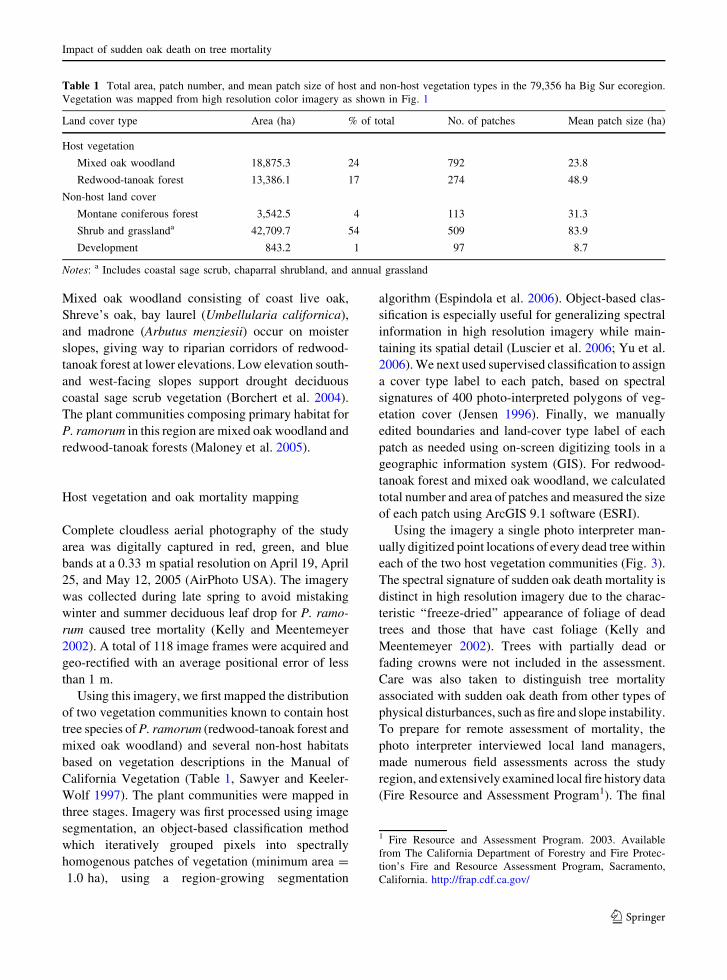
Table 1 Total area, patch number, and mean patch size of host and non-host vegetation types in the 79,356 ha Big Sur ecoregion.
Vegetation was mapped from high resolution color imagery as shown in Fig. 1
Land cover type Area (ha) % of total No. of patches Mean patch size (ha)
Host vegetation
Mixed oak woodland 18,875.3 24 792 23.8
Redwood-tanoak forest 13,386.1 17 274 48.9
Non-host land cover
Montane coniferous forest 3,542.5 4 113 31.3
Shrub and grasslanda 42,709.7 54 509 83.9
Development 843.2 1 97 8.7
Notes: a Includes coastal sage scrub, chaparral shrubland, and annual grassland
1 Fire Resource and Assessment Program. 2003. Available
from The California Department of Forestry and Fire Protec-
tion’s Fire and Resource Assessment Program, Sacramento,
California. http://frap.cdf.ca.gov/
Impact of sudden oak death on tree mortality
123

map of dead tree point locations was generalized to a
50 9 50 m grid (0.25 ha) to provide a spatially-
explicit estimate of mortality density.
Field survey of host population and mortality
levels
To evaluate and improve our remote assessment of
mortality, we surveyed 77 field plots (50 9 50 m,
0.25 ha) for evidence of sudden oak death mortality
across a range of mortality levels in the region’s two
primary host vegetation types (redwood-tanoak forest
and mixed oak woodland). This plot size was adopted
to maximize spatial overlap between the field plot
censuses and corresponding area in the imagery, yet
permit sufficient plot replication across the study
region. Within each plot, we visually assessed all
standing dead host trees (Q. agrifolia, Q. parvula var.
shrevei, Q. kellogii, L. densiflorus) for typical symp-
toms of infection by P. ramorum, primarily
‘‘bleeding’’ lesions (dark red exudates and discolor-
ation of bark surface) and the presence of secondary
organisms typically associated with sudden oak death
(bark beetles, ambrosia beetles, Hypoxylon thouarsia-
num) (Davidson et al. 2003). Other causes of tree
death, such as past wildfire, physical disturbance and
canker rots, were observed but not included in the
analysis of dead trees (Swiecki and Bernhardt 2002;
Garbelotto et al. 2003a). Living host trees that exhib-
ited symptoms of P. ramorum infection were not
included in our assessment of sudden oak death
mortality. For each host species we measured diameter
at breast height (DBH) and basal area (m2) of all dead
trees C6 cm DBH, and tallied trees by the determined
cause of death. All plots classified as symptomatic fell
within drainages identified by Maloney et al. (2005) as
P. ramorum-positive through laboratory examination.
Additional data on host population levels were
collected to estimate prevalence of mortality due to
P. ramorum across the ecoregion (Wickland et al.
2007). An independent network of 175 plots (0.05 ha)
was established to measure variability in the number
and DBH of host trees (dead and alive) that exist in the
Big Sur ecoregion (Wickland et al. 2007). These plots
were randomly located across a broad range of
ecological conditions stratified by host vegetation type
(redwood-tanoak and mixed oak), elevation, latitude,
and fire history. All stems C1 cm DBH were recorded
and tallied by species, but only stems greater than or
equal to 6 cm were analyzed for consistency with the 77
0.25 ha plots. Plot locations of both datasets were
mapped using survey-grade GPS receivers and differ-
entially corrected with a horizontal accuracy of less
than 1 m (Trimble Navigation Limited, California,
USA).
Landscape context variables
For each field plot, we also derived several GIS-based
variables to examine relationships between oak mor-
tality and underlying landscape factors, which may
influence local habitat conditions and bias in our
remote assessments: elevation, solar illumination (SI),
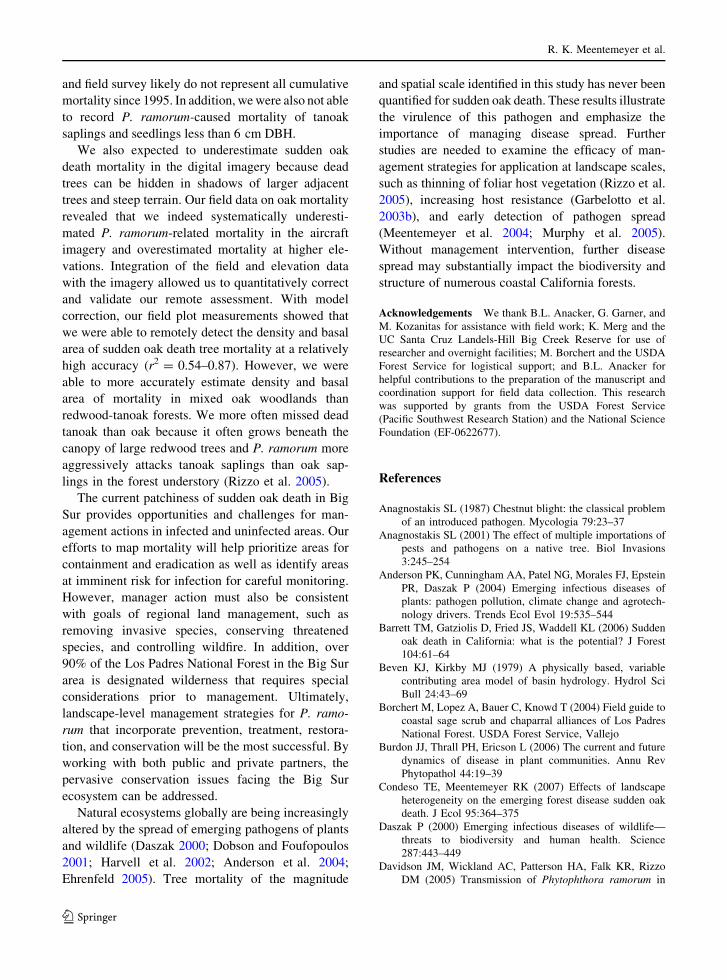
Fig. 3 An example of sudden oak death mortality mapping in
a redwood-tanoak forest located within a mosaic of heteroge-
neous land cover. Hollow red points mark individual locations
of tree mortality due to Sudden Oak Death. Photo-interpreta-
tion excluded non-subject signatures of mortality, such as
chaparral (Point A) and bare earth (Point B). The yellow circle
represents the size of a 0.25 ha field plot used to assess remote
estimates of mortality. For this plot, we detected 14 dead trees
in redwood-tanoak forest while 44 dead trees were field
detected. The difference is due to trees growing in the
understory of redwood tree canopies
R. K. Meentemeyer et al.
123

topographic moisture index (TMI), distance to coast,
and latitude. SI was derived for time of imagery
collection (April 21) by calculating the cosine of
solar illumination angle on slope equation (Dubayah
1994) across a 30 m USGS digital elevation model
(DEM). TMI characterized effects of local topogra-
phy on soil moisture, computed as the natural log of
the ratio between upslope drainage area and the slope
gradient of a given grid cell in the DEM (Beven and
Kirkby 1979; Moore et al. 1991).
Statistical analysis and spatial modeling
of oak mortality
We first used paired comparison t-tests to examine
differences between remotely assessed and field
assessed measurements of mortality density within
seventy-seven 0.25 ha plots. We also determined which
landscape variables were associated with field assessed
mortality levels using best-fit multiple regression. Nine
plots that were determined to be asymptomatic and
outside areas known to be infested (Maloney et al.
2005) were removed from analyses. The density and
basal area of mortality variables were square-root
transformed to make data conform to assumptions of
parametric analysis. Square-root transformations con-
formed to linearity and normality assumptions better
than log-transformations. Next, for each host forest type,
we conducted multiple regression analyses to examine
relationships between our remote and field assessments
of tree mortality density, while accounting for possible
contributions of five landscape variables (elevation, SI,
TMI, latitude, distance to coast). We identified variables
to include in the regression models using a best-fit model
approach with the Akaike Information Criterion (AIC)
as the criterion for model fit. Second order interactions
among predictor variables were also tested. The two
resulting predictive equations of tree mortality in each
host forest type were applied in the GIS to each 0.25 ha
grid cell.
The imagery did not enable us to remotely map tree
basal area lost to sudden oak death disease. As an
alternative, we quantified for each host forest type the
relationship between basal area of dead trees and the
density of dead trees observed in a plot. We next
estimated the basal area of mortality across the study
area, based on the relationship between the total basal
area of dead trees and the regression adjusted density of
dead trees described above. To derive this relationship,
we used multiple regression to predict dead basal area as
a function of dead tree density. The resulting models of
dead basal area were applied to each grid cell’s adjusted
number of dead trees to calculate a region-wide estimate
of dead basal area in each host forest type.
Finally, we determined the prevalence of sudden
oak death tree mortality in each of the two host
vegetation types (redwood-tanoak and mixed oak) by
comparing the total number of remotely assessed dead
trees to an independent estimate of the total population
of host trees (alive and dead). To estimate the total
number of host trees in the ecoregion we calculated the
average density of host trees in each host vegetation
type using data from the network of 175 field plots
(0.05 ha each). We then scaled the density values to the
area of a 0.25 ha grid cell in the GIS and summed them
across all grid cells within each of the two host
vegetation types. Prevalence of tree mortality was
simply calculated as the ratio of remotely assessed
dead trees to the estimated population of host trees.
Results
Host vegetation mapping
The combination of automated image processing and
manual editing produced a spatially detailed map of
the two forest habitats important to P. ramorum
(Fig. 2). Host vegetation occurred in 41% of the
study area (Table 1). Vegetation types were cor-
rectly classified in 64 of 77 plots (83% accuracy).
Redwood-tanoak forest was mapped with zero omis-
sion error but it incorrectly included 12 mixed-oak
woodland plots and one plot of non-host vegetation
(28% commission error). Mixed-oak woodland was
incorrectly mapped as redwood-tanoak in 12 plots
(29% omission error), but had zero commission
error.
Host-environment–mortality relationships
Host forest types of our plots differed with respect to
two of five environmental variables. Redwood-tanoak
forests occurred at significantly lower elevations ðx ¼254� 40:1 mÞ than mixed oak woodland ðx ¼ 455�34:6 m; F1,66 = 14.4, P = 0.0003) and TMI was 15%
greater in redwood-tanoak forests than in mixed-oak
Impact of sudden oak death on tree mortality
123

woodlands (F1,66 = 4.64, P = 0.035). Host vegeta-
tion types did not differ with respect to potential solar
insolation, latitude, or distance to coast (P [ 0.05).
For both vegetation types, multiple regressions
showed that mortality density was negatively related
to TMI (redwood-tanoak, F1,26 = 5.2, P = 0.032;
mixed oak woodland, F1,36 = 4.6, P = 0.039). How-
ever, SI was positively related to mortality in
redwood-tanoak forest (F1,26 = 5.3, P = 0.029) and
negatively related to mortality in mixed oak wood-
land (F1,36 = 4.1, P = 0.05).
Quantification of tree mortality
Sudden oak death mortality was observed in 76% of
the 0.25 ha field validation plots (52 of 68 field plots;
29 of 39 mixed-oak woodland plots and 23 of 29
redwood-tanoak plots). Our remote mapping assess-
ment failed to detect the presence of mortality in
24% of plots (6 of 39 mixed oak plots, 9 of 29
redwood-tanoak plots). In contrast, our remote
assessment made commission errors at only two
plots (i.e. mapping mortality where there is none).
Paired comparisons t-tests showed that remote
assessment significantly underestimated mortality
(redwood-tanoak forest t = 5.81, df = 28, P \0.0001; mixed-oak woodland t = 4.93, df = 38,
P \ 0.0001; Fig. 4).
The multiple regression models adjusted the
remotely assessed number of dead trees based on
the actual number of dead trees (Fig. 5). For
redwood-tanoak forests, no landscape variables were
significantly related to number dead, but for mixed-
oak woodlands, elevation and an interaction term
were significant factors in the model (Table 2). None
of the other landscape variables (latitude, potential
solar insolation, topographic moisture index, and
distance to coast) were significant (P [ 0.05). The
regression coefficient for the relationship between
remotely assessed and actual number of dead trees
was 8% greater for mixed-oak woodlands than for
redwood-tanoak forest (Table 2, Fig. 5). Both the
field and remotely assessed number of dead trees
were significantly related to basal area (Table 2,
Fig. 6), but the regression coefficient was greater in
mixed-oak woodlands than in redwood-tanoak for-
ests. None of the landscape variables or interaction
terms affected the magnitude of the relationship
significantly.
Fig. 4 Comparison of field
versus remotely assessed
numbers of dead trees for
each vegetation type. Data
shown are least square
means and standard errors
Fig. 5 Relationship
between remotely mapped
dead tree density and field
assessed density (number
of trees per 0.25 ha).
Redwood-tanoak forest
results based on one
independent variable.
Mixed oak woodland results
are based on the leverage
plot within the multiple
regression model described
in Table 2
R. K. Meentemeyer et al.
123

Application of the density and basal area models to
each 0.25 ha grid cell in the GIS produced an
estimate of 235,678 dead trees and 12,653 m2 of
dead tree basal area in the study area (Fig. 7). The
models estimate that 63% of the dead trees occurred
in redwood-tanoak forest (148,469 trees; 8,410 m2
basal area) and 37% occurred in mixed oak woodland
(87,209 trees; 4,243 m2 basal area).
Integration of the 175 plots (0.05 ha) with the
remote assessment of absolute tree mortality showed
that mixed oak woodlands had a greater total number
of host trees (C6 cm DBH) with a greater mean
population density than redwood-tanoak forests
(Table 3). However, the proportion of hosts trees
killed by sudden oak death was similar in each of the
two host vegetation types (Table 3). We were not
able to distinguish the difference between dead coast
live oak, Shreve’s oak and black oak within mixed
oak woodlands via remote sensing, and thus cannot
quantify species level mortality estimates within
Quercus.
Current mortality in the study area is concentrated
in the northern portion of the ecoregion (Fig. 7). The
drainages experiencing highest mean densities of
mortality in redwood-tanoak forest were Partington
Canyon (mean = 31 dead trees per ha), Bixby Creek
Table 2 Regression correction models predicting tree mortality based on remotely assessed mortality. All partial regression coef-
ficients shown were statistically significant (P \ 0.001)
Models N r2 RMSE Model
Field assessment vs. mapped assessment of dead tree density
Redwood-tanoak 29 0.66 1.00 0.92 + 1.18 md
Mixed-oak 39 0.87 0.95 1.38 + 1.28 md - 0.001e - 0.001 md 9 e
Regression adjusted mapped assessment vs. basal area
Redwood-tanoak 29 0.54 0.29 0.043 + 0.23 md
Mixed-oak 39 0.73 0.37 -0.036 + 0.33 md
Notes: md = mapped density; e = elevation
Fig. 6 Relationships
between cumulative tree
basal area and field assessed
dead tree density (upper
graphs) and adjusted dead
tree density (lower graphs)
by forest type: (a)
Redwood-tanoak forest and
(b) mixed oak woodland
Impact of sudden oak death on tree mortality
123
Lexi Christensen
Out of the 235,678 dead trees total 148,469 were redwood forest and 87,209 were oak woodland

Mixed Oak Woodlands
Predicted number of dead oak trees per 0.25 ha plot
sllecdirg
ah52.0fo
rebmu
N
0
1000
2000
3000
4000
Redwood-Tanoak Forest
Predicted number of dead tanoak trees per 0.25 ha plot
sllecdirg
a h52. 0f o
re bmu
N
00 10 20 30 40 50 60
0 10 20 30 40 50 60
1000
2000
3000
4000
5000
Fig. 7 Spatial distribution of the estimated density of sudden
oak death tree mortality based on the redwood-tanoak forest
and mixed oak woodland correction models described in
Table 3. The inset map illustrates a magnified view of the
0.25 ha grid cell mortality estimates overlaying the digital
color imagery. Histograms indicate number of 0.25 ha cells as
a function of density of dead trees in each host forest type
R. K. Meentemeyer et al.
123

(28 ha-1) and the south fork of the Little Sur River
(27 ha-1). The highest mean densities of mortality in
mixed oak woodlands occur along moderate elevation
slopes of Granite Canyon (19 ha-1) and Sycamore
Canyon (15 ha-1) drainages. No mortality was
detected in Big Creek, Vincente Creek, and Salmon
Creek canyons, despite the existence of susceptible
host habitat (Fig. 7). Relatively small amounts of
mortality were detected in remote areas of several
canyons previously thought to be uninfected, includ-
ing Willow Creek (\1 ha-1), Prewitt Creek (10 ha-1),
and Mill Creek (4 ha-1) (Fig. 7).
Discussion
Information on the spatial distribution of tree diseases
are needed for landscape-scale analyses of disease
dynamics and impacts, and subsequent development of
management actions (Holdenrieder et al. 2004). Our
spatially-explicit assessment of oak mortality indi-
cates that Phytophthora ramorum has substantially
impacted forest ecosystems in the Big Sur region of
coastal California, killing over 200,000 oak and tanoak
trees with a total loss of at least 12,650 m2 of tree basal
area—20% of available host trees in the impacted
forest stands. Although mortality has been observed in
Big Sur since the mid 1990s (16 years ago), we have
documented impacts relatively early in the epidemic.
The majority of potential host habitat in the Big Sur
ecoregion has yet to experience sudden oak death tree
mortality. The majority of potential host habitat (80%)
has yet to experience sudden oak death tree mortality.
Over the past century, a number of introduced forest
pathogens have caused extensive tree mortality over
wide geographic areas (Rizzo et al. 2005). In North
America, Chestnut blight (causal agent Cryphonectria
parasitica) has dramatically changed the composition
of forests in the eastern United States by removing the
dominant chestnut (Castanea dentata), while white
pine blister rust (causal agent Cronartium ribicola) has
killed many five-needled pines (Pinus spp.) in both
eastern and western forests (Anagnostakis 2001). In
Western Australian jarrah forests, Phytophthora cin-
namomi has caused significant tree mortality over tens
of thousands of hectares (Weste and Marks 1987).
While the damage caused by these diseases is impres-
sive, the extensive tree morality and subsequent
ecological impacts of these important diseases occurred
over many decades. For example, chestnut blight took
nearly 50 years to spread throughout the geographic
range of chestnut trees (Anagnostakis 2001). Therefore
in the case of sudden oak death, we have begun to
document tree mortality levels and potential ecological
impacts at a relatively early stage in the epidemic.
Our estimates of tree mortality are likely conserva-
tive, even after field validation. We were only able to
record standing-dead trees in 2005, not those that had
fallen to the ground. Field studies have suggested that
dead trees will only remain standing for 2–4 years
following death. Sites that have been invaded by
P. ramorum longer than 5 years often have a large
number of stems that could not be measured because
they had either fallen over time or were too decayed to
assess symptoms of P. ramorum caused mortality.
Thus, standing dead trees observed in the 2005 imagery
Table 3 Estimated number, basal area, and prevalence of dead host trees within the ecoregion’s two primary host vegetation types
Redwood-tanoak Mixed oak
Area of impacted host vegetation (ha)a 4,870 1,446
Mean population density (host trees/ha) 152.3 ± 21.43 SE 294.1 ± 23.25 SE
Estimated population of host trees in impacted areas 741,863 425,250
Estimated population of host trees in the ecoregion 2,039,134 5,550,891
Cumulative number of dead trees 148,469 87,209
Mean number of dead trees per grid cella 9.50 9.18
Proportion host trees dead 0.200 0.205
Cumulative basal area (m2) of dead trees 8,410 4,243
Mean cumulative basal area (m2) of dead trees per grid cella 0.54 0.46
a Based on grid cells with at least 1 dead tree mapped as sudden oak death
Redwood-tanoak forest and mixed oak woodland
Impact of sudden oak death on tree mortality
123
Lexi Christensen
Number of dead trees for both species
Lexi Christensen
Number of host trees in this ecoregion - regardless if they are susceptible to mortality or not from impact of pathogens. THIS IS THE TOTAL NUMBER OF TREES IN AN AREA.
Lexi Christensen
Size in ha
Lexi Christensen
Only impact area is listed so i chose impact population
and field survey likely do not represent all cumulative
mortality since 1995. In addition, we were also not able
to record P. ramorum-caused mortality of tanoak
saplings and seedlings less than 6 cm DBH.
We also expected to underestimate sudden oak
death mortality in the digital imagery because dead
trees can be hidden in shadows of larger adjacent
trees and steep terrain. Our field data on oak mortality
revealed that we indeed systematically underesti-
mated P. ramorum-related mortality in the aircraft
imagery and overestimated mortality at higher ele-
vations. Integration of the field and elevation data
with the imagery allowed us to quantitatively correct
and validate our remote assessment. With model
correction, our field plot measurements showed that
we were able to remotely detect the density and basal
area of sudden oak death tree mortality at a relatively
high accuracy (r2 = 0.54–0.87). However, we were
able to more accurately estimate density and basal
area of mortality in mixed oak woodlands than
redwood-tanoak forests. We more often missed dead
tanoak than oak because it often grows beneath the
canopy of large redwood trees and P. ramorum more
aggressively attacks tanoak saplings than oak sap-
lings in the forest understory (Rizzo et al. 2005).
The current patchiness of sudden oak death in Big
Sur provides opportunities and challenges for man-
agement actions in infected and uninfected areas. Our
efforts to map mortality will help prioritize areas for
containment and eradication as well as identify areas
at imminent risk for infection for careful monitoring.
However, manager action must also be consistent
with goals of regional land management, such as
removing invasive species, conserving threatened
species, and controlling wildfire. In addition, over
90% of the Los Padres National Forest in the Big Sur
area is designated wilderness that requires special
considerations prior to management. Ultimately,
landscape-level management strategies for P. ramo-
rum that incorporate prevention, treatment, restora-
tion, and conservation will be the most successful. By
working with both public and private partners, the
pervasive conservation issues facing the Big Sur
ecosystem can be addressed.
Natural ecosystems globally are being increasingly
altered by the spread of emerging pathogens of plants
and wildlife (Daszak 2000; Dobson and Foufopoulos
2001; Harvell et al. 2002; Anderson et al. 2004;
Ehrenfeld 2005). Tree mortality of the magnitude
and spatial scale identified in this study has never been
quantified for sudden oak death. These results illustrate
the virulence of this pathogen and emphasize the
importance of managing disease spread. Further
studies are needed to examine the efficacy of man-
agement strategies for application at landscape scales,
such as thinning of foliar host vegetation (Rizzo et al.
2005), increasing host resistance (Garbelotto et al.
2003b), and early detection of pathogen spread
(Meentemeyer et al. 2004; Murphy et al. 2005).
Without management intervention, further disease
spread may substantially impact the biodiversity and
structure of numerous coastal California forests.
Acknowledgements We thank B.L. Anacker, G. Garner, and
M. Kozanitas for assistance with field work; K. Merg and the
UC Santa Cruz Landels-Hill Big Creek Reserve for use of
researcher and overnight facilities; M. Borchert and the USDA
Forest Service for logistical support; and B.L. Anacker for
helpful contributions to the preparation of the manuscript and
coordination support for field data collection. This research
was supported by grants from the USDA Forest Service
(Pacific Southwest Research Station) and the National Science
Foundation (EF-0622677).
References
Anagnostakis SL (1987) Chestnut blight: the classical problem
of an introduced pathogen. Mycologia 79:23–37
Anagnostakis SL (2001) The effect of multiple importations of
pests and pathogens on a native tree. Biol Invasions
3:245–254
Anderson PK, Cunningham AA, Patel NG, Morales FJ, Epstein
PR, Daszak P (2004) Emerging infectious diseases of
plants: pathogen pollution, climate change and agrotech-
nology drivers. Trends Ecol Evol 19:535–544
Barrett TM, Gatziolis D, Fried JS, Waddell KL (2006) Sudden
oak death in California: what is the potential? J Forest
104:61–64
Beven KJ, Kirkby MJ (1979) A physically based, variable
contributing area model of basin hydrology. Hydrol Sci
Bull 24:43–69
Borchert M, Lopez A, Bauer C, Knowd T (2004) Field guide to
coastal sage scrub and chaparral alliances of Los Padres
National Forest. USDA Forest Service, Vallejo
Burdon JJ, Thrall PH, Ericson L (2006) The current and future
dynamics of disease in plant communities. Annu Rev
Phytopathol 44:19–39
Condeso TE, Meentemeyer RK (2007) Effects of landscape
heterogeneity on the emerging forest disease sudden oak
death. J Ecol 95:364–375
Daszak P (2000) Emerging infectious diseases of wildlife—
threats to biodiversity and human health. Science
287:443–449
Davidson JM, Wickland AC, Patterson HA, Falk KR, Rizzo
DM (2005) Transmission of Phytophthora ramorum in
R. K. Meentemeyer et al.
123

mixed-evergreen forest in California. Phytopathology
95:587–596
Dobson A, Foufopoulos J (2001) Emerging infectious pathogens
of wildlife. Philos Trans R Soc Lond B 356:1001–1012
Dubayah RC (1994) Modeling a solar radiation topoclimatol-
ogy for the Rio Grande river basin. J Veg Sci 5:627–640
Ehrenfeld D (2005) The environmental limits to globalization.
Conserv Biol 19:318–326
Espindola GM, Camara G, Reis IA, Bins LS, Monteiro AM
(2006) Parameter selection for region-growing image
segmentation algorithms using spatial autocorrelation. Int
J Remote Sens 27:3035–3040
Fichtner EJ, Lynch SC, Rizzo DM (2007) Detection, distri-
bution, sporulation, and survival of Phytophthoraramorum in a California redwood-tanoak forest soil.
Phytopathology 97:1366–1375
Garbelotto M, Davidson JM, Ivors KL, Maloney PE, Huberli
D, Koike St, Rizzo DM (2003a) Non-oak native plants are
main hosts for sudden oak death pathogen in California.
California Agric 57:18–23
Garbelotto M, Schmidt DJ, Tjosvold S, Harnik TY (2003b)
Chemical treatment strategies for control of sudden oak
death in oaks and tanoaks. Phytopathology 93:S28
Gilbert GS (2002) Evolutionary ecology of plant diseases in
natural ecosystems. Annu Rev Phytopathol 40:13–43
Harvell CD, Mitchell CE, Ward JR, Altizer S, Dobson AP,
Ostfeld RS, Samuel MD (2002) Climate warming and
disease risks for terrestrial and marine biota. Science
296:2158–2162
Henson P, Usner DJ (1996) The natural history of Big Sur.
University of California Press, California
Ivors K, Garbelotto M, DeVries I, Ruyter-Spira C, Heckkert
TE, Rosenzweig N, Bonants P (2006) Microsatellite
markers identify three lineages of Phytophthora ramorumin US nurseries, yet single lineages in US forest and
European nursery populations. Mol Ecol 15:1493–1505
Holdenrieder O, Pautasso M, Weisberg PJ, Lonsdale D (2004)
Tree diseases and landscape processes: the challenge of
landscape pathology. Trends Ecol Evol 19:446–452
Jensen JR (1996) Introductory digital image processing: a remote
sensing perspective. Prentice Hall, Upper Saddle River
Kelly M, Meentemeyer RK (2002) Landscape dynamics of the
spread of sudden oak death. Photogram Eng Remote Sens
68:1001–1009
Luscier JD, Thompson WL, Wilson JM, Gorham BE, Dragut
LD (2006) Using digital photographs and object-based
image analysis to estimate percent ground cover in veg-
etation plots. Front Ecol Environ 4:408–413
Mack RN, Simberloff D, Lonsdale WM, Evans H, Clout M,
Bazzaz FA (2000) Biotic invasions: causes, epidemiology,
global consequences, and control. Ecol Appl 10:689–710
Maloney PE, Lynch SC, Kane SF, Jensen CE, Rizzo DM
(2005) Establishment of an emerging generalist pathogen
in redwood forest communities. J Ecol 93:899–905
Meentemeyer, R. K., Anaker, B. L., Mark, W., Rizzo, D. M.
(2008a) Early detection of emerging forest disease using
dispersal estimation and ecological niche modeling. Ecol
Appl
Meentemeyer, R. K., Rank, N. E., Anaker, B. L., Rizzo, D.M.,
Cushman, J.H. (2008b) Influence of land-cover change on
the spread of an invasive forest pathogen. Ecol Appl
Meentemeyer R, Rizzo D, Mark W, Lotz E (2004) Mapping the
risk of establishment and spread of sudden oak death in
California. Forest Ecol Manage 200:195–214
Monahan WB, Koenig WD (2006) Estimating the potential
effects of sudden oak death on oak-dependent birds. Biol
Conserv 127:146–157
Moore ID, Grayson RB, Ladson AR (1991) Digital terrain
modelling. A review of hydrological, geomorphological,
and biological applications. Hydrol Process 5:3–30
Murphy SK, Bienapfl J, Rizzo D, Valachovic Y, Lee C (2005)
Monitoring Phytophthora ramorum distribution in streams
within coastal California watersheds. Sudden Oak Death
Science Symposium II, Monterey
Myers N, Mittermeier RA, Mittermeier CG, da Fonseca GAB,
Kent J (2000) Biodiversity hotspots for conservation pri-
orities. Nature 403:853–858
Parker IM, Gilbert GS (2004) The evolutionary ecology of
novel plant-pathogen interactions. Annu Rev Ecol Evol
Syst 35:675–700
Prospero S, Hansen EM, Grunwald NJ, Winton LM (2007)
Population dynamics of the sudden oak death pathogen
Phytophthora ramorum in Oregon from 2001 to 2004.
Mol Ecol 16:2958–2973
Rizzo DM, Garbelotto M (2003) Sudden oak death: endan-
gering California and Oregon forest ecosystems. Front
Ecol Environ 1:197–204
Rizzo DM, Garbelotto M, Davidson JM, Slaughter GW, Koike
ST (2002) Phytophthora ramorum as the cause of exten-
sive mortality of Quercus spp. and Lithocarpusdensiflorus in California. Plant Dis 86:205–214
Rizzo DM, Garbelotto M, Hansen EM (2005) Phytophthoraramorum: integrative research and management of an
emerging pathogen in California and Oregon forests.
Annu Rev Phytopathol 43:309–335
Sawyer JO, Keeler-Wolf T (1997) A manual of California
vegetation. California Native Plant Society, Sacramento
Swiecki TJ, Bernhardt E (2002) Evaluation of stem water
potential and other tree and stand variables as risk factors for
Phytophthora ramorum canker development in coast live
oak. In: R S, D M (eds) Proceedings of the fifth symposium
on California oak woodlands. USDA, Albany, pp 787–798
Tomback DF, Kendall KC (2001) Biodiversity losses: the
downward spiral. In: Tomback DF, Arno SF, Keane RE
(eds) Whitebark pine communities: ecology and restora-
tion. Island Press, Washington
Weste G, Marks GC (1987) The biology of Phytophthoracinnamomi in Australasian forests. Annu Rev Phytopathol
25:207–229
Wickland AC, Frangioso K, Rizzo DM, Meentemeyer RK
(2007) The Big Sur ecoregion sudden oak death adaptive
management project: ecological monitoring. Third sudden
oak death symposium. 5–8 March 2007, Santa Rosa
Yang XB, Dowler WM, Royer MH (1991) Assessing the risk
and potential impact of an exotic plant disease. Plant Dis
75:976–982
Yu Q, Gong P, Clinton N, Biging G, Kelly M, Schirokauer D
(2006) Object-based detailed vegetation classification
with airborne high spatial resolution remote sensing
imagery. Photogram Eng Remote Sens 72:799–811
Impact of sudden oak death on tree mortality
123