Impact of Stoichiometry on the Hydrogen Storage …djsiege/Energy_Storage_Lab/Publications... ·...
10
Impact of Stoichiometry on the Hydrogen Storage Properties of LiNH 2 -LiBH 4 -MgH 2 Ternary Composites Andrea Sudik,* ,† Jun Yang, † Donald J. Siegel, † C. Wolverton, ‡ Roscoe O. Carter III., † and A. R. Drews † Ford Motor Company, Research and AdVanced Engineering, MD1170/RIC, P.O. Box 2053, Dearborn, Michigan 48121, and Materials Science and Engineering Department, Northwestern UniVersity, 2220 Campus DriVe, EVanston, Illinois 60208 ReceiVed: August 14, 2008; ReVised Manuscript ReceiVed: NoVember 21, 2008 We recently reported (Yang, J.; et al. Angew. Chem., Int. Ed. 2008, 47, 882) a novel hydrogen storage composite involving a 2:1:1 LiNH 2 :LiBH 4 :MgH 2 ratio. On the basis of in-depth experimental and computational analysis, this composite was found to release hydrogen via a complex multistep reaction cascade, which seeded the products of a subsequent reversible hydrogen storage reaction. This so-called autocatalytic reaction sequence was found to result in favorable kinetics, ammonia attenuation, and partial low-temperature reversibility. Here, we extend our original study by examining the effects of reactant stoichiometry on the ensuing hydrogen storage desorption pathway and properties. In particular, we examine four (LiNH 2 ) X -(LiBH 4 ) Y -(MgH 2 ) Z composites, where X:Y:Z ) 2:1:2, 1:1:1, 2:0.5:1, and 2:1:1 (original stoichiometry). For each sample, we characterize the postmilled mixtures using powder X-ray diffraction (PXRD) and infrared spectroscopy (IR) analyses and observe differences in the relative extent of two spontaneous milling-induced reactions. Variable- temperature hydrogen desorption data subsequently reveal that all composites exhibit a hydrogen release event at rather low temperature, liberating between 2.3 (1:1:1) and 3.6 (2:0.5:1) wt % by 200 °C. At higher temperatures (200-370 °C), the hydrogen release profiles differ considerably between composites and release a total of 5.7 (1:1:1) to 8.6 (2:0.5:1) wt %. Utilizing variable-temperature IR and PXRD data coupled with first-principles calculations, we propose a reaction pathway that is consistent with the observed phase progression and hydrogen desorption properties. From these data, we conclude that premilled reactant stoichiometry has a profound impact on reaction kinetics and high-temperature reaction evolution because of reactant availability. From this enhanced understanding of the desorption process, we recommend and test a stoichiometrically optimal ratio (3:1:1.5) which releases a total of 9.1 wt % hydrogen. Finally, we assess the reversibility (at 180 °C) of the four primary composites over two desorption cycles and find that only the 2:1:1 and 2:0.5:1 are reversible (3.5 wt % for 2:0.5:1). 1. Introduction Safe and efficient on-board hydrogen storage is widely recognized as an enabling technology for the advancement of hydrogen-fueled vehicles. 1 While there are several challenges associated with the development of a viable hydrogen storage system (including issues such as cost and durability) for automotive applications where size and weight are constrained, volumetric and gravimetric hydrogen densities are of particular concern. As an example, even though hydrogen gas at STP has approximately three times the energy density of gasoline by weight, its volumetric energy density when compressed to 700 bar is only ∼15% of that of gasoline. Moreover, accounting for the weight and volume penalties associated with the tank and ancillary components required for containment, current high- pressure storage systems (350-700 bar) achieve densities of only 3-4 wt % H 2 and ∼20 g of H 2 /L, which is far below the density of a gasoline fuel system as well as the targets established by the U.S. Department of Energy. 2 Consequently, breakthroughs for further densification of hydrogen are highly desirable. Perhaps the most promising approach to achieving automotive hydrogen storage targets is via materials-based storage. Complex hydrides are one class of material which has been proposed for storage applications. These materials, optimally composed of lightweight cations and hydrogen-containing complex anions such as borohydrides (BH 4 - ) 3-5 and alanates (AlH 4 - ), 6,7 show promise for hydrogen storage as they are theoretically capable of achieving both high volumetric and gravimetric hydrogen densities (e.g., LiBH 4 contains 18.5 wt % H 2 and 120 g of H 2 / L). Nevertheless, the strong bonding of hydrogen in complex hydrides typically requires high temperatures and/or low pres- sures to liberate hydrogen from these very stable materials. In addition, at temperatures of practical interest, storage reactions involving complex hydrides frequently release hydrogen at prohibitively slow rates (poor kinetics). In an attempt to remedy these deficiencies, several approaches for improving the thermodynamic and kinetic properties of complex hydrides have been explored. These include “desta- bilized” reactions (e.g., LiBH 4 -MgH 2 ), 8-11 catalyzed reactions (e.g., TiCl 3 -NaAlH 4 ), 12,13 and discovery of new complex hydride reactants [e.g., Li 4 (NH 2 ) 3 (BH 4 )] 14-16 and products [e.g., Li 2 Mg(NH) 2 ]. 17,18 Building on this work, we recently presented a method for further enhancing the properties of complex hydrides through an “autocatalyzed” multistep reaction path- * To whom correspondence should be addressed. E-mail: [email protected]. † Ford Motor Company. ‡ Northwestern University. J. Phys. Chem. C 2009, 113, 2004–2013 2004 10.1021/jp807270y CCC: $40.75 2009 American Chemical Society Published on Web 01/13/2009
Transcript of Impact of Stoichiometry on the Hydrogen Storage …djsiege/Energy_Storage_Lab/Publications... ·...

Impact of Stoichiometry on the Hydrogen Storage Properties of LiNH2-LiBH4-MgH2
Ternary Composites
Andrea Sudik,*,† Jun Yang,† Donald J. Siegel,† C. Wolverton,‡ Roscoe O. Carter III.,† andA. R. Drews†
Ford Motor Company, Research and AdVanced Engineering, MD1170/RIC, P.O. Box 2053,Dearborn, Michigan 48121, and Materials Science and Engineering Department, Northwestern UniVersity,2220 Campus DriVe, EVanston, Illinois 60208
ReceiVed: August 14, 2008; ReVised Manuscript ReceiVed: NoVember 21, 2008
We recently reported (Yang, J.; et al. Angew. Chem., Int. Ed. 2008, 47, 882) a novel hydrogen storage compositeinvolving a 2:1:1 LiNH2:LiBH4:MgH2 ratio. On the basis of in-depth experimental and computational analysis,this composite was found to release hydrogen via a complex multistep reaction cascade, which seeded theproducts of a subsequent reversible hydrogen storage reaction. This so-called autocatalytic reaction sequencewas found to result in favorable kinetics, ammonia attenuation, and partial low-temperature reversibility.Here, we extend our original study by examining the effects of reactant stoichiometry on the ensuing hydrogenstorage desorption pathway and properties. In particular, we examine four (LiNH2)X-(LiBH4)Y-(MgH2)Z
composites, where X:Y:Z ) 2:1:2, 1:1:1, 2:0.5:1, and 2:1:1 (original stoichiometry). For each sample, wecharacterize the postmilled mixtures using powder X-ray diffraction (PXRD) and infrared spectroscopy (IR)analyses and observe differences in the relative extent of two spontaneous milling-induced reactions. Variable-temperature hydrogen desorption data subsequently reveal that all composites exhibit a hydrogen releaseevent at rather low temperature, liberating between 2.3 (1:1:1) and 3.6 (2:0.5:1) wt % by 200 °C. At highertemperatures (200-370 °C), the hydrogen release profiles differ considerably between composites and releasea total of 5.7 (1:1:1) to 8.6 (2:0.5:1) wt %. Utilizing variable-temperature IR and PXRD data coupled withfirst-principles calculations, we propose a reaction pathway that is consistent with the observed phaseprogression and hydrogen desorption properties. From these data, we conclude that premilled reactantstoichiometry has a profound impact on reaction kinetics and high-temperature reaction evolution because ofreactant availability. From this enhanced understanding of the desorption process, we recommend and test astoichiometrically optimal ratio (3:1:1.5) which releases a total of 9.1 wt % hydrogen. Finally, we assess thereversibility (at 180 °C) of the four primary composites over two desorption cycles and find that only the2:1:1 and 2:0.5:1 are reversible (3.5 wt % for 2:0.5:1).
1. Introduction
Safe and efficient on-board hydrogen storage is widelyrecognized as an enabling technology for the advancement ofhydrogen-fueled vehicles.1 While there are several challengesassociated with the development of a viable hydrogen storagesystem (including issues such as cost and durability) forautomotive applications where size and weight are constrained,volumetric and gravimetric hydrogen densities are of particularconcern. As an example, even though hydrogen gas at STP hasapproximately three times the energy density of gasoline byweight, its volumetric energy density when compressed to 700bar is only !15% of that of gasoline. Moreover, accountingfor the weight and volume penalties associated with the tankand ancillary components required for containment, current high-pressure storage systems (350-700 bar) achieve densities ofonly 3-4 wt % H2 and !20 g of H2/L, which is far below thedensity of a gasoline fuel system as well as the targetsestablished by the U.S. Department of Energy.2 Consequently,breakthroughs for further densification of hydrogen are highlydesirable.
Perhaps the most promising approach to achieving automotivehydrogen storage targets is via materials-based storage. Complexhydrides are one class of material which has been proposed forstorage applications. These materials, optimally composed oflightweight cations and hydrogen-containing complex anionssuch as borohydrides (BH4
-)3-5 and alanates (AlH4-),6,7 show
promise for hydrogen storage as they are theoretically capableof achieving both high volumetric and gravimetric hydrogendensities (e.g., LiBH4 contains 18.5 wt % H2 and 120 g of H2/L). Nevertheless, the strong bonding of hydrogen in complexhydrides typically requires high temperatures and/or low pres-sures to liberate hydrogen from these very stable materials. Inaddition, at temperatures of practical interest, storage reactionsinvolving complex hydrides frequently release hydrogen atprohibitively slow rates (poor kinetics).
In an attempt to remedy these deficiencies, several approachesfor improving the thermodynamic and kinetic properties ofcomplex hydrides have been explored. These include “desta-bilized” reactions (e.g., LiBH4-MgH2),8-11 catalyzed reactions(e.g., TiCl3-NaAlH4),12,13 and discovery of new complexhydride reactants [e.g., Li4(NH2)3(BH4)]14-16 and products [e.g.,Li2Mg(NH)2].17,18 Building on this work, we recently presenteda method for further enhancing the properties of complexhydrides through an “autocatalyzed” multistep reaction path-
* To whom correspondence should be addressed. E-mail: [email protected].† Ford Motor Company.‡ Northwestern University.
J. Phys. Chem. C 2009, 113, 2004–20132004
10.1021/jp807270y CCC: $40.75 2009 American Chemical SocietyPublished on Web 01/13/2009
way.19 Specifically, a combination of three hydride compounds,a 2:1:1 molar ratio of LiNH2, LiBH4, and MgH2, was found toexhibit a reduced desorption temperature (!140 °C onset),increased H2 purity, facile kinetics, and partial reversibility (2.8wt % at 140 °C) as compared to its individual constituents. In-depth phase identification, property analysis, and first-principlescalculations revealed that these properties arose via a coupledreaction cascade, yielding an autocatalyzed reversible hydrogendesorption step. More recently, a follow-up study was conductedto evaluate the role of MgH2 in the multistep hydrogen storageprocess.20 On the basis of a series of (LiNH2)2-LiBH4-(MgH2)Z
compositions (where Z ) 0-1), the desired autocatalyzedreaction pathway was increasingly accessed (and hydrogenstorage properties improved) for increasing amounts of MgH2
(maximized at Z ) 1). A related study probing the impact ofsmall amounts of LiBH4 on Mg(NH2)-LiH (1:2) was alsorecently reported by Hu et al.21 However, these studies did notexamine the effect of variable amounts of LiNH2 and/or largerfractions of LiBH4 (including MgH2 amounts beyond 33mol %).
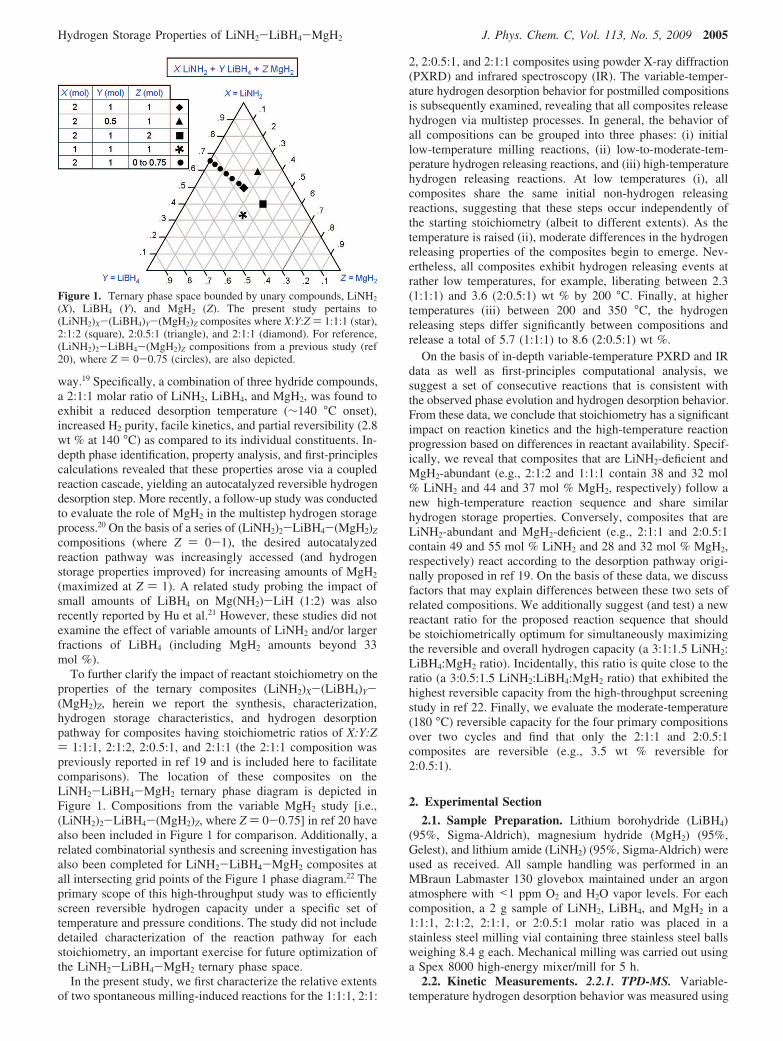
To further clarify the impact of reactant stoichiometry on theproperties of the ternary composites (LiNH2)X-(LiBH4)Y-(MgH2)Z, herein we report the synthesis, characterization,hydrogen storage characteristics, and hydrogen desorptionpathway for composites having stoichiometric ratios of X:Y:Z) 1:1:1, 2:1:2, 2:0.5:1, and 2:1:1 (the 2:1:1 composition waspreviously reported in ref 19 and is included here to facilitatecomparisons). The location of these composites on theLiNH2-LiBH4-MgH2 ternary phase diagram is depicted inFigure 1. Compositions from the variable MgH2 study [i.e.,(LiNH2)2-LiBH4-(MgH2)Z, where Z ) 0-0.75] in ref 20 havealso been included in Figure 1 for comparison. Additionally, arelated combinatorial synthesis and screening investigation hasalso been completed for LiNH2-LiBH4-MgH2 composites atall intersecting grid points of the Figure 1 phase diagram.22 Theprimary scope of this high-throughput study was to efficientlyscreen reversible hydrogen capacity under a specific set oftemperature and pressure conditions. The study did not includedetailed characterization of the reaction pathway for eachstoichiometry, an important exercise for future optimization ofthe LiNH2-LiBH4-MgH2 ternary phase space.
In the present study, we first characterize the relative extentsof two spontaneous milling-induced reactions for the 1:1:1, 2:1:
2, 2:0.5:1, and 2:1:1 composites using powder X-ray diffraction(PXRD) and infrared spectroscopy (IR). The variable-temper-ature hydrogen desorption behavior for postmilled compositionsis subsequently examined, revealing that all composites releasehydrogen via multistep processes. In general, the behavior ofall compositions can be grouped into three phases: (i) initiallow-temperature milling reactions, (ii) low-to-moderate-tem-perature hydrogen releasing reactions, and (iii) high-temperaturehydrogen releasing reactions. At low temperatures (i), allcomposites share the same initial non-hydrogen releasingreactions, suggesting that these steps occur independently ofthe starting stoichiometry (albeit to different extents). As thetemperature is raised (ii), moderate differences in the hydrogenreleasing properties of the composites begin to emerge. Nev-ertheless, all composites exhibit hydrogen releasing events atrather low temperatures, for example, liberating between 2.3(1:1:1) and 3.6 (2:0.5:1) wt % by 200 °C. Finally, at highertemperatures (iii) between 200 and 350 °C, the hydrogenreleasing steps differ significantly between compositions andrelease a total of 5.7 (1:1:1) to 8.6 (2:0.5:1) wt %.
On the basis of in-depth variable-temperature PXRD and IRdata as well as first-principles computational analysis, wesuggest a set of consecutive reactions that is consistent withthe observed phase evolution and hydrogen desorption behavior.From these data, we conclude that stoichiometry has a significantimpact on reaction kinetics and the high-temperature reactionprogression based on differences in reactant availability. Specif-ically, we reveal that composites that are LiNH2-deficient andMgH2-abundant (e.g., 2:1:2 and 1:1:1 contain 38 and 32 mol% LiNH2 and 44 and 37 mol % MgH2, respectively) follow anew high-temperature reaction sequence and share similarhydrogen storage properties. Conversely, composites that areLiNH2-abundant and MgH2-deficient (e.g., 2:1:1 and 2:0.5:1contain 49 and 55 mol % LiNH2 and 28 and 32 mol % MgH2,respectively) react according to the desorption pathway origi-nally proposed in ref 19. On the basis of these data, we discussfactors that may explain differences between these two sets ofrelated compositions. We additionally suggest (and test) a newreactant ratio for the proposed reaction sequence that shouldbe stoichiometrically optimum for simultaneously maximizingthe reversible and overall hydrogen capacity (a 3:1:1.5 LiNH2:LiBH4:MgH2 ratio). Incidentally, this ratio is quite close to theratio (a 3:0.5:1.5 LiNH2:LiBH4:MgH2 ratio) that exhibited thehighest reversible capacity from the high-throughput screeningstudy in ref 22. Finally, we evaluate the moderate-temperature(180 °C) reversible capacity for the four primary compositionsover two cycles and find that only the 2:1:1 and 2:0.5:1composites are reversible (e.g., 3.5 wt % reversible for2:0.5:1).
2. Experimental Section2.1. Sample Preparation. Lithium borohydride (LiBH4)
(95%, Sigma-Aldrich), magnesium hydride (MgH2) (95%,Gelest), and lithium amide (LiNH2) (95%, Sigma-Aldrich) wereused as received. All sample handling was performed in anMBraun Labmaster 130 glovebox maintained under an argonatmosphere with <1 ppm O2 and H2O vapor levels. For eachcomposition, a 2 g sample of LiNH2, LiBH4, and MgH2 in a1:1:1, 2:1:2, 2:1:1, or 2:0.5:1 molar ratio was placed in astainless steel milling vial containing three stainless steel ballsweighing 8.4 g each. Mechanical milling was carried out usinga Spex 8000 high-energy mixer/mill for 5 h.
2.2. Kinetic Measurements. 2.2.1. TPD-MS. Variable-temperature hydrogen desorption behavior was measured using
Figure 1. Ternary phase space bounded by unary compounds, LiNH2
(X), LiBH4 (Y), and MgH2 (Z). The present study pertains to(LiNH2)X-(LiBH4)Y-(MgH2)Z composites where X:Y:Z ) 1:1:1 (star),2:1:2 (square), 2:0.5:1 (triangle), and 2:1:1 (diamond). For reference,(LiNH2)2-LiBH4-(MgH2)Z compositions from a previous study (ref20), where Z ) 0-0.75 (circles), are also depicted.
Hydrogen Storage Properties of LiNH2-LiBH4-MgH2 J. Phys. Chem. C, Vol. 113, No. 5, 2009 2005

a temperature-programmed desorption (TPD) apparatus con-structed in-house utilizing a MKS PPT electron-ionizationquadrapole mass spectrometer (MS) equipped with a heatedcapillary inlet (115 °C), a Lindberg tube furnace with program-mable temperature control, and a Brooks 5850 E-series massflow controller. For each experiment, a specimen of ap-proximately 20 mg of sample was loaded into a quartz tubebetween quartz wool plugs. The septum-sealed specimen tubewas placed in the furnace, and a continuous flow of UHP Arcarrier gas (100 sccm flow rate) was passed through thespecimen while it was heated at a programmed rate of 5 °C/min from room temperature to 370 °C. Concentrations ofhydrogen (m/z ) 2) and ammonia (m/z ) 17) in the effluentwere determined by comparison to single-point calibrationsobtained using certified mixtures of 1% H2/N2 and 2.05% NH3/N2, and all TPD-MS comparison plots were normalized againstthe sample weight. The mass signals corresponding to a varietyof non-hydrogen volatile or gaseous species (e.g., ammonia,diborane, borazine, water, oxygen, etc.) were also tracked duringthe TPD-MS experiments and, with the exception of ammonia,were found to remain below the detection limit of our instrument(100 ppm) throughout the entire temperature profile.
2.2.2. WDD. Variable-temperature hydrogen desorption ki-netics were characterized using a water displacement desorption(WDD) apparatus constructed in-house where the desorbed gasamount was directly monitored as a function of temperature.For each experiment, approximately 250 mg of sample wasloaded into a stainless steel autoclave. The sealed autoclave wasmounted onto a three-port manifold connected to UHP Ar purgegas as well as an outlet tube that passes through the bottom ofa water-filled graduated buret. The manifold and sample werepurged with Ar prior to each experiment. The sample was heatedat a constant rate (5 °C/min) from room temperature to the finalset point (up to 370 °C), and the desorbed hydrogen volumewas manually monitored as the amount of water is displaced inthe buret. The amount of desorbed hydrogen was corrected forthe reduced headspace pressure and thermal expansion of 1 barof Ar gas upon sample heating.
2.2.3. PCT. Isothermal hydrogen desorption and cyclingexperiments were performed using a PCT Pro-2000 Sievert-type pressure-composition-temperature (PCT) apparatus fromHy-Energy. In a typical experiment, a 200 mg sample wasloaded into an autoclave sample holder having a thermocouplethat penetrates into the sample interior. Temperatures andpressures of the sample and gas reservoirs were monitored byLabView-based control software. Desorption kinetics wereperformed at the indicated temperature (180-250 °C) usinghydrogen back pressure (1 bar). Adsorption experiments wereperformed at a 180 °C and 150 bar hydrogen pressure.
2.3. Characterization. 2.3.1. In Situ Powder X-ray Dif-fraction (PXRD). Phase identity and purity was characterizedby using variable-temperature in situ powder X-ray diffractiondata collected using a Bueler HDK 2.4 furnace chamber attachedto a Scintag X1 diffractometer, an Inel CPS 120 positionsensitive detector, and collimated Cu KR radiation. Specimenswere prepared in an inert atmosphere glovebox by spreadingpowder onto a sapphire crystal with a drop of mineral oilimpregnated into the powder and then stored in a sealedcontainer to protect the powder against exposure to room airduring transfer into the HTXRD chamber. Once the specimenwas placed onto the heating strip, and the furnace chamber wassealed, the atmosphere inside the chamber was evacuated andbackfilled with nitrogen several times to eliminate residualoxygen and moisture. Data were collected under an atmosphere
of flowing purified nitrogen (200 sccm), while the temperaturewas ramped at a continuous rate of 2 °C/min from 50 to 300 or350 °C, following an initial room-temperature scan. The residualmineral oil used during sample transfer and loading results inan observed halo at 20° (two-theta) in the two-dimensionalcontour plot data (Figure 4). This effect persists from roomtemperature to 100 °C at which point the mineral oil becomesless viscous and is able to flow off of the sample holder. Scanswere integrated for 5 min, each corresponding to a temperatureaverage over a 10 °C window while ramping. The phaseassemblage was determined for each scan using the MDI JADEsoftware and the Powder Diffraction File (PDF-4). In addition,the presence of transient liquid phases made a completequantitative analysis impossible, and phase assemblages pre-sented here are from tracking the net intensities of representativepeaks for each crystalline phase.
2.3.2. In Situ Infrared Spectroscopy (IR). Variable-temper-ature diffuse reflectance infrared spectra were obtained on aMattson Instruments Sirius 100 FT-IR spectrometer withupgraded electronics and high-speed parallel data transfercapability. The unit was equipped with a water-cooled sourceand a HgCdTe nitrogen-cooled detector. A Harrick prayingmantis accessory with a high-temperature environmental cellwas used, which was equipped with KBr windows. Finelyground KBr powder was used as a reference material. Theinstrument was purged with boil-off liquid nitrogen, while thesample cell was purged with flowing UHP helium. Theinterferometer mirror velocity corresponded to a HeNe modula-tion frequency of 40 kHz. All data manipulations and transfor-mations were accomplished with Mattson WinFirst software.Each sample was heated at a rate of 5 °C/min from roomtemperature to 320 °C.
2.4. Density Functional Theory (DFT) Calculations. First-principles calculations of finite-temperature thermodynamicquantities, enthalpies, entropies, and free energies were per-formed using density functional theory (VASP23 code), inconjunction with an evaluation of lattice normal-mode vibra-tional frequencies via the harmonic approximation. The projectoraugmented wave method24 was used to describe the core-valenceinteraction, and the exchange-correlation energy was evaluatedusing the PW91 generalized gradient approximation.25 Thecrystallographic phases used for DFT calculations on LiNH2,LiBH4, Li4BN3H10, and Li3BN2 are described in ref 29. Sourcesfor the structures of other relevant phases are as follows:Mg(NH2)2, ref 26; Mg3N2, ref 27; and R-Li2Mg(NH)2, ref 28.Further details regarding our calculations can be foundelsewhere.10,19,29,30
3. Results and Discussion3.1. Synthesis and Characterization of (LiNH2)X-
(LiBH4)Y-(MgH2)Z Composites.The four (LiNH2)X-(LiBH4)Y-(MgH2)Z composites, where X:Y:Z ) 1:1:1, 2:1:2, 2:1:1, and2:0.5:1, were prepared by milling the respective reactants inthe appropriate molar ratios (section 2.1). The phase assemblageof the postmilled samples was subsequently characterized usingPXRD (Figure 2a) and IR measurements (Figure 2b). From thesedata, it is evident that the premilled reactant stoichiometry hassome impact on the identity and relative abundance of the phasespresent in the postmilled products. As previously reported forthe 2:1:1 composite (pink, Figure 2), two new phases [Li4BN3H10
and Mg(NH2)2] are observed in the postmilled sample. Theidentification of these phases is based on PXRD data as well asthe observance of N-H amide stretches characteristic forLi4BN3H10 (3303 and 3242 cm-1, observed; 3303 and 3243cm-1, ref 31) and Mg(NH2)2 (3328 and 3272 cm-1, observed;
2006 J. Phys. Chem. C, Vol. 113, No. 5, 2009 Sudik et al.
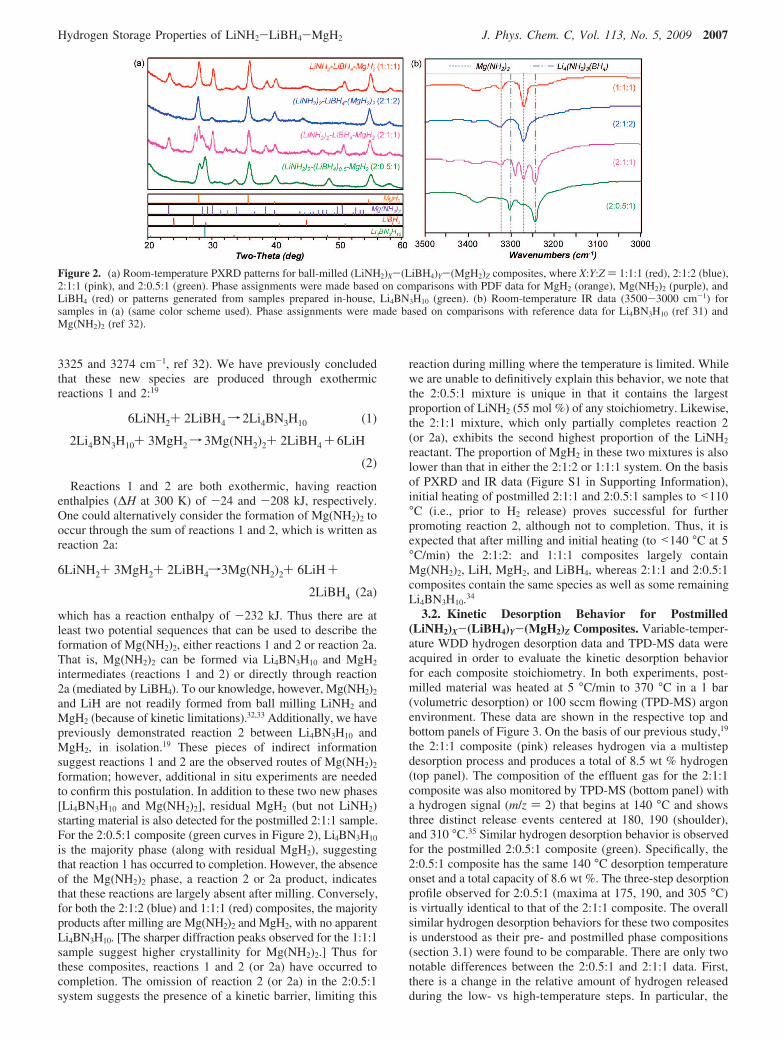
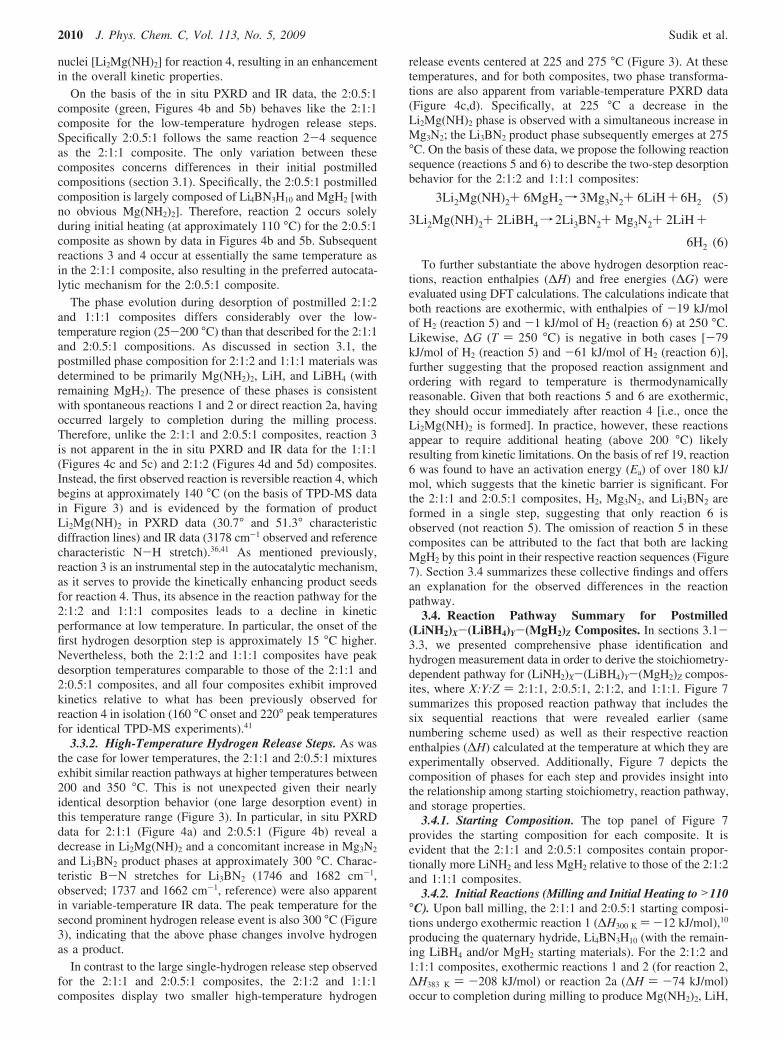
3325 and 3274 cm-1, ref 32). We have previously concludedthat these new species are produced through exothermicreactions 1 and 2:19
6LiNH2+ 2LiBH4f 2Li4BN3H10 (1)
2Li4BN3H10+ 3MgH2f 3Mg(NH2)2+ 2LiBH4 + 6LiH
(2)
Reactions 1 and 2 are both exothermic, having reactionenthalpies (!H at 300 K) of -24 and -208 kJ, respectively.One could alternatively consider the formation of Mg(NH2)2 tooccur through the sum of reactions 1 and 2, which is written asreaction 2a:
6LiNH2+ 3MgH2+ 2LiBH4f3Mg(NH2)2+ 6LiH+
2LiBH4 (2a)
which has a reaction enthalpy of -232 kJ. Thus there are atleast two potential sequences that can be used to describe theformation of Mg(NH2)2, either reactions 1 and 2 or reaction 2a.That is, Mg(NH2)2 can be formed via Li4BN3H10 and MgH2
intermediates (reactions 1 and 2) or directly through reaction2a (mediated by LiBH4). To our knowledge, however, Mg(NH2)2
and LiH are not readily formed from ball milling LiNH2 andMgH2 (because of kinetic limitations).32,33 Additionally, we havepreviously demonstrated reaction 2 between Li4BN3H10 andMgH2, in isolation.19 These pieces of indirect informationsuggest reactions 1 and 2 are the observed routes of Mg(NH2)2
formation; however, additional in situ experiments are neededto confirm this postulation. In addition to these two new phases[Li4BN3H10 and Mg(NH2)2], residual MgH2 (but not LiNH2)starting material is also detected for the postmilled 2:1:1 sample.For the 2:0.5:1 composite (green curves in Figure 2), Li4BN3H10
is the majority phase (along with residual MgH2), suggestingthat reaction 1 has occurred to completion. However, the absenceof the Mg(NH2)2 phase, a reaction 2 or 2a product, indicatesthat these reactions are largely absent after milling. Conversely,for both the 2:1:2 (blue) and 1:1:1 (red) composites, the majorityproducts after milling are Mg(NH2)2 and MgH2, with no apparentLi4BN3H10. [The sharper diffraction peaks observed for the 1:1:1sample suggest higher crystallinity for Mg(NH2)2.] Thus forthese composites, reactions 1 and 2 (or 2a) have occurred tocompletion. The omission of reaction 2 (or 2a) in the 2:0.5:1system suggests the presence of a kinetic barrier, limiting this
reaction during milling where the temperature is limited. Whilewe are unable to definitively explain this behavior, we note thatthe 2:0.5:1 mixture is unique in that it contains the largestproportion of LiNH2 (55 mol %) of any stoichiometry. Likewise,the 2:1:1 mixture, which only partially completes reaction 2(or 2a), exhibits the second highest proportion of the LiNH2
reactant. The proportion of MgH2 in these two mixtures is alsolower than that in either the 2:1:2 or 1:1:1 system. On the basisof PXRD and IR data (Figure S1 in Supporting Information),initial heating of postmilled 2:1:1 and 2:0.5:1 samples to <110°C (i.e., prior to H2 release) proves successful for furtherpromoting reaction 2, although not to completion. Thus, it isexpected that after milling and initial heating (to <140 °C at 5°C/min) the 2:1:2: and 1:1:1 composites largely containMg(NH2)2, LiH, MgH2, and LiBH4, whereas 2:1:1 and 2:0.5:1composites contain the same species as well as some remainingLi4BN3H10.34
3.2. Kinetic Desorption Behavior for Postmilled(LiNH2)X-(LiBH4)Y-(MgH2)Z Composites. Variable-temper-ature WDD hydrogen desorption data and TPD-MS data wereacquired in order to evaluate the kinetic desorption behaviorfor each composite stoichiometry. In both experiments, post-milled material was heated at 5 °C/min to 370 °C in a 1 bar(volumetric desorption) or 100 sccm flowing (TPD-MS) argonenvironment. These data are shown in the respective top andbottom panels of Figure 3. On the basis of our previous study,19
the 2:1:1 composite (pink) releases hydrogen via a multistepdesorption process and produces a total of 8.5 wt % hydrogen(top panel). The composition of the effluent gas for the 2:1:1composite was also monitored by TPD-MS (bottom panel) witha hydrogen signal (m/z ) 2) that begins at 140 °C and showsthree distinct release events centered at 180, 190 (shoulder),and 310 °C.35 Similar hydrogen desorption behavior is observedfor the postmilled 2:0.5:1 composite (green). Specifically, the2:0.5:1 composite has the same 140 °C desorption temperatureonset and a total capacity of 8.6 wt %. The three-step desorptionprofile observed for 2:0.5:1 (maxima at 175, 190, and 305 °C)is virtually identical to that of the 2:1:1 composite. The overallsimilar hydrogen desorption behaviors for these two compositesis understood as their pre- and postmilled phase compositions(section 3.1) were found to be comparable. There are only twonotable differences between the 2:0.5:1 and 2:1:1 data. First,there is a change in the relative amount of hydrogen releasedduring the low- vs high-temperature steps. In particular, the
Figure 2. (a) Room-temperature PXRD patterns for ball-milled (LiNH2)X-(LiBH4)Y-(MgH2)Z composites, where X:Y:Z ) 1:1:1 (red), 2:1:2 (blue),2:1:1 (pink), and 2:0.5:1 (green). Phase assignments were made based on comparisons with PDF data for MgH2 (orange), Mg(NH2)2 (purple), andLiBH4 (red) or patterns generated from samples prepared in-house, Li4BN3H10 (green). (b) Room-temperature IR data (3500-3000 cm-1) forsamples in (a) (same color scheme used). Phase assignments were made based on comparisons with reference data for Li4BN3H10 (ref 31) andMg(NH2)2 (ref 32).
Hydrogen Storage Properties of LiNH2-LiBH4-MgH2 J. Phys. Chem. C, Vol. 113, No. 5, 2009 2007

2:0.5:1 composite liberates more hydrogen during the low-temperature steps (4.5 wt % at 250 °C) and less at the high-temperature step (8.6 wt % total) than compared to that of the2:1:1 composite (3.7 wt % at 250 °C and 8.5 wt % total). (Wecompare observed and theoretical capacity data for all com-posites in sections 3.4 and 3.5.) Second, the amount of ammonialiberated (from 100 to 200 °C) for the 2:0.5:1 composite isalmost an order of magnitude higher than that of the 2:1:1sample (Figure S2 in Supporting Information). This enhance-ment in released ammonia could stem from the higher relativeamide content [i.e., more Li4BN3H10 and Mg(NH2)2] in thepostmilled 2:0.5:1 composite vs the 2:1:1 composite. Potentiallythese amides are not as readily consumed (via reactions 2, 3,and 4), a kinetic effect leading to their self-decomposition whichinvolves ammonia as a product.28,36-38
The remaining 2:1:2 (blue) and 1:1:1 (red) composites weredetermined to have similar pre- and postmilled phase composi-tions (section 3.1), and thus also exhibit similar desorptioncharacteristics (Figure 3). The behavior for these two stoichi-ometries, however, is markedly different than that of the 2:0.5:1and 2:1:1 composites described above. Specifically, 2:1:2 and1:1:1 both possess significantly reduced total capacities, 6.6 and5.7 wt % (top), respectively, as compared to that of the 2:0.5:1and 2:1:1 mixtures. They also both release hydrogen in threedistinct steps centered at 175, 225, and 275 °C with desorptiononsets approximately 15 °C higher (at !155 °C) than that ofthe 2:1:1 and 2:0.5:1 composites (bottom). As will be discussedlater, these higher onset temperatures for 2:1:2 and 1:1:1 arethought to stem from the absence of the kinetically enhancing
product seeding step, which is observed in the 2:1:1 and 2:0.5:1composites. While the peak of the low-temperature desorptionstep for 2:1:2 and 1:1:1 can largely be superimposed with thatof the 2:0.5:1 and 2:1:1 composites, the two higher-temperaturesteps are noticeably different in terms of both peak positionand magnitude. Finally, for both the 2:1:2 and 1:1:1 composites,there was negligible ammonia detected in the TPD-MS data(Figure S2 of Supporting Information) likely stemming fromthe low relative content and/or facile consumption of amide-based constituents. Overall, in Figure 3, it is evident thatalthough the four composites are all based on the same initialreactants (LiNH2, LiBH4, and MgH2), their specific reactantstoichiometry appears to impact both the phase composition aftermilling (under identical conditions) and the resulting desorptionproperties. Characterization of the desorption pathway for eachcomposite will be used to better understand the effect ofstoichiometry on the resulting properties.
3.3. Product Phase Analysis and Desorption PathwayDetermination for Postmilled (LiNH2)X-(LiBH4)Y-(MgH2)Z
Composites. To understand the dependence of stoichiometryon the resulting desorption properties in the (LiNH2)X-(LiBH4)Y-(MgH2)Z composites, it is necessary to fully charac-
Figure 3. Kinetic hydrogen desorption data as a function of temper-ature (5 °C/min to 370 °C) for (LiNH2)X-(LiBH4)Y-(MgH2)Z com-posites, where X:Y:Z ) 1:1:1 (red circles), 2:1:2 (blue triangles), 2:1:1(pink diamonds), and 2:0.5:1 (green squares). Top: Volumetric hydrogendesorption is given in weight percent (wt %) to 1 bar. Bottom:Temperature-programmed desorption mass spectrometry (TPD-MS)data for hydrogen (m/z ) 2) are reported as relative partial pressure ina flow-through setup (100 sccm Ar). The bottom inset depicts TPD-MS data expanded over the 125-170 °C temperature range. TPD-MSdata for ammonia (m/z ) 17) can be found in Figure S2 of theSupporting Information.
Figure 4. Powder X-ray diffraction (PXRD) data for(LiNH2)X-(LiBH4)Y-(MgH2)Z composites as a function of temperature(25-350 °C), where X:Y:Z ) (a) 2:1:1 (pink), (b) 2:0.5:1 (green), (c)1:1:1 (red), and (d) 2:1:2 (blue). The top panel in each plot is the two-dimensional contour plot derived from the raw patterns (Figures S3-S6in the Supporting Information), whereas the bottom panel is a graphof the relative amounts of individual phases as a function of temperature.
2008 J. Phys. Chem. C, Vol. 113, No. 5, 2009 Sudik et al.

terize each desorption pathway. From the previous study of the2:1:1 mixture,19 we found the task of deciphering the multistepreaction mechanism to be quite complex due to the large numberof elements and reaction products having varying degrees ofcrystallinity. Similarly, on the basis of the observed multistephydrogen release behavior in Figure 3, the remaining 2:0.5:1,2:1:2, and 1:1:1 composites will require the same in-depth phaseidentification methods and first-principles calculations to elu-cidate the reaction details. In particular, we have employed bothvariable-temperature powder X-ray diffraction (PXRD) andvariable-temperature infrared spectroscopy (IR) techniques toexperimentally track product phases over the entire desorptiontemperature range (25-350 °C). The desorption pathway canbe divided into two sets of hydrogen release reactions that occurat low (25-200 °C) and high (200-350 °C) temperatures. Thesereaction steps are described separately in sections 3.3.1 and3.3.2, respectively.
3.3.1. Low-Temperature Hydrogen Release Steps. Figure 4depicts results from the in situ PXRD analysis for eachcomposite, specifically showing the two-dimensional contourplots (top panels) generated from raw data (Figures S3-S6 inthe Supporting Information) and phase assemblage (bottompanels) as a function of temperature. On the basis of these data,which was previously collected for the postmilled 2:1:1composite (Figure 4a), we had deduced19 that the low-temper-ature hydrogen release steps, from 25 to 250 °C, involved thefollowing reaction sequence:
2Li4BN3H10+ 3MgH2f 3Mg(NH2)2+ 2LiBH4 + 6LiH
(2b)
2Li4BN3H10+ 3MgH2f 3Li2Mg(NH)2+ 2LiBH4+ 6H2
(3)
3Mg(NH2)2 + 6LiHT3Li2Mg(NH)2+ 6H2 (4)
Specifically for the 2:1:1 composite, irreversible reaction 2,which was also observed upon milling (section 3.1), is furtheraccessed during initial heating to 110 °C. This is evidenced bythe disappearance of Li4BN3H10 and MgH2 phases in Figure 4adata where the former melts and reacts with the latter as wellas the simultaneous emergence of the product Mg(NH2)2 phase.The presence of reaction 2 is further corroborated from newvariable-temperature IR data which are depicted in Figure 5afor the 2:1:1 composite. In particular, the N-H amide stretchescharacteristic for Li4BN3H10 (3303 and 3242 cm-1, observed;3303 and 3243 cm-1, ref 31) disappear with a simultaneousgrowth in N-H amide stretches for Mg(NH2)2 (3328 and 3272cm-1, observed; 3325 and 3274 cm-1, ref 32) between roomtemperature and 110 °C. As the temperature surpasses 110 °C,the remaining reactants (Li4BN3H10 and MgH2) undergo asecond irreversible reaction 3, releasing hydrogen and formingLi2Mg(NH)2 and LiBH4 product phases. This reaction 3 issupported by the appearance and growth of Li2Mg(NH)2 in bothPXRD (Figure 4a) and IR data (Figure 5a; N-H stretch at 3178cm-1, observed and ref 36).
To corroborate the experimentally observed temperature atwhich reaction 3 becomes preferentially favored over reaction2, the difference in total free energy (!G) for both reactionswas computationally determined by density functional theory(DFT) over the full temperature profile (Figure 6). From thesedata, the calculated temperature at which the !G values forreactions 2 and 3 cross (i.e., reaction 3 becomes more negativethan reaction 2) is approximately 170 °C, a temperature that isfairly consistent with the experimental observation of ap-
proximately 160 °C for kinetic desorption data (top panel, Figure3), which is performed at 5 °C/min to 1 bar.32 Incidentally, thistemperature is also similar to that thermodynamically expectedfor reaction 4 (153 °C calculated temperature based on !H500
K ) 47 kJ/mol of H2). Reaction 3 is crucial to the autocatalyticmechanism, as it serves to directly catalyze (or seed) thesubsequent reversible reaction 4 between Mg(NH2)2 and LiH.More specifically, we believe reaction 3 preforms the product
Figure 5. Infrared spectroscopy (IR) data for(LiNH2)X-(LiBH4)Y-(MgH2)Z composites as a function of temperature(to 320 °C), where X:Y:Z ) (a) 2:1:1 (pink), (b) 2:0.5:1 (green), (c)1:1:1 (red), and (d) 2:1:2 (blue). The spectra are expanded from 3350to 1600 cm-1. Phase assignments were made based on comparisonswith reference data for Li4BN3H10,31 Mg(NH2)2,32 Li2Mg(NH)2,36 andLi3BN2.39
Figure 6. Difference in total free energy (!G) vs temperature (from0 to 600 K) for reactions 2 and 3 computationally determined by densityfunctional theory (DFT).
Hydrogen Storage Properties of LiNH2-LiBH4-MgH2 J. Phys. Chem. C, Vol. 113, No. 5, 2009 2009
nuclei [Li2Mg(NH)2] for reaction 4, resulting in an enhancementin the overall kinetic properties.
On the basis of the in situ PXRD and IR data, the 2:0.5:1composite (green, Figures 4b and 5b) behaves like the 2:1:1composite for the low-temperature hydrogen release steps.Specifically 2:0.5:1 follows the same reaction 2-4 sequenceas the 2:1:1 composite. The only variation between thesecomposites concerns differences in their initial postmilledcompositions (section 3.1). Specifically, the 2:0.5:1 postmilledcomposition is largely composed of Li4BN3H10 and MgH2 [withno obvious Mg(NH2)2]. Therefore, reaction 2 occurs solelyduring initial heating (at approximately 110 °C) for the 2:0.5:1composite as shown by data in Figures 4b and 5b. Subsequentreactions 3 and 4 occur at essentially the same temperature asin the 2:1:1 composite, also resulting in the preferred autocata-lytic mechanism for the 2:0.5:1 composite.
The phase evolution during desorption of postmilled 2:1:2and 1:1:1 composites differs considerably over the low-temperature region (25-200 °C) than that described for the 2:1:1and 2:0.5:1 compositions. As discussed in section 3.1, thepostmilled phase composition for 2:1:2 and 1:1:1 materials wasdetermined to be primarily Mg(NH2)2, LiH, and LiBH4 (withremaining MgH2). The presence of these phases is consistentwith spontaneous reactions 1 and 2 or direct reaction 2a, havingoccurred largely to completion during the milling process.Therefore, unlike the 2:1:1 and 2:0.5:1 composites, reaction 3is not apparent in the in situ PXRD and IR data for the 1:1:1(Figures 4c and 5c) and 2:1:2 (Figures 4d and 5d) composites.Instead, the first observed reaction is reversible reaction 4, whichbegins at approximately 140 °C (on the basis of TPD-MS datain Figure 3) and is evidenced by the formation of productLi2Mg(NH)2 in PXRD data (30.7° and 51.3° characteristicdiffraction lines) and IR data (3178 cm-1 observed and referencecharacteristic N-H stretch).36,41 As mentioned previously,reaction 3 is an instrumental step in the autocatalytic mechanism,as it serves to provide the kinetically enhancing product seedsfor reaction 4. Thus, its absence in the reaction pathway for the2:1:2 and 1:1:1 composites leads to a decline in kineticperformance at low temperature. In particular, the onset of thefirst hydrogen desorption step is approximately 15 °C higher.Nevertheless, both the 2:1:2 and 1:1:1 composites have peakdesorption temperatures comparable to those of the 2:1:1 and2:0.5:1 composites, and all four composites exhibit improvedkinetics relative to what has been previously observed forreaction 4 in isolation (160 °C onset and 220° peak temperaturesfor identical TPD-MS experiments).41
3.3.2. High-Temperature Hydrogen Release Steps. As wasthe case for lower temperatures, the 2:1:1 and 2:0.5:1 mixturesexhibit similar reaction pathways at higher temperatures between200 and 350 °C. This is not unexpected given their nearlyidentical desorption behavior (one large desorption event) inthis temperature range (Figure 3). In particular, in situ PXRDdata for 2:1:1 (Figure 4a) and 2:0.5:1 (Figure 4b) reveal adecrease in Li2Mg(NH)2 and a concomitant increase in Mg3N2
and Li3BN2 product phases at approximately 300 °C. Charac-teristic B-N stretches for Li3BN2 (1746 and 1682 cm-1,observed; 1737 and 1662 cm-1, reference) were also apparentin variable-temperature IR data. The peak temperature for thesecond prominent hydrogen release event is also 300 °C (Figure3), indicating that the above phase changes involve hydrogenas a product.
In contrast to the large single-hydrogen release step observedfor the 2:1:1 and 2:0.5:1 composites, the 2:1:2 and 1:1:1composites display two smaller high-temperature hydrogen
release events centered at 225 and 275 °C (Figure 3). At thesetemperatures, and for both composites, two phase transforma-tions are also apparent from variable-temperature PXRD data(Figure 4c,d). Specifically, at 225 °C a decrease in theLi2Mg(NH)2 phase is observed with a simultaneous increase inMg3N2; the Li3BN2 product phase subsequently emerges at 275°C. On the basis of these data, we propose the following reactionsequence (reactions 5 and 6) to describe the two-step desorptionbehavior for the 2:1:2 and 1:1:1 composites:
3Li2Mg(NH)2+ 6MgH2f 3Mg3N2+ 6LiH+ 6H2 (5)
3Li2Mg(NH)2+ 2LiBH4f 2Li3BN2+ Mg3N2+ 2LiH+
6H2 (6)
To further substantiate the above hydrogen desorption reac-tions, reaction enthalpies (!H) and free energies (!G) wereevaluated using DFT calculations. The calculations indicate thatboth reactions are exothermic, with enthalpies of -19 kJ/molof H2 (reaction 5) and -1 kJ/mol of H2 (reaction 6) at 250 °C.Likewise, !G (T ) 250 °C) is negative in both cases [-79kJ/mol of H2 (reaction 5) and -61 kJ/mol of H2 (reaction 6)],further suggesting that the proposed reaction assignment andordering with regard to temperature is thermodynamicallyreasonable. Given that both reactions 5 and 6 are exothermic,they should occur immediately after reaction 4 [i.e., once theLi2Mg(NH)2 is formed]. In practice, however, these reactionsappear to require additional heating (above 200 °C) likelyresulting from kinetic limitations. On the basis of ref 19, reaction6 was found to have an activation energy (Ea) of over 180 kJ/mol, which suggests that the kinetic barrier is significant. Forthe 2:1:1 and 2:0.5:1 composites, H2, Mg3N2, and Li3BN2 areformed in a single step, suggesting that only reaction 6 isobserved (not reaction 5). The omission of reaction 5 in thesecomposites can be attributed to the fact that both are lackingMgH2 by this point in their respective reaction sequences (Figure7). Section 3.4 summarizes these collective findings and offersan explanation for the observed differences in the reactionpathway.
3.4. Reaction Pathway Summary for Postmilled(LiNH2)X-(LiBH4)Y-(MgH2)Z Composites. In sections 3.1-3.3, we presented comprehensive phase identification andhydrogen measurement data in order to derive the stoichiometry-dependent pathway for (LiNH2)X-(LiBH4)Y-(MgH2)Z compos-ites, where X:Y:Z ) 2:1:1, 2:0.5:1, 2:1:2, and 1:1:1. Figure 7summarizes this proposed reaction pathway that includes thesix sequential reactions that were revealed earlier (samenumbering scheme used) as well as their respective reactionenthalpies (!H) calculated at the temperature at which they areexperimentally observed. Additionally, Figure 7 depicts thecomposition of phases for each step and provides insight intothe relationship among starting stoichiometry, reaction pathway,and storage properties.
3.4.1. Starting Composition. The top panel of Figure 7provides the starting composition for each composite. It isevident that the 2:1:1 and 2:0.5:1 composites contain propor-tionally more LiNH2 and less MgH2 relative to those of the 2:1:2and 1:1:1 composites.
3.4.2. Initial Reactions (Milling and Initial Heating to>110°C). Upon ball milling, the 2:1:1 and 2:0.5:1 starting composi-tions undergo exothermic reaction 1 (!H300 K ) -12 kJ/mol),10
producing the quaternary hydride, Li4BN3H10 (with the remain-ing LiBH4 and/or MgH2 starting materials). For the 2:1:2 and1:1:1 composites, exothermic reactions 1 and 2 (for reaction 2,!H383 K ) -208 kJ/mol) or reaction 2a (!H ) -74 kJ/mol)occur to completion during milling to produce Mg(NH2)2, LiH,
2010 J. Phys. Chem. C, Vol. 113, No. 5, 2009 Sudik et al.

and LiBH4. For the 2:1:1 composite, reaction 2 is only partiallyobserved during milling but is further accessed during initialheating to <110 °C. Reaction 2 is observed only during initialheating for the 2:0.5:1 composite, although it also does not reachcompletion. Because reaction 2 is only fractionally observedfor the 2:1:1 and 2:0.5:1 composites, it is difficult to ascertainthe exact amounts of each phase remaining after this step(reflected by the curved lines in Figure 7). Thus, on the basisof PXRD and IR data, upon milling and initial heating (to<110°C) the 2:1:1 and 2:0.5:1 composites contain a mixture ofLi4BN3H10, Mg(NH2)2, LiH, LiBH4, and MgH2 phases, whereasthe 2:1:2 and 2:0.5:1 composites contain only Mg(NH2)2, LiH,LiBH4, and MgH2.
3.4.3. Hydrogen Release: Step 1 (T ) 110-200 °C). Forthe 2:1:1 and 2:0.5:1 composites, when the temperature sur-passes 110 °C, the remaining Li4BN3H10 and MgH2 reactaccording to reaction 3 (!H443 K ) 15 kJ/mol of H2). Unlikereaction 2, reaction 3 produces hydrogen, and, more importantly,generates the Li2Mg(NH)2 product that serves as preformednuclei for subsequent reaction 4. Reaction 3, which is instru-mental in the kinetics-enhancing autocatalytic mechanism, isnot observed for the 2:1:2 and 1:1:1 composites as no Li4BN3H10
exists. For all composites, reversible hydrogen storage reaction4 (!H463 K ) 50 kJ/mol of H2) is observed and is responsiblefor the majority of hydrogen released at low temperature(2.3-3.6 wt % by 200 °C). Upon completion of reaction 4, the2:1:1 and 2:0.5:1 composites are comprised solely ofLi2Mg(NH)2 and LiBH4, whereas the 2:1:2 and 1:1:1 compositescontain these phases as well as remaining MgH2.
3.4.4. Hydrogen Release: Step 2 (T ) 200-250 °C). The2:1:2 and 1:1:1 composites, which possess both Li2Mg(NH)2
and MgH2, then undergo exothermic hydrogen release reaction5 (!H523 K ) -19 kJ/mol of H2). The hydrogen release eventcentered at 225 °C in the TPD-MS data (Figure 3, bottom panel)is attributed to this reaction for both composites. Reaction 5 is
also consistent with the observance of the Mg3N2 phase invariable-temperature PXRD data (Figure 4b,c). Because the2:1:1 and 2:0.5:1 composites do not possess any remainingMgH2 after reaction 4 (in step 1), step 2 is not observed.
3.4.5. Hydrogen Release: Step 3 (T ) 250-325 °C). Thefinal hydrogen release step observed for all four compositionsbetween 250 and 325 °C can be ascribed to exothermic reaction6 (!H523 K ) -1 kJ/mol of H2). This reaction occurs to a largeextent for the 2:1:1 and 2:0.5:1 composites, as they arecomposed entirely of Li2Mg(NH)2 and LiBH4 prior to this stage.Conversely, the 2:1:2 and 1:1:1 composites contain only minoramounts of these reactants, and thus reaction 6 is less prominentin the hydrogen release data (Figure 3). At the completion ofstep 3, the 2:1:1, 2:1:2, and 1:1:1 composites all contain Mg3N2,Li3BN2, LiH, and LiBH4. However, the 2:0.5:1 composite isproportionally LiBH4-deficient and thus contains residualLi2Mg(NH)2 as evidenced in the IR data (Figure 5b) by the imideN-H stretch, which is characteristic for this phase (at 3178cm-1).
The total observed amounts of hydrogen can be comparedwith the theoretically expected amount based on the reactionsequence proposed in Figure 7. In particular, the observed (andtheoretical) amounts of hydrogen released for the 2:1:1, 2:0.5:1, 2:1:2, and 1:1:1 composites are 8.5 (8.5), 8.6 (8.7), 6.5 (6.6)and 5.7 (5.6) wt %, respectively. On the basis of the Figure 7reaction summary data, we can aim to refine the reactant ratiosuch that it would stoichiometrically match the reaction pathwaywithout leaving excess reactants [e.g., for 2:0.5:1 residualhydrogen-containing Li2Mg(NH)2 remains after reaction 6]. Indoing so, the overall and “lower” temperature capacities wouldbe optimized. In particular, the X:Y:Z ratio for (LiNH2)X-(LiBH4)Y-(MgH2)Z should be selected to enable reactions 1–4to proceed precisely to completion (i.e., without producingexcess reactants or products). Additionally, the amount of MgH2
should be appropriately tuned, so that it would be completely
Figure 7. Summary of the proposed reaction pathway for (LiNH2)X-(LiBH4)Y-(MgH2)Z composites, including reaction enthalpy (!H), temperaturerange, and evolution of phase composition (right panel). The reaction numbers correspond to those used in the text. The asterisks and wavy linesfor the 2:1:1 and 2:0.5:1 composites for the initial reactions indicate that the relative amounts of the respective phases are unable to be estimated.
Hydrogen Storage Properties of LiNH2-LiBH4-MgH2 J. Phys. Chem. C, Vol. 113, No. 5, 2009 2011

consumed via reactions 2 and 3. This enables the desiredautocatalytic reaction 3 to occur while simultaneously optimizingthe overall capacity. Thus, on the basis of reactions 1 and 6 inFigure 7, the appropriate X:Y (LiNH2:LiBH4) ratio is 3:1, andfrom reactions 2 and 3, MgH2 (Z) should be limited to 1.5.Therefore, the composite which stoichiometrically matchesreactions 1–4 and 6 is (LiNH2)3-LiBH4-(MgH2)1.5 (3:1:1.5).This composite is predicted to have a 9.2 wt % total capacitywith 4.6 wt % corresponding to the first hydrogen release step(i.e., reactions 3 and 4). Indeed this composition was preparedand examined, and kinetic desorption data revealed a 9.1 wt %total capacity with 4.2 wt % hydrogen liberated by 250 °C(Figure S7 of the Supporting Information). Nevertheless, becausethis composite is relatively amide-rich (i.e., a proportionallyhigher LiNH2 content), it is not the most favorable with regardto ammonia liberation (Figure S8 of the Supporting Information).
3.5. Reversibility of Postmilled (LiNH2)X-(LiBH4)Y-(MgH2)Z Composites. The low-temperature reversible storagecapacity for each (LiNH2)X-(LiBH4)Y-(MgH2)Z composite wasdetermined based on discharge-charge-discharge experimentsperformed with a Sievert-type PCT apparatus at 180 °C andcharging (discharging) at 150 (1) bar. Results for the first andsecond desorption cycles are shown in Figure 8. For the firstdischarge, all composites rapidly liberate hydrogen within 0.5 h.The observed amounts of hydrogen released correlate reasonablywell with what is expected, on the basis of the Figure 6 reactionpathway through reaction 4. These observed (expected) amountsfor the 2:1:1, 2:0.5:1, 2:1:2, and 1:1:1 composites are 2.9 (4.2),3.7 (4.8), 3.1 (3.3), and 2.7 (2.8) wt %, respectively. Morenoticeable differences between observed and expected amountsare apparent for the 2:1:1 and 2:0.5:1 composites. This discrep-ancy can be understood from the TPD-MS in Figure 3 (bottompanel), where the low-temperature hydrogen release event forthe 2:1:1 and 2:0.5:1 composites is not complete at 180 °C, thetemperature for this reversibility study. The products of thisexperiment for all composites are consistent with Li2Mg(NH)2
and H2 (i.e., through reaction 4 in Figure 7) and are expectedto be reversible. Desorption curves for the second cycle (afterrecharging) are plotted in the inlay of Figure 7. These data revealthat only the 2:1:1 and 2:0.5:1 composites possess low-temperature reversibility with cycle 2 capacities of 2.5 and 3.5wt %, respectively. Differences between cycle 1 and cycle 2
capacity for the 2:1:1 and 2:0.5:1 composites could stem fromthe small portion of hydrogen irreversibly released duringreaction 3. For the 2:1:2 and 1:1:1 composites, virtually nohydrogen is released after recharging. For example, underidentical charging conditions (180 °C and 150 bar H2), the 2:1:2composite still contains Li2Mg(NH)2 (with the remaining MgH2
and LiBH4), on the basis of PXRD data in Figure S9 of theSupporting Information. Thus, for the 2:1:2 and 1:1:1 compos-ites, recharging the Li2Mg(NH)2 phase appears to be preventedunder a variety of examined recharging temperature-timeconditions (i.e., 180-220 °C and 2-48 h at 150 bar). The onlyobvious difference between the reversible 2:1:1 and 2:0.5:1 andirreversible 2:1:2 and 1:1:1 composites is the presence of theremaining MgH2 for the latter compositions. Therefore, we inferthat this MgH2 phase either kinetically or thermodynamicallyinhibits rechargingLi2Mg(NH)2 under theexamined temperature-pressure-time conditions. More detailed investigations arenecessary to clarify the role of MgH2 in the recharging processfor the 2:1:2 and 1:1:1 composites.
4. Conclusion
In conclusion, we have examined the hydrogen storageproperties and reaction pathways of four distinct stoichiometrieswithin the LiNH2-LiBH4-MgH2 ternary composite systemusing a variety of experimental and computational techniques.The key findings of this study are summarized below.
1. Hydrogen desorption temperature: The 2:1:1 and 2:0.5:1systems release hydrogen in two primary steps beginning at 140°C (step 1) and 250 °C (step 2). Conversely, desorption in the2:1:2 and 1:1:1 composites occurs in three apparent steps withtemperature onsets of 155 °C (step 1), 200 °C (step 2), and 250°C (step 3).
2. Total hydrogen capacity: For temperatures up to 370 °C,the 2:0.5:1 stoichiometry releases the most hydrogen (8.6 wt%), followed closely by the 2:1:1 system with 8.5 wt %. The2:1:2 and 1:1:1 systems release 6.6 and 5.6 wt %, respectively.
3. Ammonia release: During desorption, ammonia is presentat negligible levels for all composites with the exception of the2:0.5:1 system, which releases considerably more.
4. Reversibility: Only the 2:1:1 and 2:0.5:1 systems exhibitsignificant low-temperature reversibility with 2.5 and 3.5 wt %,respectively, observed after the second desorption cycle at 180°C.
5. Reaction mechanism: As expected, all stoichiometriesfollow the same initial low-temperature reaction pathway,suggesting that the initial pathway is independent of stoichi-ometry. However, differences in the respective pathways beginto emerge at higher temperatures. At elevated temperatures, theinitial stoichiometry (coupled with the degree to which priorreactions have run to completion) determines whether a specifiedcompound is present and is therefore available as a potentialreactant. For example, seeding reaction 3 is not present in the2:1:2 and 1:1:1 systems because by this stage all of theLi4BN3H10 has been consumed in reaction 2. Additionally,reaction 5 between Li2Mg(NH)2 and MgH2 is only observedfor 2:1:2 and 1:1:1 composites, which still possess MgH2 atthis stage.
6. Optimal stoichiometry: An optimal stoichiometry of 3:1:1.5 is suggested on the basis of the proposed reaction pathway(Figure 7) and is found to have a high capacity (9.1 wt % total)and low onset temperature for desorption (140 °C). However,ammonia is detected as a desorption byproduct.
Supporting Information Available: Infrared (IR) spectraand powder X-ray diffraction (PXRD) characterization data at
Figure 8. Reversible 180 °C isothermal kinetic hydrogen desorptiondata (to 1 bar) based on the first desorption cycle for(LiNH2)X-(LiBH4)Y-(MgH2)Z composites, where X:Y:Z ) 1:1:1 (redcircles), 2:1:2 (blue triangles), 2:1:1 (pink diamonds), and 2:0.5:1 (greensquares). The inset plot depicts data (same color and shape schemeused) for the second desorption cycle after recharging at 180 °C and150 bar H2.
2012 J. Phys. Chem. C, Vol. 113, No. 5, 2009 Sudik et al.

110 °C, ammonia signals from TPD-MS data, and raw variable-temperature PXRD data for all composites (1:1:1, 2:1:2, 2:1:1,and 2:0.5:1). Kinetic desorption data and ammonia signal fromTPD-MS data for 3:1:1.5 composite. PXRD pattern for re-charged 2:1:2 composite. This material is available free ofcharge via the Internet at http://pubs.acs.org.
References and Notes
(1) Crabtree, G. W.; Dresselhaus, M. S.; Buchanan, M. V. Phys. Today2004, 57, 39.
(2) Targets for On-Board Hydrogen Storage Systems, 2007. U.S.Department of Energy Web site.http://www1.eere.energy.gov/hydrogenandfuelcells/storage/pdfs/targets_onboard_hydro_storage.pdf(accessed, July 11, 2008).
(3) Zuttel, A.; Rentsch, S.; Fisher, P.; Wenger, P.; Sudan, P.; Mauron,P.; Emmenegger, C. J. Alloys Compd. 2003, 356, 515.
(4) Zuttel, A.; Wenger, P.; Rentsch, S.; Sudan, P. J. Power Sources2003, 118, 1.
(5) Nakamori, Y.; Li, H.; Miwa, K.; Towata, S.; Orimo, S. Mater.Trans. 2006, 47, 1898.
(6) Bogdanovic, B.; Schwickardi, M. J. Alloys Compd. 1997, 253, 1.(7) Orimo, S.; Nakamori, Y.; Eliseo, J. R.; Zuttel, A.; Jensen, C. M.
Chem. ReV. 2007, 107, 4111.(8) Vajo, J. J.; Skeith, S. L. J. Phys. Chem. B 2005, 109, 3719.(9) Reilly, J. J.; Wiswall, R. H. Inorg. Chem. 1968, 7, 2254.
(10) Siegel, D. J.; Wolverton, C.; Ozolins, V. Phys. ReV. B 2007, 76,134102.
(11) Yang, J.; Sudik, A.; Wolverton, C. J. Phys. Chem. C 2007, 111,19134.
(12) Sun, D.; Srinivasan, S.; Kiyobayashi, T.; Kuriyama, N.; Jensen,C. M. J. Phys. Chem. B 2003, 107, 10176.
(13) Pinkerton, F. E.; Meyer, M. S.; Meisner, G. P.; Balogh, M. P. J.Alloys Compd. 2007, 433, 282.
(14) Pinkerton, F. E.; Meisner, M. M.; Balogh, M.; Kundrat, M. J. Phys.Chem. B 2005, 109, 6.
(15) Aoki, M.; Miwa, K.; Noritake, T.; Kitahara, G.; Nakamori, Y.;Orimo, S.; Towata, S. Appl. Phys. A: Mater. Sci. Process. 2005, 80, 1409.
(16) Chater, P. A.; Anderson, P. A.; Prendergast, J. W.; Walton, A.;Mann, V. S. J.; Book, D.; David, W. I. F.; Johnson, S. R.; Edwards, P. P.J. Alloys Compd. 2007, 446, 350.
(17) Luo, W. J. Alloys Compd. 2004, 381, 284.(18) Wu, G.; Xiong, Z.; Liu, T.; Liu, Y.; Hu, J.; Chen, P.; Feng, Y.;
Wee, A. T. S. Inorg. Chem. 2007, 46, 517.
(19) Yang, J.; Sudik, A.; Siegel, D. J.; Halliday, D.; Drews, A.; Carter,R. O., III.; Wolverton, C.; Lewis, G. J.; Sachtler, J. W. A.; Low, J. J.;Faheem, S. A.; Lesch, D. A.; Ozonlins, V. Angew. Chem., Int. Ed. 2008,47, 882.
(20) Sudik, A.; Yang, J.; Halliday, D.; Wolverton, C. J. Phys. Chem. C2008, 112, 4384.
(21) Hu, J.; Liu, Y.; Wu, G.; Xiong, Z.; Chua, Y.-S.; Chen, P. Chem.Mater. 2008, 20, 4398.
(22) Lewis, G. J.; Sachtler, J. W. A.; Low, J. J.; Lesch, D. A.; Faheem,S. A.; Dosek, P. M.; Knight, L. M.; Halloran, L.; Jensen, C. M.; Yang, J.;Sudik, A.; Siegel, D. J.; Wolverton, C.; Ozolins, V.; Zhang, S. J. AlloysCompd. 2007, 446-447, 355.
(23) Kresse, G.; Furthmuller, J. Phys. ReV. B 1996, 54, 11169.(24) Blochl, P. E. Phys. ReV. B 1994, 50, 17953.(25) Perdew, J. P.; Chevary, J. A.; Vosko, S. H.; Jackson, K. A.;
Pederson, M. R.; Singh, D. J.; Fiolhais, A. C. Phys. ReV. B 1992, 46, 6671.(26) Sorby, M. H.; Nakamura, Y.; Brinks, H. W.; Ichikawa, T.; Hino,
S.; Fujii, H.; Hauback, B. C. J. Alloys Compd. 2007, 428, 297.(27) Partin, D. E.; Williams, D. J.; O’Keeffe, M. J. Solid State Chem.
1997, 132, 56.(28) Rijssenbeek, J.; Gao, Y.; Hanson, J.; Huang, Q.; Jones, C.; Toby,
B. J. Alloys Compd. 2008, 454, 233.(29) Siegel, D. J.; Wolverton, C.; Ozolins, V. Phys. ReV. B 2007, 75,
014101.(30) Wolverton, C.; Siegel, D. J.; Akbarzadeh, A. R.; Ozolins, V. J.
Phys.: Condens. Matter 2008, 20, 064228.(31) Chater, P. A.; David, W. I. F.; Johnson, S. R.; Edwards, P. P.;
Anderson, P. A. Chem. Commun. 2006, (23), 2439.(32) Luo, W.; Sickafoose, S. J. Alloys Compd. 2006, 407, 274.(33) Yang, J.; Sudik, A.; Wolverton, C. J. Alloys Compd. 2007, 430,
334.(34) While not performed, it is anticipated that if the 2:1:1 and 2:0.5:1
composites were held at <110°C for a longer period of time, reaction 2would occur to completion, leaving no residual Li4BN3H10.
(35) The disparity in temperature between kinetic desorption (Figure 3,top) and TPD-MS (Figure 3, bottom) data can be attributed to the pressuredifference during data acquisition, 1 bar static for kinetic desorption and100 sccm flowing Ar for TPD-MS experiments.
(36) Chen, P.; Xiong, Z.; Yang, L.; Wu, G.; Luo, W. J. Phys. Chem. B2006, 110, 14221.
(37) Meisner, G. P.; Scullin, M. L.; Balogh, M. P.; Pinkerton, F. E.;Meyer, M. S. J. Phys. Chem. B 2006, 110, 4186.
(38) Luo, W.; Stewart, K. J. Alloys Compd. 2007, 440, 357.(39) Goubeau, V. J.; Anselment, W. Z. Anorg. Allg. Chem. 1961, 310,
248.(40) Xiong, Z.; Wu, G.; Hu, J.; Chen, P. AdV. Mater. 2004, 16, 1522.(41) Sudik, A.; Yang, J.; Halliday, D.; Wolverton, C. J. Phys. Chem. C
2007, 111, 6568.
JP807270Y
Hydrogen Storage Properties of LiNH2-LiBH4-MgH2 J. Phys. Chem. C, Vol. 113, No. 5, 2009 2013