Impact of Social CRM Technology Use on Social … of Social...Impact of Social CRM Technology Use on...
18
Thirty Sixth International Conference on Information Systems, Fort Worth, Texas 2015 1 Impact of Social CRM Technology Use on Social CRM Performance: An Organizational Perspective Completed Research Paper Introduction Social Media represents a new mode of communication and interaction between companies and their customers, which changes the existing approach to customer relationship management (CRM) (Baird and Parasnis 2013; Kumar and Reinartz 2012). Within traditional CRM, companies have access to one-way communication (e.g., e-mail newsletter) and gather information on existing customers (Choudhury and Harrigan 2014). Due to multidirectional communication through Social Media 1 , companies now have additional access to the public and private information (e.g., profiles, activities, interests etc.) of consumers (e.g., followers of a company’s Social Media account) as well as that of their friends (Alt and Reinhold 2012). The integration of Social Media into CRM is a growing phenomenon, leading to a new scientific paradigm (Askool and Nakata 2011) and is referred to as Social Customer Relationship Management (Social CRM) (Lehmkuhl and Jung 2013). Social CRM is defined by (Greenberg 2010, p. 413) as “[…] a philosophy and a business strategy, supported by a technology platform, business rules, processes and social characteristics, designed to engage the customer in a collaborative conversation in order to provide mutually beneficial value in a trusted and transparent business environment”. Gartner has identified Social CRM as one of the top innovation-triggered themes of the next five to seven years (Alvarez 2013). Given that Social CRM is defined as a business strategy, its implementation requires holistic “transformational efforts among all organizational parts” (Lehmkuhl and Jung 2013, p. 190). In particular, the implementation of Social CRM has the potential to provide mutually beneficial value for both the company and its customers. Today, companies transform their business by applying new strategies, conducting organizational change, developing capabilities and implementing Social CRM technologies (Trainor et al. 2014). Vendors like Lithium, Jive, and Salesforce offer various tools (e.g., Hearsay Social, Radian6, ExcatTarget) for Social CRM in order to achieve, analyze and manage “the customers content on the companies’ Social Media platforms (e.g., Facebook, Twitter, Blogs, etc.)” (Küpper 2014, p. 573). Monitoring and capturing Social Media information (e.g., posts or comments from a customer about a company) were the initial reasons for companies to implement such tools (Sarner and Sussin 2012). Today, companies integrate extended features into their systems (e.g., sentiment analysis, predictive modeling, matching Social Media and CRM data), in order to increase the effectiveness and efficiency of their Social CRM activities (e.g., organize customer-oriented events, develop co-created products and services). Hence, companies are still struggling to realize and assess the benefits of the Social CRM technologies they have implemented (Alvarez 2013; Sarner et al. 2012). Previous works have developed Social CRM architectures (Alt and Reinhold 2012; Reinhold and Alt 2013; Woodcock et al. 2011), identifying individual features of Social CRM technologies without any empirical evidence of the business benefits. The important question remains: the use of which feature results in the most value? Or, to put it another way, which used feature will increase the performance outcomes of the company? Zablah et al. (2012) measures the use of CRM technology in order to evaluate the impact on performance. In terms of the different tools and features of a CRM technology and a Social CRM technology, the article misses the Social Media perspective. In contrast, the previous works of Trainor (2012) and Trainor et al. (2014) investigate the Social CRM topic. Notably, the findings of Trainor et al. (2014) reveal significant impact factors for Social Media technology use on Social CRM capabilities. The authors measure Social Media technology use with reflective indicators (i.e., questions about the use of Facebook, Twitter, YouTube etc.). In light of the fact that companies use tools to communicate on several 1 Multi-directional means that the interaction does not take place exclusively between the company and the customer, but also between the clients, their friends and acquaintances.
Transcript of Impact of Social CRM Technology Use on Social … of Social...Impact of Social CRM Technology Use on...

Thirty Sixth International Conference on Information Systems, Fort Worth, Texas 2015 1
Impact of Social CRM Technology Use on Social CRM Performance: An Organizational
Perspective Completed Research Paper
Introduction
Social Media represents a new mode of communication and interaction between companies and their customers, which changes the existing approach to customer relationship management (CRM) (Baird and Parasnis 2013; Kumar and Reinartz 2012). Within traditional CRM, companies have access to one-way communication (e.g., e-mail newsletter) and gather information on existing customers (Choudhury and Harrigan 2014). Due to multidirectional communication through Social Media1, companies now have additional access to the public and private information (e.g., profiles, activities, interests etc.) of consumers (e.g., followers of a company’s Social Media account) as well as that of their friends (Alt and Reinhold 2012). The integration of Social Media into CRM is a growing phenomenon, leading to a new scientific paradigm (Askool and Nakata 2011) and is referred to as Social Customer Relationship Management (Social CRM) (Lehmkuhl and Jung 2013). Social CRM is defined by (Greenberg 2010, p. 413) as “[…] a philosophy and a business strategy, supported by a technology platform, business rules, processes and social characteristics, designed to engage the customer in a collaborative conversation in order to provide mutually beneficial value in a trusted and transparent business environment”. Gartner has identified Social CRM as one of the top innovation-triggered themes of the next five to seven years (Alvarez 2013).
Given that Social CRM is defined as a business strategy, its implementation requires holistic “transformational efforts among all organizational parts” (Lehmkuhl and Jung 2013, p. 190). In particular, the implementation of Social CRM has the potential to provide mutually beneficial value for both the company and its customers. Today, companies transform their business by applying new strategies, conducting organizational change, developing capabilities and implementing Social CRM technologies (Trainor et al. 2014). Vendors like Lithium, Jive, and Salesforce offer various tools (e.g., Hearsay Social, Radian6, ExcatTarget) for Social CRM in order to achieve, analyze and manage “the customers content on the companies’ Social Media platforms (e.g., Facebook, Twitter, Blogs, etc.)” (Küpper 2014, p. 573). Monitoring and capturing Social Media information (e.g., posts or comments from a customer about a company) were the initial reasons for companies to implement such tools (Sarner and Sussin 2012). Today, companies integrate extended features into their systems (e.g., sentiment analysis, predictive modeling, matching Social Media and CRM data), in order to increase the effectiveness and efficiency of their Social CRM activities (e.g., organize customer-oriented events, develop co-created products and services). Hence, companies are still struggling to realize and assess the benefits of the Social CRM technologies they have implemented (Alvarez 2013; Sarner et al. 2012).
Previous works have developed Social CRM architectures (Alt and Reinhold 2012; Reinhold and Alt 2013; Woodcock et al. 2011), identifying individual features of Social CRM technologies without any empirical evidence of the business benefits. The important question remains: the use of which feature results in the most value? Or, to put it another way, which used feature will increase the performance outcomes of the company? Zablah et al. (2012) measures the use of CRM technology in order to evaluate the impact on performance. In terms of the different tools and features of a CRM technology and a Social CRM technology, the article misses the Social Media perspective. In contrast, the previous works of Trainor (2012) and Trainor et al. (2014) investigate the Social CRM topic. Notably, the findings of Trainor et al. (2014) reveal significant impact factors for Social Media technology use on Social CRM capabilities. The authors measure Social Media technology use with reflective indicators (i.e., questions about the use of Facebook, Twitter, YouTube etc.). In light of the fact that companies use tools to communicate on several
1 Multi-directional means that the interaction does not take place exclusively between the company and the customer, but also between the clients, their friends and acquaintances.

Social Media and Digital Collaborations
2 Thirty Sixth International Conference on Information Systems, Forth Worth, Texas 2015
Social Media channels with different Social Media accounts, the previous approach covers a customer perspective instead of a company perspective. Thus, the evidence regarding a corresponding approach to link Social CRM technology use to Social CRM performance is still missing from the scholarly literature.
However, a clearly defined research gap can be stated: no article investigates and evaluates the impact of Social CRM technology use on Social CRM performance from an organizational perspective with formative indicators. With regard to the level of attention in the current literature, formative indicators (in contrast to reflective indicators) provide detailed insight into the topic under study, which can lead to actionable affordances for companies (Mathieson et al. 2001). Given the novelty of the topic, the objective of the present article is to evaluate the impact of Social CRM technology use on Social CRM performance. To achieve the stated objective, the article develops and evaluates a structural model based on the resource-based view and the capability perspective, deriving three hypotheses from the literature. Accordingly, data from a survey sample of 122 marketing, communication and IT decision makers from different companies is analyzed through a structural equation model, as proposed by Hair et al. (2013). The results show that Social CRM technology use has a significant impact on capabilities, which in turn have a direct impact on Social CRM performance.
The remainder of the paper is structured as follows. The theoretical background is introduced, including a brief description of the resource-based view and the capability perspective. The hypotheses are derived in the next section and the conceptual model is illustrated, followed by a description of the methodology. Next, the results of the evaluated model are highlighted regarding the supported as well as the unsupported hypotheses. The results are discussed in the next section. The theoretical contributions and practical implications are explained. Finally, the conclusion, limitations and avenues for further research are stated.
Theoretical Background
The resource-based view (RBV) (Barney 1991) and the capability perspective (Day 1994) serve as the theoretical background for the article. Regarding the resource-based view, Barney (1991) stated that valuable, rare, inimitable, and non-substitutable resources lead to competitive advantage (e.g., performance). “Resources can be specified as tangibles and intangibles that are used by organizations” (Keramati et al. 2010, p. 1172). Tangibles are the physical assets of a company (Rapp et al. 2010; Trainor et al. 2014) and are, especially in the Information System (IS) domain, consistent to technology (Chuang and Lin 2013; Melville and Kraemer 2004). In contrast, intangibles are specified as knowledge (e.g., human resources) and business resources (e.g., management approaches) (Chuang and Lin 2013; Rapp et al. 2010; Trainor et al. 2014). However, the literature reveals that resources are not sufficient to improve the performance of a company (e.g., Akroush et al. 2011; Coltman et al. 2011; Melville and Kraemer 2004). Improved performance stems from capabilities, which are assembled from the company’s resources (Trainor 2012). Capabilities are specified as a company’s ability to assemble, integrate and deploy resources in order to improve performance (Day 1994; Eisenhardt and Martin 2000; Teece et al. 1997). On the one hand, capabilities are understood as an organizational repeatable pattern (i.e., processes) (Chang et al. 2010) and on the other hand, they are referred to as infrastructural aspects (e.g., IT skills) (Chang et al. 2010; Trainor et al. 2014). Concerning the competitive advantages (e.g., performance), the article focuses on performance dimensions (e.g., Keramati et al. 2010). A corresponding performance measure is described as a business activity, regarding the effectiveness, or the results to be achieved. Thus, a performance measure “can be expressed either in terms of the actual efficiency and/or effectiveness of an action, or in terms of the end result of that action” (Neely et al. 1995, p. 110). Literature within the CRM (e.g., Rapp et al. 2010) and Information System (IS) domain (e.g., Melville and Kraemer 2004) has drawn on the RBV to investigate how resources influence capabilities, which are proposed to improve performance.
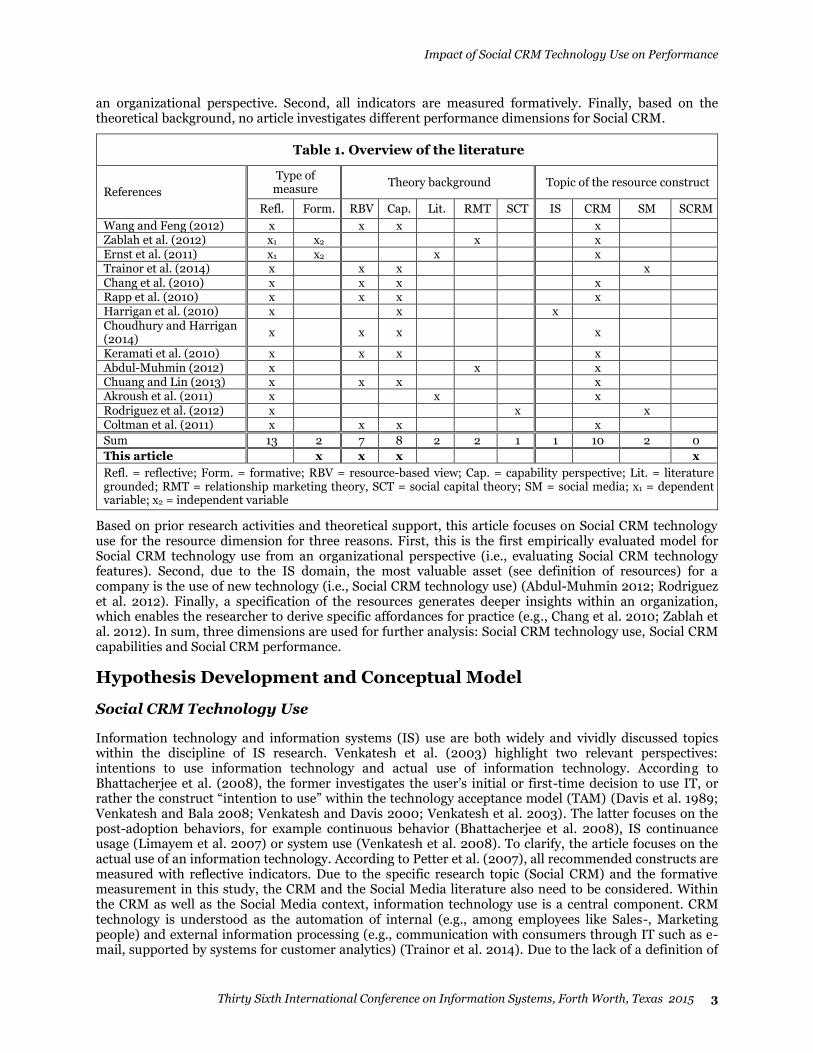
A rigorous analysis of the academic literature yields a total of 105 articles. The focus of the analysis is on empirical models within the context of Social CRM as well as on CRM, Social Media and IS, in order to identify significant effects. After selecting current literature (published after 2009) and analyzing the content, 14 relevant articles are identified. The analysis of the relevant articles includes the type of measurement (i.e., reflective vs. formative indicators), the theoretical background and the topic under study (e.g., Social CRM, CRM). An overview of these previous works is presented in Table 1. In contrast to the previous works, three major differences can be stated. First, this study evaluates all dimensions from
Impact of Social CRM Technology Use on Performance
Thirty Sixth International Conference on Information Systems, Forth Worth, Texas 2015 3
an organizational perspective. Second, all indicators are measured formatively. Finally, based on the theoretical background, no article investigates different performance dimensions for Social CRM.
Table 1. Overview of the literature
References
Type of measure
Theory background Topic of the resource construct
Refl. Form. RBV Cap. Lit. RMT SCT IS CRM SM SCRM
Wang and Feng (2012) x x x x Zablah et al. (2012) x1
x2 x x Ernst et al. (2011) x1 x2 x x Trainor et al. (2014) x x x x Chang et al. (2010) x x x x Rapp et al. (2010) x x x x Harrigan et al. (2010) x x x Choudhury and Harrigan (2014)
x x x x
Keramati et al. (2010) x x x x Abdul-Muhmin (2012) x x x Chuang and Lin (2013) x x x x Akroush et al. (2011) x x x Rodriguez et al. (2012) x x x Coltman et al. (2011) x x x x
Sum 13 2 7 8 2 2 1 1 10 2 0
This article x x x x
Refl. = reflective; Form. = formative; RBV = resource-based view; Cap. = capability perspective; Lit. = literature grounded; RMT = relationship marketing theory, SCT = social capital theory; SM = social media; x1 = dependent variable; x2 = independent variable
Based on prior research activities and theoretical support, this article focuses on Social CRM technology use for the resource dimension for three reasons. First, this is the first empirically evaluated model for Social CRM technology use from an organizational perspective (i.e., evaluating Social CRM technology features). Second, due to the IS domain, the most valuable asset (see definition of resources) for a company is the use of new technology (i.e., Social CRM technology use) (Abdul-Muhmin 2012; Rodriguez et al. 2012). Finally, a specification of the resources generates deeper insights within an organization, which enables the researcher to derive specific affordances for practice (e.g., Chang et al. 2010; Zablah et al. 2012). In sum, three dimensions are used for further analysis: Social CRM technology use, Social CRM capabilities and Social CRM performance.
Hypothesis Development and Conceptual Model
Social CRM Technology Use
Information technology and information systems (IS) use are both widely and vividly discussed topics within the discipline of IS research. Venkatesh et al. (2003) highlight two relevant perspectives: intentions to use information technology and actual use of information technology. According to Bhattacherjee et al. (2008), the former investigates the user’s initial or first-time decision to use IT, or rather the construct “intention to use” within the technology acceptance model (TAM) (Davis et al. 1989; Venkatesh and Bala 2008; Venkatesh and Davis 2000; Venkatesh et al. 2003). The latter focuses on the post-adoption behaviors, for example continuous behavior (Bhattacherjee et al. 2008), IS continuance usage (Limayem et al. 2007) or system use (Venkatesh et al. 2008). To clarify, the article focuses on the actual use of an information technology. According to Petter et al. (2007), all recommended constructs are measured with reflective indicators. Due to the specific research topic (Social CRM) and the formative measurement in this study, the CRM and the Social Media literature also need to be considered. Within the CRM as well as the Social Media context, information technology use is a central component. CRM technology is understood as the automation of internal (e.g., among employees like Sales-, Marketing people) and external information processing (e.g., communication with consumers through IT such as e-mail, supported by systems for customer analytics) (Trainor et al. 2014). Due to the lack of a definition of

Social Media and Digital Collaborations
4 Thirty Sixth International Conference on Information Systems, Forth Worth, Texas 2015
Social CRM technology use in the literature, the authors adopt a previous CRM definition from Zablah et al. (2012). Thus, Social CRM technology use is defined as the degree to which Social CRM technology features are being utilized to support organizational work. Regarding the definition, a necessary first step in assessing the degree of a company’s Social CRM technology use is to identify the corresponding Social CRM technology features, as recommended by Burton-Jones and Straub (2006). 2 A previous classification, adapted from the works of, for example, Alt and Reinhold (2012), Reinhold and Alt (2013), and Woodcock et al. (2011), highlights six categories of tool features (i.e., first-order constructs), namely monitoring and capturing, analysis, exploitation, communication, management-controlling, and IS integration. Further analysis groups these six categories into two superordinary dimensions (i.e., second-order constructs), named processing and management, which determine the resource dimension Social CRM technology use (i.e., third-order construct).
The scholarly literature reveals that technology use has a positive influence on capabilities. This conclusion is supported by Chang et al. (2010), Chuang and Lin (2013), Keramati et al. (2010), Rapp et al. (2010), and Wang and Feng (2012), who all found positive significant relationships within the context of CRM. The positive and significant relationship between Social Media or IS technology use and capabilities is supported by the contributions of Abdul-Muhmin (2012), Harrigan et al. (2010), Rodriguez et al. (2012), and Trainor et al. (2014). Thus, the first hypothesis is as follows:
H1: Social CRM technology use has a positive relationship with Social CRM capability.
Current literature within the Social Media context has stated that the use of Facebook, Twitter, and YouTube have a moderated effect on a company’s capabilities (Rodriguez et al. 2012; Trainor et al. 2014). The relationship of technology use with capabilities will be positively influenced by the use of different Social Media accounts. A company with a portfolio of Social Media accounts is able to capture, analyze etc. more relevant data through the use of Social CRM technologies (e.g., the use of Facebook and Twitter has a higher influence on the relationship than just the use of a YouTube channel). Thus, the second hypothesis is stated:
H2: Social Media use has a positive influence of the relationship between Social CRM technology use and Social CRM capability.
Social CRM Capability
Based on the abovementioned specification of capability, the authors follow a previous definition recommended by Trainor et al. (2014). Thus, Social CRM capabilities are defined as customer-facing activities, including processes and infrastructural aspects in the context of Social Media data designed to engage customers in collaborative conversations and so enhance customer relationships. This article adopts the measurement framework of Kim and Kim (2009), which covers an infrastructural and a process dimension as antecedences for performance dimensions. Three reasons for the adoption can be stated. First, the model was selected after a rigorous and systematic literature review. Second, the framework was published in a highly ranked journal and is widely used3, which provides a high degree of external validity. Finally, the framework was discussed in two focus groups with practitioners and it could be stated that it is very comprehensive and easy to communicate. The differentiation of process and infrastructural capabilities (i.e., second-order constructs) is also stated by Keramati et al. (2010), Choudhury and Harrigan (2014), and Coltman et al. (2011). Process capabilities describe aspects that relate to company-wide, as well as department-specific processes (serve as first-order constructs) of Social CRM (Keramati et al. 2010). In contrast, infrastructure capability describes activities and/or results of infrastructural aspects (Neely et al. 1995), which includes an IT dimension, for example IT-readiness, and a cultural dimension (serve as first-order constructs) (Chang et al. 2010; Chuang and Lin 2013). Both second-order constructs determine the overall capability dimension Social CRM capability (i.e., third-order construct). The literature reveals a positive relationship between Social CRM capabilities and performance. For example, through target-oriented customer events, new customer insights, or better
2 Burton-Jones and Straub (2006) highlights two relevant elements, which still have to be investigated, in this context: first, the system (here: Social CRM technology) that is being used and, second, the function (here: the feature) that is being performed.
3 According to Google Scholar, it is the most cited article for the abovementioned CRM performance measurement models as of October 2014.

Impact of Social CRM Technology Use on Performance
Thirty Sixth International Conference on Information Systems, Forth Worth, Texas 2015 5
customer interactions a company can interact more effectively and efficiently with customers (Trainor et al. 2014). In particular, the literature supports positive and significant coefficients of capabilities to customer performance within the CRM, Social Media and IS context (Chuang and Lin 2013; Jayachandran et al. 2005; Keramati et al. 2010; Rapp et al. 2010; Trainor et al. 2014). The literature also reveals positive and significant relationships with company performance. Thus, the results within the CRM and IS contexts from Chang et al. (2010), Coltman et al. (2011), Ernst et al. (2011), Harrigan et al. (2010), Keramati et al. (2010), Reinartz et al. (2004), and Wang and Feng (2012) provide strong support for the next hypothesis:
H3: Social CRM capability has a positive relationship with Social CRM performance.
Social CRM Performance
The scholarly literature lacks a clear definition of Social CRM performance. Thus, the following definition of performance is adapted, as recommend by Lebas (1995): Social CRM performance is defined as the potential for successful implementation of Social CRM activities in order to achieve business objectives. On the one hand, an objective can be customer related, for example increasing customer loyalty online by 10%. On the other hand, an objective can be company related, for example increasing the success of newly introduced products by 5%. Therefore, the article adopts the two performance dimensions from Kim and Kim (2009), namely customer performance and company performance (second-order constructs). This differentiation is also stated in the articles of Rapp et al. (2010) and Zablah et al. (2012). The customer performance describes the effects of Social CRM on the customers (customer perception) and the aspects of Social CRM, which are perceived by customers (Trainor et al. 2014). Additionally, it includes direct aspects, for example the company has to operate actively, as well as indirect aspects (serve as first-order constructs), for example the management activities of a company. In contrast, the company performance describes the dimension of the company’s success and business results (Wang and Feng 2012; Zablah et al. 2012). In particular, the constructs include monetization aspects, for example financial benefits and customer lifetime value, as well as non-monetization aspects (serve as first-order constructs), for example brand awareness and competitive advantage, in order to establish a long-term and profitable customer relationship. Both second-order constructs determine the overall performance dimension Social CRM performance (i.e., third-order construct).
Figure 1. Conceptual Model
Based on the theoretical background and the three derived hypotheses, the conceptual model is presented in Figure 1. A covariate, namely company size, is added for Social CRM capability and Social CRM
Social Media and Digital Collaborations
6 Thirty Sixth International Conference on Information Systems, Forth Worth, Texas 2015
performance in order to control for the dependent variables in the conceptual model, as proposed by Reinartz et al. (2004), Trainor et al. (2014) and Zablah et al. (2012).
Method
Instrument Development
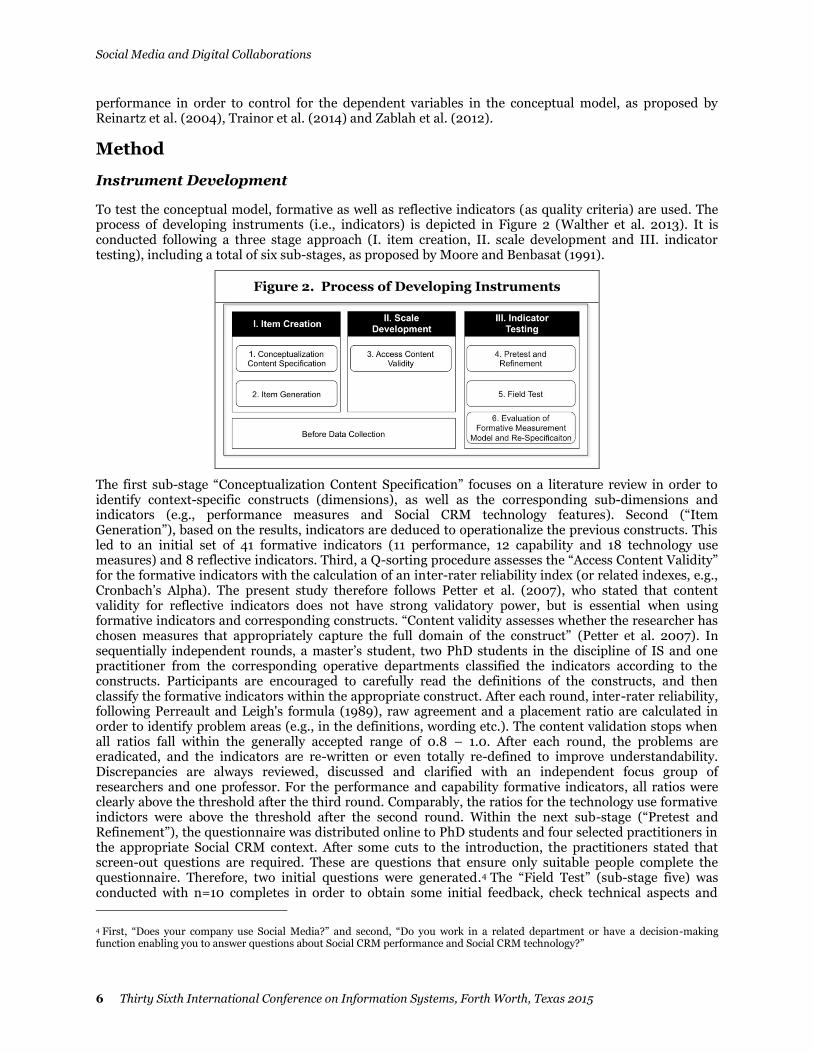
To test the conceptual model, formative as well as reflective indicators (as quality criteria) are used. The process of developing instruments (i.e., indicators) is depicted in Figure 2 (Walther et al. 2013). It is conducted following a three stage approach (I. item creation, II. scale development and III. indicator testing), including a total of six sub-stages, as proposed by Moore and Benbasat (1991).
Figure 2. Process of Developing Instruments
The first sub-stage “Conceptualization Content Specification” focuses on a literature review in order to identify context-specific constructs (dimensions), as well as the corresponding sub-dimensions and indicators (e.g., performance measures and Social CRM technology features). Second (“Item Generation”), based on the results, indicators are deduced to operationalize the previous constructs. This led to an initial set of 41 formative indicators (11 performance, 12 capability and 18 technology use measures) and 8 reflective indicators. Third, a Q-sorting procedure assesses the “Access Content Validity” for the formative indicators with the calculation of an inter-rater reliability index (or related indexes, e.g., Cronbach’s Alpha). The present study therefore follows Petter et al. (2007), who stated that content validity for reflective indicators does not have strong validatory power, but is essential when using formative indicators and corresponding constructs. “Content validity assesses whether the researcher has chosen measures that appropriately capture the full domain of the construct” (Petter et al. 2007). In sequentially independent rounds, a master’s student, two PhD students in the discipline of IS and one practitioner from the corresponding operative departments classified the indicators according to the constructs. Participants are encouraged to carefully read the definitions of the constructs, and then classify the formative indicators within the appropriate construct. After each round, inter-rater reliability, following Perreault and Leigh's formula (1989), raw agreement and a placement ratio are calculated in order to identify problem areas (e.g., in the definitions, wording etc.). The content validation stops when all ratios fall within the generally accepted range of 0.8 – 1.0. After each round, the problems are eradicated, and the indicators are re-written or even totally re-defined to improve understandability. Discrepancies are always reviewed, discussed and clarified with an independent focus group of researchers and one professor. For the performance and capability formative indicators, all ratios were clearly above the threshold after the third round. Comparably, the ratios for the technology use formative indictors were above the threshold after the second round. Within the next sub-stage (“Pretest and Refinement”), the questionnaire was distributed online to PhD students and four selected practitioners in the appropriate Social CRM context. After some cuts to the introduction, the practitioners stated that screen-out questions are required. These are questions that ensure only suitable people complete the questionnaire. Therefore, two initial questions were generated.4 The “Field Test” (sub-stage five) was conducted with n=10 completes in order to obtain some initial feedback, check technical aspects and
4 First, “Does your company use Social Media?” and second, “Do you work in a related department or have a decision-making function enabling you to answer questions about Social CRM performance and Social CRM technology?”
Impact of Social CRM Technology Use on Performance
Thirty Sixth International Conference on Information Systems, Forth Worth, Texas 2015 7
calculate the time that practitioners need to complete the questionnaire. No technical complaints or issues with the length of the questionnaire arose. Particularly for the unique characteristics of formative indicators and the corresponding constructs, the last sub-stage “Evaluation of Formative Measurement Model and Re-Specification” is based on the process of formative measurements from Cenfetelli and Bassellier (2009). The applied confirmatory factor analysis is designed according to Diamantopoulos and Winklhofer (2001), and focuses on a statistical evaluation of formative indicators and corresponding constructs (see “Measurement Model” section).
Data Sample
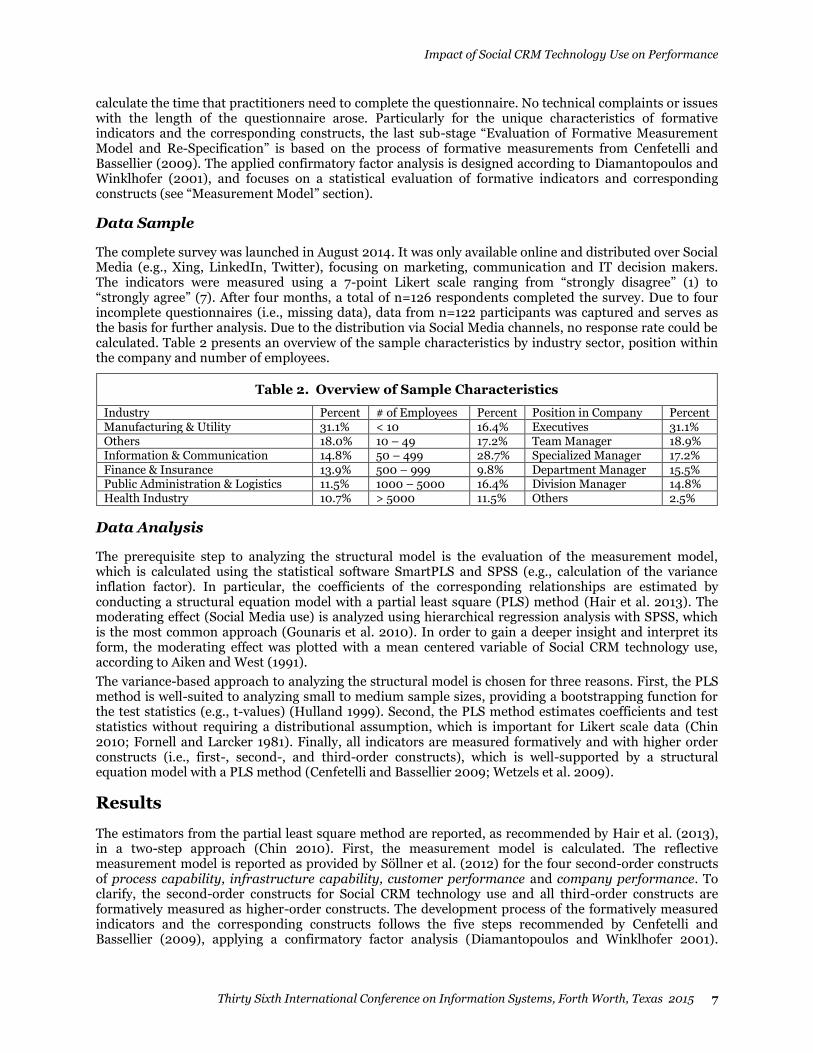
The complete survey was launched in August 2014. It was only available online and distributed over Social Media (e.g., Xing, LinkedIn, Twitter), focusing on marketing, communication and IT decision makers. The indicators were measured using a 7-point Likert scale ranging from “strongly disagree” (1) to “strongly agree” (7). After four months, a total of n=126 respondents completed the survey. Due to four incomplete questionnaires (i.e., missing data), data from n=122 participants was captured and serves as the basis for further analysis. Due to the distribution via Social Media channels, no response rate could be calculated. Table 2 presents an overview of the sample characteristics by industry sector, position within the company and number of employees.
Table 2. Overview of Sample Characteristics
Industry Percent # of Employees Percent Position in Company Percent Manufacturing & Utility 31.1% < 10 16.4% Executives 31.1% Others 18.0% 10 – 49 17.2% Team Manager 18.9% Information & Communication 14.8% 50 – 499 28.7% Specialized Manager 17.2% Finance & Insurance 13.9% 500 – 999 9.8% Department Manager 15.5% Public Administration & Logistics 11.5% 1000 – 5000 16.4% Division Manager 14.8% Health Industry 10.7% > 5000 11.5% Others 2.5%
Data Analysis
The prerequisite step to analyzing the structural model is the evaluation of the measurement model, which is calculated using the statistical software SmartPLS and SPSS (e.g., calculation of the variance inflation factor). In particular, the coefficients of the corresponding relationships are estimated by conducting a structural equation model with a partial least square (PLS) method (Hair et al. 2013). The moderating effect (Social Media use) is analyzed using hierarchical regression analysis with SPSS, which is the most common approach (Gounaris et al. 2010). In order to gain a deeper insight and interpret its form, the moderating effect was plotted with a mean centered variable of Social CRM technology use, according to Aiken and West (1991).
The variance-based approach to analyzing the structural model is chosen for three reasons. First, the PLS method is well-suited to analyzing small to medium sample sizes, providing a bootstrapping function for the test statistics (e.g., t-values) (Hulland 1999). Second, the PLS method estimates coefficients and test statistics without requiring a distributional assumption, which is important for Likert scale data (Chin 2010; Fornell and Larcker 1981). Finally, all indicators are measured formatively and with higher order constructs (i.e., first-, second-, and third-order constructs), which is well-supported by a structural equation model with a PLS method (Cenfetelli and Bassellier 2009; Wetzels et al. 2009).
Results
The estimators from the partial least square method are reported, as recommended by Hair et al. (2013), in a two-step approach (Chin 2010). First, the measurement model is calculated. The reflective measurement model is reported as provided by Söllner et al. (2012) for the four second-order constructs of process capability, infrastructure capability, customer performance and company performance. To clarify, the second-order constructs for Social CRM technology use and all third-order constructs are formatively measured as higher-order constructs. The development process of the formatively measured indicators and the corresponding constructs follows the five steps recommended by Cenfetelli and Bassellier (2009), applying a confirmatory factor analysis (Diamantopoulos and Winklhofer 2001).

Social Media and Digital Collaborations
8 Thirty Sixth International Conference on Information Systems, Forth Worth, Texas 2015
Second, the coefficients of the structural model are calculated (Hair et al. 2013) and two quality criteria are presented (i.e., f2, R2) (Gefen et al. 2011; Hair et al. 2011; Wetzels et al. 2009). The estimations are calculated with a parameter setting using 120 cases and 3000 samples.
Measurement Model
The reflective measurement model is assessed by estimating (1) convergent validity (i.e., AVE and factor loadings), (2) internal consistency (i.e., composite reliability) and (3) discriminant validity (Hair et al. 2013). Appendix A provides an overview of the test statistics. The indicators show (1) a satisfactory convergent validity as all reflective loadings are clearly above the threshold of 0.5 (Hulland 1999). Additionally, the average variance extracted (AVE) for all reflective constructs is clearly above 0.5 (Fornell and Larcker 1981). (2) Composite reliability also presents adequate results for all constructs being above the threshold of 0.7 (Nunnally and Bernstein 1994). The (3) discriminant validity shows a robust result (Hair et al. 2011), due to the fact that all square roots of each AVE are higher than the corresponding latent variable correlation (Table 3). To conclude, the reflective measurement model is an appropriate benchmark for evaluating the corresponding formative first-order constructs.5
Table 3. Discriminant Validity
Second-order constructs (I) (II) (III) (IV) Process Capability (I) 0.944 Infrastructure Capability (II) 0.421 0.960 Customer Performance (III) 0.482 0.673 0.959 Company Performance (IV) 0.524 0.752 0.777 0.956
After the fulfillment of the quality criteria for the reflective measurement model, the focus is on evaluating the formative measurement model and involves a five-step process: 1. multicollinearity testing; 2. the effect of the number of indicators and non-significant weights; 3. co-occurrence of negative and positive indicators weights; 4. absolute versus relative indicator contributions; and 5. nomological network effects (Cenfetelli and Bassellier 2009). Appendix B provides an overview of the test statistics (for the 41 formative indicators). For the first step (multicollinearity testing), the variance inflation factors (VIFs) are calculated using SPSS. All VIFs are below the maximum threshold of 5.0, as recommended by Hair et al. (2011) and Walther et al. (2013). The results reveal that multicollinearity is not an issue in this article. Steps two to five are based on the calculated values and test statistics using SmartPLS. The second step (the effect of the number of indicators and non-significant weights) deals with the problem whereby a large number of indicators cause non-significant weights. The results show that the indicators PR4, PR7, OR5 and CA1 are not significant (i.e., illustrated by a p-value > 0.1), which has to be considered in the following steps. Cenfetelli and Bassellier (2009) also state that this should not be misinterpreted as concerning any irrelevance of the indicators. The only required interpretation of this issue is that some indicators have a lower influence than others. In order to gain a deeper understanding, this article continues with step three (co-occurrence of negative and positive indicator weights). No indicator has negative weights; therefore, this is not an issue in the article. Step four (absolute versus relative indicator contributions) needs to be conducted by reporting the respective loadings. The loadings indicate that an “indicator could have only a small formative impact on the construct (shown by a low weight), but it still could be an important part of the construct (shown by a high loading)” (Söllner et al. 2012, p. 10). Concerning the issues with PR4, PR7, OR5, and CA1, which show non-significant but very high loadings (i.e., higher than 0.7), no further improvements (i.e. by dropping indicators or re-specify constructs) have to be performed (Cenfetelli and Bassellier 2009; Hair et al. 2011, 2013). The final step (nomological network effects) can proceed by conducting a redundancy analysis. This compares the formative construct with the reflective constructs, which explains the variance in the reflective measured benchmark (reflective construct) and assess the validity of the formative construct. Due to the reflective measurement model (see Table 3), the four second-order constructs for the capability and performance dimension are investigated. Based on the formatively measured second-order constructs for the resource dimension, the six corresponding first-order constructs (monitoring and capturing, analysis, exploitation, IS
5 Due to the designed measurement model for Social CRM technology used in previous research, a benchmark measurement (i.e., with reflective indicators) for the corresponding second-order constructs is not available for this data set.

Impact of Social CRM Technology Use on Performance
Thirty Sixth International Conference on Information Systems, Forth Worth, Texas 2015 9
integration, communication and management-controlling) are analyzed. Thus, ten redundancy analyses have to be considered, resulting in values of 0.893 for monitoring and capturing, 0.896 for analysis, 0.892 for exploitation, 0.904 for IS integration, 0.882 for communication, 0.859 for management-controlling, 0.808 for infrastructure capability, 0.879 for process capability, 0.840 for customer performance, and 0.868 for company performance. All results are above the recommended threshold of 0.8 (Chin 1998) and are highly significant with a p-value lower than 0.01. The overall last step is the calculation of the interrelationships between the first-order and second-order constructs, as well as the second-order and third-order constructs, in order to complete the measurement model. Table 4 presents the corresponding results. Thirteen out of fourteen (first-order to second-order constructs) as well as five out of six (second-order to third-order constructs) interrelationships reveal significant path coefficients (i.e., p-value <= 0.05). Due to the low significance of two interrelationships, previous investigations highlight the construct and therefore no further improvements have to be performed (blinded for review). To conclude, the measurement model is well-suited and validated within the Social CRM context.6
Table 4. Interrelationships of the Measurement Model
First-order construct-> P.C.
(p-value) Second-order constructs ->
P.C. (p-value)
Third-order construct
Monitoring and Capturing** 0.334 (0.022) Processing*
0.296 (0.067)
Social CRM Technology Use
Analysis* 0.234 (0.067) Exploitation** 0.479 (< 0.01) IS Integration** 0.482 (< 0.01)
Management** 0.717
(< 0.01) Communication** 0.194 (0.041) Management-Controlling** 0.436 (< 0.01)
IT** 0.289 (< 0.01) Infrastructure Capability**
0.289 (< 0.01) Social CRM
Capability Culture** 0.627 (< 0.01) Company-wide Processes** 0.527 (< 0.01)
Process Capability** 0.627
(< 0.01) Department-specific Processes** 0.387 (< 0.01)
Indirect Customer Performance** 0.617 (< 0.01) Customer Performance**
0.290 (< 0.01) Social CRM
Performance Direct Customer Performance** 0.246 (0.050) Monetization Performance** 0.413 (< 0.01)
Company Performance** 0.396
(< 0.01) Non-monetization Performance** 0.492 (< 0.01) P.C. = Path Coefficient; ** p-value <= 0.05; * p-value <= 0.10
Structural Model
Having established the appropriateness of the measures, the structural model is tested with the outlined parameter setting (mentioned above). The two path coefficients (H1, H3) show significant structural relationships (p-value lower than 0.05). In contrast, the derived hypotheses (H2) of the moderating effect reveal a non-significant structural impact (Figure 3). The plotted results in SPSS highlight the non-significant differentiation of the estimated betas (of Social Media use) for the relationship between Social CRM technology use and Social CRM capability. In other words, the relationship between Social CRM technology use and Social CRM capability is statistically independent from the use of Social Media. The covariate, company size, reveals a highly significant effect on Social CRM performance and a non-significant effect on Social CRM capability.
The f2 criteria highlight the possible omission of structural relationships (Gefen et al. 2011). All calculated values are below the threshold of 0.02 (Wetzels et al. 2009). Therefore, it can be stated that no important structural relationships are omitted. Due to the formatively measured third-order constructs, the calculation of the Goodness of Fit (GoF) criteria is impossible (Wetzels et al. 2009). The calculated R2 is above the threshold of 0.5 (Hair et al. 2011), which indicates a moderate structural model. Thus the structural model can explain more than 0.60 of the variation in their corresponding dependent constructs.
6 Social Media use (moderating effect) is measured with four questions concerning whether the company use the corresponding Social Media account (Yes/No), which determine the categories named, social networks (e.g., Facebook), Blogs (e.g., Twitter), content communities (e.g., YouTube) and collaborative communities (e.g., customer communities), as proposed by Kaplan and Haenlein (2010).

Social Media and Digital Collaborations
10 Thirty Sixth International Conference on Information Systems, Forth Worth, Texas 2015
Figure 3. Results of Path Analysis
Discussion
The present article makes several important contributions to the field by presenting a validated model, which is evaluated by the impact of Social CRM technology use on Social CRM performance mediated by Social CRM capabilities. It can be stated that the evaluated formative constructs are well-suited to the Social CRM context (i.e., no indicator or construct is dropped).
Within the Social CRM technology use construct and the second-order construct processing, the first-order construct exploitation reveals the highest significant interrelationship (path coefficient: 0.479) and analysis the lowest significant interrelationship (path coefficient: 0.234). Despite the relevant dimensions of monitoring and capturing as well as analysis, companies focus on the added value of a technology and the exploitation of data. The articles of Chang et al. (2010), Jayachandran et al., (2005) and Zablah et al. (2012) confirm the results, focusing for example on “sales support”, “sales activity planning” (EX3) and the indicator “forecasting” (EX1). An additional reason is given by current technology development. Tools like Hearsay Social and Engagor can monitor Social Media data in real time (monitoring and capturing construct), concerning the issues of a suitable sentiment analysis. Therefore, companies use these tools, but control the results manually, which is one possible reason for the lower and weakly significant interrelationships to the second-order construct processing. For the second-order construct management, the management-controlling and IS Integration constructs reveal equally distributed and significant interrelationships. The communication highlights a small, but still significant interrelationship. The results for the significant first-order constructs are supported by previous articles, for example the literature supports the data integration via an IS interface (IN2) as proposed by Chang et al. (2010). Current literature within the CRM and Social Media contexts offers stronger support for the communication construct. According to Zablah et al. (2012), communication and “employee coordination across organizational functions” have a strong interrelationship with the formative construct named “Use of CRM Interaction Support Tool”. Within the Social Media context, Trainor et al. (2014) stated that the communication attribute of employees with other departments has the highest impact on the corresponding construct (reflective). Thus, the article reveals a lower, but still significant interrelationship with the communication construct. The second-order constructs processing and management show significant interrelationships with the third-order construct Social CRM technology use. Concerning the fact that this is the first investigation of the topic under study (i.e., measured by formative indicators), no contributions by previous articles can be discussed. For the third-order construct Social CRM capability, each interrelationship between the determined constructs (i.e., first- and second-order constructs) is highly significant. The significant interrelationship of the first-order construct IT to infrastructure capability confirms, for example Trainor et al. (2014), regarding reflective indictors. The cultural aspect reveals a high weight for the infrastructure capability construct, which is also supported by Trainor et al. (2014). The findings (i.e., the weights of the first-order constructs) for process capability are diametrically opposed according to previous partial investigations (blinded for review). This could be due to two possible reasons. First, the second-order construct is measured with new reflective indicators. Second, this article is based on a theoretical background of the resource-based view and the capability perspective, which could influence the different findings of a partial investigation (i.e., an individual investigation of
Impact of Social CRM Technology Use on Performance
Thirty Sixth International Conference on Information Systems, Forth Worth, Texas 2015 11
the process aspect). Despite this fact it can be stated that process capability and infrastructure capability have a significant interrelationship with Social CRM capability, which is supported by, for example, the studies of Keramati et al. (2010) and Rapp et al. (2010). Within the third-order construct Social CRM performance and the second-order construct customer performance the indirect customer performance (Chuang and Lin 2013) has a higher coefficient than direct customer performance. For direct customer performance, a company, for example, has to involve the business innovation department (for personalized products and services) as well as to implement a number of customer touch points (for customer convenience). As a consequence of the derived company phases of implementing Social CRM, indirect customer performance requires less money and resources (e.g., full time equivalents, which analyze and then offer personalized products and services). For the second-order construct company performance, the monetization and non-monetization aspects have almost the same impact values. This result confirms previous discussion in the academic literature, which argues that non-monetization aspects are as important as monetization aspects (Kaplan and Norton 1996; Kim and Kim 2009; Kim et al. 2003). Both second-order constructs have a significant relationship to Social CRM performance.
As outlined in the hypothesis development section, the first hypothesis (H1) can be supported, stating that the processing and management aspects of Social CRM technology use enable a company to implement effective and efficient Social CRM capabilities (Chang et al. 2010; Chuang and Lin 2013; Keramati et al. 2010; Rapp et al. 2010; Wang and Feng 2012). Hypothesis three (H3) can also be supported (Chang et al. 2010; Chuang and Lin 2013; Coltman et al. 2011; Ernst et al. 2011; Harrigan et al. 2010; Jayachandran et al. 2005; Keramati et al. 2010; Rapp et al. 2010; Reinartz et al. 2004; Trainor et al. 2014; Wang and Feng 2012). On the one hand, implemented Social CRM capabilities (e.g., the knowledge of new customer insights) increase the overall customer performance (e.g., with a better customer interaction). On the other hand, Social CRM capabilities (e.g., the involvement of customers as co-creators) have a highly significant impact on organizational performance (e.g., increases the success of newly introduced or developed products and services). The moderating effect (H2) is non-significant. Therefore, a company can improve their capabilities by gaining a higher degree of Social CRM technology use independent of their Social Media use. The data also reveals that the use of a single Social Media account (e.g., Facebook) has the same effect as the use of a portfolio of Social Media accounts (e.g., Facebook, Twitter and customer communities). A further analysis of the data shows two possible reasons for this result. First, 95% of the companies use at least one social network account, reducing the total amount of companies without a social network account, which can influence the result of the moderating effect. Second, an analysis of grouped Social Media use (i.e., companies with only one Social Media account, companies with two Social Media accounts etc.) reveals that within a group over 90% use social networks. This unequal distribution could have the same effect on the moderator variable. In contrast to previous articles involving RBV, capability perspective and relationship marketing theory (Abdul-Muhmin 2012; Chuang and Lin 2013; Harrigan et al. 2010; Trainor et al. 2014), this is the first article to present a positive significant company size effect on performance. It can be stated that within the new Social CRM context, large companies can profit more than smaller companies in terms of transforming their capabilities into benefits. A non-significant relationship of company size with Social CRM capabilities is found, which is also supported by the findings of Harrigan et al. (2010) and Trainor et al. (2014). To conclude, the three investigated dimensions of the theoretical background (i.e., resource, capability and performance) are well-suited for the Social CRM context.
Theoretical Contributions and Practical Implications
The study findings provide a number of theoretical contributions. First, an ample body of literature discusses the inability to demonstrate the contribution of a Social CRM technology feature to the business success of a company. To evaluate the contribution of Social CRM technology features, an investigation of tool features is indispensable, as recommended by Zablah et al. (2012). The study applied the rigorous approach of Zablah et al. (2012) within a Social CRM context, which reveals an extension of the topic-related area of technology use. As its second major theoretical contribution, this study adopts the measurement framework from Kim and Kim (2009) within a Social CRM context. Compared to previous works, which investigate individual dimensions of capability or performance, for example, infrastructure capability (Harrigan et al. 2010), process capability (Chang et al. 2010), customer relationship performance (Choudhury and Harrigan 2014; Trainor et al. 2014), and organizational performance (Ernst et al. 2011; Keramati et al. 2010), the study investigates multiple dimensions (i.e., first- and second-order

Social Media and Digital Collaborations
12 Thirty Sixth International Conference on Information Systems, Forth Worth, Texas 2015
constructs). Finally, this study extends the investigations of Trainor et al. (2014), based on the resource-based view and the capability perspective (Day 1994; Eisenhardt and Martin 2000; Teece et al. 1997), in three different ways: (1) the resource dimension is evaluated from an organizational perspective (e.g., Social CRM technology use); (2) all dimensions are measured with formative indicators (even with higher level constructs); (3) an additional performance dimension (company performance) is evaluated, in contrast to the previous investigation of a customer performance dimension.
Four practical implications can be stated. First, the investigation and evaluation of the impact enables a prioritization of Social CRM technologies features. The prioritization supports companies to evaluate new Social CRM technologies (e.g., investing in a new tool with a valuable feature). Furthermore, the prioritization enables a better allocation of resources (e.g., the IT budget can be distributed efficiently, costs can be saved due to not required staff trainings). Second, the overall structural model facilitates a control system for Social CRM activities, for example an appraisal of social campaigns, considering various aspects of effective or ineffective campaigns. Third, it enables the justification of current and future Social CRM engagements in a company, for example spending money on new investments within Social CRM processes. Increasing the total number of customer touch-points will have a strong influence on the Social CRM performance. Finally, even smaller companies can start their Social CRM activities using a single Social Media account, which should be a social network, and so use Social CRM technologies to establish and/or improve their Social CRM capabilities, instead of implementing a portfolio of different Social Media accounts. To conclude, the investigation of the resources and capabilities within Social CRM helps companies to increase the efficiency and effectiveness of their marketing, communication, as well as their technology efforts, generating deeper insights into relevant relationships in order to improve their performance.
Conclusion, Limitations and Avenues for Further Research
The study evaluates the impact of Social CRM technology use on Social CRM performance mediated by Social CRM capability. The research approach is quantitative in nature, investigating and analyzing a sample of n=122 responses to a survey from marketing, communication and IT decision makers. Two major contributions can be stated. First, the evaluated formative indicators are robust (i.e., no indicator is dropped) and fit the corresponding constructs. Second, the results show that Social CRM technology use has a significant impact on capabilities, which in turn have a direct impact on Social CRM performance.
Three potential limitations constrain the results of this research. First, despite the highly significant values of the final measurement model (i.e., the statistical test values), there may be missing formative indicators, which should be included in the model. Second, due to the fact that the study is the first evaluated formative measurement model for Social CRM, conducting a transferability test is not possible (Cenfetelli and Bassellier, 2009). Finally, the data reveals less variation in the Social Media use variable, which could influence the results of the moderating effect.
One promising avenue for further research is the investigation of other covariates like the industry sector, as proposed by Ernst et al. (2010) and Reinartz et al. (2004). Second, a longitudinal analysis (i.e., data over time) can be tested with statistical methods (e.g., compared test statistics for two dates - ANOVAs), in order to generate deeper insights into the investigated model based on the theoretical background. Third, the determined second-order construct customer performance can be measured by surveying customers. The newly evaluated data can be integrated into the structural model and analyzed with a two-level nested regression model (Zablah et al. 2012). To conclude, the rigorously and systematically derived results presented in the article form a sound basis for further research projects.
References
Abdul-Muhmin, A. G. 2012. “CRM technology use and implementation benefits in an emerging market,” Journal of Database Marketing & Customer Strategy Management (19:2), pp. 82–97.
Aiken, L. S., and West, S. G. 1991. Multiple regression: Testing and interpreting interactions, Newbury Park, CA: Sage Publications.
Akroush, M. N., Dahiyat, S. E., Gharaibeh, H. S., and Abu-Lail, B. N. 2011. “Customer relationship management implementation: An investigation of a scale’s generalizability and its relationship with

Impact of Social CRM Technology Use on Performance
Thirty Sixth International Conference on Information Systems, Forth Worth, Texas 2015 13
business performance in a developing country context,” International Journal of Commerce and Management (21:2), pp. 158–191.
Alt, R., and Reinhold, O. 2012. “Social Customer Relationship-Management (Social CRM),” Business & Information Systems Engineering (54:5), pp. 287–291.
Alvarez, G. 2013. “Hype Cycle for E-Commerce 2013,” Gartner, Inc. Askool, S., and Nakata, K. 2011. “A conceptual model for acceptance of social CRM systems based on a
scoping study,” AI & SOCIETY (26:3), pp. 205–220. Baird, C. H., and Parasnis, G. 2013. “From social media to Social CRM - What customers want,” IBM
Global Business Services. Barney, J. 1991. “Firm Resources and Sustained Competitive Advantage,” Journal of Management (17:1),
pp. 99–120. Bhattacherjee, A., Perols, J., and Sanford, C. 2008. “Information Technology Continuance: A Theoretic
Extension and Empirical Test,” Journal of Computer Information Systems (49:1), pp. 17–26. Burton-Jones, A., and Straub, D. W. 2006. “Reconceptualizing System Usage: An Approach and Empirical
Test,” Information Systems Research (17:3), pp. 228–246. Cenfetelli, R. T., and Bassellier, G. 2009. “Interpretation of Formative Measurement in Information
Systems Research,” MIS Quarterly (33:4), pp. 689–707. Chang, W., Park, J. E., and Chaiy, S. 2010. “How does CRM technology transform into organizational
performance? A mediating role of marketing capability,” Journal of Business Research (63:8), pp. 849–855.
Chin, W. W. 1998. “The Partial Least Squares Approach to Structural Equation Modeling,” in Modern Methods for Business Research, G. A. Macoulides (ed.), Mahwah, New Jersey: Lawrence Erlbaum Associates, pp. 295–336.
Chin, W. W. 2010. “How to Write Up and Report PLS Analyses,” in Handbook of Partial Least Squares, V. Esposito Vinzi, W. W. Chin, J. Henseler, and H. Wang (eds.), Berlin, Heidelberg: Springer-Verlag, pp. 655–690.
Choudhury, M. M., and Harrigan, P. 2014. “CRM to social CRM: the integration of new technologies into customer relationship management,” Journal of Strategic Marketing (22:2), pp. 149–176.
Chuang, S.-H., and Lin, H.-N. 2013. “The roles of infrastructure capability and customer orientation in enhancing customer-information quality in CRM systems: Empirical evidence from Taiwan,” International Journal of Information Management (33:2), pp. 271–281.
Coltman, T., Devinney, T. M., and Midgley, D. F. 2011. “Customer relationship management and firm performance,” Journal of Information Technology (26:3), pp. 205–219.
Davis, F. D., Bagozzi, R. P., and Warshaw, P. R. 1989. “User Acceptance of Computer Technology: A Comparison of Two Theoretical Models,” Management Science (35:8), pp. 982–1003.
Day, G. S. 1994. “The Capabilities of Market-Driven Organizations,” Journal of Marketing (58:4), pp. 37–52.
Diamantopoulos, A., and Winklhofer, H. M. 2001. “Index Construction with Formative Indicators: An Alternative to Scale Development,” Journal of Marketing Research (38:2), pp. 269–277.
Eisenhardt, K. M., and Martin, J. A. 2000. “Dynamic capabilities: what are they?,” Strategic Management Journal (21:10-11), pp. 1105–1121.
Ernst, H., Hoyer, W. D., Krafft, M., and Krieger, K. 2011. “Customer relationship management and company performance—the mediating role of new product performance,” Journal of the Academy of Marketing Science (39:2), pp. 290–306.
Fornell, C., and Larcker, D. F. 1981. “Evaluating Structural Equation Models with Unobservable Variables and Measurement Error,” Journal of Marketing Research (18:1), pp. 39–50.
Gefen, D., Rigdon, E. E., and Straub, D. 2011. “An Update and Extension to SEM Guidelines for Administrative and Social Science Research,” MIS Quarterly (35:2), pp. 3–14.
Gounaris, S., Koritos, C., and Vassilikopoulou, K. 2010. “Person-place congruency in the Internet Banking context,” Journal of Business Research (63:9-10)Elsevier Inc., pp. 943–949.
Greenberg, P. 2010. “The impact of CRM 2.0 on customer insight,” Journal of Business & Industrial Marketing (25:6), pp. 410–419.
Hair, J. F., Hult, G. T. M., Ringle, C. M., and Sarstedt, M. 2013. A Primer on Partial Least Squares Strucutral Equation Modeling (PLS-SEM), Thousand Oaks: Sage Publications.
Hair, J. F., Ringle, C. M., and Sarstedt, M. 2011. “PLS-SEM: Indeed a Silver Bullet,” Journal of Marketing Theory and Practice (19:2), pp. 139–152.

Social Media and Digital Collaborations
14 Thirty Sixth International Conference on Information Systems, Forth Worth, Texas 2015
Harrigan, P., Schroeder, A., Qureshi, I., Fang, Y., Ibbotson, P., Ramsey, E., and Meister, D. 2010. “Internet Technologies, ECRM Capabilities, and Performance Benefits for SMEs: An Exploratory Study,” International Journal of Electronic Commerce (15:2), pp. 7–45.
Hulland, J. 1999. “Use of partial least squares (PLS) in strategic management research: a review of four recent studies,” Strategic Management Journal (20:2), pp. 195–204.
Jayachandran, S., Sharma, S., Kaufman, P., and Raman, P. 2005. “The Role of Relational Information Processes and Technology Use in Customer Relationship Management,” Journal of Marketing (69:4), pp. 177–192.
Kaplan, A. M., and Haenlein, M. 2010. “Users of the world, unite! The challenges and opportunities of Social Media,” Business Horizons (53:1), pp. 59–68.
Kaplan, R. S., and Norton, D. P. 1996. “Using the Balanced Scorecard as a Strategic Management System,” Harvard Business Review (74:1), pp. 75–85.
Keramati, A., Mehrabi, H., and Mojir, N. 2010. “A process-oriented perspective on customer relationship management and organizational performance: An empirical investigation,” Industrial Marketing Management (39:7), pp. 1170–1185.
Kim, H.-S., and Kim, Y.-G. 2009. “A CRM performance measurement framework: Its development process and application,” Industrial Marketing Management (38:4), pp. 477–489.
Kim, J., Suh, E., and Hwang, H. 2003. “A Model for Evaluating the Effectiveness of CRM Using the Balanced Scorecard,” Journal of Interactive Marketing (17:2), pp. 5–19.
Kumar, V., and Reinartz, W. 2012. Customer Relationship Management, Berlin, Heidelberg: Springer-Verlag.
Küpper, T. 2014. “Measuring the Success of Social CRM - First Approach and Future Research,” in Proceedings of the 16th International Conference on Enterprise Information Systems, Lisbon, Portugal, pp. 573–582.
Lebas, M. J. 1995. “Performance measurement and performance management,” International Journal of Production Economics (41:1-3), pp. 23–35.
Lehmkuhl, T., and Jung, R. 2013. “Towards Social CRM - Scoping the Concept and Guiding Research,” in Proceedings of the 26th Bled eConference, Bled, Slovenia, pp. 190–205.
Limayem, M., Hirt, S. G., and Cheung, C. M. K. 2007. “How Habit Limits the Predicitve Power of Intention: The Case of Information Systems Continuance,” MIS Quarterly (31:4), pp. 705–737.
Mathieson, K., Peacock, E., and Chin, W. W. 2001. “Extending the Technology Acceptance Model: The Influence of Perceived User Resources,” Database for Advances in Information Systems (32:3), pp. 86–112.
Melville, B. N., and Kraemer, K. 2004. “Information Technology and Organizational Performance: An Intergrative Model of IT Business Value,” MIS Quarterly (28:2), pp. 283–322.
Moore, G. C., and Benbasat, I. 1991. “Development of an Instrument to Measure the Perceptions of Adopting an Information Technology Innovation,” Information Systems Research (2:3), pp. 192–222.
Neely, A., Gregory, M., and Platts, K. 1995. “Performance measurement system design - A literature review and research agenda,” International Journal of Operations & Production Management (15:4), pp. 80–116.
Nunnally, J. C., and Bernstein, I. H. 1994. Psychometric Theory, (3rd ed.) New York: McGraw-Hill. Perreault, W. D. J., and Leigh, L. E. 1989. “Reliability of nominal data based on qualitative judgments,”
Journal of Marketing Research (26:2), pp. 135–148. Petter, S., Straub, D., and Rai, A. 2007. “Specifying Formative Constructs in Information Systems
Research,” MIS Quarterly (31:4), pp. 623–656. Rapp, A., Trainor, K. J., and Agnihotri, R. 2010. “Performance implications of customer-linking
capabilities: Examining the complementary role of customer orientation and CRM technology,” Journal of Business Research (63:11)Elsevier Inc., pp. 1229–1236.
Reinartz, W., Krafft, M., and Hoyer, W. D. 2004. “The Customer Relationship Management Process: Its Measurement and Impact on Performance,” Journal of Marketing Research (41:3), pp. 293–305.
Reinhold, O., and Alt, R. 2013. “How Companies are Implementing Social Customer Relationship Management: Insights From Two Case Studies,” in Proceedings of the 26th Bled eConference, Bled, Slovenia, pp. 206–221.
Rodriguez, M., Peterson, R. M., and Krishnan, V. 2012. “Social Media’s Influence on Business-to-Business Sales Performance,” Journal of Personal Selling and Sales Management (32:3), pp. 365–378.
Sarner, A., and Sussin, J. 2012. “Predicts 2013: Social CRM,” Gartner, Inc.
Impact of Social CRM Technology Use on Performance
Thirty Sixth International Conference on Information Systems, Forth Worth, Texas 2015 15
Sarner, A., Thompson, E., Sussin, J., Drakos, N., Maoz, M., Davies, J., and Mann, J. 2012. “Magic Quadrant for Social CRM,” Gartner, Inc.
Söllner, M., Hoffmann, A., Hoffmann, H., Wacker, A., and Leimeister, J. M. 2012. “Understanding the Formation of Trust in IT Artefacts,” in Proceedings of the 33rd International Conference on Information Systems, Orlando, USA, pp. 1–18.
Teece, D. J., Pisano, G., and Shuen, A. 1997. “Dynamic Capabilities and Strategic Management,” Strategic Management Journal (18:7), pp. 509–533.
Trainor, K. J. 2012. “Relating Social Media Technologies to Performance: A Capabilities-Based Perspective,” Journal of Personal Selling & Sales Management (32:3), pp. 317–331.
Trainor, K. J., Andzulis, J., Rapp, A., and Agnihotri, R. 2014. “Social media technology usage and customer relationship performance: A capabilities-based examination of social CRM,” Journal of Business Research (67:6)Elsevier Inc., pp. 1201–1208.
Venkatesh, V., and Bala, H. 2008. “Technology Acceptance Model 3 and a Research Agenda on Interventions,” Decision Sciences (39:2), pp. 273–315.
Venkatesh, V., Brown, S. A., Maruping, L. M., and Bala, H. 2008. “Predicting Different Conceptualizations of System Use: The Competing Roles of Behavioral Intention, Facilitating Conditions, and Behavioral Expectation,” MIS Quarterly (32:3), pp. 483–502.
Venkatesh, V., and Davis, F. D. 2000. “A Theoretical Extension of the Technology Acceptance Model: Four Longitudinal Field Studies,” Management science (46:2), pp. 186–204.
Venkatesh, V., Morris, M. G., Davis, G. B., and Davis, F. D. 2003. “User Acceptance of Information Technology: Toward a Unified View,” MIS Quarterly (27:3), pp. 425–478.
Walther, S., Sedera, D., Sarker, S., and Eymann, T. 2013. “Evaluating Operational Cloud Enterprise Systems Success: An Organizational Perspective,” in Proceedings of the 21st European Conference on Information Systems, Utrecht, Netherlands, pp. 1–12.
Wang, Y., and Feng, H. 2012. “Customer relationship management capabilities - Measurement, antecedents and consequences,” Management Decision (50:1), pp. 115–129.
Wetzels, M., Odekerken-Schröder, G., and van Oppen, C. 2009. “Using PLS Path Modeling for Assessing Hierarichical Construct Models: Guidelines and Empirical Illustration,” MIS Quarterly (33:1), pp. 177–195.
Woodcock, N., Broomfield, N., Downer, G., and Starkey, M. 2011. “The evolving data architecture of social customer relationship management,” Journal of Direct, Data and Digital Marketing Practice (12:3), pp. 249–266.
Zablah, A. R., Bellenger, D. N., Straub, D. W., and Johnston, W. J. 2012. “Performance Implications of CRM Technology Use: A Multilevel Field Study of Business Customers and Their Providers in the Telecommunications Industry,” Information Systems Research (23:2), pp. 418–435.

Social Media and Digital Collaborations
16 Thirty Sixth International Conference on Information Systems, Forth Worth, Texas 2015
Appendix
Appendix A. Test Statistics for the Reflective Indicators
Reflective Indicators AVE Com. R. Load. p-value
Infrastructure Capability 0.891 0.943 IN1_R** In general, sufficient resources are available and cultural
aspects within the company are established. 0.949 < 0.01
IN2_R** All in all, resources are available and cultural aspects disseminated throughout the company.
0.940 < 0.01
Process Capability 0.914 0.955 PR1_R** In general, the processes and activities in the company are
improved through Social CRM. 0.957 < 0.01
PR2_R* All in all, the improvement of business processes and activities is substantial.
0.955 < 0.01
Customer Performance 0.921 0.959 CU1_R** Generally, Social CRM activities improve a positive customer
perception. 0.959 < 0.01
CU2_R** All in all, customer perceptions are enhanced substantially due to Social CRM activities.
0.961 < 0.01
Company Performance 0.920 0.959 OR1_R** Generally, Social CRM activities increase business results. 0.957 < 0.01 OR2_R** All in all, the profitability of the Social CRM activities
enhancing results is high. 0.962 < 0.01
AVE = Average Variance Extracted; Com. R. = Composite Reliability; Load. = Loadings; ** p-value <= 0.05; * p-value <= 0.10
Appendix B. Test Statistics for the Formative Indicators
Formative Indicators VIF Weights p-value Load. Social CRM technology use: Processing The company utilizes a tool to …
Monitoring and Capturing CA1 search different type of content (e.g., posts, tweets, etc.) on social
media platforms in real time. 1.846 0.079 0.134 0.7166
CA2** collect and store unstructured social media information about the company, product, etc. on their social media platform(s).
2.385 0.417 < 0.01 0.919
CA3** collect and store unstructured information about a single artifact (e.g., consumer, a single event, etc.) on their social media platform(s).
1.540 0.588 < 0.01 0.951
Analysis AN1** analyze and assess different types of content in real time. 2.577 0.229 0.013 0.891 AN2** analyze unstructured social media data across various criteria
(e.g., consumer segmentation, etc.) in order to identify general trends, profitable consumers, etc.
2.299 0.563 < 0.01 0.959
AN3** analyze unstructured data for a single consumer (e.g., a high potential influencer) across the one (or more) social media platforms in order to understand their social behavior, motivations, etc.
2.300 0.29 < 0.01 0.885
Exploitation EX1** forecast consumer behavior, and trends etc. and enhance the
predictive model. 3.519 0.37 < 0.01 0.910
EX2** create a network map of consumers and the relationships between them.
3.207 0.207 0.014 0.885
EX3** support product purchase, increase sales, cross- and upselling (e.g., social advertising campaigns).
2.477 0.19 0.031 0.872
EX4** prepare summary statements, evaluate user activity and their loyalty, and/or prepare management reports.
4.341 0.333 0.011 0.946
VIF = Variance Inflation Factor; Load. = Loadings; ** p-value <= 0.05; * p-value <= 0.10

Impact of Social CRM Technology Use on Performance
Thirty Sixth International Conference on Information Systems, Forth Worth, Texas 2015 17
Appendix B. Test Statistics for the Formative Indicators (continuing)
Formative Indicators VIF Weights p-value Load. Social CRM technology use: Management IS Integration IN1** integrate the social media data with an existing CRM system. 1.000 0.607 < 0.01 0.965 IN2** integrate other information systems, sales processes and existing
technologies, and other tools along the project lifecycle (exclude a CRM system).
1.000 0.442 < 0.01 0.938
Communication CO1** interact personally, one-to-one communication, with a single
consume. 1.937 0.307 0.014 0.812
CO2** communicate with an entire community and/or multiple consumers.
1.369 0.271 0.035 0.800
CO3** communicate with other employees throughout the organization. 1.402 0.595 < 0.01 0.898 Management-Controlling MC1** manage their social media accounts, communities and forums,
such as moderation, internal process management, etc. 2.377 0.364 < 0.01 0.910
MC2** allocate employee access rights. 2.104 0.202 0.030 0.853 MC3** apply different engagement features (e.g., gamification). 2.230 0.526 0.01 0.944
Social CRM Capability: Infrastructure Capability Within the context of Social CRM, the company … Culture IN1** integrates Social CRM into the company culture. 1.000 0.383 < 0.01 0.701 IN2** considers cultural aspects. 1.000 0.802 < 0.01 0.955 IT IN3** provides an online brand community to interact with customers
e.g., about service or product-related content. 1.000 0.422 < 0.01 0.794
IN4** has established a good infrastructure (e.g., IT resources). 1.000 0.713 < 0.01 0.933
Social CRM Capability: Process Capability Company-wide Processes PR1** improves organizational processes and activities so that they are
more customer-oriented. 2.059 0.338 < 0.01 0.874
PR2** supports sales activities by other users. 2.051 0.434 < 0.01 0.922 PR3** improves ubiquitous communication between the customers and
the company. 1.747 0.348 < 0.01 0.875
Department-specific Processes PR4 improves the level of knowledge about a customer through new
customer insights. 2.296 0.112 0.128 0.833
PR5** enables a more efficient and effective segmentation (e.g., market and customer segmentation).
2.277 0.342 0.036 0.908
PR6** improves the involvement of customers as co-creators (e.g., in the innovation process).
2.937 0.299 < 0.01 0.887
PR7 enhances the effectiveness of company-initiated interactions with customers.
4.609 0.138 0.137 0.984
PR8** improves the efficient and effective arrangement of target-oriented customer events.
3.122 0.246 0.031 0.846
Social CRM Performance: Customer Performance Within the context of Social CRM, the company … Indirect Customer Performance CU1** enhances and simplifies the exchange of information between
consumers. 1.641 0.285 < 0.01 0.798
CU2** enhances the perceived relationship quality of customers with the company.
2.37 0.396 < 0.01 0.906
CU3** increases customer interest in company products, services and/or company activities.
1.646 0.45 < 0.01 0.916
VIF = Variance Inflation Factor; Load. = Loadings; ** p-value <= 0.05; * p-value <= 0.10
Social Media and Digital Collaborations
18 Thirty Sixth International Conference on Information Systems, Forth Worth, Texas 2015
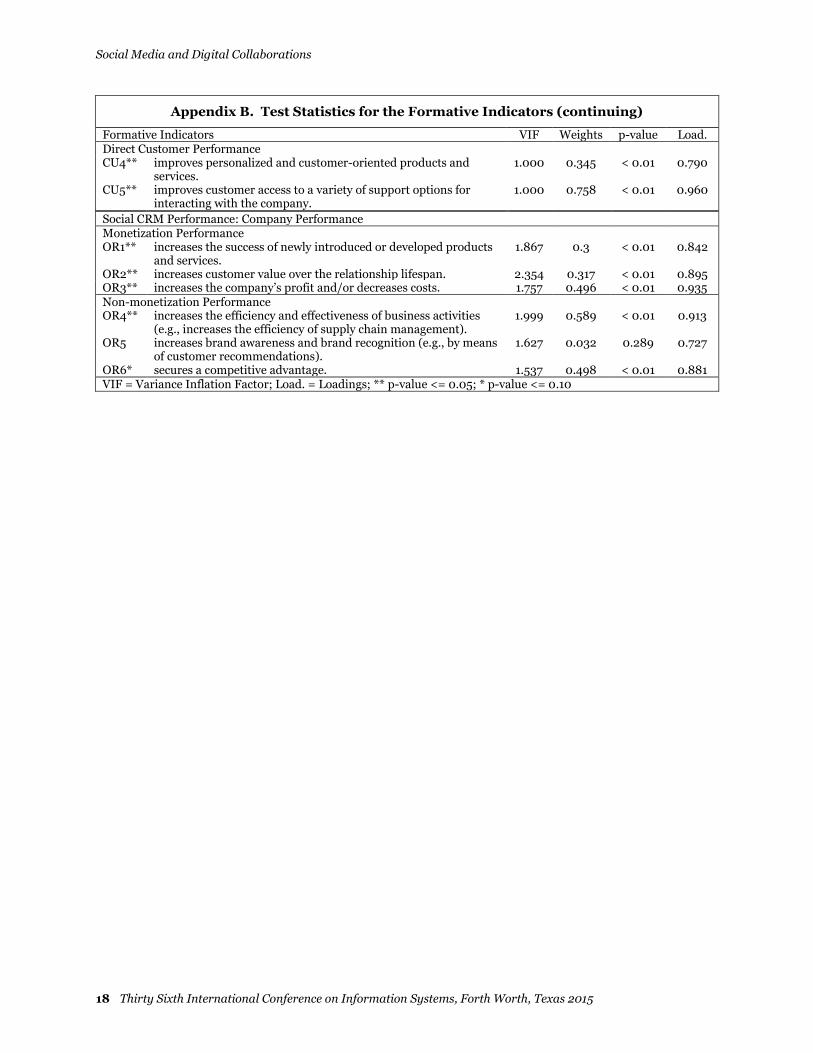
Appendix B. Test Statistics for the Formative Indicators (continuing)
Formative Indicators VIF Weights p-value Load. Direct Customer Performance CU4** improves personalized and customer-oriented products and
services. 1.000 0.345 < 0.01 0.790
CU5** improves customer access to a variety of support options for interacting with the company.
1.000 0.758 < 0.01 0.960
Social CRM Performance: Company Performance Monetization Performance OR1** increases the success of newly introduced or developed products
and services. 1.867 0.3 < 0.01 0.842
OR2** increases customer value over the relationship lifespan. 2.354 0.317 < 0.01 0.895 OR3** increases the company’s profit and/or decreases costs. 1.757 0.496 < 0.01 0.935 Non-monetization Performance OR4** increases the efficiency and effectiveness of business activities
(e.g., increases the efficiency of supply chain management). 1.999 0.589 < 0.01 0.913
OR5 increases brand awareness and brand recognition (e.g., by means of customer recommendations).
1.627 0.032 0.289 0.727
OR6* secures a competitive advantage. 1.537 0.498 < 0.01 0.881 VIF = Variance Inflation Factor; Load. = Loadings; ** p-value <= 0.05; * p-value <= 0.10