Impact of scaling and body movement on contaminant ...
24
Impact of scaling and body movement on contaminant transport in airliner cabins Sagnik Mazumdar 1 Stephane B. Poussou 1 Chao-Hsin Lin 2 Sastry S. Isukapalli 3 Michael W. Plesniak 1,4 Qingyan Chen 1 1 National Air Transportation Center of Excellence for Research in the Intermodal Transport Environment (RITE), School of Mechanical Engineering, Purdue University, West Lafayette, IN 47907 2 Boeing Commercial Airplanes Group, Seattle, WA 98124 3 Environmental and Occupational Health Sciences Institute UMDNJ-RW Johnson Medical School and Rutgers University, Piscataway, NJ 08854 4 Department of Mechanical and Aerospace Engineering The George Washington University, Academic Center, Washington DC 20052 Abstract: Studies of contaminant transport have been conducted using small-scale models. This investigation used validated Computational Fluid Dynamics (CFD) to examine if a small-scale water model could reveal the same contaminant transport characteristics as a full- scale airliner cabin. But due to similarity problems and the difficulty of scaling the geometry, a perfect scale up from a small water model to an actual air model was found to be impossible. The study also found that the seats and passengers tended to obstruct the lateral transport of the contaminants and confine their spread to the aisle of the cabin. The movement of a crew member or a passenger could carry a contaminant in its wake to as many rows as the crew member or passenger passed. This could be the reason why a SARS infected passenger could infect fellow passengers who were seated seven rows away. To accurately simulate the contaminant transport, the shape of the moving body should be a human-like model. Keywords: CFD, contaminant transport, aircraft cabin, moving body, dynamic grids, SARS INTRODUCTION Our investigation found that a moving body in an empty cabin mockup could have a significant impact on flow and contaminant transport (Poussou et al., 2010). However, this study used a small-scale water model without any seats or passengers. Although the study had obtained flow and contaminant data with detailed spatial and temporal resolutions, the results may not be directly scaled up for use in an actual cabin. The high quality experimental data was useful to validate the Computational Fluid Dynamics (CFD) model with a combined dynamic and static meshing scheme for the domain. The validation concluded that CFD could effectively capture the flow features and contaminant transport in the small-scale cabin. Mazumdar, S., Poussou, S., Lin, C.-H., Isukapalli, S.S., Plesniak, M.W., and Chen, Q. 2011. “The impact of scaling and body movement on contaminant transport in airliner cabins,” Atmospheric Environment, 45(33), 6019-6028.
Transcript of Impact of scaling and body movement on contaminant ...

Impact of scaling and body movement on contaminant transport
in airliner cabins
Sagnik Mazumdar1 Stephane B. Poussou1 Chao-Hsin Lin2 Sastry S. Isukapalli3 Michael W. Plesniak1,4 Qingyan Chen1
1National Air Transportation Center of Excellence for Research in the Intermodal Transport Environment (RITE), School of Mechanical Engineering, Purdue University, West Lafayette, IN 47907 2Boeing Commercial Airplanes Group, Seattle, WA 98124 3Environmental and Occupational Health Sciences Institute UMDNJ-RW Johnson Medical School and Rutgers University, Piscataway, NJ 08854 4Department of Mechanical and Aerospace Engineering The George Washington University, Academic Center, Washington DC 20052
Abstract: Studies of contaminant transport have been conducted using small-scale models. This investigation used validated Computational Fluid Dynamics (CFD) to examine if a small-scale water model could reveal the same contaminant transport characteristics as a full-scale airliner cabin. But due to similarity problems and the difficulty of scaling the geometry, a perfect scale up from a small water model to an actual air model was found to be impossible. The study also found that the seats and passengers tended to obstruct the lateral transport of the contaminants and confine their spread to the aisle of the cabin. The movement of a crew member or a passenger could carry a contaminant in its wake to as many rows as the crew member or passenger passed. This could be the reason why a SARS infected passenger could infect fellow passengers who were seated seven rows away. To accurately simulate the contaminant transport, the shape of the moving body should be a human-like model. Keywords: CFD, contaminant transport, aircraft cabin, moving body, dynamic grids, SARS INTRODUCTION Our investigation found that a moving body in an empty cabin mockup could have a significant impact on flow and contaminant transport (Poussou et al., 2010). However, this study used a small-scale water model without any seats or passengers. Although the study had obtained flow and contaminant data with detailed spatial and temporal resolutions, the results may not be directly scaled up for use in an actual cabin. The high quality experimental data was useful to validate the Computational Fluid Dynamics (CFD) model with a combined dynamic and static meshing scheme for the domain. The validation concluded that CFD could effectively capture the flow features and contaminant transport in the small-scale cabin.
Mazumdar, S., Poussou, S., Lin, C.-H., Isukapalli, S.S., Plesniak, M.W., and Chen, Q. 2011. “The impact of scaling and body movement on contaminant transport in airliner cabins,” Atmospheric Environment, 45(33), 6019-6028.
2
However, questions remain if the conclusions obtained from the small-scale water model can be extended to a full-scale air cabin. Thatcher et al. (2004) reported complications in interpreting and analyzing the results from a small-scale water model for a large room with air. Furthermore, our small-scale cabin was empty. The airflow pattern and contaminant transport in an actual cabin with seats and passengers can be significantly different from those of an unoccupied one (Singh et al., 2002). Hence, this study first examines: 1. The contaminant transport characteristics in a small-scale water cabin and an actual-scale air cabin; and 2. The differences in contaminant transport in an actual-scale empty cabin and a cabin fully occupied with passengers to addresses and analyze the complexity associated with interpreting the results from a scaled model and explain why the scaled cabin model may or may not be effective in predicting the flow and contaminant transport expected due to movement in an actual-scale mockup. An actual-scale cabin mockup is further used to understand the risk of airborne disease transmission associated with human movement. Past studies suggest that the risk of airborne disease transmission should remain within two rows of the contagious passenger (NRC 2002). No one has explained why passengers seated as far as seven rows ahead of the contagious passenger were infected by SARS in the Air China Flight 112 from Hong Kong to Beijing in 2003 (Olsen et al., 2003). Perhaps the movement of a walking crew member or passenger along the cabin aisle could have resulted in the spread of the infection since the body could have carried a contaminant within its wake. This investigation attempted to use CFD to analyze the impact of the moving person on the contaminant transport in the cabin in order to explain why those passengers seated far away from the index person could have been infected by SARS. THE CFD MODEL A commercial CFD program, FLUENT (2003), was used for this study. The CFD model used a second-order upwind scheme and the SIMPLE algorithm. The Re-Normalization Group (RNG) k-ε model was used to simulate the turbulent flow inside the cabin mockup, according to the recommendation of Zhang et al. (2007).
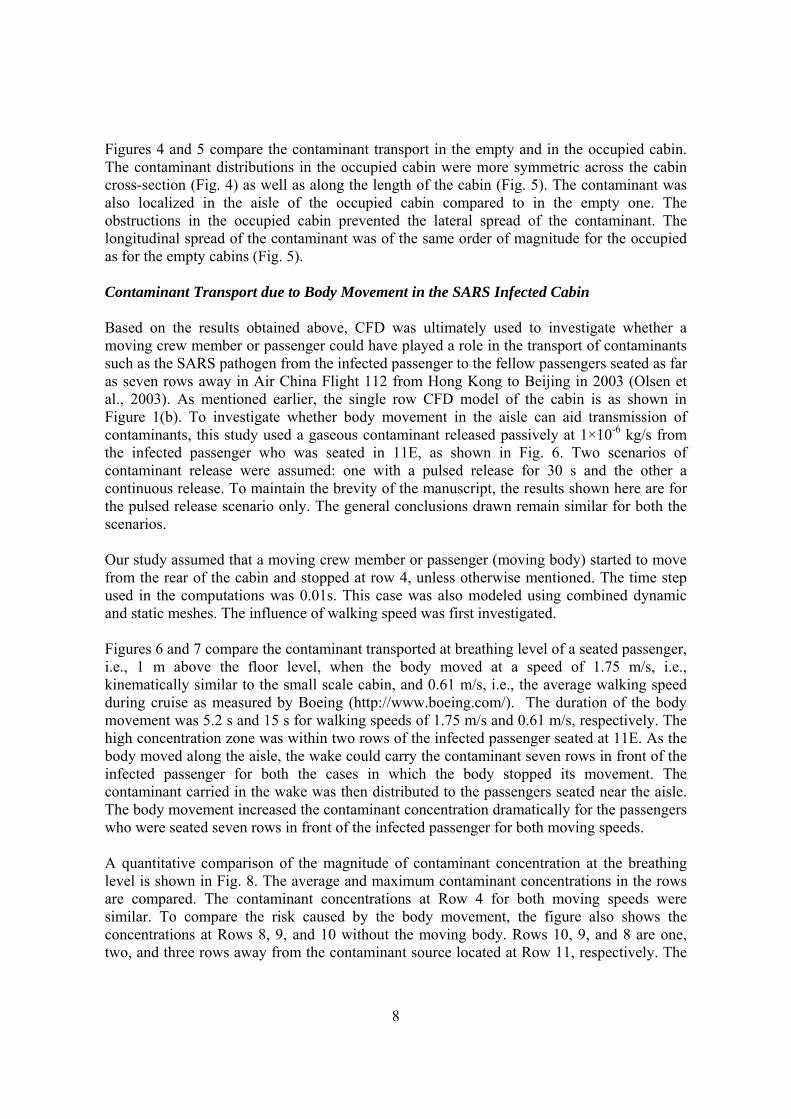
To compare and analyze the differences in flow and contaminant transport between the small-scale water model and a full-scale air cabin, the CFD model shown in Fig. 1 (a) was used. The model is similar to the one reported in Poussou et al. (2010). A comparison of the small-scale water model and the full-scale air cabin is presented in Table 1. The small-scale model used water as the working fluid, while the full-scale cabin used air. The small-scale water model was one-tenth the size of the full-scale air cabin. The length of the water mockup was equivalent to an air cabin with 28 rows of economy-class seats. The environmental control system injected fluid (water for the small-scale water model and air for the full-scale air model) into the cabin through an overhead duct of the inlet diffuser assembly (Fig. 1(a)). The fluid entered through 23 pipe fittings and was then supplied to the cabin through 48 elongated openings cut along the length. Finally, a T-shaped diffuser
3
diverted the fluid laterally to both sides of the cabin cross section. The fluid was extracted from the two outlets located near the side walls of the cabin at floor level. The fluid exchange rate was 30 per hour to match the time scales of the flow inside the cabins, as would be evident later. The moving body had a dimension of 0.2 m thick x 0.5 m wide x 1.7 m tall in a full-scale air model and one-tenth of it for the water model. The moving speed of the body was 0.175 m/s and 1.75 m/s in the small-scale cabin and in the full-scale cabin, respectively, for kinematic similarity. For both small-scale and full-scale CFD models, a combination of dynamic and static meshes was used to simulate the movement of the body. The dynamic meshes were used only for the zone where the person moved, while the rest of the computational geometry employed static meshes. This is because it is computationally time-consuming to use dynamic meshes due to the frequent remeshing (Fluent, 2003; Brohus et al., 2006). About 5% of the total 4.6 million meshes for the computational domain were dynamic ones. The maximum mesh size for the actual air cabin was 0.05 m. The simulation time step used with the dynamic meshing scheme was limited to 0.01 s by the size of the mesh and the body’s moving speed (Fluent, 2003). User defined functions were implemented in FLUENT (Fluent, 2003) to define and track the body movement. A similar combination of dynamic and static meshes was the used to understand the flow and contaminant transport in a full-scale model of the Air China Flight 112 from Hong Kong to Beijing (Olsen et al., 2003). Figure 1(b) shows a single row CFD model of the mockup. The air entered the cabin through four linear diffusers: two placed at the ceiling above the aisle injected air downwards while the other two at the side walls located below the storage bins injected air inwards to the aisle. The total supply airflow rate was 10 L/s per passenger and was distributed equally among the four inlets. The air was exhausted through outlets on the side walls close to the floor. This study used a fully occupied 15-row cabin section with a seat pitch of 0.86 m. The thermo-fluid conditions as shown in Table 2 along with the passenger and the seat model were similar to those used by Mazumdar and Chen (2008). This study examined:
The contaminant transport in the moving body wake The effect of moving body speed on the contaminant transport The influence of the moving body shape on the contaminant transport
by using the full-scale CFD model of the Air China Flight 112. All the simulations reported here were computed in a 4-node Linux cluster. Each node had five processors (1.8 GHz AMD 64) and 4GB of memory. The simulations were assumed to converge when the residual for mass (sum of the absolute residuals in each cell/the total mass inflow) and the residual for energy (sum of the absolute residuals in each cell/the total heat gains) were less than 0.1% and 1%, respectively. The contaminant concentration calculation was stopped when the cumulative normalized residual in the transport equation dropped below 1.0×10⁻⁵.
4
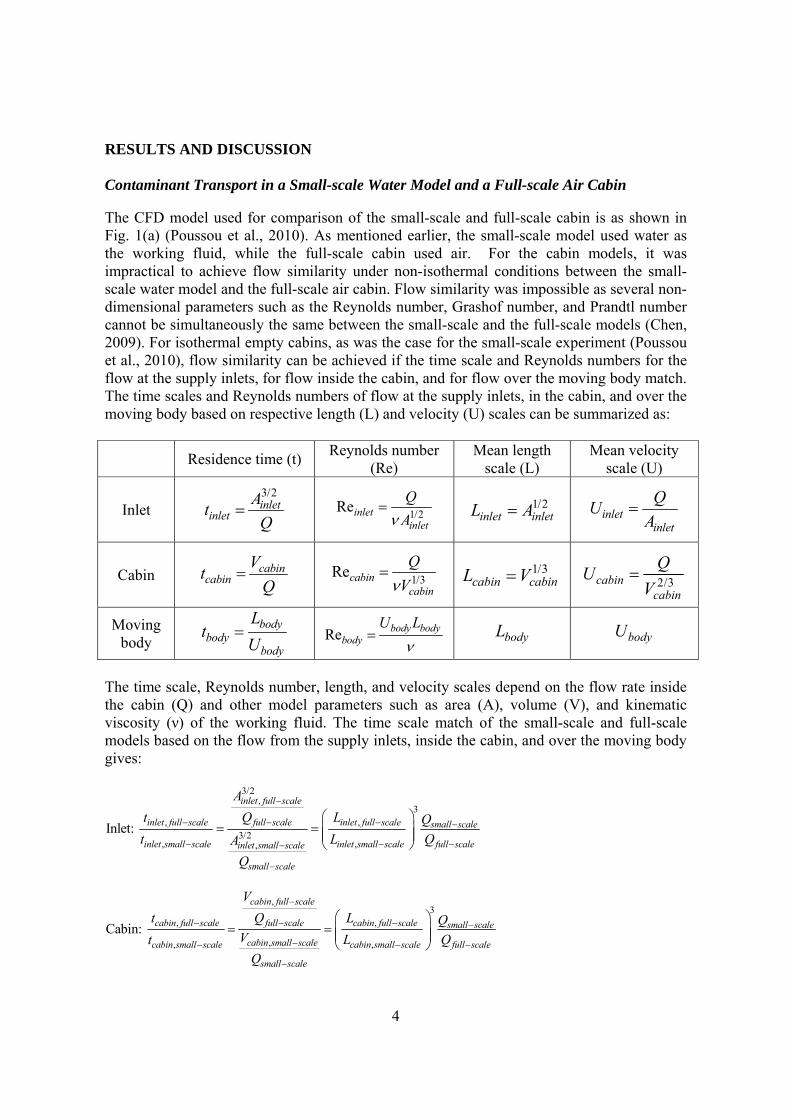
RESULTS AND DISCUSSION Contaminant Transport in a Small-scale Water Model and a Full-scale Air Cabin The CFD model used for comparison of the small-scale and full-scale cabin is as shown in Fig. 1(a) (Poussou et al., 2010). As mentioned earlier, the small-scale model used water as the working fluid, while the full-scale cabin used air. For the cabin models, it was impractical to achieve flow similarity under non-isothermal conditions between the small-scale water model and the full-scale air cabin. Flow similarity was impossible as several non-dimensional parameters such as the Reynolds number, Grashof number, and Prandtl number cannot be simultaneously the same between the small-scale and the full-scale models (Chen, 2009). For isothermal empty cabins, as was the case for the small-scale experiment (Poussou et al., 2010), flow similarity can be achieved if the time scale and Reynolds numbers for the flow at the supply inlets, for flow inside the cabin, and for flow over the moving body match. The time scales and Reynolds numbers of flow at the supply inlets, in the cabin, and over the moving body based on respective length (L) and velocity (U) scales can be summarized as:
Residence time (t) Reynolds number
(Re) Mean length
scale (L) Mean velocity
scale (U)
Inlet
3/2inlet
inletA
tQ
1/2
Reinletinlet
Q
A
1/2
inlet inletL A
inletinlet
QU
A
Cabin cabincabin
Vt
Q
1/3Recabin
cabin
Q
V
1/3
cabin cabinL V
2/3cabincabin
QU
V
Moving body
bodybody
body
Lt
U
Re body body
body
U L
bodyL
bodyU
The time scale, Reynolds number, length, and velocity scales depend on the flow rate inside the cabin (Q) and other model parameters such as area (A), volume (V), and kinematic viscosity (ν) of the working fluid. The time scale match of the small-scale and full-scale models based on the flow from the supply inlets, inside the cabin, and over the moving body gives:
3/2,
3, ,
3/2, ,,
Inlet:
inlet full scale
inlet full scale full scale inlet full scale small scale
inlet small scale inlet small scale full scaleinlet small scale
small scale
A
t Q L Q
t L QA
Q
,
3, ,
,, ,
Cabin:
cabin full scale
cabin full scale full scale cabin full scale small scale
cabin small scalecabin small scale cabin small scale full scale
small scale
V
t Q L QVt L Q
Q
5
,
, , , ,
,, , ,
,
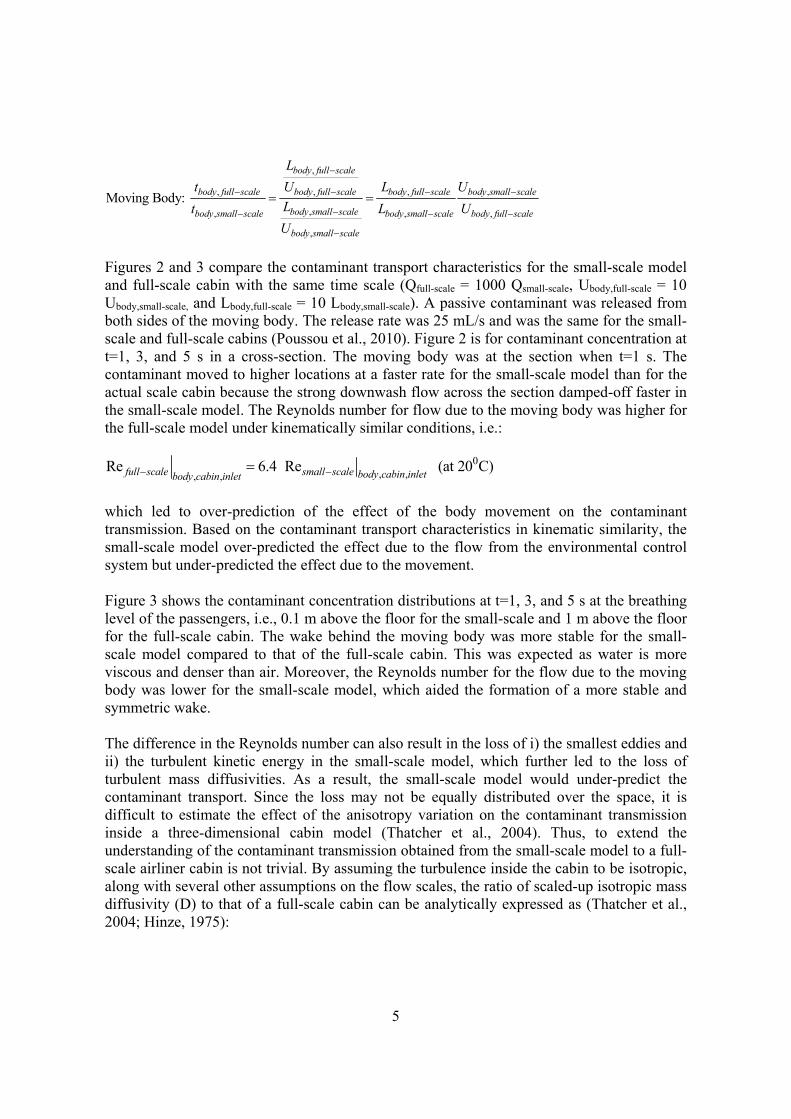
Moving Body:
body full scale
body full scale body full scale body full scale body small scale
body small scalebody small scale body small scale body full scale
body small scale
L
t U L U
Lt L U
U
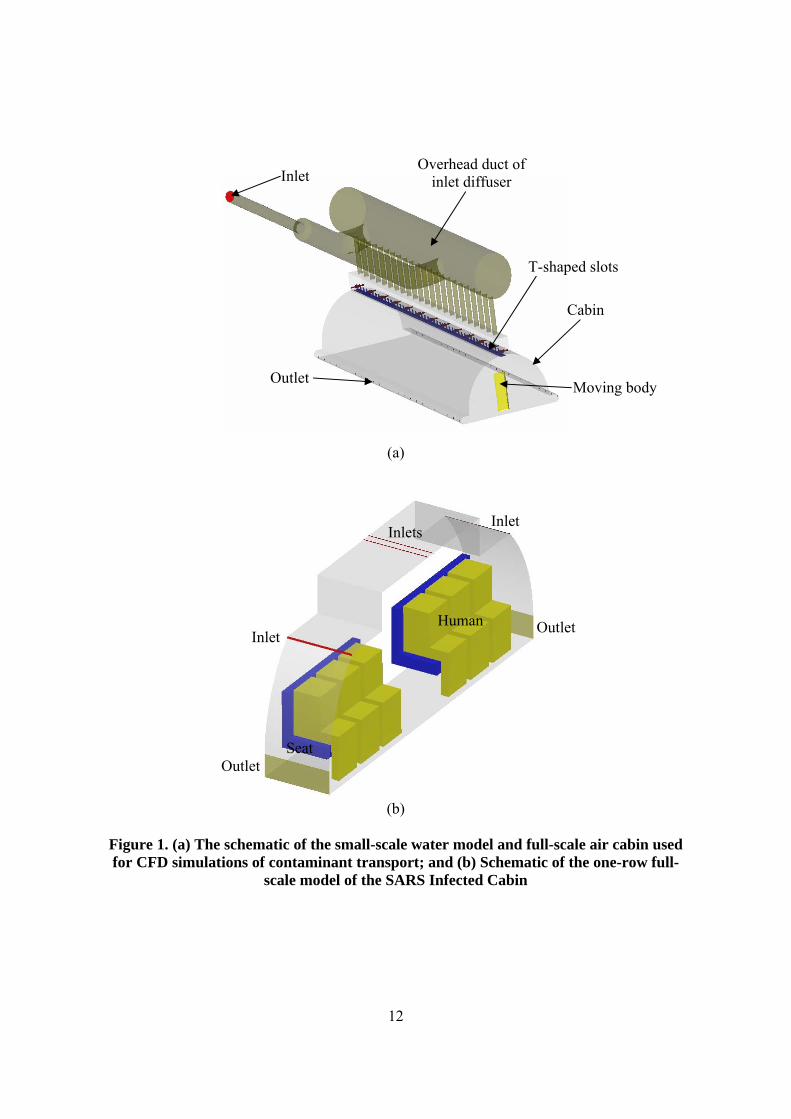
Figures 2 and 3 compare the contaminant transport characteristics for the small-scale model and full-scale cabin with the same time scale (Qfull-scale = 1000 Qsmall-scale, Ubody,full-scale = 10 Ubody,small-scale, and Lbody,full-scale = 10 Lbody,small-scale). A passive contaminant was released from both sides of the moving body. The release rate was 25 mL/s and was the same for the small-scale and full-scale cabins (Poussou et al., 2010). Figure 2 is for contaminant concentration at t=1, 3, and 5 s in a cross-section. The moving body was at the section when t=1 s. The contaminant moved to higher locations at a faster rate for the small-scale model than for the actual scale cabin because the strong downwash flow across the section damped-off faster in the small-scale model. The Reynolds number for flow due to the moving body was higher for the full-scale model under kinematically similar conditions, i.e.:
0, ,, ,
Re 6.4 Re (at 20 C)full scale small scale body cabin inletbody cabin inlet
which led to over-prediction of the effect of the body movement on the contaminant transmission. Based on the contaminant transport characteristics in kinematic similarity, the small-scale model over-predicted the effect due to the flow from the environmental control system but under-predicted the effect due to the movement. Figure 3 shows the contaminant concentration distributions at t=1, 3, and 5 s at the breathing level of the passengers, i.e., 0.1 m above the floor for the small-scale and 1 m above the floor for the full-scale cabin. The wake behind the moving body was more stable for the small-scale model compared to that of the full-scale cabin. This was expected as water is more viscous and denser than air. Moreover, the Reynolds number for the flow due to the moving body was lower for the small-scale model, which aided the formation of a more stable and symmetric wake. The difference in the Reynolds number can also result in the loss of i) the smallest eddies and ii) the turbulent kinetic energy in the small-scale model, which further led to the loss of turbulent mass diffusivities. As a result, the small-scale model would under-predict the contaminant transport. Since the loss may not be equally distributed over the space, it is difficult to estimate the effect of the anisotropy variation on the contaminant transmission inside a three-dimensional cabin model (Thatcher et al., 2004). Thus, to extend the understanding of the contaminant transmission obtained from the small-scale model to a full-scale airliner cabin is not trivial. By assuming the turbulence inside the cabin to be isotropic, along with several other assumptions on the flow scales, the ratio of scaled-up isotropic mass diffusivity (D) to that of a full-scale cabin can be analytically expressed as (Thatcher et al., 2004; Hinze, 1975):
6
22/3
, ,1/2, ,
, ,
1 1.1 Re 1cabin scale up cabin scale upT cabin full scale
cabin full scale cabin full scale
D
D
where ReT is the Reynolds number of the large scale turbulence and η is the Kolmogorov length scale of the small scale eddies. By assuming an integral length scale of a half body width W/2 and a turbulence velocity scale us = 0.5 Ubody (Poussou, 2008), the Kolmogorov length scales characterizing the wake in the small-scale and full-scale models were: ηsmall-scale = 2.7×10⁻⁴ m and ηfull-scale = 9.3×10⁻³ m, respectively. One can scale up the Kolmogorov length scale found in the small-scale model to that in a full-scale with a geometric ratio of 10:1 to be ηscale-up = 2.8×10⁻³ m. With ReT,cabin,full-scale = 2700, the ratio of a small-scale model to actual cabin mass diffusivities (Dcabin,scale-up / Dcabin,full-scale) was 0.97. Thus, the direct scale up of the contaminant transport phenomenon observed in the small scale model to a full-scale cabin would under-predict the contaminant transport. The Reynolds numbers of the small-scale model and full-scale cabin based on the flow at the supply inlets, the flow inside the cabin, and the flow over the moving body matched only when:
,, ,
,
Inlet : full scale inlet full scaleinlet full scale inlet small scale
small scale inlet small scale
LQ Q
L
,
, ,,
Cabin : full scale cabin full scalecabin full scale cabin small scale
small scale cabin small scale
LQ Q
L
,
, ,,
Moving Body: body small scale full scalebody full scale body small scale
body full scale small scale
LU U
L
At 200C, the Reynolds number was matched if:
, ,1.562 body full scale body small scaleU U
, , , ,156.2 156.2 cabin full scale inlet full scale cabin small scale inlet small scaleQ Q Q Q
Then the time scales for the flow inside the cabin would be:
0, ,, ,
6.4 (at 20 C)full scale small scale body cabin inletbody cabin inlett t
For effective comparison, the contaminant release rate should be modified as the water and air exchange rates were different. It is very difficult to estimate the scaling effect on the
7
contaminant transmission in a cabin with different time scales. Thus, the same Reynolds numbers would over-estimate the time scales, which complicates the interpretation of the contaminant transport observed in the small scale model for the full scale cabin. Furthermore, it is also difficult to replicate a full-scale cabin by a small-scale model. For example, the geometry of the diffusers which supplied air to the airliner cabins was extremely complex and hence it was not easy to model the diffuser geometry exactly for the small-scale. Due to the complex diffuser geometry, the flow from the inlets was highly non-uniform (Mazumdar et al., 2008). This non-uniform flow made it difficult to ascertain the mean length and velocity scales for the flow at the inlet. Even if the diffuser geometry were precisely modeled, other limitations existed. For instance, in the one-tenth scale water model, the height of the inlet slot could only be scaled down in our study to a half due to the limited pump capability and high pressure built in the upstream of the flow pipelines. These limitations prevented accurate scaling up of the contaminant transport from the small-scale model to an actual airliner cabin. In conclusion, the change of physical scale and that of the working fluid from water to air complicated the analyses. Simultaneous match of the time scale and Reynolds number of flow for the small-scale model and full-scale cabin was difficult. Different time scales or Reynolds numbers prevented direct scaling up of the contaminant transport observed in the small-scale model to the full-scale cabin. Moreover, other limitations in the experiment such as the non-uniform supply flow conditions due to the complex diffuser geometry also made the interpretation of the small-scale results non-trivial. Computing the mean length and velocity scales for the flow inside the cabin was also non-trivial with seats and passengers. Even with matched Reynolds numbers of the full-scale air cabin with the small-scale water model, it was hard to estimate the effect of scaling on the contaminant transport inside the three-dimensional cabin model (Thatcher et al., 2004). Hence, extending our understanding of contaminant transport obtained from the small-scale model to a full-scale model was difficult. However, the CFD model which has been tested with the experimental flow data from the small-scale model is a very useful tool to perform simulations of flow and contaminant transport in an actual cabin, and no scaling up is needed. One can then easily understand the influence of body movement on contaminant transport in an actual air cabin. Contaminant Transport in an Empty and an Occupied Cabin Airflow patterns and contaminant transport in a full-scale cabin with seats and passengers are different from those of an unoccupied one (Singh et al., 2002). Hence, our validated CFD model was further used here to compare the contaminant transport characteristics inside an empty full-scale cabin and an occupied cabin with a moving body. The cabin model is similar to the one shown in Fig. 1(a). The cabin had 28 rows of seats and 6 passengers in each row. Box-shaped mannequins with a surface area of 1.8 m2 were used to represent the passengers. The passenger and seat model, along with the thermo-fluid conditions for the occupied cabin, were similar to those used by Mazumdar and Chen (2008) and is shown in Table 2. The air exchange rate in the cabins was 30 per hour and the speed of the moving body was 1.75 m/s. The contaminant was released from the sides of the moving body.
8
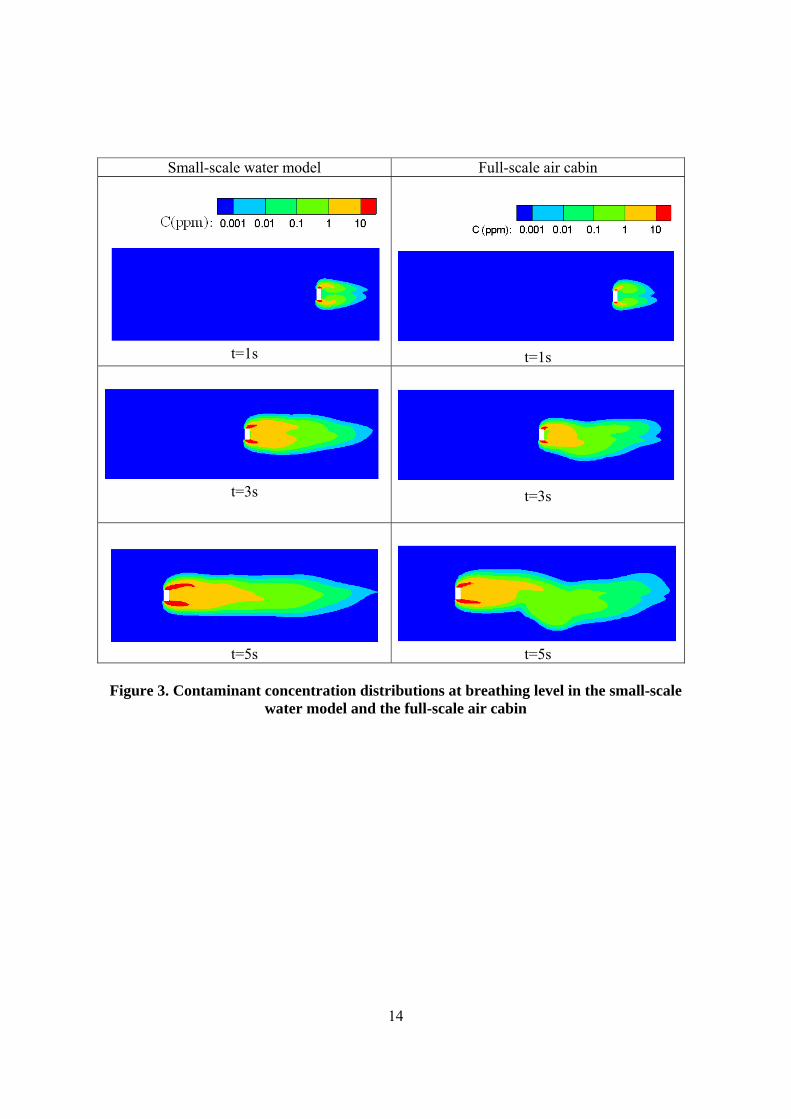
Figures 4 and 5 compare the contaminant transport in the empty and in the occupied cabin. The contaminant distributions in the occupied cabin were more symmetric across the cabin cross-section (Fig. 4) as well as along the length of the cabin (Fig. 5). The contaminant was also localized in the aisle of the occupied cabin compared to in the empty one. The obstructions in the occupied cabin prevented the lateral spread of the contaminant. The longitudinal spread of the contaminant was of the same order of magnitude for the occupied as for the empty cabins (Fig. 5). Contaminant Transport due to Body Movement in the SARS Infected Cabin Based on the results obtained above, CFD was ultimately used to investigate whether a moving crew member or passenger could have played a role in the transport of contaminants such as the SARS pathogen from the infected passenger to the fellow passengers seated as far as seven rows away in Air China Flight 112 from Hong Kong to Beijing in 2003 (Olsen et al., 2003). As mentioned earlier, the single row CFD model of the cabin is as shown in Figure 1(b). To investigate whether body movement in the aisle can aid transmission of contaminants, this study used a gaseous contaminant released passively at 1×10⁻⁶ kg/s from the infected passenger who was seated in 11E, as shown in Fig. 6. Two scenarios of contaminant release were assumed: one with a pulsed release for 30 s and the other a continuous release. To maintain the brevity of the manuscript, the results shown here are for the pulsed release scenario only. The general conclusions drawn remain similar for both the scenarios. Our study assumed that a moving crew member or passenger (moving body) started to move from the rear of the cabin and stopped at row 4, unless otherwise mentioned. The time step used in the computations was 0.01s. This case was also modeled using combined dynamic and static meshes. The influence of walking speed was first investigated. Figures 6 and 7 compare the contaminant transported at breathing level of a seated passenger, i.e., 1 m above the floor level, when the body moved at a speed of 1.75 m/s, i.e., kinematically similar to the small scale cabin, and 0.61 m/s, i.e., the average walking speed during cruise as measured by Boeing (http://www.boeing.com/). The duration of the body movement was 5.2 s and 15 s for walking speeds of 1.75 m/s and 0.61 m/s, respectively. The high concentration zone was within two rows of the infected passenger seated at 11E. As the body moved along the aisle, the wake could carry the contaminant seven rows in front of the infected passenger for both the cases in which the body stopped its movement. The contaminant carried in the wake was then distributed to the passengers seated near the aisle. The body movement increased the contaminant concentration dramatically for the passengers who were seated seven rows in front of the infected passenger for both moving speeds. A quantitative comparison of the magnitude of contaminant concentration at the breathing level is shown in Fig. 8. The average and maximum contaminant concentrations in the rows are compared. The contaminant concentrations at Row 4 for both moving speeds were similar. To compare the risk caused by the body movement, the figure also shows the concentrations at Rows 8, 9, and 10 without the moving body. Rows 10, 9, and 8 are one, two, and three rows away from the contaminant source located at Row 11, respectively. The

9
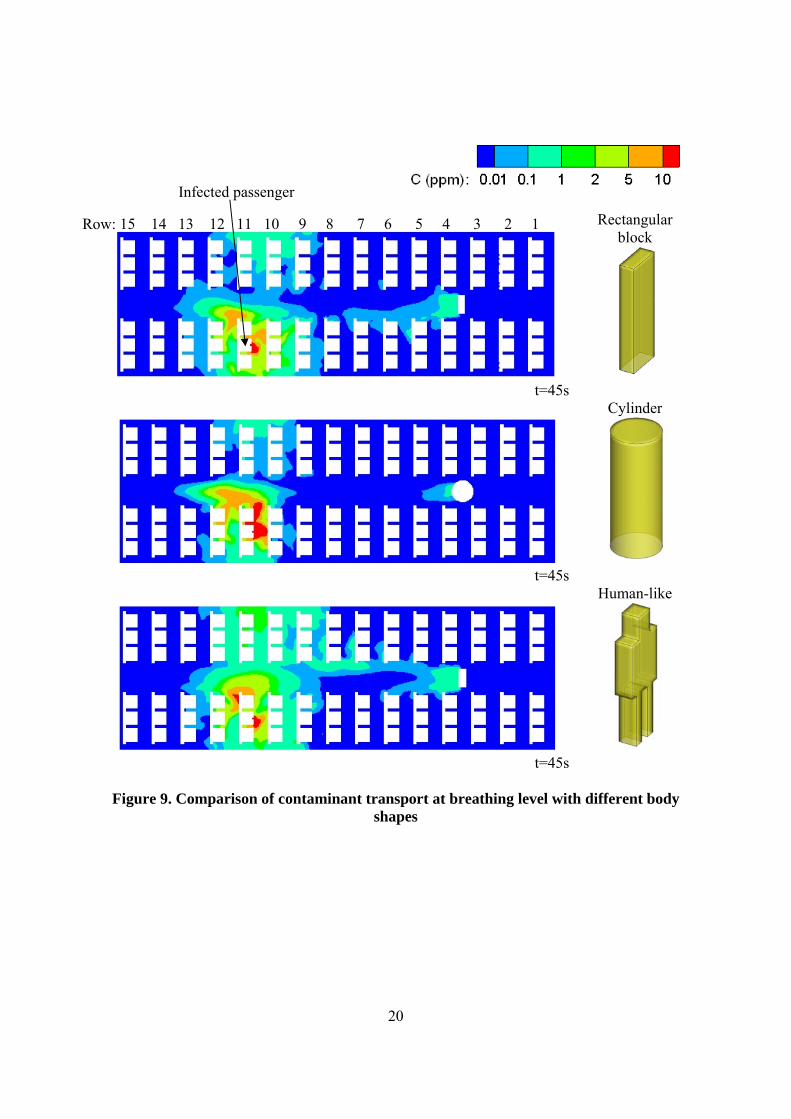
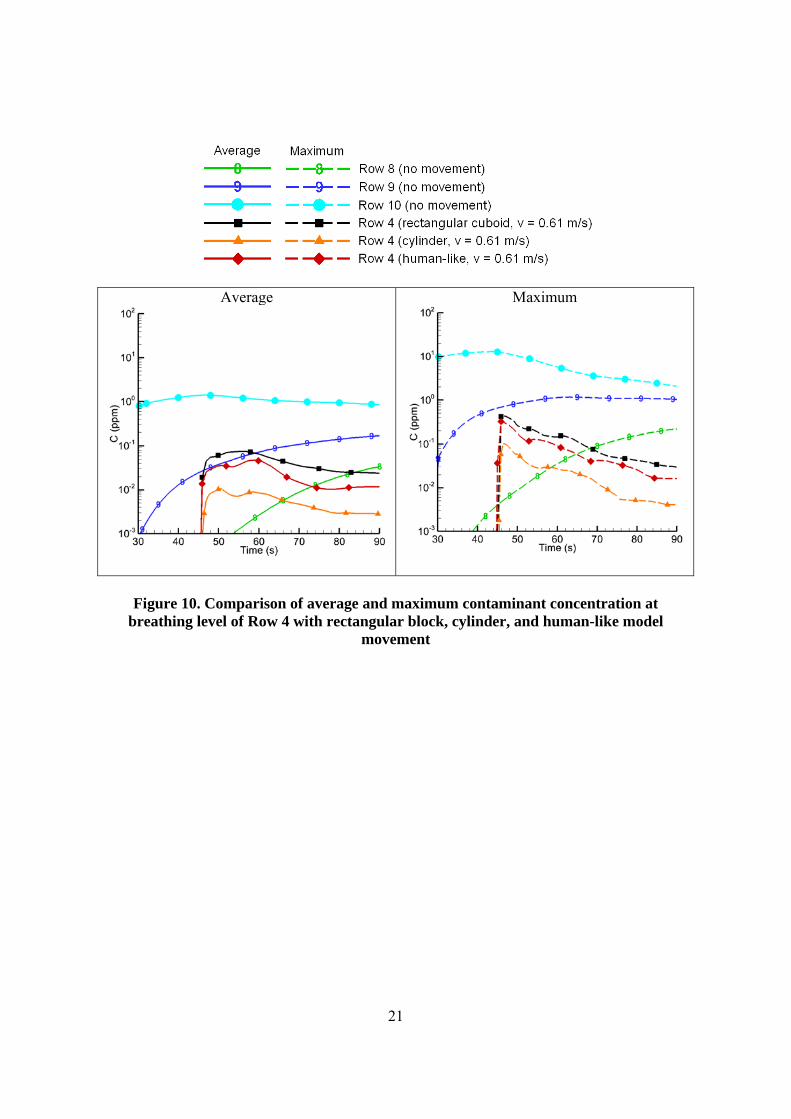
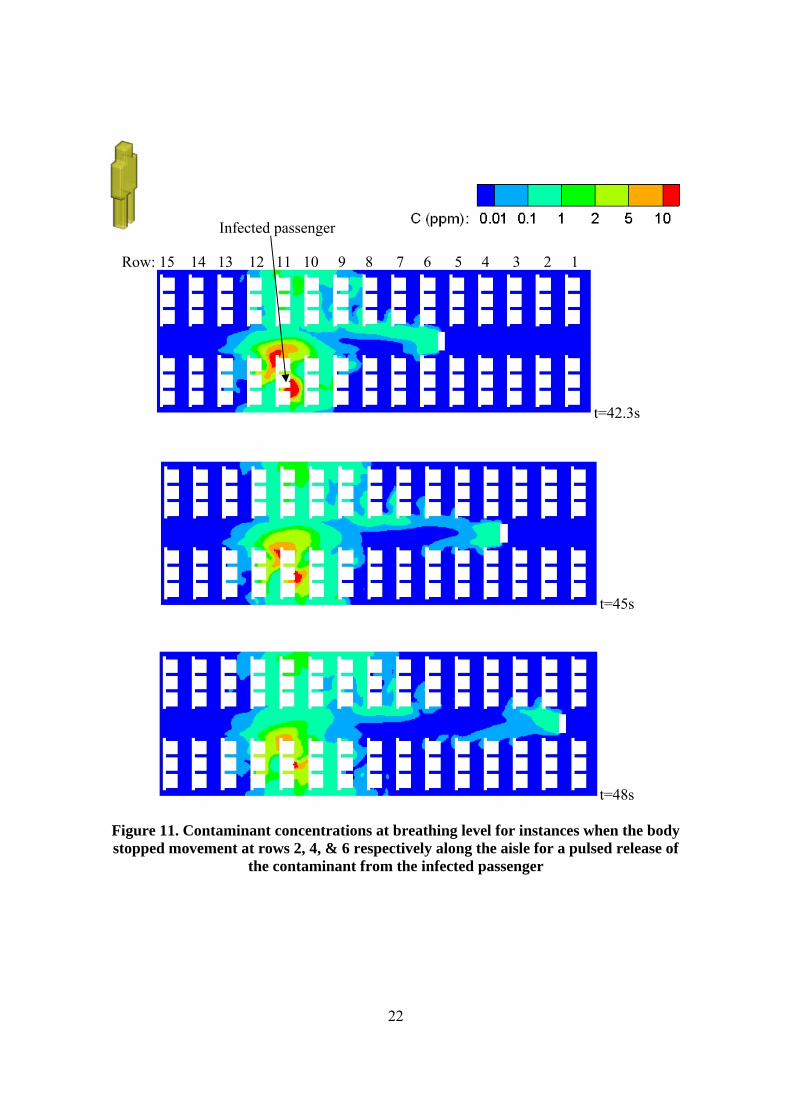
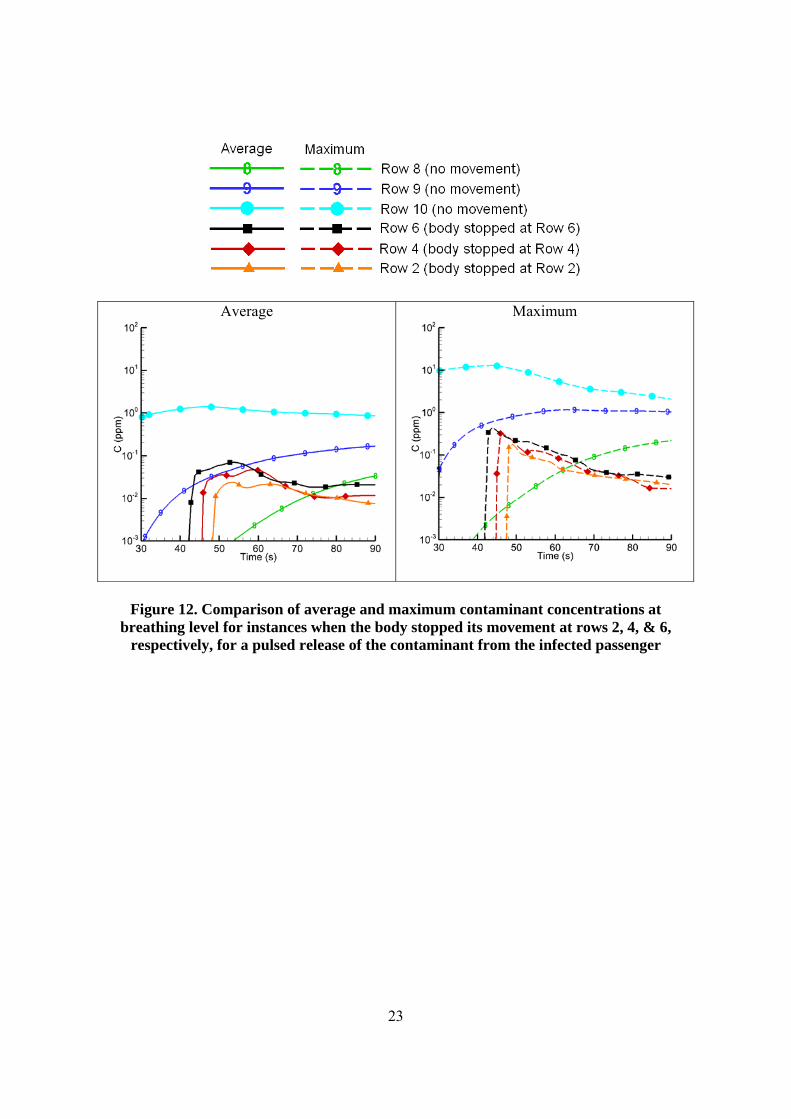
concentration at Row 4 due to the body movement can be as high as that at rows 8 and 9, which can cause infection. Thus, the body movement may have caused the transmission of the SARS pathogen from the infected passenger to fellow passengers seated as far as seven rows away on Air China Flight 112 in 2003. It should be noted that in addition to movement, other possibilities such as indirect contact by touching can also infect people seated far away from the index patient (Wan et al., 2009). The above study used a rectangular block to represent the body movement. In order to study the influence of body shape on the contaminant transport, this investigation used three different human body geometries, i.e., a rectangular block, a cylinder, and a human-like model, as shown in Figure 9. The figure also shows the snapshot of contaminant concentration at breathing level at the moment when the body stopped its movement at Row 4 when it was moving at a speed of 0.61 m/s. For all the body shapes, the contaminant was transported seven rows in front of the infected passenger. The cylinder transported the least amount of contaminant in its wake region. Figure 10 further compares quantitatively the contaminant concentration at the breathing level in Row 4 with the different body shapes. The average and maximum concentrations with the cylinder were lower, as was evident from the concentration contours. The concentration at Row 4 with the human-like model was only slightly lower than that with the rectangular block. Finally, the influence of the body movement extent was investigated using a human-like model at a moving speed of 0.61 m/s. Three different cases were compared: 1. The moving body stopped at Row 6 2. The moving body stopped at Row 4 3. The moving body stopped at Row 2 Figure 11 shows that the wake of the moving body can carry the contaminant as far as it went. Figure 12 illustrates that the magnitude of average and maximum concentrations at the breathing level in the row where the moving body stopped were reduced slightly when the body moved further. The contaminant concentrations were comparable to those at Rows 8 and 9, so the risk was high. Hence, body movement along the cabin aisle may substantially increase the infection risk for passengers seated far away from the infected passenger. CONCLUSIONS This study used CFD to extend the understanding of flow and contaminant transport inside airliner cabins with a moving crew member or passenger along the aisle. The study led to the following conclusions:
1. The small-scale water model over-predicted the flow effect from the environmental control system for the cabin, but under-predicted the flow effect due to the body movement under kinematically similar conditions.
2. The flow and contaminant transport obtained using the small-scale water model may not be the same as that in a full-scale air cabin because it is difficult to achieve flow

10
similarity. However, the CFD model can be used to predict flow and contaminant transport in the full-scale air cabin without scaling problems.
3. The obstructions created by seats and passengers in a cabin made the contaminant transport more localized to the aisle of the cabin. The longitudinal spread of the contaminant was almost the same for the occupied and empty cabins.
4. The shape of the moving body had some influence on the contaminant transport. The cylinder carried the least amount of contaminant in its wake.
5. A walking crew member or passenger along the cabin aisle can carry a contaminant from its source as far as the crew member or passenger goes. The body movement may have caused the transmission of the SARS pathogen from the infected passenger to fellow passengers seated as far as seven rows away on Air China Flight 112 in 2003.
ACKNOWLEDGEMENTS This project was funded by the U.S. Federal Aviation Administration (FAA) Office of Aerospace Medicine through the National Air Transportation Center of Excellence for Research in the Intermodal Transport Environment under Cooperative Agreement 10-C-RITE-PU. Although the FAA sponsored this project, it neither endorses nor rejects the findings of this research. The presentation of this information is in the interest of invoking comments from the technical community on the results and conclusions of the research. REFERENCES Brohus H., Balling K.D., and Jeppesen D., 2006. Influence of movements on contaminant transport in an operating room. Indoor Air 16, 356-372. Chen Q., 2009. Ventilation performance prediction for buildings: A method overview and recent applications. Building and Environment 44(4), 848-858. Fluent 6.2, 2003. User’s Guide. FLUENT Inc. Hinze J.O., 1975. Turbulence. McGraw Hill, New York, NY, 2nd edition. Mazumdar S., and Chen Q., 2008. Influence of cabin conditions on placement and response of contaminant detection sensors in a commercial aircraft. Journal of Environmental Monitoring 10, 71-81. Mazumdar S., Priyadarshana P.A., Keshavarz A., Chen Q., and Jones B.W., 2008. Flow characteristics from air supply diffusers and their effect on airflow and contaminant transport inside an aircraft cabin. The 11th International Conference on Indoor Air Quality and Climate, Indoor Air Copenhagen, Denmark. NRC (National Research Council), 2002. The airliner cabin environment and the health of passengers and crew. Washington, DC: National Academy Press.

11
Olsen S.J., Chang H.L., Cheung T.Y., Tang A.F., Fisk T.L., Ooi S.P., Kuo H.W., Jiang D.D., Chen K.T., Lando J., Hsu K.H., Chen T.J., and Dowell S.F., 2003. Transmission of the severe acute respiratory syndrome on aircraft. New England Journal of Medicine 349(25), 2416-22. Poussou S.B., 2008. Experimental investigation of airborne contaminant transport by a human wake moving in a ventilated aircraft cabin. Ph.D. Thesis, Purdue University. Poussou S.B., Mazumdar S., Plesniak M.W., Sojka P.E., and Chen Q., 2010. Flow and contaminant transport in an airliner cabin induced by a moving body: Model experiments and CFD predictions. Atmospheric Environment 44, 2830-2839. Singh A., Hosni M., and Horstman R., 2002. Numerical simulation of airflow in an aircraft cabin section. ASHRAE Transactions 108(1), 1005-1013. Thatcher T.L., Wilson D.J., Wood E.E., Craig M.J., and Sextro R.G., 2004. Pollutant dispersion in a large indoor space: Part 1—Scaled experiments using a water-filled model with occupants and furniture. Indoor Air 14(4), 258-71. Wan M.P., Sze To G.N., Chao C.Y.H., Fang L. and Melikov A., 2009. Modeling the fate of expiratory aerosols and the associated infection risk in an aircraft cabin environment. Aerosol Sci. Technol. 43, 322-343. Zhai Z., Chen Q., and Scanlon P.W., 2002. Design of ventilation system for an indoor auto racing complex. ASHRAE Transactions 108(1), 989-998. Zhang Z., Zhang W., Zhai Z., and Chen Q., 2007. Evaluation of various turbulence models in predicting airflow and turbulence in enclosed environments by CFD: Part-2: Comparison with experimental data from the literature. HVAC&R Research 13(6), 871-886.
12
(a)
(b)
Figure 1. (a) The schematic of the small-scale water model and full-scale air cabin used for CFD simulations of contaminant transport; and (b) Schematic of the one-row full-
scale model of the SARS Infected Cabin
Overhead duct of inlet diffuser Inlet
Outlet Moving body
T-shaped slots
Inlets
Inlet Outlet Human
Seat Outlet
Inlet
Cabin

13
Small-scale water model Full-scale air cabin
t=1s
t=1s
t=3s
t=3s
t=5s
t=5s
Figure 2. Contaminant concentration distributions across a cabin cross-section in the
small-scale water model and the full-scale air cabin
14
Small-scale water model Full-scale air cabin
t=1s
t=1s
t=3s
t=3s
t=5s
t=5s Figure 3. Contaminant concentration distributions at breathing level in the small-scale
water model and the full-scale air cabin
15
Empty cabin Fully occupied cabin
t=1s
t=1s
t=3s
t=3s
t=5s
t=5s
Figure 4. Contaminant concentration distribution across a cross section in full-scale
CFD model of empty and occupied cabins

16
Empty cabin Fully occupied cabin
t=1s
t=1s
t=3s
t=3s
t=5s
t=5s
Figure 5. Contaminant concentration distribution at the breathing level in full-scale
CFD model of empty and occupied cabins

17
t=30s
t=32.6s
t=35.2s
t=36s Figure 6. Contaminant transport process at breathing level due to the body moving at 1.75 m/s along the aisle for a pulsed contaminant release from the infected passenger
Infected passenger
Row: 15 14 13 12 11 10 9 8 7 6 5 4 3 2 1

18
t=30s
t= 38s
t=45s
t=46s Figure 7. Contaminant transport process at breathing level due to the body moving at 0.61 m/s along the aisle for a pulsed contaminant release from the infected passenger
Infected passenger
Row: 15 14 13 12 11 10 9 8 7 6 5 4 3 2 1

19
Average
Maximum
Figure 8. Comparison of average and maximum contaminant concentration at
breathing level due to a pulsed contaminant release from the infected passenger
20
t=45s
Rectangular block
t=45s
Cylinder
t=45s
Human-like
Figure 9. Comparison of contaminant transport at breathing level with different body
shapes
Infected passenger
Row: 15 14 13 12 11 10 9 8 7 6 5 4 3 2 1
21
Average
Maximum
Figure 10. Comparison of average and maximum contaminant concentration at
breathing level of Row 4 with rectangular block, cylinder, and human-like model movement
22
t=42.3s
t=45s
t=48s
Figure 11. Contaminant concentrations at breathing level for instances when the body stopped movement at rows 2, 4, & 6 respectively along the aisle for a pulsed release of
the contaminant from the infected passenger
Row: 15 14 13 12 11 10 9 8 7 6 5 4 3 2 1
Infected passenger
23
Average
Maximum
Figure 12. Comparison of average and maximum contaminant concentrations at
breathing level for instances when the body stopped its movement at rows 2, 4, & 6, respectively, for a pulsed release of the contaminant from the infected passenger
24
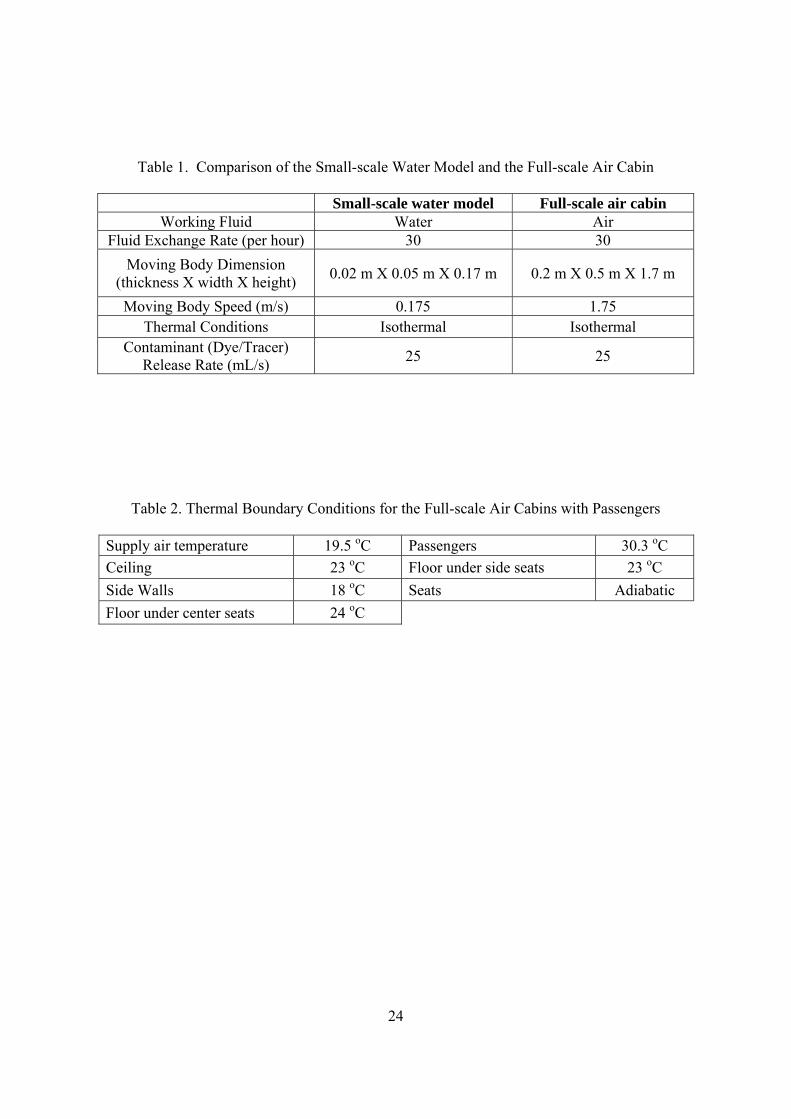
Table 1. Comparison of the Small-scale Water Model and the Full-scale Air Cabin
Small-scale water model Full-scale air cabin
Working Fluid Water Air Fluid Exchange Rate (per hour) 30 30
Moving Body Dimension (thickness X width X height)
0.02 m X 0.05 m X 0.17 m 0.2 m X 0.5 m X 1.7 m
Moving Body Speed (m/s) 0.175 1.75 Thermal Conditions Isothermal Isothermal
Contaminant (Dye/Tracer) Release Rate (mL/s)
25 25
Table 2. Thermal Boundary Conditions for the Full-scale Air Cabins with Passengers
Supply air temperature 19.5 oC Passengers 30.3 oC
Ceiling 23 oC Floor under side seats 23 oC
Side Walls 18 oC Seats Adiabatic
Floor under center seats 24 oC
![Air Contaminant _54.12_ [Preamb]](https://static.fdocuments.in/doc/165x107/5695cf481a28ab9b028d6988/air-contaminant-5412-preamb.jpg)