Impact of purification on physicochemical, surface and ...
40
Impact of purification on physicochemical, surface and functional properties of okra biopolymer GHORI, M.U., MOHAMMAD, M.A., RUDRANGI, S.R.S., FLEMING, Leigh, MERCHANT, H.A., SMITH, A.M. and CONWAY, B.R. Available from Sheffield Hallam University Research Archive (SHURA) at: http://shura.shu.ac.uk/27630/ This document is the author deposited version. You are advised to consult the publisher's version if you wish to cite from it. Published version GHORI, M.U., MOHAMMAD, M.A., RUDRANGI, S.R.S., FLEMING, Leigh, MERCHANT, H.A., SMITH, A.M. and CONWAY, B.R. (2017). Impact of purification on physicochemical, surface and functional properties of okra biopolymer. Food Hydrocolloids, 71, 311-320. Copyright and re-use policy See http://shura.shu.ac.uk/information.html Sheffield Hallam University Research Archive http://shura.shu.ac.uk
Transcript of Impact of purification on physicochemical, surface and ...
Impact of purification on physicochemical, surface and functional properties of okra biopolymer
GHORI, M.U., MOHAMMAD, M.A., RUDRANGI, S.R.S., FLEMING, Leigh, MERCHANT, H.A., SMITH, A.M. and CONWAY, B.R.
Available from Sheffield Hallam University Research Archive (SHURA) at:
http://shura.shu.ac.uk/27630/
This document is the author deposited version. You are advised to consult the publisher's version if you wish to cite from it.
Published version
GHORI, M.U., MOHAMMAD, M.A., RUDRANGI, S.R.S., FLEMING, Leigh, MERCHANT, H.A., SMITH, A.M. and CONWAY, B.R. (2017). Impact of purification on physicochemical, surface and functional properties of okra biopolymer. Food Hydrocolloids, 71, 311-320.
Copyright and re-use policy
See http://shura.shu.ac.uk/information.html
Sheffield Hallam University Research Archivehttp://shura.shu.ac.uk

Impact of Purification on Physicochemical, Surface and Functional Properties
of Okra Biopolymer
Muhammad U. Ghori 1, Mohammad Amin Mohammad 2, Shashi Ravi Suman Rudrangi 3
Leigh T. Fleming 4, Hamid A. Merchant 1, Alan M. Smith 1, Barbara R. Conway 1, *
1 Department of Pharmacy, School of Applied Sciences, University of Huddersfield,
Huddersfield, HD1 3DH
2 School of Pharmacy, University of Bradford, Bradford, BD7 1DP
3 Research and Development Department, Bristol Laboratories Limited, Laporte Way, Luton,
Bedfordshire LU4 8WL, United Kingdom
4 Centre for Precision Technologies, School of Computing and Engineering, University of
Huddersfield, Huddersfield, HD1 3DH
*Corresponding author,
Barbara R. Conway Email: [email protected] Phone: +44 (0) 1484 472347 Fax: +44 (0) 1484 472182

Abstract:
The functionality of plant-resourced biopolymers depends on their physicochemical
properties. In addition, the extraction protocol and further processing conditions can
significantly affect the effectiveness of biopolymer in diverse industrial applications.
Therefore, the objective of this study was to investigate the impact of purification on
chemical composition, molecular arrangement, solubility, swelling, erosion, wettability,
quantitative wetting kinetics, surface energy and three-dimensional (3D) surface texture
properties of okra biopolymer and its compacted form. FTIR and XRD results confirmed that
the purification process had no effect on the molecular structural arrangement. The highest
purity grade (bi-purified okra biopolymer) had the highest sugar content, solubility, matrix
tablet swelling, wettability and surface energy, although the surface porosity and roughness
of matrix tablet were low. Okra biopolymer showed pH-dependent solubility and the
maximum solubility was achieved at pH 7.4. The mechanism of swelling of less-purified
matrices was anomalous, where the rate of water diffusion and polymer relaxation was of
the same magnitude, whereas bi-purified matrices showed diffusion-controlled swelling.
Wetting was absorption-controlled and the bi-purified biopolymer had a high degree of
wetting and surface energy. The extraction method, therefore, has a major influence on the
properties and the subsequent drug delivery, biotechnology and food science applications
for the biopolymer.
Keywords:
Okra biopolymer; Purification; Matrix tablet: Swelling; Erosion; Surface energy
1. Introduction
Natural polymers are composite biomaterials and are commonly resourced from plant,
animal and microbial sources (Reis et al., 2008). There are many examples, including, but
not limited to, gum arabic (plant exudates), alginate (seaweed), xanthan gum (bacteria),
okra biopolymer (fruit), grewia gum (bark), chitin (exoskeletons of arthropods) and
chondroitin sulphate (animal cartilage) (John & Thomas, 2012). The potential of natural
polymers, especially plant biopolymers, has significantly increased, as confirmed by the
enormous quantity of associated papers and patents recently published (Beneke, Viljoen, &
Hamman, 2009; Hamman, Steenekamp, & Hamman, 2015; Thakur & Voicu, 2016). Plant-
based biopolymers, or modifications thereof, are widely used in pharmaceutical, food and
biomedical applications (Alba, Ritzoulis, Georgiadis, & Kontogiorgos, 2013; Ghori, Alba,
Smith, Conway, & Kontogiorgos, 2014). Most of them are safe for oral consumption and are
preferred over their synthetic counterparts because of low cost, non-toxicity and abundant
availability (John & Thomas, 2012).
However, there are some technical restrictions regarding their application as they must
have to meet the standards of reproducibility, content and purity (Lai & Chen, 2012). As the
biopolymers can exist in structurally complex mixtures, which may vary according to
location and season, standard isolation and purification techniques are required to ensure
the resource can be produced and used in a sustainable manner. This is of special
significance when the biopolymer is used at a high concentration to fulfil its anticipated
function, such as a modified release tablet matrix former (Beneke, Viljoen, & Hamman,
2009; Amid & Mirhosseini, 2012). Hence, it seems necessary that these biomaterials must
undergo a sophisticated purification protocol for the standardisation of their
physicochemical and functional properties. Attributable to naturally occurring sources,
these materials generally contain a lot of undesirable substances which can be fibres,
proteins, fatty acids, cellulose, hemicellulose, endotoxins (pyrogen) and mitogenic
compounds (Vidal-Serp & Wandrey, 2005). These impurities can instigate some serious
health concerns in humans. This was highlighted in a series of studies on alginate beads in
which beads were formed using highly purified alginate were more biocompatible than
commercially available non-purified alginates (De Vos, De Haan, Wolters, Strubbe, & Van
Schilfgaarde, 1997; Dusseault et al., 2006; Sharma & Gupta, 2002). Furthermore, another
study also revealed that the use of substantially purified alginate significantly reduced
fibrotic overgrowth around implants (Qi, Lu, Zhou, & Luo, 2009). Recently, our group has
affirmed the potential of purified grewia gum (starch-free) in controlled release
applications. It was found that purified grewia gum had comparable potential to the
frequently used semi-synthetic polymer, hypromellose (HPMC) in some pharmaceutical
applications and may be a useful substitute in countries where it is naturally abundant or
can be cultivated easily (Ghori & Conway, 2015; Ghori, Ginting, Smith, & Conway, 2014;
Nep, Asare-Addo, Ghori, Conway, & Smith, 2015). The practical production of biopolymers,
in amounts compatible with many industrial applications, and with a high degree of purity,
would enable their more widespread adoption.
In this study, okra biopolymer was chosen as a model material since it has documented
applications across many pharmaceutical, food and biomedical applications (Ghori, Alba,
Smith, Conway, & Kontogiorgos, 2014). The application of okra biopolymer as a drug release
modifier, film-former, scaffold for tissue engineering, emulsion stabiliser, anti-static agent,
tablet coating agent and compressibility enhancer have all been reported recently (Alba,
Ritzoulis, Georgiadis, & Kontogiorgos, 2013; Dimopoulou, Ritzoulis, Papastergiadis, &
Panayiotou, 2014; Ghori, Alba, Smith, Conway, & Kontogiorgos, 2014; Ghori, Green, Smith &
Conway, 2013; Ogaji & Nnoli, 2010). Okra biopolymer is normally acquired from its pods
(Abelmoschus esculentus L.) and it is widely cultivated in the tropics, sub-tropical and
temperate regions around the world including Africa, Asia and North-America. It has a net
global production of 6 million tons ha-1 and total trade of more than $5 billion
(Kontogiorgos, Margelou, Georgiadis, & Ritzoulis, 2012). Extracts of okra are reported as
comprising an acidic polysaccharide consisting of different sugars including galactose,
rhamnose, galacturonic acid, galactose, glucose and glucuronic acid (Alba, Ritzoulis,
Georgiadis, & Kontogiorgos, 2013).
Polymer hydration, solubility and erosion/dissolution are important areas for investigation
because of their impact on applications in industry such as biotechnology, food sciences and
drug delivery (Miller-Chou & Koenig, 2003; Narasimhan, 2001). Unlike non-polymeric
materials, polymers do not dissolve instantaneously, and the dissolution is controlled by
either the disentanglement of the polymer chains or by the diffusion of the chains through a
boundary layer adjacent to the polymer–solvent interface (Crompton, 2006; Miller-Chou &
Koenig, 2003). Moreover, within various healthcare (e.g., drug delivery and tissue
engineering) and food science applications, it is vitally important to understand the polymer
solubility/dissolution and hydration behaviour. To identify the suitability of biopolymers for
the aforementioned industrial applications, one has to evaluate some key performance
indicators which include (however, are not limited to) solubility, swelling, erosion, surface
wetting, energetics and texture. This paper describes a systematic approach to clarify the

impact of purification on these properties of a biopolymer and how they may impact
performance.
Therefore, this study was designed to assess the impact of purification on chemical
constituents, solubility, swelling, erosion, wetting, surface energetics and texture of okra
biopolymer. Moreover, okra is used as an example of a plant-derived biopolymer model and
it is intuitively expected that changes due to the purification process may be extrapolated to
similar plant-derived polysaccharide biopolymers expected to be utilised in drug delivery,
biotechnology and food science applications. Specific changes due to methods of
purification and experimental conditions may, of course, vary from biopolymer to
biopolymer.
2. Materials and methods
2.1. Materials
Fresh okra pods were purchased from a local market and were frozen and kept at -15 °C
until handling. Sulphuric acid, hydrochloric acid, ethanol and phenol were purchased from
Sigma-Aldrich, UK. Diiodomethane (>99% pure), disodium hydrogen phosphate (Na2HPO4)
and sodium dihydrogen phosphate (NaH2PO4) were purchased from Fisher Scientific UK. All
reagents used were of analytical grade.
2.2. Methods
2.2.1. Extraction of okra biopolymer
The extraction of biopolymer from fresh okra pods was carried out according to the details
described in Fig. 1. It resulted in three different polymer grades, classified as crude, purified
and bi-purified okra biopolymer. Once dried, the particle size fractions (150-250 m) were
isolated by sieving and used in all subsequent studies.
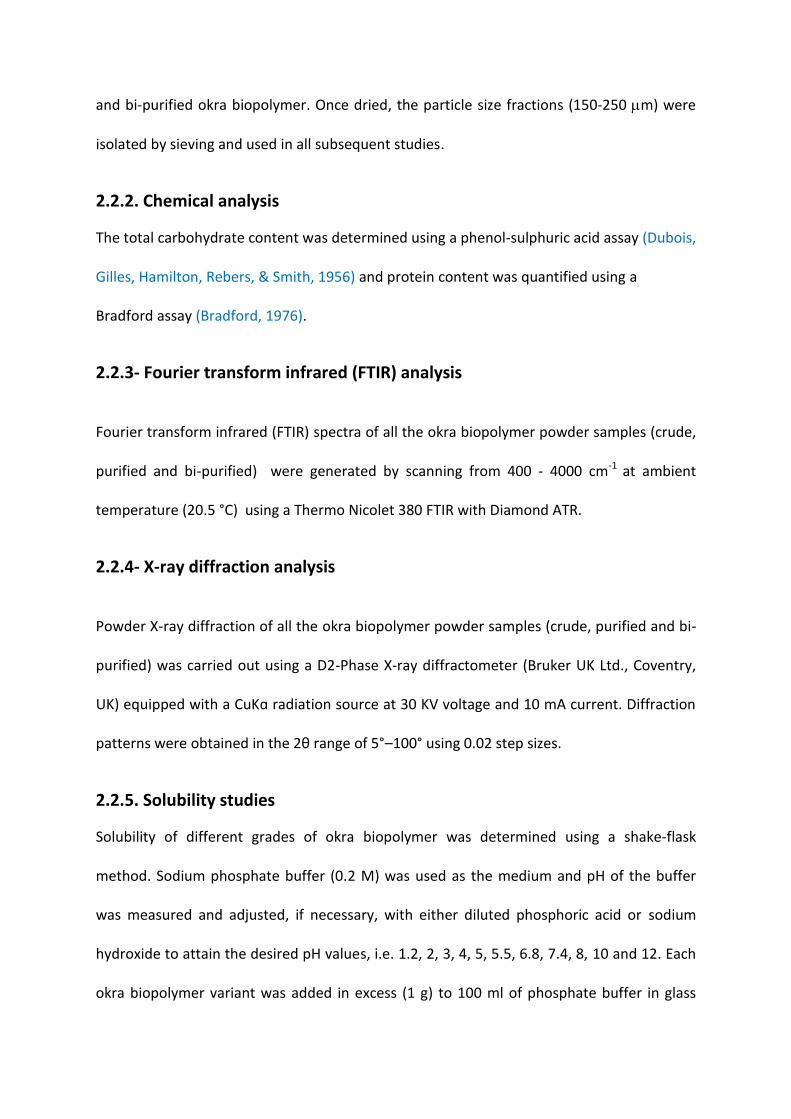
2.2.2. Chemical analysis
The total carbohydrate content was determined using a phenol-sulphuric acid assay (Dubois,
Gilles, Hamilton, Rebers, & Smith, 1956) and protein content was quantified using a
Bradford assay (Bradford, 1976).
2.2.3- Fourier transform infrared (FTIR) analysis
Fourier transform infrared (FTIR) spectra of all the okra biopolymer powder samples (crude,
purified and bi-purified) were generated by scanning from 400 - 4000 cm-1 at ambient
temperature (20.5 °C) using a Thermo Nicolet 380 FTIR with Diamond ATR.
2.2.4- X-ray diffraction analysis
Powder X-ray diffraction of all the okra biopolymer powder samples (crude, purified and bi-
purified) was carried out using a D2-Phase X-ray diffractometer (Bruker UK Ltd., Coventry,
UK) equipped with a CuKɑ radiation source at 30 KV voltage and 10 mA current. Diffraction
patterns were obtained in the 2θ range of 5°–100° using 0.02 step sizes.
2.2.5. Solubility studies
Solubility of different grades of okra biopolymer was determined using a shake-flask
method. Sodium phosphate buffer (0.2 M) was used as the medium and pH of the buffer
was measured and adjusted, if necessary, with either diluted phosphoric acid or sodium
hydroxide to attain the desired pH values, i.e. 1.2, 2, 3, 4, 5, 5.5, 6.8, 7.4, 8, 10 and 12. Each
okra biopolymer variant was added in excess (1 g) to 100 ml of phosphate buffer in glass

vials at 37 ± 0.5 °C. The glass vials were placed in the temperature-controlled shaking
apparatus (GLS 12 aqua®) at an agitation speed of 100 rpm. For every grade, three aliquots
were prepared at each pH value. After the requisite shaking time, samples were equilibrated
for 24 h at 37 ± 0.5 °C, and then the supernatant was filtered through Millex-LH membrane
0.45 µm pore size filters (Millipore®). The pH of the supernatant solutions was then
measured. The concentration of okra biopolymer in the supernatant was determined using
a phenol-sulphuric acid assay. The quantification method for the polysaccharide-based
polymer in their dissolved state has previously been reported by our group (Ghori, 2014;
Ghori, Ginting, Smith, & Conway, 2014). Briefly, filtered samples (1 mL) were added to 1 ml
of 5% phenol in 0.1 M hydrochloric acid, followed by 5 ml of concentrated sulphuric acid.
The resultant solution was mixed vigorously for 10 minutes and placed in a water bath at
25–30 °C for 20 minutes. Absorbance was measured at a maximum wavelength (λ max) of
472 nm and dissolved okra biopolymer content was quantified using a standard calibration
curve constructed for each respective grade, so content was determined relative to the
grade of polymer used.
2.2.6. Preparation of matrix tablets
All the okra biopolymer powder samples were compressed using a Testometric M500 – 50
CT (Testometric Company Ltd., United Kingdom) materials testing machine equipped with a
13.00 mm Atlas Evacuable Tablet Die (Specac Limited, United Kingdom). The powder was
accurately weighed (500 ± 2.5 mg) on an analytical balance and manually poured into the
die. Using flat-faced punches, the lower punch was held stationary while the upper punch
moved at a speed of 3 mm/min during loading and 3 mm/min on unloading. The compacts
were fabricated at an applied pressure of 100 MPa. After ejection, the tablets were stored

over silica gel for 24 h to allow for elastic recovery before any further investigation. Relative
humidity and temperature during compaction work were in the range 22–48 % RH and 20-
27 °C, respectively. The out-of-die porosity was calculated using Eq. 1.
(
) ) ×100 (Eq 1)
where W, T, d are weight, thickness and diameter of the matrix tablets, respectively. True
density of okra biopolymer powders () was determined (n = 10), using the AccuPyc 1340 II
Pycnometer (Micromeritic, UK) with helium as the inert gas.
2.2.7. Surface roughness studies
2.2.7.1- Atomic force microscopy
The atomic force microscopy (AFM) images were collected using contact mode and a
standard optical lever method with a small offset of force using Dimension Icon by Bruker,
UK. The height variation in the resulting topography maps is represented by a colour
scheme and the topographical information can be reliably inferred from the given colour
scheme. The three-dimensional root mean square roughness (Sq) (Eq. 2) (Blunt & Jiang,
2003; Farris, Introzzi, Biagioni, Holz, Schiraldi, & Piergiovanni, 2011) was also determined
using SURFSTAND® software (University of Huddersfield) (Blunt & Jiang, 2003). The scan
area was 10 × 10 µm2 and each measurement was carried out in triplicate (n=3)
√
∑
∑
2.2.8. Swelling studies
Swelling of okra biopolymer base matrix tablets was determined using USP apparatus I, SR II
6-flask (Hanson Research, USA) at 100 rpm at 37 °C. The swelling media were pH 1.2 and pH
7.4 sodium phosphate buffers and the pre-weighed matrix tablet (Wi) of each okra
biopolymer variant was immersed in the respective swelling medium (900 ml). The
previously weighed baskets, containing hydrated matrix tablets, were removed, lightly
blotted with 125 mm filter paper (Whatman®, UK) to remove excess liquid, re-weighed (Ws)
and were rapidly replaced back into the swelling media in dissolution apparatus. The mean
weight was determined for each formulation and degree of swelling (S) was calculated by
using Eq. 3 (Ghori, Alba, Smith, Conway, & Kontogiorgos, 2014)
(Eq 3)
where Wi and Ws are the initial dry and swollen weight of the matrix tablet, respectively, at
immersion time (t) in the swelling media. The degree of swelling was determined from the
mean of three replicates and presented as degree of swelling (S, %) against time (t).
2.2.9. Erosion studies
The erosion studies were carried out on all okra biopolymer based matrices. The dissolved
okra was quantified by adopting a method described in section 2.2.5 (Ghori, 2014; Ghori,
Ginting, Smith, & Conway, 2014). The degree of erosion (E, %) was determined from the
mean of three replicates and plotted against time (t).
2.2.10. Contact angle and surface wettability
The contact angles of water and diiodomethane were determined for all the variants of okra
biopolymer matrices using the sessile drop method. The OCA15plus (Dataphysics, Germany)
apparatus was used to capture the contact angle data and further SCA20 software (Data

Physics, Germany) was used for data analysis. The droplets of liquid (0.5 µl) were released
from a micro-syringe from a constant height (1 cm) for consistency purposes. The variations
in the contact angle were monitored using a software-assisted (SCA20 software) image
processing procedure. All the contact angle experiments were carried out in triplicate (n=3)
at ambient conditions (22-40 % RH and 18 - 25.5 °C temperature).
2.2.11. Determination of surface energy parameters
Two liquids of known total ( ), dispersive ( ) and specific (
) surface free energy are
enough to measure the total ( ), dispersive ( ) and specific (
) surface free energy of
the solids using the following equations (Fowkes, 1964; Wu, 1973). The details of surface
tension property of liquids used in this experiments are given in Table 1.
(√
√
) (Eq 4)
where is the initial contact angle. Although surface energy parameters are normally
calculated using equilibrium contact angle, exceptionally initial, or extrapolated initial,
contact angle can also be used for hydrophilic surfaces where the contact angle changes
with time (Correia, Ramos, Saramago, & Calado, 1997; Erbil, Yasar, Süzer, & Baysal, 1997;
Shen, Sheng, & Parker, 1999; Adão, Saramago, & Fernandes, 1999; Ho, & Khew,. 2000;
Luner, & Oh, 2001, Saurí, , et al., 2015).
If an apolar liquid (e.g., diiodomethane) is placed on the surface of a solid and its contact
angle is measured, Eq. 4 can be reduced to Eq 5:
√
(Eq 5)

As of an apolar liquid is zero, when the
and of a solid are known, its can be
calculated using (Eq 6):
(Eq 6)
The cohesion work of the solid can be determined from the surface energy as per Eq 7:
(Eq 7)
3. Results and discussion
3.1. Extraction and characterisation of okra biopolymer
The extraction protocol outlined in Fig.1 resulted in the isolation of different grades of okra
biopolymer of varying purity (Table 2). It is reported that the temperature has a significant
impact on the quantity and quality of isolated okra biopolymer (Samavati, 2013) so
extraction of okra biopolymer from okra pods was performed at 70° C (± 2.5 °C). It was
noted that the crude, purified and bi-purified protocols produced 17.21, 12.25 and 9.44 g
(okra biopolymer (g) /100 g of dry okra pods), respectively, with yield decreasing as
expected with relative purity. For each grade (crude, purified and bi-purified), drying was
carried out at 40° C for 24 h and the powder remained visually homogeneous and without
any colour changes. Although all grades were subjected to similar drying conditions for
consistency, the water content of the products may therefore vary. Moreover it was evident
from the results that the total sugar content increased and protein content decreased with
relative purification steps (Table 2). The main components of okra biopolymer (i.e.
galactose, rhamnose, and galacturonic acid) were qualitatively identified in the FTIR spectra
for all the grades as shown in Fig. 2(a). A broad peak at 3280-3290 cm−1 in the spectrum,
indicating the presence of aromatic sugar groups with O–H as the main functional group,
was found in the three samples of okra biopolymer. O–H groups are able to bind with water
molecules and produce bound moisture within the polymer components. The existence of
O–H groups confirms the hydrophilic characteristics within the polysaccharide. The medium
peak that is visible at 2930-2942 cm−1 represents the C–H stretch that exists in galactose and
rhamnose. The major functional groups are typically in the region between 1000 and 2000
cm−1 of the FTIR spectra. The carbonyl bands at 1722 cm−1 and 1601-1614 cm−1 indicate the
esterified and free carboxyl groups, respectively. It is evident from Fig. 2a that, as the
purification of okra biopolymer increased, the intensity of esterified carbonyl band
enhanced attributing to higher esterification (Alba, Ritzoulis, Georgiadis, & Kontogiorgos,
2013; Nep, Sims, Morris, Kontogiorgos, & Smith, 2016). The identical small peak at 1415-
1416 cm−1 indicates a C–H bend which is a constituent of galactose and rhamnose. The
frequency of 1200–1000 cm−1 indicates C–O stretch bonds which are present in the aromatic
compounds of galactose, rhamnose and galacturonic acid. The methyl, carbonyl, and
hydroxyl functional groups that are present in the chemical structure of okra are
constituents of the carbohydrate molecule, which is the main backbone of the polymer.
More importantly it is clearly evident from Fig. 2a that the purification has no impact on the
FTIR spectra of various grades of okra biopolymer. The XRD spectra Fig. 2b confirmed that
the biopolymer consists of amorphous regions. The broad distribution that could be seen
from the X-ray diffraction spectrum indicates the amorphous nature of the polymer. FTIR
and XRD spectra of okra biopolymer confirm that the purification process has no effect on
the molecular structural arrangement of okra biopolymer in general.
3.2. Solubility studies
The saturated solubility of different okra biopolymer grades was carried out over a wide pH
range to investigate the impact of pH and purification on the solubility of okra biopolymer. It
can be noted that the purification has a marked impact on the solubility of okra biopolymer.
The crude grade has the lowest overall solubility at any given pH liquid followed by purified
and bi-purified okra biopolymer (Fig 3a). This might be due to the presence of different
small entities, depending on the pH, being produced during purification, thus impacting the
performance of solubility measurements. Non-polymeric materials usually dissolve
promptly, and the dissolution process is generally controlled by the external mass transfer
confrontation through a liquid layer adjacent to the solid–liquid interface (Miller-Chou &
Koenig, 2003). The solubility behaviour of okra biopolymer is complex in that solubility
increases with increasing pH, which is likely due to ionisation phenomena. However, above
pH 7.4, the solubility starts to reduce. An explanation is that at low pH (acidic conditions),
the network of okra biopolymer chains is retained in a collapsed state due to very minimal
ionisation of carboxyl groups (Berger, Reist, Mayer, Felt, Peppas, & Gurny, 2004), thus
corresponding to low solubility of okra biopolymer in low pH liquids. However, as the pH of
the liquid increases, the solubility of okra biopolymer increases until it reaches a maximum
solubility at pH 7.4. This can be attributed to the higher/complete ionisation of carboxyl
groups resulting in intra-ionic repulsion as the pH was increased further, the solubility falls
due to dissociation of ionic bonds within the polymer molecular conformation that can
potentially lead to breaching of their intact network (Berger et al., 2004; Kaur, Singh, & Brar,
2014).
3.3. Swelling and erosion studies

The swelling of a polymer is a function of rate and extent of chain relaxation. The rate of
polymer swelling is an important aspect in controlling drug release from hydrophilic
matrices. The swelling study of okra biopolymer matrices was primarily conducted to
understand the liquid uptake and polymer-liquid interactions. The matrix tablets made of
okra biopolymer (crude, purified or bi-purified) were immersed into the swelling liquids and
their response is shown in Fig. 3b, in terms of the weight increased due to sorption versus
time. The tactile and visual evaluation confirmed the development of a so-called gel on the
surface of the compact. Regardless of the type of okra biopolymer, all the matrices were
slippery to touch and swelling increased in the initial phase, however, it reduced in the later
phases of the swelling study.
It is also apparent that the purification and pH of the swelling media have a perceptible
impact on the liquid uptake behaviour. The swelling of crude okra biopolymer based matrix
tablets was lowest in acidic (pH 1.2) rather than alkaline media (pH 7.4), Fig. 3b. It can also
be seen that the bi-purified okra biopolymer matrices have a higher extent of swelling than
other okra biopolymer grades, irrespective of swelling media.
Moreover, it can be hypothesised that the swelling behaviour of biopolymer based matrices,
such as those observed in this study, occurs as a result of osmotic stress exerted at the
moving front located between the dry glassy core and the outer gel layer. There are two
transport processes, namely solvent diffusion and chain disentanglement involved in liquid
imbibition into the matrix tablets, when it is in contact with a thermodynamically
compatible liquid, the liquid will diffuse into the okra polymer chains. Due to plasticization
of the polymer by the solvent, a gel-like swollen layer is formed (Ghori, 2014; Ghori &
Conway, 2015). The swelling data was analysed using the Vergnaud liquid uptake

mathematical model (Vergnaud, 1993) to determine the rate and mechanism of swelling.
The generalised form of Vergnaud model used is shown in Eq. 8
(Eq 8)
Where,
M = the amount of liquid transferred
t = time
K = the swelling constant.
n = exponent indicating the mechanism of water uptake.
It is reported that a value of n < 0.5 is indicative of a diffusion-controlled mechanism in
which the rate of diffusion is much slower than the rate of polymer hydration in a matrix
tablet. However, when n = 1, water diffuses through the matrix at a constant velocity, with
an advancing liquid front marking the limit of liquid penetration into the matrix. A value of
0.45 < n < 1 indicates an anomalous behaviour in which diffusion of liquid and polymer
hydration are of similar magnitude (Ebube et al., 1997). The Vergnaud swelling kinetics
parameters, enlisted in Table 3, depend on the porosity and the diffusivity of water in the
matrix and are an indicator of polymer hydration. In general, the R2 values were in the
range of 0.986-0.999, which indicate that the data can be well described by this model. Bi-
purified matrices have the highest swelling rate (Kw) 13.16 % min-1 and 9.59 % min-1 in pH
7.4 and pH 1.2 liquid media, respectively. Additionally, the crude okra biopolymer matrices
have lowest Kw (3.16 % min-1 and 1.64 % min-1 in pH 7.4 and pH 1.2 liquid media,
respectively). Thus purification has a significant impact on the swelling kinetics of matrices,
moreover, the porosity of the matrices was also reduced from 30.2 % (crude biopolymer
matrix tablet) to 18.5 % (bi-purified biopolymer matrix tablet) with an increasing level of

purification (Table 3). The correlation between porosity and swelling rate revealed that,
with decreased porosity, the swelling rate has increased which might be attributed to the
higher osmotic stress within the compact (Table 3), (Wise, 2000). As the bi-purified okra
biopolymer has higher solubility, it can be hypothesised that the more soluble okra
biopolymer matrices tend to develop micro-cavities influencing the osmotic stress and
tortuosity of the matrix network, leading to a higher degree of swelling.
The swelling mechanism can be inferred from the swelling exponent (n), Table 3. According
to the criteria laid out by Ebube et al., (1997), the purified matrix tablets exhibited diffusion
controlled swelling where the rate of polymer relaxation is greater than the rate of liquid
penetration into the polymer matrix network. However, all the other grades of okra polymer
showed anomalous swelling behaviour in which the rate of water diffusion and polymer
relaxation are of similar magnitude. The diffusion-oriented and increased rate of swelling in
alkaline pH media can be attributed to ionisation of the carboxyl group within the okra
biopolymer (Berger, Reist, Mayer, Felt, Peppas, & Gurny, 2004). Moreover, the ionisation of
these groups increases the permeability of water molecules in the polymer network and the
development of ionic bonds incorporating water molecules (Khare & Peppas, 1995). A
schematic representation of this theory is illustrated in Fig. 4.
Once the hydrophilic matrices are hydrated, a gel layer develops along with two separate
interfaces, one between the glassy polymer and gel layer and the other between the gel
layer and the solvent. After an induction period, the polymer starts to dissolve, which is
usually termed matrix erosion (Ghori, Ginting, Smith, & Conway, 2014). The erosion studies
were carried out on all types of okra biopolymer matrices, in two different liquid media (pH
1.2 and pH 7.4) and the results are depicted in Fig. 3c. In due course, after the swelling

phase, the hydrophilic polymer-based matrices underwent matrix erosion. The rate of
polymer erosion was determined using the data in Fig. 3c and the erosion kinetics
parameters are enlisted in Table 3, with R2 in the range of 0.958-0.988.The crude okra
biopolymer matrices exhibited the fastest erosion rate ((KE) 0.204 % min-1 and 0.265 % min-1
in pH 1.2 and pH 7.4 media, respectively). However, the bi-purified biopolymer based
matrices has the slowest erosion [pH 1.2 (0.125 % min-1) and pH 7.4 (0.145 % min-1)]. Fig. 3d
shows a good correlation between matrix swelling and erosion, and indicates that higher
swelling leads to low erosion. One explanation for this is a greater entanglement of polymer
chains on the surface of matrix tablet in the purified grade and it is evident from Fig. 3d that
the purification process has a marked effect on the relationship. Swelling of okra biopolymer
matrices occurs when hydrogen bonds and ionic bonds maintain the integrity of the
hydrophilic polysaccharide matrix during the course of connection with the liquid.
Therefore, for any given material, when the hydrogen bonds are weak in any given media,
matrix erosion may prevail. Moreover, it can be noticed that the porosity of bi-purified
matrices is lower than that of the other matrices. Therefore, the higher degree of swelling
(Fig. 3b, Table 3), higher sugar content, low porosity and possibly molecular weight
alteration are intuitively expected to be associated with stronger gel layer development that
decisively controls the erosion of okra polymer chains.
Thus, it is apparent that the purification has a noticeable impact on the swelling and erosion
kinetics of okra biopolymer matrices and this can be used as supportive information during,
for example, the developmental phase of scaffolds for tissue engineering, drug or food
based emulsions, oromucosal and nasal formulations. Additionally, specific grades of okra
biopolymer with explicit swelling and erosion rate can be selected to develop controlled
release pharmaceutical dosage forms.
3.4. Surface texture, contact angle and energetics studies
The values of three dimensional root mean square roughness (Sq) of okra biopolymer based
matrix tablets were determined using atomic force microscopy. The 3D AFM images of
matrix tablet surfaces can be seen in Fig. 5 (a-c). It can be seen that the purification has a
noticeable effect on Sq. The matrices have lowest Sq (61.01 ± 5.44 nm) and highest Sq
(358.1 ± 11.23 nm) for bi-purified and crude okra biopolymer matrices, respectively (Table
4) Moreover, it is apparent from the AFM findings that the average Sq of all the matrices
was in the acceptable threshold confirming their good compressibility aptitude (Narayan &
Hancock , 2003). Fig. 5d (1&2) shows the relationship between Sq, KW and KE, respectively. It
is evident from the graphs that, with increased roughness, swelling rate is decreased and
conversely the KE values increase. Moreover, it is also apparent from Fig. 5e that with a
reduction in porosity (crude > purified > bi-purified), the Sq is also reduced.
Fig. 6a shows the contact angle profile of okra biopolymers with water as the testing liquid.
It was found that the contact angle of bi-purified matrix tablet was lower than other
matrices. The water contact angle exponentially decreased as a function of time for all
tested matrices. However, the diiodomethane contact angle showed a minor initial increase
and then it became constant as a function of time (Fig. 6b). During the experiments with
water as a test liquid, it was observed that drops placed on the bi-purified biopolymer
matrices were immediately taken up by the compacts in accordance with its swelling
behaviour. This may be due potentially lower moisture content (surface and in-bound) as
the drying procedure may not produce consistent content across the grades. Moreover, this

may also be attributed to altered particle size distribution due to compression pressure.
However, diiodomethane does not penetrate into the compact surface as quickly as water.
These different responses of the compacts towards the liquid droplets reflect their
hydrophilic nature and wettability. The wettability of the compact surface can be inferred
using the contact angle criteria (Yuan & Lee, 2013). The wettability trend was crude <
purified < bi-purified. Fig. 6c shows the calculated surface energy values of these matrices. A
general decline in specific energy and surge in dispersive and total energy is evident with
increasing sample purity therefore, it can be established that the purification can affect the
surface energetics of the of okra biopolymer. Fig. 6d shows the work of cohesion (Wc, mJ.m-
2) of okra biopolymer matrices. According to Dupré, Wc is the work done per unit area
produced in dividing a homogeneous liquid. The Wc specifies the work which must be
expended to produce droplets from a volume of liquid when applied on the sample surface
(Dupré & Dupré, 1869). When a liquid phase comes into contact with a second liquid or solid
phase, the tendency to spread (complete wetting) is given by the ratio between the Wc per
phase. It is apparent from the results, Fig. 6d, that the crude biopolymer based matrices
have higher Wc while the bi-purified biopolymer based matrices have the lowest. The
contact angle and surface energetics show that the purification of okra biopolymer has a
measurable effect on the wettability and surface energetics of matrices. Moreover, these
findings corroborate results from solubility studies. The most likely cause is the variation in
the chemical composition of okra biopolymer, as the more purified samples have higher
sugar content and are assumed to be more hydrophilic. Also, different distributions of
ionisation sites within the okra polymer chains may impact the conformation of biopolymer
chains on the surface of compact.
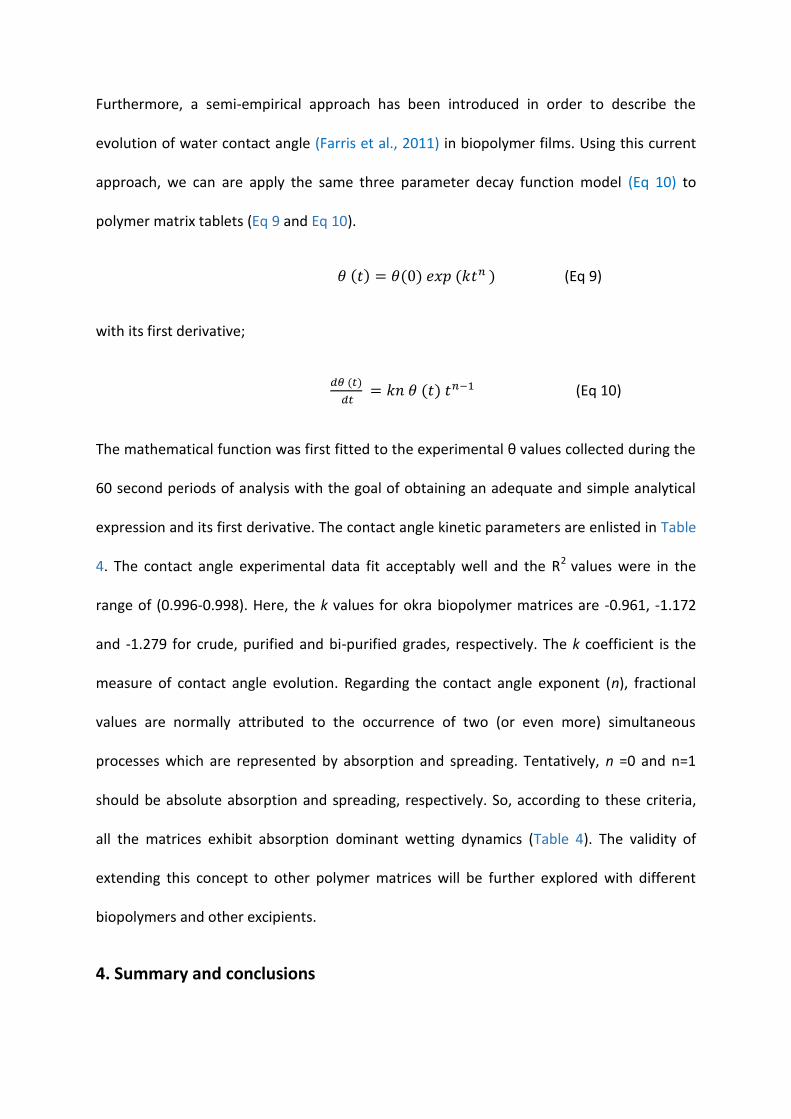
Furthermore, a semi-empirical approach has been introduced in order to describe the
evolution of water contact angle (Farris et al., 2011) in biopolymer films. Using this current
approach, we can are apply the same three parameter decay function model (Eq 10) to
polymer matrix tablets (Eq 9 and Eq 10).
(Eq 9)
with its first derivative;
(Eq 10)
The mathematical function was first fitted to the experimental θ values collected during the
60 second periods of analysis with the goal of obtaining an adequate and simple analytical
expression and its first derivative. The contact angle kinetic parameters are enlisted in Table
4. The contact angle experimental data fit acceptably well and the R2 values were in the
range of (0.996-0.998). Here, the k values for okra biopolymer matrices are -0.961, -1.172
and -1.279 for crude, purified and bi-purified grades, respectively. The k coefficient is the
measure of contact angle evolution. Regarding the contact angle exponent (n), fractional
values are normally attributed to the occurrence of two (or even more) simultaneous
processes which are represented by absorption and spreading. Tentatively, n =0 and n=1
should be absolute absorption and spreading, respectively. So, according to these criteria,
all the matrices exhibit absorption dominant wetting dynamics (Table 4). The validity of
extending this concept to other polymer matrices will be further explored with different
biopolymers and other excipients.
4. Summary and conclusions
The present study has shown that the purification processes led to a reduction in the
protein; however the overall sugar content was increased with additional steps.
Importantly, none of the purification processes was able to completely remove the protein
contents. Therefore, it can be assumed that some protein fractions might be an integral part
of the molecular structure of okra biopolymer. FTIR and XRD spectra of okra biopolymer
confirmed that the purification process has no effect on the molecular structural
arrangement of okra biopolymer, hence, confirming the suitability of extraction and
purification protocol.
The different grades of okra behaved in a discrete way with respect to the surface
interaction with liquid. They demonstrated different wetting kinetics and surface energetic
properties as indicated by the contact angle analysis. The experimental confirmation herein
suggests that the wetting trend was governed by the solid/liquid interface, namely,
absorption which impacts the overall wetting dynamics.
The relative purity impacted solubility, and swelling and erosion behaviour of okra-based
tablet matrices. The solubility and Kw were increased; however, KE was reduced in any given
liquid media. Information from the swelling and erosion studies provides understanding of
the fundamental solvation behaviour of biopolymers and these findings will be helpful in the
development and optimisation of end products. A deeper understanding of changes of
protein fractions for different grades of refined okra might be a helpful next step.
AFM-based 3D surface texture analysis showed that bi-purified okra biopolymer has a
smoother surface. Moreover, with the reduction in surface roughness, the swelling and
surface energy was increased and the matrix erosion and porosity were reduced.
Hence, on the basis of these findings, it can be concluded that the present extraction and
purification protocol of okra can be adopted to develop a plant-derived biopolymer having
an acceptable level of purity. As the purification method can influence the way the
biopolymer functions, thus specific needs for the formulation must be considered. More
importantly, it is instinctively expected that the same can be true for analogous plant-
derived polysaccharide biopolymers.
Acknowledgements
The authors acknowledge the financial support provided by the University of Huddersfield,
Huddersfield, UK.
References
Adão, M. H. V. C., Saramago, B. J. V., & Fernandes, A. C. (1999). Estimation of the surface
properties of styrene-acrylonitrile random copolymers from contact angle
measurements. Journal of Colloid and Interface Science, 217(1), 94-106.
Alba, K., Laws, A. P., & Kontogiorgos, V. (2015). Isolation and characterization of acetylated
LM-pectins extracted from okra pods. Food Hydrocolloids, 43, 726-735.
Alba, K., Ritzoulis, C., Georgiadis, N., & Kontogiorgos, V. (2013). Okra extracts as emulsifiers
for acidic emulsions. Food Research International, 54(2), 1730-1737.
Amid, B. T., & Mirhosseini, H. (2012). Effect of different purification techniques on the
characteristics of heteropolysaccharide-protein biopolymer from durian (Durio
zibethinus) seed. Molecules, 17(9), 10875-10892.
Berger, J., Reist, M., Mayer, J. M., Felt, O., Peppas, N., & Gurny, R. (2004). Structure and
interactions in covalently and ionically crosslinked chitosan hydrogels for biomedical
applications. European Journal of Pharmaceutics and Biopharmaceutics, 57(1), 19-34.

Blunt, L., & Jiang, X. (2003). Advanced techniques for assessment surface topography:
development of a basis for 3D surface texture standards" SURFSTAND": Kogan Page
Science.
Bradford, M. M. (1976). A rapid and sensitive method for the quantitation of microgram
quantities of protein utilizing the principle of protein-dye binding. Analytical
Biochemistry, 72(1-2), 248-254.
Beneke, C. E., Viljoen, A. M., & Hamman, J. H. (2009). Polymeric plant-derived excipients in
drug delivery. Molecules, 14(7), 2602-2620.
Correia, N. T., Ramos, J. J. M., Saramago, B. J., & Calado, J. C. (1997). Estimation of the
surface tension of a solid: application to a liquid crystalline polymer. Journal of
Colloid and Interface Science, 189(2), 361-369.
Crompton, T. R., (2006). Polymer Reference Book: Rapra Technology Limited.
De Vos, P., De Haan, B., Wolters, G., Strubbe, J., & Van Schilfgaarde, R. (1997). Improved
biocompatibility but limited graft survival after purification of alginate for
microencapsulation of pancreatic islets. Diabetologia, 40(3), 262-270.
Dimopoulou, M., Ritzoulis, C., Papastergiadis, E. S., & Panayiotou, C. (2014). Composite
materials based on okra hydrocolloids and hydroxyapatite. Food Hydrocolloids, 42,
348-354.
Dubois, M., Gilles, K. A., Hamilton, J. K., Rebers, P., & Smith, F. (1956). Colorimetric method
for determination of sugars and related substances. Analytical Chemistry, 28(3), 350-
356.
Dupré, A., & Dupré, P. (1869). Théorie mécanique de la chaleur: Gauthier-Villars.
Dusseault, J., Tam, S. K., Ménard, M., Polizu, S., Jourdan, G., Yahia, L. H., & Hallé, J. P. (2006).
Evaluation of alginate purification methods: effect on polyphenol, endotoxin, and
protein contamination. Journal of Biomedical Materials Research Part A, 76(2), 243-
251.
Ebube, N. K., Hikal, A. H., Wyandt, C. M., Beer, D. C., Miller, L. G., & Jones, A. B. (1997).
Sustained release of acetaminophen from heterogeneous matrix tablets: Influence of
polymer ratio, polymer loading, and co-active on drug release. Pharmaceutical
Development and Technology, 2(2), 161-170.
Erbil, H. Y., Yasar, B., Süzer, S., & Baysal, B. M. (1997). Surface characterization of the
hydroxy-terminated poly (ε-caprolactone)/poly (dimethylsiloxane) triblock

copolymers by electron spectroscopy for chemical analysis and contact angle
measurements. Langmuir, 13(20), 5484-5493.
Farris, S., Introzzi, L., Biagioni, P., Holz, T., Schiraldi, A., & Piergiovanni, L. (2011). Wetting of
biopolymer coatings: contact angle kinetics and image analysis investigation.
Langmuir, 27(12), 7563-7574.
Fowkes, F. M. (1964). Attractive forces at interfaces. Industrial & Engineering Chemistry,
56(12), 40-52.
Ghori, M. U. (2014). Release kinetics, compaction and electrostatic properties of hydrophilic
matrices. PhD Thesis, University of Huddersfield.
Ghori, M. U., Alba, K., Smith, A. M., Conway, B. R., & Kontogiorgos, V. (2014). Okra extracts
in pharmaceutical and food applications. Food Hydrocolloids, 42, 342-347.
Ghori, M. U., & Conway, B. R. (2015). Hydrophilic matrices for oral control drug delivery.
American Journal of Pharmacological Sciences, 3(5), 103-109.
Ghori, M. U., Ginting, G., Smith, A. M., & Conway, B. R. (2014). Simultaneous quantification
of drug release and erosion from hypromellose hydrophilic matrices. International
Journal of Pharmaceutics, 465(1), 405-412.
Ghori, M. U., Green, C., Smith, A. M., & Conway, B. R. (2013). Okra biopolymer as
pharmaceutical excipient. In 1st UK Hydrocolloid Conference.
Hamman, H., Steenekamp, J., & Hamman, J. (2015). Use of natural gums and mucilages as
pharmaceutical excipients. Current Pharmaceutical Design, 21(33), 4775-4797.
Ho, C. C., & Khew, M. C. (2000). Surface free energy analysis of natural and modified natural
rubber latex films by contact angle method. Langmuir, 16(3), 1407-1414.
John, M. J., & Thomas, S., (2012). Natural Polymers: Composites: Royal Society of Chemistry.
Kaur, G., Singh, D., & Brar, V. (2014). Bioadhesive okra polymer based buccal patches as
platform for controlled drug delivery. International Journal of Biological
Macromolecules, 70, 408-419.
Khare, A. R., & Peppas, N. A. (1995). Swelling/deswelling of anionic copolymer gels.
Biomaterials, 16(7), 559-567.
Kontogiorgos, V., Margelou, I., Georgiadis, N., & Ritzoulis, C. (2012). Rheological
characterization of okra pectins. Food Hydrocolloids, 29(2), 356-362.

Lai, H., & Chen, Q. (2012). Bioprocessing of plant-derived virus-like particles of Norwalk virus
capsid protein under current Good Manufacture Practice regulations. Plant Cell
Reports, 31(3), 573-584.
Li, J., Shin, G. H., Lee, I. W., Chen, X., & Park, H. J. (2016). Soluble starch formulated
nanocomposite increases water solubility and stability of curcumin. Food
Hydrocolloids, 56, 41-49.
Luner, P. E., & Oh, E. (2001). Characterization of the surface free energy of cellulose ether
films. Colloids and Surfaces A: Physicochemical and Engineering Aspects, 181(1), 31-
48.
Mandala, I. G., & Bayas, E. (2004). Xanthan effect on swelling, solubility and viscosity of
wheat starch dispersions. Food Hydrocolloids, 18(2), 191-201.
Miller-Chou, B. A., & Koenig, J. L. (2003). A review of polymer dissolution. Progress in
Polymer Science, 28(8), 1223-1270.
Narasimhan, B. (2001). Mathematical models describing polymer dissolution: consequences
for drug delivery. Advanced Drug Delivery Reviews, 48(2), 195-210.
Narayan, P., & Hancock, B. C. (2003). The relationship between the particle properties,
mechanical behavior, and surface roughness of some pharmaceutical excipient
compacts. Materials Science and Engineering: A, 355(1), 24-36.
Nep, E., Asare-Addo, K., Ghori, M., Conway, B., & Smith, A. M. (2015). Starch-free grewia
gum matrices: Compaction, swelling, erosion and drug release behaviour.
International Journal of Pharmaceutics, 496(2), 689-698.
Nep, E., Ghori, M. U., Ngwuluka, N., Conway, B. R., & Smith, A. (2014). physicochemical
characterization of polysaccharides extracted from sesame leaves: a potential matrix
for sustained release tablets. In The AAPS Annual Meeting and Exposition.
Nep, E. I., Sims, I. M., Morris, G. A., Kontogiorgos, V., & Smith, A. M. (2016). Evaluation of
some important physicochemical properties of starch free grewia gum. Food
Hydrocolloids, 53, 134-140.
Ogaji, I., & Nnoli, O. (2010). Film coating potential of Okra biopolymer using paracetamol
tablets as a model drug. Asian Journal of Pharmaceutics, 4(2), 130.
Qi, Y., Lu, L., Zhou, C., & Luo, B. (2009). Purification of alginate for tissue engineering. In
Bioinformatics and Biomedical Engineering, 2009. ICBBE 2009. 3rd International

Conference on Bioinformatics and Biomedical Engineering, pp. 1-4: Institute of
Electrical and Electronics Engineers (IEEE).
Reis, R. L., Neves, N. M., Mano, J. F., Gomes, M. E., Marques, A. P., & Azevedo, H. S. (2008).
Natural-Based Polymers for Biomedical Applications, Woodhead Publishing Series in
Biomaterials.
Samavati, V. (2013). Polysaccharide extraction from Abelmoschus esculentus: Optimization
by response surface methodology. Carbohydrate Polymers, 95(1), 588-597.
Saurí, J., Suñé-Negre, J. M., Díaz-Marcos, J., Vilana, J., Millán, D., Ticó, J. R., Miñarro, M.,
Pérez-Lozano, P. & García-Montoya, E. (2015). Relationships between surface free
energy, surface texture parameters and controlled drug release in hydrophilic
matrices. International Journal of Pharmaceutics, 478(1), 328-340.
Sharma, A., & Gupta, M. (2002). Three phase partitioning of carbohydrate polymers:
separation and purification of alginates. Carbohydrate Polymers, 48(4), 391-395.
Shen, W., Sheng, Y. J., & Parker, I. H. (1999). Comparison of the surface energetics data of
eucalypt fibers and some polymers obtained by contact angle and inverse gas
chromatography methods. Journal of Adhesion Science and Technology, 13(8), 887-
901.
Thakur, V. K., & Voicu, S. I. (2016). Recent advances in cellulose and chitosan based
membranes for water purification: A concise review. Carbohydrate Polymers, 146, 148-165.
Vergnaud, J. M. (1993). Liquid transport controlled release processes in polymeric materials:
Applications to oral dosage forms. International Journal of Pharmaceutics, 90(2), 89-
94.
Vidal-Serp, D. S., & Wandrey, C. (2005). Purification of natural anionic polymers. Minerva
Biotecnologica, 17(4), 215-229.
Wise, D. L. (2000). Handbook of Pharmaceutical Controlled Release Technology: Taylor &
Francis.
Wu, S. (1971). Calculation of interfacial tension in polymer systems. In Journal of Polymer
Science Part C: Polymer Symposia, vol. 34 (pp. 19-30): Wiley Online Library.
Wu, S. (1973). Polar and nonpolar interactions in adhesion. The Journal of Adhesion, 5(1),
39-55.

Yuan, Y., & Lee, T. R. (2013). Contact angle and wetting properties. In Surface Science
Techniques, (pp. 3-34): Springer.
Zajic, L., & Buckton, G. (1990). The use of surface energy values to predict optimum binder
selection for granulations. International Journal of Pharmaceutics, 59(2), 155-164.
List of Figures;
Fig. 1, Extraction protocol for okra biopolymer.
Fig. 2, (a) Fourier transform-infrared (FT-IR) and (b) X-ray diffraction (XRD) spectra of crude, purified and bi-purified okra biopolymer.
Fig. 3, (a) pH solubility profiles, (b) swelling, (c) matrix erosion (d) inter-relationship of swelling and erosion profiles of okra biopolymer based matrices.
Fig. 4, Schematic illustration of okra biopolymer matrix tablet swelling process with respect
to acidic and alkaline pH.
Fig. 5, Surface topography of (a) crude, (b) purified, (c) bi-purified and inter-relationship between surface roughness and swelling, and erosion of okra biopolymer matrices.
Fig. 6, Contact angle with (a) water, (b) diiodomethane, (c) surface energy and (d) work of
cohesion profiles for okra biopolymer matrices.
List of Tables;
Table 1. Total ( ), dispersive ( ) and specific (
) surface free energy of water and diiodomethane (Wu, 1971; Zajic & Buckton, 1990).
Table 2, Chemical composition of crude, purified and bi-purified okra biopolymer (standard deviations are in parentheses).
Table 3, Swelling, erosion kinetics, true density and porosity of matrix tablets
Table 4. Surface roughness and contact angle kinetic parameters

Fig. 1, Extraction and solubility protocol for okra biopolymer.

Fig. 2, (a) Fourier transform-infrared (FT-IR) and (b) X-ray diffraction (XRD) spectra of crude, purified and bi-purified okra
biopolymer.
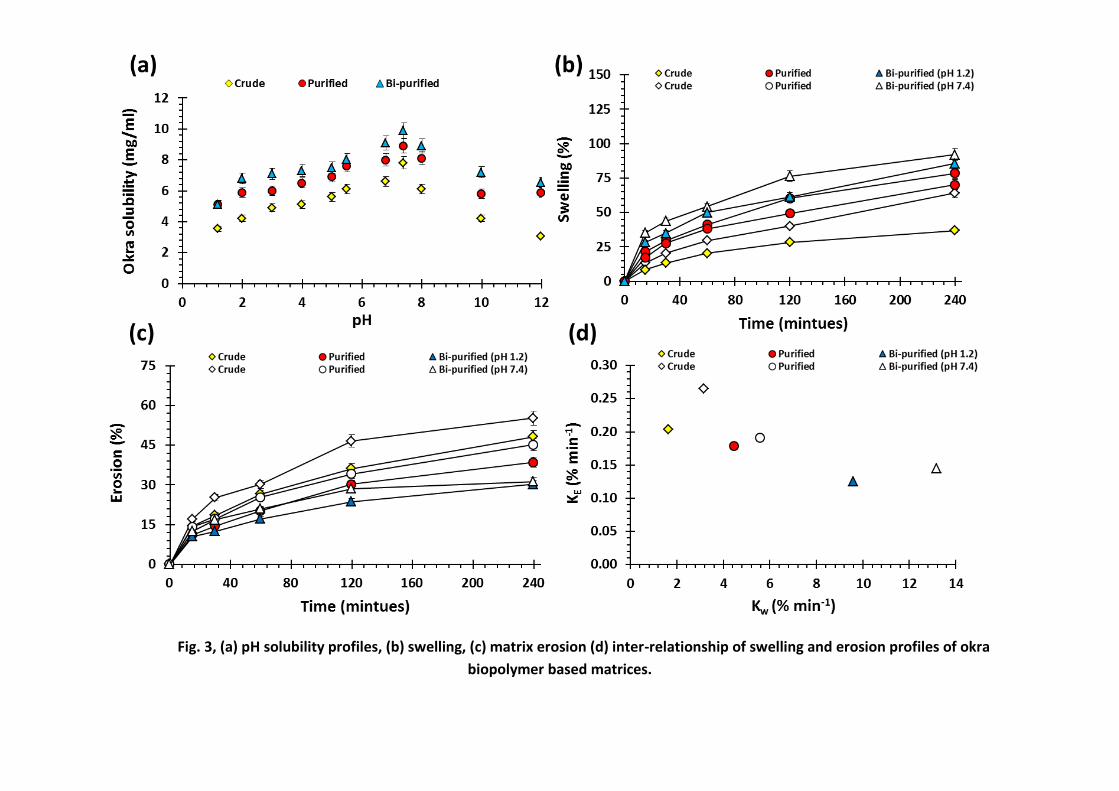
Fig. 3, (a) pH solubility profiles, (b) swelling, (c) matrix erosion (d) inter-relationship of swelling and erosion profiles of okra
biopolymer based matrices.

Fig. 4, Schematic illustration of okra biopolymer matrix tablet swelling process with respect to acidic and alkaline pH.

Fig. 5, Surface topography of (a) crude, (b) purified, (c) bi-purified and inter-relationship between surface roughness and swelling,
and erosion of okra biopolymer matrices.

34
1
2
3
4
5
6
7
8
9
10
11
12
13
14
15
16
Fig. 6, Contact angle with (a) water, (b) diiodomethane, (c) surface energy and (d) work of cohesion profiles of okra biopolymer matrices. 17
18

35
19
Table 1, Total ( ), dispersive ( ) and specific (
) surface free energy of water and diiodomethane (Zajic and Buckton, 1990; Wu, 1971) . 20
21
Liquid (mJ/m2) (mJ/m2)
(mJ/m2)
Water 72.8 21.8 51.0
Diiodomethane 50.4 50.4 0.0 22
23
24
25
26
27
28
29
30
31
32
33
34

36
35
36
37
38
39
40
41
42
43
44
45
46
47
Table 2, Chemical composition of crude, purified and bi-purified okra gum (standard deviations are in parenthesis) 48
Okra gum grade Total sugars
(%)
Protein content
(%)
Yield
(g /100g okra pods)

37
49 Crude 68.55 (2.51) 7.14 (0.37) 17.21 (1.12)
Purified 77.33 (3.75) 5.55 ( 1.02) 12.25 (1.55)
Bi-purified 88.12 (3.41) 4.67 (0.51) 9.44 (0.87)

38
50
51
Table 3, Swelling and erosion kinetics, true density and porosity of matrix tablets 52
a Swelling rate (% 53 min
-1),
b Swelling
exponent, c Erosion 54 rate (% min
-1 ),
d
True density, e
55 Porosity
56
57
58
59
60
61
62
63
64
65
66
67
68
Okra gum
matrices
pH of
media
Swelling kinetics
parameters
Matrix erosion
parameters
(gcm-3) d
(%) e KWa nb R2 KE
c R2
Crude 1.2 1.64 0.594 0.993 0.204 0.982 1.61 ± 0.01 30.2 ± 3.1
7.4 3.16 0.530 0.995 0.265 0.980
Purified 1.2 4.45 0.501 0.980 0.179 0.997 1.52 ± 0.02 24.7 ± 1.2
7.4 5.58 0.496 0.999 0.191 0.981
Bi-purified 1.2 9.59 0.387 0.989 0.125 0.992 1.56 ± 0.01 18.5 ± 2.7
7.4 13.16 0.367 0.986 0.145 0.978

39
69
70
71
72
Table 4, Surface roughness and contact angle kinetic parameters 73
74
75
76
77
78
79
80
81
82
Okra gum Sq (nm) Contact angle kinetics parameters
θ k n R2
Crude 358.1 (11.23) 202.85 -0.961 0.143 0.996
Purified 226.5 (8.24) 223.95 -1.172 0.141 0.997
Bi-purified 61.01 (5.44) 225.67 -1.279 0.140 0.998