Impact of Potential Changes to the Treatment of ... · Milliman Client Report 15800 Bluemound Road...
41
January 31, 2019 Milliman Client Report 15800 Bluemound Road Suite 100 Brookfield, WI 53005 USA Tel +1 262 784 2250 Fax +1 262 923 3680 milliman.com Impact of Potential Changes to the Treatment of Manufacturer Rebates Prepared for: The Assistant Secretary for Planning and Evaluation U.S. Department of Health and Human Services Prepared by: Milliman, Inc. Jake Klaisner, FSA, MAAA Actuary Katie Holcomb, FSA, MAAA Consulting Actuary Troy Filipek, FSA, MAAA Principal and Consulting Actuary
Transcript of Impact of Potential Changes to the Treatment of ... · Milliman Client Report 15800 Bluemound Road...
January 31, 2019
Milliman Client Report
15800 Bluemound Road
Suite 100
Brookfield, WI 53005
USA
Tel +1 262 784 2250
Fax +1 262 923 3680
milliman.com
Impact of Potential Changes to the Treatment of Manufacturer Rebates
Prepared for: The Assistant Secretary for Planning and Evaluation U.S. Department of Health and Human Services
Prepared by:
Milliman, Inc.
Jake Klaisner, FSA, MAAA
Actuary
Katie Holcomb, FSA, MAAA
Consulting Actuary
Troy Filipek, FSA, MAAA
Principal and Consulting Actuary

Milliman Client Report
U.S. Department of Health and Human Services
Impact of Potential Changes to the Treatment of Manufacturer Rebates January 31, 2019
TABLE OF CONTENTS
I. EXECUTIVE SUMMARY ........................................................................................................................ 1
II. BACKGROUND ..................................................................................................................................... 3
III. RESULTS ............................................................................................................................................... 7
IV. CONSIDERATIONS ............................................................................................................................. 18
V. METHODOLOGY AND ASSUMPTIONS ............................................................................................. 27
VI. CAVEATS, LIMITATIONS, AND QUALIFICATIONS .......................................................................... 28
APPENDIX A1 – Annual Dollar Impact of Removing Manufacturer Rebates (Billions of Dollars) APPENDIX A2 – Dollar Impact of Removing Manufacturer Rebates (PMPM) APPENDIX B1 – Projected Annual Costs After Removing Manufacturer Rebates (Billions of Dollars) APPENDIX B2 – Projected Costs After Removing Manufacturer Rebates (PMPM) APPENDIX C – Annual Percentage Cost Impact of Removing Manufacturer Rebates

Milliman Client Report
U.S. Department of Health and Human Services Page 1
Impact of Potential Changes to the Treatment of Manufacturer Rebates January 31, 2019
I. EXECUTIVE SUMMARY The Assistant Secretary for Planning and Evaluation (ASPE) for the US Department of Health and Human Services (HHS) requested that Milliman analyze how the U.S. healthcare market would be impacted by potential regulatory changes disallowing manufacturer rebates in their current form. This report analyzes the impact of this potential change, with focus on the impact to stakeholders in the Medicare Part D program. Currently, all Medicare Part D rebates are protected by safe harbor regulations under the federal Anti-Kickback Statute, which otherwise prohibit payments in exchange for services under a federal healthcare program. If this safe harbor protection is altered to no longer encompass manufacturer rebates, these rebates could be completely prohibited under Medicare Part D. In this report, we examine the impact of removing manufacturer rebates from the Medicare Part D program and replacing them with a price concession producing a correspondingly lower point-of-sale (POS) price. This report does not analyze the impact of any potential changes to pharmacy rebates, which are a different form of rebates common in Part D. We looked at this impact for a status quo scenario (holding all other assumptions constant), as well as layering in potential behavioral changes by plan sponsors, members, and pharmaceutical manufacturers (e.g., tighter formularies, changes to price concessions, changes in utilization). Table 1 below shows the 10 year estimated impact between 2020 and 2029 to member, government, and manufacturer costs in billions of dollars under varying behavior change scenarios, assuming the changes first took place in 2020. While several scenarios are presented, we do not intend to imply that any one outcome is more likely than another. For example, scenarios that may decrease costs are not necessarily more likely than scenarios that may increase costs.
Table 1 ASPE
Impact of Removing Safe Harbor Protections for Manufacturer Rebates 2020 to 2029 (Billions of Dollars)
Scenario
Member Cost
Sharing Member Premium
Total Member Costs* NAR NADS LICS LIPS
Total Gov’t
Costs* CGDP
Total Program Costs*
No Behavioral Changes -$40.8 $26.4 -$14.5 -$103.1 $215.4 -$89.5 $12.0 $34.8 -$20.6 $0
Increased Formulary Controls
-64.6 8.4 -56.2 -139.1 174.7 -118.3 3.8 -78.8 -29.5 -164.6
Increased Formulary Controls and Increased Price Concessions
-63.5 4.0 -59.5 -163.2 180.3 -118.5 1.9 -99.6 -29.1 -188.2
Reduced Price Concessions
-32.6 44.9 12.3 -30.2 221.1 -71.4 20.5 139.9 -17.1 135.1
Decreased Brand Price Trends
-46.5 13.3 -33.1 -154.6 211.4 -101.3 6.1 -38.4 -22.8 -94.3
Increased Brand Use and Decreased Brand Price Trends
-42.7 16.7 -26.0 -143.8 214.8 -101.3 7.6 -22.7 -21.2 -69.9
Increased Pharmacy Rebates
-40.8 22.8 -18.1 -110.2 207.1 -89.5 10.4 17.8 -20.6 -20.9
*Totals may not sum to individual components due to rounding.
The appendices at the end of this report provide further details on the total projected costs and relative impacts in each year from 2020 to 2029. We estimate stakeholders could be affected as follows:
Members have overall cost savings on average, driven by lower cost sharing, partially offset by higher premiums. With that said, the distribution of savings is not uniform, and individual members will be impacted differently depending on their pharmacy spend levels and other characteristics.

Milliman Client Report
U.S. Department of Health and Human Services Page 2
Impact of Potential Changes to the Treatment of Manufacturer Rebates January 31, 2019
For example, members not taking any products with rebates may have no change to cost sharing, but would see an increase in premiums, though depending on changes to benefit designs, these members may also have savings.
The government could have cost increases, excluding the impact of any behavioral changes. However, we believe it is unlikely for there to be no behavioral changes. With plan bid amounts and member premiums increasing, stakeholders may make strategic behavior changes resulting in overall program savings (including government savings) over time.
Manufacturer claim liabilities through the coverage gap discount program (CGDP) would be lower.
Assuming no changes to total costs net of manufacturer rebates, this would produce overall savings for manufacturers. However, if plan sponsors push manufacturers for increased price concessions as a behavioral impact resulting from these policy changes, it could produce an increase in manufacturer costs. Note that our analysis focuses on the impact to manufacturers regarding their role in funding the Part D program through the CGDP. We did not model the net impact to manufacturers after accounting for changes in product sales and price concessions since it was outside of the scope the project timeline would allow.
The impact of potential behavioral changes could increase or decrease costs. We estimate increased formulary controls, higher price concessions, and lower price trends would all reduce overall program costs, including greater average member savings. The increase in government costs expected in the no behavioral change scenario now becomes a decrease in government costs. On the other hand, if price concessions are lower than their current values, total program costs would increase; government costs would increase by more and the increase in member premium could outweigh average savings for member cost sharing.
Milliman Client Report
U.S. Department of Health and Human Services Page 3
Impact of Potential Changes to the Treatment of Manufacturer Rebates January 31, 2019
II. BACKGROUND ASPE engaged Milliman to analyze how the U.S. healthcare market would be impacted by the removal of manufacturer rebates. In particular, we considered the impact to the Medicare Part D program if manufacturer rebates were completely eliminated and replaced with lower POS costs. We also examined the effect of potential behavioral changes that may occur as a result of this change. BACKGROUND ON MEDICARE PART D
Medicare Part D includes pharmacy coverage for Medicare-eligible beneficiaries who choose to enroll in one of two plan types individually or through their employer for retiree-based coverage:
Medicare Advantage Part D (MAPD) plans, which provide both medical and pharmacy coverage Stand-alone Prescription Drug Plans (PDPs), which provide only pharmacy coverage
The statutorily defined standard Part D benefit has multiple phases. Plan sponsors are allowed to vary their benefits (with some limitations), as long as the design results in the same or better value to the member, on average. The benefit phases and standard cost sharing for 2019 are as follows:
Deductible Phase: A $415 deductible during which members pay 100% of allowed claim costs.
Initial Coverage Phase: Members pay 25% of allowed claim costs with plan sponsors paying the remaining 75% until the initial coverage limit of $3,820 in total allowed costs is reached.
Coverage Gap Phase: In this phase, members pay 37% of generic costs and 25% of brand costs. As part of the Affordable Care Act (ACA), pharmaceutical manufacturers provide a discount for most brand medications filled by non-low income (NLI) members during the coverage gap phase. This is known as the Coverage Gap Discount Program (CGDP). As of 2019, the CGDP was increased from 50% to 70% as part of the Bipartisan Budget Act of 2018 (BBA). Plan sponsors pay 63% of generic costs and the remaining 5% of brand costs within this phase. Low income (LI) subsidy-eligible members are not eligible for the CGDP since they receive federal cost sharing subsidies in the coverage gap and all other phases of the benefit.
Catastrophic Phase: Once a member’s true out-of-pocket (TrOOP) spending reaches a catastrophic threshold ($5,100 in combined member and CGDP spending), they enter the final phase, known as the catastrophic or reinsurance phase. After this point, members pay roughly 5% coinsurance, plan sponsors pay approximately 15%, and the federal government pays the remaining 80% of claims costs as federal reinsurance.
In addition to varying the standard benefit parameters, plans may also offer enhanced coverage beyond the standard benefit (e.g., by reducing or eliminating the deductible, reducing cost sharing during the initial coverage phase, providing additional coverage in the coverage gap, and / or covering medications not typically covered by Part D). REBATES IN PART D Manufacturer and pharmacy rebates are negotiated by plan sponsors to help reduce net costs and in turn member premiums. Both manufacturer and pharmacy rebates are a form of direct and indirect remuneration (DIR), which is a payment occurring after the POS to help reduce the final price of a medication paid by the plan sponsor. Since rebates occur after the POS and are paid directly to the plan sponsor or pharmacy benefit manager (PBM), they only directly reduce costs for the plan sponsor and are not shared directly with members or other stakeholders at the POS. The plan sponsor shares a portion of rebates with the federal government, proportionate to the amount of claims paid by the government through reinsurance (we estimate this proportion to be about 35% in 2019, on average). The plan keeps the remainder of rebates and uses them to reduce premiums for all members. This is valuable to a plan sponsor since keeping premiums low is typically the primary tool for attracting individual Part D enrollment.

Milliman Client Report
U.S. Department of Health and Human Services Page 4
Impact of Potential Changes to the Treatment of Manufacturer Rebates January 31, 2019
Plans collect rebates during all phases of the Part D benefit, regardless of what the plan liability is in a given phase. Manufacturer rebates generally apply only to brand products (which tend to cost more than generic products) and as such, a large portion of rebates is associated with claims in the coverage gap and catastrophic phases. Plans retain a majority of the rebates collected during these phases, even though they are only responsible for paying a small portion of the POS claim costs. For example, in 2019, plans will pay 5% / 0% of brand claims in the gap for NLI / LI members, respectively, and approximately 15% of all claims in the catastrophic phase. This dynamic can create a misalignment of incentives between various stakeholders. The other primary form of DIR is price concessions associated with preferred pharmacy networks. In this case, a pharmacy pays a rebate to the plan sponsor in exchange for network status, which generally results in lower cost sharing at preferred pharmacy chains to encourage members to shop at those pharmacies. Just as with manufacturer rebates, the rebate paid by retail pharmacies is valuable to the plan because a majority of the rebate is used to help reduce member premiums. Pharmacy rebates are typically paid on generic and brand medications (unlike manufacturer rebates that tend to be brand only), and are typically contracted as either a flat fee per prescription or a percentage of POS costs. While pharmacy rebates are typically associated with preferred network pharmacies, some plans contract DIR arrangements with non-preferred pharmacies as well. This dynamic of rebates offering high value to plan sponsors has led to plans seeking more aggressive rebate contracts with both manufacturers and pharmacies in recent years. In particular, a plan sponsor may prefer a product with a high cost, since the manufacturer rebate is often contracted as a percentage of costs (i.e., the higher cost leads to a higher dollar value of rebate). Since a plan sponsor’s claim liability is relatively low in the coverage gap and catastrophic phases of the benefit, where a large portion of rebates are generated, the rebates can sometimes more than offset the claim costs for which the plan is responsible. This means a high-cost product can produce a lower (or even negative) net claim liability for the plan, which may make it the preferred option from the plan perspective, even if it is not the lowest cost medication when considering all stakeholder payments (i.e., measured as total costs net of rebates). PART D REBATE REFORM The Centers for Medicare and Medicaid Services (CMS) expressed concern regarding pharmacy DIR in early 2014, several years after the first preferred pharmacy networks in Part D emerged. CMS was concerned with pharmacy price concessions not being reflected at the POS, thus, not being shared with beneficiaries and affecting price transparency / competition. CMS proposed requiring all pharmacy price concessions be reflected at the POS, but after receiving comments on the proposed rule, ultimately scaled back the proposal to require price concessions at the POS “except contingent price concessions that cannot reasonably be determined at the point-of-sale.”1 As a result, many plans structured contracts such that some contingency existed, even if small or predictable, so that concessions could continue affecting premium when reflected as DIR rather than at the POS. More recently, there has been a great deal of public attention on the idea of reflecting all types of rebates, not just pharmacy rebates, at the POS. In November 2017, CMS issued a proposed rule including an RFI soliciting comments on the application of rebates at the POS. CMS proposed requiring plan sponsors to reflect a minimum percentage of manufacturer rebates and all pharmacy rebates in the POS price. The RFI included an example where the POS rebate for a given therapeutic class would be determined by applying a specified minimum percentage to the average manufacturer rebates for rebated products in that class, though the RFI requested feedback on other approaches. The proposed rule was finalized in April 2018. While no requirements regarding POS rebates were implemented in the April 2018 final rule or to date, CMS noted over 1,400 responses to the RFI were received and the responses could be used to help inform future policy changes2.
1 Medicare Program; Contract Year 2015 Policy and Technical Changes to the Medicare Advantage and the Medicare Prescription Drug Benefit Programs, 79 FR 29843 (May 23, 2014). 2 Medicare Program; Contract Year 2019 Policy and Technical Changes to the Medicare Advantage, Medicare Cost Plan, Medicare Fee-for-Service, the
Medicare Prescription Drug Benefit Programs, and the PACE Program – A Rule by the Centers for Medicare & Medicaid Services. April 16, 2018. https://www.federalregister.gov/documents/2018/04/16/2018-07179/medicare-program-contract-year-2019-policy-and-technical-changes-to-the-medicare-advantage-medicare.

Milliman Client Report
U.S. Department of Health and Human Services Page 5
Impact of Potential Changes to the Treatment of Manufacturer Rebates January 31, 2019
The President’s Fiscal Year 2019 Budget, which was released in February 2018, put forth a similar proposal, which would require plans to share a “substantial portion” of rebates at the POS3, in conjunction with a number of other Part D program changes designed to “discourage drug manufacturers’ price and rebate strategies that increase spending for both beneficiaries and the Government.” The budget proposal calls for at least one-third of total rebates and price concessions to be shared at the POS.4 The Part D changes outlined in the President’s Fiscal Year 2019 Budget were reinforced in May 2018, when the Trump Administration released “American Patients First: The Trump Administration Blueprint to Lower Drug Prices and Reduce Out-of-Pocket Costs”5 (HHS Blueprint). The HHS Blueprint described several initiatives already taken, proposed, or under consideration for future implementation to reduce pharmacy costs. The HHS Blueprint identified four primary reform strategies to deal with challenges in the pharmacy supply chain:
Improved competition Better negotiation Incentives for lower list prices Lowering out-of-pocket costs
POS rebates were cited as a means to reduce out-of-pocket costs and HHS was seeking public comments on other ways to reduce the impact of the high price / high rebate dynamic existing in the Part D program today, including the idea of eliminating rebates altogether in favor of fixed price contracts. On November 26, 2018, CMS released a proposed rule impacting several aspects of Medicare Part D6. In the proposed rule, CMS states it is considering changes to the definition of negotiated price, which would require plans to pay the lowest possible reimbursement at the POS. This rule change would eliminate all DIR payments from pharmacies to plans, requiring those discounts to be reflected at the POS. Only negative DIR, or payments from plans to pharmacies, would be permitted. For example, a pharmacy would be paid the lowest possible amount specified in the contract at the POS, but negative DIR could later be paid if the pharmacy met performance guarantees associated with higher reimbursement. FEDERAL ANTI-KICKBACK STATUTE The federal Anti-Kickback Statute, originally enacted in 1972, prohibits offering any kind of reward or incentive in exchange for services related to a federal healthcare program. However, safe harbors were established as exceptions to this rule to allow certain typical payments in the healthcare system. This includes rebates, defined as “any discount the terms of which are fixed and disclosed in writing to the buyer at the time of the initial purchase to which the discount applies, but which is not given at the time of sale.”7 As such, rebates are not considered a kickback and are widespread in Part D. On July 18, 2018, HHS sent a proposed rule to the Office of Management and Budget (OMB) that could potentially remove or change the rebate safe harbor. The proposal is titled “Removal of Safe Harbor Protection for Rebates to Plans or PBMs Involving Prescription Pharmaceuticals and Creation of New Safe Harbor Protection.”8 The rule has not yet been released at the time of writing, so its content is unknown to the public. However, if the safe harbor on rebates is fully lifted, rebates could be eliminated from the Part D program altogether.
3 Office of Management and Budget; An American Budget; Fiscal Year 2019. https://www.whitehouse.gov/wp-content/uploads/2018/02/budget-fy2019.pdf. 4 Department of Health and Human Services; FY 2019 Budget in Brief. February 19, 2018. https://www.hhs.gov/sites/default/files/fy-2019-budget-in-brief.pdf. 5 U.S. Department of Health & Human Services. American Patients First: The Trump Administration Blueprint to Lower Drug Prices and Reduce Out-of-Pocket Costs. May 2018. https://www.hhs.gov/sites/default/files/AmericanPatientsFirst.pdf. 6 CMS (November 26, 2018). Modernizing Part D and Medicare Advantage to Lower Drug Prices and Reduce Out-of-Pocket Expenses. https://www.federalregister.gov/documents/2018/11/30/2018-25945/modernizing-part-d-and-medicare-advantage-to-lower-drug-prices-and-reduce-out-of-pocket-expenses 7 “Exceptions” 42 CFR 1001.952. 8 Office of Information and Regulatory Affairs. https://www.reginfo.gov/.

Milliman Client Report
U.S. Department of Health and Human Services Page 6
Impact of Potential Changes to the Treatment of Manufacturer Rebates January 31, 2019
REBATES IN MEDICAID In Medicaid, pharmacy costs can be managed by either the state or a managed care organization (MCO). Ingredient costs can be based on a variety of benchmarks, such as national average drug acquisition cost (NADAC), wholesale acquisition cost (WAC), and more. The net cost to the Medicaid program is the ingredient cost less any patient cost sharing (often zero), less rebates. Rebates are specified by the Medicaid Drug Rebate Program (MDRP), which requires manufacturers to have a national rebate agreement with HHS for their products to be covered by Medicaid. The rebate amount is calculated differently for certain medication types, but the unit rebate amount (URA) is generally calculated as follows:
Basic Rebate Amount: Equal to the greater of 1) 23.1% of average manufacturer price (AMP), where AMP is the average price to manufacturers by wholesalers or pharmacies in a retail setting, or 2) the difference between AMP and Best Price, which is the lowest price available to any purchaser or insurer in most markets, with some exclusions such as the Part D market.
Additional Rebate Amount: The additional rebate amount serves as a penalty for manufacturers who have increased prices at a rate greater than inflation. It is calculated using a comparison of AMP and a Consumer Price Index (CPI) value in the current period relative to the period in which the product was first launched.
The basic and additional rebate amounts are combined to form the URA, which is capped at AMP. In addition to the URA, most states also negotiate a supplemental rebate. Supplemental rebates can be paid to either states (who share a portion with the federal government) or MCOs, unless state law prohibits MCOs from collecting rebates. The supplemental rebate is typically provided to the entity responsible for managing the preferred drug list (PDL), in exchange for PDL status and / or lack of prior authorization or other utilization management criteria. The total value of Medicaid rebates is substantial, with about $24 billion in rebates paid in fiscal year 20159. A 2015 study by the Office of Inspector General (OIG) found Medicaid rebates for top brand medications were substantially higher than rebates for those same products in Medicare Part D10. While this was based on 2012 data and Part D rebates have grown significantly since then, Medicaid rebates have also presumably grown significantly during this period, particularly because of the inflationary component of the URA noted above. In fact, the OIG study noted more than half of Medicaid rebates for the brand studied were attributed to the inflationary component and brand prices have continued to grow (in some cases substantially) since 2012.
9 Medicaid and CHIP Payment and Access Commission. “Policy Options for Controlling Medicaid Spending on Prescription Drugs.” https://www.macpac.gov/wp-content/uploads/2017/09/Policy-Options-for-Controlling-Medicaid-Spending-on-Prescription-Drugs.pdf. 10 Department of Health and Human Services Office of Inspector General. “Medicaid Rebates for Brand-Name Drugs Exceeded Part D Rebates by a Substantial Margin” https://oig.hhs.gov/oei/reports/oei-03-13-00650.pdf.
Milliman Client Report
U.S. Department of Health and Human Services Page 7
Impact of Potential Changes to the Treatment of Manufacturer Rebates January 31, 2019
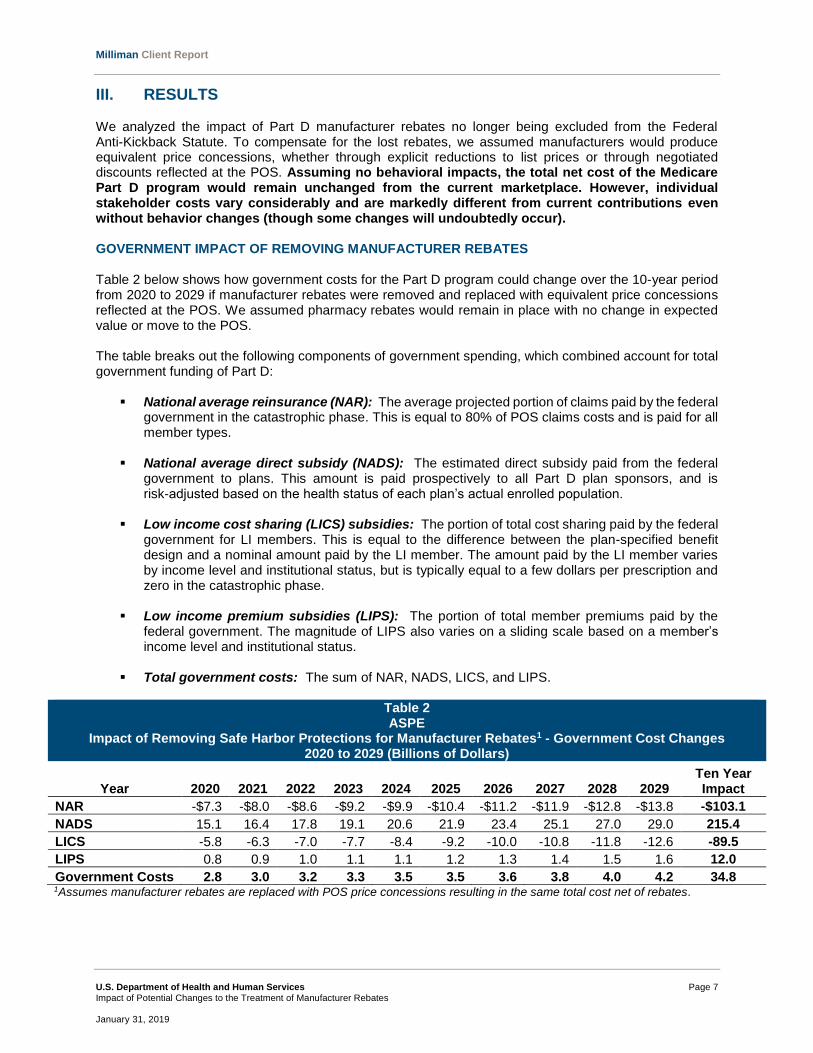
III. RESULTS We analyzed the impact of Part D manufacturer rebates no longer being excluded from the Federal Anti-Kickback Statute. To compensate for the lost rebates, we assumed manufacturers would produce equivalent price concessions, whether through explicit reductions to list prices or through negotiated discounts reflected at the POS. Assuming no behavioral impacts, the total net cost of the Medicare Part D program would remain unchanged from the current marketplace. However, individual stakeholder costs vary considerably and are markedly different from current contributions even without behavior changes (though some changes will undoubtedly occur). GOVERNMENT IMPACT OF REMOVING MANUFACTURER REBATES Table 2 below shows how government costs for the Part D program could change over the 10-year period from 2020 to 2029 if manufacturer rebates were removed and replaced with equivalent price concessions reflected at the POS. We assumed pharmacy rebates would remain in place with no change in expected value or move to the POS. The table breaks out the following components of government spending, which combined account for total government funding of Part D:
National average reinsurance (NAR): The average projected portion of claims paid by the federal
government in the catastrophic phase. This is equal to 80% of POS claims costs and is paid for all member types.
National average direct subsidy (NADS): The estimated direct subsidy paid from the federal government to plans. This amount is paid prospectively to all Part D plan sponsors, and is risk-adjusted based on the health status of each plan’s actual enrolled population.
Low income cost sharing (LICS) subsidies: The portion of total cost sharing paid by the federal government for LI members. This is equal to the difference between the plan-specified benefit design and a nominal amount paid by the LI member. The amount paid by the LI member varies by income level and institutional status, but is typically equal to a few dollars per prescription and zero in the catastrophic phase.
Low income premium subsidies (LIPS): The portion of total member premiums paid by the federal government. The magnitude of LIPS also varies on a sliding scale based on a member’s income level and institutional status.
Total government costs: The sum of NAR, NADS, LICS, and LIPS.
Table 2 ASPE
Impact of Removing Safe Harbor Protections for Manufacturer Rebates1 - Government Cost Changes 2020 to 2029 (Billions of Dollars)
Year 2020 2021 2022 2023 2024 2025 2026 2027 2028 2029 Ten Year Impact
NAR -$7.3 -$8.0 -$8.6 -$9.2 -$9.9 -$10.4 -$11.2 -$11.9 -$12.8 -$13.8 -$103.1
NADS 15.1 16.4 17.8 19.1 20.6 21.9 23.4 25.1 27.0 29.0 215.4
LICS -5.8 -6.3 -7.0 -7.7 -8.4 -9.2 -10.0 -10.8 -11.8 -12.6 -89.5
LIPS 0.8 0.9 1.0 1.1 1.1 1.2 1.3 1.4 1.5 1.6 12.0
Government Costs 2.8 3.0 3.2 3.3 3.5 3.5 3.6 3.8 4.0 4.2 34.8 1Assumes manufacturer rebates are replaced with POS price concessions resulting in the same total cost net of rebates.

Milliman Client Report
U.S. Department of Health and Human Services Page 8
Impact of Potential Changes to the Treatment of Manufacturer Rebates January 31, 2019
These results assume no corresponding behavioral changes. While we believe it very unlikely that no stakeholders would modify behaviors if a major change like this took place, we initially present the results without behavioral changes to demonstrate the impact of the elimination of manufacturer rebates alone. The impact of potential behavioral changes are presented in the following section of the report. Overall, if manufacturer rebates were removed, we estimate government costs could increase, on average, by about $3.5 billion per year between 2020 and 2029. This assumes manufacturer rebates are replaced with equivalent price concessions producing the same total net cost. In other words, the POS cost underlying the estimates in Table 2 is equal to the POS cost in the current environment less the full value of manufacturer rebates. Pharmacy rebates are assumed to still exist at the same levels as in the baseline, functioning as DIR. Table 2 illustrates the following impacts on government Part D funding:
The NAR and LICS values steadily decrease throughout the 10-year period due to the decreased POS costs. The lower POS costs cause fewer members to reach the catastrophic phase of the benefit, and if they do, the reinsurance amount for each claim is lower than in the current rebate environment. This reduces NAR costs to the government by over $100 billion over ten years. LICS is reduced as well, as the government-funded portion of cost sharing would be calculated as a percentage of a smaller POS cost.
Offsetting the lower NAR and LICS costs, NADS and LIPS both increase over the 10-year timeframe. NADS is a function of the total plan liability in Part D. In the current environment, rebates are used as a tool to keep plan costs low. If manufacturer rebates are converted to price concessions producing lower POS costs, the plan liability increases because rebates would be shared with all stakeholders involved in paying POS claims (members, manufacturers, and the government), meaning fewer rebate dollars can be used to offset plan claim liability. This causes a steadily growing NADS funded by the government.
Since 2012, NADS has decreased by over $35 PMPM, while NAR has increased by over $41. Changing the treatment of manufacturer rebates would produce a stark and immediate reversal in this pattern, with the government funding a greater portion of Part D costs through direct subsidy payments for all members and a smaller portion of Part D costs through reinsurance for high-cost members.
We note the government may also be impacted by changes in risk corridor payments to the extent plan profitability is impacted by this change. Rebates are particularly impactful in the risk corridor calculations and as such, the elimination or reduction of rebates may lead to unpredictable impacts at the individual plan level. Modeling plan level impacts was outside the scope of our analysis. The appendices at the end of this report provide further detail on these results, including the overall projected costs in the baseline and after manufacturer rebates are removed. MEMBER AND MANUFACTURER IMPACTS OF REMOVING MANUFACTURER REBATES If manufacturer rebates were replaced with equivalent POS price concessions, on average both members and manufacturers would have decreased funding responsibilities to offset the government’s larger cost burden. Tables 3 illustrates the estimated impacts to the following member and manufacturer funded elements of the Part D program:
Member cost sharing: The portion of total cost sharing paid out-of-pocket by members (exclusive of LICS)
Member premium: The portion of total member premiums paid out-of-pocket by members (exclusive of LIPS)
Total member costs: The sum of member cost sharing and member premium

Milliman Client Report
U.S. Department of Health and Human Services Page 9
Impact of Potential Changes to the Treatment of Manufacturer Rebates January 31, 2019
Coverage gap discount program (CGDP): The portion of claims paid by pharmaceutical manufacturers for NLI members in the coverage gap phase of the Part D benefit
Table 3 ASPE
Impact of Removing Safe Harbor Protections for Manufacturer Rebates1 – Member / Manufacturer Cost Changes 2020 to 2029 (Billions of Dollars)
2020 2021 2022 2023 2024 2025 2026 2027 2028 2029 Ten Year Impact
Member Cost Sharing -$2.8 -$3.0 -$3.3 -$3.6 -$3.9 -$4.2 -$4.4 -$4.8 -$5.2 -$5.6 -$40.8
Member Premium 1.8 2.0 2.2 2.3 2.5 2.7 2.9 3.1 3.3 3.6 26.4
Total Member Costs -1.0 -1.1 -1.2 -1.3 -1.4 -1.5 -1.6 -1.7 -1.8 -2.0 -14.5
CGDP -1.9 -2.0 -2.0 -2.0 -2.1 -2.1 -2.1 -2.1 -2.2 -2.2 -20.6 1Assumes manufacturer rebates are replaced with POS price concessions resulting in the same total cost net of rebates.
If manufacturer rebates are removed, total member costs and manufacturer claim costs are expected to decrease by $14 billion and $21 billion, respectively, over the 10-year period. As with Table 2, these results assume no corresponding behavioral changes. While we believe it likely that stakeholder behaviors would change in some way, we initially present the results without behavioral changes to demonstrate the impact of eliminating manufacturer rebates alone. The impacts including potential behavioral changes are presented in the following section of the report.
Total member costs are expected to be about $1.4 billion per year lower on average, due to a
reduction in average cost sharing, only partially offset by an increase in premiums. Note that the impact will vary for members taking different types of products, with the greatest savings associated with members taking very high-cost products subject to coinsurance, while members taking low-cost or no medications may have an increase in total costs through higher premiums. These results assume a defined standard benefit design—members enrolled in enhanced plans or employer group waiver plans (EGWPs) may not see as much savings if their benefit design uses copayments rather than coinsurance, though high-utilizing members would still see meaningful savings as nearly all plans use defined standard coinsurance on brands in the gap and catastrophic phases.
2020 plan year member premiums (the portion paid by members, exclusive of LIPS) are expected
to be $3.20 higher per month as a result of the replacement of manufacturer rebates with POS price concessions. We project this premium to increase by 4% to 5% annually over the 10-year projection. This equates to a 2029 member premium of $46.20 PMPM, relative to a projected 2029 member premium of $41.30 PMPM assuming no changes to manufacturer rebates. The member premium increase could be the largest challenge with implementing this change since it is a highly visible feature of the plan that members focus on when selecting their plan annually and impacts most members (except for those with fully subsidized premiums). However, as demonstrated later in this report, some plans could actually have a decrease in premium as a result of this change.
Manufacturer payments through the CGDP are expected to be about $2 billion per year lower on average. When POS costs are lower, it takes longer for costs to accumulate toward the initial coverage limit (ICL) and the TrOOP threshold. CGDP payments would be lower as fewer members reach the coverage gap or spend less time in the gap before the year ends, and because CGDP would be calculated as a percentage of a lower POS cost, but the impact would vary by manufacturer and by plan sponsor.
Milliman Client Report
U.S. Department of Health and Human Services Page 10
Impact of Potential Changes to the Treatment of Manufacturer Rebates January 31, 2019
As noted above, the overall average impact to members is a small increase in premium and larger decrease in cost sharing, but the results would vary for different members in different plans. While all members in a given Part D plan pay the same premium (not accounting for LIPS), different plans will have different changes in premium if manufacturer rebates are removed. Changes in premium would vary based on the following:
The change in premium will be directly correlated to the current magnitude of manufacturer rebates. Plan sponsors with very high manufacturer rebate levels may experience the highest increases in premiums. These plans (presumably market-leading plans with high enrollment and, therefore, high negotiation leverage) would have the largest reduction in POS costs, causing the largest increase in plan costs because fewer rebate dollars can be used to offset plan claims liability. However, because all plans receive the same direct subsidy amount (prior to risk adjustment), the NADS would not be enough to compensate for the increase in plan cost, resulting in a higher than average premium increase.
On the other hand, plan sponsors with lower than average rebate levels may in fact experience a decrease in premiums. Similar to the effect described above, these plans would not have as large of a change in net plan liability, but they would receive the same NADS, which would be higher to reflect the average change in bid amounts across all plans. As a result, the increased NADS may more than offset the increase in bid amount for these plans, causing a decrease in premiums.
In line with the dynamics described above, PDPs may have higher premium increases than MAPD
plans, since PDPs tend to have higher manufacturer rebate levels than MAPD plans. This could cause an acceleration in the higher enrollment trends for MAPD plans relative to PDPs.
Shifts in enrollment could cause further changes in plan premiums over time. Members may seek
the lowest cost sharing available for the products they use. If plan sponsors continue negotiating price concessions distinctly for themselves (as opposed to manufacturers uniformly reducing list prices), members taking high-cost products may shift to plans with the highest price concessions. This adverse selection could cause premiums to increase in the following year.
The results presented to this point represent no change in total program costs or in stakeholder
behaviors. Plan behavioral changes would certainly influence future premiums, as discussed in the next section.
Member cost sharing would also vary in different situations, including but not limited to the following considerations:
Assuming price concessions are reflected at the POS at a product level or aggregated across rebated products (as opposed to aggregated across all products in the same therapeutic class or across all products), only members taking a product with a manufacturer rebate would see cost sharing savings. A majority of brand utilization is for products with manufacturer rebates, and about 40% of NLI Part D members used a brand medication in 2017. All else constant, members not taking any rebated medications would have no change in cost sharing, however, reductions to cost sharing for generics may be needed to meet actuarial equivalence testing, which could produce savings for all NLI members other than non-utilizers.
Members with certain benefit designs may be more likely to save than others. In particular, members with a deductible and a coinsurance benefit during the initial coverage phase may save a greater percentage of costs than members with other benefit designs. Members with copayments may not see cost sharing savings if the value of the copayment remains the same and does not exceed the new POS cost of the medication, though the value of the copayment may in fact change due to actuarial equivalence requirements in Part D. However, a large portion of brand utilizers reach the coverage gap or catastrophic phases, during which nearly all plans have a coinsurance design. As a result, members with copayments during the initial coverage phase could still have some cost sharing savings if they reach the gap and catastrophic phases.

Milliman Client Report
U.S. Department of Health and Human Services Page 11
Impact of Potential Changes to the Treatment of Manufacturer Rebates January 31, 2019
Members in plans with the highest premium increases might have the highest offsetting cost
sharing savings – as noted above, plans with the highest manufacturer rebate levels may have the largest premium increases, but those high rebate levels would produce greater cost sharing savings if the rebate is converted to a lower POS cost.
LI members would not be significantly impacted by this (or most other) changes to Part D costs
because their cost sharing and premiums are already highly subsidized by the government. However, to the extent some LI members pay a percentage of cost sharing and / or premium, they would experience similar impacts as NLI members, but the dollar change would be smaller.
When taking into account total member costs, including both cost sharing and premium, some members would have savings and some members would have increases in costs. The overall average impact shown in Table 3 is a savings to total member costs, though the distribution of changes to member costs is far from uniform. With that said, no members would have an increase in cost sharing, so the “break even” point of member spending increasing or decreasing is equal to the total annual increase in premium. The estimated average premium increase in 2020 (exclusive of LIPS) is $3.20 PMPM. As such, if manufacturer rebates were eliminated, a member with a reduction in cost sharing of more than $3.20 per month (about $38 per year), would save money from this change. Many brand utilizers could see this level of savings or much more. The average projected gross cost per brand prescription in 2020 is over $400 for non-specialty products and over $800 for brand and specialty products combined. A member taking a $400 brand with a 30% manufacturer rebate would save $120 if they were in the deductible phase, and would continue to save $30 per month while in the initial coverage phase. LI members are largely shielded from changes to both cost sharing and premium, given these amounts are heavily subsidized by the government. Only partial subsidy LI members, which we estimate account for about 15% of all LI members, could see meaningful direct cost sharing savings (these members have an $85 deductible and 15% coinsurance up to TrOOP in 2019). Other LI members would have minimal impact because their cost sharing and premiums are already highly subsidized. As such, the impact of this change is concentrated among NLI members, who account for about 70% of total Part D enrollment. Based on actual 2017 Part D claim records for about 4 million NLI lives, we estimate NLI members would be affected as follows if manufacturer rebates are removed (though the actual results will vary depending on benefit design, rebate levels, and premium increases):
According to Milliman manual rate data, about 7% of NLI members do not use any medications. These members have no cost sharing, and thus, would only be affected by the change in premium (which would increase on average, but could vary significantly by plan).
Up to 30% of NLI members could directly benefit from the changes in POS costs by enough to make up for the average increase in premium.
Of the remaining 63% of NLI members, total costs may increase or decrease. All else constant,
these members generally do not have enough cost sharing savings to fully offset the increase in premium. However, even members not taking any brand medications could experience copayment reductions as plans alter their benefit designs. As the POS cost of brands decreases, the overall value of the benefit will decrease, and plans may need to reduce cost sharing to maintain the minimum required value of 25% in the initial coverage phase. As a result, generic or other copays may decrease, which could generate savings for these members, but is difficult to quantify.

Milliman Client Report
U.S. Department of Health and Human Services Page 12
Impact of Potential Changes to the Treatment of Manufacturer Rebates January 31, 2019
BEHAVIORAL EFFECTS The results in Tables 2 and 3 reflect the 10-year estimated impact of eliminating manufacturer rebates and replacing them with commensurate POS price reductions (whether through lower list prices or negotiated concessions with separate plan sponsors), but assumes no other changes. While it is difficult to predict what other kinds of changes may result from this potential change, all stakeholders would likely change behavior as a result of this change, so it is critical to consider possible behavioral impacts as well. However, we do not intend to imply that any one outcome modeled is more likely than another, and it is difficult to predict the magnitude of change in all scenarios. We modeled the impact to stakeholder costs from 2020 to 2029 under the following eight scenarios:
Scenario 1 – No Behavioral Changes: This is the same scenario presented in Tables 2 and 3. Scenario 2 – Increased Formulary Controls: PBMs and plans may favor less rich formulary
designs, instead focusing more on lower POS costs. If manufacturer rebates were removed from the Part D program, plans would lose a large portion of their ability to reduce costs after the POS. Therefore, discount contracting (lowest POS costs) could become the main avenue to keep costs to the plan as low as possible. While changes in plan costs may not directly affect plan profit, it is important for plan sponsors to keep costs low to maintain competitive premiums. This could incentivize formulary designs that would move members to the lowest cost alternatives. These formulary design changes may include: ̶ Quicker adoption of new generics ̶ Higher tier placement (or removal) of brands with generic equivalents ̶ More robust prior authorization and step therapy programs for high cost brands In this scenario, we assume plans will react to the elimination of manufacturer rebates by placing a stronger emphasis on formulary management, resulting in a gradual reduction in costs over time relative to the baseline, brought about by a higher generic dispensing rate (GDR). We assumed GDR would increase the most in the second year of implementation, assuming plans may need additional time to formulate strategies and react to competitor changes in year one. We assumed GDR would also continue to increase by a small amount over four years.
Pharmacy rebates would continue to exist as DIR and with GDRs approaching or exceeding 90%, a large portion of these rebates are for generic medications. Increasing GDR has an added bonus for plan sponsors of not just reducing POS costs, but maintaining the same level of pharmacy rebates (as opposed to manufacturer rebates, which decrease when GDR increases because they are primarily for brand medications), which could lead plan sponsors to pursue this type of strategy.
Scenario 3 – Increased Formulary Controls and Increased Price Concessions: As formulary
control tightens, manufacturers may offer additional price concessions to PBMs or plan sponsors (which could be even greater than the equivalent rebate arrangements today) to keep their products on formulary. In the current supply chain, manufacturers can negotiate with PBMs using rebates to maintain formulary positioning and the value of the rebate can sometimes outweigh any difference in POS cost relative to competing products. However, in a market without rebates, manufacturers of higher-cost products may need to negotiate larger price concessions with PBMs to secure formulary access or risk losing formulary status to a lower-cost alternative.
Manufacturers may be pushed to provide higher price concessions to keep the net plan sponsor liability closer to the current liability after rebates, rather than maintaining the current net allowed cost after rebates. In dollars, the value of the price concession would need to be greater than the value of the rebate to keep the plan sponsor net neutral.

Milliman Client Report
U.S. Department of Health and Human Services Page 13
Impact of Potential Changes to the Treatment of Manufacturer Rebates January 31, 2019
Scenario 3 builds upon Scenario 2 by assuming price concessions negotiated with manufacturers will gradually increase. We assumed brand costs would initially be 0.5% lower, with concessions further increasing over time to a maximum difference of 2.5% less than baseline costs. This reaction may occur as plans fight to keep premiums down, but no longer can do so with manufacturer rebates, so they may gradually push manufacturers for deeper price concessions in order to maintain formulary status. Scenario 3 assumes GDR will still increase relative to the baseline due to a shift in formulary strategies focused on lowest cost products, but assumes a smaller GDR increase than Scenario 2. Relative to Scenario 2, brand utilization may be higher if more brands are covered due to larger price concessions.
Scenario 4 – Reduced Price Concessions: As mentioned above, Tables 2 and 3 (Scenario 1)
assume the impact of the elimination of manufacturer rebates in Medicare Part D has no net impact on overall costs. However, in the transition between negotiations for rebates and the new price concessions, manufacturers may take the opportunity to improve POS costs, but not to the point at which it fully makes up for the former rebate. In particular, this could happen if manufacturers choose to reduce POS costs through lower list prices as opposed to negotiated price concessions with Part D plans. This is because list prices are the basis of manufacturer reimbursement in all markets—if a manufacturer reduced list price by the full value of the Part D rebate on a per script basis, it would lose money due to lower reimbursement in the commercial and other markets. For example, assume a $100 list price, 30% Part D rebate, 50% Part D market share, 20% commercial rebate, and 50% commercial market share. The average net reimbursement for the manufacturer is $75 [= ($100 - $30) * 50% + ($100 - $20) * 50%]. However, if the manufacturer reduces the list price to $70 and rebates continue to exist in the commercial market, the new net reimbursement would only be $63 [= ($70 - $0) * 50% + ($70 - $14) * 50%]. In this example, the manufacturer would only be able to reduce the list price to $83.33 for the overall average reimbursement to remain neutral at $70. Scenario 4 examines this possibility by assuming that manufacturers adjust prices to result in POS costs reduced by an amount equivalent to only 80% of the lost rebate rather than 100%. Note that the 80% assumption is for illustrative purposes and may be plausible, though it is difficult to predict how much manufacturers would be able to reduce price concessions by given the pressures they may face from plan sponsors. This scenario, as with others, might occur in combination with other downstream behavioral changes (e.g., increased focus on lower-cost generic medications). However, we present this scenario to show how costs could increase if plans were unsuccessful in offsetting increases to net costs.
Scenario 5 – Decreased Brand Unit Cost Trend: This scenario assumes manufacturers will not
increase list prices as quickly in a world without manufacturer rebates. To the extent manufacturers currently implement high annual list price increases in reaction to plan strategies preferring high list prices with high corresponding rebates, there may be less need for high future price increases. In particular, assuming formulary strategies evolve to favor lower POS cost products, manufacturers may need to respond by limiting price increases over time. We assumed a 1% lower annual trend on brand medications, beginning in 2020. This could take the form of large drops in trend, or even negative trends, in competitive therapeutic classes, combined with smaller or no changes in trend in other classes.
Scenario 6 – Increased Utilization and Decreased Brand Unit Cost Trend: In addition to the lower brand price trends assumed in Scenario 5, there may also be changes in utilization. The transfer of manufacturer rebates to POS discounts will decrease member cost sharing at the POS in many cases. Therefore, members may use more brands given they are now more affordable. We kept the same price trends as in Scenario 5, but assumed brand utilization trends would be 0.5% greater in this scenario than in the baseline for NLI members only (LI members would not be influenced by the change because their cost sharing is already subsidized). Increases in brand utilization will increase total costs, all else constant, and partially offset savings generated by reduced brand price trends in this scenario.
Milliman Client Report
U.S. Department of Health and Human Services Page 14
Impact of Potential Changes to the Treatment of Manufacturer Rebates January 31, 2019
Scenario 7 – Increased Pharmacy Rebates: This scenario assumes PBMs and plans will more aggressively contract for pharmacy rebates in the absence of manufacturer rebates. Pharmacy rebates would still have strong value through their treatment as DIR and there may be opportunities to offset the increases to member premium by negotiating for increased pharmacy rebates. This scenario is similar to Scenario 3 in that both assume there will be pressure to provide alternative avenues to keep plan liability closer to its current levels. However, Scenario 7 assumes this will increase through pharmacy rebates (which we assume will remain as DIR and not at the POS) rather than manufacturer price concessions at the POS.
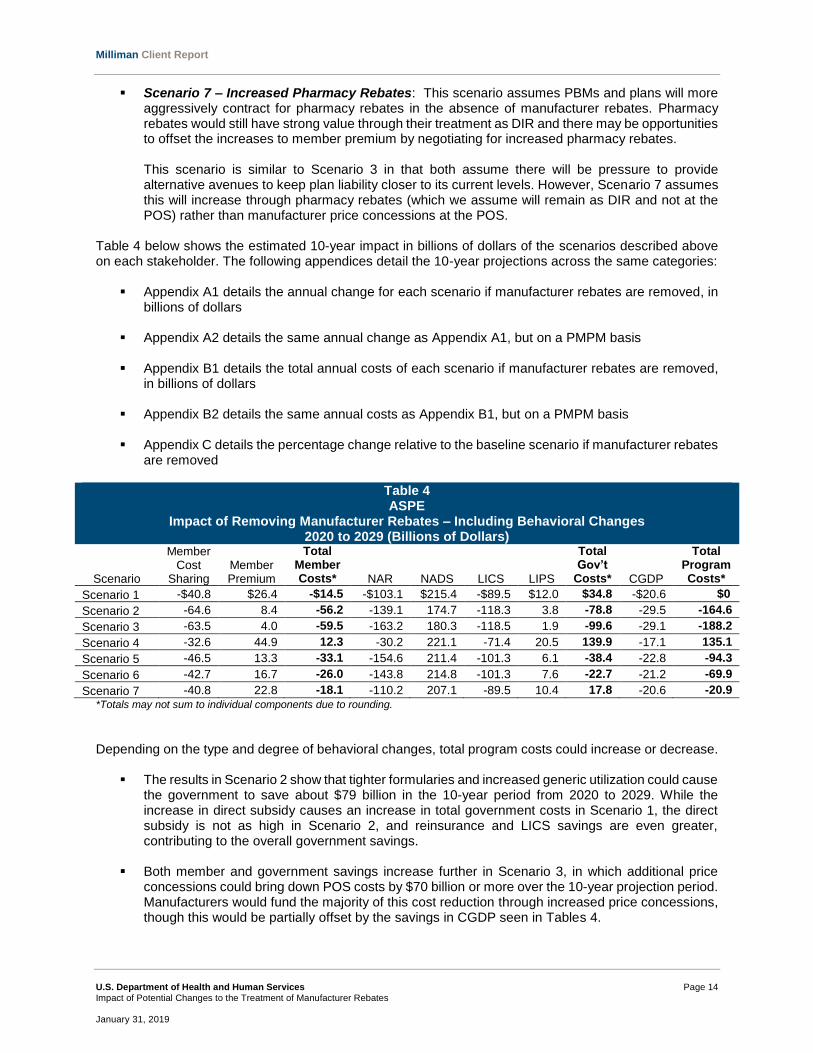
Table 4 below shows the estimated 10-year impact in billions of dollars of the scenarios described above on each stakeholder. The following appendices detail the 10-year projections across the same categories:
Appendix A1 details the annual change for each scenario if manufacturer rebates are removed, in billions of dollars
Appendix A2 details the same annual change as Appendix A1, but on a PMPM basis
Appendix B1 details the total annual costs of each scenario if manufacturer rebates are removed, in billions of dollars
Appendix B2 details the same annual costs as Appendix B1, but on a PMPM basis
Appendix C details the percentage change relative to the baseline scenario if manufacturer rebates are removed
Table 4 ASPE
Impact of Removing Manufacturer Rebates – Including Behavioral Changes 2020 to 2029 (Billions of Dollars)
Scenario
Member Cost
Sharing Member Premium
Total Member Costs* NAR NADS LICS LIPS
Total Gov’t
Costs* CGDP
Total Program Costs*
Scenario 1 -$40.8 $26.4 -$14.5 -$103.1 $215.4 -$89.5 $12.0 $34.8 -$20.6 $0
Scenario 2 -64.6 8.4 -56.2 -139.1 174.7 -118.3 3.8 -78.8 -29.5 -164.6
Scenario 3 -63.5 4.0 -59.5 -163.2 180.3 -118.5 1.9 -99.6 -29.1 -188.2
Scenario 4 -32.6 44.9 12.3 -30.2 221.1 -71.4 20.5 139.9 -17.1 135.1
Scenario 5 -46.5 13.3 -33.1 -154.6 211.4 -101.3 6.1 -38.4 -22.8 -94.3
Scenario 6 -42.7 16.7 -26.0 -143.8 214.8 -101.3 7.6 -22.7 -21.2 -69.9
Scenario 7 -40.8 22.8 -18.1 -110.2 207.1 -89.5 10.4 17.8 -20.6 -20.9
*Totals may not sum to individual components due to rounding.
Depending on the type and degree of behavioral changes, total program costs could increase or decrease.
The results in Scenario 2 show that tighter formularies and increased generic utilization could cause the government to save about $79 billion in the 10-year period from 2020 to 2029. While the increase in direct subsidy causes an increase in total government costs in Scenario 1, the direct subsidy is not as high in Scenario 2, and reinsurance and LICS savings are even greater, contributing to the overall government savings.
Both member and government savings increase further in Scenario 3, in which additional price
concessions could bring down POS costs by $70 billion or more over the 10-year projection period. Manufacturers would fund the majority of this cost reduction through increased price concessions, though this would be partially offset by the savings in CGDP seen in Tables 4.
Milliman Client Report
U.S. Department of Health and Human Services Page 15
Impact of Potential Changes to the Treatment of Manufacturer Rebates January 31, 2019
Scenario 4 has an opposite impact, with total program costs increasing because total price concessions are lower than in the baseline. This would cause costs for all stakeholders to increase. Members would still have cost sharing savings on average because the price concession, while lower than in the baseline, is now reflected at the POS when in the baseline it was not, and some members would still have overall savings. However, on average across all members, the increase in premium would outweigh the cost sharing savings.
In Scenario 5, member savings is less than Scenarios 2 and 3, but it is still close to double the
impact without any behavioral changes (Scenario 1). Total government costs are still estimated to decrease rather than increase. The lower rate of brand price increases produces lower total program costs and the increases in member premium relative to the baseline shrink over time.
In Scenario 6, total savings is less than Scenario 5, with increases in brand utilization offset by decreases in price trends. The assumption of increased brand utilization is in direct contrast to Scenarios 2 and 3, which assumed less brand utilization. This illustrates that if the elimination of manufacturer rebates corresponds with lower increases in brand prices over time, government savings may be generated even if formularies do not change.
The basis of Scenario 7 is similar to Scenario 3, assuming plans are able to gain increased price concessions from pharmacies. We assumed pharmacy rebates would increase but utilization would not change. With member claims not impacted by rebates, one would expect medication choices may not change. As a result, claim payments (member cost sharing, LICS, CGDP) do not change relative to Scenario 1. While total costs are lower than in Scenario 1, government costs still increase $8.6 billion relative to the baseline, as pharmacy DIR is not great enough to offset the loss of manufacturer rebates.
OTHER CHANGES There certainly could be numerous other behavioral changes across different stakeholders and further nuances surrounding the effects of the potential changes described here. We did not attempt to capture every possible combination of changes, but illustrate potential effects. Enrollment In addition to the changes modeled in Table 4, there could also be significant changes in enrollment. Premium is a very important factor for members shopping for a Part D plan, so if premiums increase, members may choose to “shop around” for a new plan. This could result in a large number of members shopping for a new plan, especially considering the highest concentration of members are in the largest plans, which presumably have the largest manufacturer rebate levels (and, therefore, may have the largest premium increases). This could result in the following types of enrollment shifts:
Members shifting to plans with leaner coverage. Typically, plans with tighter formularies or less enhanced benefit designs have lower premiums, as the total cost of coverage is lower. Note in the current environment, high rebates could allow a richer plan to have lower premium than a leaner plan with low rebates, but this dynamic would be largely eliminated if manufacturer rebates were removed. If members react to premium increases by moving to leaner plans, total program costs may decrease with members potentially steered toward lower cost medications. This option would be largely limited to members enrolled in enhanced plan designs, which account for about two thirds of all Medicare Advantage and stand-alone Part D members.
Members shifting to similar plans with a smaller increase, or even decrease, in premium. While premiums are expected to increase on average, plans with lower than average manufacturer rebate levels may in fact have lower premiums because the plan bid amount increases by a smaller amount than the national average bid, but the plan still collects the higher national average direct subsidy. This could potentially even the playing field for Part D premiums and enrollment, such that smaller carriers with less negotiation leverage may now have premiums closer to larger carriers, allowing them to gain more membership.

Milliman Client Report
U.S. Department of Health and Human Services Page 16
Impact of Potential Changes to the Treatment of Manufacturer Rebates January 31, 2019
Shifts in auto-enrolled LI members. Basic plans with premium below the low income benchmark (LIB) in a given region are eligible for auto-enrolled LI members. The LIB is calculated from the average bids across all plans in the region, weighted by LI membership. A plan with premium not currently below the LIB typically has fewer LI members and might not face as large of a premium increase, which could cause the plan’s premium to be below the LIB if manufacturer rebates are eliminated. This could result in large shifts in LI auto-enrollment, particularly in the first year of the change.
Continued enrollment shifts over time. The elimination of manufacturer rebates would be a significant change in Part D, and we expect plans to continue to adjust strategies over time. As such, there could be swings in plan premiums not just in the first year of implementation, but for several years to follow. Some plans may take longer than others to find ways to offset the increases in premiums and some plans might choose to wait and see how their competitors react to the change. As noted above, members may initially shift to plans with lower premium increases or premium decreases. However, if this was caused by lower manufacturer rebates, those plans may still have less negotiating leverage, and thus, may lose ground over time as larger carriers potentially negotiate greater price concessions in the new environment. As a result, any enrollment shifts away from current market leaders may only be temporary, unless the shift is significant enough to change negotiation dynamics and shift leverage from the current market leaders to other carriers.
Benefit Design Benefit designs may also change if manufacturer rebates are eliminated. Enhanced plans may be less likely to enhance the benefit for brand tiers than for generic tiers if their focus is strictly on achieving the lowest POS cost. As described previously, all plans are subject to actuarial equivalence testing, which requires members to pay 25% or less of costs (on average across all tiers) before reaching the ICL. If the POS cost for brands decreases, a copayment will become a larger percentage of costs, which may cause a plan to fail the equivalence test unless it reduces cost sharing on that tier or another tier. To illustrate, consider a plan with the following benefit design and average costs (assuming a three-tier formulary, for simplicity):
Table 5 ASPE
Impact of Removing Manufacturer Rebates1 Changes to Actuarial Equivalence Testing
Baseline Remove Manufacturer Rebates
Generic Brand Specialty2 Total Generic Brand Specialty2 Total
Member Cost Sharing $5 $85 $625 $25 $5 $85 $500 $23
Allowed Cost per Script $20 $350 $2,500 $102 $20 $280 $2,000 $85
Actuarial Value 25% 24% 25% 25% 25% 30% 25% 27%
1Brand and specialty manufacturer rebates assumed to be replaced by 20% POS price concessions in this example. 2Specialty cost sharing assumed to be 25% coinsurance.
In this example, the plan offers a $5 copay on generics and an $85 copay on brands, both of which are equivalent to approximately 25% coinsurance (a 25% coinsurance applies to specialty medications as well). When manufacturer rebates are removed, brand and specialty POS costs are assumed to decrease by 20%. The $85 brand copay now has an effective value of 30%, and the total effective coinsurance increases from 25% to 27%. The plan would need to reduce cost sharing on at least one tier to pass the actuarial equivalence test requiring 25% or lower cost sharing. This could be achieved in this case by reducing the generic copay from $5 to $3.25 or reducing the brand copay from $85 to $70, among other options.

Milliman Client Report
U.S. Department of Health and Human Services Page 17
Impact of Potential Changes to the Treatment of Manufacturer Rebates January 31, 2019
In addition to plan-specific benefit design changes, it is possible the CMS-defined Part D benefit parameters (deductible, ICL, TrOOP) may also change as a result of removing manufacturer rebates. These parameters are set each year using an annual percentage increase (API) methodology, reflective of year-over-year changes in average Part D costs observed in actual claims data. Part D costs used in this approach are gross of rebates, so it is possible there could be a one-time drop in the Part D benefit parameters in the year following the elimination of manufacturer rebates. As POS costs decrease, there could be a similar percentage decrease in the deductible, ICL, and TrOOP when those lower costs are compared to the prior year. (Note, a different methodology is currently used for calculating TrOOP, but this is expected to revert back retroactively to the API approach beginning in 2020.) The impact to each component of Part D spending could change if the Part D benefit parameters change in this way. A reduction in the Part D deductible would result in greater average member savings and would result in a larger number of members with cost sharing savings. However, we estimate members would have larger average premium increases and government costs would increase, largely due to a lower TrOOP amount. If TrOOP decreases, members will reach the catastrophic phase more quickly and the government will pay more claims through federal reinsurance. This may nearly offset the savings in federal reinsurance related to lower POS costs, depending on the magnitude of the change in benefit parameters.

Milliman Client Report
U.S. Department of Health and Human Services Page 18
Impact of Potential Changes to the Treatment of Manufacturer Rebates January 31, 2019
IV. CONSIDERATIONS There are many possible outcomes if manufacturer rebates are eliminated. We do not attempt to discuss all possible consequences, but provide discussion in this section of important considerations and potential impacts. DIFFERENCES ACROSS PLAN TYPES Different plans will likely have different strategies in reaction to the elimination of manufacturer rebates. There is variability among formulary strategies today, and some formularies do already target the lowest POS costs in most or all classes, so changes in formulary strategies will not be uniform across all plans. It is difficult to predict how plans will react, but we observe the following potential distinctions among different types of plans:
MAPD / PDP: MAPD plans on average have lower rebate levels than PDP plans, according to Milliman Part D bid client survey results. As a result, MAPD plans may not experience as large of an increase in bid amount, which would lead to a lower than average increase in premium (or even a decrease in premium). In the last several years, there has been a shift in enrollment from PDP to MAPD plans, with MAPD enrollment growing nearly 7% from 2017 to 2018, while PDP enrollment grew only 1%. This movement from PDP to MAPD could increase if PDP premium increases drive members to plans with lower increases. Additionally, MAPD plans are often able to offset increases in Part D costs through benefit changes on the Part C side as well, which may be less visible or less important to some members.
LI / NLI: Similarly, plans with a large proportion of NLI members may have lower average manufacturer rebate levels than plans with a large proportion of LI members. This is because LI members on average use a greater proportion of brand rebated medications. As a result, plans with a large proportion of LI members may face greater premium increases. This could cause an interesting dynamic with the LIBs. Basic plans with premium below the LIB are eligible for auto-enrolled LI members, which is an easy way to gain volume and is often a strategy used by basic PDPs. The LIB is calculated from the average bids across all plans in the region, weighted by LI membership. A plan with premium not currently below the LIB typically has fewer LI members and, therefore, might not face as large of a premium increase. This could cause the plan’s premium to be below the LIB once manufacturer rebates are eliminated. Across the market, it could result in large shifts in LI auto-enrollment, particularly in the first year of the change.
EGWP / Individual: In the results presented in this report, we modeled a national average
population, assuming total enrollment across both EGWP and Individual plan types. However, EGWP plans have unique benefit designs. Average EGWP member spending can be greater than average individual member spending (all else equal), including greater utilization of brands driven by richer cost sharing. As a result, an EGWP with strong manufacturer rebate levels might see a large increase in premium and could possibly react by reducing the level of benefit enhancements or increasing retiree contributions in addition to formulary strategies discussed previously.
Basic / Enhanced: Basic plans have limited ability to offset any premium increases through benefit reductions, as they are required to offer a plan with the same average value as the defined standard plan. Enhanced plans, on the other hand, could possibly make benefits less rich to offset premium increases, though they would still be required to meet meaningful difference requirements relative to the carrier’s basic plans.

Milliman Client Report
U.S. Department of Health and Human Services Page 19
Impact of Potential Changes to the Treatment of Manufacturer Rebates January 31, 2019
To further illustrate the variability by plan type, Table 6 below shows our average estimated member premium in 2020 for the following hypothetical Part D plans:
National average plan: This plan is assumed to have claim costs, rebates, income mix, and all other assumptions equal to the national average. These are the same assumptions underlying our national average impacts in the tables throughout this report.
100% NLI plan: In this case, we applied the same assumptions as for the national average plan, but assuming 100% NLI enrollment. While most plans have some mix of NLI and LI members, we provide this sample plan for illustration.
100% LI plan: Similarly, this plan has the same assumptions as for the national average plan, but
assuming 100% LI enrollment.
Low-rebate plan: This example assumes the same claim costs and income mix as the national average plan, but assumes the plan has lower than average rebate levels (15% of total allowed costs).
Table 6 ASPE
Impact of Removing Manufacturer Rebates Monthly Premium Across Sample Plan Types
Baseline Remove Manufacturer Rebates
National average plan $34 $39
100% NLI plan $37 $34
100% LI plan $30 $45
Low-rebate plan $60 $51
As seen in Table 6, a plan with lower than average manufacturer rebates could have a decrease in premium of about $9 PMPM. Based on the assumptions underlying this illustration, the low-rebate plan still has higher premium than the other plans, but it is a much more level playing field relative to the baseline, in which the low-rebate plan premium was at least $20 higher than the next highest plan. In the examples in Table 6, average premiums for a 100% NLI plan are higher than the national average in the baseline, but decrease by about $3 when manufacturer rebates are eliminated and transferred to POS price concessions. On the other hand, a 100% LI plan has the opposite impact—premium increases by about $15, such that the LI plan now has higher premium than the national average plan. Note this income mix effect assumes no change to the risk adjustment model, though as discussed below a change is likely to be needed. RISK ADJUSTMENT Risk scores may become more important to plans if manufacturer rebates are eliminated. The direct subsidy paid to plans is risk-adjusted based on the average risk score across the members enrolled in the plan. In Tables 4 above, the national average direct subsidy is expected to increase by $175 billion or more. As the direct subsidy increases, the value of the multiplicative risk score adjustment increases as well. MAPD plans may increase focus on risk score coding efforts to capture as many diagnoses as possible and maximize risk scores. This is not as easy for PDP plans though, which could possibly lead PDPs to push for greater control over risk scores or the inclusion of pharmacy data in the Part D risk score model. The CMS risk adjustment model would likely need to be updated if manufacturer rebates were eliminated. Currently, the risk adjustment model is calibrated to gross Part D costs, prior to accounting for rebates. POS costs would now reflect manufacturer rebates, which could dramatically change how certain conditions

Milliman Client Report
U.S. Department of Health and Human Services Page 20
Impact of Potential Changes to the Treatment of Manufacturer Rebates January 31, 2019
are evaluated. It is possible high-rebate therapeutic classes currently profitable for plan sponsors could receive a reduction in the risk adjustment factor for the associated condition. REIMBURSEMENT MODELS IN THE ABSENCE OF MANUFACTURER REBATES If manufacturer rebates are eliminated completely, manufacturers may take some other kind of action to reduce net costs in Part D. There are two primary mechanisms by which this could be done:
Reducing List Prices: As discussed previously, incentives exist today to encourage formulary preference of products with high list prices and high rebates over lower-priced products. Without manufacturer rebates, these incentives would be removed. Further, we estimate manufacturer rebates account for as much as 30% of gross costs for brand medications, so without rebates, manufacturers would presumably be able to significantly reduce list prices. However, this has implications for other markets, as discussed previously, so manufacturers may not necessarily reduce list prices by the full amount of average rebates in the Part D market, particularly if rebates continue to exist in the commercial or other markets.
Negotiated Price Concessions: One possible way the market could function without rebates would be for the manufacturer to negotiate directly with PBMs or plan sponsors for an additional price concession reflected at the POS. In terms of the supply chain flow, the wholesaler would still purchase products from manufacturers at a discount relative to the list price and sell to pharmacies on a spread. Upon dispensing a prescription, the pharmacy would collect the copayment and be reimbursed by the PBM for the final POS cost after accounting for price concessions negotiated by the PBM with both the pharmacy and manufacturer. For each Part D claim, pharmacies could request a “chargeback” payment to be reimbursed for the differential between the manufacturer’s price concession and pharmacy’s price concession to make the pharmacy whole.
Note one key difference between these two options is that negotiated price concessions will result in variable pricing across different plan sponsors. In particular, plans with the lowest POS costs may continue to be plans with large volume / negotiating power (though these are the plans who will also need to make up the most ground and will face the largest premium increases if manufacturer rebates are eliminated, as discussed previously). Plans with small enrollment and little negotiation leverage may prefer manufacturers reduce list prices to potentially result in a lower POS cost for them and make enrollment gains more likely. Of the two reimbursement options outlined above, reducing list prices is the simplest in that it requires fewer changes to supply chain stakeholders and less administrative burden. The chargeback model would involve administrative and logistical challenges and would require a significant change to the supply chain to take place in a short period of time. Additionally, the chargeback payment introduces a new step in the supply chain that could bring along an additional fee related to administering the program. Further, pharmacies may have a cash flow issue depending on the timing of payments from the manufacturer to true up to the PBM-manufacturer negotiated price concessions. The impact of this cash flow issue is dependent on how frequently the chargeback payment is made. However, the chargeback model results in more similar net prices as the current environment, with POS costs varying by plan, so some plans may push for maintaining this type of structure. APPLICATION OF PRICE CONCESSIONS The CMS RFI on reflecting a portion of rebates at the POS suggested reflecting POS manufacturer rebates using an average across all rebated products in a given class rather than at a product-specific level. For classes with multiple rebated products, this approach has the advantage of reducing member cost sharing while still protecting proprietary contracting information associated with a single product. However, spreading rebates across the entire class would result in one manufacturer subsidizing POS costs for another if the rebate values are not equal. This cross-subsidization could make manufacturers less willing to give strong concessions. Manufacturers offering high rebates today may be opposed to spreading rebates at any level other than product-specific, while other manufacturers could be in favor of
Milliman Client Report
U.S. Department of Health and Human Services Page 21
Impact of Potential Changes to the Treatment of Manufacturer Rebates January 31, 2019
this approach to the extent it reduces costs for their products. Additionally, contracting terms may not be protected if there is only one brand in a given therapeutic class. Spreading rebates across a therapeutic class may be less relevant to the concept of eliminating manufacturer rebates altogether (as opposed to partial rebate pass-through, as proposed in the CMS RFI) since it hinges on rebate contracts continuing to be contracted in the same way they are today. However, if manufacturer rebates are eliminated completely, they could be transferred to lower POS costs through lower list prices, which would be product-specific, or through the chargeback model described above. While the price concessions in this model could in theory be spread by plan sponsors, manufacturers may challenge this approach and could word their contracts to prohibit applying rebates to other products. This would both eliminate the gap between POS and net costs and increase transparency on product- and plan-level pricing. Product-level POS price concessions would be particularly transparent in the Part D market because the CMS Plan Finder tool, available online, provides easy access to information on POS prices for every Part D plan in the market. Price transparency has the advantage of improving clarity on medication costs for beneficiaries, as well as the general public. However, it would also reveal previously confidential information on manufacturer contracting. This could possibly lead manufacturers to outbid each other—if a competitor’s price concession is known, a manufacturer can offer a slightly higher concession to gain formulary status—and could also give Part D plans, or even commercial plans, to push for a known rebate level offered to another plan. These additional pressures could lead to lower total costs. Alternatively, transparency could weaken manufacturers’ bargaining power and make manufacturers less likely to want to negotiate aggressive contracts. Manufacturers with high rebates today would likely not want their contract terms exposed such that others could view those terms and take them into account in their own contracting. IMPACT TO CONTRACT NEGOTIATIONS Plans and manufacturers may initially have competing incentives if manufacturer rebates are eliminated. Plans would shift focus away from high-price / high-rebate strategies to focus simply on lowest cost products. This allows for better alignment with manufacturers wishing to compete on list price alone. However, during the initial shift away from rebates, plans and manufacturers will naturally both be motivated to remain whole relative to prior years. For the manufacturer, this means the POS cost would be equal to the net cost (POS cost less rebates) when manufacturer rebates were in existence. But from the plan’s point of view, this would not produce neutral financials. Instead, plan liability would increase if the same magnitude of rebates were translated to POS discounts (whether through reduced list prices or POS price concessions). As a result, plan sponsors may push for stronger price concessions to keep their net liability neutral, rather than only keeping the net total cost neutral. On the other hand, manufacturers may be less willing to negotiate the same rebate levels. Some manufacturers might choose to reduce list prices to benefit all markets, not just Part D and, therefore, may not be willing to give additional concessions in Part D. As mentioned above, how price concessions are shared is an important factor. If price concessions are spread across multiple products, manufacturers may be less willing to give additional discounts since they would be subsidizing other products. Also, as negotiated rates become more transparent, it is possible manufacturers are less willing to give strong discounts, which could reveal previously confidential information and possibly imply strategies used in other markets where contracts are still confidential. This could be particularly true for manufacturers offering aggressive rebate levels today. Alternatively, transparency could cause manufacturers to concede additional discounts, since they would presumably know a certain level is necessary to beat a competitor’s price. Plans may seek stronger price concessions from manufacturers, but they may also negotiate additional price concessions from pharmacies. If manufacturer rebates are eliminated, it is possible plans focus on pharmacy price concessions first, since each dollar of DIR is able to reduce premiums by a greater amount than each dollar of POS cost reductions. While the high-price / high-rebate dynamics may be mitigated by the elimination of manufacturer rebates, plans may still have a strong focus on rebates if they still exist in
Milliman Client Report
U.S. Department of Health and Human Services Page 22
Impact of Potential Changes to the Treatment of Manufacturer Rebates January 31, 2019
any format post-POS. Plans could even structure DIR contracts to provide a greater dollar amount per generic script than brand script, which would align with the generic-focused formulary strategies discussed in Scenarios 2 and 3. With that said, $1 PMPM of increased pharmacy DIR may be more difficult to achieve than $1 PMPM of manufacturer price concessions. Pharmacy DIR only comprises about 15% of total rebates today, so a large percentage increase would be needed to offset changes in the treatment of manufacturer rebates. This was seen in Scenario 7, in which increased pharmacy DIR did less to offset member premium increases than in most other scenarios. IMPACT TO MANUFACTURERS Manufacturers may have differing strategies if manufacturer rebates are eliminated. Manufacturers currently not offering any Part D rebates on a given product may be less likely to change pricing or contracting strategies when manufacturer rebates are eliminated. Products with rebates, especially those in competitive therapeutic classes with multiple alternatives, will face the most pressure to offer the lowest POS cost, whether through lower list prices, negotiated price concessions, or some combination of these two approaches. When considering whether to reduce list prices, manufacturers will need to balance the impact in Part D with the impact to other markets. List prices are generally the basis of reimbursement across all markets, so a reduction in list price (with no separate price concession) could result in a higher net cost in Part D if the manufacturer is attempting to remain neutral across all markets. That said, a lower list price could potentially result in better formulary placement in the commercial market, which could improve sales volume. As discussed later in this section, lower list prices could have significant implications for rebates paid by manufacturers to state Medicaid programs, such that a reduction in list price could increase manufacturer revenue in Medicaid. Additionally, brand prices have received a great deal of public attention and scrutiny in recent years, so manufacturers may take the opportunity to explicitly reduce list prices, if even only by a small amount, to generate a positive public message. Price concessions could be used as the balancing item to then achieve a similar net cost in the Part D market. Manufacturers not applying an explicit reduction to list prices in the short-term might still reduce prices over the long-term by implementing smaller annual price increases than they otherwise would if rebates still existed in Part D. Additionally, when launching a new product intended to be used by the Medicare population, manufacturers generally recognize the value of rebates and may launch at a high list price and offer a rebate right away to get to the targeted net cost in the current system. Without rebates, manufacturers could choose to launch new products at a lower list price. One strategy manufacturers might use in reaction to the elimination of manufacturer rebates is the creation of authorized generics. An authorized generic is the same treatment as the brand, but marketed without the brand label, and sometimes sold at a lower cost. If the brand manufacturer produced an authorized generic at a lower list price and only contracted it in the Part D market, it could satisfy Part D plans by offering a lower price without disrupting pricing in other markets. This could be an option if negotiated price concessions are also prohibited. Manufacturers may have more success marketing biosimilars in Part D if manufacturer rebates are eliminated. Historically, biosimilars have been strongly disadvantaged in Part D because they were not eligible for the CGDP, which made plans much less likely to prefer them. The BBA changed this dynamic such that biosimilars are now eligible for the CGDP, though they are still often at a disadvantage to higher-cost biologics if the biologic offers a rebate. Without rebates, high-price / high-rebate strategies are mitigated and biosimilar manufacturers could potentially have greater success in Part D.

Milliman Client Report
U.S. Department of Health and Human Services Page 23
Impact of Potential Changes to the Treatment of Manufacturer Rebates January 31, 2019
IMPACT TO RETAIL PHARMACIES As modeled in Scenario 7, if manufacturer rebates are eliminated, retail pharmacies could receive additional pressure to provide greater rebates, given how valuable rebates are in reducing premiums. However, the results of Scenario 7 showed that greater savings could be achieved through other strategic changes. Increases in pharmacy rebates could potentially cut into retail pharmacy revenue and could also make it difficult for smaller, less profitable pharmacy chains to gain network access. On the other hand, if there are any increases in utilization as member cost sharing decreases, such as modeled in Scenario 6, the added volume could help pharmacy profits. Overall, pharmacies may be impacted less since they are not as affected by changes to brand costs and are less impacted by reimbursement pressures. IMPACT TO PBMS Many large health plans own their PBMs, so PBM reactions may align with plan strategies, particularly among those carriers. UnitedHealth Group, Humana, and CVS Health, the three largest Part D carriers accounting for more than half of total enrollment, each own their own PBM. The next largest Part D carrier, Aetna, recently merged with CVS Health, and Cigna acquired Express Scripts. As a result, formulary and rebate strategies for health plans could align with those of their owned PBMs, though those PBMs may not necessarily share the same strategies with other Part D customers for competitive reasons. Manufacturer administrative fees (MAF), which are paid from manufacturers to PBMs for formulary status, are not considered rebates by PBMs and, therefore, are often not passed through to Part D plans. The MAF is one component of PBM revenue, particularly in Part D where spread pricing is effectively not permitted based on pricing and reporting requirements. If list prices decrease, MAF (typically contracted as a percentage of list prices) would also decrease. Moreover, if the safe harbor protection on rebates is lifted, MAF may also be considered a kickback and, therefore, be prohibited. While PBMs do not currently classify MAF as a rebate, it may meet the definition of discount under the federal Anti-Kickback Statute. This could cause a significant reduction to PBM revenues. PBM revenue may shift to fixed costs paid by plans on a per script basis, which would require PBMs to determine what a reasonable alternative fee would be to maintain profitability. Alternatively, PBMs might move to pass through all rebates and MAF to the POS even if rebates are not prohibited—PBMs have been moving in this direction in recent years, and doing so would allow the current structure of negotiated rebates to remain largely intact. Most PBMs own their own specialty and / or mail order pharmacies, and therefore, are able to generate more revenue when prescriptions are dispensed at these locations. PBMs may try to offset potential revenue decreases by pushing Part D members to owned specialty and mail order pharmacies. This incentive already exists today, but could be boosted by the loss of manufacturer rebates and may be particularly aligned within carrier-owned PBMs who can set lower mail order cost sharing to incentivize members to use mail. Price protection rebates are common in current Part D manufacturer rebate contracts, providing an additional rebate to the extent list prices increase above a pre-defined rate. While price protections are a part of rebates and are required to be passed through from PBMs to plans, in a new environment without manufacturer rebates, perhaps PBMs could leverage similar price protection arrangements as a means to further reduce POS costs. IMPACT TO COMMERCIAL MARKET Changes to the federal Anti-Kickback Statute would not directly affect commercial rebates. Recent interpretation suggests that commercial plans offered under the ACA health insurance exchanges are not considered federal health care programs, and thus, are excluded from the Anti-Kickback Statute11. While the current administration has given no indication they intend to revise this treatment, should the administration revise both their interpretation of the ACA as a federal health care program and the rebate safe harbor, this could significantly alter practices in the commercial market that have heretofore not been
11 Radick, Robert. “The Anti-Kickback Statute and the Affordable Care Act: A Law Enforcement Tool Suddenly Goes Missing.” Forbes. https://www.forbes.com/sites/insider/2013/11/13/the-anti-kickback-statute-and-the-affordable-care-act-a-law-enforcement-tool-suddenly-goes-missing/#771910f11cea.

Milliman Client Report
U.S. Department of Health and Human Services Page 24
Impact of Potential Changes to the Treatment of Manufacturer Rebates January 31, 2019
subject to the Anti-Kickback Statute. If that were to occur, the impact to the commercial market would largely mirror the impact to the Part D market. Member cost sharing savings could potentially be higher, to the extent commercial members have high-deductible health plans directly benefitting from lower POS costs. Premiums would increase in the commercial market as well, though plans might potentially not react as strongly as not all commercial plans are as premium-sensitive as in the Part D market, or the standalone PDP market in particular, which does not exist in commercial. Assuming any changes to the rebate safe harbor do not directly impact the commercial market, there could still be some spillover impact to this market. Some plans in the commercial market already reflect rebates at the POS. For example, UnitedHealth Group and Aetna both announced they will be passing through rebates at the POS for fully insured commercial group customers beginning in 2019. Rebates are not as valuable to plans in the commercial market as in Part D, which in some ways makes it easier and less impactful to use POS discounts instead of rebates. For carriers and PBMs operating in both the commercial and Part D markets (which is the case for a majority of companies), it may be difficult to maintain two different reimbursement strategies, particularly in terms of contracting with manufacturers. Given this and the advantage of lowering costs for members with high deductibles and / or coinsurance, plans may choose to adjust commercial strategies to follow suit with Part D. On the other hand, it is also possible plans and PBMs react in the commercial market by valuing rebates even more, shifting focus toward this market where manufacturer rebates can still be used to keep premiums low. As mentioned previously, manufacturer changes to list prices, whether through explicit one-time reductions or changes to price trends over time, will directly impact the commercial market. If list prices go down, commercial plans may benefit while still being permitted to keep rebates as well, which could improve overall revenue. IMPACT TO MEDICAID The analysis presented in the previous section focused on removing manufacturer rebates in Part D, which could be done by changing the safe harbor protection on rebates under the federal Anti-Kickback Statute. It is important to note the rebate safe harbor currently applies to all federal healthcare programs, including Medicaid. However, it is uncertain whether lifting the safe harbor completely would eliminate all rebates in Medicaid, since the URA is statutorily defined. Under a very broad definition of eliminating manufacturer rebates, one could assume legislation would be adjusted such that all rebates in all federal healthcare programs, including both the URA and supplemental Medicaid rebates, would be prohibited. However, this may be unlikely because it would cause a significant increase in both state and federal government costs for Medicaid, at a time when budget pressure in this program is enormous. Eliminating manufacturer rebates in Part D has advantages of reducing member cost sharing and potentially changing plan behaviors to shift away from high-price / high-rebate strategies and focus more on the lowest net cost, which could possibly lead to lower overall program costs and lower government spending over time. However, most of these effects do not apply in the Medicaid market. In Part D, the CGDP and reinsurance complicate the impact of rebates relative to lower POS costs, since rebate sharing does not impact all stakeholders in the same way. Additionally, member cost sharing in Medicaid is already negligible, so a lower POS cost would not affect member spending and may not influence their decisions. States and MCOs already are motivated to manage to the lowest POS costs, but also have limited tools to influence member behavior, both of which mean there is much less potential to reduce total Medicaid pharmacy spending to offset the loss of rebates. Further, the value of supplemental rebates is fairly small (typically in the low single-digits as a percent of total pharmacy costs), which makes it less likely for strategies to change if these rebates are altered, simply due to the lower magnitude of impact. Eliminating Supplemental Rebates in Medicaid Most states collect some level of supplemental rebates. In many cases, multiple states take part in a purchasing pool, in which the PBM helps negotiate supplemental rebates for the entire pool. MCOs sometimes also negotiate supplemental rebates (if permitted by law), though typically only one of the state

Milliman Client Report
U.S. Department of Health and Human Services Page 25
Impact of Potential Changes to the Treatment of Manufacturer Rebates January 31, 2019
or the MCO will collect supplemental rebates for a given brand, depending on which entity is responsible for managing the PDL (or the relevant portion of the PDL, as some states manage only certain classes). In cases where the state manages the PDL and collects supplemental rebates, the PDL may be more brand-heavy and also may favor higher cost brands because the rebates more than make up for the higher starting cost. The net cost to the state after rebates is often lower for a brand, sometimes even in comparison to a generic alternative. If all supplemental rebates were eliminated, PDL strategies might shift toward medications with lower list prices, though if the federal URA still exists, there may still be strong incentive to cover brands (given the URA is many multiples higher than most supplemental rebates). Moreover, a shift toward products with lower list prices would not necessarily save the government money, since the net cost is often lower for a brand than for a generic or lower-priced brand. Without rebates, a generic may become the lower net cost option compared to a brand, but it may still have a higher net cost than the brand had when rebates were permitted. In cases where MCOs currently manage the PDL, PDL strategies could shift towards more generic and less brand coverage. The MCO’s only concern would be lowest POS cost and the MCO does not collect any of the federal URA. However, it is uncertain whether there would be overall savings in costs to offset the loss of rebates, given this would result in lower URA collected by the state and federal governments. The URA can average 50% or more of total pharmacy spending, so shifting toward generic products, which have a significantly lower URA, may not compensate for lower gross costs. Additionally, because MCOs already are incentivized to favor generics and there are likely few cases where MCO-collected rebates are great enough to offset the cost differential relative to a generic alternative, eliminating manufacturer rebates may not impact PDL strategies in a material way. Impact to Medicaid of Eliminating Part D Rebates Even if all Medicaid rebates continue to be excluded from the Anti-Kickback Statute, the removal of manufacturer rebates in Part D could potentially still impact the Medicaid program. Part D rebates do not directly affect the Medicaid program since they are excluded from the definition of Best Price. However, if changes to Part D rebates result in changes in list prices, this would have a direct impact on Medicaid prices and rebates. As list price changes, it affects the Medicaid gross claim cost, as well as the rebate. These changes have opposing effects – if list price decreases, gross claims decrease in turn. However, rebates will decrease, which could more than offset the reduction in gross claims. The impact to the URA is twofold:
The basic rebate amount would be lower because it is calculated as 23.1% of a lower AMP value (or because the difference between AMP and Best Price is also correspondingly lower)
The inflationary component of the rebate would also be lower because the relativity between current AMP and AMP at time of product launch decreases
We estimate these URA impacts would result in an increase in total government costs for the Medicaid program. To illustrate, consider the following hypothetical example:
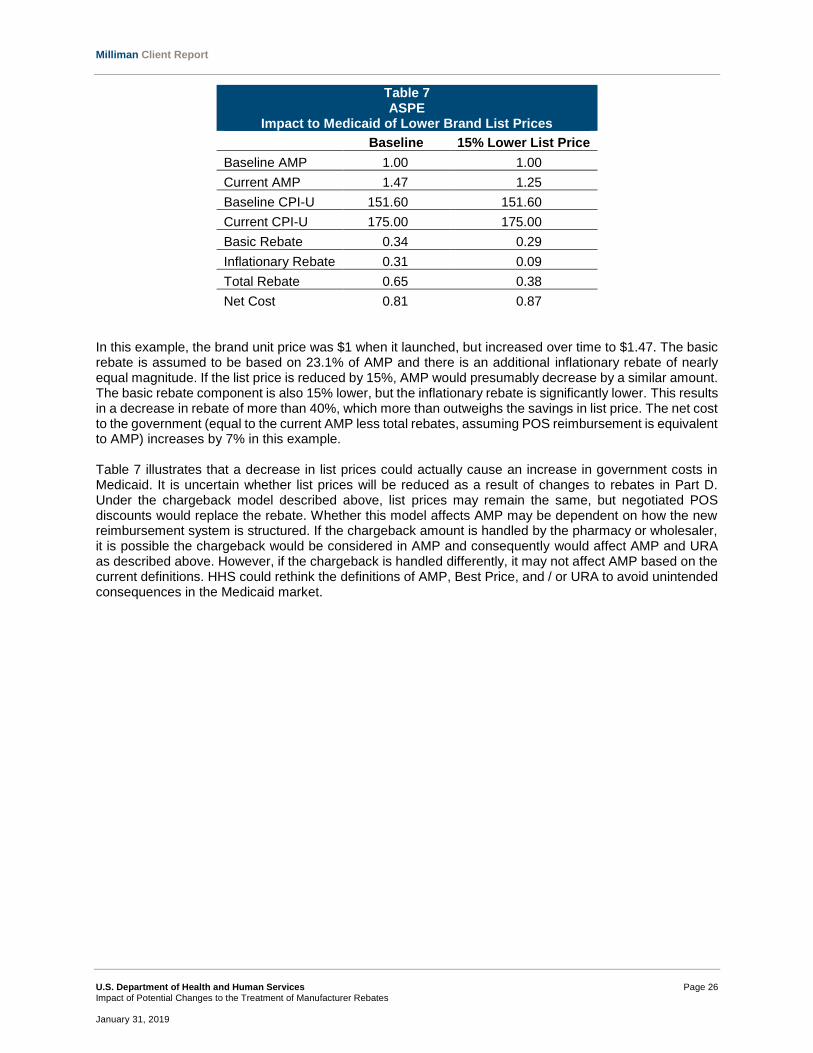
Milliman Client Report
U.S. Department of Health and Human Services Page 26
Impact of Potential Changes to the Treatment of Manufacturer Rebates January 31, 2019
Table 7 ASPE
Impact to Medicaid of Lower Brand List Prices
Baseline 15% Lower List Price
Baseline AMP 1.00 1.00
Current AMP 1.47 1.25
Baseline CPI-U 151.60 151.60
Current CPI-U 175.00 175.00
Basic Rebate 0.34 0.29
Inflationary Rebate 0.31 0.09
Total Rebate 0.65 0.38
Net Cost 0.81 0.87 In this example, the brand unit price was $1 when it launched, but increased over time to $1.47. The basic rebate is assumed to be based on 23.1% of AMP and there is an additional inflationary rebate of nearly equal magnitude. If the list price is reduced by 15%, AMP would presumably decrease by a similar amount. The basic rebate component is also 15% lower, but the inflationary rebate is significantly lower. This results in a decrease in rebate of more than 40%, which more than outweighs the savings in list price. The net cost to the government (equal to the current AMP less total rebates, assuming POS reimbursement is equivalent to AMP) increases by 7% in this example. Table 7 illustrates that a decrease in list prices could actually cause an increase in government costs in Medicaid. It is uncertain whether list prices will be reduced as a result of changes to rebates in Part D. Under the chargeback model described above, list prices may remain the same, but negotiated POS discounts would replace the rebate. Whether this model affects AMP may be dependent on how the new reimbursement system is structured. If the chargeback amount is handled by the pharmacy or wholesaler, it is possible the chargeback would be considered in AMP and consequently would affect AMP and URA as described above. However, if the chargeback is handled differently, it may not affect AMP based on the current definitions. HHS could rethink the definitions of AMP, Best Price, and / or URA to avoid unintended consequences in the Medicaid market.

Milliman Client Report
U.S. Department of Health and Human Services Page 27
Impact of Potential Changes to the Treatment of Manufacturer Rebates January 31, 2019
V. METHODOLOGY AND ASSUMPTIONS We used Milliman’s Part D Analysis and Rating Tool (DART) to complete this analysis. This model is designed to project historical claims data forward for the purpose of creating Medicare Part D bids. The underlying data reflects Milliman’s manual rates. The manual rates, adjustment factors, assumed demographics, and risk scores in the Milliman Medicare Part D pricing models are based on individual Medicare Part D experience, including over 40 million member months across 34 U.S. regions and Puerto Rico. Our model relies on separate LI and NLI claim probability distributions providing allowed spend levels based on the average price for medications split by product type and distribution channel. We calibrated to the published 2019 Part D national average amounts, using the manual rate data described above with trend and generic pipeline adjustments to project to 2019. We adjusted the data to average contracting / non-benefit expense assumptions from Milliman’s Medicare Part D Contract Survey, which surveyed Part D plan sponsors on the assumptions underlying their Part D bid development. For simplicity, our baseline scenario assumed the 2019 defined standard benefit, which includes changes to CGDP as a result of the BBA. For 2020 and future values, we began with our 2019 projection, and we applied annual trends to gross costs and the Part D benefit parameters, using information from the 2018 Medicare Trustees report. Note, the Trustees report includes the anticipated large increase in TrOOP expected to occur in 2020. We used public enrollment files from CMS to estimate the proportion of LI and NLI members nationwide. To estimate LIPS, we assumed that on average, 95% of LI premiums are paid by the government through premium subsidies. To convert manufacturer rebates to lower POS costs, we calculated the average wholesale price (AWP) discount required to achieve the same allowed cost net of rebates as in the baseline scenario. Manufacturer rebates were assumed to apply to specialty and brand prescriptions only. In our 2020 baseline scenario, we assumed total rebates (manufacturer and pharmacy) were equal to about 27.5% of allowed costs and that 15% of total rebates were attributable to pharmacy rebates. In future years, we held the 2020 AWP discount constant. In Scenario 2, we assumed GDR would increase within the first several years. We assumed GDR would be higher than in the baseline by 0.5% in 2020, and gradually continue to increase until it was 2.5% higher than the baseline in 2023 and all future years. In Scenario 3, we applied more gradual GDR increase assumptions with the ultimate 2029 GDR coming in 2.0% higher than the baseline. We also assumed price concessions would increase within the first several years of the 10-year projection for brands. We reduced brand POS costs by 0.5% per year for each of the first 5 years of the projection. In Scenario 4, we adjusted the conversion of manufacturer rebates to lower POS costs described above such that the resulting discounts offset 80% of the lost manufacturer rebates (Scenario 1 assumes the discounts offset 100% of the lost manufacturer rebates). In Scenario 5, we decreased brand unit cost trend by 1.0% per year, beginning in 2020. In Scenario 6, we increased brand use trend by 0.5% and decreased brand unit cost trend by 1.0% per year, beginning in 2020. In Scenario 7, we increased pharmacy rebates by 5% in each year from 2020 to 2024.

Milliman Client Report
U.S. Department of Health and Human Services Page 28
Impact of Potential Changes to the Treatment of Manufacturer Rebates January 31, 2019
VI. CAVEATS, LIMITATIONS, AND QUALIFICATIONS This report was developed to help ASPE better understand the impact of potential changes to the Medicare Part D program. This information may not be appropriate, and should not be used, for other purposes. This report is provided for the use of ASPE. ASPE may share this information with outside entities with Milliman’s permission. Milliman does not intend to benefit, and assumes no duty or liability to, other parties who receive this work product. Any third party recipient of this work product who desires professional guidance should not rely upon Milliman’s work product, but should engage qualified professionals for advice appropriate to its own specific needs. Any releases of this report to a third party should be in its entirety. Milliman does not endorse any public policy or advocacy position on matters discussed in this report. Please note that in preparing our estimates, we relied upon a Milliman database of national Medicare Part D claims, public information from CMS, and the 2018 Medicare Trustees Report. Actual results will certainly vary for specific health plans due to differences in demographics, trends, discount arrangements, formulary, utilization patterns, and rebate arrangements, among other factors. Note that we did not attempt to evaluate every possible change in stakeholder behavior that may result from these potential program changes. Results will vary based on how members and other stakeholders react to the changes if implemented. The authors are actuaries for Milliman, members of the American Academy of Actuaries, and meet the Qualification Standards of the Academy to render the actuarial opinion contained herein. To the best of our knowledge and belief, this information is complete and accurate and has been prepared in accordance with generally recognized and accepted actuarial principles and practices. This report outlines the review and opinions of the authors and not necessarily that of Milliman. The terms of Milliman’s subcontractor agreement with the RAND Corporation to perform work for ASPE, effective October 26, 2018 and amended January 30, 2019, apply to this information and its use.
Milliman Client Report
U.S. Department of Health and Human Services
Impact of Potential Changes to the Treatment of Manufacturer Rebates January 31, 2019
APPENDICES

Milliman Client Report
U.S. Department of Health and Human Services Page A-1
Impact of Potential Changes to the Treatment of Manufacturer Rebates January 31, 2019
Appendix A1
ASPE
Impact of Potential Changes to the Treatment of Manufacturer Rebates and Behavioral Changes
Annual Dollar Impact of Removing Manufacturer Rebates (Billions of Dollars)
Scenario 1
Year 2020 2021 2022 2023 2024 2025 2026 2027 2028 2029Ten Year
Impact
Member Cost Sharing -$2.8 -$3.0 -$3.3 -$3.6 -$3.9 -$4.2 -$4.4 -$4.8 -$5.2 -$5.6 -$40.8
Member Premium 1.8 2.0 2.2 2.3 2.5 2.7 2.9 3.1 3.3 3.6 26.4
Total Member Costs -1.0 -1.1 -1.2 -1.3 -1.4 -1.5 -1.6 -1.7 -1.8 -2.0 -14.5
NAR -7.3 -8.0 -8.6 -9.2 -9.9 -10.4 -11.2 -11.9 -12.8 -13.8 -103.1
NADS 15.1 16.4 17.8 19.1 20.6 21.9 23.4 25.1 27.0 29.0 215.4
LICS -5.8 -6.3 -7.0 -7.7 -8.4 -9.2 -10.0 -10.8 -11.8 -12.6 -89.5
LIPS 0.8 0.9 1.0 1.1 1.1 1.2 1.3 1.4 1.5 1.6 12.0
Total Government Costs 2.8 3.0 3.2 3.3 3.5 3.5 3.6 3.8 4.0 4.2 34.8
CGDP -1.9 -2.0 -2.0 -2.0 -2.1 -2.1 -2.1 -2.1 -2.2 -2.2 -20.6
Total Gross Allowed Costs -$43.4 -$48.2 -$53.2 -$58.2 -$63.8 -$68.8 -$75.0 -$81.6 -$89.5 -$97.9 -$679.7
Scenario 2
Year 2020 2021 2022 2023 2024 2025 2026 2027 2028 2029Ten Year
Impact
Member Cost Sharing -$3.1 -$4.4 -$5.3 -$6.1 -$6.6 -$6.9 -$7.3 -$7.8 -$8.3 -$8.8 -$64.6
Member Premium 1.5 0.9 0.6 0.5 0.6 0.6 0.7 0.8 0.9 1.0 8.4
Total Member Costs -1.6 -3.5 -4.7 -5.6 -6.0 -6.3 -6.6 -6.9 -7.3 -7.8 -56.2
NAR -7.9 -10.1 -11.6 -12.8 -13.7 -14.5 -15.5 -16.4 -17.6 -19.0 -139.1
NADS 14.5 14.1 14.4 14.9 16.1 17.2 18.5 19.9 21.6 23.5 174.7
LICS -6.2 -8.0 -9.3 -10.4 -11.4 -12.3 -13.4 -14.5 -15.8 -17.0 -118.3
LIPS 0.7 0.4 0.3 0.2 0.3 0.3 0.3 0.4 0.4 0.5 3.8
Total Government Costs 1.1 -3.6 -6.2 -8.1 -8.7 -9.3 -10.0 -10.6 -11.4 -12.1 -78.8
CGDP -2.0 -2.6 -2.8 -3.0 -3.1 -3.1 -3.1 -3.2 -3.3 -3.3 -29.5
Total Gross Allowed Costs -$45.9 -$57.8 -$66.9 -$74.8 -$81.6 -$87.4 -$94.7 -$102.3 -$111.4 -$121.1 -$843.8
Scenario 3
Year 2020 2021 2022 2023 2024 2025 2026 2027 2028 2029Ten Year
Impact
Member Cost Sharing -$3.0 -$4.1 -$5.0 -$5.8 -$6.4 -$6.9 -$7.4 -$7.8 -$8.3 -$8.8 -$63.5
Member Premium 1.6 1.0 0.6 0.3 0.1 0.0 0.1 0.1 0.1 0.2 4.0
Total Member Costs -1.4 -3.1 -4.5 -5.5 -6.3 -6.8 -7.3 -7.7 -8.1 -8.7 -59.5
NAR -8.0 -10.4 -12.5 -14.5 -16.4 -17.5 -18.7 -20.1 -21.7 -23.5 -163.2
NADS 14.8 14.7 15.0 15.6 16.7 17.7 19.0 20.5 22.3 24.2 180.3
LICS -6.1 -7.8 -9.1 -10.4 -11.5 -12.5 -13.5 -14.6 -15.9 -17.1 -118.5
LIPS 0.7 0.5 0.3 0.1 0.0 0.0 0.0 0.0 0.1 0.1 1.9
Total Government Costs 1.5 -3.0 -6.3 -9.2 -11.2 -12.2 -13.2 -14.2 -15.3 -16.4 -99.6
CGDP -2.0 -2.5 -2.7 -2.9 -3.0 -3.1 -3.2 -3.2 -3.3 -3.4 -29.1
Total Gross Allowed Costs -$45.3 -$56.7 -$66.7 -$75.8 -$84.3 -$90.9 -$98.7 -$106.7 -$116.2 -$126.4 -$867.7

Milliman Client Report
U.S. Department of Health and Human Services Page A-2
Impact of Potential Changes to the Treatment of Manufacturer Rebates January 31, 2019
Appendix A1
ASPE
Impact of Potential Changes to the Treatment of Manufacturer Rebates and Behavioral Changes
Annual Dollar Impact of Removing Manufacturer Rebates (Billions of Dollars)
Scenario 4
Year 2020 2021 2022 2023 2024 2025 2026 2027 2028 2029Ten Year
Impact
Member Cost Sharing -$2.2 -$2.4 -$2.7 -$2.9 -$3.1 -$3.3 -$3.6 -$3.8 -$4.1 -$4.4 -$32.6
Member Premium 2.9 3.2 3.6 3.9 4.2 4.6 5.0 5.4 5.8 6.3 44.9
Total Member Costs 0.7 0.8 0.9 1.0 1.1 1.2 1.4 1.6 1.7 1.9 12.3
NAR -3.0 -3.1 -3.1 -3.2 -3.1 -3.1 -3.0 -2.9 -2.8 -2.8 -30.2
NADS 15.6 16.9 18.3 19.7 21.2 22.5 24.1 25.7 27.6 29.6 221.1
LICS -4.4 -4.9 -5.5 -6.0 -6.7 -7.4 -8.0 -8.7 -9.5 -10.2 -71.4
LIPS 1.4 1.5 1.6 1.8 1.9 2.1 2.2 2.4 2.6 2.9 20.5
Total Government Costs 9.5 10.4 11.3 12.3 13.3 14.1 15.3 16.4 17.9 19.4 139.9
CGDP -1.5 -1.6 -1.7 -1.7 -1.7 -1.7 -1.7 -1.8 -1.8 -1.8 -17.1
Total Gross Allowed Costs -$34.7 -$38.6 -$42.6 -$46.6 -$51.0 -$55.0 -$60.0 -$65.3 -$71.5 -$78.3 -$543.6
Scenario 5
Year 2020 2021 2022 2023 2024 2025 2026 2027 2028 2029Ten Year
Impact
Member Cost Sharing -$2.8 -$3.2 -$3.6 -$4.0 -$4.4 -$4.7 -$5.2 -$5.6 -$6.2 -$6.8 -$46.5
Member Premium 1.7 1.7 1.7 1.6 1.5 1.4 1.3 1.1 0.8 0.5 13.3
Total Member Costs -1.2 -1.5 -1.9 -2.4 -2.8 -3.3 -3.9 -4.6 -5.3 -6.2 -33.1
NAR -7.8 -9.1 -10.5 -12.0 -13.7 -15.4 -17.5 -19.9 -22.7 -26.0 -154.6
NADS 15.0 16.3 17.6 18.9 20.2 21.5 22.9 24.5 26.3 28.3 211.4
LICS -5.9 -6.7 -7.5 -8.4 -9.4 -10.4 -11.4 -12.6 -13.9 -15.2 -101.3
LIPS 0.8 0.8 0.8 0.7 0.7 0.6 0.6 0.5 0.4 0.2 6.1
Total Government Costs 2.1 1.3 0.4 -0.7 -2.1 -3.7 -5.5 -7.5 -9.9 -12.7 -38.4
CGDP -1.9 -2.0 -2.1 -2.2 -2.3 -2.3 -2.4 -2.4 -2.6 -2.7 -22.8
Total Gross Allowed Costs -$44.4 -$50.4 -$56.8 -$63.5 -$71.0 -$78.1 -$86.8 -$96.2 -$107.4 -$119.6 -$774.3
Scenario 6
Year 2020 2021 2022 2023 2024 2025 2026 2027 2028 2029Ten Year
Impact
Member Cost Sharing -$2.8 -$3.1 -$3.4 -$3.8 -$4.1 -$4.4 -$4.7 -$5.0 -$5.5 -$5.9 -$42.7
Member Premium 1.7 1.8 1.8 1.8 1.8 1.8 1.7 1.6 1.5 1.3 16.7
Total Member Costs -1.1 -1.3 -1.6 -2.0 -2.3 -2.6 -3.0 -3.4 -4.0 -4.6 -26.0
NAR -7.7 -8.9 -10.1 -11.4 -12.9 -14.4 -16.2 -18.2 -20.6 -23.5 -143.8
NADS 15.1 16.4 17.7 19.1 20.5 21.8 23.3 25.0 26.9 29.0 214.8
LICS -5.9 -6.7 -7.5 -8.4 -9.4 -10.4 -11.4 -12.6 -13.9 -15.2 -101.3
LIPS 0.8 0.8 0.8 0.8 0.8 0.8 0.8 0.7 0.7 0.6 7.6
Total Government Costs 2.2 1.7 1.0 0.1 -0.9 -2.1 -3.5 -5.1 -6.9 -9.0 -22.7
CGDP -1.9 -2.0 -2.0 -2.1 -2.1 -2.1 -2.2 -2.2 -2.3 -2.3 -21.2
Total Gross Allowed Costs -$44.2 -$49.9 -$55.9 -$62.2 -$69.2 -$75.7 -$83.8 -$92.4 -$102.7 -$113.9 -$749.8
Scenario 7
Year 2020 2021 2022 2023 2024 2025 2026 2027 2028 2029Ten Year
Impact
Member Cost Sharing -$2.8 -$3.0 -$3.3 -$3.6 -$3.9 -$4.2 -$4.4 -$4.8 -$5.2 -$5.6 -$40.8
Member Premium 1.7 1.8 1.9 2.0 2.1 2.3 2.4 2.6 2.8 3.0 22.8
Total Member Costs -1.0 -1.2 -1.4 -1.6 -1.8 -1.9 -2.0 -2.2 -2.3 -2.5 -18.1
NAR -7.5 -8.2 -9.0 -9.8 -10.7 -11.3 -12.1 -12.9 -13.8 -15.0 -110.2
NADS 14.9 16.1 17.2 18.4 19.6 20.9 22.4 24.0 25.8 27.8 207.1
LICS -5.8 -6.3 -7.0 -7.7 -8.4 -9.2 -10.0 -10.8 -11.8 -12.6 -89.5
LIPS 0.8 0.9 0.9 0.9 1.0 1.0 1.1 1.2 1.3 1.4 10.4
Total Government Costs 2.5 2.4 2.2 1.9 1.5 1.4 1.4 1.5 1.5 1.6 17.8
CGDP -1.9 -2.0 -2.0 -2.0 -2.1 -2.1 -2.1 -2.1 -2.2 -2.2 -20.6
Total Gross Allowed Costs -$43.4 -$48.2 -$53.2 -$58.2 -$63.8 -$68.8 -$75.0 -$81.6 -$89.5 -$97.9 -$679.7

Milliman Client Report
U.S. Department of Health and Human Services Page A-3
Impact of Potential Changes to the Treatment of Manufacturer Rebates January 31, 2019
Appendix A2
ASPE
Impact of Potential Changes to the Treatment of Manufacturer Rebates and Behavioral Changes
Dollar Impact of Removing Manufacturer Rebates (PMPM)
Scenario 1
Year 2020 2021 2022 2023 2024 2025 2026 2027 2028 2029Ten Year
Average
Member Cost Sharing -$4.85 -$5.12 -$5.46 -$5.79 -$6.06 -$6.27 -$6.53 -$6.85 -$7.19 -$7.54 -$6.23
Member Premium $3.15 $3.33 $3.51 $3.70 $3.89 $4.06 $4.24 $4.45 $4.67 $4.85 $4.03
Total Member Costs -$1.70 -$1.80 -$1.95 -$2.09 -$2.18 -$2.21 -$2.28 -$2.40 -$2.52 -$2.69 -$2.20
NAR -$12.84 -$13.43 -$14.04 -$14.62 -$15.24 -$15.66 -$16.37 -$17.07 -$17.82 -$18.75 -$15.73
NADS $26.35 $27.64 $28.99 $30.37 $31.77 $32.89 $34.38 $35.99 $37.65 $39.36 $32.86
LICS -$10.06 -$10.69 -$11.35 -$12.15 -$12.96 -$13.80 -$14.62 -$15.54 -$16.43 -$17.15 -$13.66
LIPS $1.48 $1.54 $1.61 $1.69 $1.77 $1.84 $1.92 $2.02 $2.12 $2.20 $1.84
Total Government Costs $4.93 $5.06 $5.21 $5.29 $5.34 $5.27 $5.32 $5.41 $5.52 $5.66 $5.32
CGDP -$3.24 -$3.28 -$3.26 -$3.23 -$3.19 -$3.09 -$3.08 -$3.05 -$3.05 -$3.02 -$3.14
Total Gross Allowed Costs -$75.90 -$81.18 -$86.77 -$92.40 -$98.45 -$103.28 -$110.08 -$117.27 -$124.88 -$132.93 -$103.70
Scenario 2
Year 2020 2021 2022 2023 2024 2025 2026 2027 2028 2029Ten Year
Average
Member Cost Sharing -$5.44 -$7.46 -$8.68 -$9.64 -$10.12 -$10.40 -$10.77 -$11.14 -$11.54 -$11.95 -$9.85
Member Premium $2.70 $1.58 $1.05 $0.79 $0.87 $0.96 $1.06 $1.18 $1.31 $1.42 $1.27
Total Member Costs -$2.74 -$5.88 -$7.63 -$8.85 -$9.26 -$9.44 -$9.71 -$9.96 -$10.23 -$10.53 -$8.58
NAR -$13.78 -$16.97 -$18.92 -$20.33 -$21.15 -$21.72 -$22.67 -$23.63 -$24.63 -$25.81 -$21.22
NADS $25.35 $23.70 $23.40 $23.68 $24.83 $25.82 $27.18 $28.64 $30.19 $31.84 $26.65
LICS -$10.83 -$13.48 -$15.09 -$16.50 -$17.56 -$18.54 -$19.64 -$20.83 -$22.03 -$23.09 -$18.04
LIPS $1.26 $0.73 $0.48 $0.36 $0.39 $0.44 $0.48 $0.54 $0.59 $0.64 $0.58
Total Government Costs $2.01 -$6.02 -$10.12 -$12.79 -$13.48 -$14.00 -$14.64 -$15.28 -$15.88 -$16.41 -$12.03
CGDP -$3.58 -$4.33 -$4.60 -$4.77 -$4.76 -$4.62 -$4.61 -$4.59 -$4.57 -$4.53 -$4.51
Total Gross Allowed Costs -$80.19 -$97.31 -$109.03 -$118.71 -$125.85 -$131.24 -$138.94 -$147.00 -$155.46 -$164.32 -$128.73
Scenario 3
Year 2020 2021 2022 2023 2024 2025 2026 2027 2028 2029Ten Year
Average
Member Cost Sharing -$5.22 -$6.96 -$8.23 -$9.21 -$9.83 -$10.33 -$10.81 -$11.18 -$11.56 -$11.97 -$9.68
Member Premium $2.77 $1.70 $0.96 $0.42 $0.09 $0.07 $0.10 $0.14 $0.18 $0.21 $0.61
Total Member Costs -$2.44 -$5.26 -$7.27 -$8.80 -$9.74 -$10.26 -$10.71 -$11.04 -$11.38 -$11.76 -$9.07
NAR -$13.89 -$17.45 -$20.37 -$22.98 -$25.31 -$26.21 -$27.48 -$28.84 -$30.28 -$31.94 -$24.89
NADS $25.80 $24.73 $24.47 $24.75 $25.70 $26.52 $27.89 $29.43 $31.06 $32.81 $27.51
LICS -$10.61 -$13.08 -$14.88 -$16.49 -$17.76 -$18.73 -$19.83 -$21.02 -$22.21 -$23.26 -$18.08
LIPS $1.30 $0.79 $0.44 $0.19 $0.04 $0.03 $0.04 $0.06 $0.08 $0.09 $0.28
Total Government Costs $2.60 -$5.01 -$10.33 -$14.53 -$17.32 -$18.39 -$19.38 -$20.37 -$21.34 -$22.30 -$15.19
CGDP -$3.45 -$4.14 -$4.43 -$4.59 -$4.65 -$4.60 -$4.65 -$4.62 -$4.60 -$4.55 -$4.45
Total Gross Allowed Costs -$79.19 -$95.53 -$108.75 -$120.26 -$130.13 -$136.51 -$144.79 -$153.28 -$162.20 -$171.55 -$132.39

Milliman Client Report
U.S. Department of Health and Human Services Page A-4
Impact of Potential Changes to the Treatment of Manufacturer Rebates January 31, 2019
Appendix A2
ASPE
Impact of Potential Changes to the Treatment of Manufacturer Rebates and Behavioral Changes
Dollar Impact of Removing Manufacturer Rebates (PMPM)
Scenario 4
Year 2020 2021 2022 2023 2024 2025 2026 2027 2028 2029Ten Year
Average
Member Cost Sharing -$3.86 -$4.08 -$4.34 -$4.62 -$4.84 -$5.02 -$5.22 -$5.45 -$5.74 -$6.03 -$4.97
Member Premium $5.11 $5.45 $5.80 $6.17 $6.54 $6.87 $7.26 $7.69 $8.13 $8.56 $6.84
Total Member Costs $1.25 $1.37 $1.47 $1.55 $1.69 $1.86 $2.04 $2.23 $2.39 $2.53 $1.87
NAR -$5.26 -$5.22 -$5.13 -$5.00 -$4.85 -$4.63 -$4.45 -$4.21 -$3.95 -$3.80 -$4.61
NADS $27.19 $28.50 $29.86 $31.25 $32.67 $33.82 $35.30 $36.86 $38.50 $40.17 $33.73
LICS -$7.77 -$8.31 -$8.90 -$9.57 -$10.27 -$11.06 -$11.75 -$12.53 -$13.29 -$13.89 -$10.89
LIPS $2.39 $2.52 $2.66 $2.82 $2.98 $3.12 $3.30 $3.49 $3.69 $3.89 $3.12
Total Government Costs $16.55 $17.49 $18.50 $19.51 $20.53 $21.24 $22.39 $23.61 $24.94 $26.37 $21.35
CGDP -$2.68 -$2.71 -$2.70 -$2.68 -$2.65 -$2.57 -$2.56 -$2.55 -$2.52 -$2.48 -$2.60
Total Gross Allowed Costs -$60.70 -$64.92 -$69.39 -$73.89 -$78.73 -$82.60 -$88.03 -$93.78 -$99.87 -$106.30 -$82.93
Scenario 5
Year 2020 2021 2022 2023 2024 2025 2026 2027 2028 2029Ten Year
Average
Member Cost Sharing -$4.95 -$5.37 -$5.84 -$6.32 -$6.75 -$7.12 -$7.58 -$8.10 -$8.64 -$9.20 -$7.09
Member Premium $2.92 $2.84 $2.72 $2.57 $2.38 $2.14 $1.86 $1.55 $1.18 $0.72 $2.04
Total Member Costs -$2.03 -$2.52 -$3.12 -$3.75 -$4.37 -$4.98 -$5.72 -$6.54 -$7.46 -$8.48 -$5.05
NAR -$13.71 -$15.31 -$17.08 -$18.98 -$21.11 -$23.11 -$25.71 -$28.55 -$31.70 -$35.31 -$23.58
NADS $26.26 $27.45 $28.69 $29.93 $31.23 $32.21 $33.61 $35.14 $36.73 $38.37 $32.26
LICS -$10.31 -$11.22 -$12.18 -$13.27 -$14.44 -$15.60 -$16.79 -$18.12 -$19.44 -$20.63 -$15.46
LIPS $1.37 $1.31 $1.25 $1.18 $1.09 $0.97 $0.84 $0.70 $0.54 $0.33 $0.93
Total Government Costs $3.60 $2.23 $0.67 -$1.14 -$3.23 -$5.52 -$8.05 -$10.82 -$13.88 -$17.24 -$5.85
CGDP -$3.31 -$3.40 -$3.45 -$3.46 -$3.49 -$3.42 -$3.46 -$3.52 -$3.57 -$3.62 -$3.48
Total Gross Allowed Costs -$77.64 -$84.88 -$92.69 -$100.78 -$109.57 -$117.25 -$127.37 -$138.23 -$149.88 -$162.38 -$118.14
Scenario 6
Year 2020 2021 2022 2023 2024 2025 2026 2027 2028 2029Ten Year
Average
Member Cost Sharing -$4.89 -$5.23 -$5.61 -$5.99 -$6.32 -$6.57 -$6.87 -$7.24 -$7.62 -$8.01 -$6.51
Member Premium $2.98 $2.96 $2.92 $2.86 $2.76 $2.64 $2.47 $2.29 $2.08 $1.78 $2.55
Total Member Costs -$1.91 -$2.26 -$2.69 -$3.13 -$3.55 -$3.94 -$4.40 -$4.95 -$5.55 -$6.23 -$3.97
NAR -$13.53 -$14.93 -$16.45 -$18.08 -$19.89 -$21.55 -$23.76 -$26.15 -$28.79 -$31.83 -$21.94
NADS $26.32 $27.58 $28.90 $30.24 $31.65 $32.74 $34.25 $35.89 $37.61 $39.41 $32.78
LICS -$10.31 -$11.22 -$12.18 -$13.27 -$14.44 -$15.60 -$16.79 -$18.12 -$19.44 -$20.63 -$15.46
LIPS $1.40 $1.37 $1.34 $1.31 $1.26 $1.19 $1.12 $1.04 $0.94 $0.81 $1.16
Total Government Costs $3.87 $2.80 $1.60 $0.19 -$1.42 -$3.21 -$5.18 -$7.33 -$9.68 -$12.24 -$3.46
CGDP -$3.27 -$3.32 -$3.32 -$3.31 -$3.28 -$3.19 -$3.19 -$3.18 -$3.18 -$3.16 -$3.24
Total Gross Allowed Costs -$77.21 -$83.96 -$91.21 -$98.66 -$106.73 -$113.65 -$122.89 -$132.77 -$143.33 -$154.62 -$114.39
Scenario 7
Year 2020 2021 2022 2023 2024 2025 2026 2027 2028 2029Ten Year
Average
Member Cost Sharing -$4.85 -$5.12 -$5.46 -$5.79 -$6.06 -$6.27 -$6.53 -$6.85 -$7.19 -$7.54 -$6.23
Member Premium $3.04 $3.10 $3.15 $3.20 $3.23 $3.39 $3.56 $3.75 $3.94 $4.10 $3.47
Total Member Costs -$1.80 -$2.02 -$2.31 -$2.59 -$2.83 -$2.88 -$2.97 -$3.10 -$3.25 -$3.44 -$2.76
NAR -$13.02 -$13.83 -$14.68 -$15.54 -$16.48 -$16.95 -$17.73 -$18.50 -$19.33 -$20.35 -$16.82
NADS $26.08 $27.08 $28.12 $29.17 $30.23 $31.34 $32.83 $34.43 $36.08 $37.78 $31.60
LICS -$10.06 -$10.69 -$11.35 -$12.15 -$12.96 -$13.80 -$14.62 -$15.54 -$16.43 -$17.15 -$13.66
LIPS $1.43 $1.43 $1.45 $1.46 $1.47 $1.54 $1.61 $1.70 $1.79 $1.86 $1.59
Total Government Costs $4.42 $3.99 $3.53 $2.95 $2.26 $2.13 $2.09 $2.09 $2.11 $2.14 $2.71
CGDP -$3.24 -$3.28 -$3.26 -$3.23 -$3.19 -$3.09 -$3.08 -$3.05 -$3.05 -$3.02 -$3.14
Total Gross Allowed Costs -$75.90 -$81.18 -$86.77 -$92.40 -$98.45 -$103.28 -$110.08 -$117.27 -$124.88 -$132.93 -$103.70

Milliman Client Report
U.S. Department of Health and Human Services Page A-5
Impact of Potential Changes to the Treatment of Manufacturer Rebates January 31, 2019
Appendix B1
ASPE
Impact of Potential Changes to the Treatment of Manufacturer Rebates and Behavioral Changes
Projected Annual Costs After Removing Manufacturer Rebates (Billions of Dollars)
Baseline
Year 2020 2021 2022 2023 2024 2025 2026 2027 2028 2029Ten Year
Impact
Member Cost Sharing $24.8 $26.8 $28.9 $30.9 $33.0 $35.0 $37.1 $39.3 $41.9 $44.7 $342.4
Member Premium 13.3 14.8 16.4 17.9 19.7 21.2 23.2 25.3 27.7 30.5 209.9
Total Member Costs 38.0 41.6 45.3 48.8 52.7 56.3 60.3 64.5 69.6 75.1 552.4
NAR 46.9 52.7 58.9 65.1 72.2 78.4 86.9 95.8 106.5 118.4 781.8
NADS 10.1 10.5 10.9 11.2 11.4 11.7 11.7 11.5 11.3 11.0 111.3
LICS 31.6 34.4 37.2 40.2 43.5 46.6 50.1 53.9 58.3 62.9 458.7
LIPS 6.2 6.8 7.5 8.2 9.0 9.6 10.5 11.5 12.6 13.8 95.8
Total Government Costs 94.9 104.5 114.5 124.7 136.1 146.4 159.2 172.6 188.7 206.1 1,447.6
CGDP 6.6 7.1 7.5 7.9 8.3 8.7 9.2 9.6 10.2 10.9 85.9
Total Gross Allowed Costs $182.9 $201.2 $220.2 $239.1 $260.2 $279.2 $302.6 $327.2 $356.7 $388.5 $2,757.6
Scenario 1
Year 2020 2021 2022 2023 2024 2025 2026 2027 2028 2029Ten Year
Impact
Member Cost Sharing $22.0 $23.8 $25.6 $27.3 $29.1 $30.9 $32.7 $34.5 $36.7 $39.1 $301.6
Member Premium 15.1 16.8 18.5 20.2 22.2 23.9 26.1 28.4 31.1 34.0 236.3
Total Member Costs 37.1 40.6 44.1 47.5 51.3 54.8 58.8 62.9 67.8 73.2 537.9
NAR 39.5 44.7 50.3 55.9 62.4 68.0 75.7 84.0 93.8 104.5 678.8
NADS 25.2 27.0 28.7 30.3 32.0 33.6 35.1 36.5 38.3 40.0 326.7
LICS 25.9 28.0 30.3 32.6 35.1 37.4 40.1 43.0 46.5 50.2 369.2
LIPS 7.1 7.8 8.5 9.3 10.1 10.9 11.8 12.9 14.1 15.4 107.8
Total Government Costs 97.7 107.5 117.7 128.0 139.6 149.9 162.8 176.4 192.7 210.2 1,482.5
CGDP 4.7 5.1 5.5 5.8 6.3 6.6 7.1 7.5 8.1 8.6 65.3
Total Gross Allowed Costs $139.5 $153.0 $167.0 $180.9 $196.4 $210.4 $227.5 $245.6 $267.2 $290.5 $2,077.9
Scenario 2
Year 2020 2021 2022 2023 2024 2025 2026 2027 2028 2029Ten Year
Impact
Member Cost Sharing $21.6 $22.4 $23.6 $24.8 $26.4 $28.1 $29.8 $31.5 $33.6 $35.9 $277.8
Member Premium 14.8 15.7 17.0 18.4 20.2 21.9 23.9 26.1 28.7 31.5 218.3
Total Member Costs 36.5 38.2 40.6 43.2 46.7 50.0 53.7 57.6 62.3 67.4 496.1
NAR 39.0 42.6 47.3 52.3 58.5 64.0 71.4 79.4 88.9 99.3 642.7
NADS 24.6 24.6 25.3 26.1 27.5 28.9 30.2 31.4 32.9 34.5 286.0
LICS 25.4 26.4 28.0 29.8 32.1 34.2 36.7 39.4 42.5 45.9 340.4
LIPS 6.9 7.3 7.8 8.4 9.2 9.9 10.9 11.8 13.0 14.3 99.6
Total Government Costs 96.0 100.9 108.3 116.7 127.4 137.0 149.2 162.0 177.3 194.0 1,368.8
CGDP 4.5 4.5 4.7 4.9 5.2 5.6 6.0 6.5 7.0 7.5 56.4
Total Gross Allowed Costs $137.0 $143.4 $153.3 $164.3 $178.6 $191.8 $207.9 $224.9 $245.3 $267.4 $1,913.9
Scenario 3
Year 2020 2021 2022 2023 2024 2025 2026 2027 2028 2029Ten Year
Impact
Member Cost Sharing $21.8 $22.7 $23.9 $25.1 $26.6 $28.1 $29.7 $31.5 $33.6 $35.9 $278.9
Member Premium 14.9 15.8 17.0 18.2 19.7 21.3 23.3 25.4 27.9 30.6 213.9
Total Member Costs 36.6 38.5 40.8 43.3 46.4 49.4 53.0 56.9 61.5 66.5 492.9
NAR 38.9 42.3 46.4 50.6 55.8 61.0 68.1 75.8 84.8 94.8 618.7
NADS 24.9 25.2 25.9 26.8 28.0 29.4 30.7 32.0 33.6 35.2 291.6
LICS 25.6 26.6 28.1 29.8 32.0 34.1 36.6 39.2 42.4 45.7 340.2
LIPS 7.0 7.3 7.8 8.3 9.0 9.7 10.6 11.5 12.7 13.9 97.6
Total Government Costs 96.3 101.5 108.2 115.6 124.9 134.1 146.0 158.5 173.4 189.6 1,348.1
CGDP 4.6 4.6 4.8 5.0 5.3 5.6 6.0 6.4 7.0 7.5 56.8
Total Gross Allowed Costs $137.6 $144.5 $153.5 $163.3 $175.9 $188.3 $203.9 $220.5 $240.5 $262.1 $1,889.9

Milliman Client Report
U.S. Department of Health and Human Services Page A-6
Impact of Potential Changes to the Treatment of Manufacturer Rebates January 31, 2019
Appendix B1
ASPE
Impact of Potential Changes to the Treatment of Manufacturer Rebates and Behavioral Changes
Projected Annual Costs After Removing Manufacturer Rebates (Billions of Dollars)
Scenario 4
Year 2020 2021 2022 2023 2024 2025 2026 2027 2028 2029Ten Year
Impact
Member Cost Sharing $22.5 $24.4 $26.3 $28.0 $29.9 $31.7 $33.5 $35.5 $37.8 $40.2 $309.8
Member Premium 16.2 18.0 19.9 21.8 23.9 25.8 28.2 30.6 33.6 36.8 254.8
Total Member Costs 38.8 42.5 46.2 49.8 53.8 57.5 61.7 66.1 71.4 77.0 564.6
NAR 43.9 49.6 55.8 62.0 69.1 75.3 83.8 92.9 103.7 115.6 751.6
NADS 25.7 27.5 29.2 30.9 32.6 34.3 35.7 37.1 38.9 40.6 332.4
LICS 27.2 29.4 31.8 34.2 36.9 39.2 42.1 45.1 48.8 52.6 387.3
LIPS 7.6 8.3 9.1 10.0 10.9 11.7 12.8 13.9 15.2 16.7 116.2
Total Government Costs 104.3 114.8 125.9 137.0 149.4 160.5 174.4 189.1 206.6 225.5 1,587.6
CGDP 5.0 5.5 5.8 6.2 6.6 7.0 7.4 7.9 8.4 9.0 68.8
Total Gross Allowed Costs $148.2 $162.6 $177.6 $192.5 $209.2 $224.2 $242.6 $261.9 $285.1 $310.1 $2,214.1
Scenario 5
Year 2020 2021 2022 2023 2024 2025 2026 2027 2028 2029Ten Year
Impact
Member Cost Sharing $21.9 $23.7 $25.3 $26.9 $28.6 $30.3 $31.9 $33.6 $35.7 $37.9 $296.0
Member Premium 15.0 16.5 18.0 19.5 21.2 22.7 24.5 26.3 28.6 31.0 223.3
Total Member Costs 36.9 40.1 43.4 46.5 49.8 53.0 56.4 60.0 64.3 68.9 519.2
NAR 39.0 43.6 48.4 53.1 58.6 63.0 69.3 76.0 83.8 92.3 627.3
NADS 25.1 26.8 28.5 30.0 31.6 33.2 34.6 35.9 37.6 39.3 322.7
LICS 25.7 27.7 29.7 31.9 34.2 36.2 38.7 41.3 44.4 47.7 357.4
LIPS 7.0 7.6 8.3 8.9 9.7 10.3 11.1 12.0 13.0 14.1 101.9
Total Government Costs 96.9 105.8 114.9 124.0 134.0 142.7 153.7 165.1 178.8 193.4 1,409.3
CGDP 4.7 5.0 5.4 5.7 6.1 6.4 6.8 7.2 7.7 8.2 63.1
Total Gross Allowed Costs $138.5 $150.8 $163.3 $175.6 $189.2 $201.1 $215.8 $231.0 $249.3 $268.8 $1,983.3
Scenario 6
Year 2020 2021 2022 2023 2024 2025 2026 2027 2028 2029Ten Year
Impact
Member Cost Sharing $22.0 $23.7 $25.5 $27.1 $28.9 $30.7 $32.4 $34.2 $36.4 $38.8 $299.7
Member Premium 15.0 16.6 18.2 19.7 21.4 23.0 24.9 26.9 29.2 31.8 226.6
Total Member Costs 36.9 40.3 43.6 46.8 50.4 53.6 57.3 61.1 65.7 70.6 526.4
NAR 39.1 43.8 48.8 53.7 59.3 64.1 70.7 77.6 85.9 94.9 638.0
NADS 25.2 26.9 28.6 30.2 31.9 33.5 35.0 36.5 38.3 40.0 326.2
LICS 25.7 27.7 29.7 31.9 34.2 36.2 38.7 41.3 44.4 47.7 357.4
LIPS 7.0 7.7 8.3 9.0 9.8 10.4 11.3 12.2 13.3 14.4 103.4
Total Government Costs 97.1 106.1 115.5 124.8 135.2 144.2 155.6 167.5 181.8 197.0 1,425.0
CGDP 4.7 5.1 5.4 5.8 6.2 6.6 7.0 7.4 8.0 8.5 64.7
Total Gross Allowed Costs $138.7 $151.3 $164.2 $176.9 $191.0 $203.5 $218.8 $234.8 $254.0 $274.5 $2,007.9
Scenario 7
Year 2020 2021 2022 2023 2024 2025 2026 2027 2028 2029Ten Year
Impact
Member Cost Sharing $22.0 $23.8 $25.6 $27.3 $29.1 $30.9 $32.7 $34.5 $36.7 $39.1 $301.6
Member Premium 15.0 16.6 18.3 19.9 21.8 23.5 25.6 27.9 30.6 33.5 232.7
Total Member Costs 37.0 40.4 43.9 47.2 50.8 54.3 58.3 62.4 67.3 72.6 534.3
NAR 39.4 44.5 49.9 55.3 61.6 67.1 74.8 83.0 92.7 103.4 671.6
NADS 25.0 26.6 28.1 29.6 31.0 32.6 34.0 35.4 37.2 38.8 318.4
LICS 25.9 28.0 30.3 32.6 35.1 37.4 40.1 43.0 46.5 50.2 369.2
LIPS 7.0 7.7 8.4 9.1 9.9 10.7 11.6 12.7 13.9 15.2 106.2
Total Government Costs 97.4 106.8 116.7 126.6 137.6 147.8 160.6 174.1 190.2 207.6 1,465.4
CGDP 4.7 5.1 5.5 5.8 6.3 6.6 7.1 7.5 8.1 8.6 65.3
Total Gross Allowed Costs $139.5 $153.0 $167.0 $180.9 $196.4 $210.4 $227.5 $245.6 $267.2 $290.5 $2,077.9

Milliman Client Report
U.S. Department of Health and Human Services Page A-7
Impact of Potential Changes to the Treatment of Manufacturer Rebates January 31, 2019
Appendix B2
ASPE
Impact of Potential Changes to the Treatment of Manufacturer Rebates and Behavioral Changes
Projected Costs After Removing Manufacturer Rebates (PMPM)
Baseline
Year 2020 2021 2022 2023 2024 2025 2026 2027 2028 2029Ten Year
Average
Member Cost Sharing $43.26 $45.19 $47.15 $49.05 $50.94 $52.60 $54.44 $56.44 $58.48 $60.65 $52.24
Member Premium $23.21 $24.93 $26.71 $28.44 $30.33 $31.88 $34.04 $36.30 $38.72 $41.33 $32.03
Total Member Costs $66.46 $70.11 $73.86 $77.49 $81.27 $84.48 $88.48 $92.73 $97.20 $101.99 $84.27
NAR $81.92 $88.72 $96.05 $103.34 $111.47 $117.76 $127.45 $137.69 $148.69 $160.64 $119.28
NADS $17.63 $17.74 $17.79 $17.74 $17.57 $17.63 $17.12 $16.49 $15.80 $14.93 $16.98
LICS $55.28 $57.87 $60.69 $63.86 $67.17 $69.93 $73.51 $77.39 $81.36 $85.33 $69.98
LIPS $10.87 $11.51 $12.25 $13.01 $13.84 $14.46 $15.44 $16.48 $17.58 $18.76 $14.61
Total Government Costs $165.71 $175.84 $186.78 $197.95 $210.04 $219.78 $233.53 $248.04 $263.42 $279.67 $220.86
CGDP $11.46 $11.89 $12.20 $12.52 $12.86 $13.05 $13.45 $13.86 $14.30 $14.73 $13.11
Total Gross Allowed Costs $319.55 $338.72 $359.05 $379.51 $401.52 $419.19 $443.92 $470.11 $497.85 $527.22 $420.73
Scenario 1
Year 2020 2021 2022 2023 2024 2025 2026 2027 2028 2029Ten Year
Average
Member Cost Sharing $38.41 $40.06 $41.69 $43.27 $44.87 $46.33 $47.91 $49.58 $51.29 $53.11 $46.01
Member Premium $26.36 $28.26 $30.22 $32.14 $34.22 $35.94 $38.28 $40.75 $43.39 $46.19 $36.06
Total Member Costs $64.76 $68.32 $71.91 $75.40 $79.09 $82.27 $86.20 $90.34 $94.68 $99.30 $82.07
NAR $69.08 $75.29 $82.01 $88.72 $96.23 $102.10 $111.08 $120.62 $130.87 $141.89 $103.56
NADS $43.99 $45.39 $46.78 $48.11 $49.34 $50.52 $51.51 $52.48 $53.45 $54.30 $49.84
LICS $45.22 $47.18 $49.34 $51.71 $54.20 $56.13 $58.89 $61.85 $64.93 $68.18 $56.33
LIPS $12.35 $13.05 $13.86 $14.70 $15.61 $16.30 $17.37 $18.50 $19.70 $20.96 $16.45
Total Government Costs $170.64 $180.91 $191.99 $203.25 $215.38 $225.05 $238.85 $253.45 $268.94 $285.33 $226.18
CGDP $8.22 $8.60 $8.93 $9.28 $9.67 $9.96 $10.37 $10.81 $11.25 $11.71 $9.97
Total Gross Allowed Costs $243.65 $257.55 $272.27 $287.11 $303.07 $315.91 $333.85 $352.85 $372.98 $394.30 $317.03
Scenario 2
Year 2020 2021 2022 2023 2024 2025 2026 2027 2028 2029Ten Year
Average
Member Cost Sharing $37.82 $37.73 $38.47 $39.41 $40.82 $42.19 $43.67 $45.30 $46.94 $48.70 $42.39
Member Premium $25.90 $26.50 $27.76 $29.23 $31.20 $32.85 $35.10 $37.48 $40.03 $42.75 $33.30
Total Member Costs $63.72 $64.23 $66.23 $68.64 $72.01 $75.04 $78.77 $82.77 $86.97 $91.45 $75.69
NAR $68.14 $71.75 $77.13 $83.01 $90.32 $96.04 $104.78 $114.06 $124.06 $134.83 $98.06
NADS $42.98 $41.44 $41.19 $41.43 $42.40 $43.45 $44.31 $45.13 $45.99 $46.78 $43.64
LICS $44.46 $44.40 $45.61 $47.36 $49.61 $51.40 $53.87 $56.56 $59.33 $62.24 $51.94
LIPS $12.13 $12.24 $12.74 $13.37 $14.23 $14.89 $15.93 $17.01 $18.17 $19.41 $15.20
Total Government Costs $167.72 $169.82 $176.66 $185.16 $196.56 $205.78 $218.89 $232.76 $247.55 $263.25 $208.83
CGDP $7.88 $7.56 $7.59 $7.75 $8.10 $8.43 $8.84 $9.28 $9.73 $10.20 $8.60
Total Gross Allowed Costs $239.36 $241.41 $250.01 $260.81 $275.67 $287.95 $304.99 $323.11 $342.39 $362.90 $292.00
Scenario 3
Year 2020 2021 2022 2023 2024 2025 2026 2027 2028 2029Ten Year
Average
Member Cost Sharing $38.04 $38.22 $38.92 $39.84 $41.10 $42.26 $43.63 $45.26 $46.92 $48.68 $42.56
Member Premium $25.98 $26.63 $27.67 $28.85 $30.43 $31.96 $34.14 $36.44 $38.91 $41.54 $32.64
Total Member Costs $64.02 $64.86 $66.59 $68.69 $71.53 $74.22 $77.77 $81.69 $85.83 $90.22 $75.20
NAR $68.03 $71.27 $75.68 $80.36 $86.16 $91.55 $99.97 $108.85 $118.41 $128.70 $94.39
NADS $43.43 $42.47 $42.26 $42.50 $43.28 $44.15 $45.01 $45.92 $46.86 $47.75 $44.49
LICS $44.68 $44.80 $45.81 $47.37 $49.40 $51.20 $53.68 $56.37 $59.15 $62.07 $51.90
LIPS $12.17 $12.30 $12.70 $13.20 $13.88 $14.49 $15.49 $16.54 $17.66 $18.85 $14.89
Total Government Costs $168.31 $170.83 $176.45 $183.42 $192.72 $201.39 $214.15 $227.68 $242.08 $257.37 $205.67
CGDP $8.01 $7.75 $7.77 $7.93 $8.21 $8.45 $8.80 $9.24 $9.70 $10.18 $8.66
Total Gross Allowed Costs $240.36 $243.20 $250.29 $259.26 $271.39 $282.69 $299.13 $316.83 $335.66 $355.68 $288.34
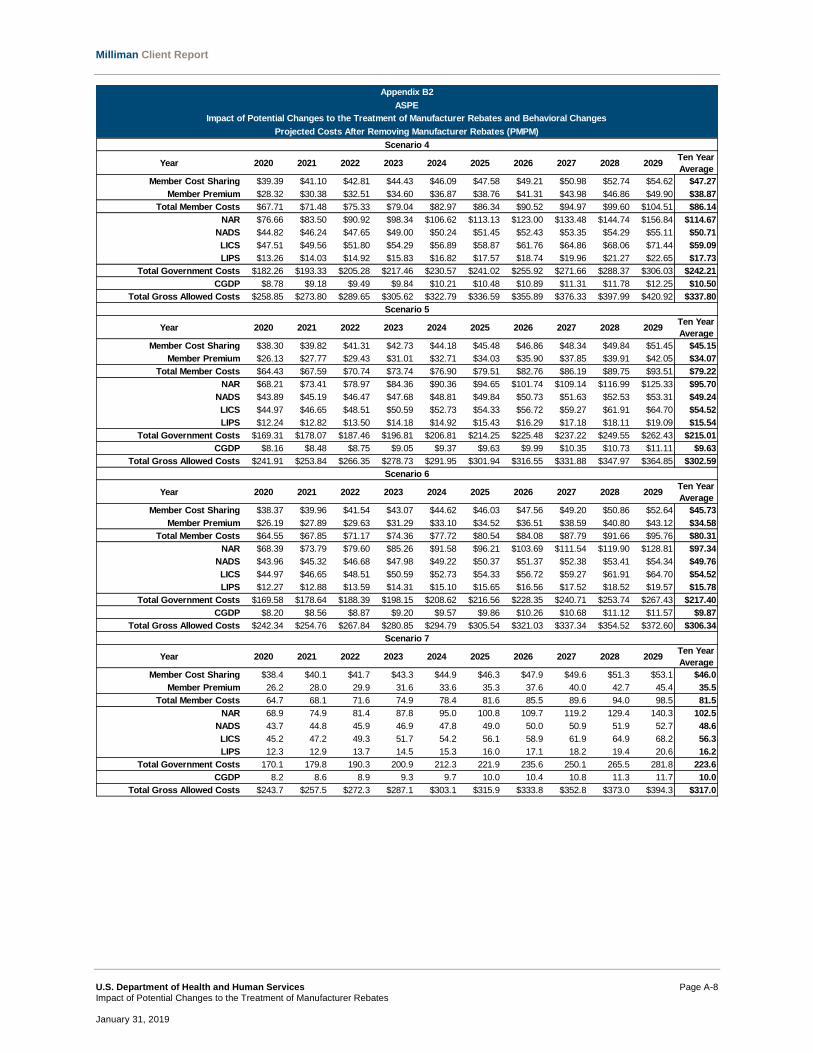
Milliman Client Report
U.S. Department of Health and Human Services Page A-8
Impact of Potential Changes to the Treatment of Manufacturer Rebates January 31, 2019
Appendix B2
ASPE
Impact of Potential Changes to the Treatment of Manufacturer Rebates and Behavioral Changes
Projected Costs After Removing Manufacturer Rebates (PMPM)
Scenario 4
Year 2020 2021 2022 2023 2024 2025 2026 2027 2028 2029Ten Year
Average
Member Cost Sharing $39.39 $41.10 $42.81 $44.43 $46.09 $47.58 $49.21 $50.98 $52.74 $54.62 $47.27
Member Premium $28.32 $30.38 $32.51 $34.60 $36.87 $38.76 $41.31 $43.98 $46.86 $49.90 $38.87
Total Member Costs $67.71 $71.48 $75.33 $79.04 $82.97 $86.34 $90.52 $94.97 $99.60 $104.51 $86.14
NAR $76.66 $83.50 $90.92 $98.34 $106.62 $113.13 $123.00 $133.48 $144.74 $156.84 $114.67
NADS $44.82 $46.24 $47.65 $49.00 $50.24 $51.45 $52.43 $53.35 $54.29 $55.11 $50.71
LICS $47.51 $49.56 $51.80 $54.29 $56.89 $58.87 $61.76 $64.86 $68.06 $71.44 $59.09
LIPS $13.26 $14.03 $14.92 $15.83 $16.82 $17.57 $18.74 $19.96 $21.27 $22.65 $17.73
Total Government Costs $182.26 $193.33 $205.28 $217.46 $230.57 $241.02 $255.92 $271.66 $288.37 $306.03 $242.21
CGDP $8.78 $9.18 $9.49 $9.84 $10.21 $10.48 $10.89 $11.31 $11.78 $12.25 $10.50
Total Gross Allowed Costs $258.85 $273.80 $289.65 $305.62 $322.79 $336.59 $355.89 $376.33 $397.99 $420.92 $337.80
Scenario 5
Year 2020 2021 2022 2023 2024 2025 2026 2027 2028 2029Ten Year
Average
Member Cost Sharing $38.30 $39.82 $41.31 $42.73 $44.18 $45.48 $46.86 $48.34 $49.84 $51.45 $45.15
Member Premium $26.13 $27.77 $29.43 $31.01 $32.71 $34.03 $35.90 $37.85 $39.91 $42.05 $34.07
Total Member Costs $64.43 $67.59 $70.74 $73.74 $76.90 $79.51 $82.76 $86.19 $89.75 $93.51 $79.22
NAR $68.21 $73.41 $78.97 $84.36 $90.36 $94.65 $101.74 $109.14 $116.99 $125.33 $95.70
NADS $43.89 $45.19 $46.47 $47.68 $48.81 $49.84 $50.73 $51.63 $52.53 $53.31 $49.24
LICS $44.97 $46.65 $48.51 $50.59 $52.73 $54.33 $56.72 $59.27 $61.91 $64.70 $54.52
LIPS $12.24 $12.82 $13.50 $14.18 $14.92 $15.43 $16.29 $17.18 $18.11 $19.09 $15.54
Total Government Costs $169.31 $178.07 $187.46 $196.81 $206.81 $214.25 $225.48 $237.22 $249.55 $262.43 $215.01
CGDP $8.16 $8.48 $8.75 $9.05 $9.37 $9.63 $9.99 $10.35 $10.73 $11.11 $9.63
Total Gross Allowed Costs $241.91 $253.84 $266.35 $278.73 $291.95 $301.94 $316.55 $331.88 $347.97 $364.85 $302.59
Scenario 6
Year 2020 2021 2022 2023 2024 2025 2026 2027 2028 2029Ten Year
Average
Member Cost Sharing $38.37 $39.96 $41.54 $43.07 $44.62 $46.03 $47.56 $49.20 $50.86 $52.64 $45.73
Member Premium $26.19 $27.89 $29.63 $31.29 $33.10 $34.52 $36.51 $38.59 $40.80 $43.12 $34.58
Total Member Costs $64.55 $67.85 $71.17 $74.36 $77.72 $80.54 $84.08 $87.79 $91.66 $95.76 $80.31
NAR $68.39 $73.79 $79.60 $85.26 $91.58 $96.21 $103.69 $111.54 $119.90 $128.81 $97.34
NADS $43.96 $45.32 $46.68 $47.98 $49.22 $50.37 $51.37 $52.38 $53.41 $54.34 $49.76
LICS $44.97 $46.65 $48.51 $50.59 $52.73 $54.33 $56.72 $59.27 $61.91 $64.70 $54.52
LIPS $12.27 $12.88 $13.59 $14.31 $15.10 $15.65 $16.56 $17.52 $18.52 $19.57 $15.78
Total Government Costs $169.58 $178.64 $188.39 $198.15 $208.62 $216.56 $228.35 $240.71 $253.74 $267.43 $217.40
CGDP $8.20 $8.56 $8.87 $9.20 $9.57 $9.86 $10.26 $10.68 $11.12 $11.57 $9.87
Total Gross Allowed Costs $242.34 $254.76 $267.84 $280.85 $294.79 $305.54 $321.03 $337.34 $354.52 $372.60 $306.34
Scenario 7
Year 2020 2021 2022 2023 2024 2025 2026 2027 2028 2029Ten Year
Average
Member Cost Sharing $38.4 $40.1 $41.7 $43.3 $44.9 $46.3 $47.9 $49.6 $51.3 $53.1 $46.0
Member Premium 26.2 28.0 29.9 31.6 33.6 35.3 37.6 40.0 42.7 45.4 35.5
Total Member Costs 64.7 68.1 71.6 74.9 78.4 81.6 85.5 89.6 94.0 98.5 81.5
NAR 68.9 74.9 81.4 87.8 95.0 100.8 109.7 119.2 129.4 140.3 102.5
NADS 43.7 44.8 45.9 46.9 47.8 49.0 50.0 50.9 51.9 52.7 48.6
LICS 45.2 47.2 49.3 51.7 54.2 56.1 58.9 61.9 64.9 68.2 56.3
LIPS 12.3 12.9 13.7 14.5 15.3 16.0 17.1 18.2 19.4 20.6 16.2
Total Government Costs 170.1 179.8 190.3 200.9 212.3 221.9 235.6 250.1 265.5 281.8 223.6
CGDP 8.2 8.6 8.9 9.3 9.7 10.0 10.4 10.8 11.3 11.7 10.0
Total Gross Allowed Costs $243.7 $257.5 $272.3 $287.1 $303.1 $315.9 $333.8 $352.8 $373.0 $394.3 $317.0
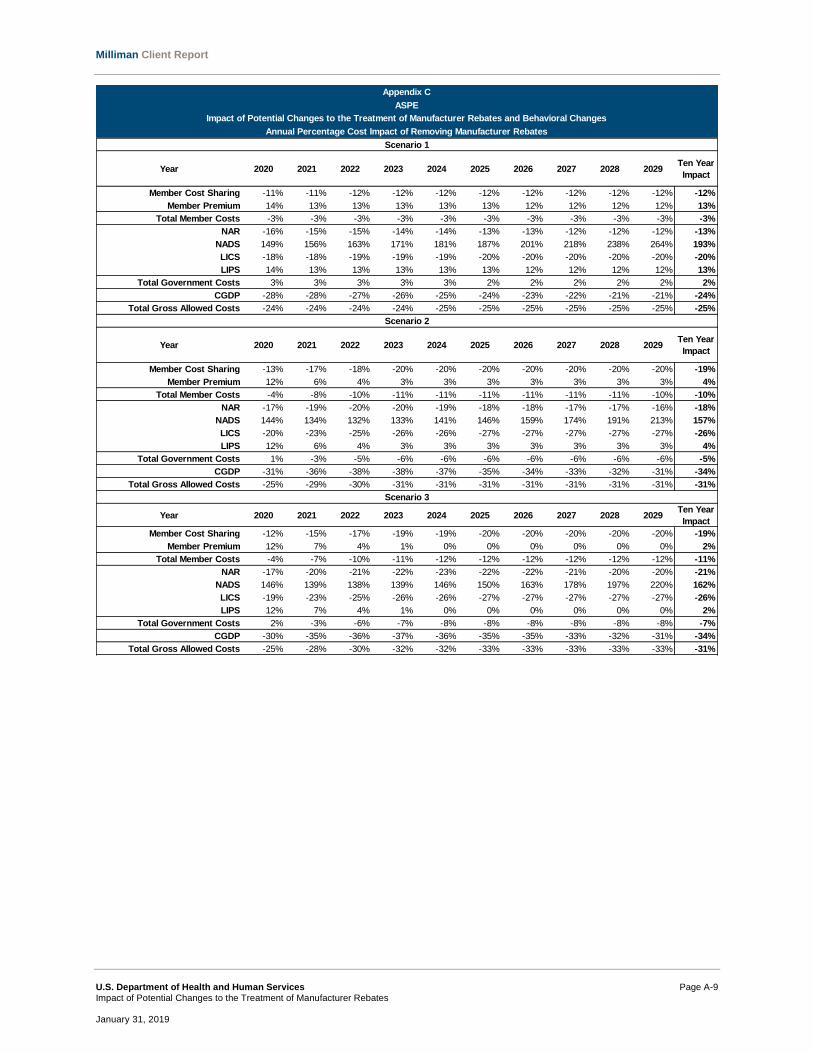
Milliman Client Report
U.S. Department of Health and Human Services Page A-9
Impact of Potential Changes to the Treatment of Manufacturer Rebates January 31, 2019
Appendix C
ASPE
Impact of Potential Changes to the Treatment of Manufacturer Rebates and Behavioral Changes
Annual Percentage Cost Impact of Removing Manufacturer Rebates
Scenario 1
Year 2020 2021 2022 2023 2024 2025 2026 2027 2028 2029Ten Year
Impact
Member Cost Sharing -11% -11% -12% -12% -12% -12% -12% -12% -12% -12% -12%
Member Premium 14% 13% 13% 13% 13% 13% 12% 12% 12% 12% 13%
Total Member Costs -3% -3% -3% -3% -3% -3% -3% -3% -3% -3% -3%
NAR -16% -15% -15% -14% -14% -13% -13% -12% -12% -12% -13%
NADS 149% 156% 163% 171% 181% 187% 201% 218% 238% 264% 193%
LICS -18% -18% -19% -19% -19% -20% -20% -20% -20% -20% -20%
LIPS 14% 13% 13% 13% 13% 13% 12% 12% 12% 12% 13%
Total Government Costs 3% 3% 3% 3% 3% 2% 2% 2% 2% 2% 2%
CGDP -28% -28% -27% -26% -25% -24% -23% -22% -21% -21% -24%
Total Gross Allowed Costs -24% -24% -24% -24% -25% -25% -25% -25% -25% -25% -25%
Scenario 2
Year 2020 2021 2022 2023 2024 2025 2026 2027 2028 2029Ten Year
Impact
Member Cost Sharing -13% -17% -18% -20% -20% -20% -20% -20% -20% -20% -19%
Member Premium 12% 6% 4% 3% 3% 3% 3% 3% 3% 3% 4%
Total Member Costs -4% -8% -10% -11% -11% -11% -11% -11% -11% -10% -10%
NAR -17% -19% -20% -20% -19% -18% -18% -17% -17% -16% -18%
NADS 144% 134% 132% 133% 141% 146% 159% 174% 191% 213% 157%
LICS -20% -23% -25% -26% -26% -27% -27% -27% -27% -27% -26%
LIPS 12% 6% 4% 3% 3% 3% 3% 3% 3% 3% 4%
Total Government Costs 1% -3% -5% -6% -6% -6% -6% -6% -6% -6% -5%
CGDP -31% -36% -38% -38% -37% -35% -34% -33% -32% -31% -34%
Total Gross Allowed Costs -25% -29% -30% -31% -31% -31% -31% -31% -31% -31% -31%
Scenario 3
Year 2020 2021 2022 2023 2024 2025 2026 2027 2028 2029Ten Year
Impact
Member Cost Sharing -12% -15% -17% -19% -19% -20% -20% -20% -20% -20% -19%
Member Premium 12% 7% 4% 1% 0% 0% 0% 0% 0% 0% 2%
Total Member Costs -4% -7% -10% -11% -12% -12% -12% -12% -12% -12% -11%
NAR -17% -20% -21% -22% -23% -22% -22% -21% -20% -20% -21%
NADS 146% 139% 138% 139% 146% 150% 163% 178% 197% 220% 162%
LICS -19% -23% -25% -26% -26% -27% -27% -27% -27% -27% -26%
LIPS 12% 7% 4% 1% 0% 0% 0% 0% 0% 0% 2%
Total Government Costs 2% -3% -6% -7% -8% -8% -8% -8% -8% -8% -7%
CGDP -30% -35% -36% -37% -36% -35% -35% -33% -32% -31% -34%
Total Gross Allowed Costs -25% -28% -30% -32% -32% -33% -33% -33% -33% -33% -31%

Milliman Client Report
U.S. Department of Health and Human Services Page A-10
Impact of Potential Changes to the Treatment of Manufacturer Rebates January 31, 2019
Appendix C
ASPE
Impact of Potential Changes to the Treatment of Manufacturer Rebates and Behavioral Changes
Annual Percentage Cost Impact of Removing Manufacturer Rebates
Scenario 4
Year 2020 2021 2022 2023 2024 2025 2026 2027 2028 2029Ten Year
Impact
Member Cost Sharing -9% -9% -9% -9% -10% -10% -10% -10% -10% -10% -10%
Member Premium 22% 22% 22% 22% 22% 22% 21% 21% 21% 21% 21%
Total Member Costs 2% 2% 2% 2% 2% 2% 2% 2% 2% 2% 2%
NAR -6% -6% -5% -5% -4% -4% -3% -3% -3% -2% -4%
NADS 154% 161% 168% 176% 186% 192% 206% 224% 244% 269% 199%
LICS -14% -14% -15% -15% -15% -16% -16% -16% -16% -16% -16%
LIPS 22% 22% 22% 22% 22% 22% 21% 21% 21% 21% 21%
Total Government Costs 10% 10% 10% 10% 10% 10% 10% 10% 9% 9% 10%
CGDP -23% -23% -22% -21% -21% -20% -19% -18% -18% -17% -20%
Total Gross Allowed Costs -19% -19% -19% -19% -20% -20% -20% -20% -20% -20% -20%
Scenario 5
Year 2020 2021 2022 2023 2024 2025 2026 2027 2028 2029Ten Year
Impact
Member Cost Sharing -11% -12% -12% -13% -13% -14% -14% -14% -15% -15% -14%
Member Premium 13% 11% 10% 9% 8% 7% 5% 4% 3% 2% 6%
Total Member Costs -3% -4% -4% -5% -5% -6% -6% -7% -8% -8% -6%
NAR -17% -17% -18% -18% -19% -20% -20% -21% -21% -22% -20%
NADS 149% 155% 161% 169% 178% 183% 196% 213% 232% 257% 190%
LICS -19% -19% -20% -21% -21% -22% -23% -23% -24% -24% -22%
LIPS 13% 11% 10% 9% 8% 7% 5% 4% 3% 2% 6%
Total Government Costs 2% 1% 0% -1% -2% -3% -3% -4% -5% -6% -3%
CGDP -29% -29% -28% -28% -27% -26% -26% -25% -25% -25% -27%
Total Gross Allowed Costs -24% -25% -26% -27% -27% -28% -29% -29% -30% -31% -28%
Scenario 6
Year 2020 2021 2022 2023 2024 2025 2026 2027 2028 2029Ten Year
Impact
Member Cost Sharing -11% -12% -12% -12% -12% -12% -13% -13% -13% -13% -12%
Member Premium 13% 12% 11% 10% 9% 8% 7% 6% 5% 4% 8%
Member Costs -3% -3% -4% -4% -4% -5% -5% -5% -6% -6% -5%
NAR -17% -17% -17% -17% -18% -18% -19% -19% -19% -20% -18%
NADS 149% 155% 162% 170% 180% 186% 200% 218% 238% 264% 193%
LICS -19% -19% -20% -21% -21% -22% -23% -23% -24% -24% -22%
LIPS 13% 12% 11% 10% 9% 8% 7% 6% 5% 4% 8%
Government Costs 2% 2% 1% 0% -1% -1% -2% -3% -4% -4% -2%
CGDP -29% -28% -27% -26% -26% -24% -24% -23% -22% -21% -25%
Total Gross Allowed Costs -24% -25% -25% -26% -27% -27% -28% -28% -29% -29% -27%
Scenario 7
Year 2020 2021 2022 2023 2024 2025 2026 2027 2028 2029Ten Year
Impact
Member Cost Sharing -11% -11% -12% -12% -12% -12% -12% -12% -12% -12% -12%
Member Premium 13% 12% 12% 11% 11% 11% 10% 10% 10% 10% 11%
Member Costs -3% -3% -3% -3% -3% -3% -3% -3% -3% -3% -3%
NAR -16% -16% -15% -15% -15% -14% -14% -13% -13% -13% -14%
NADS 148% 153% 158% 164% 172% 178% 192% 209% 228% 253% 186%
LICS -18% -18% -19% -19% -19% -20% -20% -20% -20% -20% -20%
LIPS 13% 12% 12% 11% 11% 11% 10% 10% 10% 10% 11%
Government Costs 3% 2% 2% 1% 1% 1% 1% 1% 1% 1% 1%
CGDP -28% -28% -27% -26% -25% -24% -23% -22% -21% -21% -24%
Total Gross Allowed Costs -24% -24% -24% -24% -25% -25% -25% -25% -25% -25% -25%