Impact of policies favouring organic inputs on small...
21
Impact of policies favouring organic inputs on small farms in Karnataka, India: a multicriteria approach Seema Purushothaman • Sheetal Patil • Ierene Francis Received: 3 October 2011 / Accepted: 12 February 2012 Ó Springer Science+Business Media B.V. 2012 Abstract Over 56% of the population of Karnataka state in India depends on agriculture for its livelihood. A majority of these are small and marginal farmers, with land under 2 ha, responsible for nearly half the food production in the state. The increasing rate of farmers’ suicides in the state is reportedly fuelled among others, by increasing input costs, crop failure and accumulating debt. This triggered several policy measures, intended to improve the sustainability of farm livelihoods including those promoting organic practices in farming. The paper presents the results of a multicriteria analysis conducted to comprehend the effects of two different practice–policy scenarios on smallholders in Karnataka—one scenario ‘with policy’ (WP) to support organic agricultural practices and the other a ‘business as usual’ (BAU) scenario that continues to stress on market-based, synthetic inputs for cultivation. The paper integrates results from quantitative and participatory techniques to compare and project effects on ecological, economic and socio-cultural indicators. Ecological and economic indicators in WP are projected to be significantly higher than BAU in a majority of the study sites, while socio-cultural indicators show mixed outcomes, depending on regional and social characteristics. Across the study sites, small and rain-fed farms are benefitted better in WP compared to large and irrigated farms, respectively. Among small and rain-fed farms, soil fertility, water quality, agro-diversity, net income and freedom from indebtedness improve considerably, while there is slight reduction in collective activities and no perceivable change in land-based subsistence. Keywords Multicriteria analysis Á Organic practices Á Policy evaluation Á Agrarian distress Á Farmer suicide Á Smallholder Readers should send their comments on this paper to [email protected] within 3 months of publication of this issue. S. Purushothaman (&) Á S. Patil Á I. Francis Ashoka Trust for Research in Ecology and the Environment, Royal Enclave, Srirampura, Jakkur Post, Bangalore 560064, India e-mail: [email protected] 123 Environ Dev Sustain DOI 10.1007/s10668-012-9340-1
Transcript of Impact of policies favouring organic inputs on small...

Impact of policies favouring organic inputs on smallfarms in Karnataka, India: a multicriteria approach
Seema Purushothaman • Sheetal Patil • Ierene Francis
Received: 3 October 2011 / Accepted: 12 February 2012� Springer Science+Business Media B.V. 2012
Abstract Over 56% of the population of Karnataka state in India depends on agriculture
for its livelihood. A majority of these are small and marginal farmers, with land under 2 ha,
responsible for nearly half the food production in the state. The increasing rate of farmers’
suicides in the state is reportedly fuelled among others, by increasing input costs, crop
failure and accumulating debt. This triggered several policy measures, intended to improve
the sustainability of farm livelihoods including those promoting organic practices in
farming. The paper presents the results of a multicriteria analysis conducted to comprehend
the effects of two different practice–policy scenarios on smallholders in Karnataka—one
scenario ‘with policy’ (WP) to support organic agricultural practices and the other a
‘business as usual’ (BAU) scenario that continues to stress on market-based, synthetic
inputs for cultivation. The paper integrates results from quantitative and participatory
techniques to compare and project effects on ecological, economic and socio-cultural
indicators. Ecological and economic indicators in WP are projected to be significantly
higher than BAU in a majority of the study sites, while socio-cultural indicators show
mixed outcomes, depending on regional and social characteristics. Across the study sites,
small and rain-fed farms are benefitted better in WP compared to large and irrigated farms,
respectively. Among small and rain-fed farms, soil fertility, water quality, agro-diversity,
net income and freedom from indebtedness improve considerably, while there is slight
reduction in collective activities and no perceivable change in land-based subsistence.
Keywords Multicriteria analysis � Organic practices � Policy evaluation �Agrarian distress � Farmer suicide � Smallholder
Readers should send their comments on this paper to [email protected] within 3 months of publicationof this issue.
S. Purushothaman (&) � S. Patil � I. FrancisAshoka Trust for Research in Ecology and the Environment,Royal Enclave, Srirampura, Jakkur Post, Bangalore 560064, Indiae-mail: [email protected]
123
Environ Dev SustainDOI 10.1007/s10668-012-9340-1
sheetal
Note
Citation: Environ Dev Sustain (2012) 14(4): 507-527
1 Introduction
Agriculture is the most important livelihood in India, providing employment to almost two-
thirds of the population. A large number of farmers in India are small and marginal with a
land holding of \2 ha. Indian agriculture was traditionally organic in practice; however,
this changed with the green revolution in the 1960s, with many farmers switching to the
use of fertilizers, pesticides, irrigation and high yielding varieties of crops (Bhattacharyya
and Chakraborty 2005). While the green revolution increased production of certain crops
and made India largely self-sufficient in major food grains, the high dependence on
external inputs increased risks and caused ecological (Singh 2000) and even social prob-
lems (Deshpande 2002). These impacts were also driven by economic growth, techno-
logical change, population growth and sectoral policies (Bhalla and Singh 2009; Rao and
Gulati 2005). Since the 1990s, agricultural output growth in India has been slowing (Fan
and Chan-Kang 2005), and this slowdown has put serious strain on the income and live-
lihood of smallholders (Chand et al. 2011). Farm holdings are being further fragmented;
the share of agriculture in Gross Domestic Product has been decreasing, while the pro-
portion of population dependent on agriculture for their livelihood has remained significant
(Suri 2006).
The state of Karnataka, located in south-western India, has diverse agro-climatic con-
ditions and hence a great diversity in crops. It recorded the highest growth rates in the
country in terms of Gross State Domestic Product (GSDP) and per capita GSDP (56.2 and
43.9%, respectively, in the decade 1996–2005) mostly deriving from the service and
manufacturing sectors. The state has 56% of its workforce engaged in agriculture, and 75%
of these are small and marginal farmers, operating in \2 ha of land (DES 2006). Nearly
80% of agricultural land is unirrigated and depends on (uncertain) monsoons. The state is
currently representative of both high rates of economic growth and agrarian distress
characterized by an increasing number of farmers’ suicides (24,252 farmers’ suicides
between 1999 and 2009) (NCRB 1999–2009). More suicides are reported among farmers
who cultivated crops with high cost of cultivation (Government of Karnataka 2007). Heavy
investment and accumulated indebtedness (often due to crop loss from floods, pest attacks
or droughts) often caused financial crises for farmers. Even when the harvest is good, a
slump in prices could cause huge losses (Suri 2006). Over 61% of all farmer households in
Karnataka were indebted (higher than the country average of 48.6%), and 73% of these
indebted households incurred these loans for cultivation expenditure (NSSO 2003). Irri-
gation (borewell) failure, accidents and illnesses also contribute to distress.
Agriculture in Karnataka witnessed rapid commercialization in crop choice and agri-
cultural inputs (Purushothaman and Kashyap 2010) though recent trends show a new
direction in policy attention. It is one of the first Indian states to specify standards and
implement pilot projects for organic farming in partnership with Non-Governmental Or-
ganisations (NGOs) (Giovannucci 2005). In the wake of changing policies and increasing
interest towards sustainable agriculture, this paper compares the effects of conventional
non-organic input practices and recently incentivized organic inputs in different parts of
the state.
Next section describes the larger problem in Indian farming focusing on small farms,
current practices in the small farm sector of the state as well as recent agricultural policy
inclination. Later (Sect. 3), we move on to the suitability of multicriteria analysis (MCA),
before discussing its application (Sect. 4) and results (Sect. 5) in the study sites and across
categories of farmers. The paper concludes by drawing broad inferences on the
S. Purushothaman et al.
123

sustainability of small-scale farming with respect to ecological, economic and socio-cul-
tural indicators.
2 Problems, policies and the study sites
Small farmers have been characterized as ‘complex, diverse and risk-prone’ (Chambers
et al. 1989). Though there are several stress factors identified as affecting small farmers
(Viswanathan et al. 2012), they are also recognized as possessing certain ‘resilience fac-
tors’ including efficiencies associated with the use of family labour, livelihood diversity
allowing spreading of risks, and indigenous knowledge to help cope with crises. While
some studies predict the decline in smallholder agriculture, some others see the possibility,
given appropriate policies, of pro-poor growth based on efficiency and employment gen-
eration associated with family farms (Morton 2007).
Traditionally, agricultural economic theory believed that small farms were inefficient,
this later shifted to an acknowledgement of an inverse relationship between farm size and
productivity; however, it is still believed that large-scale, mechanized farms are more
efficient than the peasant sector (Ellis and Biggs 2001). The validity of an inverse rela-
tionship between farm size and productivity depends on various factors including intensity
of land and input use, soil fertility, opportunity cost of family labour, level of technology
adoption and other managerial factors (Fan and Chan-Kang 2005). Thus, Verma and
Bromley (1987) find no single answer to the relationship between farm size and agricul-
tural productivity and state that preoccupation with this issue is often unnecessary. Chand
et al. (2011) in turn argue that policies that aim to consolidate farm size because of
supposed non-viability of smallholders will affect adversely the productivity and growth of
the agricultural sector. They also find that marginal and smallholders in India have higher
productivity (per acre) than larger farms, and a lower fertilizer imbalance index, because
they use inputs in an efficient manner.
Meanwhile, loss of soil fertility, declining groundwater levels, water salinity, stagnating
yields, slow agricultural growth, indebtedness and marginalization are problems that
snowball into severe distress that often culminates in farmers’ suicides (Vasavi 1999;
Deshpande and Prabhu 2005) in India. A possible way to deal with the current agrarian
crisis is to switch over to cost-effective and ecologically sustainable inputs, but their
adoption at larger scales can be expanded only through policy support (Reddy and Galab
2006). Several policy measures were introduced to mitigate agrarian problems (Deshpande
2007), including loan waivers by central and state governments and crop insurance
schemes.
Government of Karnataka in 2006 introduced the Karnataka State Policy on Organic
Farming (KSPoOF1) in order to improve the sustainability of farm livelihoods. For
smallholders in the state, organic farming mostly implies non-certified practices with self-
reliance in most inputs.2 The policy defined organic farming as farming that requires less
external inputs, relying more on natural and human resources that are available in the
farms. Thus, it aims at reducing farmers’ financial burden, engaging them in productive
activities on-farm and curbing migration to urban areas. It provides support for organic
1 http://raitamitra.kar.nic.in/kda_booklet.pdf. Accessed on 21 Nov 2010.2 In fact the non-certified organic area has been much more than area under certified organic farming(Bhattacharyya and Chakraborty 2005).
Impact of policies favouring organic inputs
123

seeds and seedlings, vermicompost pits, azolla culture, biopesticides and livestock.
The policy has been implemented in all the taluks (subdistrict) of the state covering 100 ha
of contiguous land area (mostly in one village) in each taluk. The KSPoOF was initially
implemented with active involvement of local NGOs and is now being supplemented by
larger statewide policies in the same direction (e.g. Karnataka State Organic Farming
Mission, support for organic inputs from National Horticultural Mission) where NGOs are
not involved. In KSPoOF, NGOs focused on guiding farmers through gradual conversion
to organic cultivation, producing vermicompost and azolla culture and biopesticides as also
in exchange visits and trainings. Since 2006, the number of farmers registered under the
policy has grown fivefold, and budgetary support allocated for subsidies for organic inputs
increased by nearly 20%.3 Henceforth in the paper, ‘organic’ will refer to increasing use of
organic inputs as influenced by various policies and not certified organic practices aiming
at niche markets.
The study focuses on districts with notable temporal change in agricultural land use and
farmers’ distress as also that represents a cross-section of major agro-climatic regions in
the state. Identification of study sites was based on analyses of temporal data on land use,
cropping pattern and farmers’ suicides followed by a workshop based on this analysis with
researchers, officials and farmers. Selected districts—Bijapur, Chikballapur, Udupi, Chi-
tradurga and Mysore (Fig. 1)—cover major agro-climatic zones of the state. The charac-
teristics of these districts are provided in Table 1.
Fig. 1 Map of Karnataka, with study districts
3 http://www.kar.nic.in/finance/bud2010/budhig10e.pdf and Karnataka State Annual Budget 2011–2012.
S. Purushothaman et al.
123

3 MCA in assessing sustainability of farming
Agricultural sustainability is not precisely measurable (and hence not easily comparable),
especially because externalities of any agricultural system are very difficult to measure
(Pretty 1995). Nevertheless, it is now accepted that the best way of developing manage-
ment strategies to address challenges in the farming sector is to view the agricultural
system as an integrated whole (Reenberg and Paarup Laursen 1997; Ikerd 1993; Zander
and Kachele 1999), and studies (e.g. Cai and Smith 1994; Van Calker et al. 2005) suggest
that sustainability should be studied in terms of its economic, social and ecological aspects.
Multicriteria analysis (MCA) is generally used to assist decision-makers faced with
such numerous and sometimes conflicting evaluations. Multicriteria decision-making
techniques are particularly helpful in the short term, while in the long term, more efforts
can be made towards understanding the costs and benefits involved (Tiwari et al. 1999).
MCA is also regarded by some as a dialogue tool and is not meant to provide a
prescriptive solution. Multiple-criteria decision aid evolved from Keeney and Raiffa
(1976) and Munda et al. (1994) is used to build alternative solutions and to help in
decision-making among stakeholders with differing preferences. The open and explicit
nature of MCA provides it with advantages over informal judgment (see Dodgson et al.
2009). MCA can thus be used to compare the consequences of different scenarios on
sustainability criteria. A review of potential MCA applications in the context of farm
sustainability (Sadok et al. 2008) indicates that there are few such applications in tropical
agriculture.
This study uses MCA to compare the indicators of sustainability of small farms in
different practice/policy scenarios rather than to arrive at a unique solution. The first step in
understanding sustainability criteria involves the translation of ecological, economic and
Table 1 Characteristics of the districts studied
Bijapur Chitradurga Chikballapur Mysore Udupi
Agro-climatic zone Northerndry zone
Central dryzone
Eastern dryzone
Southerntransitionzone
Coastalzone
Geographical Area (ha)c 1,053,471 770,702 404,501 676,382 356,446
Average annual rainfall(2004–2008) (mm)a
582 656 841 815 4,274
Average size of operational landholdingb (2005–2006) (ha)b
3.03 2.05 1.15 g 0.97 0.78
Net sown area (2008–2009) (%)c 71 51 26 49 26
Net irrigated area (2008–2009) (%)c 35 19 25 47 33
Fertilizers distributed (N ? P ? K,tonnes) (2009–2010)c
68,856 30,817 40,977 77,603 7,012
Population density (2011) (perkm2)d
207 197 298 437 304
Human development index (2001)e 0.59 0.63 0.63g 0.63 0.71
Farmers’ suicides (2003–2007)f 408 1,058 241g 383 192
a Karnataka State Natural Disaster Monitoring Centre; DES (2006b, 2011c); d Census of India 2011;e Karnataka Human Development Report 2005–2006; f State Crime Records Bureau, Government ofKarnataka; g Chikballapur was formed as a new district from larger Kolar district on 23 August 2007, hencethis data is available only for Chikballapur and Kolar combined
Impact of policies favouring organic inputs
123

social complexity into a more limited number of functions and attributes (Limburg et al.
2002 cited in Zendehdel et al. 2008). The process includes selection of indicators within a
land use function (LUF) framework (following Perez-Soba et al. 2008; Konig et al. 2010),
collection of primary data and comparing indicators in two current situations and future
scenarios. Stakeholders’ preferences for each LUF were collected through deliberation and
consensus building in Participatory Impact Assessment (PIA) workshops, to be applied as
weightages in MCA.
3.1 Indicator framework
Land use functions are defined as those goods and services that are produced through land
use in its interaction with the geophysical and socio-cultural landscape and that summarize
the most relevant societal, economic and environmental issues of a region (Perez-Soba
et al. 2008). Each of the three assessment criteria (ecological, economic and socio-cultural)
of farm sustainability is represented by a set of LUFs. For each LUF, a corresponding
indicator was chosen (Table 2). Indicators were selected based on our understanding of the
local context, consultation with local stakeholders and data measurability. The MCA
attempts to compare indicators of the land use functions in two scenarios involving organic
and non-organic input application.
3.2 Measurement of indicators
Primary data were collected in the study districts on socio-economic parameters, soil and
water quality and agro-biodiversity. Of the three ecological indicators, soil organic carbon
(SOC), an important indicator of soil fertility and productivity, is measured in terms of the
proportion of active carbon content in soil and water quality (WQ) is given by the inverse
of electrical conductivity.4 Agro-biodiversity (BD) is quantified as the number of species
(crops, domesticated cattle and all multipurpose trees) per acre of farmland.
Among the economic indicators, net income (IN) is calculated by subtracting cash
expenses on material (organic and inorganic) inputs, hired labour and transport from the
Table 2 LUFs and indicators for assessment criteria
Assessment criteria Land use function Indicator Measurement of indicator
Ecological Ecosystem processes Soil fertility SOC (% of total carbon)
Water Water quality 1/EC (dS/m)-1
Biodiversity Agro-biodiversity (Species of crops, domesticatedanimals and multipurposetrees)/acre
Economic Economic production Net income INR/acre/year
Provision of food Food from farm kg/person/year
Financial services No overdue loans Probability from logistic function
Socio-cultural Social capital Collective activities Number
Social equity Asset distribution Range between average high andlow asset indices for the village
4 The quality of irrigation water depends on the amount of salts dissolved. The greater the dissolved salts,greater the EC (measured in deciSiemens/meter) and poorer the quality of water.
S. Purushothaman et al.
123
gross agricultural income per acre. Here, some of the organic inputs are farm-generated,
and when there is additional requirement for organic manure, we attribute a shadow price
(price prevailing in informal transactions5) for meeting the additional requirement of
organic inputs that is in excess of what is produced on farm. For mineral fertilizers, the
prevailing market price was used. Thus, IN is of two types—(a) net cash income and
(b) net income with attributed price for additional organic manure. Food from farm (FF) is
measured as the quantity of food (grains and vegetables) grown in the farm that is available
for consumption (per head) in the farm family. The indicator no overdue loans (NDT) is
the probability6 of the farmer not having defaulted or overdue loans.
We selected two socio-cultural indicators, asset distribution (AD) and collective
activities (CA), to represent the socio-cultural LUFs. Asset distribution is measured as the
range of asset index (index of land area, vehicles and gadgets owned) in the village. The
indicator is measured as the range between (average) asset index for households above and
below the mean asset index of all households in the village. Thus, an inverse of this range
was considered, so that the higher this number (to be in line with the direction of values for
other indicators), more equal the distribution of assets in the village. Collective activities
are measure of involvement of the family in village events and activities. It is the number
of associations, groups or events in the village that family members participate in.
Using the above-mentioned eight indicators, we assess the current and projected effect
of policy-driven changes in farming practices on ecological, economic and socio-cultural
LUFs of small farms in the selected districts.
3.3 Data for quantifying the indicators
For initial implementation of the KSPoOF, one village per taluk was selected by the
department of agriculture based on willingness among farmers, availability of livestock
and presence of local NGOs. Three villages where the policy was implemented since 2006
(policy villages) and three neighbouring (non-policy) villages where KSPoOF had not been
implemented were selected in each study district (except for Udupi, a smaller district,
where only 4 villages were selected in total). In 2009–2010, we conducted a primary
survey using a tested semi-structured questionnaire in 14 ‘policy’ villages and 14 ‘non-
policy’ villages. Thus, data are available from villages where organic practices had been
supported for more than 3 years (since 2006) and for neighbouring villages where such
incentives were not given. Small farmers were the target beneficiaries of organic farming
policy although large farmers were not totally excluded from the policy. In four out of five
districts studied, the farm households selected for socio-economic interview had an
average landholding size between 2.25 and 6.3 acres (0.9 and 2.6 ha), while in Chitradurga,
the landholdings were larger with an average size of 13.5 acres (5.62 ha). Small farmers
(with landholding \2 ha) constituted 61% out of total 260 respondents in all districts.
Analysis of the data collected revealed that there were also farmers who applied con-
siderable amount of organic manure in non-policy villages. Since the policy emphasis was
not on complete conversion to certified organic farming, we decided to classify farmers
into two groups based on the quantity of organic fertilizer applied per unit area of land.
5 No formal existing market for farm yard manure.6 The probability of being free from overdue loans is measured using a binary logistic function for eachdistrict. Most common determinants of this probability were Cropping intensity, Gross agricultural income,Landholding size, area under commercial crops and irrigation. Equation explaining probability of being freefrom overdue loans is given in ‘‘Appendix 3’’.
Impact of policies favouring organic inputs
123
One group of farmers, the ‘with-policy’ (WP) group, included those farmers who applied
(either voluntarily or by policy influence) 70% or more nutrients out of the total input
application sourced from organic matter. The other group, ‘Business as usual’ (BAU), was
formed of farmers whose organic nutrient use was less than 70% of the total nutrients
applied. However, in Udupi, only farmers who applied 100% organic matter were clas-
sified as ‘WP’, as the availability and use of organic matter (farm yard manure, leaf
manure) was higher compared to other districts, owing to the nature of major crops like
areca and paddy (Sinu et al. 2012) and more biomass in the landscape.
The questionnaire used for primary data collection of socio-economic information of
farm household covered details about the family, education, cropping pattern, crop inputs,
crop yield, livestock, trees, gadgets and machinery, housing, irrigation, income, food
consumption (bought and produced), assets, marketing facilities, collective activities,
labour employed and defaulted loans. Soil and water samples from the farms (in both WP
and BAU groups) were collected and analysed for SOC and Water EC at the state run
Krishi Vigyan Kendra (KVK) laboratories in the respective districts. The data collected
were used to compute values of the indicators as explained in Sect. 3.2.
Table 3 gives the average values of indicators quantified using data collected through
interviews, farm observations and soil and water analysis in WP and BAU farmers in the
study villages. The numbers in parentheses against each group in the table indicate the
number of households surveyed.7
Ecological indicators measured higher in WP farms compared to BAU, except for water
quality in Mysore. In three study districts, adopting WP farming practices has helped
farmers to improve net income and also to escape defaulting on loan repayments. However,
food consumption from their own farms is less in WP farms (compared to BAU) in three
districts, which is poorer among the study sites. Collective activities are higher in WP than
in BAU (in four districts), whereas distribution of assets is often less equal in WP than in
BAU (in three districts).
Though the comparison of present situation is useful, it needs to be verified for the
nearby future8 to be more prescriptive about corresponding policy drivers. Thus, we
attempt a short-term projection of these patterns in indicators found in 2009, using MCA
based on weightages attributed by stakeholders.
3.4 Inclusion of community preferences
In the deliberative traditions of MCA, stakeholders’ preferences for important LUFs were
an integral part in this MCA exercise. The method used follows a cardinal form of
deliberative multicriteria evaluation (Zendehdel et al. 2008) that integrates results of
deliberation and stakeholder interaction towards consensus building into the MCA. We
draw upon information from Participatory Impact Assessment (PIA) workshops organized
in the study sites where stakeholders were asked to attribute weightage to the selected
LUFs to signify their importance. On an average, across the five districts, higher weights
were attributed to the ecological and economic LUFs than to the socio-cultural LUFs
(Fig. 2). PIA workshop in Bijapur (the poorest of the study districts) ranked provision of
food as the most important function of their land, and participants from Udupi (the most
developed of the study districts) ranked water quality and soil fertility as most important.
7 Comparison of mean values of other key variables for WP and BAU groups is presented in ‘‘Appendix 1’’.8 Especially since it was not feasible to get enough sample farms following strictly the selected practices fora comparable time period.
S. Purushothaman et al.
123

Ta
ble
3M
ean
indic
ato
rv
alu
es(i
n2
00
9)
for
sam
ple
ho
use
ho
lds
Ind
icat
or
Bij
apu
rC
hit
rad
urg
aC
hik
bal
lap
ur
My
sore
Ud
up
i
WP
(30
)@B
AU
(15
)&W
P(3
3)
BA
U(1
0)
WP
(63
)B
AU
(35
)W
P(2
9)
BA
U(1
4)
WP
(23
)B
AU
(8)
So
ilo
rgan
icca
rbo
n(%
)a1
.18
1.0
00
.49
0.4
40
.51
0.3
90
.73
0.6
00
.49
0.5
0
Wat
erq
ual
ity
(in
ver
seo
fE
C)b
(dS
/m)-
11
.38
0.9
10
.79
0.6
20
.57
0.5
81
.34
3.9
82
.55
1.8
3
Agro
-bio
div
ersi
ty(s
pec
ies/
acre
)3
.68
3.1
91
.19
0.6
62
.03
1.3
02
.54
2.0
02
.61
2.3
4
Net
cash
inco
me
(IN
R/a
cre/
yea
r)1
1,9
35
-1
,99
23
4,5
36
7,1
97
1,6
481
,416
2,6
33
5,8
352
6,1
49
20
,45
5
Net
Inco
me
(wit
hsh
adow
pri
cefo
rorg
anic
inputs
)(I
NR
/acr
e/yea
r)9
,997
(-5
,831
)2
7,7
08
6,5
89
(-1
3,3
50
)(-
9,8
39)
(-3
,886
)(-
46
4)
(-7
,39
3)
(-1
0,6
27
)
No
ov
erd
ue
loan
s(p
rob
abil
ity
)0
.95
0.9
50
.44
0.5
50
.23
0.2
50
.70
0.4
30
.55
0.4
4
Fo
od
fro
mfa
rm(k
g/c
apit
a/y
ear)
42
05
11
92
51
14
53
54
51
98
85
38
81
07
16
53
Coll
ecti
ve
acti
vit
ies
(nu
mb
er)
0.5
00
.33
0.8
80
.80
0.6
80
.66
0.0
70
.14
1.3
01
.13
Ass
etdis
trib
uti
on
(inver
seo
fra
nge
bet
wee
nav
erag
eh
igh
and
low
vil
lag
eas
set
ind
ices
)
1.1
71
.73
1.2
71
.51
0.9
50
.91
1.7
01
.06
1.6
11
.68
Hig
her
val
ues
ital
iciz
ed
n(W
P)
=1
78
and
n(B
AU
)=
82
ath
resh
old
:m
inim
um
of
0.5
%;
bth
resh
old
:m
axim
um
of
2(d
S/m
)-1
@W
P‘w
ith
po
licy
’ap
ply
ing
70
%o
rm
ore
of
tota
ln
utr
ien
tsas
org
anic
mat
ter;
&B
AU
‘bu
sin
ess
asu
sual
’,fa
rms
app
lyin
gle
ssth
an7
0%
of
tota
ln
utr
ien
tsas
org
anic
mat
ter
Impact of policies favouring organic inputs
123

3.5 Projecting the impact of practices in different scenarios
Assessment of multidimensional sustainability is instrumental in evaluating the varied
benefits and drawbacks of any target policy, so that mitigation strategies for possible
negative impacts can be prepared while implementing the policy for different target
locations and groups. Quantitative scenario descriptions allow the assessment of change in
indicators in different policy/practice scenarios from the baseline situation. We opted for a
target year (2015) that was 5 years from the assessment year (2009–2010) for scenario
development, considering the turnover period of policies in line with the tenure of a
government and the period for national planning (both 5 year) in India.
The scenarios used for the MCA analysis were based on expert knowledge, past trends
in the state, stakeholders’ views from PIA workshops and past trends in policies.
‘‘Appendix 2’’ provides the assumptions on all variables in the two scenarios. The major
difference between the scenarios is the relative quantity of different inputs used. For
example, in the WP scenario, it was learnt reasonable to assume 40% increase in the
quantity of organic inputs and 20% decrease in the quantity of chemical inputs for all
districts in line with stated policy goals. Similarly, in the BAU scenario, it is assumed that
the quantity of inorganic inputs used would increase by 30%, and organic inputs would
decrease by 30%. Among the soil and water parameters, soil organic carbon was assumed
to change because of the policy emphasis on organic inputs and because of the current
levels of soil carbon in WP and BAU farms (Table 3). Variables like ‘extent of commercial
crops’, ‘irrigated area’ and ‘cropping intensity’ were expected to change, but depending on
Fig. 2 Preference for LUFs from PIA
S. Purushothaman et al.
123

the public investments in irrigation projects and infrastructure like road networks and
markets. Landholding size and rainfall are assumed to be largely unaffected during the
period till 2015. The values of the indicators were projected to 2015, using regressions and
expected changes in explanatory variables in the two scenarios.
Ordinary least square regression was used to identify the causal relationships between
the selected LUF indicators and the economic, environmental, social and institutional
dimensions of the prevailing situation in the district as also to project the values of the
indicators in 2015.9 Independent variables used in the regression equations were tested for
multicollinearity and modified as explained above for the scenarios WP and BAU before
predicting the value of dependent variables for 2015.
3.6 MCA for comparing the scenarios
The software Criterium Decision Plus (CDP) was used to carry out the multicriteria
analysis by comparing the projected impact of the two scenarios based on indicator values
(as in Sect. 3.5) and weights acquired from PIA (as in Sect. 3.4). The projected values of
indicators using the regression with the two scenarios (equations in ‘‘Appendix 3’’) and
LUF weights (as in Fig. 2) are entered in CDP. CDP uses a decision tree (Fig. 3) to
normalize indicator values and attribute weights to indicators.
In CDP, threshold values and ranges are objectively set for all indicators, in order to
normalize values of indicators, so that they can be compared, as these thresholds10 affect
the overall score of sustainability.
4 Results and discussion
The comparative performance of indicator scores between WP and BAU after a 5-year
period across the study districts is depicted in Table 4 (not to be compared among the
districts, but between the scenarios for each district). Figure 4 compares small and big
landholdings, and Fig. 5 compares rain-fed and irrigated farmers. All the three sets of
Fig. 3 Framework of hierarchical process for impact assessment
9 Regression equations determining indicators values are provided in ‘‘Appendix 3’’.10 For most indicators, the threshold is given by the minimum and maximum values in the data, so that theycan be normalized and compared. SOC and WQ were normalized using standard threshold levels of 0.5–2and 2–0 respectively.
Impact of policies favouring organic inputs
123

results use two variants of the indicator ‘net income’ (IN), with and without the shadow
price for additional organic inputs expected to be used in the coming years in WP. The
rationale here is the uncertainty about self-sufficiency in sourcing these organic inputs
from own farms, given the current levels of biomass and livestock in the farm holdings.
Altogether, the only trade-off in WP in the run up to 2015 (from 2009) was found to be
only in socio-cultural indicators for three districts (Mysore, Chikballapur and Chitradurga).
Otherwise, no indicator was adversely impacted in any district in WP.
Despite the districts having different physical and social characteristics, most of the
selected indicators perform better even in the short term, with policies favouring organic
inputs going against the arguments in literature for adverse impacts on crop yields (e.g.
Bhattacharyya and Chakraborty 2005; Ramesh et al. 2010) affecting farm household
economy. In other evaluations like Gomez-Limon and Sanchez-Fernandez (2010), private
environmental benefits from reduced use of artificial fertilizers emerge greater than the
increase in profits obtained from their use. Apart from the private benefits considered here,
the use of organic inputs (instead of chemical fertilizers) statedly has potential for miti-
gating greenhouse gas emissions from avoided production and application of fossil fuel-
based fertilizers and soil carbon sequestration (Tirado et al. 2010). Imbalanced use of
fertilizers and pesticides, leading to deterioration in soil and water quality and pesticide
resistance, could add to financial burden, thus linking agricultural practices and financial
viability. Unlike the already cited literature on adverse impacts on income and crop yield
with organic farming, the adverse trade-off in WP here was unexpectedly on socio-cultural
indicators in three of the five study districts. Such disaggregated results provide pointers as
to where and how to anticipate varied potential impacts of policies.
Despite not attaching price-premium for organic produce, net income in WP is projected
to be higher than in BAU for the study districts. This economic advantage with organic
Table 4 Impact on selected indicators in two scenarios across study sites
Indicators WP better than BAU WP sameas BAU
WP worsethan BAU
Soil organic carbon Mysore, Chitradurga, Chikballapur,Bijapur, Udupi
None None
Water quality Bijapur, Chitradurga, Mysore, Udupi Chikballapur None
Biodiversity Chitradurga, Bijapur, Mysore.Chikballapur, Udupi
None None
Net income Bijapur, Chitradurga, Mysore,Chikballapur, Udupi
None None
Net income (with shadowprice for organicinputs)
Chitradurga, Bijapur, Udupi,Mysore, Chikballapur
None None
No overdue loans Bijapur, Mysore, Chitradurga,Udupi, Chikballapur
None None
Food from farm Udupi, Chikballapur, Mysore,Bijapur, Chitradurga
None None
Collective activities Chitradurga, Bijapur Udupi Chikballapur,Mysore
Asset distribution Chikballapur, Udupi, Mysore Bijapur Chitradurga
The actual projected values are in ‘‘Appendix 4’’, and the difference in values between the scenarios fromCDP are in ‘‘Appendix 5’’
S. Purushothaman et al.
123
practices in terms of cost savings is also found in Padel and Lampkin (1994) and Offer-
mann and Nieberg (1999). Thus, we differ with the arguments for premium price for
organic products as precondition for the success of organic farming (Ramesh et al. 2005)
and also point towards the need to transform prevailing institutions and collective activities
around the use of capital intensive inputs like credit and fertilizer cooperatives, into local
networks around production and use of organic inputs.
Districtwise analysis does not give us insights into disaggregated relative impact of
practices on small and big farms or on rain-fed and irrigated farms. Thus, we pool the data
across districts to compare WP and BAU for small (up to 2 ha) and big farms as well as
rain-fed (irrigated area less than or equal to 20% of total landholding) and irrigated farms.
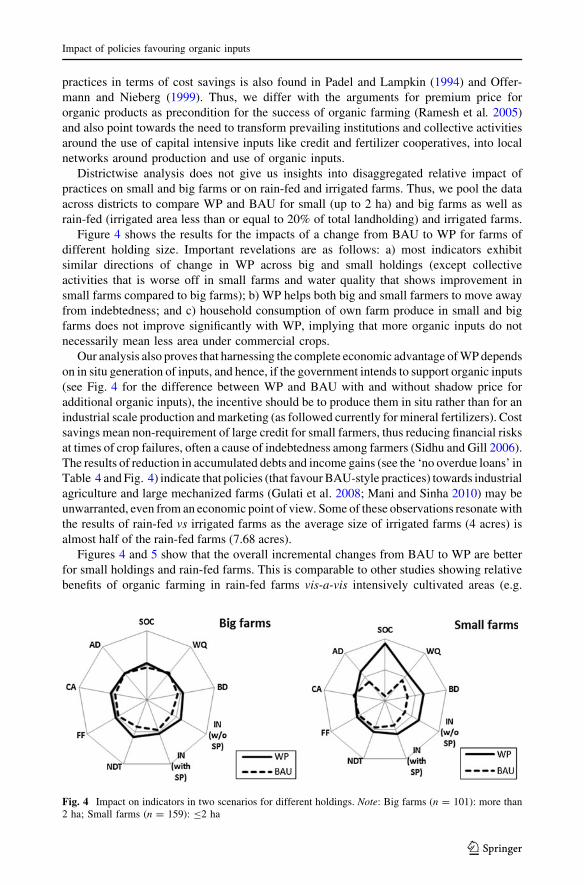
Figure 4 shows the results for the impacts of a change from BAU to WP for farms of
different holding size. Important revelations are as follows: a) most indicators exhibit
similar directions of change in WP across big and small holdings (except collective
activities that is worse off in small farms and water quality that shows improvement in
small farms compared to big farms); b) WP helps both big and small farmers to move away
from indebtedness; and c) household consumption of own farm produce in small and big
farms does not improve significantly with WP, implying that more organic inputs do not
necessarily mean less area under commercial crops.
Our analysis also proves that harnessing the complete economic advantage of WP depends
on in situ generation of inputs, and hence, if the government intends to support organic inputs
(see Fig. 4 for the difference between WP and BAU with and without shadow price for
additional organic inputs), the incentive should be to produce them in situ rather than for an
industrial scale production and marketing (as followed currently for mineral fertilizers). Cost
savings mean non-requirement of large credit for small farmers, thus reducing financial risks
at times of crop failures, often a cause of indebtedness among farmers (Sidhu and Gill 2006).
The results of reduction in accumulated debts and income gains (see the ‘no overdue loans’ in
Table 4 and Fig. 4) indicate that policies (that favour BAU-style practices) towards industrial
agriculture and large mechanized farms (Gulati et al. 2008; Mani and Sinha 2010) may be
unwarranted, even from an economic point of view. Some of these observations resonate with
the results of rain-fed vs irrigated farms as the average size of irrigated farms (4 acres) is
almost half of the rain-fed farms (7.68 acres).
Figures 4 and 5 show that the overall incremental changes from BAU to WP are better
for small holdings and rain-fed farms. This is comparable to other studies showing relative
benefits of organic farming in rain-fed farms vis-a-vis intensively cultivated areas (e.g.
Fig. 4 Impact on indicators in two scenarios for different holdings. Note: Big farms (n = 101): more than2 ha; Small farms (n = 159): B2 ha
Impact of policies favouring organic inputs
123

Ramesh et al. 2005). Surprisingly again, the Fig. 5 also shows that WP does not aid rain-
fed farmers in deriving more food for subsistence from land; in fact, it does not vary much
across big, small, rain-fed or irrigated farms. This indicator is influenced by the access of
households to the public distribution system (PDS) (as stated also in Purushothaman 2005)
and wherever PDS performs well with assured and cheaper access to food grains for the
family, farmers grow crops for the market. Nevertheless, in WP, they could be reaping
additional benefits in terms of other indicators, though WP by itself is not enough to make
them grow coarse grains/food crops.
The adverse trend in collective action in small and rain-fed farms implies the need to
revive and revitalize village social platforms for farmers to interact on the techniques and
practices involving organic inputs as current institutional mechanisms are mostly around
fertilizer and credit cooperatives and dominated by large farmers. Adverse performance of
asset distribution in irrigated WP is less explainable but could be attributed to the corre-
lation of small holdings with irrigation as also the currently less mechanized operations in
small farms following organic practices.
Although this study makes an attempt to trace a range of indicators to evaluate sus-
tainability, we concede that these indicators do not cover the entire spectrum of factors
affecting sustainability of small farms.
5 Concluding remarks
At a time when there are apparent attempts to wean small farmers from their occupation
given the expected economies of scale from consolidation of farm land in corporate farming
(Gulati et al. 2008), amidst a widely discussed agrarian crisis and the ironic coexistence of
food price inflation and farmers’ suicides, it is critical to look at the prospects of small-scale
agriculture in India, given the negative effects of conventional agriculture on soil, water and
health as well as challenges posed by climate change, water scarcity, decline of biodiversity,
socio-economic problems. The objective of the study was to compare the impact of recently
incentivized sustainable farm practices (WP) with that of conventional non-organic practices
(BAU) on small farms using deliberative but cardinal MCA.
The economic benefits in terms of freedom from indebtedness and income gains, slight
reduction in collective action and almost no impact on land-based subsistence (in both rain-
Fig. 5 Impact on indicators in two scenarios for rain-fed and irrigated farms. Note: Rain-fed (n = 92):Irrigated area B20% of the total land holding; Irrigated (n = 168): irrigated area more than 20%
S. Purushothaman et al.
123

fed and small farms) are the emerging short-term prospects with policies supporting organic
inputs. Although WP emerges better with respect to income, benefits are better if inputs are
generated in situ. Though WP does not improve the food sourced from own land and
involvement in collective activities, the ecological and economic benefits make the case for
support for in situ production of organic manures and fertilizers, along with catalysing the
emerging institutions for weaving collective activities around these practices.
The largest projected benefits from policies favouring sustainable agriculture among the
study sites in Karnataka were seen in Bijapur and Chitradurga, where ecological and
economic indicators benefit significantly. Results in these drier and underdeveloped dis-
tricts indicate that such policies (promoting sustainable agriculture) have a good potential
in resource-poor areas. Given the weightages elicited from PIA, it appears that WP is in
line with what farmers want, except for food raised from own farms, that is often valued as
the most important use of one’s land (e.g. in Bijapur).
The MCA results show that implementation or continuation of policies that favour
organic farming practices can help small farming sustain as an occupation though the
nature and extent of impact on ecological, economic or socio-cultural criteria differ across
districts. The paper also illustrates the potential application of MCA with participatory and
quantitative processes, in a disaggregate analysis of multidimensional impacts of farm
policies.
Acknowledgments The authors gratefully acknowledge the support of EU FP6 project ‘‘Land use policiesand sustainable development in developing countries (LUPIS)’’.
Appendix 1
See Table 5
Table 5 Mean values of key variables in WP and BAU for 2009
Variables Bijapur Chitradurga Chikballapur Mysore Udupi
WP(30)
BAU(15)
WP(33)
BAU(10)
WP(63)
BAU(35)
WP(29)
BAU(14)
WP(23)
BAU(8)
Landholding (acre) 2.25 2.80 10 17 4.89 4.9 3.41 6.3 4.32 3.99
Education (number ofyears of schooling)
4 6 10 10 7 8 4 7 5 3
Food crop yield(kg/acre)
1,600 917 1,790 1,538 750 734 1,100 1,088 2,200 1,000
Commercial crop yield(kg/acre)
4,560 2,390 1,313 2,368 3,700 2,690 1,569 1,400 400 600
Livestock(number/acre)
4 3 1 1 2 1 3 2 2 1
Organic input (kg/acre) 11,965 409 5,663 1,097 4,756 1,984 2,771 1,588 7,523 5,961
Inorganic input(kg/acre)
0 177 26 230 40 152 11 162 0 290
Extent of Irrigation (%) 76 78 22 7 62 47 51 45 38 29
Cropping intensity (%) 172 194 107 79 77 59 136 157 114 85
Commercialization (%) 46 42 85 90 44 58 38 63 66 61
Mean values for 2009
Values enter regression equations in ‘‘Appendix 3’’; Mean values for LUF indicators are in Table 3
Impact of policies favouring organic inputs
123

Appendix 2
See Table 6
Table 6 Scenario assumptions for projecting indicator variables to 2015
Variable Acronym used in‘‘Appendix 3’’
With policy(WP)
Business as usual(BAU)
Livestock (number/acre) ANC (?)10% (-)10%
Agro-biodiversity (number of species/acre) BD (?)10% (-)10%
Collective action (number) CA (?)10% (-)10�%
Commercial crop ratio (%) CC No change (?)10%
Home grown food consumption (kg/person/acre) FF (?)10% (-)10%
Cropping intensity (%) CI (?)10% (?)10%
Crop species (number) CrSP (?)10% (-)10%
Cultivated land holding (acres) CULH (?)10% (?)10%
No overdue loans (probability) NDT (?)10% (-)10%
Ground water level (feet) GRW (-)10% (-)10%
Chemical fertilizer (kg/acre) CFZ (-)30% (?)30%
Net income (INR/acre/year) IN No change No change
Organic fertilizer (kg/acre) OFZ (?)40% (-)20%
Extent of irrigation (%) IRLPR (?)10% (?)10%
Land holding (acre) LH No change No change
Plantation crop species (number) PlSP (?)5% (?)10%
Soil organic carbon (%) SOC (?)10% (-)10%
Tree species (number) TrSP (?)10% (-)10%
Water quality (inverse of EC) WQ No change No change
These variables also include selected indicators as they often influence one another
S. Purushothaman et al.
123

Appendix 3
See Table 7
Table 7 Regression equations determining indicator values for 2009
Indicator Bijapur Chitradurga Chikballapur Mysore Udupi
SOC -CULH**, -IRLPR**,?CrSP**,?ANC*,?CFZ*(49%)
-IRLRP**,?GRW*,?BD*, -PlSP**,?CC**(30%)
-CULH**,?CI**, -CFZ** (45%)
-CI**, -CFZ**, ?BD*(39%)
?IRLPR*,?CFZ*, -CC*,?WQ*, ?BD**,-ANC** (49%)
WQ -CFZ*, ?BD*,?CrSP**(64%)
?IRLPR*,?CI*,?OFZ**(57%)
-IRLPR**,?CC**,?CrSP**, -PlSP** (70%)
?CULH**,?IRLPR*,?OFZ**,?GRW**,?CrSP**(78%)
?CC*, -CrSP**,?IRLPR*, -CFZ* (42%)
BD ?CI**,?NDT**,?FC**,?FF**,?ANC**(79%)
?IRLPR**,?CI**,?OFZ**,?ANC**(72%)
?IRLPR*,?CI**,?OFZ*,?ANC**(40%)
?IRLRP**,?CI**,?OFZ**,?ANC**(75%)
-CULH**,?IRLPR**,?NDT*,?CFZ**,?PlSP**,?SOC** (81%)
IN -CULH**,?OFZ**, -CrSP**,?PlSP**(73%)
-CULH**, -IRLPR**,?OFZ**,?CC* (57%)
?CI**, -CrSP**,?BD*, -CFZ** (61%)
?WQ**, -CULH**, -IRLPR**,?CA** (68%)
-CULH**, -CFZ**, ?CC*,-CrSP** (34%)
NDT ?IRLPR**, -CI**,?CrSP**,?BD* (60%)
?IRLPR**, -CI*,?OFZ**,?CFZ*,?CC* (63%)
?CULH**,?OFZ**, -CC**,?CrSP**(72%)
-CC**,?BD**,?PlSP**, -CrSP** (68%)
-CULH**, -CFZ*, -CC*,?FF** (59%)
FF ?IRLRP**,?CA**, -OFZ**, -PlSP**,?BD**(63%)
?CULH**,?NDT*,?OFZ*, -CC** (40%)
-IRLPR**, -CI**, ?CFZ**,-CC**,?CrSP*,?SOC** (57%)
-CI*, -CFZ**,?CrSP**(40%)
?CULH**,?ANC**,?CrSP*, -PlSP* (76%)
CA ?CC**,?CrSP*,?PlSP**(48%)
?CrSP**,?ANC*,?BD*, -NDT* (56%)
-PlSP**,?ANC*, -CC* (71%)
-CULH**, -IRLPR**,?CFZ**, -ANC* (49%)
-CULH**, -CC*, ?IRLPR*,-NDT* (61%)
AD -CI*, ?NDT*,?CC*, ?IN*(59%)
?OFZ**,?CrSP**, -PlSP**(64%)
?IRLPR**,?CrSP**,?SOC**, -CA** (91%)
-CI**, -PlSP*,-ANC**, -CA** (77%)
?CA**, ?NDT**,?PlSP**, ?CI**(62%)
Acronyms explained in Table 6 (Appendix 2)
* Significant at 95% level; ** significant at 99% level; Numbers in parenthesis indicates R2 of eachregression equation in each district
Impact of policies favouring organic inputs
123

Ap
pen
dix
4
See
Tab
le8
Ta
ble
8P
roje
cted
mea
nv
alu
eso
fin
dic
ato
rs(i
n2
01
5)
Cri
teri
aIn
dic
ators
Bij
apur
Chit
radurg
aC
hik
bal
lapur
Myso
reU
dupi
WP
BA
UW
PB
AU
WP
BA
UW
PB
AU
WP
BA
U
Eco
log
ical
So
ilo
rgan
icca
rbo
n1
.13
0.7
90
.50
0.4
60
.49
0.4
60
.80
0.5
00
.51
0.4
8
Wat
erq
ual
ity
1.6
10
.88
0.8
00
.71
0.5
70
.58
2.3
92
.37
2.6
12
.22
Bio
div
ersi
ty4
.36
3.0
21
.24
0.5
92
.27
1.8
72
.73
2.2
32
.73
2.4
4
Eco
nom
icN
etin
com
e1
1,9
35
-1
,992
34
,53
67
,19
71
,648
1,4
16
2,6
335
,835
26
,14
92
0,4
55
Net
inco
me
(wit
hsh
adow
pri
cefo
ro
rgan
icin
pu
ts)
12
,86
6-
8,2
90
3,6
52-
18
,61
4-
12
,20
8-
12
,50
8-
3,8
64-
9,8
55
-7
,612
-1
1,2
89
No
ov
erd
ue
loan
s0
.97
0.9
30
.72
0.5
70
.23
0.2
20
.73
0.4
10
.47
0.4
4
Fo
od
from
farm
47
64
68
1,2
351
,12
75
31
99
93
38
65
1,4
74
1,0
16
Soci
o-c
ult
ura
lC
oll
ecti
ve
acti
vit
ies
0.4
60
.45
0.8
80
.81
0.6
40
.69
0.1
10
.18
1.2
41
.24
Ass
etd
istr
ibu
tio
n1
.37
1.3
71
.35
1.4
40
.95
0.9
10
.84
0.4
51
.69
1.6
2
Hig
her
val
ues
ital
iciz
ed
Pro
ject
edv
alues
of
oth
erk
eyv
aria
ble
sar
eas
sum
pti
on
sm
ade
for
scen
ario
sas
list
edin
‘‘A
pp
end
ix2’’
S. Purushothaman et al.
123

Appendix 5
See Table 9
References
Bhalla, G. S., & Singh, G. (2009). Economic liberalisation and indian agriculture: A statewise analysis.Economic and Political Weekly, 44(52), 34–44.
Bhattacharyya, P., & Chakraborty, G. (2005). Current status of organic farming in India and other countries.Indian Journal of Fertilizers, 1(9), 111–123.
Cai, Y., & Smith, B. (1994). Sustainability in agriculture: A general review. Agriculture, Ecosystems &Environment, 49, 299–307.
Chambers, R., Pacey, A., & Thrupp, L. A. (1989). Farmer first: Farmer innovation and agriculturalresearch. London: Intermediate Technology.
Chand, R., Prasanna, P. A. L., & Singh, A. (2011). Farm size and productivity: Understanding the strengthsof smallholders and improving their livelihoods. Economic and Political Weekly, 46(26–27), 5–11.
DES. (2006). Agricultural census. Directorate of Economics and Statistics.DES (2011). Karnataka at a Glance (2009–2010). Directorate of Economics and Statistics.Deshpande, R. S. (2002). Suicides by farmers in Karnataka: Agrarian distress and possible alleviatory steps.
Economic and Political Weekly, 37(26), 2601–2610.Deshpande, R. S. (2007). Emerging issues in land policy. Asia Development Bank. INRM Policy Brief No.
16.Deshpande, R. S., & Prabhu, N. (2005). Farmers’ distress proof beyond question. Economic and Political
Weekly, 40(44), 4663–4665.Dodgson, J. S., Spackman, M., Pearman, A. & Phillips, L. D. (2009). Multi-criteria analysis: A manual.
Department for Communities and Local Government: London, UK. http://eprints.lse.ac.uk/12761/.Accessed December 30 2011.
Ellis, F., & Biggs, S. (2001). Evolving themes in rural development 1950s to 2000s. Development PolicyReview, 19(4), 437–448.
Fan, S., & Chan-Kang, C. (2005). Is small beautiful? Farm size, productivity, and poverty in Asian agri-culture. Agricultural Economics, 32, 135–146.
Giovannucci, D. (2005). Evaluation of organic agriculture and poverty reduction in Asia. Rome: Interna-tional Fund for Agricultural Development, Office of Evaluation.
Gomez-Limon, J. A., & Sanchez-Fernandez, G. (2010). Empirical evaluation of agricultural sustainabilityusing composite indicators. Ecological Economics, 69(5), 1062–1075.
Table 9 Difference in CDP values between WP and BAU
Indicators WP better than BAU WP same as BAU WP worse than BAU
Soil organic carbon 0.71, 0.67, 0.60, 0.37, 0.33 None None
Water quality 0.49, 0.19, 0.16, 0.02 0 None
Biodiversity 0.60, 0.25, 0.17, 0.10, 0.07 None None
Net income 0.37, 0.19, 0.06, 0.03, 0.01 None None
Net income (with shadowprice for organic inputs)
0.45, 0.37, 0.17, 0.05, 0.01 None None
No overdue loans 0.33, 0.27, 0.27, 0.04 None None
Food from farm 0.44, 0.21, 0.15, 0.05, 0.01 None None
Collective activities 0.14, 0.02 0 (-0.06, -0.29)
Asset distribution 0.26, 0.11, 0.02 0 (-0.26)
Values appear in the same order of districts as in Table 4
Impact of policies favouring organic inputs
123
Government of Karnataka. (2007) Improving the economic condition of farmers. Report of the OfficialGroup of Government of Karnataka. http://raitamitra.kar.nic.in/Karnataka%20Mission.pdf. AccessedAugust 12 2011.
Gulati, A., Joshi, P. K., & Landen, M. (Ed.) (2008). Contract farming in India: A resource book.http://www.ncap.res.in/contract_%20farming/Resources/2.1%20Ashok%20Gulati.pdf. Accessed Sep-tember 22 2011.
Ikerd, J. E. (1993). The need for a systems-approach to sustainable agriculture. Agriculture, Ecosystems &Environment, 46(1–4), 147–160.
Keeney, R. L., & Raiffa, H. (1976). Decisions with multiple objectives: Preferences and value trade-offs.New York: Wiley.
Konig, H. J., Schuler, J., Suarma, U., McNeill, D., Imbernon, J., Damayanti, F., et al. (2010). Assessing theimpact of land use policy on urban-rural sustainability using the FoPIA approach in Yogyakarta,Indonesia. Sustainability, 2, 1991–2009.
Mani, G., & Sinha, V. K. (2010). Credit absorption capacity of farmers in Uttar Pradesh. Indian Journal ofAgricultural Economics, 65(4), 677–692.
Morton, J. F. (2007). The impact of climate change on smallholder and subsistence agriculture. Proceedingsof the National Academy of Sciences, 104(50), 19680–19685.
Munda, G., Nijkamp, P., & Rietveld, P. (1994). Qualitative multicriteria evaluation for environmentalmanagement. Ecological Economics, 10, 97–112.
NCRB. (1999–2009). Accidental deaths and suicides in India. National Crime Records Bureau Ministry ofHome Affairs. Government of India.
NSSO. (2003). Situation assessment survey of farmers. Indebtedness of farmer households. NSS 59th round.National Sample Survey Organisation. Ministry of Statistics and Programme Implementation. Gov-ernment of India.
Offermann, F. & Nieberg, H. (1999). Economic performance of organic farms in Europe. In Organicfarming in Europe: Economics and policy 5. Hohenheim: University of Hohenheim. https://www.uni-hohenheim.de/i410a/ofeurope/organicfarmingineurope-vol5.pdf. Accessed September 25 2011.
Padel, S., & Lampkin, N. H. (1994). Farm-level performance of organic farming systems: An overview. InN. H. Lampkin & S. Padel (Eds.), Economics of organic farming. Wallingford, UK: CABI.
Perez-Soba, M., Petit, S., Jones, L., Bertrand, N., Briquel, V., Omodei-Zorini, L., et al. (2008). Land usefunctions: A multifunctionality approach to assess the impact of land use change on land use sus-tainability. In K. Helming, P. Tabbush, & M. Perez-Soba (Eds.), Sustainability impact assessment ofland use changes. Berlin, Heidelberg, New York: Springer.
Pretty, J. N. (1995). Regenerating agriculture: Policies and practice for sustainability and self-reliance.London: Earthscan Publications Limited.
Purushothaman, S. (2005). Land-use strategies for Tribals: A socio economic analysis. Economic andPolitical Weekly, 53, 5611–5619.
Purushothaman, S., & Kashyap, S. (2010). Trends in land use and crop acreages in Karnataka and theirrepercussions. Karnataka Journal of Agricultural Sciences, 23(2), 330–333.
Ramesh, P., Panwar, N. R., Singh, A. B., Ramana, S., Yadav, S. K., Srivastava, R., et al. (2010). Status oforganic farming in India. Current Science, 98(9), 1190–1194.
Ramesh, P., Singh, M., & SubbaRao, A. (2005). Organic farming: Its relevance to the Indian context.Current Science, 88(4), 561–568.
Rao, C. H. H., & Gulati, A. (2005). Indian agriculture: Emerging perspectives and policy issues. New Delhi:Academic Foundation.
Reddy, R. V., & Galab, S. (2006). Looking beyond the debt trap. Economic and Political Weekly, 41(19),1838–1841.
Reenberg, A., & Paarup Laursen, B. (1997). Determinants for land use strategies in a Sahelian agro-ecosystem: Anthropological and ecological geographical aspects of natural resource management.Agricultural Systems, 53(2–3), 209–229.
Sadok, W., Angevin, F., Bergez, J. E., Bockstaller, C., Colomb, B., Guichard, L., et al. (2008). Ex anteassessment of the sustainability of alternative cropping systems: Implications for using multi-criteriadecision-aid methods. A review. Agronomy for Sustainable Development, 28, 163–174.
Sidhu, R. S., & Gill, S. S. (2006). Agricultural credit and Indebtedness in India: Some issues. Indian Journalof Agricultural Economics, 61(1), 11–35.
Singh, R. B. (2000). Environmental consequences of agricultural development: A case study from the GreenRevolution state of Haryana, India. Agriculture, Ecosystems & Environment, 82, 97–103.
Sinu, P. A., Kent, S. M., & Chandrashekara, K. (2012). Forest resource use and perception of farmers onconservation of a usufruct forest (Soppinabetta) of Western Ghats, India. Land Use Policy, 29,702–709.
S. Purushothaman et al.
123

Suri, K. C. (2006). Political economy of agrarian distress. Economic and Political Weekly, 41(16),1523–1529.
Tirado, R., Gopikrishna, S. R., Krishnan, R., & Smith, P. (2010). Greenhouse gas emissions and mitigationpotential from fertilizer manufacture and application in India. International Journal of AgriculturalSustainability, 8(3), 176–185.
Tiwari, D. N., Loof, R., & Paudyal, G. N. (1999). Environmental-economic decision-making in lowlandirrigated agriculture using multi-criteria analysis techniques. Agricultural Systems, 60, 99–112.
Van Calker, K. J., Berentsen, P. B. M., Giesen, G. W. J., & Huirne, R. B. M. (2005). Identifying and rankingattributes that determine sustainability in Dutch dairy farming. Agriculture and Human Values, 22,53–63.
Vasavi, A. R. (1999). Agrarian distress in Bidar. Market, state and suicides. Economic and Political Weekly,34(32), 2263–2268.
Verma, B. N., & Bromley, D. W. (1987). The political economy of farm size in India. Economic Devel-opment and Cultural Change, 35(4), 791–808.
Viswanathan, P. K., Thapa, G. B., Routray, J. K., & Ahmad, M. M. (2012). Agrarian transition and emergingchallenges in Asian agriculture: A critical assessment. Economic and Political Weekly, 47(4), 41–50.
Zander, P., & Kachele, H. (1999). Modelling multiple objectives of land use for sustainable development.Agricultural Systems, 59(3), 311–325.
Zendehdel, K., de Keyser, W., & van Huylenbroek, G. (2008). A deliberative multi-criteria approach toenvironmental valuation. In C. Zografos & R. B. Howarth (Eds.), Deliberative ecological economics.New Delhi: Oxford University Press.
Impact of policies favouring organic inputs
123


![PART 6 CONDITIONAL EXEMPTIONS - Home - OAIC · 12 Sinclair v Maryborough Mining Warden [1975] HCA 17; (1975) 132 CLR 473 at 480 ... the factors favouring disclosure and those favouring](https://static.fdocuments.in/doc/165x107/5ac631297f8b9a2b5c8e0998/part-6-conditional-exemptions-home-oaic-sinclair-v-maryborough-mining-warden.jpg)