Impact of Plastic Waste Disposal on Soil and Water Quality ... · per day of municipal solid waste....
47
Impact of Plastic Waste Disposal on Soil and Water Quality at Lucknow Dumpsites CENTRAL POLLUTION CONTROL BOARD (Ministry of Environment & Forests) Parivesh Bhawan, East Arjun Nagar, Delhi-110032 December, 2015
Transcript of Impact of Plastic Waste Disposal on Soil and Water Quality ... · per day of municipal solid waste....

Impact of Plastic Waste Disposal on
Soil and Water Quality at
Lucknow Dumpsites
CENTRAL POLLUTION CONTROL BOARD (Ministry of Environment & Forests) Parivesh Bhawan, East Arjun Nagar,
Delhi-110032
December, 2015


Contents
1. Introduction …1
2. Aims & Objectives
3. Scope of the study …2
4. Plan of Work
5. Methodology …3
5.1 Sampling
5.2 Analysis
5.3 Sampling Condition
6. Sampling Details …18
6.1 List of Soil Samples
6.2 List of water samples
7. Analysis of Soil & Water samples …33
7.1 Physio-chemical Parameters of soil
7.2 Chemical Property of Soil Samples
7.3 Heavy Metals & Organic contaminants in Soil Samples
7.4 Heavy Metals in Water Samples
7.5 Phthalates in Water Samples
8. Conclusion …43
9. Recommendation …44

Executive Summary
Solid waste management (SWM) is an integral part of the urban environment
and planning of the urban infrastructure to ensure safe and healthy environment. While
considering the promotion of sustainable economic growth, the rapid and unplanned
industrialization, urbanization and population growth have resulted in proliferation of
consumer articles vis a vis generation of waste.
Lucknow city is situated at the banks of river Gomti. Geographically, Lucknow
city is situated at coordinates 26.85°N and 80.92°E having 2,528 km2 area. As per 2001
census its population was approximately 27.50 lakhs generating more than 1200 tonnes
per day of municipal solid waste. The purpose of the study was to assess the impact of
plastic waste disposal on soil and ground water quality of Lucknow dumpsite. The
following two dumpsite locations of Lucknow city: a) Ghaila, Hardoi Road and b)
Dudauli, Sitapur Road have been under taken for the sampling and study.
Samples of soil and water were collected and analyzed in both pre monsoon
and post monsoon seasons. It was found through the determination of Toxicity
Characteristic Leaching Procedure (TCLP) that chemical moieties like heavy metals,
chloride, phthalates etc. migrate from plastic waste to the surrounding medium. Since
these plastic additives are not chemically bound with the polymeric chain and remain
present as free and leachable phase, hence, they can migrate from plastic to the
recipient medium during landfilled conditions due to physico-chemical exertion and
microbial degradation. These leachates can cause considerable pollution problems by
contaminating the surrounding soil, ground or surface waters.

1. Introduction
Plastics are petro-based polymer made-up of long chain of hydrocarbons and
non-biodegradable. Plastics are widely used for storage and packaging of food stuffs
and transportation. The usage includes disposable and reusable containers, plastic
wraps, cutlery, water bottles and baby bottles. Plastic products can be easily found in
human residential and occupational environments in high concentrations. After their
service life, the plastic products may be landfilled where due to biotic and abiotic
degradation, leaching of plastic additives i.e. heavy metals, plasticizers, stabilizers,
unreacted monomers and harmful moieties of colorants occur which ultimately percolate
in different segments of environment contaminates soil and water bodies. )
The toxicological effects of several plastic additives have been sporadically
studied and there is a need for holistic study on impact of plastics waste disposal on soil
and ground water. The aim of this study is to monitor and assess the impact of polymeric
and plastic additives with special reference to heavy metals and phthalate esters on soil
and water medium as they are landfilled along with municipal solid waste. An effect has
been made to understand the toxicological implications due to leaching of plastic waste
and to generate baseline data to draw recommendations for identifying the health risk due
to the presence of heavy metals and phthalate esters migrating food chain through
various polymeric and plastic additives used by plastic products manufacturing
industries.
2. AIMS & OBJECTIVES
To collect the soil and water samples from two identified dumpsite locations of
Lucknow city (i.e. Dudauli and Ghaila sites) and compile the information regarding the commonly used practice for plastic waste disposal by municipal authorities and
Consumers.
To estimate the migration or leaching of heavy metals (Cd, Co, Cr, Cu, Pb,
Mo, Ti and Zn) and phthalate esters in ground water and soil samples collected from landfill sites.
Page 1

3. SCOPE OF THE STUDY
To collect and identify different types of plastic products and waste from market and
dumpsites such as colored plastic bags and containers and gift items, plastic
crockery and multilayered plastic and find out leachability of plastic products and
waste in laboratory through appropriate testing methods.
To collect water and soil samples near the dumpsites at Lucknow.
To study the migrations of phthalate esters from dump sites.
To suggest remedial measures on use of additives in production of plastic products.
4. PLAN OF WORK
Phase
of
Work
Phase 1
Phase 3
Phase 2
06 12
Months 18
Page 2

Phases Proposed Plan Status
Phase 1: Initiation of sample collection, procurement of chemicals and glassware, processing, preparation of reagents, standardization of method and appointment of staff.
Control samples of and water had been analyzed during November, 08- January, 09.
Procurement of chemicals and glass wares, processing, preparation of reagents, standardization of method had been completed.
Project staff as envisaged in the project had been appointed.
Pre-monsoon sampling from Dudauli
dumpsite was completed.
Phase 2: Estimation of plastic additives viz. heavy metals and phthalates using standard procedure.
Analysis of pre-monsoon samples was done
Phase 3: Continued the analysis of phthalates, metals etc, and interpretation of available data and compilation of report.
Post-monsoon sampling from Dudauli dumpsite was completed on September 28-30, 2009 and sampling on Ghaila dumpsite was completed on December 9-10, 2009.
5. METHODOLOGY
5.1 Sampling
5.1.1 Identification of Sampling Location:
On the basis of field survey and data concerning to municipal and plastic waste
dumping provided by Lucknow Nagar Nigem, relating to two dumpsite location i.e. (a)
Ghaila, Hardoi Road and (b) Dudauli, Sitapur Road have been under taken for digging
borewell of 30 meter deep at each locations. The samples were taken for soil and water
quality testing using Standard Methods. Samples were taken at two locations on Ghaila
dumpsite and four locations on Dudauli dumpsite in pre and post monsoon period. From
each location respective siol samples were collected at the surface and further at regular
intervals of 3 metes upto the depth of the constructed well. After construction of well first
static water samples were drawn in triplicate at each location. Summary of the sample
collection is presented in Table 2.
Table-1: Work Plan
Page 3

S. No. Sample Site No. of Samples
1. Municipal Solid Waste
Dumpsite, Ghaila, Hardoi Road, Lucknow (2 locations, 3 each)
Pre-Monsoon Plan for Sampling
Post-Monsoon Plan for Sampling
Water Soil Water Soil
06 06 06 06
2. Municipal Solid Waste Dumpsite, Dudauli, Sitapur Road, Lucknow (4 locations, 3 each)
12 12 12 12
Total (72 Samples) 18 18 18 18
Total No. of construction of 30 meter deep test wells: 06 Total No. of samples involving lysimetric method: Water (36 samples) and Soil (36 samples)
Ghaila Municipal Solid Waste Dudauli Municipal Solid Waste
Dumpsite, Hardoi Road, Lucknow Dumpsite, Sitapur Road, Lucknow
I Alcknow City
Residential Area
Dumpsite Area 7- Roads rA
Sampling Location
Residential
Cornmercial
I n d u s t r i a l Administrative
___ Cantonment ___ Roads
Water Bodies
(i ) Sampling Location
Page 4
Table - 2
• • - . (Y . U T T A R P R A D E S H
V ' , 4
AMJASTIMM
" • ss
NIKON
ti.K1.1140
•
AIONIX4/1.1
LOC.. OF UTTAR P.M. $1.1 IN MINA
CHINA PAKI3TAN
India
SARAIIANKI 71e,
44,11+111 041.4
UC . , 0
MARDOr
ONNAO 4 1. . ,:a ,
Nierket AO 44fiva.4
— tsattillaftiwy .....
R +.4
MOW rgatl0 7 C " N
1 01 .ft.Vopri District Lucknow ",‘,„.., RAE BAREJLLY O •v.
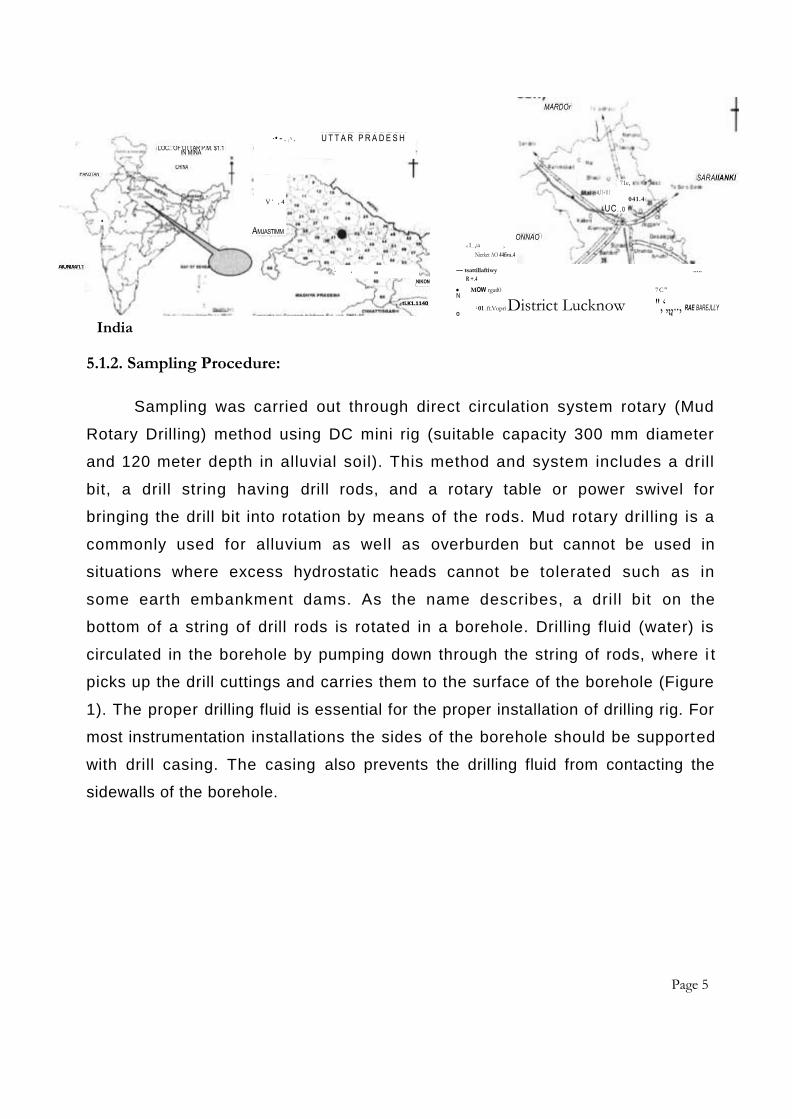
5.1.2. Sampling Procedure:
Sampling was carried out through direct circulation system rotary (Mud
Rotary Drilling) method using DC mini rig (suitable capacity 300 mm diameter
and 120 meter depth in alluvial soil). This method and system includes a drill
bit, a drill string having drill rods, and a rotary table or power swivel for
bringing the drill bit into rotation by means of the rods. Mud rotary drilling is a
commonly used for alluvium as well as overburden but cannot be used in
situations where excess hydrostatic heads cannot be tolerated such as in
some earth embankment dams. As the name describes, a drill bit on the
bottom of a string of drill rods is rotated in a borehole. Drilling fluid (water) is
circulated in the borehole by pumping down through the string of rods, where i t
picks up the drill cuttings and carries them to the surface of the borehole (Figure
1). The proper drilling fluid is essential for the proper installation of drilling rig. For
most instrumentation installations the sides of the borehole should be supported
with drill casing. The casing also prevents the drilling fluid from contacting the
sidewalls of the borehole.
Page 5

Fig 1: Direct Circulation System Rotary (Mud Rotary Drilling) method using DC
mini rig
Page 6

5.1.3. Step of Sampling:
Step i): Identified sampling location
Step ii): Installation of DC mini rig for drilling bottles
Step iii): Mode of drilling using Direct Circulation System Rotary (Mud Rotary
Drilling) method
Step iv): Formation of recycled water micro well
Page 7

Step v: Soil sample collection in cloth bag Step vi: Drawing water samples by installation of
submersible pump in constructed well
Step vii): Collection of water samples in Step viii): Sealing of construction well using
glass bottles concrete cement material
5.1.4. Preservation of Samples:
Soil samples were collected in cloth bag and glass bottles. Samples of water
collected in 2 litre glass bottles and LDPE containers as per USEPA guidelines for waste
and solid waste: SW 846. All samples were preserved at refrigerated conditions. During
sampling and processing of the samples, precautions were taken to avoid external
contamination. This is important since phthalates are ubiquitous chemicals in the indoor
Page 8

environment. Therefore, use of plasticized plastic equipments were avoided during
sampling and processing. For phthalate analysis, all glassware's were properly cleaned
with Dichloromethane (DCM/HPLC grade) before use. Detergents were not used during
washing of glassware's and all equipments were preconditioned and checked for blank
levels of phthalates before analysis. The sample for analysis of heavy metals were
preserved by adding 5 ml Nitric acid per liter of water sample.
5.2 ANALYSIS
Parameters of soil and water samples collected and analysed are given below Table-3 :
S.No.
Sample Parameters
i) Soil pH, Heavy metals (Cd, Co, Cr, Cu, Pb, Mo, Ti and Zn),
Nitrogen, Phosphorous, Potassium, Phthalates.
ii) Water Heavy metals (Cd, Co, Cr, Cu, Pb, Mo, Ti and Zn) and Phthalates.
iii) Leachates TCLP for heavy metals (Cd, Co, Cr, Cu, Pb, Mo, Ti and Zn), Carbon Black, Nigrosine Dye, Chlorides, Phthalates.
5.2.1. Determination of Hazardous Characteristics of Wastes: Toxicity Characteristic Leaching Procedure (TCLP)
This method is based on USEPA Method 1311-Toxicity Characteristics Leaching
Procedure (TCLP). This is applicable to the determination of mobility of metals and
semi-volatile organic compound in solids. The principle involved in leaching procedure
consists of 3 main steps:
Step l- Crushing/grinding: The solid sample has been passed through 9.5-mm sieve.
Step II- Determination of appropriate extraction fluid: Depending on the pH of the solid
sample, one of two extraction fluids is used to extract the soil.
Step III- Extraction of solid sample: The solid sample is extracted (20:1 liquid to solid
ratio) by shaking it end over end for 18 ± 2 hours at a controlled temperature at
30 rpm. The extract also known as the leachate is then filtered and analyzed for
desired analytes. The moisture content of the solid sample is determined
separately and reported alongwith the analytical results.
Page 9

Preparation of Extraction Fluid No.1:
5.7 ml of glacial acetic acid added to 500 ml of double distilled water.
Then 64.3 ml of 1 M NaOH added to above solution and diluted to 1 liter.
The pH of this fluid maintained at 4.93 0.05.
Preparation of Extraction Fluid No.2:
5.7 ml of glacial acetic acid diluted to 1 liter.
The pH of this fluid maintained 2.88 ± 0.05.
Note: The extraction fluids should be monitored frequently for impurities and the pH
concentration and it may be discarded, if impurities found or pH is not within
specifications.
Determination of Appropriate Extraction Fluid:
5.0 g (± 0.1 g) of the sample (<9.5 mm) transferred into a 500 ml beaker or
Erlenmeyer flask. 96.5 ml of DDW added to the beaker and covered with a watch
glass. It then stirred vigorously for 5 minutes using a magnetic stirrer.
The pH solution measured and recorded.
When the pH 5.0, extraction fluid No.1 used.
When the pH > 5.0, added 3.5 ml 1 M HCI, covered with a watch glass, heated to
50°C±2 for 10 minutes. Solution allowed to cool at room temperature and then
pH recorded. When the pH was 5, use extraction fluid No.1. Otherwise, use
Extraction fluid No.2
Analysis of leachate:
The leachates have been prepared and analyzed as per standard guidelines.
5.2.2. Estimation of Heavy Metals:
200 ml of water sample or the TCLP extract of soil/plastic material were taken in
conical flask, digested it for organic substances, if any, with 20 ml concentrated nitric acid
in a fuming chamber. The digested samples were made upto 20 ml with 0.1 N HNO3 and
analyzed for Cd, Co, Cr, Cu, Pb, Mo, Ti and Zn with the help of Atomic Absorption
Spectrophotometer (ZEEnit- 700) under following conditions are mentioned at Table-4.
Page 10

S. No Metals Lamp current
(m A)
Wave length
(nm)
Slit Width (nm)
1 Cd 6 228.8 0.2
2 Co 4 240.7 0.2
3 Cr 6 357.9 0.2
4 Cu 3 324.8 0.5
5 Pb 3 283.3 0.5
6 Mo 3 313.4 0.5
7 Ti 3 320.0 0.5
8 Zn 3 213.9 0.5
5.2.3. Estimation of Phthalates:
A 500 ml of water sample collected from each location or TCLP leachate was extracted
three times using 30 ml of dichloromethane (HPLC grade) solvent in one litre separatory
funnel each time. The micelle formation was suppressed by adding 10 ml of saturated
sodium chloride solution during each operation. The organic layers were combined
together and demoistered by passing through anhydrous granular sodium sulphate bed
[EPA method-8060, Analysis of phthalate esters in water and waste water (1986); EPA
method-3510, Separatory funnel liquid-liquid extraction (1986)]. Each sample was
processed for column cleanup prior to analysis on HPLC. For proper cleanup,
chromatographic column (300 mm length X 10 mm I.D.) was prepared by placing 10 g
of activated Florisil on bed of Pyrex glass wool at the bottom. The column was tapped
properly to settle the Florisil and further added 1 cm of anhydrous sodium sulfate to the
top [EPA method-3620, Florisil column cleanup-1986]. Column was preluted with 40 ml
n-Hexane (v/v). The compounds were eluted with 100 ml of 20% ethyl ether in hexane
(v/v). The extract in hexane was concentrated under reduced pressure using rotary
evaporator (Buchi, B 490). The exchange of solvent was done by replacing hexane with
methanol (HPLC grade) and final volume was made up to 10 ml in volumetric flask.
Page 11
Table:- 4

The methodology was tested using water samples. Each sample was screened for 5
Phthalates viz. Di-methyl phthalate (DMP), Di-ethyl phthalate (DEP), Di-butyl phthalate
(DBP), Di (2-ethylhexyl) phthalate (DEHP) and Di-octyl phthalate (DOP) by using HPLC
under following conditions:
Equipment: HPLC, Water's make, pump-515; Column: RP, C-18; Temperature: 27° C.
Mobile phase: Methanol-water (90:10), Flow Rate 2 ml/rnin.
Detector: UV-VIS detector (Model 2487; Water's make), Wavelength: 254 nm.
To identify the chromatographic peaks, the five representative samples were analyzed
on Gas chromatograph-Mass Spectrophotometer (GC-MS) using following conditions:
Equipment: GC-MS, Turbo Mass, Perkin Elmer, USA.
Column: DB-5ms low bleed (30X0.25 mm), Film thickness: 0.25 Om; Temperature
programme: 1 min. hold at 70°C and raised the temperature up to 325°C @ 100 C/min.
Injector temperature: 2500 C.
Mobile phase: Helium, Flow Rate 1.25 ml/min.
Ionization mode: El; Mass resolution (m/z): 30-550; Scan rate: 10/sec; Ionization energy:
70 eV; Detector: Mass; Source temperature: 2800 C.
Schematic Flow-Diagram of Phthalate Extraction from Water Samples ITCLP Leachate
500 ml of sample was taken in a separating funnel
Add 20 ml of sodium chloride to the sample
Thenafter add 30 ml of dichloromethane to the sample
1. Resulting sample was shaken vigorously for 5 min with periodic venting to release
excess pressure
Stand and allowed the organic layer to separate from water phase for a minimum of 10
min.
Collected organic layer and pool in a separate conical flask
Page 12

Repeat the extraction two more times using fresh portions of solvent in the same manner
Combined three solvent extracts and process it for column cleanup
Concentrated the extract (eluate) up to dryness on rotavapour
Final volume was made up to 10 ml with filtered methanol solution
Estimation of Phthalate using HPLC
Source: EPA method-3510, Separatory funnel liquid-liquid extraction; 1986. EPA method-3620, Florisil column cleanup; 1986.
Schematic Flow-Diagram of Phthalate Extraction from Soil Samples
5 gm of dry sample was taken
Extracted using Soxhlet apparatus with the help of 1:1 Acetone/n- Hexane mixture for
approx. 18 hours
Collect the extract and process it for column cleanup
Concentrate the extract (eluate) upto dryness on rotavapour
Made up the final volume upto 10 ml with filtered methanol solution
Estimation of Phthalate using HPLC
Source: EPA method-8060, Analysis of phthalate esters in water and waste water; 1986.
5.2.4. Estimation of Chloride in leachates
In the leachate (each 20 ml), add 3 drops of K2Cr207, stirred well and titrated
against 0.014 AgNO3. The formula used is as follows:
CI mg/L —
S-B) X 0.5
---------- X 1000
ml of sample
Page 13

5.3 Sampling Conditions
5.3.1 Pre-monsoon Sampling
First phase of pre-monsoon sampling was conducted at four identified locations of
Municipal Solid Waste Dumpsite, Dudauli, Sitapur Road, Lucknow during April 12, 2009
to April 15, 2009 while second phase of pre-monsoon sampling was conducted at two
identified locations of Municipal Solid Waste Dumpsite, Dudauli, Ghaila, Hardoi Road,
Lucknow during May 04, 2009 to May 05, 2009. Conditions during sampling are given
below.
Location I: Municipal Solid Waste Dumpsite, Dudauli, Sitapur Road, Lucknow
Date Time Site Location of
Drilling
Temperature
12.04.09 6: 00 pm — 10:
30 pm
Municipal Solid Waste Dumpsite, Dudauli, Sitapur Road, Lucknow
Point I 36°±2 C
13.04.09 1:30 pm
—
5:45 pm
Municipal Solid Waste Dumpsite, Dudauli, Sitapur Road, Lucknow
Point II 41° ±2 C
14.04.09 10:15 am
—
12:15 pm
Municipal Solid Waste Dumpsite, Dudauli, Sitapur Road, Lucknow
Point III 42° ±2 C
15.04.09 3:30 pm — 6:
45 pm
Municipal Solid Waste Dumpsite, Dudauli, Sitapur Road, Lucknow
Point IV 39°±2C
Location II: Municipal Solid Waste Dumpsite, Ghaila, Hardoi Road, Lucknow
Date Time Site Location of Drilling
Temperature
04.05.09 9: 00 am — 5:
00 pm
Municipal Solid Waste
Dumpsite, Ghaila, Hardoi
Road, Lucknow
Point I 35°±2 C
05.05.09 8:30 am
—
4:45 pm
Municipal Solid Waste
Dumpsite, Ghaila, Hardoi
Road, Lucknow
Point II 39°±2 C
Page 14

5.3.2 Post-monsoon Sampling
The proposed post-monsoon sampling was delayed for three months due to late
monsoon conditions and prolonged water logging after heavy rains at Ghaila Municipal
Solid Waste Dumpsite, Hardoi Road, Lucknow. Post-monsoon sampling was
conducted at one identified location of Municipal Solid Waste Dumpsite, Dudauli, Sitapur
Road, Lucknow during September 28-30, 2009 while last phase of post-monsoon
sampling was also conducted at one identified location of Municipal Solid Waste
Dumpsite, Ghaila, Hardoi Road, Lucknow during December 9-10, 2009.
Conditions during sampling are charted below.
Location I
Date Time Site Location of
Drilling
Temperature
29.10.09 10:00 am —
05: 30 pm
Municipal Solid Waste Dumpsite, Dudauli, Sitapur Road, Lucknow
Point I 29°±2C
09.12.09 9:30 am —
5:30 pm
Municipal Solid Waste Dumpsite, Ghaila, Hardoi Road , Lucknow
Point II 26°±2C
Location II
5.4 Geo-physical and Drilling Features of Dumpsite Area:
Strata Chart: Municipal Solid Waste Dumpsite, Dudauli, Sitapur Road, Lucknow
Test Well No. 1 Static Water Level: 13.7 meter
STRATA DETAILS LOWERING DETAILS ASSEMBLY DETAILS
Ground Level
12.0 Meter
27.0 Meter
36.0 Meter
Ground
Level Above Ground
Ground
Level
Coarse Level- 0.5 Sand meters 113 mm
PVC Plain
Casing Pipe
Sticky Clay
30.0 Meter 30.0 Meter
36.0 Meter 36.0 Meter
Fine to Medium
Sand
113 mm PVC Slotted Casing Pipe
Page 15

Strata Chart: Municipal Solid Waste Dumpsite, Dudauli, Sitapur Road, Lucknow Test Well No. 2 Static Water Level: 10.70 meter
STRATA DETAILS LOWERING DETAILS ASSEMBLY DETAILS
Sticky Clay
Ground
Level Above Ground
Level- 0.5 meters
Ground
Level
113 mm PVC Plain Casing Pipe
Medium Sand
21.0 Meter 21.0 Meter 113 mm PVC
Slotted Casing Pipe
24.0 Meter
24.0 Meter
113 mm PVC Plain
Sticky Clay Casing Pipe
27.0 Meter 27.0 Meter
Medium 113 mm PVC
Sand Slotted Casing Pipe
33.0 Meter 33.0 Meter
Ground Level
24.0 Meter
27.0 Meter
33.0 Meter
Strata Chart: Municipal Solid Waste Dumpsite, Dudauli, Sitapur Road, Lucknow Test Well No. 3 Static Water Level: 13.7 meter
STRATA DETAILS LOWERING DETAILS ASSEMBLY DETAILS
Sticky Clay
Ground
Level
Above Ground
Level- 0.5 meters
Ground
Level
113 mm PVC Plain Casing Pipe
Medium 24.0 Meter 24.0 Meter 113 mm PVC
Sand Slotted Casing Pipe
27.0 Meter
27.0 Meter
113 mm PVC Plain
Sticky Clay Casing Pipe 33.0 Meter 33.0 Meter
Medium 113 mm PVC
Sand Slotted Casing Pipe
36.0 Meter 36.0 Meter
Ground Level
15.0 Meter
27.0 Meter
30.0 Meter
36.0 Meter
Page 16
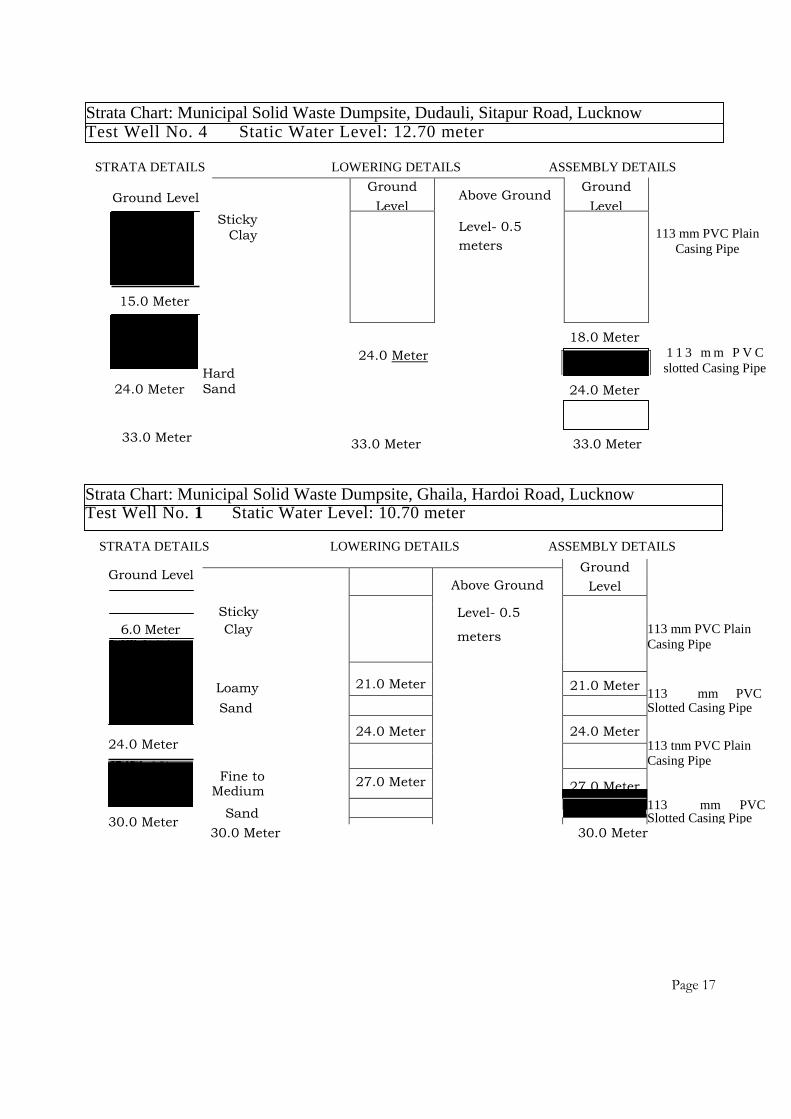
Strata Chart: Municipal Solid Waste Dumpsite, Dudauli, Sitapur Road, Lucknow Test Well No. 4 Static Water Level: 12.70 meter
STRATA DETAILS LOWERING DETAILS ASSEMBLY DETAILS
Ground
Level Above Ground
Ground
Level
Sticky
Clay
Level- 0.5
meters
113 mm PVC Plain
Casing Pipe
24.0 Meter
Hard Sand
33.0 Meter 33.0 Meter
Ground Level
15.0 Meter
24.0 Meter
33.0 Meter
18.0 Meter 1 1 3 m m P V C
slotted Casing Pipe
24.0 Meter
Strata Chart: Municipal Solid Waste Dumpsite, Ghaila, Hardoi Road, Lucknow Test Well No. 1 Static Water Level: 10.70 meter
STRATA DETAILS LOWERING DETAILS ASSEMBLY DETAILS
Ground
Level
Above Ground
Sticky Level- 0.5
Clay meters
113 mm PVC Plain
Casing Pipe
Loamy 21.0 Meter
113 mm PVC 21.0 Meter
Sand Slotted Casing Pipe
24.0 Meter
24.0 Meter
113 tnm PVC Plain Casing Pipe
Fine to Medium
27.0 Meter 27.0 Meter
Sand 113 mm PVC
Slotted Casing Pipe
30.0 Meter 30.0 Meter
Page 17
Ground Level
6.0 Meter
24.0 Meter
30.0 Meter

Strata Chart: Municipal Solid Waste Dumpsite, Ghaila, Hardoi Road, Lucknow Test Well No. 2 Static Water Level: 10.70 meter
STRATA DETAILS LOWERING DETAILS ASSEMBLY DETAILS
Ground Level
6.0 Meter
24.0 Meter
30.0 Meter
Ground
Level
Above Ground
Sticky Level- 0.5
Clay meters 113 mm PVC Plain Casing Pipe
Loamy 21.0 Meter
113 mm PVC 21.0 Mete
Sand Slotted Casing Pipe
24.0 Meter 24.0 Meter
113 mm PVC Plain
Casing Pipe
Fine to 27.0 Meter 27.0 Meter
Medium Sand
113 mm PVC Slotted Casing Pipe
Nss
30.0 Meter 30.0 Meter
6. Sampling Details
6.1 List of Soil Samples
Sample Code
IITR Code No. Texture Depth Sample Containe r
Date of Sampling
Remarks, if any
Point I, Municipal Solid Waste Dumpsite, Dudauli, Sitapur Road Lucknow (6: 00 pm — 10: 30 pm) 1. AS 01/D/Soil/ IITR Medium 3.4 meter Cloth 12.04.0 Pre-monsoon
Dudauli, Sitapur Road, Lucknow
sand 9 [Experimental ]
2. AS 021D/Soil/ IITR Sticky 6.45 Cloth 12.04.0 Pre-monsoon
Dudauli, Sitapur Road, Lucknow clay meter (3.05 meter)
9 [Experimental ]
3. AS 03/D/Soil/ IITR Clay + 9.50 Cloth 12.04.0 Pre-monsoon
Dudauli, Sitapur Road, Lucknow Gravel meter
(3.05 meter)
9 [Experimental ]
4. AS 04/D/Soil/ IITR Sticky 12.50 Cloth 12.04.0 Pre-monsoon
Dudauli, Sitapur Road, Lucknow clay +
Gravel
meter
(3.0
meter)
9 [Experimental ]
5. AS 05/D/Soil/ IITR Sticky 15.50 Cloth 12.04.0 Pre-monsoon
Dudauli, Sitapur Road, Lucknovt clay + meter 9 [Experimental]
Gravel (3.0 meter )
Page 18

6. AS 06/0/Soil/ IITR Loamy 18.50 Cloth 12.04.0 Pre-monsoon Dudauli, Sitapur Road, Lucknow clay +
Gravel meter (3.0 meter)
9 [Experimental ]
7. AS 07/D/Soil/ IITR Loamy 21.50 Cloth 12.04.0 Pre-monsoon Dudauli, Sitapur Road, Lucknow clay +
Gravel+ Sand
meter (3.0 meter)
9 [Experimental ]
8. AS 08/D/So1l/ IITR Loamy 24.50 Plastic 12.04.0 Pre-monsoon Dudauli, Sitapur Road, Lucknow clay +
Gravel
meter (3.0 meter)
9 [Experimental ]
9. AS 09/D/Soil/ IITR Loamy 27.50 Plastic 12.04.0 Pre-monsoon Dudauli, Sitapur Road, Lucknow clay +
Gravel
meter (3.0 meter)
9 [Experimental ]
10. AS 10/D/Soil/ IITR Loamy 30.50 Plastic 12.04.0 Pre-monsoon Dudauli, Sitapur Road, Lucknow clay +
Gravel meter (3.0 meter)
9 [Experimental ]
11. AS 11/D/Soil/ IITR Clay + 33.50 Cloth 12.04.0 Pre-monsoon Dudauli, Sitapur Road, Lucknow Sand meter
(3.0 meter)
9 [Experimental ]
12. AS 12/D/Soil/ IITR Sand 36.50 Cloth 12.04.0 Pre-monsoon Dudauli, Sitapur Road, Lucknow meter
(3.0 meter)
9 [Experimental ]
Point II, Municipal Solid Waste Dumpsite, Dudauli, Sitapur Road, Lucknow (1:30 pm - 5:45 pm)
13. AS 13/D/Soil/ IITR Sticky 3.4 meter Cloth 13.04.0 Pre-monsoon Dudauli, Sitapur Road, Lucknow
clay+ small gravels
9 [Experimental ]
14. AS 14/D/Soil/ IITR Sticky 6.45 Cloth 13.04.0 Pre-monsoon Dudauli, Sitapur Road, Lucknow
clay+ small gravels
meter (3.05 meter)
9 [Experimental ]
15. AS 15/D/Soil/ IITR Sticky 9.50 Cloth 13.04.0 Pre-monsoon Dudauli, Sitapur Road, Lucknow clay
meter (3.05 meter)
9 [Experimental ]
16. AS 16/D/Soil/ IITR Sticky 12.50 Cloth 13.04.0 Pre-monsoon Dudauli, Sitapur Road, Lucknow clay meter
(3.0 meter) 9 [Experimental ]
Page 19

17. AS 17/D/Soil/ IITR Dudauli, Sitapur Road, Lucknow
Sticky clay 15.50 meter (3.0 meter)
Cloth 13.04.09 Pre-monsoon [Experimental]
18. AS 18/D/Soil/ IITR Dudauli, Sitapur Road, Lucknow
Sand + Gravel
18.50 meter (3.0 meter)
Cloth 13.04.09 Pre-monsoon [Experimental]
19. AS 19/D/Soil/ IITR Dudauli, Sitapur Road, Lucknow
Loamy Sand
21.50 meter (3.0 meter)
Cloth 13.04.09 Pre-monsoon [Experimental]
20. AS 20/D/Soil/ IITR Dudauli, Sitapur Road, Lucknow
Loamy Sand
24.50 meter (3.0 meter)
Cloth 13.04.09 Pre-monsoon [Experimental]
21. AS 21/D/Soil/ IITR Dudauli, Sitapur Road, Lucknow
Loamy Sand
27.50 meter (3.0 meter)
Cloth 13.04.09 Pre-monsoon [Experimental]
22. AS 22/D/Soil/ IITR Dudauli, Sitapur Road, Lucknow
Sand 30.50 meter
(3.0 meter)
Cloth 13.04.09 Pre-monsoon [Experimental]
23. AS 23/D/Soil/ IITR Dudauli, Sitapur Road, Lucknow
Sand 33.50 meter (3.0 meter)
Cloth 13.04.09 Pre-monsoon [Experimental]
Point II, Municipal Solid Waste Dumpsite, Dudauli, Sitapur Road, Lucknow (10:15 am - 12:15
Pm)
24. AS 24/D/Soil/ IITR Dudauli, Sitapur Road, Lucknow
Loamy Sand
3.4 meter Cloth 14.04.09 Pre-mansoon [Experimental]
25. AS 25/D/Soil/ IITR Dudauli, Sitapur Road, Lucknow
Loamy Sand + gravel
6.45 meter (3.05 meter)
Cloth 14.04.09 Pre-mansoon [Experimental]
26. AS 26/D/Soil/ IITR Dudauli, Sitapur Road, Lucknow
Clay + garvel
9.50 meter (3.05 m)
Cloth 14.04.09 Pre-monsoon [Experimental]
27. AS 27/D/Soil/ IITR Dudauli, Sitapur Road, Lucknow
Clay + garvel
12.50 meter (3.0 meter)
Cloth 14.04.09 Pre-monsoon [Experimental]
Page 20

28. AS 28/D/Soil/ IITR Dudauli, Sitapur Road, Lucknow
Clay + garvel
15.50 meter (3.0 meter)
Cloth 14.04.09
Pre-monsoon [Experimental]
29. AS 29/D/Soil/ IITR Dudauli, Sitapur Road, Lucknow
Clay + garvel
18.50 meter (3.0 meter)
Cloth 14.04.09 Pre-monsoon [Experimental]
30. AS 30/D/Soil/ IITR Dudauli, Sitapur Road, Lucknow
Loamy Sand
21.50 meter (3.0 meter)
Cloth 14.04.09 Pre-monsoon [Experimental]
31. AS 31/D/Soil/ IITR Dudauli, Sitapur Road, Lucknow
Loamy Sand
24.50 meter (3.0 meter)
Cloth 14.04.09 Pre-monsoon [Experimental]
32. AS 32/D/Soil/ IITR Dudauli, Sitapur Road, Lucknow
Loamy Sand
27.50 meter (3.0 meter)
Cloth 14.04.09 Pre-monsoon [Experimental]
33. AS 33/D/Soil/ IITR Dudauli, Sitapur Road, Lucknow
Loamy Sand
30.50 meter
(3.0 meter)
Cloth 14.04.09 Pre-monsoon [Experimental]
34. AS 34/D/Soil/ IITR Dudauli, Sitapur Road, Lucknow
Sand 33.50 meter (3.0 meter)
Cloth 14.04.09 Pre-monsoon [Experimental]
35. AS 35/D/Soil/ IITR Dudauli, Sitapur Road, Lucknow
Sand 36.50 meter (3.0 meter)
Cloth 14.04.09 Pre-monsoon [Experimental]
Point IV, Municipal Solid Waste Dumpsite, Dudaul", Sitapur Road, Lucknow (3:30 pm- 6: 45 pm)
36. AS 36/D/Soil/ IITR Dudauli, Sitapur Road, Lucknow
Clay + Mud
3.4 meter Cloth 14.04.09 Pre-monsoon [Experimental]
37. AS 37/D/Soil/ IITR Dudauli, Sitapur Road, Lucknow
Clay + Mud
6.45 meter (3.05 meter)
Cloth 14.04.09 Pre-monsoon [Experimental]
38. AS 38/D/Soil/ IITR Dudauli, Sitapur Road, Lucknow
Clay + Gravel
9.50 meter (3.05 meter)
Cloth 14.04.09 Pre-monsoon [Experimental]
Page 21
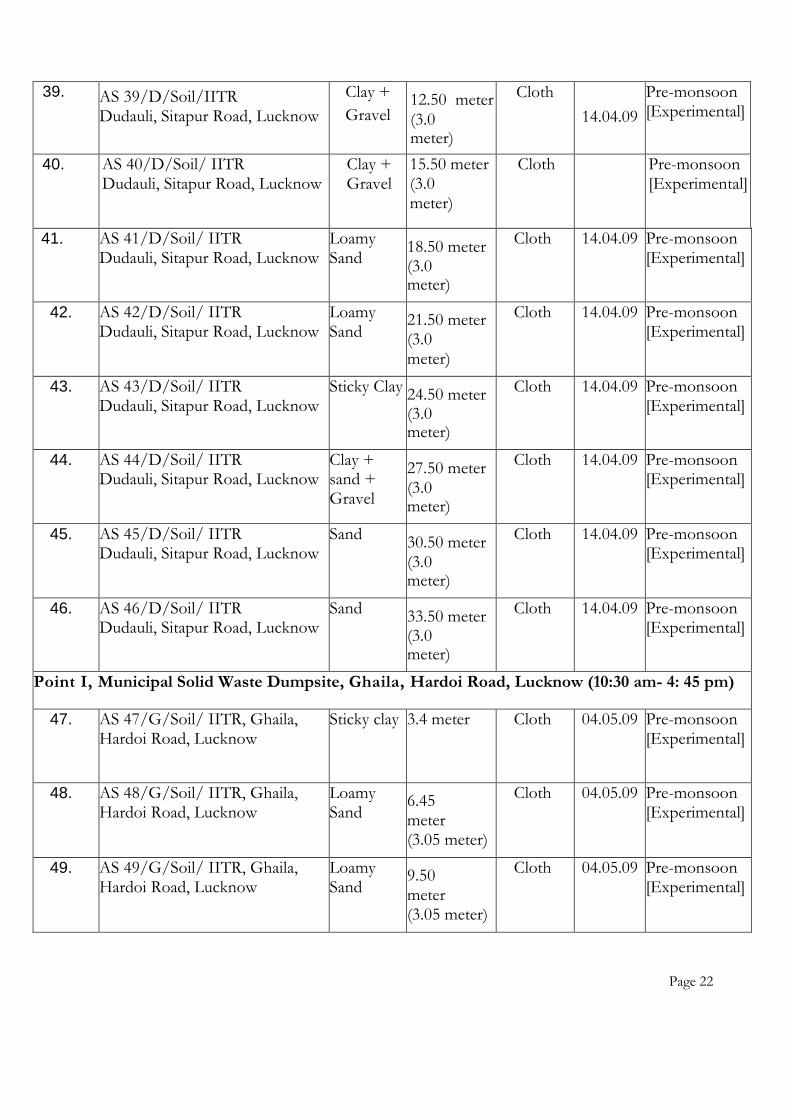
39. AS 39/D/Soil/IITR Dudauli, Sitapur Road, Lucknow
Clay +
Gravel
Clay + Gravel
12.50 meter
(3.0 meter)
Cloth
14.04.09
Pre-monsoon [Experimental]
40. AS 40/D/Soil/ IITR Dudauli, Sitapur Road, Lucknow
Clay + Gravel
15.50 meter (3.0 meter)
Cloth
Pre-monsoon [Experimental]
41. AS 41/D/Soil/ IITR Dudauli, Sitapur Road, Lucknow
Loamy Sand
18.50 meter (3.0 meter)
Cloth 14.04.09 Pre-monsoon [Experimental]
42. AS 42/D/Soil/ IITR Dudauli, Sitapur Road, Lucknow
Loamy Sand
21.50 meter (3.0 meter)
Cloth 14.04.09 Pre-monsoon [Experimental]
43. AS 43/D/Soil/ IITR Dudauli, Sitapur Road, Lucknow
Sticky Clay 24.50 meter (3.0 meter)
Cloth 14.04.09 Pre-monsoon [Experimental]
44. AS 44/D/Soil/ IITR Dudauli, Sitapur Road, Lucknow
Clay + sand + Gravel
27.50 meter (3.0 meter)
Cloth 14.04.09 Pre-monsoon [Experimental]
45. AS 45/D/Soil/ IITR Dudauli, Sitapur Road, Lucknow
Sand 30.50 meter (3.0 meter)
Cloth 14.04.09 Pre-monsoon [Experimental]
46. AS 46/D/Soil/ IITR Dudauli, Sitapur Road, Lucknow
Sand 33.50 meter (3.0 meter)
Cloth 14.04.09 Pre-monsoon [Experimental]
Point I, Municipal Solid Waste Dumpsite, Ghaila, Hardoi Road, Lucknow (10:30 am- 4: 45 pm)
47. AS 47/G/Soil/ IITR, Ghaila, Hardoi Road, Lucknow
Sticky clay 3.4 meter Cloth 04.05.09 Pre-monsoon [Experimental]
48. AS 48/G/Soil/ IITR, Ghaila, Hardoi Road, Lucknow
Loamy Sand
6.45 meter (3.05 meter)
Cloth 04.05.09 Pre-monsoon [Experimental]
49. AS 49/G/Soil/ IITR, Ghaila, Hardoi Road, Lucknow
Loamy Sand
9.50 meter (3.05 meter)
Cloth 04.05.09 Pre-monsoon [Experimental]
Page 22

50. AS 50/G/Soil/IITR, Ghaila,
Hardoi Road,
Lucknow
Lomy Sand
12.50 meter (3.0 meter)
Cloth 04.05.09 Pre-monsoon [Experimental]
51. AS 51/G/Soil/ IITR, Ghaila, Hardoi Road, Lucknow
Loamy Sand
15.50 meter (3.0 meter)
Cloth 04.05.09 Pre-monsoon [Experimental
52. AS 52/G/Soil/ IITR, Ghaila, Hardoi Road, Luthnow
Loamy Sand
18.50 meter (3.0 meter)
Cloth 04.05.09 Pre-monsoon [Experimental]
53. AS 53/G/Soil/ IITR, Ghaila, Hardoi Road, Lucknow
Loamy Sand
21.50 meter (3.0 meter)
Cloth 04.05.09 Pre-monsoon [Experimental]
54. AS 54/G/Soil/ IITR, Ghaila, Hardoi Road, Lucknow
Loamy Sand
24.50 meter (3.0 meter)
Cloth 04.05.09 Pre-monsoon [Experimental]]
55. AS 55/G/Soil/ IITR, Ghaila, Hardoi Road, Lucknow
Sand 27.50 meter (3.0 meter)
Cloth 04.05.09 Pre-monsoon [Experimental]
56. AS 56/G/Soil/ IITR, Ghaila, Hardoi Road, Lucknow
Sand 30.50 meter (3.0 meter)
Cloth 04.05.09 Pre-monsoon [Experimental]
Point II, Municipal Solid Waste Dumpsite, Ghila, Hardoi Road, Lucknow (8:30 am- 11:30am)
57. AS 57/G/Soil/ IITR, Ghaila, Hardoi Road, Lucknow
Sticky clay
3.4 meter Cloth 05.05.09 Pre-monsoon [Experimental]
58. AS 58/G/Soil/ IITR, Ghaila, Hardoi Road, Lucknow
Sticky clay
6.45 meter (3.05 meter)
Cloth 05.05.09 Pre-monsoon [Experimental]
59. AS 59/G/Soil/ IITR, Ghaila, Hardoi Road, Lucknow
Loamy Sand
9.50 meter (3.05 meter)
Cloth 05.05.09 Pre-monsoon [Experimental]
60. AS 60/G/Soil/ IITR, Ghaila, Hardoi Road, Lucknow
Loamy Sand
12.50 meter (3.0 meter)
Cloth 05.05.09 Pre-monsoon [Experimental]
61. AS 61/G/Soil/ IITR, Ghaila, Hardoi Road, Lucknow
Loamy Sand
15.50 meter (3.0 meter)
Cloth 05.05.09 Pre-monsoon [Experimental]
62. AS 62/G/Soil/ IITR, Ghaila, Hardoi Road, Lucknow
Loamy Sand
18.50 meter (3.0 meter)
Cloth 05.05.09 Pre-monsoon [Experimental]
Page 23

63. AS 63/G/Soil/ IITR, Ghaila, Hardoi Road, Lucknow
Loamy Sand 21.50 meter (3.0 meter)
Cloth 05.05.09 Pre-monsoon [Experimental]
64. AS 641G/Soil/ IITR, Ghaila, Hardoi Road, Lucknow
Loamy Sand 24.50 meter (3.0 meter)
Cloth 05.05.09 Pre-monsoon [Experimental]
65. AS 65/G/Soil/ IITR, Ghaila, Hardoi Road, Lucknow
Sand 27.50 meter (3.0 meter)
Cloth 05.05.09 Pre-monsoon [Experimental]
66. AS 66/0/Soil/ IITR, Ghaila, Hardoi Road, Lucknow
Sand 30.50 meter (3.0 meter)
Cloth 04.05.09 Pre-monsoon [Experimental]
67. AS 67/C/Soil/ IITR, Sitapur Road (FaizullaGanj, near old Kisan Mandi), Lucknow
Clay +
gravel 5 cm below from upper
layer
Cloth 07.08.08 Pre-monsoon [Control]
68. AS 68/ C /Soil/ IITR, Ghaila, Hardoi Road, Lucknow
Loamy clay 5 cm below from upper
layer
Cloth 07.08.08 Pre-monsoon [Control]
69. AS 69/ C /Soil/ IITR, Ghaila, Hardoi Road (Near temple, opposite to dumpsite), Lucknow
Rough clay 5 cm below from upper
layer
Cloth 07.08.08 Pre-monsoon [Control]
70. AS 70/ C /Soil/ IITR, Jiamau, Lucknow
Rough clay 5 cm below from upper
layer
Cloth 07.08.08 Pre-monsoon [Control]
71. AS 71/ C /Soil/ IITR, Jiamau, Lucknow
Loamy clay 5 cm below from upper
layer
Cloth 07.08.08 Pre-monsoon [Control]
72. AS 72/ C /Soil/ IITR, Manas Nagar, Jiamau, Lucknow
Rough clay 5 cm below from upper
layer
Cloth 06.11.08 Pre-monsoon [Control]
73. AS 73/ C /Soil/ IITR, RamaBai Sthali, Ashiana Lucknow
Rough clay 5 cm below from upper
layer
Cloth 06.11.08 Pre-monsoon [Control]
74. AS 74/ C /Soil/ IITR, Kila Mohannmadi Nagar, Smriti Park, Ashiana, Lucknow
Rough clay 5 cm below from upper
layer
Cloth 06.11.08 Pre-monsoon [Control]
75. AS 75/ C /Soil/ IITR, B Block, Indira Nagar, Lucknow
Rough clay 5 cm below from upper
layer
Cloth 06.11.08 Pre-monsoon [Control]
76. AS 76/ C /Soil/ IITR, C Block, Lucknow
Rough clay 5 cm below from upper
layer
Cloth 06.11.08 Pre-monsoon [Control]
77. AS 77/ C /Soil/ IITR, Gheru Soil, Lucknow
Rough clay 5 cm below from upper
layer
Cloth 3.12.08 Pre-monsoon [Control]
Page 24
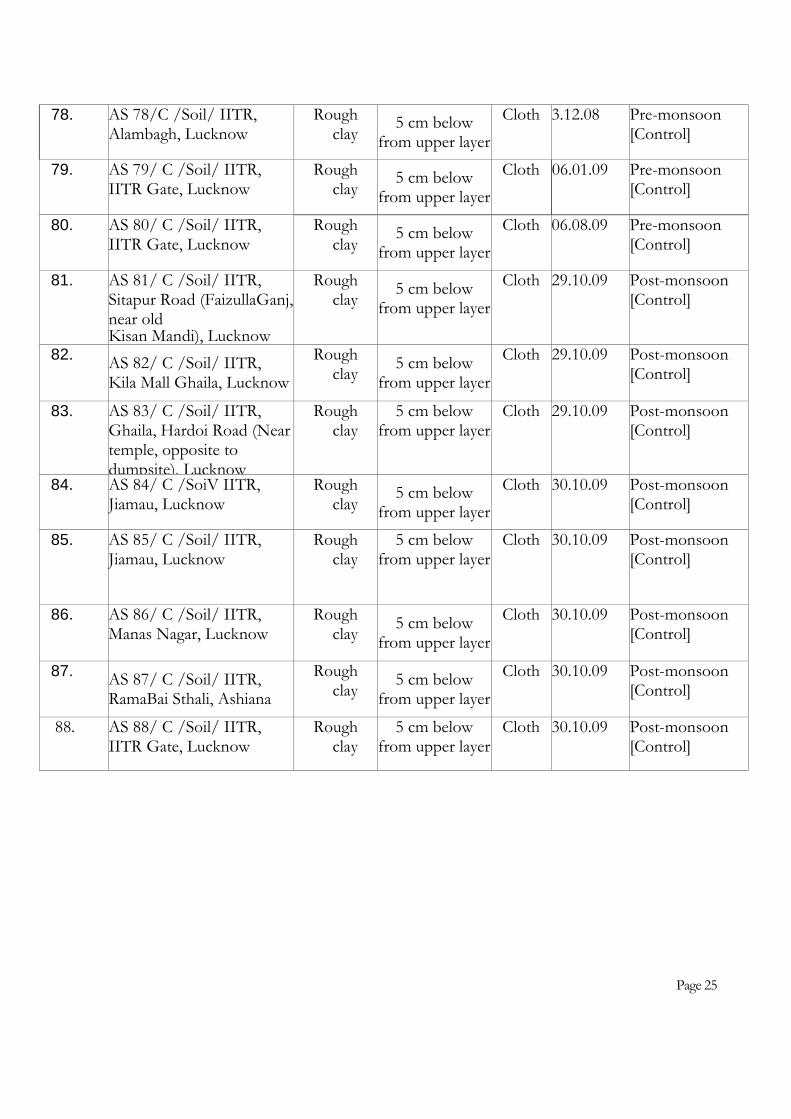
78. AS 78/C /Soil/ IITR, Alambagh, Lucknow
Rough clay
5 cm below from upper layer
Cloth 3.12.08 Pre-monsoon [Control]
79. AS 79/ C /Soil/ IITR, IITR Gate, Lucknow
Rough clay
5 cm below from upper layer
Cloth 06.01.09 Pre-monsoon [Control]
80. AS 80/ C /Soil/ IITR, IITR Gate, Lucknow
Rough clay
5 cm below from upper layer
Cloth 06.08.09 Pre-monsoon [Control]
81. AS 81/ C /Soil/ IITR, Sitapur Road (FaizullaGanj, near old
Rough clay
5 cm below from upper layer
Cloth 29.10.09 Post-monsoon [Control]
Kisan Mandi), Lucknow 82.
AS 82/ C /Soil/ IITR, Kila Mall Ghaila, Lucknow
Rough clay
5 cm below from upper layer
Cloth 29.10.09 Post-monsoon [Control]
83. AS 83/ C /Soil/ IITR, Ghaila, Hardoi Road (Near temple, opposite to dumpsite), Lucknow
Rough clay
5 cm below from upper layer
Cloth 29.10.09 Post-monsoon [Control]
84. AS 84/ C /SoiV IITR, Jiamau, Lucknow
Rough clay
5 cm below from upper layer
Cloth 30.10.09 Post-monsoon [Control]
85. AS 85/ C /Soil/ IITR, Jiamau, Lucknow
Rough clay
5 cm below from upper layer
Cloth 30.10.09 Post-monsoon [Control]
86. AS 86/ C /Soil/ IITR, Manas Nagar, Lucknow
Rough clay
5 cm below from upper layer
Cloth 30.10.09 Post-monsoon [Control]
87. AS 87/ C /Soil/ IITR, RamaBai Sthali, Ashiana
Rough clay
5 cm below from upper layer
Cloth 30.10.09 Post-monsoon [Control]
88. AS 88/ C /Soil/ IITR, IITR Gate, Lucknow
Rough clay
5 cm below from upper layer
Cloth 30.10.09 Post-monsoon [Control]
Page 25
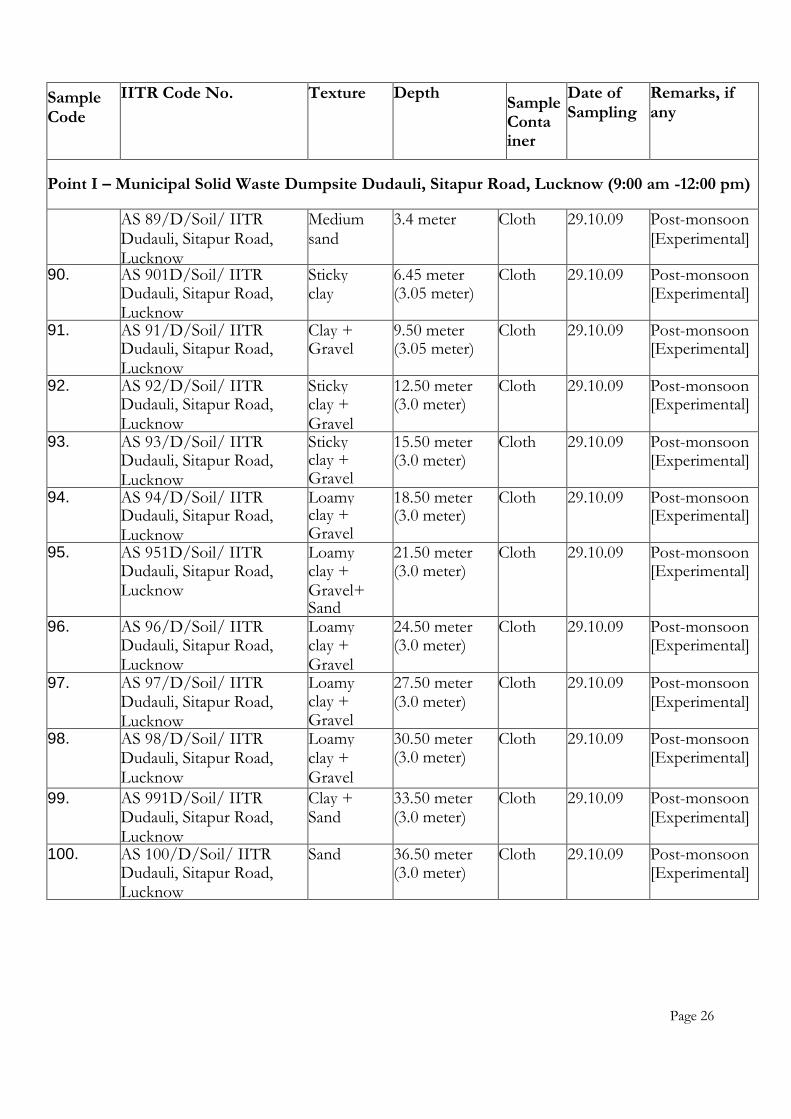
Sample Code
IITR Code No. Texture Depth Sample Conta iner
Date of Sampling
Remarks, if any
Point I – Municipal Solid Waste Dumpsite Dudauli, Sitapur Road, Lucknow (9:00 am -12:00 pm)
AS 89/D/Soil/ IITR Dudauli, Sitapur Road, Lucknow
Medium sand
3.4 meter Cloth 29.10.09 Post-monsoon [Experimental]
90. AS 901D/Soil/ IITR Sticky 6.45 meter Cloth 29.10.09 Post-monsoon Dudauli, Sitapur Road,
Lucknow clay (3.05 meter) [Experimental]
91. AS 91/D/Soil/ IITR Clay + 9.50 meter Cloth 29.10.09 Post-monsoon Dudauli, Sitapur Road,
Lucknow Gravel (3.05 meter) [Experimental]
92. AS 92/D/Soil/ IITR Sticky 12.50 meter Cloth 29.10.09 Post-monsoon Dudauli, Sitapur Road,
Lucknow clay + Gravel
(3.0 meter) [Experimental]
93. AS 93/D/Soil/ IITR Sticky 15.50 meter Cloth 29.10.09 Post-monsoon Dudauli, Sitapur Road,
Lucknow
clay + Gravel
(3.0 meter) [Experimental]
94. AS 94/D/Soil/ IITR Loamy 18.50 meter Cloth 29.10.09 Post-monsoon Dudauli, Sitapur Road,
Lucknow
clay + Gravel
(3.0 meter) [Experimental]
95. AS 951D/Soil/ IITR Loamy 21.50 meter Cloth 29.10.09 Post-monsoon Dudauli, Sitapur Road,
Lucknow clay + Gravel+
(3.0 meter) [Experimental]
Sand 96. AS 96/D/Soil/ IITR Loamy 24.50 meter Cloth 29.10.09 Post-monsoon Dudauli, Sitapur Road,
Lucknow clay + Gravel
(3.0 meter) [Experimental]
97. AS 97/D/Soil/ IITR Loamy 27.50 meter Cloth 29.10.09 Post-monsoon Dudauli, Sitapur Road,
Lucknow
clay + Gravel
(3.0 meter) [Experimental]
98. AS 98/D/Soil/ IITR Loamy 30.50 meter Cloth 29.10.09 Post-monsoon Dudauli, Sitapur Road,
Lucknow clay + Gravel
(3.0 meter) [Experimental]
99. AS 991D/Soil/ IITR Clay + 33.50 meter Cloth 29.10.09 Post-monsoon Dudauli, Sitapur Road,
Lucknow Sand (3.0 meter) [Experimental]
100. AS 100/D/Soil/ IITR Sand 36.50 meter Cloth 29.10.09 Post-monsoon Dudauli, Sitapur Road,
Lucknow (3.0 meter) [Experimental]
Sampling any
Page 26

Sample
code
IITR Code No. Texture Depth Sample
Container
Date of
Sampling
Remarks, if any
Point I Municipal Solid Waste Dumpsite, Ghaila, Hardoi, Lucknow (9:00 am -5:00 pm)
101. AS 101/0/Soil/ IITR Ghaila, Hardoi Road , Lucknow
Sticky Clay
3.4 meter Cloth 09.12.09 Postmonsoon [Experiment]
102. AS 102/0/Soil/ IITR Ghaila, Hardoi Road , Lucknow
Loamy Sand
6.45 meter
(3.05
meter)
Cloth 09.12.09 Postmonsoon [Experiment]
103. AS 103/ G /Soil/ IITR Ghaila, Hardoi Road, Lucknow
Loamy Sand
9.50 meter
(3.05
meter)
Cloth 09.12.09 Postmonsoon [Experimental]
104. AS 104/C /Soil/ IITR Ghaila, Hardoi Road, Lucknow
Loamy Sand
12.50
meter
(3.0
meter)
Cloth 09.12.09 Postmonsoon [Experimental]
105. AS 105/ G /Soil/ IITR Ghaila, Hardoi Road, Lucknow
Loamy Sand
15.50 meter (3.0 meter)
Cloth 09.12.09 Postmonsoon [Experimental]
106. AS 106/ G /Soil/ IITR Ghaila, Hardoi Road, Lucknow
Loamy Sand
18.50 meter (3.0 meter)
Cloth 09.12.09 Postmonsoon [Experimental]
107. AS 107/ G /Soil/ IITR Ghaila, Hardoi Road, Lucknow
Loamy Sand
21.50 meter
(3.0
meter)
Cloth 09.12.09 Postmonsoon [Experimental]
108. AS 108/ G /Soil/ IITR Ghaila, Hardoi Road, Lucknow
Loamy Sand
24.50
meter
(3.0
Meter)
Cloth
Cloth
09.12.09
09.12.09
Postmonsoon [Experimental]
109. AS 109/C /Soil/ IITR Ghaila, Hardoi Road, Lucknow
Sand 27.50 meter (3.0 meter)
Cloth 90.12.09 Postmonsoon [experimental]
110. AS 110/ G /Soil/ IITR Ghaila, Hardoi Road, Lucknow
Sand 30.50 meter (3.0 meter)
Cloth 09.12.09 Postmonsoon [Experimental]
Page 27

6.2 List of Water Samples
Sample Code
IITR Code No. Depth Sample Container
Date of Sampling
Remarks, if any
Pre-monsoon Experimental Water Samples (collected from MSW dumpsite)
Point I, Municipal Solid Waste Dumpsite, Dudauli, Sitapur Road, Lucknow (6:30 am— 7:45 am)
1. AS 01/D/Water/ IITR Dudauli, Sitapur Road, Lucknow
36.50 meter
Glass Bottle 17.04.09 Premonsoon [Experiment all
2. AS 02/D/ Water / IITR Dudauli, Sitapur Road, Lucknow
36.50 meter
Glass Bottle 17.04.09 Premonsoon [Experiment all
3. AS 03/D/ Water / IITR Dudauli, Sitapur Road, Lucknow
36.50 meter
Glass Bottle 17.04.09 Premonsoon [Experiment al]
Point II, Municipal Solid Waste Dumpsite, Dudauli, Sitapur Road, Lucknow (3:00 pm-4:45pm)
4. AS 04/D/ Water / IITR Dudauli, Sitapur Road, Lucknow
33.50 meter
Glass Bottle 15.04.09 Premonsoon [Experiment al]
5. AS 05/D/ Water / IITR Dudauli, Sitapur Road, Lucknow
33.50 meter
Glass Bottle 15.04.09 Premonsoon [Experiment al]
6. AS 06/D/ Water / IITR Dudauli, Sitapur Road, Lucknow
33.50 meter
Glass Bottle 15.04.09 Premonsoon [Experiment al]
Point III, Municipal Solid Waste Dumpsite, Dudauli, Sitapur Road, Lucknow (11:00am-
1:45pm)
7. AS 07/D/ Water / IITR Dudauli, Sitapur Road, Lucknow
36.50 meter
Glass Bottle 15.04.09 Premonsoon [Experiment all
Page 28

8. AS 08/D/ Water / IITR Dudauli, Sitapur Road, Lucknow
36.50 meter
Glass Bottle
15.04.09 Premonsoon [Experiment all
9. AS 09/D/ Water / IITR Dudauli, Sitapur Road, Lucknow
36.50 meter
Glass Bottle
15.04.09 Premonsoon [Experiment al]
Point IV, Municipal Solid Waste Dumpsite, Dudauli, Sitapur Road, Lucknow (8:30 am- 10: 15 am)
10. AS 10/D/ Water / IITR Dudauli, Sitapur Road, Lucknow
33.50 meter
Glass Bottle
17.04.09 Premonsoon [Experiment al]
11. AS 11/D/ Water / IITR Dudauli, Sitapur Road, Lucknow
33.50 meter
Glass Bottle
17.04.09 Premonsoon [Experiment al]
12. AS 12/D/ Water / IITR Dudauli, Sitapur Road, Lucknow
33.50 meter
Glass Bottle
17.04.09 Premonsoon [Experiment al]
Sample Code
IITR Code No. Depth Sample Container
Date of Sampling
Remarks, if any
Point V, Municipal Solid Waste Dumpsite, Ghaila Hardoi Road, Lucknow (10:30 am— 3: 30 pm)
13. AS 13/GNVater/ IITR Ghaila, Hardoi Road, Lucknow
30.85 meter
Glass Bottle 04.05.09 Premonsoon [Experiment al]
14. AS 14/G/ Water / IITR Ghaila, Hardoi Road, Lucknow
30.85 meter
Glass Bottle 04.05.09 Premonsoon [Experiment al]
15. AS 15/G/ Water / IITR Ghaila, Hardoi Road, Lucknow
30.85 meter
Glass Bottle 04.05.09 Premonsoon [Experiment al]
Page 29

Point VI, Municipal Solid Waste Dumpsite, Ghaila, Hardoi Road, Lucknow (8:00am- 11:45am)
16. AS 16/G/ Water / IITR Ghaila, Hardoi Road, Lucknow
30.85 meter
Glass Bottle
06.05.09 Premonsoon [Experiment al]
17. AS 17/G/ Water / IITR Ghaila, Hardoi Road, Lucknow
30.85 meter
Glass Bottle
06.05.09 Premonsoon [Experiment al]
18. AS 18/G/ Water / I ITR Ghaila, Hardoi Road, Lucknow
30.85 meter
Glass Bottle
06.05.09 Premonsoon [Experiment al]
Pre-monsoon Control Water Samples
19. AS 19/C/Water/ IITR HP Water, Dudauli, Sitapur Road, Lucknow
Hand Pump
Glass Bottle
04.05.09 Pre- monsoon [Control]
20. AS 20/C/ Water / IITR Ghaila, Hardoi Road, Lucknow
Hand Pump
Glass Bottle
07.08.08 Premonsoon [Control]
21. AS 21/C/ Water / IITR IITR, Main Campus, Lucknow
Tap Water
Glass Bottle
10.01.09 Premonsoon [Control]
22. AS 22/C/ Ghaila Tube well water„ Hardoi Road, Lko
Tube well
water
Glass Bottle
04.05.09 Pre- monsoon [Control]
23. AS 23/C/ Water / IITR Ghaila Pond water„ Hardoi Road, Lko
Pond Water
Glass Bottle
05.05.09 Premonsoon [Control]
24. AS 24/C/ Water / IITR Dudauli Tube well water, Sitapur Road, Lko
Tube well
water
Glass Bottle
21.04.09 Premonsoon [Control]
Sample Code
IITR Code No. Depth Sample Container
Date of Sampling
Remarks, if any
Post-monsoon Experimental Water Samples (collected from MSW dumpsite)
Point I, Municipal Solid Waste Dumpsite, Dudauli, Sitapur Road, Lucknow (6:30 am— 7: 45 am)
25. AS 25/D/Water/ IITR Dudauli, Sitapur Road, Lucknow
36.50 meter
Glass Bottle 30.10.09 Post-monsoon [Experimental]
26. AS 26/D/ Water / IITR Dudauli, Sitapur Road, Lucknow
36.50 meter
Glass Bottle 30.10.09 Post-monsoon
[Experimental]
27. AS 27/D/ Water / IITR Dudauli, Sitapur Road, Lucknow
36.50 meter
Glass Bottle 30.10.09 Post-monsoon [Experimental]
Page 30

Point II Municipal Solid Waste Dumpsite Dudauli, Sitapur Road, Lucknow (3:00 pm— 4:
45 pm)
28. AS 28D/ Water / IITR Dudauli, Sitapur Road, Lucknow
33.50 meter
Glass Bottle 30.10.09 Post-monsoon [Experimental]
29. AS 29/D/ Water / IITR Dudauli, Sitapur Road, Lucknow
33.50 meter
Glass Bottle 30.10.09 Post-monsoon [Experimental]
30. AS 30/D/ Water! I ITR Dudauli, Sitapur Road, Lucknow
33.50 meter
Glass Bottle 30.10.09 Post-monsoon [Experimental]
Point III, Municipal Solid Waste Dumpsite, Dudauli, Sitapur Road, Lucknow (11:00 am— 1: 45 pm)
31. AS 31/D/ Water / I ITR Dudauli, Sitapur Road, Lucknow
36.50 meter
Glass Bottle 30.10.09 Post-monsoon [Experimental]
32. AS 32/D/ Water! I ITR Dudauli, Sitapur Road, Lucknow
36.50 meter
Glass Bottle 30.10.09 Post-monsoon [Experimental]
33. AS 33/D/ Water / I ITR Dudauli, Sitapur Road, Lucknow
36.50 meter
Glass Bottle 30.10.09 Post-monsoon [Experimental]
Point IV, Municipal Solid Waste Dumpsite, Dudauli, Sitapur Road, Lucknow (8:30 am— 10: 15 am)
34. AS 34D/ Water! IITR Dudauli, Sitapur Road, Lucknow
33.50 meter
Glass Bottle 30.10.09 Post-monsoon [Experimental]
35. AS 35/D/ Water / I ITR Dudauli, Sitapur Road, Lucknow
33.50 meter
Glass Bottle 30.10.09 Post-monsoon [Experimental]
36. AS 36/D/ Water! I ITR Dudauli, Sitapur Road, Lucknow
33.50 meter
Glass Bottle 30.10.09 Post-monsoon [Experimental]
Sample Code
IITR Code No. Depth Sample Container
Date of Sampling
Remarks, if any
Point V Municipal Solid Waste Dumpsite Ghaila, Hardoi Road, Lucknow (10:30 am— 3: 30 pm)
37. AS 37/G/VVater/ IITR Ghaila, Hardoi Road, Lucknow
30.85 meter
Glass Bottle 10.12.09 Post-monsoon
[Experimental] 38. AS 38/G/ Water / IITR
Ghaila, Hardoi Road, Lucknow 30. 85 meter
Glass Bottle ±
10.12.09 Post-monsoon [ExRerimental]
Page 31

39. AS 39/G/ Water / IITR Ghaila, Hardoi Road, Lucknow
30.85 meter
Glass Bottle
10.12.09 Post-monsoon [Experimental]
Point VI, Municipal Solid Waste Dumpsite, Ghaila, Hardoi Road, Lucknow (9:00am-10:45am)
40. AS 40/G/ Water / I ITR Ghaila, Hardoi Road, Lucknow
30.85 meter
Glass Bottle
10.12.09 Post-monsoon [Experimental] Post-monsoon [Experimental]
41. AS 41/G/ Water / IITR Ghaila, Hardoi Road, Lucknow
30.85 meter
Glass Bottle
10.12.09 Post-monsoon [Experimental]
42. AS 42/G/ Water / IITR Ghaila, Hardoi Road, Lucknow
30.85 meter
Glass Bottle
10.12.09 Post-monsoon [Experimental]
Post-monsoon Control Water Samples
43. AS 43/C/VVater/ IITR HP Water, Dudauli, Sitapur Road, Lucknow
Hand Pump
Glass Bottle
30.10.09 Post-monsoon [Control]
44. AS 44/C/ Water / I ITR Ghaila, Hardoi Road, Lucknow
Hand Pump
Glass Bottle
30.10.09 Post-monsoon [Control]
45. AS 45/C/ Water / I ITR IITR, Main Campus, Lucknow
Tap Water
Glass Bottle
30.10.09 Post-monsoon [Control]
46. AS 46/C/ Ghaila Tube well water, Hardoi Road, Lko
Tube well water
Glass Bottle
30.10.09 Post-monsoon [Control]
47. AS 47/C/ Water / I ITR Ghaila Pond water„ Hardoi Road, Lko
Pond Water
Glass Bottle
30.10.09 Post-monsoon [Control]
48. AS 48/C/ Water / I ITR Dudauli Tube well water, Sitapur Road, Lko
Tube well water
Glass Bottle
30.10.09 Post-monsoon [Control]
Page 32

7. Analysis of soil & water samples: 7.1 Physio-chemical Parameters of Soil;
(Soil pH is a measurement of the soil acidity (pH<7) or soil alkalinity (pH>7). Soil
solutions were extracted from the dumpsite as well as control soil by lysimetric method
for determination of pH. The data obtained are presented in Figure 1. Observations
reveaied that the pH of dumpsite soil samples collected in post monsoon season
was comparatively more basic than the pre monsoon sampleThe similar trend was also
observed in control soil samples. All the samples have pH>7 indicating occurrence of alkaline
soil. It may be due to poor soil texture of sampling point 1-4, and upper soil portion of
sampling point 5-6 which have thick hard calcareous (kankar) layers of low infiltration
capacity in their soil profile. Such soil becomes alkaline due to presence of carbonates and
bicarbonates of calcium, magnesium, sodium, and potassium held by soil colloids. During
post-monsoon season, high rainfall occurred at both sampling location at dumped waste
containing high plastic contents as well as hard soil profile of low infiltration capacity
caused water logging at Ghaila dumpsite area. The irrigated water contained lime which
might precipitated in the upper regions of dumpsite area nearest the water delivery inlets
and in the water flow path. Due to prolonged water logging it has resulted into higher
alkalinity of soil and pH levels rising to 7.0 and above until equilibrium is reached with
atmospheric carbon dioxide levels. Such increase in soil pH occurs more rapidly on coarse
and medium-textured soils than on clays which are more highly buffered. Higher pH values
of soil may be due to above factors at Dudauli dumpsite and Locations 5 and 6 of Ghaila
dumpsite area.
9.5 9
83 6.5 . 75 , , • Premonsoon
• Postmonsoon
0 „so .,:s.it. ‘5,;,) ,,,a „." co
c. cv. q°4,. e° q°q°$‘ qt.
Sampling Location
Fig. 1: Mean pH of collected soil samples of each sampling location in different monsoon seasons
Page 33

7.2 Chemical Property of Soil Samples
Assessment of soil quality with respect to its chemical composition was also done by
evaluating essential mineral level viz, available phosphorous as phosphate (in kg/ha),
available potassium (in kg/ha), available nitrogen (in kg/ha) and chloride level (mg/kg). The
data obtained are presented in figure 2-5 revealed that control and dumpsite soil samples
collected after rainfall (post monsoon samples) were comparatively found to be more
enriched with essential minerals/ions. Availability of phosphorous and potassium was
found to be higher in control soil samples than dumpsite samples indicating the depletion
of nutritional quality of dumpsite soil due to dumping of municipal solid was, However, higher
concentration of nitrogen and chloride ion was found throughout the soil profile of dumpsite
area. The probable reason may be decomposition of landfilled/dumped waste under
environmental conditions leading to formation of different characteristic chemical moieties
viz, nitrogen, methane, chloride, phosphate etc. Such species were prominently found in
higher concentration at Dudauli Municipal Solid Waste dumpsite area in comparison to
Ghaila Municipal Solid Waste dumpsite because of high load of dumped waste in larger
area at Dudauli dumpsite. It is worth to mention that significant amount of analytes were found
throughout different soil layers and levels were comparatively higher in post monsoon
season, specially in case of Ghaila dumpsite samples, indicating constant percolation of such
analytes in the soil profile.
40
35
30
25
20
15
10
5
0
Premonsoon
Postmonsoon
(.6% N> C.11 CI' C.1). •1/4-‘)
co t. &S‘ &Q. & Q. &Q. < 2 C • q < I Q
Fig 2: Mean Concentration of Available Phosphorous (P) as
Phosphate in Collected Soil Samples of each Sampling location in
different Monsoon Seasons
Page 34

A0.
N.9*
e NC 4' 4.5 4" 4'
(9q0 q0 10 q 0 0 q
Fig 3: Mean concentration of available potassium in collected soil samples
of each sampling location in different monsoon seasons
120
300 80
£ 200
osin150
Ptemonsoon Postmonsoon
Premonsoon
Postmonsoon
41„1/4:1 '5
5 co
C3
ot e° 4” • 4'`'64"
`" 4
'`"
3 `
0 <2 q& e a ° <z°\
ce# 4b.
<t‘" ask.
e° e° q
Fig 7: Mean concentration of chloride in tclp extract of collected soil
Fig 4: Mean values of available nitrogen in collected soil samples of each
sampling location in different monsoon seasons
20 0 2
0 1 1 1 1 1 18
16
s 12 g
I ) 10
t 8 • Premonsoon
-a 6 •Postm (moon
• 4
<5 D. <3 4) Fig 5: Samples of each sampling location in different monsoon seasons
Page 35

7.3 Heavy Metals and Organic Contaminants in Soil Samples:
Heavy metals viz Cd,Co,Cr, Cu, Pb, Mo, Ti and Zn were analyzed in all control soil (22 nos.) samples
(14 pre monsoon + 08 post monsoon) and experimental/dumpsite soil (88 nos.) samples (66 pre-
monsoon + 22 Post monsoon). In addition level of phthalates viz. Di-methyl phthalate (DMP),
Diethylphthalate (DEP), Di-butyl phthalate (DBP), Di (2-ethylhexyl) phthalate (DEHP) and Di-octyl phthalate
(DOP) were also determined in leachates (TCLP) of soil samples. Data revealed that Ghaila Landfill site
having coarse or sandy texture of soil have greater contamination of inorganic and organic moieties
throughout soil profile and in deep aquifers because rain water leachates containing pool of
contaminants may easily percolate throughi)On the other hand, impact of pollutants appeared more on
upper strata soil and side streams at Dudauli waste dumpsite having clay, gravels or rocky soil texture. In
addition, seasonal fluctuations also dominates on the quality and quantity of landfill leachate produced.
During the wet season period (post monsoon), low-strength leachate may suppose to generate, while
during the dry season period (pre monsoon), reduced percolation and enhanced evaporation increase
the leachate strength.
Soils have property to bind various chemicals and it depends on the form in which they exist in the
environment. It consists of mineral particles, organic matter and organic-mineral particles. They play
important role in giving the soil's ability to absorb exchange, oxidize, reduce, catalyze and precipitate
chemical and metal ions in particular. The inorganic colloidal fraction of soil is the most responsible for
absorption by its mineral particles. Its large surface area and porosity makes it good absorber of organic
and inorganic materials. Organic and inorganic moieties physically adsorb on soil surface instead of
being chemically absorb. Due to variation in pH, temperature, weathering or flow of water from
refusal tips such contaminants may migrate and percolates into lower soil strata or underground water
profile. The period of waste dumping was also found to be an important parameter to characterize the
leachate and to predict the environmental implications of waste dumping. Age of the landfill
corresponding to stabilization stage has a significant effect on characteristic composition of leachate,
as found at Dudauli dumpsite where dumping is continued since last five years and Ghaila dumpsite which
is active since last three years. The observed value revealed that the quantity of leachate produced
may be regarded as proportional to the volume of water percolating through the landfilled waste.
Reduction of the quantity of water entering the tip is of great importance in reducing the rate of leachate
generation. Leachate production has been found to be higher when the disposed refuse is less compacted
since compaction was found to reduce the filtration rate.
Page 36

7.3 Heavy Metals in Water Samples :
Heavy metals viz. Cd, Co, Cr, Cu, Pb, Mo, Ti and Zn were analyzed in all control water
(12 nos.) samples (06 pre monsoon + 06 post monsoon) and experimental/dumpsite
water (36 nos.) samples (18 pre monsoon + 18 post monsoon). The analytical data as
presented in table 5 revealed that Cd, Co and Ti were found below detection limit (BDL) in
all 48 samples. However, Cu and Zn are present in significant concentration in all
samples. Further, levels of Pb, Mo and Cr were found in traces and the concentration
above permissible limit was found only in few samples of first strata water. There was no
significant difference in level of heavy metals in pre-monsoon and post-monsoon water
samples as seen in case of soil samples. This may be due to dilution factor because of
rainfall. However, presence of heavy metals in traces in first strata in the underground
water of d psite area, may occur due to percolation of such heavy metals from dumping
of municipal solid waste including plastic waste. The effect of percolation was more at
Ghaila dumpsite area having sandy soil texture than Dudauli dumpsite area with hard
clay and gravels in soil profile. The concentration of Heavy Metals is mentioned at Table-5.
Table- 5: Concentration of Heavy Metals in Water Samples
CADMIUM (Cd)
Pre- monsoon Samples
Post- monsoon Samples
Concentration (mg/I)
Control Control
Total 0 0
Average 0 0
Standard Deviation
0 0
Maximum value 0 0
Minimum value 0 0
Experimental Experimental
Total 0 0
Average 0 0
Standard Deviation
- -
Maximum value - -
Minimum value - -
COBALT (Co)
Pre- monsoon Samples
Post- monsoon Samples
Concentration (mg/I)
Control Control
Total 0 0
Average 0 0
Standard Deviation
0 0
Maximum value 0 0
Minimum value 0 0
Experimental Experimental
Total 0 0
Average 0 0
Standard Deviation
- -
Maximum value - -
Minimum value - -
Page 37

CHROMIUM (Cr)
Pre- monsoon
Samples
Post- monsoon
Samples Concentration (mg/I)
Control Control
Total 0 0 Average 0 0 Standard Deviation
0 0
Maximum value 0
Minimum value 0 0
Experimental 1.108
Experimental 0.080 Total
Average 0.061 0.004 Standard Deviation
0.058 0.018
Maximum value 0.196 0.080
Minimum value 0
COPPER (Cu)
Pre- monsoon
Samples
Post- monsoon
Samples Concentration (mg/I)
Control Controi
Total 0.509 1.465 Average 0.084 0.244 Standard Deviation 0.085 0.324
Maximum value 0.213 0.900
Minimum value 0 0
Experimental Experimental Total 0.857 1.129 Average 0.047 0.062 Standard Deviation 0.100 0.049
Maximum value 0.420 0.180
Minimum value 0 0
LEAD (Pb) Pre-
monsoon Samples
Post- monsoon Samples
Concentration (mg/I)
Control Control
Total 0 0
Average 0 0
Standard Deviation
0 0
Maximum value 0 0
Minimum value 0 0
Experimental
Experimental
Total 0.040 0
Average 0.002 0
Standard Deviation 0.022
0
Maximum value 0
0
Minimum value 0.040 0
MOLYBDENUM (Mo)
Pre- monsoon Samples
Post- monsoon Samples
Concentration (mg/I)
Control Control
Total 0 0
Average 0 0
Standard Deviation 0 0
Maximum value 0 0
Minimum value 0 0 Experimental _
1.898 Experimental
0 Total
Average 0.105444 0
Standard Deviation 0.160629 0
Maximum value 0.417 0
Minimum value 0 0
Page 38

Titenium (Ti)
Pre- monsoon Samples
Post- monsoon Samples
Concentrati on (mg/I)
Control Control
Total 0 0 Average 0 0
Standard Deviation
0 0
Maximum value 0 0
Minimum value 0 0
Experimental Experimental Total 0 0 Average 0 0
Standard Deviation _ _
Maximum value _ _
Minimum value _ _
ZINC (Zn) Pre-
monsoon Samples
Post- monsoon Samples
Concentration (mg/I)
Control Control
Total 4.197 3.120 Average 0.699 0.624
Standard Deviation 0.379 0.306
Maximum value 1.066 0.820
Minimum value 0 0
Experimental Experimental Total 25.435 14.300 Average 1.413 0.841
Standard Deviation 1.279 0.648
Maximum value 4.410 2.500
Minimum value 0.006 0.100
7.5 Phthalates in Water Samples
The quality of water collected from dumpsite area was assessed with respect to
phthalates. This was conducted to estimate the concentration level of phthalates viz.
Di-methyl phthalate (DMP), Di-ethyl phthalate (DEP), Di-butyl phthalate (DBP), Di (2-ethylhexyl)
phthalate (DEHP) and Di-octyl phthalate (DOP). The levels of different type of phthalates in
the dumpsite water as well as control water samples at selected identified locations are
presented in Table 4. During conducting experiment, Limit of Quantification (LOQ) and Limit
of Detection (LOD) and recovery were determined by spiked sample method. The data
analysed are presented at Table 6.
Table - 6
Compound Spiked Level in
water (Ogil)
Mean Recovery
LOQ (0g/1) LOD (DWI)
DMP 10 70% 1.67 0.55 DEP 10 90% 0.28 0.09 DBP 10 76% 0.34 0.11 DEHP 10 85% 0.83 0.27 DOP 10 75% 0.40 0.13
Page 39

The processed samples were analyzed using High Performance/Pressure Liquid
Chromatography (HPLC). One representative chromatograph of Standard and a sample is
presented in Fig.6. The f ive representat ive samples were analyzed on Gas
Chromatography-Mass Spectrophotometer (GC-MS) to get confirmation of the respective
chromatographic peaks of phthalates. The identification of the phthalates found in the
samples was confirmed on GC-MS by comparing the RT and fragmentation patterns of the
compound in the standard and samples.
Fig-6: HPLC Chromatograph of representative Phthalate(s)
It is evident from the data of control water samples of all six locations that the values of
phthalates are in traces (Table 7). In pre-monsoon control water samples the mean values
of individual phthalates are BDL, 0.958 mg/I, 0.747 mg/I, 1.005 mg/I and 0.462 mg/I for DMP,
DEP, DBP, DEHP and DOP, respectively. These values revealed that DEHP were found to
be present in 52.0% of the total phthalate concentration, while the DMP was the least
detected phthalate. Detected phthalate concentration was found in the order
DEHP>DEP>DBP>DOP»DMP, hence, it found in lesser quantity as compared to DEHP, DEP
and DBP. Data obtained from the analysis of post-monsoon control water samples
revealed the occurrence of phthalates concentration is comparatively higher than the
pre-monsoon samples (Fig. 7 and Fig. 8). Mean values of individual phthalates
concentration in post-monsoon control water samples are BDL, 1.033 mg/I, 0.832 mg/I, 1.358
mg/I and 0.517 mg/I for DMP, DEP, DBP, DEHP and DOP, respectively. Detected phthalate
level was found to follow the same occurrence trend as pre-monsoon samples: DEHP>
DEP>DBP>DOP>>DMP. Out of six control water samples, five samples were collected near
(within 200 meters residential area) Dudauli and Ghaila Municipal waste dumpsite area from
tube well or hand pump, which was used by local people. The presence of traces of
phthalates in water samples of the dumpsite areas indicate the effect of dumping of
municipal and plastic waste on the surroundings.
,
D1HP DEP I DBP DEHP DOP
S t a n d a r d — 0 0
,
0 HI
031 11
kid -0 001
2.60 3. 4.00 5.00 600 7.00 5.00 9.00 l a lo o 11.00. 1209 1309
1409
Minutes
0 013
0 012
0 011
0 010
0.009
0.098
0.097
A i m -
0.095
0 . 0 9 4
0 OGG
0 002 -
Sample —00.
_
Page 40

Fig 7: Mean Concentration of Phthalates (mg/I) in Control Water Samples
Concentration of Phthalates in Control Water Samples
1
• 0.8
t 0.4
0.2 MIT) DEP DER DEED DOP
Control Water Samples
Mean Concentrat'on (±SD) of Phthalates (mg/I)
DMP DEP DBP DEHP DOP
Pre-monsoon BDL 0'958 ±2.76
0.747 ±2.12
1.005 ±2.46
0.462 ±1.35
Post-monsoon BDL 1"033
±2.95 0.832 t2.37
1.358 ±3.45
0.517 ±1.51
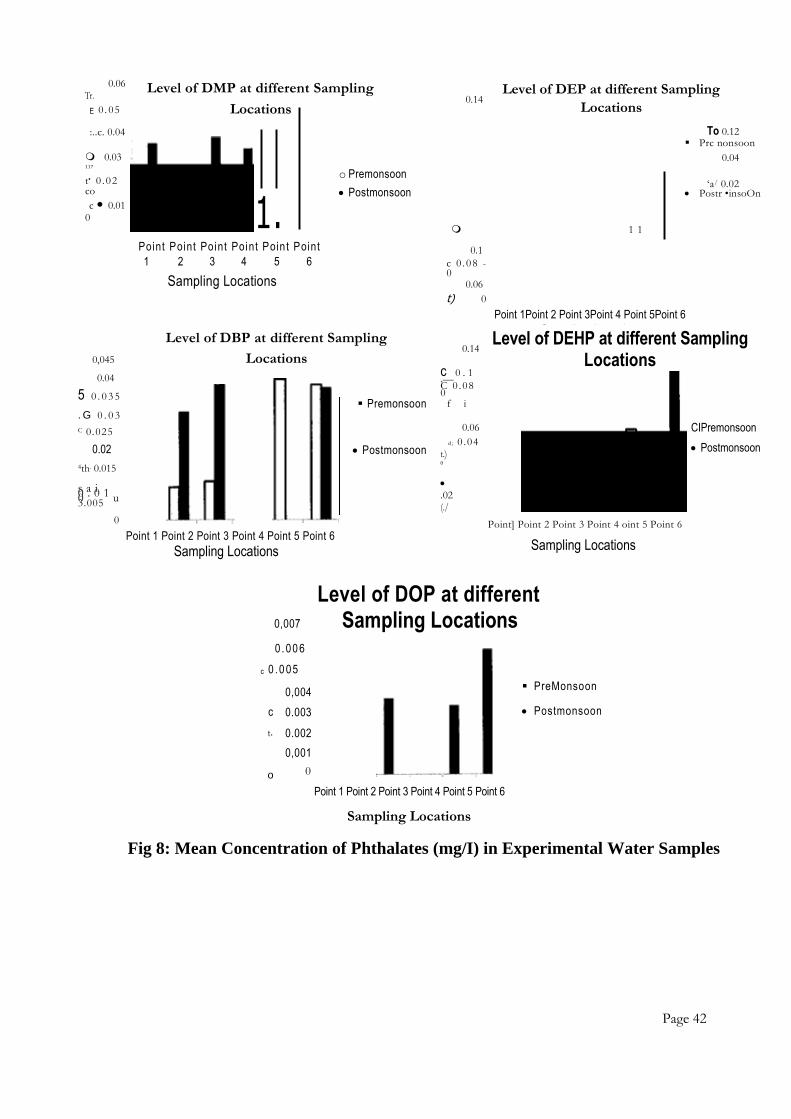
Table 7: Concentration of Phthalates in Experimental Water Samples
Sampling Location
Season Mean Concentration (±SD) of Phthalates (in mg/I)
DMP DEP DBP DEHP DOP
0.014 0.073 0.003 0.003 0.002 Pre-monsoon ±0.005 ±0.014 ±0.005 ±0.002 ±0.002
Point 1 Post-monsoon
0.036 ±0.012
0.081 ±0.010
0.017 ±0.029
0.012 ±0.013
BDL
Point 2 Pre-monsoon
0.009 ±0.001
0.105 ±0.013
0.009 ±0.005
0.009 ±0.001
BDL
Post-monsoon 0.021 ±0.010
0.131 ±0.013
0.030 ±0.010
0.053 ±0.033
BDL
Pre-monsoon 0.027 0.084 0.011 0.011 0.003
Point 3 ±0.006 ±0.012 ±0.004 ±0.004 ±0.003
Post-monsoon 0.038 ±0.007
0.121 ±0.024
0.038 ±0.005
0.007 ±0.005
BDL
Pre-monsoon
0.016 ±0.006
0.058 ±0.053
0.006 ±0.002
0.009 ±0.001
BDL
Point 4 Post-monsoon
0.034 ±0.008
0.076 ±0.064
BDL 0.031 ±0.010
BDL
0.041 0.085 0.040 0.069 0.003 Pre-monsoon ±0. 006 ±0.015 ±0.005 ±0.019 ±0.005
Point 5 Post-monsoon
0.017 ±0.028
0.036 ±0.063
BDL 0.038 ±0.040
BDL
0.050 0.0683 0.038 0.067 0.006 Pre-monsoon ±0.005 ±0.010 ±0.008 ±0.007 ±0.010
Point 6 Post-monsoon
0.045 ±0.039
0.079 ±0.071
0.037 ±0.032
0.121 ±0.022
BDL
Page 41
0.06 Tr.
E 0 . 05
:..c. 0.04
0.03 117
t• 0 . 02 co
c • 0.01 0
Point Point Point Point Point Point
1 2 3 4 5 6
Sampling Locations
1.
Level of DMP at different Sampling
Locations
o Premonsoon
Postmonsoon
Level of DEP at different Sampling 0.14
Locations
To 0.12
0.04
‘a/ 0.02
1 1
0.1
c 0 . 0 8 - 0
0.06
t) 0
Point 1Point 2 Point 3Point 4 Point 5Point 6
Sampling Locations
Prc nonsoon
Postr •insoOn
0,045
0.04
5 0 . 0 3 5
. G 0 . 0 3
C 0.025
0.02
4th. 0.015
s a i 0 . 0 1 0 u 3.005
0
0.14
c 0 . 1 .— C 0 . 08 0
f i
0.06
d ; 0 .04 t.) 0
0.02 (./
0
Level of DBP at different Sampling
Locations
Premonsoon
Postmonsoon
Point 1 Point 2 Point 3 Point 4 Point 5 Point 6
Sampling Locations
Level of DEHP at different Sampling Locations
Point] Point 2 Point 3 Point 4 oint 5 Point 6
Sampling Locations
CIPremonsoon
Postmonsoon
Level of DOP at different 0,007 Sampling Locations 0 . 00 6
c 0 .0 05
0,004
c 0.003
t. 0.002
0,001
o 0
Point 1 Point 2 Point 3 Point 4 Point 5 Point 6
PreMonsoon
Postmonsoon
Sampling Locations
Fig 8: Mean Concentration of Phthalates (mg/I) in Experimental Water Samples
Page 42

Recommendation: It has been observed that dumping of plastic waste may deteriorates soil and underground water quality due to leaching of additives, colours, stabilizes and fillers present in the different categories of plastic products. It is therefore recommended that plastic dumping should not be allowed to preserve the soil and water quality vis-as-vis Environment.
Conclusion:
Characterizat ion of dumpsite samples could be a yard -st ick for the
measurement of extent of pollution in surrounding environment. The biotic and
abiotic transformation processes of different wastes give rise to pools of organic and
inorganic compounds in the gaseous and liquid phases. During landfill operation,
leachates are produced, mainly due to the infiltration of rainwater through the refuse tips.
Such compounds may percolate through soil and contaminate groundwater basins in the
drainage area of the landfill.
The period of waste dumping (age of landfill site), geological and seasonal factors are
important parameters to characterize the leachate and predict the environmental
implications of waste dumping.
The pH of dumpsite soil samples collected in post-monsoon season was found to be
comparatively more basic than the pre-monsoon samples. Accumulated dumped waste
containing high plastic contents as well as hard soil profile of low infiltration capacity
caused water logging. This irrigated water contained much of the lime which might
precipitate in the upper regions of dumpsite area and resulted into increase in the
alkalinity of the soil.
Availability of phosphorous and potassium was found to be higher in control soil samples
than dumpsite samples indicating the depletion of nutritional quality of dumpsite soil
due to dumping and degradation of plastics waste for more than 10 years.
Decomposition of landfilled/dumped waste under environmental conditions caused higher
concentration of nitrogen and chloride ions throughout the soil profile of dumpsite area.
Presence of heavy metals and phthalates in first strata of underground water of umpsite
area is due to migration and percolation of dumping of municipal and plastic waste.
Data obtained from Toxicity Characteristic Leaching Procedure (TCLP) of dumpsite
samples also contained significant amount of analytes indicating migration of chemical
moieties from plastic waste.
Page 43