
Impact of Phase Change materials - Agbanigo of Phase Change materials - Agbanigo Sept., 2012 i...
84
Department of Mechanical and Aerospace Engineering IMPACT OF PHASE CHANGE MATERIALS ON ENERGY SAVINGS OF RENWABLE ENERGY TECHNOLOGIES Author: Agbanigo Andrew Olubunmi Supervisor: Dr. Nicolas Kelly A thesis submitted in partial fulfilment for the requirement of the degree Master of Science Sustainable Engineering: Renewable Energy Systems and the Environment 2012
Transcript of Impact of Phase Change materials - Agbanigo of Phase Change materials - Agbanigo Sept., 2012 i...

Department of Mechanical and Aerospace Engineering
IMPACT OF PHASE CHANGE
MATERIALS ON ENERGY SAVINGS OF
RENWABLE ENERGY TECHNOLOGIES
Author: Agbanigo Andrew Olubunmi
Supervisor: Dr. Nicolas Kelly
A thesis submitted in partial fulfilment for the requirement of the degree
Master of Science
Sustainable Engineering: Renewable Energy Systems and the Environment
2012

Copyright Declaration
This thesis is the result of the author’s original research. It has been composed by the
author and has not been previously submitted for examination which has led to the
award of a degree.
The copyright of this thesis belongs to the author under the terms of the United
Kingdom Copyright Acts as qualified by University of Strathclyde Regulation 3.50.
Due acknowledgement must always be made of the use of any material contained in,
or derived from, this thesis.
Signed: - Date: - 8th September, 2012
Impact of Phase Change materials - Agbanigo Sept., 2012
i
Abstract
The possibility of energy and operational cost savings with application of phase
change thermal/heat storage was investigated in this report. Model of a 2-storey
detached house representative of typical UK dwelling with average insulation
employing an air source heat pump for domestic water and space heating was
simulated. The model was divided into three zones, living, non-living and loft. The
living zone represents the living room and dining, the non-living zone, the bedrooms,
toilets and baths and the kitchen while loft zone represents the loft. Model of the
domestic hot water tank is stratified and has provision for incorporating phase change
material. A base case model with no PCM in DHW tank was simulated for decreasing
on/off set time duration to obtain a minimum on/off set time for running heat pump
such that DHW temperature drop below 40oC is in experienced for a percentage of
occupied period (averaged over simulation week/period) not greater than 15%. This
set time was set as starting point for simulating models with phase change material
incorporated into the DHW tank. Simulations were run for 12.5%, 25% and 37.5% of
DHW tank volume of PCM and for reducing on/off set time duration as well as back
shifting on/off set time away from peak energy demand period into off peak period in
order to explore the possibility of taking advantage of the different and lower energy
tariff for off peak period for energy cost savings. Back shifting on/off set time into off
peak period for models with PCM using the same number of hours as for the
minimum obtained for the base case, 7 – 16, yielded energy cost saving of 32.8
pence/day, 22.75% less but energy consumption increase of 5.23%, for on/off set time
3 – 12, 12.5% PCM, being the on/off set time with maximum percentage of occupied
period DHW temperature dropped below 40oC. 50.55pence/day, that is 35.06%, was
obtained as maximum energy cost saving while average daily energy consumption
increased from 13.95kWhr to 15.04kWhr, (7.81%), for back shifting to 1 – 10, 37.5%
PCM while reducing on/off set time duration and back shifting resulted in maximum
energy cost savings of 111.06pence/day (77.2%) and 6.34kW/day (52.83%) reduction
in energy consumption when compared with the minimum base case (no PCM) on/off
set time.

Impact of Phase Change materials - Agbanigo Sept., 2012
ii
Dedication
This work is dedicated to God almighty, whose grace and mercy made it possible for
me to embark on the programme and to finish. It is also dedicated to my wife, Kemi
and my daughter, Eden, the two blessings of God I have not come to fully appreciate.
Acknowledgments
I wish to acknowledge and appreciate God for his love, grace, mercy and provision
for me throughout the period of the programme. I appreciate my wife and daughter for
enduring and taking care of each other while I was away. I am grateful to Iya Remi,
my mother, for her constant love and prayers, and for yielding herself to be used of
God to bless me. I am grateful to my mother-in-law for her support. I appreciate sister
Nike, who has been more of a sister than an in-law. I also appreciate Mama Sunday
(Eye Jiyegbe), my siblings and other members of my extended family for their
support and understanding.
I am grateful to of the Government of Nigeria, the Education Trust Fund, the
management of The Federal Polytechnic, Ado Ekiti, the Staff Training and
Development Committee, the Head of department and staff of Mechanical
Engineering Department, The Federal Polytechnic, Ado Ekiti, particularly, Engr.
Oladebeye, Engr. Ajueyitsi and Mr. P. S. Ogunsola (daddy P.S.).
I acknowledge the support and assistance of Dr. Nick Kelly, my supervisor and Dr.
Jon Hand, both for guiding and helping with ESP-r software and the models.
I acknowledge and appreciate the brethren in T. C. T. M., worldwide, for their prayers
and support, the G. O., Rev. Olowoselu, Pastor Emmanuel, Pastor and Pastor (Mrs)
Akinyemi, Pastor Baderinwa and Mrs. Baderinwa (mommy A. G. O.), Victor
Aderemi (Bishop) and his lovely wife, Shade, and Baba Ogunrinde. Oluwa a di yi mu.

Impact of Phase Change materials - Agbanigo Sept., 2012
iii
I appreciate also, the brethren in R. C. C. G., Fountain of Love parish, Glasgow,
especially Pastor Omoniyi Makun and Dr (Mrs.) Dele Makun, Pastor Segun Ibigbemi,
Sister Ope, and Bros Olumide Ajibola and Bolu. You have all been a blessing to me.
May you be strengthened and established in Him.
I also appreciate members of the choir in both assemblies, Ado Ekiti and Glasgow. It
is good to sing praise to the Lord and proclaim his love at night. May His praise
continually be in your mouths.
I am grateful to Anthony and Fehintoluwa (F. T.) Olowoyeye, Stephen and Rebecca,
both of House of Hearing, Edinburgh. The Lord will not allow help to be far from you
and may you ever flourish in Him. Also, Tosin and Sola Odubanjo, you guys rock. I
am grateful also, to Mr. Sunday Omole and omo aba mi, Mr. Adesanya. Thank you
both for your help and assistance.

Impact of Phase Change materials - Agbanigo Sept., 2012
iv
Table of Contents
Index Page
Abstract i
Dedication ii
Acknowledgements ii
Table of contents iv
List of Figures vi
List of Tables viii
1 Introduction 1
1.0 Background 1
1.0.1 Energy 1
1.0.2 Energy Storage and Conservation 3
1.0.3 Thermal Energy/Heat Storage 5
1.0.4 Phase Change Heat Storage 7
1.0.5 Domestic Energy consumption 10
1.0.5 Heat Pumps 11
1.0.7 Air Source Heat Pumps (ASHP) 13
1.0.8 Ground Source Heat Pumps (GSHP) 15
1.2 Aims, Objectives and Scope 18
1.2.1 Aim 18
1.2.2 Objectives 18
1.2.3 Scope 18
2 Literature Survey 19
2.1 Preamble 19
2.2 Renewable Energy Systems 19
2.3 Energy Storage and Phase Change Materials 21
2.4 Energy Demand/Load Shifting and Control 25
2.5 Heat pump Heating Systems 26
3 Methodology 28

Impact of Phase Change materials - Agbanigo Sept., 2012
v
3.1 Model Description 28
3.2 Experimental Procedure 29
4 Result Analysis and Discussion 33
4.1 Base Case 33
4.2 Effect of Reducing on/off Set Time Duration 34
4.3 Effect of Back Shifting (no PCM) 38
4.4 Effect of Back Shifting with PCM 41
4.5 Comparison between No-PCM and PCM Cases (Back Shifting 46
4.6 Bach Shifting Combined with o/off Set Time Duration Reduction 50
4.7 Combined Effect of Set Time and Proportion of PCM 53
5 Conclusion and Recommendations 58
5.1 Conclusion 58
5.2 Recommendations 59
References 60
Appendices Tables and Figures 66
Appendix A Result Tables 66
Appendix B Figures 71

Impact of Phase Change materials - Agbanigo Sept., 2012
vi
List of Figures
Figure 1.1 Arrangement of components of an Air Source Heat Pump 13
Figure 1.2 Air Source Heat Pump 14
Figure 1.3 Ground Source Heat Pump showing different configurations 16
Figure 4.1 DHW temperature profile over simulation period for on/off set
time 7–16 (no PCM)
33
Figure 4.2 Profile for hot water draw for on/off set time 7-16 (no PCM) 34
Figure 4.3 DHW temperature profile over simulation period for on/off set
time 7-14 (no PCM)
35
Figure 4.4 DHW temperature profile over simulation period for on/off set
time 7-12 (no PCM)
35
Figure 4.5 DHW temperature profile over simulation period for on/off set
time 7-10 (no PCM)
36
Figure 4.6 Effect of reducing on/off set time duration (start 7am) on % of
occupied period hot water temperature < 40 deg
37
Figure 4.7 Effect of reducing on/off set time on actual operating time for
heat pump
37
Figure 4.8 DHW temperature profile over simulation period for on/off set
time 5-14 (no PCM)
38
Figure 4.9 DHW temperature profile over simulation period for on/off set
time 3-12 (no PCM)
39
Figure 4.10 DHW temperature profile over simulation period for on/off set
time 1-10 (n0 PCM)
39
Figure 4.11 Effect of back shifting on/off set time on % of occupied period
hot water temperature < 40 deg (no PCM)
40
Figure 4.12 Effect of back shifting on actual heat pump operating time (no
PCM)
41
Figure 4.13 DHW temperature profile over simulation period (5-14, 12.5%
PCM)
42

Impact of Phase Change materials - Agbanigo Sept., 2012
vii
Figure 4.14 DHW temperature profile over simulation period (5-14, 25%
PCM)
42
Figure 4.15 DHW temperature profile over simulation period (5-14, 37.5%
PCM)
43
Figure 4.16 DHW temperature profile over simulation period (3-12, 12.5%
PCM)
44
Figure 4.17 DHW temperature profile over simulation period (3-12, 25%
PCM)
44
Figure 4.18 DHW temperature profile over simulation period (3-12, 37.5%
PCM)
45
Figure 4.19 DHW temperature profile over simulation period (1-10, 25%
PCM)
46
Figure 4.20 DHW temperature profile over simulation period (1-10, 37.5%
PCM)
46
Figure 4.21 Comparison of back shifting effect on energy cost for no-PCM and
different % of PCM in DHW tank
47
Figure 4.22 Comparison of back shifting effect on % of occupied period hot
water temp < 40 deg for no-PCM and different % of PCM in
DHW tank
47
Figure 4.23 Comparison of back shifting effect on actual heat pump operating
time for no-PCM and different % of PCM in DHW tank
49
Figure 4.24 Comparison of back shifting effect on actual heat pump energy
consumption for no-PCM and different % of PCM in DHW tank
50
Figure 4.25 Effect of reducing on/off set time duration with 5am start time on
energy cost for different % of PCM
51
Figure 4.26 Effect of reducing on/off set time duration with 5am start time on
% of occupied period hot water temp < 40 deg for different % of
PCM
51

Impact of Phase Change materials - Agbanigo Sept., 2012
viii
Figure 4.27 Effect of reducing on/off set time duration with 5am start time on
actual heat pump operating time for different % of PCM
52
Figure 4.28 Effect of reducing on/off set time duration with 5am start time on
heat pump energy consumption for different % of PCM
53
Figure 4.29 Comparison of combined effect of on/off set time and % PCM on
energy cost
53
Figure 4.30 Comparison of combined effect of on/off set time and % PCM on
% of occupied period hot water temp < 40 deg
54
Figure 4.31 Comparison of combined effect of on/off set time and % PCM on
actual heat pump operating time
55
Figure 4.32 Comparison of combined effect of on/off set time and % PCM on
heat pump energy consumption
56
Figure 4.33 DHW temperature profile over simulation period (5-8, 37.5%
PCM)
56
Figure 4.34 DHW temperature profile over simulation period (3-8, 37.5%
PCM)
57
Figure B1 Living zone temperature profile for on/off set time 7 -23 (no PCM) 71
Figure B2 Cut-out picture of EDF Energy prices sheet showing Economy 7
tariffs
72

Impact of Phase Change materials - Agbanigo Sept., 2012
ix
List of Tables
Table 1.1 Properties of some Phase Change Materials for Domestic Application 9
Table A1 Effect of back shifting on energy cost computed from simulation
result
66
Table A2 Effect of back shifting on % of occupied period DHW temperature
dropped below 40oC computed from simulation result
66
Table A3 Effect of back shifting actual heat pump operating time computed
from simulation result
66
Table A4 Effect of back shifting heat pump average daily energy consumption
(kWhr/day) computed from simulation result
67
Table A5 Effect of reducing on/off set time duration on energy cost computed
from simulation results
67
Table A6 Effect of reducing on/off set time duration on % of occupied period
DHW temperature dropped below 40oC computed from simulation
results
67
Table A7 Effect of reducing on/off set time duration actual heat pump
operating time computed from simulation results
68
Table A8 Effect of reducing on/off set time duration heat pump average daily
energy consumption (kWhr/day) computed from simulation results
68
Table A9 Combined effect of on/off set time back shifting and duration
reduction on cost computed from simulation results (7-16 only for no
PCM)
68
Table A10 Combined effect of on/off set time back shifting and duration
reduction on % of occupied period DHW temperature dropped below
40oC computed from simulation results (7-16 only for no PCM)
69
Table A11 Combined effect of on/off set time back shifting and duration
reduction actual heat pump operating time computed from simulation
results (7-16 only for no PCM)
69

Impact of Phase Change materials - Agbanigo Sept., 2012
x
Table A12 Combined effect of on/off set time back shifting and duration
reduction heat pump average daily energy consumption (kWhr/day)
computed from simulation results (7-16 only for no PCM)
70

Impact of Phase Change materials - Agbanigo Sept., 2012
1
1 Introduction
1.0 Background
1.0.1 Energy
Modern man, in a lot of respect, differs from his primitive ancestors, especially, in
energy use. World total energy consumption was put at in 2005
(Energy Information Administration, 2007). With over six billion population, this is
equivalent to every individual having 90 men do heavy industrial labour non-stop all
day.
Because energy has the ability to make possible the provision of comfort,
transportation and production of food and material goods, it has become essential to
our way of life, a veritable ingredient in everyday human life. So much so that it is
used as a yardstick with which a country’s development is measured, the per capital
energy consumption.
There is an ever increasing demand for energy due to increase in use and demand for
labour saving devices, population increase, industrialisation, e.t.c., leading to increase
in energy production and search for more sources and resources, often exceeding
capacity of local resources to cope.
Energy is defined as the capacity to do work. It is present or inherent in very object or
substance in nature, in cells, atoms, molecules, nuclei and in nuclear forces and
interactions. According to the energy equation , matter is energy and energy
is matter.
It is dormant and reserved while it remains in the cells, atoms, molecules and nuclei
as chemical, internal molecular and nuclear energy, but is consumed when it performs
or is employed to do work: mechanical work, to move unit mass over unit distance,

Impact of Phase Change materials - Agbanigo Sept., 2012
2
electrical work, to move a charged particle (electron) through an electric field, thermal
work, to cause unit increase in temperature of a substance and release of
electromagnetic radiation (visible light, gamma rays, x-rays, radio waves, etc).
It is inter-convertible from one form to the other, more easily when it is being used
up, from the stored, reserved form, to work, and from one type of work to another. It
is however not quite easily converted from work to the stored form. And this all that
can be done to energy, convert from one form/type to the other. Energy can neither
be created nor destroyed! It can only be converted from one form/type to another or
transferred.
The ease of conversion (or transfer) depends on the materials and systems employed –
A boiler for converting chemical energy stored in natural gas to thermal work which
raises temperature of water, a battery operated light bulb for converting chemical
energy stored in batteries to thermal energy (work) for raising temperature of bulb
filament and electromagnetic radiation as light (energy), and a thermal power plant,
through a number of conversion processes and stages, for converting stored chemical
energy of fuels (like natural gas) to electrical work (energy).
A thermal power plant begins to consume energy once the burners are lit and the fuel
ignited. Energy is utilised here (for steam power plant) to raise temperature of water
and change it from liquid to gas (steam) (i.e. thermal work). The turbine converts or
changes the work (energy) from thermal to mechanical in the spinning shaft which is
further converted or changed into electrical work (energy) by the electric motor
(alternator). This energy has been consumed and its usefulness depends on how easily
it can be further converted into other forms/types of work (energy), retained (or kept
from dissipating) or converted back to the stored form for use/consumption at a later
time. This has been the major challenge of energy utilisation and availability.
The readiness or effectiveness with which an energy converter or consumer converts
energy from one form to the other is referred to as its efficiency. It is the ratio of
output energy to the input energy, whether or not the form/type is similar or different
after conversion. Every energy conversion process or transfer involves some losses or

Impact of Phase Change materials - Agbanigo Sept., 2012
3
wastages and is never at 100%. This is due to limitations imposed by structural,
molecular and thermodynamic constraints on substances and materials. The coils
within an electric motor will always warm up as a result of the resistance to flow off
electricity by copper. This is necessary for inducing magnetic force needed for
moving the armature and producing rotation of the shaft. The shaft, in turn, will warm
up due to friction resistance in the bearings and so on. Also, the molecules of the
material used to construct a heat exchanger will, of necessity, take up some of the heat
energy before it flows across to the receiving substance (like water), which will in
turn also take up some before passing it on. This energy taken up represents ‘work’
that has to be done on atoms and molecules of the substance for it to perform the
required task.
1.0.2 Energy Storage andConservation
As stated above, energy consumption for a power plant begins as soon as the burners
go on. If not utilised for any particular purpose, the energy, now converted to thermal
energy (work), is dissipated, taken up, in the molecules of air in the atmosphere. It is
wasted because it was not utilised.
Energy storage affords opportunities for better utilisation and management of energy
and energy resources. Wastages can be reduced considerably as energy systems would
not necessarily have to be designed for maximum load but for an optimum that is
some mid-way between highest and lowest demand. Excesses during periods of low
demand can be stored away and utilised to meet up supply during periods of high
energy demand. This way energy demand and supply profile can be levelled.
It is particularly useful in renewable energy systems technology and applications like
solar, wind, wave and tidal energy, which are intermittent. Storing up energy
produced during periods of high resource availability provides opportunity for
extending supply and making it appear continuous, if energy in store can sufficiently
meet up demand during periods of low or no resource availability.

Impact of Phase Change materials - Agbanigo Sept., 2012
4
Energy storage (or rightly put, energy reservation) refers to means or methods of
keeping energy in the stored or dormant form (holding off consumption or
dissipation), converting work (energy) back to stored form, or delaying its dissipation
by temporarily storing for use at a later time in order to prevent or reduce its wastage
or useless dissipation.
Holding off consumption, that is keeping in the stored, dormant form implies not
employing it to perform work. Not using energy is almost an impossible task in this
industrialised energy intensive age. Electrical energy (work) can easily be converted
back to the stored form (chemical energy) via electrolysis or kept from dissipating in
charge and electrical capacitors. Thermal and mechanical energy (work), on the other
hand, can only be converted into temporary stored form or kept (temporarily) from
dissipating, as internal (heat) energy via change of phase from solid to liquid or liquid
to gas, or increase in temperatures of a substances with high specific heat capacity, for
thermal energy (these are non natural processes. Plants naturally convert thermal, and
radiant energy, from the sun into stored chemical energy via photosynthesis), and by
employing a rotating object with large mass, a flywheel, or as internal energy in
compressed air/vapour or pumped water storage for mechanical energy (work).
The substances employed for these storages are often in unstable states, which can
only be maintained if substance/material is isolated from the environment or
surrounding, from frictional forces, otherwise the work is dissipated and utilised or
wasted as substance returns to stable state. Keeping storage substance/material in
isolation is not always easy to achieve due also to thermodynamic, structural and
environmental constraints.
Although electrical energy (work) can be converted back to the stored form it is not
without some losses as ‘work’ has to be done (energy dissipation) on the atoms and
molecules of the storage substance to change their configuration into the form that
enables them store energy. Maximum theoretical efficiency for electrolysis is between
80 – 94% but between 50 – 70% in practice, and drops as the substance cycles
between dissipation and storage over a period of time until the substance is no longer
able to change back to the energy storing form.

Impact of Phase Change materials - Agbanigo Sept., 2012
5
Because of the difficulty and attendant losses associated with attempts to convert
work (energy) back to the stored energy form, coupled with the fact that it may only
be possible with electrical form/type, and that it is almost impossible not to consume
energy at all, preventing dissipation for a period of time seems to be the option for
reducing or preventing energy wastage with wide applicability.
1.0.3 Thermal Energy/Heat Storage
The ease or readiness with which heat/thermal energy can be reserved or kept from
dissipation, temporarily, depends, to a large extent, on the quantity to be stored,
storage temperature and the length of time for which it is to be stored. Storing at low
temperatures (often referred to as low grade heat, below 100°C) can easily be done for
considerable lengths of time (up to 48 hrs), whereas storing at higher temperatures
(high grade heat, above 100oC) for long periods is more difficult to achieve and
requires rather complex systems to effectively keep the heat (energy) from
dissipating. Also, storing heat (energy) in high temperatures allows large quantities to
be stored but with increased possibility of wastages or losses (wasteful dissipation)
due to high temperature differences.
Heat/thermal (energy) can be stored employing three basic methods or ways: in
elevated temperatures of substances with high thermal mass (specific heat capacity),
by change of phase of a material from, say solid to liquid or liquid to gas or by
reversible chemical reaction of some substances that absorb large amount of heat
during either the forward or reverse reaction and releases stored heat in the reverse or
forward reaction. The first method is referred to as sensible heat/thermal storage
(SHS), the second, latent heat/thermal storage (LHS) and the third chemical
heat/thermal storage.
Sensible heat storage involves changes in the temperatures of the material storing the
heat. Here, advantage is taken of the relatively high specific heat capacity of the
storage material. This term refers to the amount of heat/thermal energy required or
needed to raise the temperature of the substance by one unit. For example, specific
heat capacity of water is about 4.2kJ/kgK, about 3.35kJ/kgK for concrete and about
Impact of Phase Change materials - Agbanigo Sept., 2012
6
0.42kJ/kgK for steel. This means that for every degree (Kelvin) rise or fall in
temperature of water 4.2 kJ of heat/thermal energy is absorbed or released; 3.35kJ for
concrete and 0.42kJ for steel.
Latent heat/thermal storage involves no change in temperature, utilising the energy
taken up or given out by a substance as it changes from one phase to the other, the
process occurring at the same temperature. The heat (energy) absorbed is utilised to
break the strong molecular structure and bond of more compact configuration phase,
say solid, and cause transformation into a less compact configuration phase, say
liquid. The energy (heat) is released when the substance returns to the initial phase
and the molecular bonds reform. This heat/energy is usually very large in comparison
to that required per unit mass for sensible heating. Latent heat of vaporisation of water
is 2260 kJ/kg and between 260 and 285 kJ/kg for steel.
The ratio of energy (heat) required for phase change to that required for temperature
change is relatively large for many known substances, about 80 for water. That is, 80
times more energy (heat) is needed to cause water to transform from liquid to gas than
is needed to raise the temperature of liquid (or gaseous) water by 1 degree. This
implies that water, employed for latent heat storage, can store 80 times more heat
(energy) than the same quantity employed for sensible heat (energy) storage. This also
means that 80 times less quantity and space will be required for the same
quantity/amount of heat (energy).
Important factors about a thermal storage system are the amount of energy that can be
stored, the amount stored per unit volume, the volumetric energy capacity, and the
length of time over which it can be stored with acceptable losses. Volumetric energy
capacity is usually high for materials with high density. If specific heat capacity is
high, large amount of heat can be stored in relatively small amount of material, which
affords the advantage of small storage space. For sensible heat storage, amount of
material required to store an appreciable amount of heat/energy is relatively large,
even for high density materials, making it difficult to take advantage of small storage
space.
Impact of Phase Change materials - Agbanigo Sept., 2012
7
Latent heat/thermal storage allows storage of more heat/energy per unit mass and
volume, making storage system smaller, lighter and more compact. The reduced size
also means heat loss is reduced as heat loss is proportional to surface area. The fact
that phase changes occur at relatively constant temperatures implies that difference
between heat (energy) storage and heat (energy) delivery temperatures need not be
large and heat (energy) supply and delivery will occur at relatively constant
temperatures, which also reduces or limits heat (energy) loss to the surrounding
(Farid, et al., 2004). Also fluctuations in supply can be effectively smoothed out by
application of heat storage (Münster & Lund, 2007).
The process of heat storage or absorption ceases for sensible heat storage when
storage material temperature reaches temperature at which heat is being delivered to
it. Latent heat storage, on the other hand, continues until all material completely
changes phase. More heat can even be stored if phase change temperature is lower
than heat delivery temperature, this time as sensible heat, combining both types of
heat storage methods.
Phase change materials for latent heat/thermal energy storage affords great
opportunities for energy and cost savings and the potential for their development and
advancement, implementation and integration is immense (Baker, 2008).
1.0.4 Phase Change Heat storage materials (PCMs)
For most phase change energy storage applications the solid-liquid phase is the most
widely employed, primarily because of the ease of handling solid and liquids relative
to gases, and because heat transfer to and from PCMs involve some conduction,
which is better in solids and liquids.
There are two main divisions or classes of phase change materials used for thermal
energy storage: organic and inorganic. Organic materials are paraffin, fatty acids,
esters, alcohols, and glycols while inorganic materials include water, salts and salt
hydrates of metals, alkalis, metals and alloys, and eutectic mixtures.

Impact of Phase Change materials - Agbanigo Sept., 2012
8
The paraffins stand out among organic PCMs and are often classed separately. They
are waxes and viscous oils. They have a high latent heat of fusion, low vapour
pressure, little or no sub-cooling and are chemically stable. They are readily available,
non corrosive and safe but their application is limited by low thermal conductivity,
flammability and large volumetric change after phase change.
Organic non-paraffinic PCMs have high melting points, similar to those of paraffins,
as well as low thermal conductivity and volume change. They are majorly toxic,
poisonous and unstable at high temperatures, as well as being very expensive.
Inorganic phase change materials have relatively high latent heat, high thermal
conductivity and low volumetric change, with salt and salt hydrates ranking best.
They (salts and salt hydrates) have high volumetric thermal storage capacities, sharp
melting points and are readily available. Some are corrosive to some metals and other
not so corrosive. However, a suitable combination of phase change material and
metals is largely possible.
A major problem with salt hydrates (and many other inorganic phase change
materials) is super-cooling upon freezing due to weak nucleation properties and phase
segregation which is caused by incongruent melting. As the hydrates melt anhydrous
salts separate from the aqueous solution and settle to the bottom because of higher
density. When re-solidification begins, it usually starts at the interface between
anhydrous salt and precipitate forming a contact barrier that prevents complete
rehydration. The method adopted to tackle this problem is to mix the salt hydrate with
nucleating and gelling agent
Eutectics are mixture of two or three inorganic compounds that have definite
melting/freezing points, which enables them to melt and freeze without separating.
The mixture could contain only salts, salt hydrates, alkalis or mixture of two or all.
Their sharp melting points allow melting and freezing of all components to occur
simultaneously.

Impact of Phase Change materials - Agbanigo Sept., 2012
9
Table 1.1 Properties of some PCM used for domestic applications (source
Cabeza et al. (2011))
Product Type
Melting
temperature(oC)
Heat of
fusion
(kJ/kg)
Thermal
conductivity
(W/m K) Source
RT 20 Paraffin 22 172 0.88 Rubitherm
GmbH
Climsel C23 Salt hydrate 23 148 – Climator
E23 Salt hydrate 23 155 0.43 EPS Ltd
Climsel C24 Salt hydrate 24 108 1.48 Climator
TH 24 Salt hydrate 24 45.5 0.8 TEAP
RT 26 Paraffin 25 131 0.88 Rubitherm
GmbH
RT25 Paraffin 26 232 – Rubitherm
GmbH
STL 27 Salt hydrate 27 213 1.09 Mitsubishi
Chemical
S27 Salt hydrate 27 207 – Cristopia
AC 27 Salt hydrate 27 207 1.47 Cristopia
RT 27 Paraffin 28 179 0.87 Rubitherm
GmbH
RT 30 Paraffin 28 206 – Rubitherm
GmbH
E28 Salt hydrate 28 193 0.21 EPS Ltd
Latent heat thermal storage systems (using phase change materials) employed for
home and office heating purposes offer huge benefits and opportunities for reducing
cost and CO2 emissions by buildings, enhancing building ability to stabilize and
maintain steady internal temperature conditions (Turnpenny et al, 2000 and 2001;
Halford & Boehm, 2007; Heim & Clarke, 2004). Acting as heat resistors and
entrapment, they store up heat that would have ordinarily been wasted for later use
during periods of high heating demand. This can help smoothen out energy demand
peaks and reduce overall heating energy demand. According to (Arteconi, et al., 2012)
phase change energy storage is capable of ensuring energy security, efficiency and
environmental quality.

Impact of Phase Change materials - Agbanigo Sept., 2012
10
1.0.5 Domestic Energy Consumption
Energy is used in the home for a variety of purposes from food preparation and
preservation to entertainment and environment control. It is reported that buildings
consume around 40% of the total energy produced and between 42% (Henze, 2005)
and 60% (Wyse, 2011) of this is used for indoor environment control. In the UK, 30%
of total energy is utilised in the domestic sector with 83% employed for heating and
cooling purposes (Boardman, et al., 2005).
Domestic heating in the UK is done mostly with gas fired boilers. Crozier-Cole &
Gareth (2002) reported that about 18 million units are fitted into UK homes,
representing about 68% of residential properties in the UK (Kane & Newborough,
2006).
In spite of their high efficiencies gas fired boilers are still a major contributor to
global CO2 emissions because they burn fossil fuels. Mounting global cry for
reduction in CO2 emission and the looming end to fossil fuel availability, coupled
with environmental considerations and strict emission restrictions, has led to research
into alternative renewable sources of energy, especially in the residential sector,
because they have the potential to reduce residential emission of pollutants and CO2
attributed to electricity and heating. It has also prompted many countries to put in
place policies and incentives aimed at encouraging deployment of renewable energy
technology systems (International Energy Agency, 2002).
This type of heating system (gas fired boilers) has more or less reached its peak in
terms of performance and efficiencies, which is close to 100% (Barbieri, et al., 2011),
a reason Kane & Newborough (2006) and De Paepe, et al (2006) infer is responsible
for move of research efforts at achieving more carbon savings and CO2 emission
reductions into co-generation and micro-CHP systems for domestic application as
well as heat pumps for domestic heating (White, 2009). After all, very, little
improvements can be made, especially to the efficiency, by further research work.

Impact of Phase Change materials - Agbanigo Sept., 2012
11
1.0.6 Heat Pumps
Heat pumps have been identified as strong contender for reducing carbon emissions in
the UK domestic energy sector (Singh, et al., 2010). They are considered as having
the greatest potential for reducing domestic heating and power CO2 emissions
(Cockroft & Kelly, 2006), with capability, also, for reducing overall primary energy
consumption and is one of the products promoted under the EU Ecolabel scheme with
potential to reduce negative environmental impact (European Union (EU), 2010). This
is primarily due to their durability, long useful service life (like normal refrigerators)
and potential for financial gains and reduced cost savings from using the technology
for heating in comparison to conventional domestic heating systems. A further
reduction would be possible, also, if any excess produced during periods of low heat
demand can be stored and utilised to make up during periods of high demand.
Heat pumps are basically refrigerators with the heat absorbing part (evaporator)
located outside and the heat emitting (condenser) part located indoor. In a typical
refrigerator a compressor works on a substance, the refrigerant, and causes it to
remove, extract, absorb heat from food and other stuffs kept in the compartment and
to give out this heat at the back (or at the sides in some cases) outside of the
box/compartment. A heat pump has the same components and works in the same way
except that heat removal is from the outside of the house, the house acting as the
refrigerator box or compartment. Heat is now rejected into the house (box or
compartment). Simply put, the system removes heat energy from the low temperature
outdoor and delivers heat at a higher temperature to the indoor whose temperature is
also high.
There are different types of refrigeration systems employed for domestic heating. The
common type is the vapour compression refrigeration system that operates on the
simple saturated vapour compression cycle. It utilises a mechanical compressor to
compress the refrigerant vapour leaving the evaporator, thereby increasing its
temperature and pressure, and driving it round the system: to the condenser where it
rejects heat as it condenses, changing from vapour (gas) to liquid, to the expansion

Impact of Phase Change materials - Agbanigo Sept., 2012
12
devise where it expands from high pressure to low pressure, the temperature also
changing from high to low, to the evaporator where it absorbs heat as it evaporates
changing from vapour (gas) to liquid and back to the compressor for the process to be
repeated. The compressor requires energy to drive it, usually obtained from the grid or
a prime mover, as the case may be.
Another type, the vapour absorption refrigeration system, utilises what is sometimes
referred to as a thermal compressor. There is no mechanical compression of
refrigerant. Rather a substance that has high affinity for the refrigerant, a strong
carrier, is employed to absorb refrigerant vapour from the evaporator. A solution
pump drives this strong refrigerant-carrier solution through a secondary circuit
embedded between the evaporator and condenser. The secondary circuit is open to the
primary circuit through an absorber, to the evaporator, and generator, to the
condenser. The generator is heated and the heat drives out the refrigerant at high
temperature and pressure from the solution. Refrigerant flows onward to the
condenser while the weak refrigerant-carrier solution returns through a secondary
expander to the absorber where it can absorb more refrigerant and begin another
cycle. The refrigerant proceeds as it does in the vapour compression system, rejecting
heat in the condenser, expanding in the expansion devise and evaporating in the
evaporator. The process/cycle continues with the carrier absorbing refrigerant again in
the absorber and on to through the solution pump.
Refrigeration technology is not new and the system still consumes as much energy
and emits as much CO2 as conventional refrigerators (vapour compression) because it
also runs on electricity. Its application (heat pump) as an energy saving (or renewable
energy) technology however, results from its sourcing input energy (heat) from a
cheap and abundant source (Hepbasli & Kalinci, 2009) and, more importantly, the
amount of total energy (heat) rejected (or delivered to demand) compared to energy
consumed for the purpose, its ‘thermal’ efficiency or Coefficient of Performance
(COP). The ratio is usually greater than 100% (sometime up to 200%); implying that
more energy is produced than is consumed, producing more heat for the same quantity
of energy consumed in comparison to gas fired (or electric) boilers (Kim, et al., 2004).

Impact of Phase Change materials - Agbanigo Sept., 2012
13
Although an increase in deployment of heat pumps could be regarded as adding more
electrical load to the network, the greater than 100% efficiency is an indication of a
lower overall energy load.
The vapour compression system is the most widely utilised for domestic applications.
This can be further sub-divided into two types according to and named by where heat
is removed or absorbed (the same categorisation is possible for vapour absorption
systems).
1.0.7 Air Source Heat Pump (ASHP)
As the name implies it sources or absorbs heat from outside/atmospheric air.
Installation is quite easy and simple. It consists of two units, outdoor unit consisting
of the expander, evaporator and compressor and located outdoors and the indoor unit,
the condenser, located indoors. The indoor unit can be inconspicuous but the outdoor
unit occupies a rather conspicuous location on the building side.
Figure 1.1 Arrangement of components of an Air Source Heat Pump
(REUK.co.uk, 2012)
Fans or blowers blow air over the evaporator from which the refrigerant absorbs heat.
The condenser may be arranged to heat water in a hot water storage tank or simply

Impact of Phase Change materials - Agbanigo Sept., 2012
14
provided with a fan or blower to blow air over it, which is transferred through vents
round the house. They can also be placed or installed under floor slabs to provide
under floor heating.
Performance of heat pumps, and efficiency, is dependent on heat supply temperature,
refrigerant used and more importantly on evaporator temperature (Kara, et al., 2008),
which is influenced/affected by atmospheric air temperature and weather conditions,
and decreases as air temperature drops. System efficiency, and effectiveness, for air
source heat pump can decrease below 100% during very cold seasons like winter. The
evaporator may freeze up if atmospheric temperatures fall to and below 5oC.
They are relatively easy to install, and require little maintenance but often regarded as
noisy. Although the hum of the compressor and fan/blower is quite noticeable, noise
levels from air source heat pumps are still below 56 decibels (Building Performance
Centre, 2011).
Figure 1.2 Air Source Heat Pump (Pro Enviro Limited, 2012)

Impact of Phase Change materials - Agbanigo Sept., 2012
15
1.0.8 Ground Source heat Pumps (GSHP)
This type of heat pump absorbs heat from the ground, using the earth as heat source.
They are sometimes referred to as Geothermal Heat Pumps. It employs loops of pipes
buried in the ground to extract heat from same. The entire system, except the
evaporators, is located indoors. The condenser, similar to air source heat pumps, can
be arranged to heat water, provided with a fan/blower to circulate warm air round the
house or installed in floor slabs for under floor heating.
The absence of a second blower for the evaporator means lower energy consumption
for this type of heat pump, and compressor power requirement is quite low due to the
moderate evaporating temperature the system is designed to operate in compared to
air source heat pumps. Also, because the compressor is located indoors, the types used
are designed to produce low noise levels.
Its performance is not so heavily impacted by weather conditions as ground
temperatures are relatively stable, slightly varying with air temperature with a lag that
is depth dependent, so that greater depths see less variation (Jenkins, et al., 2009).
Notwithstanding, it is able to function at relatively high efficiencies even in mid
winter, offering potential for a higher coefficient of performance (COP) compared to
air source heat pumps (White, 2009). But its performance can also reduce
tremendously in very severe, cold winter when the ground freezes.
A major drawback for this type of heat pump is the difficulty of achieving excellent
thermal contact between evaporator and the ground due to irregular shaped stones and
rocks underground and the relatively high cost of installation with the ground coil
alone taking up between 30% and 50% of total cost (Building Research Establishment
Sustainable Energy Centre, 2009). Also sufficient space required for installing it is
usually not always available and the cost of drilling boreholes in the absence of large
expanse of land is relatively high.

Impact of Phase Change materials - Agbanigo Sept., 2012
16
a b
c
Figure 1.3 Ground Source Heat Pumps showing different configurations of
evaporator underground – a) vertical loop (South West Energy Services
Limited, 2012), b) horizontal loop (Carbon Zero, UK, 2011) and c)
spiral loop (Sunray Solar Limited, 2011)
Although heat pumps produce (or supply) more energy (heat) than is consumed,
implying reduced energy demand, they still suffer from some imperfections and
produce some wastes. Boait et al (2011) suggest underloading as one of the reasons
for low efficiency of heat pumps, particularly in the UK. Most times they are run
continuously, installers’ recommecdations being the reason given by home owners for
this (Boait, et al., 2011).
According to Izquierdo-Barrientos et al (2012), Muruganantham et al (2010) and
Hong et al (2012), opportunities abound in operation of heat pumps heating systems
for energy and cost savings, as well as electrical network stabilisation by both
manipulation of operation period/time for back shifting from peak to off-peak periods
and application of thermal buffering. However, manipulation of demand is also
important, according to Wyse (2011), to ensuring steady and reliable energy supply.

Impact of Phase Change materials - Agbanigo Sept., 2012
17
As suggested by Arteconi et al (2012), “thermal energy storage can be used for
electrical loads management if coupled with electrically driven heating and cooling
systems” like heat pumps (vapour compression systems) as a means of flattening the
load profile, smoothening out demand fluctuations, thereby reducing
operation/running time/period and resulting in further reduction in cost and energy,
and imposed load on electricity networks.
This forms the basis for this research work, to investigate possibilities of saving
energy and cost by manipulating start and stop time of a heat pump heating system
employed for space and water heating and incorporating a phase change heat storage
materials into the system.

Impact of Phase Change materials - Agbanigo Sept., 2012
18
1.1 Aims, Objectives and Scope
1.1.1 Aim
To assess ability of PCM to improve effectiveness of renewable energy technology
and to effect reduction in energy cost.
1.1.2 Objectives
1) Review state of the art of PCMs and applications for domestic thermal energy
storage
2) Review renewable energy systems for domestic application to assess
application and deployment PCMs incorporated into the systems
3) Using an integrated model for a house/dwelling employing air source heat
pump heating system with phase change material integration, test effectiveness
of system with and without phase change material.
1.1.3 Scope
The scope of this work entails assessing the impact of phase change materials on
improving performance of air source heat pump supplying heat to a 2-storey detached
UK house with average insulation, using ESP-r simulation software to simulate
models of the building and its energy systems.

Impact of Phase Change materials - Agbanigo Sept., 2012
19
2 Literature Review
2.1 Peamble
The survey of literatures examines works on renewable energy sysyems deployment
and application for carbon emission redunction and energy and cost savings
undertaken with application of both experimental and theoretical methods. The
literatures cut across micro-generation and heat pump applcation and comparisons of
different types of technologies for domestic application, and implemtation of various
control strategies.
2.2 Renewablenergy systems
Roselli et al, (2011) reported on the energy production and economic and
environmental implications of deploying small scale cogeneration systems which they
propose as one of the option for introduction of more efficient technologies into the
energy sector for achieving the 2020 renewable and emission targets set by the EU.
One of the advantages of small scale cogeneration systems for power generation,
according to them (Roselli, et al., 2011), is the avoidance of network loses
experienced with large centralised power stations.
They reported that a variety of small single family to medium commercial units
driven by reciprocating internal combustion engines and capable of supplying
between 1.0 – 10kW electric power and 2.0 – 26kW thermal power are available in
the market and are being deployed while the sterling engine prime mover types are yet
to be developed commercially. They compared a number of sample systems with
conventional gas-fired boiler system supplying heat and power plant system that
supplies electricity. They found and concluded that net primary energy savings and
CO2 reductions were possible with reciprocating internal combustion engine based
micro-cogeneration systems.

Impact of Phase Change materials - Agbanigo Sept., 2012
20
In the same vein, Peacock & Newborough (2005) investigated practical application of
different prime-mover specification and control strategy for Stirling engine and Fuel
cell based CHP for annual energy and CO2 emission estimation for single dwellings in
the UK by employing detailed minute by minute electricity and gas consumption data
for a period of 1 year. In their study, they analysed contributions to thermal and
electrical demand of test residential apartments met by Stirling engine micro-CHP and
Fuel cell micro-CHP, as well as electrical export to the grid, employing different
control strategies - unrestricted thermal surplus, restricted thermal surplus, restricted
thermal surplus but part-load and unrestricted thermal surplus. They found that
running the system under restricted thermal surplus strategy produced the best results
- CO2 reduction above 2.5kg/day in winter and between £90 and £99 total savings.
Unrestricted thermal surplus strategy produces more heat than can be stored by the
conventional thermal store available in the test residents leading to a smaller total
savings, £52, and even more CO2 emissions than non-CHP base case. While running
under restricted thermal surplus but part load strategy reduces amount of thermal
surplus (and wastages) produced, it also reduces the proportion of electrical and
heating demand met by system and amount exported to the grid. But it increases
number of switching events, which affects durability of system negatively. Total
savings in the case was £90. Running under restricted thermal surplus strategy (full
load), however, supplied a significant proportion of both thermal and electrical
demand, with high electrical export but higher surplus thermal energy, especially
during summer, and gave a total savings of £99.
They concluded from their findings that thermal requirements of the dwellings were
better matched by applying the restricted thermal surplus but part load strategy,
however, CO2 reduction is smaller than that obtained with the restricted thermal
surplus (full load) case.
An implication of this would be that storage of the excess thermal energy produced,
for example during summer, to offset thermal deficit at other periods could improve
upon total savings and CO2 emissions.

Impact of Phase Change materials - Agbanigo Sept., 2012
21
2.3 Energy Storage and Phase Change Materials
The possibility of energy savings from storing exsess energy was investigated by
Heim & Clarke (2004) who developed a phase change materials (PCMs) model and
incorporated into ESP-r by adding effect of phase change transition to the energy
balance equations. Employing special materials concept used in ESP-r to model active
building elements, they introduced thermo-physical properties of the Gypsum PCM as
special material properties used for the modelling. This allows homogeneous
treatment of the properties which vary with temperature.
They conducted numerical simulations for a multi-zone passive solar building with
high glazing and natural ventilation, and employed PCM impregnated gypsum plaster
board for internal room lining. They compared with a similar building model but
without PCM impregnated plaster board walls. Analysis of results reveals that
incorporation of PCM resulted in effective reduction of heating energy demand during
the heating period/seasons. They concluded that the relatively small difference in
resultant room temperatures was due to the small latent heat of the PCM and thinness
of the walls. The findings however showed the potential of PCM to impart and
stabilize internal temperatures and to store energy for use later during the heating
season and reduce heating energy demands.
In a report by Halford & Boehm (2007) studies on a strategy to shift air conditioning
load away from peak period using encapsulated PCM installed within wall (or ceiling)
insulation was described.
They developed a model in which the phase change temperature and latent heat are
treated as parametric properties. They modelled the ceilings and walls as three-layer
plane wall with the PCM sandwiched between two insulations. Independent variation
to the thickness of each layer is possible to enable creation of different configurations.
Two different baseline conditions were established for comparisons with case with
PCM impregnated walls to permit identification of the various components of PCM
load shifts: ‘mass but no phase change’ and ‘insulation only’.

Impact of Phase Change materials - Agbanigo Sept., 2012
22
Their findings show maximum peak load reduction of between 11% and 25% for
comparison with ‘mass but no phase change’ case and between 19% and 57% load
reduction for comparison with ‘insulation only’ case. Their results also show that
changes in mean ambient temperature imparts the optimal position of the phase
transition layer relative to the inside wall, suggesting a relationship between
performance and off-peak re-solidification of PCM.
Also, Izquierdo-Barrientos et al (2012) conducted a study on effect of embeding PCM
in external walls of building with the use of a one-dimensional transient heat transfer
model.
Three scenarios/configurations were considered due to the effect of the PCM on wall
thermal behaviour, with, (1) PCM placed interior to the insulator, (2) exterior to
insulator and the third has the insulator replaced by PCM. Because the PCM layer
added resistance to heat flow and to be able to make proper comparisons, a base case
model with an additional layer whose properties are similar to that of the PCM layer
in a solid state was introduced.
Employing different wall configurations wherein the location of PCM within wall is
varied as well as phase transition temperatures, and also varying wall orientation, they
ran numerical simulations, using finite difference technique, for two different time
periods covering 6 winter and 6 summer days.
They observed that there was no significant effect on heat losses during the winter
simulation periods for all the various conditions but large differences were observed
during the summer periods. This they attributed to high radiant fluxes during summer.
They also observed that inclusion of PCM in the external walls further increased the
thermal inertia of the walls, which led to increased thermal load during the day and
reduced load during the night.
They concluded finally that although total heat gained or lost was not significantly
affected, proper selection of PCM is capable of reducing maximum amplitude of
instantaneous heat fluxes in and out of buildings and thereby reduce energy

Impact of Phase Change materials - Agbanigo Sept., 2012
23
requirements for HVAC systems. Their work demonstrates the ability of phase change
materials to act as heat resistors and entrapment, enhancing building ability to
maintain steady internal temperature conditions.
Turnpenny et al (2000 and 2001) in two different reports described the design,
construction and testing of a cooling system that incorporates heat pipes embedded
into a phase change material (PCM). They employed one dimensional mathematical
heat transfer model for sizing the units.
An average sized room in an existing building with a large south-facing window that
receives considerable solar gains in the summer was used for the experiment. They
reported that the room had to be partitioned to bring the size down to 16 m2 of floor
area. Heat pipes with longitudinal fins along one end and inserted (the finned end)
into PCM to make single units were arranged in a circle and mounted close to the
ceiling below a ceiling fan located at the centre of the experimental study room The
fan blows air downwards over the heat pipes. Extractor fans draw cool air during the
night, guided through the room and over the heat pipes to remove heat absorbed by
PCM during the day.
Result analysis reveal heat transfer rates of between 80 and 200 W per unit, sufficient
to absorb solar heat gains and prevent room temperature from rising to uncomfortable
levels. They did a comparison of their results with previous works on alternative
cooling systems and conventional air conditioning system and concluded that a latent
heat storage system offers better benefits in terms of reducing cost and CO2
emissions.
The effect of integrating thermal energy storage device into a domestic space heating
system employing a solar heater assisted heat pump by a using two non-linear partial
differential equations, one for material storage temperature and the other for the heat
transfer fluid, for its modelling was similarly evaluated by Badescu (2003).

Impact of Phase Change materials - Agbanigo Sept., 2012
24
Thermal energy storage system was employed for storing heat from the solar heater,
which is subsequently delivered to the evaporator of a vapour compression heat
pump.
They reported that heat supply to the heat pump evaporator was rapid for thermal
energy storage (TES) with smaller mass (quantity).This, they reported, was due to
rapid increase in temperature as a result of heat saturation of the small amount of
storage material. They conclude that this was a disadvantage with the use of small
amount of material for large quantities of heat, because ‘the amount of stored energy
is smaller than for more massive units’ (Badescu, 2003).
In a study by Muruganantham et al (2010), impact of a new class of organic based
phase change material, BioPCM, manufactured by Phase Change Energy Solutions
(PCES) Incorporated, on energy consumption, peak load shifting and energy savings
was evaluated. They constructed two similar sheds with one having the BioPCM
embedded in the walls, ceiling and floor and tested, over a year, in Phoenix Arizona.
Both sheds had total thermal resistance of 13.49oC/W (with PCM) and 13.33
oC/W
(without PCM). They commented that a thermal resistance difference of 1% was not
sufficient enough to interfere with or affect results and findings.
Results show differences in energy consumption between 9% and 29.25%, with the
largest difference, 29.25% occurring in November, as well as shifts in peak power
consumption. This occurred only in the summer months, with maximum of 60
minutes occurring in June. They attributed the lack of shift of peak load in the other
(season) months to insufficient time for PCM to change phase as a result of short
sunlight hours. They reported that this was also responsible for energy savings,
especially in winter. The incomplete melting and solidification of the PCM allowed it
exhibit its highest thermal capacity, implying that it was able to prevent and reduce
heat from flow across it from and to the interior. Heat stored was also available for the
evening and night periods. They also reported a cost saving of 30%.

Impact of Phase Change materials - Agbanigo Sept., 2012
25
Similar to the findings of Izquierdo-Barrientos et al (2012), these results show
capability of PCMs to trap heat and enhance building ability to maitain steady internal
temperatures. It also shows clearly, possibility of energy and cost savings by proper
control strategy.
2.4 Energy Demand/Load shifting and Control
Hong, et al., (2012) assessed the possibilities of manipulation start and stop times for
a heat pump for better electricity network management. Using ESP-r to model two
types of buildings with each having two variants of thermal fabrics representing
present UK housing standard and passive house standards, both heated by air source
heat pumps, they ran simulations, altering the start times of the heat pumps, adjusting
zones and hot water temperature set points and adding two types of thermal buffering.
Result analysis reveals, for the current building standard fabric, advance times of
between 1.5 and 2.5hrs for both before zone resultant and hot water temperatures
dropped below 18 and 40oC respectively. They reported that the buffering did little to
increase advancement time. Maximum obtained was 2.5hrs, and this resulted in
increasing heat pump energy consumption by 37%. There was little improvement in
advance time for the passive house standard fabric simulation but a significant
reduction in energy consumption of about 76%.
They observed that increasing zone and hot water temperatures also did not improve
on advance time; rather it increased energy consumption by between 30 and 70%, the
latter being for the passive house standard fabric.
They reported a maximum advance time of 6 hours after introducing
additional/supplemental heating to boost hot water temperatures to 60oC. This
resulted in an energy increase of 70%.

Impact of Phase Change materials - Agbanigo Sept., 2012
26
They concluded that to obtain an operating time/period shift sufficient to effect a
flattening of peak electricity consumption would only be possible with improved
thermal insulation and buffering.
They observed that CO2 emission reductions and primary energy savings due to
micro-CHP deployment depended on reduction in total electricity consumption and
hence on proportion met by micro-CHP and that imported from the grid. They
concluded that these are better achieved by operating the systems to satisfy heating
demands.
Similarly, Boait et al (2011) conducted a study to investigate how appropriate control
regimes can improve performance and coefficient of performance of heat pumps as
well as increase energy savings in dwellings. They modelled a building and heat
pump combined and validated with a number of pre 1980 houses in Harrogate
Borough council, Yorkshire.
The houses, they reported, have been upgraded with cavity-wall insulation, double-
glazing and additional loft insulation fitted with ground source heat pumps used for
space and water heating. They also reported that all the heat pumps run continuously,
being a manufacturer’s recommendation. This, they concluded, allows opportunities
for energy savings to be missed and suggested a need for a control system capable of
determining suitable setback periods and implementing it, as well as possible
implementation procedures.
2.5 Heat Pump Heating Systems
Employing procedure set out in directive 2007/742/EC of the European Parliament,
Fernández-Seara et al (2012) did an evaluation of system and main components
performance of a ground source heat pump investigated by using a water-glycol
heater as ground source for the evaporator and a condensing section cooling water
loop for demand.

Impact of Phase Change materials - Agbanigo Sept., 2012
27
The condensing section consisted of two series connected heat exchangers, one
serving to cool refrigerant from superheat temperature to condensing temperature (the
‘desuperheater’) and connected to the hot water storage tank and the other serving as
condenser and linked to the water loop for space heating. Water and water-glycol flow
were controlled by pumps and mass flow recirculation loops while a 3-way electronic
valve regulates “desuperheater” water flow.
Results show impact of evaporator temperature as well as condenser temperature on
performance and compressor power consumption, COP rising with evaporator
temperature but dropping or reducing with condenser temperature. Power
consumption also increased with both evaporator and condenser temperatures.
Temperature increase from 0 -15oC for evaporator produced 8% increase in power
consumption while cooling water (condenser) temperature increase form 25 – 45oC
caused an increase of 35% in power consumption.
The findings of their research shows the significance of an important factor for
performance and preference for ground source heat pumps over air source heat
pumps, especially for cold temperate regions such as the UK. It also shows a likely
disadvantage in use of heat pumps for high temperature heating, being more effective
at low condensing temperatures.

Impact of Phase Change materials - Agbanigo Sept., 2012
28
3 Methodology
3.1 Model Description
The investigation was carried out using ESP-r software, a building energy modelling
tool for dynamic internal environment modelling and simulation to model a detached 2-
storey detached building employing air source heat pump water heating system and
separated into three zones, living, non-living and loft. The model represents details of
building geometry, fabric materials, occupants and equipment heat gains, air leakages
and heating system. The heating system, comprising an air source heat pump and
domestic hot water storage tank, which has provision for inclusion of phase change
materials, are treated as components and represented by networks. A stratified tank
model is employed for the domestic hot water storage tank.
The modelled building is an average insulation building with total floor area of
139.9m2. It is a 2-storey detached building divided into three zones representative of
the living room and dining, the living zone, the bedrooms, kitchen and toilets, the
non-living zone, and the loft designated as loft in the model. It is heated by an air
source heat pump that provides space and water heating.
The living and non-living zones have an overall areas of 33.9m2 and 106m
2
respectively. Power rating for the air source heat pump is 8kW. It has a base power
consumption of 10W and operates between 65oC and 90
oC, heat in and heat out
temperatures respectively. Its operation is controlled by time actuator according to
on/off time settings and temperature actuator set to cycle on when water temperature
reaches 50oC and cycle off when it reaches 55
oC. Volume of domestic hot water tank
is 0.144 m3.
Heat is removed from heat pump through a primary/main heat exchanger with water
as coolant. This is channelled to wall mounted plate heat exchangers, radiators, to
supply space heating for the zones. It branches off to an immersion heat exchanger
inside the hot water storage tank before reaching the radiators for domestic water

Impact of Phase Change materials - Agbanigo Sept., 2012
29
heating (figure B2). Flow is controlled by two circulation pumps, one to remove water
from heat pump heat exchanger and the other, on the branch off to storage tank, to
circulate water through the tank.
Water return from radiators flows to the heat pump heat exchanger joined by return
from hot water tank immersion heat exchanger. Two 3-way temperature actuated
valves control water flow between flow and return for both storage tank and radiator.
The strategy employed is such that domestic hot water is maintained above 40oC, so
heat supply to the domestic hot water storage tank is given priority.
ESP-r allows adjustments and manipulation of zones and plant and systems
component, composition and controls of occupied periods, occupant and appliance
casual heat gains, system start and stop times, sensor and actuator parameters, as well
as capacity of hot water tank and water draw. The control most germane to this
project is the on/off start/stop set times times for heat pump for manipulation of both
running time/period and duration, and amount of phase change material included in
the domestic hot water storage tank to investigate effect of phase change heat storage
on domestic hot water supply and cost of providing energy for the purpose. Occupied
period set for the simulation is between 8:00 am and 11:00pm (8.00 – 23.00)
UK weather data for 1994 was used for the simulations.
3.2 Experimental Procedure
The heat pump on/off set time controls for the base case model, without PCM, were
adjusted to reduce the running/operation time while keeping start time one hour
before beginning of occupied period and predominantly in the peak period (with one
hour off peak at beginning) for series of simulations to obtain minimum run
time/duration before hot water temperature drops below 40oC for a time duration not
greater than 15% of total occupied period and for which it does not drop below 38oC
for longer than 10% within the 15% of total occupied period.

Impact of Phase Change materials - Agbanigo Sept., 2012
30
15% of occupied period was chosen because it was assumed that this would amount to
2.25 hrs (2 hr 15 min) (15% of 15 hrs of occupied period, 8am – 11pm) during which
the temperature drop is assumed to be almost unnoticeable, if the difference is not
more than 2K, which is the reason for 38oC as the bottom margin temperature.
A further criteria is set for minimum run time/duration for which temperature drop
40oC occurs close to the end of occupied period, 7pm – 11pm (19.00 – 23.00), which
is when hot water consumption rates for most dwellings is expected to decrease,
progressively, toward the end of occupied period (Energy Saving Trust, 2008).
Simulations were repeated for the minimum run time/duration obtained above but
back-shifted away from peak electricity demand period into off peak period. This was
to identify maximum back-shifting time possible before hot water temperature drops
below 40oC, applying the criteria set above.
This minimum run/operation time/duration is used as determinant for the likely
minimum energy consumption and cost of providing sufficient heating for domestic
hot water and set as maximum for testing with inclusion of phase change material.
Using the minimum on/off set time/duration obtained in the procedures above as
maximum, further simulations were run for base case model but with phase change
material incorporated into the domestic hot water storage tank in a series of two-step
procedures. First, on/off set time duration was reduced during the peak period by 2hr
while maintaining the ‘on’ or start set time for the initial base case and shifting the
‘off’ or stop set time backwards by 2 hours. Second, the initial ‘off’ or stop set time is
restored and the ‘on’ or start time is shifted backwards by 2hours. A 2 hr gap is used
because difference is significantly small to be noticed over 1 hour gap.
The twin procedure is repeated for series of reducing on/off set time durations. In so
doing, a fixed, progressively reducing, on/off set time duration is moved or shifted
backwards and forward until entire heat pump operation was reduced to 3hrs and in
the off peak electricity demand period only. Simulations were done for a week in
January for winter, being the coldest season of the year.

Impact of Phase Change materials - Agbanigo Sept., 2012
31
The procedures above were carried out for inclusion of phase change materials into
the domestic hot water tank to make up 12.5%, 25% and 37.5% of its volume. Only
whole units PCM can be utilised because it is encapsulated. Unit volume is 0.003m3,
while diameter and length are 0.088m and 0.4932m respectively.6 units therefore
make up 12.5% of volume of domestic hot water storage tank, 12 units, 25% and 18
units 37.5%. Also, since the PCM models are set to occupy the upper part of the tank
18 units seem the highest that can be incorporated into the tank to avoid the risk of
having too little water in the upper part of the tank. The phase change temperature is
set at 41.5oC.
The results are analysed for effect on hot water temperatures, actual heat pump
operating time and energy consumption, and cost estimate for running system to
provide heating.
The result analysis did not focus much attention on zone temperatures because of the
difficulty of keeping them up even for 15 hour run/operation time/duration for heat
pump. This is due primarily to the sample accommodation being of average
insulation. Heat loss through building fabric is relatively high, so attention was
focused on domestic hot water.
Cost of electricity for powering heat pump was determined from minute by minute
real power consumption taken over the entire simulation week and averaged to obtain
average daily cost. Average peak and off peak energy rates for economy 7 electricity
tariffs, obtained from EDF Energy (2010), that is 11.57p/kWh and 4.86p/kWh
respectively, are utilised in the equations below:

Impact of Phase Change materials - Agbanigo Sept., 2012
32
= peak energy cost (p/kWh)
= off peak energy cost (p/kWh)
= minute energy consumption (kW/min)
= peak energy cost per minute (p/min)
= off peak energy cost per minute (p/min)
= average energy cost per minute (p/min)
= energy cost per day (p/day)
= total data over simulation period
Actual operating time and energy consumption for heat pump were obtained from the
simulation plant results and averaged over the simulation week/period.
While running simulations for these specific on/off set times: 1-8, 1-10, 3-10 and 5-8
all for 12.5%PCM, and 3-10 for 37.5% PCM ESP-r encountered some errors and
problem with the model which made results obtained for them unreliable They have
been excluded from the result analysis and are the blanks in the results table of
appendix A and gaps in some of the result charts.
It is believed that the results and data obtained from simulations of other on/off set
times are sufficient enough to make valid conclusions without these erroneous results.

Impact of Phase Change materials - Agbanigo Sept., 2012
33
4 Result Analysis and Discussion
4.1 Base case
Simulations for the base case model (without PCM) with reducing on/off set time
duration obtained a 7 hours reduction possibility (figure 1). Hot water temperature
remained above 40oC for approximately 85% of the entire occupied period, averaged
over the week-long simulation period, and below 40oC for exactly 14.53%. It also
remained above 38oC for 8.44% of period. Figure 4.1 shows the hot water temperature
profile for the 7 hour reduced operating period (7 – 16).
The gully in day 6 of hot water temperature profile for simulation week (fig 4.1
above) is due to high hot water draw in the middle of the night (between 12am
and1am) when heat pump was off and there was no heating (fig 4.2). This is
10
15
20
25
30
35
40
45
00
h0
1
06
h0
0
12
h0
0
18
h0
0
00
h0
1
06
h0
0
12
h0
0
18
h0
0
00
h0
1
06
h0
0
12
h0
0
18
h0
0
00
h0
1
06
h0
0
12
h0
0
18
h0
0
00
h0
1
06
h0
0
12
h0
0
18
h0
0
00
h0
1
06
h0
0
12
h0
0
18
h0
0
00
h0
1
06
h0
0
12
h0
0
18
h0
0
Tem
per
ature
(d
eg)
Time (hrs)
Fig. 4.1 - DHW temp profile over simulation period for on/off set time 7 - 16 (no PCM)

Impact of Phase Change materials - Agbanigo Sept., 2012
34
significant because it is a determinant, throughout the exercise, of the percentage of
occupied period that the hot water temperature would fall below 40oC.
This on/off set time (7 – 16) gives total on/off set time duration of 9 hours for the heat
pump. Actual operating time is 38.45 hours for the entire simulation week and 5.49
hrs as daily average operating time. This yields 144.2 pence as average daily cost of
energy (144.2 p/day or £1.44/day).
4.2 Effect of Reducing on/off set time Duration
Reducing the on/off time 7am to 4pm (7 – 16) by two hour intervals with 7am
remaining as the ‘on’ or start time, that is, 7 – 14, 7 – 12 and 7 – 10, for durations of
9, 7, 5 and 3 hours, respectively, produced the hot water temperature profiles shown
in figures 4.3 – 4.5.
0
0.02
0.04
0.06
0.08
0.1
0.12
0.14
0.16
0.18
0.2
00
h0
1
06
h0
0
12
h0
0
18
h0
0
00
h0
1
06
h0
0
12
h0
0
18
h0
0
00
h0
1
06
h0
0
12
h0
0
18
h0
0
00
h0
1
06
h0
0
12
h0
0
18
h0
0
00
h0
1
06
h0
0
12
h0
0
18
h0
0
00
h0
1
06
h0
0
12
h0
0
18
h0
0
00
h0
1
06
h0
0
12
h0
0
18
h0
0
Ho
t W
ater
Dra
w (
kg/s
)
Time (min)
Fig. 4.2 - Profile for DHW Draw for on/off set time 7 - 16 (no PCM)

Impact of Phase Change materials - Agbanigo Sept., 2012
35
10
15
20
25
30
35
40
45
00
h0
1
06
h0
0
12
h0
0
18
h0
0
00
h0
1
06
h0
0
12
h0
0
18
h0
0
00
h0
1
06
h0
0
12
h0
0
18
h0
0
00
h0
1
06
h0
0
12
h0
0
18
h0
0
00
h0
1
06
h0
0
12
h0
0
18
h0
0
00
h0
1
06
h0
0
12
h0
0
18
h0
0
00
h0
1
06
h0
0
12
h0
0
18
h0
0
Tem
per
ature
(d
eg)
Time (hrs)
Fig. 4.3 DHW temp profile over simulation period for oon/off set time 7 - 14 (no PCM)
10
15
20
25
30
35
40
45
00
h0
1
06
h0
0
12
h0
0
18
h0
0
00
h0
1
06
h0
0
12
h0
0
18
h0
0
00
h0
1
06
h0
0
12
h0
0
18
h0
0
00
h0
1
06
h0
0
12
h0
0
18
h0
0
00
h0
1
06
h0
0
12
h0
0
18
h0
0
00
h0
1
06
h0
0
12
h0
0
18
h0
0
00
h0
1
06
h0
0
12
h0
0
18
h0
0
Tem
per
ature
(d
eg)
Time (hrs)
Fig 4.4 DHW temp profile over simulation period for on/off set time 7 - 12 (no PCM)

Impact of Phase Change materials - Agbanigo Sept., 2012
36
The effects of these on percentage of occupied period that hot water temperature falls
below 40oC and on actual operating time for heat pump are shown in figures 4.6 and
4.7. As expected, percentage of occupied period that hot water temperature dropped
below 40oC increased from 14.52% for initial case (7 – 16) to 24.92% for on/off set
time 7 – 14, 43.16% for on/off set time 7 – 12 and 63.91 for on/off set time 7 – 10
while average heat pump daily operating time reduced from 5.49hrs for on/off set
time 7 – 16 to 4.45hrs for on/off set time 7 – 14, 3.45hrs for on/off set time 7 – 12 and
2.33hrs for on/off set time 7 - 10.
10
15
20
25
30
35
40
45
00
h0
1
06
h0
0
12
h0
0
18
h0
0
00
h0
1
06
h0
0
12
h0
0
18
h0
0
00
h0
1
06
h0
0
12
h0
0
18
h0
0
00
h0
1
06
h0
0
12
h0
0
18
h0
0
00
h0
1
06
h0
0
12
h0
0
18
h0
0
00
h0
1
06
h0
0
12
h0
0
18
h0
0
00
h0
1
06
h0
0
12
h0
0
18
h0
0
Tem
per
ature
(d
eg)
Time (hrs)
Fig 4.5 DHW temp profile over simulation period for on/off set time 7 - 10 (No PCM)

Impact of Phase Change materials - Agbanigo Sept., 2012
37
0
10
20
30
40
50
60
70
0 2 4 6 8 10
% o
f o
ccup
ied
per
iod
DH
W t
emp
bel
ow
40
deg
Set time duration (hrs)
Fig 4.6 Effect of reducing set time duration (start time at 7am) on % of
occupied period hot water temp < 40 deg
0
1
2
3
4
5
6
0 2 4 6 8 10
Act
ual
hea
t p
um
p o
per
atin
g t
ime
(hrs
/day
)
Set time duration (hrs)
Fig 4.7 Effect of reducing operation set time on actual daiily operating time for heat pump

Impact of Phase Change materials - Agbanigo Sept., 2012
38
4.3 Effect of Back Shifting (no PCM)
The minimum set time duration of 9 hours was back shifted by 2-hour intervals away
from peak period into the off-peak period (note that initial on/off set time used as base
contained one hour of off-peak operation). The on/off set times are 5 – 14, 3 – 12 and
1 – 10. The domestic hot water temperature profile for each on/off set time and effect
on percentage of occupied period that hot water temperature dropped below 40oC and
on actual operating time for heat pump and are shown in figures 4.8 – 4.12.
10
15
20
25
30
35
40
45
00
h0
1
06
h0
0
12
h0
0
18
h0
0
00
h0
1
06
h0
0
12
h0
0
18
h0
0
00
h0
1
06
h0
0
12
h0
0
18
h0
0
00
h0
1
06
h0
0
12
h0
0
18
h0
0
00
h0
1
06
h0
0
12
h0
0
18
h0
0
00
h0
1
06
h0
0
12
h0
0
18
h0
0
00
h0
1
06
h0
0
12
h0
0
18
h0
0
Tem
per
ature
(d
eg)
Time (hrs)
Fig. 4.8 DHW temp profile over simulation period for on/off set time 5 - 14 (no PCM)

Impact of Phase Change materials - Agbanigo Sept., 2012
39
It is pertinent to note that the width of the gully in day 6 of domestic hot water
temperature profile for simulation week reduces as set time is shifted backwards from
10
15
20
25
30
35
40
45
00
h0
1
06
h0
0
12
h0
0
18
h0
0
00
h0
1
06
h0
0
12
h0
0
18
h0
0
00
h0
1
06
h0
0
12
h0
0
18
h0
0
00
h0
1
06
h0
0
12
h0
0
18
h0
0
00
h0
1
06
h0
0
12
h0
0
18
h0
0
00
h0
1
06
h0
0
12
h0
0
18
h0
0
00
h0
1
06
h0
0
12
h0
0
18
h0
0
Tem
per
ature
(d
eg)
Time (hrs)
Fig 4.9 DHW temp profile over simulation period -on/off set time 3 - 12 (no PCM)
10
15
20
25
30
35
40
45
00
h0
1
06
h0
0
12
h0
0
18
h0
0
00
h0
1
06
h0
0
12
h0
0
18
h0
0
00
h0
1
06
h0
0
12
h0
0
18
h0
0
00
h0
1
06
h0
0
12
h0
0
18
h0
0
00
h0
1
06
h0
0
12
h0
0
18
h0
0
00
h0
1
06
h0
0
12
h0
0
18
h0
0
00
h0
1
06
h0
0
12
h0
0
18
h0
0
Tem
per
ature
(d
eg)
Time (hrs)
Fig 4.10 DHW temp profile over simulation period - on/off set time 1 - 10 (no PCM)

Impact of Phase Change materials - Agbanigo Sept., 2012
40
the initial base case and heat pump start time and it draws close to the period of high
hot water draw. It is however not able to cause hot water temperature to stay above
40oC longer because stop time, and heat pump off time is equally shifted backwards
away from the period of high hot water draw. It appears to have a more negative
impact on hot water temperature and actual operating time for the heat pump, as show
in figures 4.11 and 4.12.
0
10
20
30
40
50
60
70
7=16 5=14 3=12 1=10
% o
f o
ccu
pie
d p
erio
d D
HW
tem
p b
elo
w 4
0 d
eg
Set time
Fig 4.11 Effect of bach shifting set time duration on % of occupied period DHW
temp < 40 deg (no PCM)

Impact of Phase Change materials - Agbanigo Sept., 2012
41
Percentage of occupied period with hot water temperatures below 40oC increases
from 14.52% to 24.22%, 39.35% and 59.29% for on/off set times 7 – 16, 5 – 14, 3 –
12 and 1 – 10 respectively. As shown in figure 4.12, the heat pump is working more,
due to its starting earlier in the mornings and into the night when temperatures are still
relatively low. The implication being that the system is experiencing more heat loss
and energy wastage.
4.4 Effect of Back Shifting with PCM
Back shifting from on/off set time 7 – 16 to 5 – 14 without PCM resulted in hot water
temperature dropping below 40oC for 24.22% of occupied period and below 38
oC for
14.13%. With this as starting point for test case models, incorporating phase change
materials, a comparison is made with the same on/off set times of 5 – 14, 3 – 12 and 1
– 10 with proportion of PCM to DHW tank volume of 12.5%, 25% and 37.5% for
each set time. Temperature profiles for the domestic hot water temperature for each of
the set times and percentage of PCM are shown in figures 4.13 – 4.20
5.35
5.4
5.45
5.5
5.55
5.6
5.65
5.7
7=16 5=14 3=12 1=10
Act
ual
Hea
t p
um
p o
per
atin
g
tim
e
(hrs
/day
)
Set time
Fig 4.12 Effect of bach shifting set time duration actual heat pump operating time
(no PCM)

Impact of Phase Change materials - Agbanigo Sept., 2012
42
10
15
20
25
30
35
40
45
00
h0
1
06
h0
0
12
h0
0
18
h0
0
00
h0
1
06
h0
0
12
h0
0
18
h0
0
00
h0
1
06
h0
0
12
h0
0
18
h0
0
00
h0
1
06
h0
0
12
h0
0
18
h0
0
00
h0
1
06
h0
0
12
h0
0
18
h0
0
00
h0
1
06
h0
0
12
h0
0
18
h0
0
00
h0
1
06
h0
0
12
h0
0
18
h0
0
Tem
per
ature
(d
eg)
Time (hrs)
Fig 4.13 DHW temp profile over simulation period (5 - 14 , 12.5% PCM)
10
15
20
25
30
35
40
45
00
h0
1
06
h0
0
12
h0
0
18
h0
0
00
h0
1
06
h0
0
12
h0
0
18
h0
0
00
h0
1
06
h0
0
12
h0
0
18
h0
0
00
h0
1
06
h0
0
12
h0
0
18
h0
0
00
h0
1
06
h0
0
12
h0
0
18
h0
0
00
h0
1
06
h0
0
12
h0
0
18
h0
0
00
h0
1
06
h0
0
12
h0
0
18
h0
0
Tem
per
ature
(d
eg)
Time (hrs)
Fig 4.14 DHW and Buffer tank water temp profile over simulation period (5 - 14,
25% PCM)
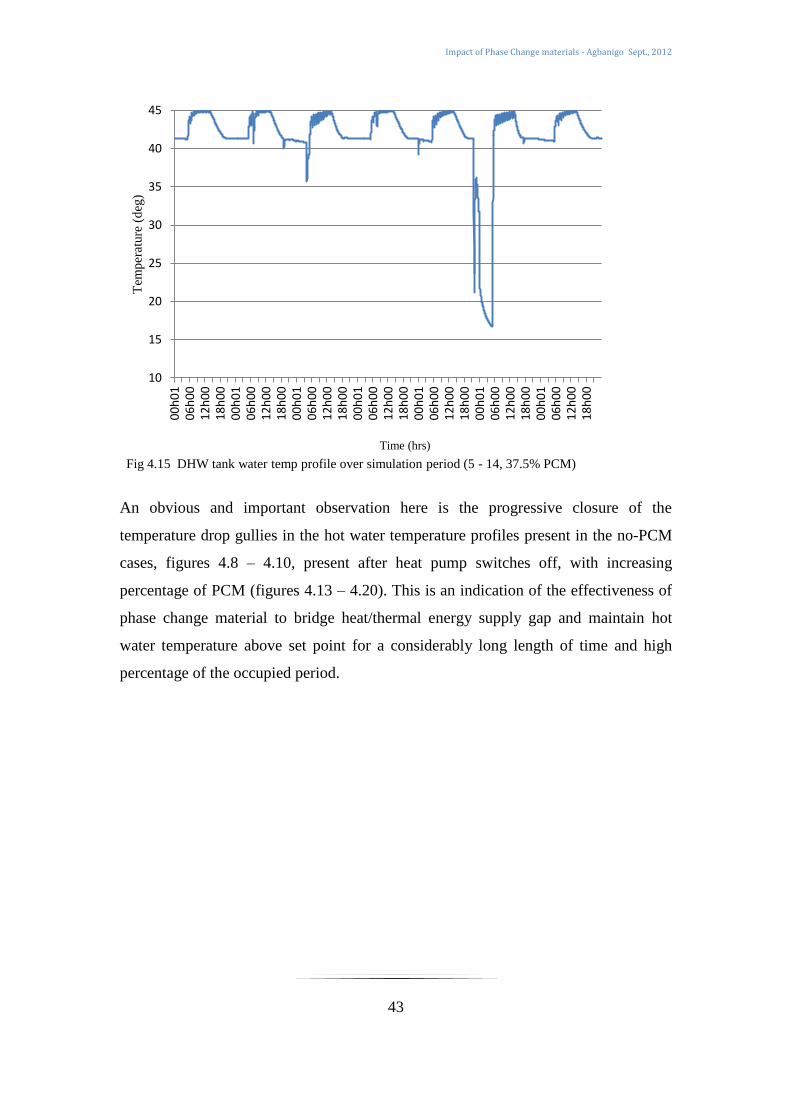
Impact of Phase Change materials - Agbanigo Sept., 2012
43
An obvious and important observation here is the progressive closure of the
temperature drop gullies in the hot water temperature profiles present in the no-PCM
cases, figures 4.8 – 4.10, present after heat pump switches off, with increasing
percentage of PCM (figures 4.13 – 4.20). This is an indication of the effectiveness of
phase change material to bridge heat/thermal energy supply gap and maintain hot
water temperature above set point for a considerably long length of time and high
percentage of the occupied period.
10
15
20
25
30
35
40
45
00
h0
1
06
h0
0
12
h0
0
18
h0
0
00
h0
1
06
h0
0
12
h0
0
18
h0
0
00
h0
1
06
h0
0
12
h0
0
18
h0
0
00
h0
1
06
h0
0
12
h0
0
18
h0
0
00
h0
1
06
h0
0
12
h0
0
18
h0
0
00
h0
1
06
h0
0
12
h0
0
18
h0
0
00
h0
1
06
h0
0
12
h0
0
18
h0
0
Tem
per
ature
(d
eg)
Time (hrs)
Fig 4.15 DHW tank water temp profile over simulation period (5 - 14, 37.5% PCM)

Impact of Phase Change materials - Agbanigo Sept., 2012
44
10
15
20
25
30
35
40
45
00
h0
1
06
h0
0
12
h0
0
18
h0
0
00
h0
1
06
h0
0
12
h0
0
18
h0
0
00
h0
1
06
h0
0
12
h0
0
18
h0
0
00
h0
1
06
h0
0
12
h0
0
18
h0
0
00
h0
1
06
h0
0
12
h0
0
18
h0
0
00
h0
1
06
h0
0
12
h0
0
18
h0
0
00
h0
1
06
h0
0
12
h0
0
18
h0
0
Tem
per
ature
(d
eg)
Time (hrs)
Fig. 4.16 DHW tank water temp profile over simulation period (3 - 12, 12.5% PCM)
10
15
20
25
30
35
40
45
00
h0
1
06
h0
0
12
h0
0
18
h0
0
00
h0
1
06
h0
0
12
h0
0
18
h0
0
00
h0
1
06
h0
0
12
h0
0
18
h0
0
00
h0
1
06
h0
0
12
h0
0
18
h0
0
00
h0
1
06
h0
0
12
h0
0
18
h0
0
00
h0
1
06
h0
0
12
h0
0
18
h0
0
00
h0
1
06
h0
0
12
h0
0
18
h0
0
Tem
per
ature
(d
eg)
Time (hrs)
Fig 4.17 DHW tank water temp profile over simulation period (3 - 12, 25% PCM)

Impact of Phase Change materials - Agbanigo Sept., 2012
45
A similar trend as with the no –PCM base case of gradual reduction of width of the
gully in day 6 of hot water temperature profile for simulation week is observable. The
reduction in these cases, have a positive effect on percentage of occupied period that
hot water remained above 40oC, (figure 4.22). With PCM extending heat availability
beyond the off time of heat pump slope of temperature drop is much gentler, almost
horizontal, and sufficient to keep hot water temperatures up till heat pump’s next ‘on’
or start time.
10
15
20
25
30
35
40
45
00
h0
1
06
h0
0
12
h0
0
18
h0
0
00
h0
1
06
h0
0
12
h0
0
18
h0
0
00
h0
1
06
h0
0
12
h0
0
18
h0
0
00
h0
1
06
h0
0
12
h0
0
18
h0
0
00
h0
1
06
h0
0
12
h0
0
18
h0
0
00
h0
1
06
h0
0
12
h0
0
18
h0
0
00
h0
1
06
h0
0
12
h0
0
18
h0
0
Tem
per
ature
(d
eg)
Time (hrs)
Fig 4.18 DHW tank water temp profile over simulation period (3 - 12, 37.5% OCM)

Impact of Phase Change materials - Agbanigo Sept., 2012
46
4.5 Comparison between no-PCM and PCM cases (Back Shifting)
Consequence of back shifting on cost of running heat pump, percentage of occupied
period hot water temperature dropped below 40oC, actual operating time for heat
pump and average daily heat pump energy consumption is compared for the base
10
15
20
25
30
35
40
45
00
h0
1
06
h0
0
12
h0
0
18
h0
0
00
h0
1
06
h0
0
12
h0
0
18
h0
0
00
h0
1
06
h0
0
12
h0
0
18
h0
0
00
h0
1
06
h0
0
12
h0
0
18
h0
0
00
h0
1
06
h0
0
12
h0
0
18
h0
0
00
h0
1
06
h0
0
12
h0
0
18
h0
0
00
h0
1
06
h0
0
12
h0
0
18
h0
0
Tem
per
ature
(d
eg)
Time (hrs)
Fig 4.19 DHW tank water temp profile over simulation period (1 - 10, 25% PCM)
10
15
20
25
30
35
40
45
00
h0
1
06
h0
0
12
h0
0
18
h0
0
00
h0
1
06
h0
0
12
h0
0
18
h0
0
00
h0
1
06
h0
0
12
h0
0
18
h0
0
00
h0
1
06
h0
0
12
h0
0
18
h0
0
00
h0
1
06
h0
0
12
h0
0
18
h0
0
00
h0
1
06
h0
0
12
h0
0
18
h0
0
00
h0
1
06
h0
0
12
h0
0
18
h0
0
Tem
per
ature
(d
eg)
Time (hrs)
Fig 4.20 DHW tank water temp profile over simulation period (1 - 10, 37.5% PCM)

Impact of Phase Change materials - Agbanigo Sept., 2012
47
cases (no PCM) and test cases with different proportions of PCM in domestic hot
water tank in figures 4.21 – 4.24.
0
20
40
60
80
100
120
140
160
7=16 5=14 3=12 1=10
Aver
age
Ener
gy C
ost
(p
ence
/day
)
On/off set time
Fig 4.21 Comparison of back shifting effect on energy cost for no-PCM and
different percentage of PCM in DHW tank
no PCM
12.5
25
37.5
0
10
20
30
40
50
60
70
7=16 5=14 3=12 1=10
% o
f o
ccup
ied
tim
e ho
t w
ater
tem
p <
40
deg
On/off set time
Fig 4.22 Comparison of back shifting effect on % of occupied period water temp
< 40 deg for no-PCM and different percentage of PCM in DHW tank
no PCM
12.5
25
37.5

Impact of Phase Change materials - Agbanigo Sept., 2012
48
Maximum percentage of occupied period that hot water temperature dropped below
40oC for the test cases (back shifting constant on/off set time duration) with PCM is
7.77%, occurring for on/off set time of 3 – 12, 12.5% PCM. Average energy cost and
heat pump energy consumption for this set time are 111.4 pence/day and
14.68kWh/day respectively. Compared with 7 – 16 on/off set time for the base case
with no PCM (being the only case with hot water temperature remaining above 40oC
for the assumed proportion of occupied period criteria) (144.2pence/day energy cost
and 13.95kWh/day energy consumption) gives a cost reduction of 32.8 pence daily
average and energy consumption increase of 0.73kWh/day. These amount to a cost
savings of 22.75% daily average but energy consumption increase of 5.23%.
Lowest energy cost obtained for on/off set times that meet the set criteria, is 93.65
pence/day for on/off set time of 1 – 10 and 37.5% PCM. Hot water temperature was
below 40oC for 1.32% of occupied period and daily average actual operating time and
average daily energy consumption for the heat pump are 5.92hrs and 15.04kWh
respectively. Average daily energy cost reduced by 35.06% while average energy
consumption increased by 7.81%.
The on/off set time, 1 – 10, amounts to heat pump working for 7 hours during off
peak energy demand period and only 3 hours during the peak period. Implication of
this is that although energy consumption by heat pump increased much of the energy
is consumed in the low energy tariff period, indicating possibility of energy cost
saving off peak operation though energy consumption rate is higher.

Impact of Phase Change materials - Agbanigo Sept., 2012
49
Figures 4.23 and 4.24 show the increase of actual operating time for the heat pump
and average daily energy consumption with back shifting and also with increasing
percentage of PCM for the test cases from 5.49hrs/day and 13.95kWhr/day
respectively for base case to maximums of 5.92 and 15.04kWhr.day respectively for
the on/off set time 1 – 10 with 37.5% PCM. This is similar for the base cases, without
PCM.
As with the base cases, it can be attributed to heat pump having to work for longer
duration due to its mid-night and early morning start-ups and the heat loss
experienced. This is coupled with additional heating required to cause change of
phase, the latent heat absorbed by PCM while melting.
5.2
5.3
5.4
5.5
5.6
5.7
5.8
5.9
6
7=16 5=14 3=12 1=10
Act
ual
Hea
t p
um
p o
per
atin
g ti
me
(hrs
)
On/off set time
Fig 4.23 Comparison of back shifting effect on actual heat pump operating time for
no-PCM and different percentage of PCM in DHW tank
no PCM
12.5
25
37.5

Impact of Phase Change materials - Agbanigo Sept., 2012
50
This notwithstanding, energy cost appears low because as ‘on’ or start time for heat
pump is moved backwards into the off peak period the hours of off peak operation
increases, thus bringing down cost of running heat pump because of the different and
lower energy tariffs for off peak periods.
4.6 Back Shifting Combined with Set Time Duration Reduction
Further reduction of on/off set time duration as well as heat pump start/on time back
shifted or moved back further into the off peak energy demand period for more off
peak operation hours for the heat pump produced results represented in figures 4.25 –
4.28.
This indicates the impact of phase change materials on in enabling system to take
advantage of the difference in energy tariffs between peak and off peak periods for
energy cost reduction.
13.4
13.6
13.8
14
14.2
14.4
14.6
14.8
15
15.2
7=16 5=14 3=12 1=10
Ave.
enrg
y c
onsu
mp
tio
n (
kW
h/d
ay)
On/off set time
Fig 4.24 Comparison of back shifting effect on average heat pump energy
comsumption for no-PCM and different percentage of PCM in DHW tank
no PCM
12.5
25
37.5

Impact of Phase Change materials - Agbanigo Sept., 2012
51
Figure 4.25 shows energy cost, reducing with reducing on/off set time duration but
rising with increasing proportion of PCM for each of the set time duration. The
increase with proportion of PCM, although minimal, is attributable to the additional
heating requirement for increased volume (quantity) of PCM while decrease with
decreasing set time duration is due to reduced operating time and average daily
energy consumption for the heat pump as depicted in figures 4.27 and 4.28. The
relationships between actual heat pump operating time as well as average daily energy
0
20
40
60
80
100
120
140
9 7 5 3
Aver
age
Ener
gy c
ost
(p
ence
/day
On/off set time duration (Hrs)
Fig 4.25 Effect of reducing set time duration with 5am as starting time on cost at
different % of PCM
12.5
25
37.5
0
5
10
15
20
25
9 7 5 3
% o
ccu
pie
d p
erio
d w
ater
tem
p <
40
deg
On/off set time duration (Hrs)
Fig 4.26 Effect of reducing set time duration with 5am as starting time on %
occupied period water temp < 40 deg at different % of PCM
12.5
25
37.5
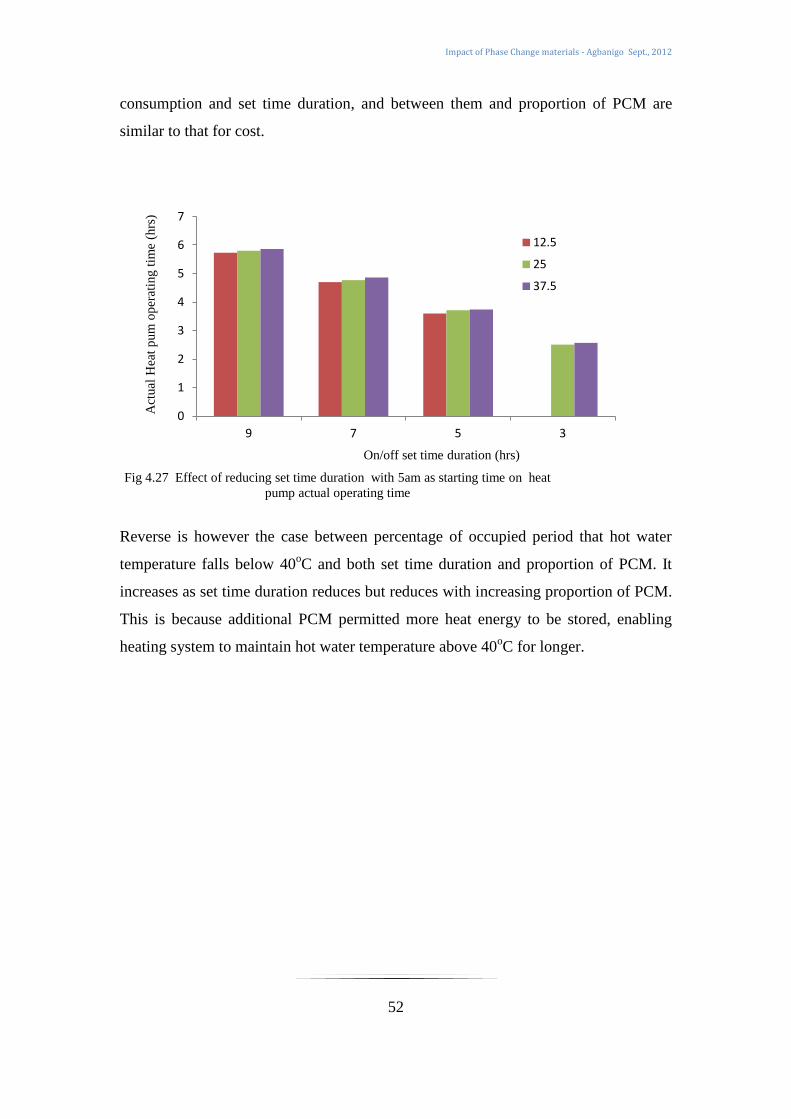
Impact of Phase Change materials - Agbanigo Sept., 2012
52
consumption and set time duration, and between them and proportion of PCM are
similar to that for cost.
Reverse is however the case between percentage of occupied period that hot water
temperature falls below 40oC and both set time duration and proportion of PCM. It
increases as set time duration reduces but reduces with increasing proportion of PCM.
This is because additional PCM permitted more heat energy to be stored, enabling
heating system to maintain hot water temperature above 40oC for longer.
0
1
2
3
4
5
6
7
9 7 5 3
Act
ual
Hea
t p
um
op
erat
ing t
ime
(hrs
)
On/off set time duration (hrs)
Fig 4.27 Effect of reducing set time duration with 5am as starting time on heat
pump actual operating time
12.5
25
37.5

Impact of Phase Change materials - Agbanigo Sept., 2012
53
4.7 Combined Effect of on/off Set Time and Proportion of PCM
A final comparison is done for effect of on/off set time and duration, as well as
proportion of PCM, on energy cost, percentage of occupied period water temperature
dropped below 40oC, actual operating time and energy consumption for heat pump.
They are represented in figures 4.29 – 4.32.
0
2
4
6
8
10
12
14
16
9 7 5 3
Ave
. en
ergy
co
sum
pti
on
(kW
h/d
ay)
On/off set time duration
Fig 4.28 Effect of reducing set time duration with 5am as starting
time on heat pump energy consumption
12.5
25
37.5
0
20
40
60
80
100
120
140
160
7=16 5=14 3=12 1=10 5=12 3=10 1=8 5=10 3=8 5=8
Aver
ge
Ener
gy c
ost
(p
ence
/d
ay)
On/off set time
Fig 4.29 Comparison of Effect of on/off set time and % PCM on energy cost
no PCM
12.5
25
37.5

Impact of Phase Change materials - Agbanigo Sept., 2012
54
Figures 4.29 – 4.32 show the pattern of results obtained from the toggling back and
forth described in the methodology. It can be seen, from figure 4.29, that energy cost
reduces as on/off set time moves back or is back-shifted with fixed on/off set time
interval as well as with reducing on/off set time duration but increases with increasing
proportion of PCM.
Actual heat pump operating time and average daily energy consumption however
increase with back shifting and proportion of PCM but reduces with reducing on/off
set time duration (figures 4.31 and 4.32).
The only anomaly is the on/off set time 3 – 8 where cost rises between 12.5% and
25% PCM but drops between 25% and 37.5% PCM. The reason is not exactly clear
and the only reasoning at this time is that there could be a glitch in the model or
iterations which may have affected the output results. The anomaly is however absent
in the case of effect on percentage of occupied period hot water dropped below 40oC
(figure 4.30).
0
5
10
15
20
25
30
35
40
7=16 5=14 3=12 1=10 5=12 3=10 1=8 5=10 3=8 5=8
% o
ccup
ied
per
iod
wat
er t
emp
< 4
0 d
eg
On/off set time
Fig 4.30 Comparison of Effect of on/off set time and % PCM on %
occupied perion wter temp < 40 deg
no PCM
12.5
25
37.5

Impact of Phase Change materials - Agbanigo Sept., 2012
55
The lowest average daily energy cost obtained is 33.14 pence, for on/off set time 5 – 8
at 37.5% PCM in domestic hot water tank. This on/off set time compares well with
the initial base case no PCM on/off set time of 7 – 16 in terms of percentage of
occupied period that water temperature falls below 40oC. Both are close to the 15%
mark. Interestingly, this on/off set time is entirely in the off peak energy demand
period and average daily energy consumption is considerably lower than that for the
base case, 6.58kWh/day (the true lowest energy cost, shortest operating time for heat
pump and lowest energy consumption was obtained for on/off set time 5 – 8, 25%
PCM but the percentage of occupied period that hot water temperature falls below
40oC for this set tine is outside the criteria of 15% set at the beginning).
This shows that there is high possibility of running system only in the off peak period
and saving huge sums on heating energy with incorporation of phase change
materials. Hot water temperature profile for on/off set time 5 – 8 at 37.5% PCM is
shown in figure 4.33.
0
1
2
3
4
5
6
7
7=16 5=14 3=12 1=10 5=12 3=10 1=8 5=10 3=8 5=8
Hea
t p
um
p a
ctual
op
erat
ing t
ime
(Hrs
)
On/off set time
Fig 4.31 Comparison of Effect of on/off set time and % PCM on heat pump
actual operating time
no PCM
12.5
25
37.5

Impact of Phase Change materials - Agbanigo Sept., 2012
56
0
2
4
6
8
10
12
14
16
7=16 5=14 3=12 1=10 5=12 3=10 1=8 5=10 3=8 5=8 Ave.
hea
t p
um
ener
gy c
onsu
mp
tio
n (
kW
h/d
ay)
On/off set time
Fig 4.32 Comparison of Effect of on/off set time and % PCM on
heat pump energy consumtion
no PCM
12.5
25
37.5
10
15
20
25
30
35
40
45
00
h0
1
06
h0
0
12
h0
0
18
h0
0
00
h0
1
06
h0
0
12
h0
0
18
h0
0
00
h0
1
06
h0
0
12
h0
0
18
h0
0
00
h0
1
06
h0
0
12
h0
0
18
h0
0
00
h0
1
06
h0
0
12
h0
0
18
h0
0
00
h0
1
06
h0
0
12
h0
0
18
h0
0
00
h0
1
06
h0
0
12
h0
0
18
h0
0
Tem
per
ature
(d
eg)
Time (hrs)
Fig 4.33 DHW tank water temp profile over simulation period (5 - 8, 37.5% PCM)

Impact of Phase Change materials - Agbanigo Sept., 2012
57
Average daily energy cost and energy consumption difference of 111.06 pence and
7.37kWh/day respectively, are obtained from comparing the two cases, which sums to
77.2% and 52.83% savings on energy cost and consumption respectively.
The next lowest average daily energy cost is obtained for on/off set time 3 – 8, 37.5%
PCM (domestic hot water temperature profile is shown in figure 4.34). Actual heat
pump operating time for this set time is 3.75 hrs higher than actual heat pump
operating time and energy consumption for on/off set time 5 – 8 but with hot water
temperature below 40oC for 5.55% of the occupied period. This implies that water
temperature is maintained above 40oC for a much longer period. Average daily energy
cost and average daily energy consumption are7.73 pence and 9.59kWh respectively.
Energy cost and energy consumption are 44.03% and 45.74% respectively, higher
than average daily energy cost and energy consumption for 5 – 8 but 66.9% for cost
and 31.25% for energy consumption, less than that for the initial base case (7 – 16, no
PCM).
10
15
20
25
30
35
40
45
00
h0
1
06
h0
0
12
h0
0
18
h0
0
00
h0
1
06
h0
0
12
h0
0
18
h0
0
00
h0
1
06
h0
0
12
h0
0
18
h0
0
00
h0
1
06
h0
0
12
h0
0
18
h0
0
00
h0
1
06
h0
0
12
h0
0
18
h0
0
00
h0
1
06
h0
0
12
h0
0
18
h0
0
00
h0
1
06
h0
0
12
h0
0
18
h0
0
Tem
per
ature
(d
eg)
Time (hrs)
Fig 4.34 DHW tank water temp profile over simulation period (3 - 8, 37.5%
PCM)

Impact of Phase Change materials - Agbanigo Sept., 2012
58
5 Conclusion and Recommendations
5.1 Conclusion
The objective of this research work is to assess the probability that phase change
energy storage materials can lead to energy savings when applied to or with
renewable energy systems. If any, renewable energy systems are the most likely
candidates for energy storage, being mostly intermittent in nature.
The work was done employing models for a detached UK building with average
insulation and utilising an air source heat pump for heat supply for domestic water
heating and space heating. Simulations were run for a winter week over a range of
on/off set times and durations, and proportion of phase change materials in domestic
hot water storage tank.
Results show that inclusion of phase change materials causes heat pump to work or
remain on, or cycle on longer due to additional heating required to cause change of
phase. Results also show that shifting operating period backwards also results in
increasing actual operating time of heat pump as depicted by rise in heat pump
operating time and energy consumption from 5.49hrs/day and 13.95kWhr/day
respectively for base case with no PCM to a maximum of 5.92 and 15.04kWhr.day
respectively for on/off set time 1 – 10 with 37.5% PCM, while reducing the on/off set
time duration results in less actual operating time for heat pump.
Reducing on/off set time duration resulted in a reduction of heat pump operating time
and average energy consumption but they increased with proportion of PCM in DHW
The proportion of increase of actual operating time of heat pump and average energy
consumption as on/off set time, that is, operating period is moved backwards, as well
as with increasing proportion of phase change material is considerable small when
compared to the reduction experienced due to reducing on/off set time duration,
resulting in overall reduction in actual heat pump operating time and energy
consumption, from 5.49hrs/day and 13.95kWhr/day, operating time and energy

Impact of Phase Change materials - Agbanigo Sept., 2012
59
consumption respectively, for the base case (7 – 16 on/off set time) to 2.51hrs/day and
6.43kWhr/day, operating time and energy consumption respectively, for on/off set
time 5 – 8 with 25% PCM. This reflects on the maximum average daily energy cost
savings and energy consumption reduction, of 77.2% and 52.83% respectively
obtained for on/off set time of 5 - 8, 37.5% PCM, which agrees with the criteria set at
the beginning.
Overall effect of the application of phase change materials, therefore, is the potential
for back shifting operating period away from peak energy demand period to off peak
period and reducing total operating period, with eventual effect on reduced energy
cost and consumption.
5.2 Recommendations
This research work was conducted using simulation software that employs iterations
of near actual conditions. Some assumptions are also made that may not be
completely accurate. Phase change simulated has properties that closely resemble
actual materials.
Further work could be on acquiring data for properties and behaviour of market
available phase change materials to be modelled for simulation in order to make the
results more realistic.
A practical approach to the problem could be examined with the aim of establishing
and validating models and confirming modelling results.

Impact of Phase Change materials - Agbanigo Sept., 2012
60
References
Badescu, V., 2003. Model of a Thermal Energy Storage Device integrated into a Solar
Assisted Heat Pump System for Space Heating. Energy Conversion and
Management, 40(10), pp. 1589-1604.
Barbieri, E. S., Melino, F. & Morini, M., 2011. Influence of the Thermal Energy
Storage on the Profitability of Micro-CHP Systems for Residential Building
Applications. Perugia, Italy, Energy Solutions for a Sustainable World -
Proceedings of the Third International Conference on Applied Energy, May 16-18,
2011.
Bernotat, K. & Sandberg, T., 2002. Biomass Fired Small-Scale CHP in Sweden and
the Baltic States: A Case Study on the Potential of Clustered Dwellings. Biomass
and Bienergy, 27(6), p. 521–530.
Boait, P. J., Fan, D. & Stafford, A., 2011. Performance and Control of Domestic
Ground-Source Heat Pumps in Retrofit Installations. Energy and Buildings,
Volume 43, p. 1968–1976.
Boardman, B. et al., 2005. The 40% House Project. [Online]
Available at:
http://www.eci.ox.ac.uk/research/energy/downloads/40house/40house.pdf
[Accessed 30 July 2012].
Building Performance Centre, 2011. Acoustic Noise Measurements for Air Source
Heat Pumps, London: Department of Energy and Climate Change.
Carbon Trust, 2011. Conversion Factors. [Online]
Available at:
http://www.carbontrust.com/media/18259/ctl153_conversion_factors.pdf
[Accessed 25 May 2012].

Impact of Phase Change materials - Agbanigo Sept., 2012
61
Cockroft, J. & Kelly, N., 2006. A comparative Assessment of Future Heat and Power
Sources for the UK Domestic Sector. Energy Conversion and Management, 47(15-
16), pp. 2349-2360.
Crozier-Cole, T. & Gareth, J., 2002. The potential market for micro CHP in the UK
(Report to the Energy Savings Trust), Wiltshire: Energy for Sustainable
Development Limited.
De Paepe, M., D’Herdt, P. & Mertens, D., 2006. Micro-CHP systems for residential
applications. Energy Conversion and Management, 47(18-19), p. 3435–3446.
Demirbas, M. F., 2006. Thermal Energy Storage and Phase Change: An Overview.
Energy Sources, Part B, 1(1), p. 85–95.
Department of Energy and Climate Change, 2011. Digest of United Kingdom Energy
Statistics (DUKES). London: National Statistics.
EDF Energy, 2010. Domestic Energy Prices Excluding VAT. [Online]
Available at: http://www.edfenergy.com/products-services/for-your-
home/documents/prepayment-prices.pdf
[Accessed 08 August 2012].
Energy Information Administration, 2007. International Energy Annual 2005.
[Online]
Available at: http://www.eia.doe.gov/emeu/iea/notes
[Accessed 12 06 2010].
European Union (EU), 2010. Regulation (EC) No 66/2010 of the European
Parliament and of the Council of 25 November 2009 on the EU Ecolabel ( Council
2010/66/EC). Official Journal of the European Union (L27), 53(1), pp. 1-19.
Faber Maunsell, 2002. Micro-Map, Mini and Micro CHP—Market Assessment and
Development Plan Summary Report, London: European Commission SAVE
programme.

Impact of Phase Change materials - Agbanigo Sept., 2012
62
Farid, M. M., Khudhair, A. M., Razack, S. A. K. & Al-Hallaj, S., 2004. A Review on
Phase Change Energy Storage: Materials and Applications. Energy Conversion
and Management, 45(9-10), p. 1597–1615.
Ferguson, A., Kelly, N., Weber, A. & Griffith, B., 2009. Modelling Residential-scale
Combustion-Based Cogeneration in Building Simulation. Journal of Building
Performance Simulation, 2(1), pp. 1-14.
Halford, C. K. & Boehm, R. F., 2007. Modeling of Phase Change Material Peak Load
Shifting. Energy and Buildings, 39(3), p. 298–305.
Heim, D. & Clarke, J. A., 2004. Numerical Modelling and Thermal Simulation of
PCM–Gypsum Composites with ESP-r. Energy and Buildings, 36(8), p. 795–805.
Henze, G. P., 2005. Energy and Cost Minimal Control of Active and Passive Building
Thermal Storage Inventory. Journal of Solar Energy Engineering, 127(3), pp. 343-
351.
Hepbasli, A. & Kalinci, Y., 2009. Renewable and Sustainable Energy Reviews, 13(6-
7), pp. 1211-1229.
Hong, J., Kelly, N. J., Richardson, I. & Thomson, M., 2012. Assessing Heat Pumps as
Flexible Load. Proceedings of IMechE Part A: Journal of Power and Energy, pp.
1-13.
International Energy Agency, 2002. Distributed Generation in Liberalised Electricity
Markets. Paris: OECD.
Izquierdo-Barrientos, M. A. et al., 2012. A Numerical Study of External Building
Walls Containing Phase Change Materials (PCM). Applied Thermal Engineering,
Volume 47, pp. 73-85.

Impact of Phase Change materials - Agbanigo Sept., 2012
63
Kane, D. & Newborough, M., 2006. Scenarios for Carbon Abatement in Dwellings by
Implemention of Stirling Engine Micro-CHP Systems. 4th International
Conference on Energy Efficiency in Domestic Appliances and Lighting (EEDAL),
21-23 June, Volume 3, pp. 1229-1236.
Kara, O., Ulgen, K. & Hepbasli, A., 2008. Exergetic Assessment of Direct-Expansion
Solar-Assisted Heat Pump Systems: Review and Modeling. Renewable and
Sustainable Energy Reviews, 12(5), pp. 1383-1401.
Kelly, N. J., Clarke, J. A., Ferguson, A. & Burt, G., 2008. Developing and Testing a
Generic Micro-Combined Heat and Power Model for Simulations of Dwellings
and Highly Distributed Power Systems. Proceedings of the Institution of
Mechanical Engineers, Part A: Journal of Power and Energy, 222(7), pp. 685-695.
Kelly, S. & Pollitt, M. G., 2009. Making Combined Heat and Power District
Heating(CHP-DH) Networks in the United Kingdom Economically Viable: A
Comparative Approach, Cambridge: Faculty of Economics, University of
Cambridge, UK.
Kim, M., Kim, M. S. & Chung, J. D., 2004. Transient thermal behavior of a water
heater system driven by a heat pump. International Journal of Refrigeration, 27(4),
pp. 415-421.
Münster, E. & Lund, H., 2007. Comparison of Electricity Balancing for Large Scale
Integration of Renewable Energy in Six European Regions. Dubrovnik, Forlag
Uden Navn.
Muruganantham, K. et al., 2010. Experimental Investigation of a Bio-Based Phase-
Change Material to Improve Building Energy Performance. Phoenix, Arizona,
USA, ASME.

Impact of Phase Change materials - Agbanigo Sept., 2012
64
Peacock, A. D. & Newborough, M., 2004. The 40% House Project - Task Four:
Power and Demand. [Online]
Available at:
http://www.eci.ox.ac.uk/research/energy/downloads/40house/background_doc_p.p
df
[Accessed 24 May 2012].
Peacock, A. D. & Newborough, M., 2005. Impact of Micro-CHP Systems on
Domestic Sector CO2 Emissions. Applied Thermal Engineering, 25(17-18), p.
2653–2676.
Roselli, C., Sasso, M., Sibilio, S. & Tzscheutschler, P., 2011. Experimental Analysis
of Microcogenerators Based on Different Prime Movers. Energy and Buildings,
43(4), pp. 796-804.
Singh, H., Muetze, A. & Eames, P. C., 2010. Factors Influencing the Uptake of Heat
Pump Technology by the UK Domestic Sector. Renewable Energy, 4(873–878), p.
35.
Turnpenny, J. R., Etheridge, D. W. & Reay, D. A., 2000. Novel Ventilation Cooling
System for Reducing Air Conditioning in Buildings.: Part I: Testing and
Theoretical Modelling. Applied Thermal Engineering, 20(11), p. 1019–1037.
Turnpenny, J. R., Etheridge, D. W. & Reay, D. A., 2001. Novel Ventilation System
for Reducing Air Conditioning in Buildings. Part II: Testing of Prototype. Applied
Thermal Engineering, 21(12), p. 1203–1217.
Veerapen, J. & Beerepoot, M., 2011. Co-Generation and Renewables - Solution for
Low-Carbon Energy Future, Paris: International Energy Agency.
Voorspools, K. R. & D'haeseleer, W. D., 2002. The Evaluation of Small Cogeneration
for Residential Heating. International Journal of Energy Research, 26(13), p.
1175–1190.

Impact of Phase Change materials - Agbanigo Sept., 2012
65
Watson, J., 2004. Co-Provision in Sustainable Energy Systems: The Case of Micro-
Generation. Energy Policy for a Sustainable Energy Future, 32(7), p. 1981–1990.
White, A. J., 2009. Thermodynamic Analysis of the Reverse Joule–Brayton Cycle
Heat Pump for Domestic Heating. Applied Energy, 86(11), pp. 2443-2450.
Wyse, B., 2011. Investigation into the Time-Shifting Of Domestic Heat Loads.
Glasgow: University of Strathclyde, Glasgow, Scotland.

Impact of Phase Change materials - Agbanigo Sept., 2012
66
Appendices
Appendix A Results Tables
Table A1 Effect of back shifting on energy cost computed from simulation result
On/off set time no PCM % PCM
12.5 25 37.5
7=16 144.2 - - -
5=14 126.1 129.5 131.2 132.2
3=12 109.4 111.4 112.6 112
1=10 90.87 - 94.17 93.65
Table A2 Effect of back shifting on % of occupied period DHW temperature
dropped below 40oC computed from simulation result
On/off set time no PCM % PCM
12.5 25 37.5
7=16 14.52 - - -
5=14 24.22 6.96 1.14 1.14
3=12 39.35 7.77 1.38 1.24
1=10 59.29 - 3.53 1.32
Table A3 Effect of back shifting actual heat pump operating time computed from
simulation result
On/off set time no PCM
% PCM
12.5 25 37.5
7=16 5.49 - - -
5=14 5.6 5.73 5.8 5.86
3=12 5.67 5.77 5.86 5.9
1=10 5.68 - 5.87 5.92

Impact of Phase Change materials - Agbanigo Sept., 2012
67
Table A4 Effect of back shifting heat pump average daily energy consumption
(kWhr/day) computed from simulation result
On/off set time no PCM % PCM
12.5 25 37.5
7=16 13.95
5=14 14.21 14.57 14.78 14.92
3=12 14.39 14.68 14.93 14.99
1=10 14.42
14.93 15.04
Table A5 Effect of reducing on/off set time duration on energy cost computed
from simulation results
On/off set time
duration
% PCM
12.5 25 37.5
9 129.5 131.2 132.2
7 98.56 100.2 102.3
5 66.88 68.65 68.71
3 - 32.39 33.14
Table A6 Effect of reducing on/off set time duration on % of occupied period
DHW temperature dropped below 40oC computed from simulation
results
On/off set time
duration
% PCM
12.5 25 37.5
9 6.96 1.14 1.14
7 8.3 1.65 1.25
5 14.27 6.3 1.37
3 - 21.95 12.55

Impact of Phase Change materials - Agbanigo Sept., 2012
68
Table A7 Effect of reducing on/off set time duration actual heat pump operating
time computed from simulation results
On/off set time
duration
% PCM
12.5 25 37.5
9 5.73 5.8 5.86
7 4.7 4.77 4.86
5 3.6 3.71 3.74
3 - 2.51 2.57
Table A8 Effect of reducing on/off set time duration pump average daily energy
consumption (kWhr/day) computed from simulation results
On/off set time
duration
% PCM
12.5 25 37.5
9 14.57 14.78 14.92
7 11.96 12.15 12.39
5 9.23 9.46 9.56
3
6.43 6.58
Table A9 Combined effect of on/off set time back shifting and duration reduction
on cost computed from simulation results (7-16 only for no PCM)
On/off set time no PCM % PCM
12.5 25 37.5
7=16 144.2 - - -
5=14 - 129.5 131.2 132.2
3=12 - 111.4 112.6 112
1=10 - - 94.17 93.68
5=12 - 98.56 100.2 102.3
3=10 - - 81.07 -
1=8 - - 60.85 61.29
5=10 - 66.88 68.65 68.71
3=8 - - - 47.73
5=8 - - - 33.14

Impact of Phase Change materials - Agbanigo Sept., 2012
69
Table A10 Combined effect of on/off set time back shifting and duration reduction
on % of occupied period DHW temperature dropped below 40oC
computed from simulation results (7-16 only for no PCM)
On/off set time no PCM % PCM
12.5 25 37.5
7=16 14.52 - - -
5=14 - 6.96 1.14 1.14
3=12 - 7.77 1.38 1.24
1=10 - - 3.53 1.32
5=12 - 8.3 1.65 1.25
3=10 - - 4.86 -
1=8 - - 7.58 4.45
5=10 - 14.27 6.3 1.34
3=8 - - - 5.55
5=8
- - 12.55
Table A11 Combined effect of on/off set time back shifting and duration reduction
heat pump average daily energy consumption (kWhr/day) computed
from simulation results (7-16 only for no PCM)
On/off set time no PCM % PCM
12.5 25 37.5
7=16 5.49 - - -
5=14 - 5.73 5.8 5.86
3=12 - 5.77 5.86 5.9
1=10 - - 5.77 5.92
5=12 - 4.7 4.77 4.86
3=10 - - 4.82 -
1=8 - - 4.8 4.84
5=10 - 3.63 3.71 3.74
3=8 - - - 3.75
5=8 - - - 2.57

Impact of Phase Change materials - Agbanigo Sept., 2012
70
Table A12 Combined effect of on/off set time back shifting and duration reduction
actual heat pump operating time computed from simulation results (7-
16 only for no PCM)
On/off set time no PCM % PCM
12.5 25 37.5
7=16 13.95
5=14
14.57 14.78 14.92
3=12
14.68 14.93 14.99
1=10
14.93 15.04
5=12
11.96 12.15 12.36
3=10
12.29
1=8
12.24 12.33
5=10
9.23 9.46 9.56
3=8
9.14 12.24 9.59
5=8
6.43 6.58

Impact of Phase Change materials - Agbanigo Sept., 2012
71
Appendix B
Figure B1 Living zone temperature profile for on/off set time 7 -23 (no PCM)
14.5
15.5
16.5
17.5
18.5
19.5
20.5
21.5 0
0h
01
06
h0
0
12
h0
0
18
h0
0
00
h0
1
06
h0
0
12
h0
0
18
h0
0
00
h0
1
06
h0
0
12
h0
0
18
h0
0
00
h0
1
06
h0
0
12
h0
0
18
h0
0
00
h0
1
06
h0
0
12
h0
0
18
h0
0
00
h0
1
06
h0
0
12
h0
0
18
h0
0
00
h0
1
06
h0
0
12
h0
0
18
h0
0
Tem
per
ature
(d
eg)
Time (hrs)
Living zone temperature profile for on/off set time 7-23 (no PCM)

Impact of Phase Change materials - Agbanigo Sept., 2012
72
Figure B2 Cut-out picture of EDF Energy prices sheet showing Economy 7 tariffs
(source EDF Energy, 2010)


![phase change materials - Home - Home | BEopt Group07... · Phase Phase change Phase change materials a phase is a set of ... Phase change diagram. ... Naphthalene 80[4,11] 147.7[4,11]](https://static.fdocuments.in/doc/165x107/5aacf7167f8b9ac55c8dae8a/phase-change-materials-home-home-beopt-group07phase-phase-change-phase.jpg)


