Reduced burden from major diseases due to an increase in ...

AIHW
Impact of overweight and obesity as a risk factor for chronic conditions
This report updates and extends estimates of the burden due to overweight and obesity reported in the Australian Burden of Disease Study 2011 to include burden in people aged under 25, revised diseases linked to overweight and obesity based on the latest evidence, and estimates by socioeconomic group. The report includes scenario modelling, undertaken to assess the potential impact on future health burden if overweight and obesity in the population continues to rise or is reduced. The enhanced analysis in the report shows that 6.6% of the total health burden in Australia in 2011 is due to overweight and obesity, and that this burden increased with increasing level of socioeconomic disadvantage.
Australian Burden of Disease StudyImpact of overw
eight and obesity as a risk factor for chronic conditions: Australian Burden of D
isease Study

AUSTRALIAN BURDEN OF DISEASE STUDY SERIES
Number 11
Impact of overweight and obesity as a risk factor for chronic conditions
Australian Burden of Disease Study
Australian Institute of Health and Welfare Canberra
Cat. no. BOD 12

Australian Institute of Health and Welfare is a major national agency that provides reliable, regular and relevant information and statistics on Australia’s health and welfare.
The Institute’s purpose is to provide authoritative information and statistics to promote better health and wellbeing among Australians.
© Australian Institute of Health and Welfare 2017
This product, excluding the AIHW logo, Commonwealth Coat of Arms and any material owned by a third party or protected by a trademark, has been released under a Creative Commons BY 3.0 (CC-BY 3.0) licence. Excluded material owned by third parties may include, for example, design and layout, images obtained under licence from third parties and signatures. We have made all reasonable efforts to identify and label material owned by third parties.
You may distribute, remix and build upon this work. However, you must attribute the AIHW as the copyright holder of the work in compliance with our attribution policy available at <www.aihw.gov.au/copyright/>. The full terms and conditions of this licence are available at <http://creativecommons.org/licenses/by/3.0/au/>.
This publication is part of the Australian Institute of Health and Welfare’s Australian Burden of Disease Study series. A complete list of the Institute’s publications is available from the Institute’s website <www.aihw.gov.au>.
ISSN 2204-4108 (PDF) ISSN 2006-4508 (Print) ISBN 978-1-76054-114-9 (PDF) ISBN 978-1-76054-115-6 (Print)
Suggested citation Australian Institute of Health and Welfare 2017. Impact of overweight and obesity as a risk factor for chronic conditions: Australian Burden of Disease Study. Australian Burden of Disease Study series no.11. Cat. no. BOD 12. BOD. Canberra: AIHW.
Australian Institute of Health and Welfare Board Chair Director Mrs Louise Markus Mr Barry Sandison
Any enquiries relating to copyright or comments on this publication should be directed to: Digital and Media Communications Unit Australian Institute of Health and Welfare GPO Box 570 Canberra ACT 2601 Tel: (02) 6244 1000 Email: [email protected]
Published by the Australian Institute of Health and Welfare
This publication is printed in accordance with ISO 14001 (Environmental Management Systems) and ISO 9001 (Quality Management Systems). The paper is sourced from sustainably managed certified forests.
Please note that there is the potential for minor revisions of data in this report. Please check the online version at <www.aihw.gov.au> for any amendments.

Contents
Acknowledgments.............................................................................................................................. iv
Abbreviations ....................................................................................................................................... v
Summary .............................................................................................................................................. vi
1 Introduction ................................................................................................................................... 1
2 Methods .......................................................................................................................................... 5
2.1 Selected linked diseases and relative risks .......................................................................... 5
2.2 Determining overweight and obesity prevalence .............................................................. 6
2.3 Theoretical minimum risk exposure distribution .............................................................. 6
2.4 Quantifying overweight and obesity burden ..................................................................... 7
2.5 Socioeconomic group analysis .............................................................................................. 7
2.6 Comparison with attributable burden in 2003 .................................................................... 7
2.7 Scenario modelling ................................................................................................................. 7
3 Burden due to overweight and obesity ................................................................................. 10
3.1 Total overweight and obesity burden ................................................................................ 10
3.2 Which diseases account for the most burden due to overweight and obesity? ........... 11
3.3 Was it due to fatal or non-fatal burden? ............................................................................ 13
3.4 How does the overweight and obesity burden vary by age? ......................................... 14
3.5 What proportion of burden for each linked disease is due to overweight and obesity? ................................................................................................................................... 16
4 Variation across socioeconomic groups .................................................................................. 21
5 Changes between 2011 and 2003 .............................................................................................. 24
6 Scenario modelling ..................................................................................................................... 26
7 Discussion .................................................................................................................................... 31
Appendix A: Detailed methods ....................................................................................................... 37
Appendix B: Selection of relative risks .......................................................................................... 42
Appendix C: Additional tables ........................................................................................................ 47
Glossary ................................................................................................................................................ 51
References ............................................................................................................................................ 53
List of tables ........................................................................................................................................ 58
List of figures ...................................................................................................................................... 59
iii

Acknowledgments This report was authored by Melanie Dunford and Vanessa Prescott from the Burden of Disease and Mortality Unit of the Australian Institute of Health and Welfare (AIHW), under the guidance of Michelle Gourley, Sushma Mathur and Lynelle Moon.
David Whitelaw from the AIHW provided valuable input and statistical advice. Anne-Marie Waters worked on initial stages of the project. Geoff Neideck and Fadwa Al-Yaman provided constructive comments and review. Their respective contributions are all gratefully acknowledged.
The National Vascular Diseases Monitoring Advisory Group (NVDMAG), chaired by Erin Lalor, guided the report’s preparation. The NVDMAG includes the following expert advisory groups and their members:
Cardiovascular Disease Expert Advisory Group: Andrew Tonkin (Chair), Tom Briffa, Derek Chew, Annette Dobson, Mandy Thrift and Mark Nelson
Chronic Kidney Disease Expert Advisory Group: Steven Chadban (Chair), Alan Cass, Jeremy Chapman, Joan Cunningham, Bettina Douglas, Stephen McDonald and David Parker
Diabetes Expert Advisory Group: Jonathan Shaw (Chair), Stephen Colagiuri, Maria Craig, Wendy Davis, Mark Harris, Greg Johnson, Glynis Ross and Sophia Zoungas.
Other members of the NVDMAG providing valuable guidance were Sonia Cornelly, Elizabeth Flynn and Bernie Towler.
The Department of Health funded this report. The authors acknowledge the valuable comments from individual staff members.
iv

Abbreviations
ABDS Australian Burden of Disease Study
ABS Australian Bureau of Statistics
AIHW Australian Institute of Health and Welfare
ASR age-standardised rate
BMI body mass index
DALY disability-adjusted life year
GBD Global Burden of Disease
PAF population attributable fraction
RSE relative standard error
TMRED theoretical minimum risk exposure distribution
YLD years lived with disability
YLL years of life lost
Symbols kg/m2
>
≥
<
—
. .
%
–
kilograms per metre squared
greater than
greater than or equal to
less than
nil or rounded to zero
not applicable
per cent
minus
v

Summary Overweight and obesity is a major public health issue, with nearly 2 in 3 adults and 1 in 4 children in Australia considered overweight or obese (AIHW 2016c). The Australian Burden of Disease Study (ABDS) 2011 modelled the impact of overweight and obesity and showed it is one of the leading risk factors for ill health and death (AIHW 2016a).
This report updates and extends the findings reported in the ABDS 2011 to include burden in people aged under 25, revised diseases linked to overweight or obesity (based on the latest evidence), and estimates by socioeconomic group. This report also includes scenario modelling to assess the potential impact on future health burden if overweight and obesity in the population were to continue to rise or be reduced.
In total, 22 diseases resulting from overweight and obesity were included in this analysis. These comprised 11 types of cancer (7 were included in the ABDS 2011), 3 cardiovascular conditions, chronic kidney disease, diabetes, dementia, gallbladder disease, gout, back pain and problems, osteoarthritis and asthma.
Overall health impact of overweight and obesity The enhanced analysis in this report indicates:
• 7.0% of the total health burden in Australia in 2011 was due to overweight and obesity – 63% of this was fatal burden rather than non-fatal burden – 84% was experienced between ages 45 to 84
• males experienced a greater proportion of burden from overweight and obesity (males 7.3% of total burden; females 6.6%)
• 53% of diabetes burden and 45% of osteoarthritis burden were due to overweight and obesity.
Overweight and obesity burden greatest in lowest socioeconomic group The lowest socioeconomic group experienced rates of overweight and obesity burden that were 2.3 times those of the highest socioeconomic group.
Little change in rates of overweight and obesity burden between 2003 and 2011 Despite rising rates of overweight and obesity, the rate of burden was similar in 2003 and 2011 (after accounting for population increase and ageing). This was largely due to increases in some linked disease burden (such as diabetes and chronic kidney disease) being offset by decreases in other linked disease burden (such as coronary heart disease and stroke).
Around 14% of disease burden due to overweight and obesity could be avoided if the population’s body mass dropped slightly An estimated 6% of future disease burden in 2020 due to overweight and obesity could be avoided if current increases in overweight and obesity in the population were halted (maintained at 2011 levels). Furthermore, 14% of disease burden due to overweight and obesity in the year 2020 could be avoided if the population at risk in 2011 reduced their body mass index (BMI) by 1 and these rates were maintained in 2020, compared with what would be the case if overweight and obesity continued to rise.
vi
1 Introduction The increasing rate of overweight and obesity is a major public health issue in Australia, involving all ages and socioeconomic groups (AIHW 2016c). In 2011–12, almost 2 in 3 (63%) Australian adults were overweight or obese (AIHW 2015). Chronic diseases associated with overweight and obesity include many of the leading causes of morbidity, mortality and burden of disease in Australia. These include cancer, cardiovascular disease, diabetes and musculoskeletal conditions (AIHW 2016c).
Overweight and obesity is also a concern in children, with 1 in 4 Australian children aged 5–17 (25%) considered overweight or obese in 2011–12. Overweight and obesity in childhood is associated with poor mental and social health outcomes, and linked to comorbid chronic conditions such as Type 2 diabetes, asthma, sleep apnoea, some orthopaedic and gastrointestinal problems, and non-alcoholic fatty liver disease (Kelly et al. 2013; Pulgarón 2013; Sahoo et al. 2015). As well, childhood obesity is a risk factor for chronic disease in adulthood (Dietz 1998). For example, a recent meta-analysis reported a statistically significant association between obesity in children aged 12–18 and an increased incidence of diabetes, coronary heart disease and some cancers in adulthood (Llewellyn et al. 2016).
Individuals from lower socioeconomic groups are more likely to be overweight or obese, with rates particularly high for women. Almost 2 in 3 (63%) Australian women in the lowest socioeconomic group are overweight or obese compared with almost 1 in 2 women (47%) in the highest socioeconomic group (AIHW 2015). Children living in one-parent families or in low socioeconomic groups are also more likely to be overweight or obese (AIHW 2014).
Analysis of the prevalence of overweight and obesity at the local level in 2014–15 has shown that the percentage of overweight or obese adults varies across Primary Health Network areas (AIHW 2016e). Overall, adults in regional Primary Health Network areas were more likely to be overweight or obese than their city counterparts.
National rates of overweight and obesity have increased in recent decades, up from 56% in 1995. This has been driven by an increase in obese adults, with the percentage of adults who were overweight but not obese remaining similar in that time (AIHW 2016e).
The Australian Burden of Diseases Study 2011 (ABDS) assessed the burden of over 200 diseases and injuries in Australia in 2011 (at a national and sub-national level), as well as the impact from 29 risk factors, including overweight and obesity (referred to as ‘high body mass’ in the ABDS 2011 report; AIHW 2016a) at a national level. In the ABDS 2011, overweight and obesity was the second leading risk factor—responsible for 5.5% of the burden from all diseases and injuries in Australia in 2011—behind smoking, which accounted for 9.0% of the disease burden. As overweight and obesity is the second leading risk factor in terms of burden of disease in Australia, and with its prevalence increasing, it is important to have a body of evidence on its wider impacts to support decisions on what needs to be done to reduce its impact.
The ABDS 2011 and this current project provide detailed information at the national level on the impact of overweight and obesity on various diseases, using complex modelling techniques (see Chapter 2).
Impact of overweight and obesity as a risk factor for chronic conditions 1
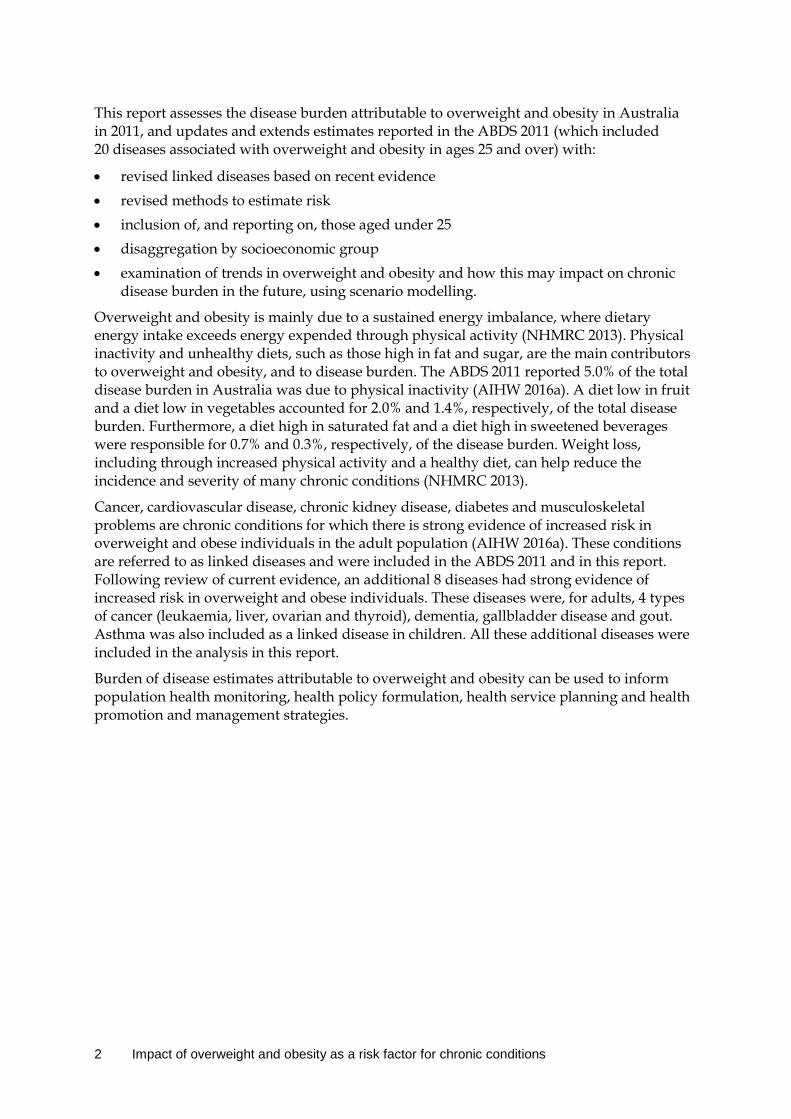
This report assesses the disease burden attributable to overweight and obesity in Australia in 2011, and updates and extends estimates reported in the ABDS 2011 (which included 20 diseases associated with overweight and obesity in ages 25 and over) with:
• revised linked diseases based on recent evidence • revised methods to estimate risk • inclusion of, and reporting on, those aged under 25 • disaggregation by socioeconomic group • examination of trends in overweight and obesity and how this may impact on chronic
disease burden in the future, using scenario modelling.
Overweight and obesity is mainly due to a sustained energy imbalance, where dietary energy intake exceeds energy expended through physical activity (NHMRC 2013). Physical inactivity and unhealthy diets, such as those high in fat and sugar, are the main contributors to overweight and obesity, and to disease burden. The ABDS 2011 reported 5.0% of the total disease burden in Australia was due to physical inactivity (AIHW 2016a). A diet low in fruit and a diet low in vegetables accounted for 2.0% and 1.4%, respectively, of the total disease burden. Furthermore, a diet high in saturated fat and a diet high in sweetened beverages were responsible for 0.7% and 0.3%, respectively, of the disease burden. Weight loss, including through increased physical activity and a healthy diet, can help reduce the incidence and severity of many chronic conditions (NHMRC 2013).
Cancer, cardiovascular disease, chronic kidney disease, diabetes and musculoskeletal problems are chronic conditions for which there is strong evidence of increased risk in overweight and obese individuals in the adult population (AIHW 2016a). These conditions are referred to as linked diseases and were included in the ABDS 2011 and in this report. Following review of current evidence, an additional 8 diseases had strong evidence of increased risk in overweight and obese individuals. These diseases were, for adults, 4 types of cancer (leukaemia, liver, ovarian and thyroid), dementia, gallbladder disease and gout. Asthma was also included as a linked disease in children. All these additional diseases were included in the analysis in this report.
Burden of disease estimates attributable to overweight and obesity can be used to inform population health monitoring, health policy formulation, health service planning and health promotion and management strategies.
2 Impact of overweight and obesity as a risk factor for chronic conditions
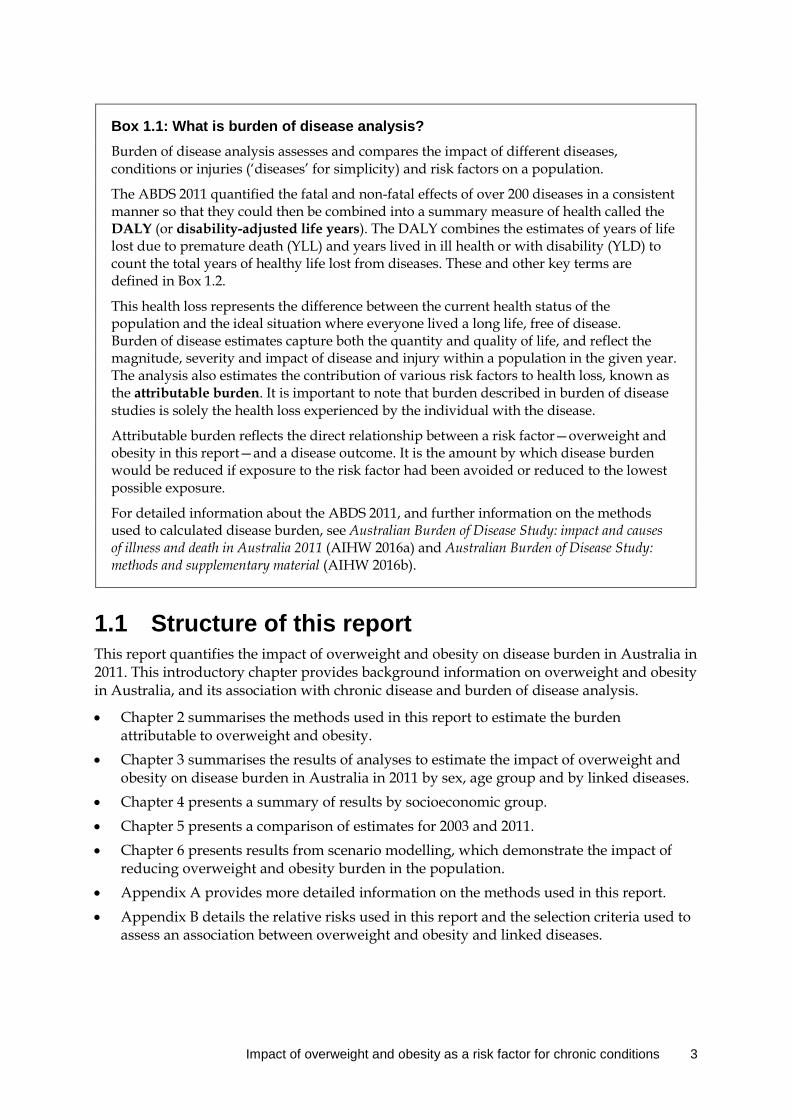
Box 1.1: What is burden of disease analysis? Burden of disease analysis assesses and compares the impact of different diseases, conditions or injuries (‘diseases’ for simplicity) and risk factors on a population.
The ABDS 2011 quantified the fatal and non-fatal effects of over 200 diseases in a consistent manner so that they could then be combined into a summary measure of health called the DALY (or disability-adjusted life years). The DALY combines the estimates of years of life lost due to premature death (YLL) and years lived in ill health or with disability (YLD) to count the total years of healthy life lost from diseases. These and other key terms are defined in Box 1.2.
This health loss represents the difference between the current health status of the population and the ideal situation where everyone lived a long life, free of disease. Burden of disease estimates capture both the quantity and quality of life, and reflect the magnitude, severity and impact of disease and injury within a population in the given year. The analysis also estimates the contribution of various risk factors to health loss, known as the attributable burden. It is important to note that burden described in burden of disease studies is solely the health loss experienced by the individual with the disease.
Attributable burden reflects the direct relationship between a risk factor—overweight and obesity in this report—and a disease outcome. It is the amount by which disease burden would be reduced if exposure to the risk factor had been avoided or reduced to the lowest possible exposure.
For detailed information about the ABDS 2011, and further information on the methods used to calculated disease burden, see Australian Burden of Disease Study: impact and causes of illness and death in Australia 2011 (AIHW 2016a) and Australian Burden of Disease Study: methods and supplementary material (AIHW 2016b).
1.1 Structure of this report This report quantifies the impact of overweight and obesity on disease burden in Australia in 2011. This introductory chapter provides background information on overweight and obesity in Australia, and its association with chronic disease and burden of disease analysis.
• Chapter 2 summarises the methods used in this report to estimate the burden attributable to overweight and obesity.
• Chapter 3 summarises the results of analyses to estimate the impact of overweight and obesity on disease burden in Australia in 2011 by sex, age group and by linked diseases.
• Chapter 4 presents a summary of results by socioeconomic group. • Chapter 5 presents a comparison of estimates for 2003 and 2011. • Chapter 6 presents results from scenario modelling, which demonstrate the impact of
reducing overweight and obesity burden in the population. • Appendix A provides more detailed information on the methods used in this report. • Appendix B details the relative risks used in this report and the selection criteria used to
assess an association between overweight and obesity and linked diseases.
Impact of overweight and obesity as a risk factor for chronic conditions 3

Box 1.2: Key terms used in this report attributable burden: The disease burden attributed to a particular risk factor. It is the reduction in burden that would have occurred if exposure to the risk factor had been avoided or had been reduced to its theoretical minimum risk exposure distribution (see theoretical minimum risk exposure distribution).
body mass index (BMI): An international index used to classify underweight, overweight and obesity. BMI is calculated by dividing a person’s weight in kilograms by the square of their height in metres (kg/m2).
comparative risk assessment: The process for estimating the burden of disease attributable to selected risk factors. It involves five key steps: selection of linked diseases (see linked disease, estimation of exposure distribution, estimation of effect sizes, choice of theoretical minimum risk exposure level, and then the calculation of attributable burden.
confounding: A term describing an observed association that is due, in whole or part, to a third factor associated with both the exposure and the outcome of interest.
DALY (disability-adjusted life years): years of healthy life lost, either through premature death or, equivalently, through living with disability due to illness or injury.
linked disease: A disease or condition on the causal pathway of the risk factor; therefore, more likely to develop if exposed to the risk.
obesity: A category used to describe the amount of body mass a person has above what is considered ideal. Defined as a BMI equal to or greater than 30 kg/m2.
overweight: A category used to describe the amount of body mass a person has above what is considered ideal. Defined as a BMI equal to or greater than 25 kg/m2, but less than 30 kg/m2.
population attributable fraction (PAF): For a particular risk factor and causally linked disease or injury, the percentage reduction in burden that would occur for a population if exposure to the risk factor were avoided or reduced to its theoretical minimum.
relative risk (RR): The risk of an event relative to exposure, calculated as the ratio of the probability of the event’s occurring in the exposed group to the probability of its occurring in the non-exposed group. An RR of 1 implies no difference in risk; an RR <1 implies the event is less likely to occur in the exposed group; and an RR >1 implies the event is more likely to occur in the exposed group.
risk factor: Any factor that causes or increases the likelihood of a health disorder or other unwanted condition or event.
theoretical minimum risk exposure distribution (TMRED): The risk factor exposure distribution that will lead to the lowest conceivable disease burden.
YLD (years lived with disability): A measure of the years of what could have been a healthy life that were instead spent in states of less than full health. This is also referred to as non-fatal burden.
YLL (years of life lost): A measure of the years of life lost due to premature mortality. This is also referred to as fatal burden.
4 Impact of overweight and obesity as a risk factor for chronic conditions
2 Methods Burden attributable to overweight and obesity was estimated using the comparative risk assessment methodology (Murray et al. 2003), which is a standard approach used in burden of disease risk factor analysis globally (Forouzanfar et al. 2016).
This chapter provides an overview of the steps used to calculate the burden attributable to overweight and obesity. In this report, a number of methodological developments have occurred since the ABDS 2011. See Box 2.1 at the end of this chapter for a summary of updated methods and the impact of these changes. A more detailed description of the methods is in Appendix A.
2.1 Selected linked diseases and relative risks Burden of disease studies use relative risks to measure the association between risk factors and diseases (referred to as ‘linked diseases’). Diseases were included if there was evidence for a causal association with overweight and obesity—preferably from a meta-analysis or prospective studies—considered to be at a convincing or probable level.
In total, 22 linked diseases were included in the analysis: 11 types of cancer (bowel, breast, gallbladder, kidney, leukaemia, liver, oesophageal, ovarian, pancreatic, thyroid and uterine), 3 cardiovascular diseases (coronary heart disease, hypertensive heart disease and stroke), asthma, back pain and problems, chronic kidney disease, dementia, diabetes, gallbladder disease, gout and osteoarthritis. All these conditions were estimated in adults and/or adolescents except for asthma, which was estimated in children aged 5–19 only. See Appendix B for the selected age groups used in the analysis for each linked disease.
The relative risks for linked diseases that were also included in the Global Burden of Disease study (GBD) 2015 were sourced from GBD 2015, except for oesophageal cancer (Forouzanfar et al. 2016). The relative risks for all GBD sourced conditions are updated from those used in the ABDS 2011, as the ABDS 2011 obtained these from GBD 2010. In GBD 2015, numerous cardiovascular conditions were removed as linked diseases, due to insufficient evidence: this is consistent with the review of the literature for this report. The relative risk for oesophageal carcinoma was selected from a meta-analysis based on studies assessing risk from oesophageal adenocarcinoma only, as risk is associated only with this subtype (Renehan, Tyson et al. 2008). Furthermore, based on new evidence, there were 4 linked diseases included in this study that were not included in GBD 2015 or the ABDS 2011 study. These were, for adults, dementia, gallbladder diseases and gout, and asthma in children. Relative risks for these diseases were sourced directly from selected studies (Aune et al. 2014; Egan et al. 2013; Pedditizi et al. 2016; Stender et al. 2013). Age or sex-specific relative risks for all linked disease were applied where possible. Some diseases associated with overweight and obesity were excluded from the report if they were not captured as a disease in the ABDS 2011, if they did not meet the selection criteria, or if no suitable relative risks were available to use in the analysis. These diseases included heart failure, sleep apnoea, obesity hypoventilation syndrome, binge eating disorder, metabolic syndrome, depression, infertility, menstrual disorders and non-alcoholic liver disease.
Impact of overweight and obesity as a risk factor for chronic conditions 5
Linked diseases were defined according to the ABDS 2011 definitions. For example, diabetes includes Type 1 and 2 diabetes, but not gestational diabetes; and dementia refers to all types of dementia. As already mentioned, heart failure burden could not be estimated as it was not defined separately in the ABDS 2011. However, estimates for coronary heart disease and hypertensive heart disease do include burden experienced from heart failure due to these conditions. For detailed information about the ABDS 2011, see Australian Burden of Disease Study: impact and causes of illness and death in Australia 2011 (AIHW 2016a) and Australian Burden of Disease Study: methods and supplementary material (AIHW 2016b).
2.2 Determining overweight and obesity prevalence
Overweight and obesity is characterised by excess weight and is based on the body mass index (BMI), an internationally recognised index used to identify overweight and obesity. While BMI may not be the most accurate measure of adiposity—particularly central adiposity, which is associated with increased cardiovascular and diabetes risk—it was used for various reasons as discussed in Section 7.3.
Age- and sex-specific data were extracted in the finest possible increments, from a continuous Australian population BMI distribution. The increments started at a BMI of 20.00–20.99, then 21.00–21.99 and so on, up to the highest BMI categories possible, which in most cases was a BMI of 36 and greater. The level of granularity was limited to keep the relative standard error to 25% or less where possible; however, data from some BMI categories in a small number of age groups did have relative standard errors between 25% and 50%. The median BMI within these increments was used to estimate the BMI exposure for the increment. For example, the median value from the survey in respondents with a BMI of 21.00–21.99 by sex and age group was used to estimate the exposure for which to apply the relative risk for the increment.
Data were sourced directly from the Australian Health Survey 2011–12. For children and adolescents aged 5–14, age- and sex-specific BMI cut-off levels indicating overweight and obesity were derived from Cole et al. (2000).
2.3 Theoretical minimum risk exposure distribution The estimated contribution of a risk factor to disease burden is calculated by comparing the observed risk factor distribution with an alternative, hypothetical distribution (the counterfactual scenario). In the ABDS 2011, as in previous burden of disease studies, a theoretical minimum risk exposure distribution (TMRED) scenario was adopted. The TMRED scenario is the hypothetical exposure distribution that would lead to the lowest conceivable disease burden.
In this study, the TMRED for the risk factor ‘overweight and obesity’ was updated from 21–23 kg/m2 (used in the ABDS 2011) to a wider range of 20–25 kg/m2, as estimated by GBD 2015 (Forouzanfar et al. 2016). This is the exposure range at which a person is not at risk of developing disease outcomes.
A new model from that used in the ABDS 2011 has also been used to estimate the appropriate TMRED value from within this range for each person in the population. See Appendix A for a detailed description of the new model used in this report.
6 Impact of overweight and obesity as a risk factor for chronic conditions

2.4 Quantifying overweight and obesity burden The burden attributable to overweight and obesity was estimated using calculated population attributable fractions (PAFs) for each linked disease and the total burden estimated in the ABDS 2011. PAFs determine the proportion of a particular disease that could have potentially been avoided if the population had never been exposed to a risk factor (Box 1.2). These were calculated using the relative risks and exposure information from the previous steps. The formula used to calculate PAFs and attributable burden is detailed in Appendix A.
In the case of overweight and obese individuals, it is possible to develop more than one linked disease. The underlying DALY estimates used in this report (as calculated in the ABDS 2011) were adjusted for the probability of an individual’s having more than one condition (for more information, see AIHW 2016b). The relative risks used were also typically adjusted for confounding (age, sex, smoking status, alcohol use, and intermediate risk factors such as systolic blood pressure and cholesterol levels).
2.5 Socioeconomic group analysis Estimates of attributable burden by socioeconomic group were calculated using data on population exposure to overweight and obesity by socioeconomic group, applied to estimates of disease burden by equivalent socioeconomic group from the ABDS 2011.
In this report, socioeconomic groups are based on an index of relative socioeconomic disadvantage, developed as part of the Socio-Economic Indexes for Areas by the ABS (ABS 2010). This index relates to a particular geographic area and is based on a number of characteristics, including household income, employment and education level. In this analysis, the index is allocated based on the individual’s residential area. The actual socioeconomic properties of individuals can vary within the same area.
Socioeconomic groups are presented as quintiles in this analysis. Quintile 1 (Q1) represents the 20% of the population with the lowest socioeconomic characteristics. The level of socioeconomic position increases with each quintile, through to the 20% of the population with the highest socioeconomic characteristics (Q5).
Each quintile has a similar number of people; however, the lower socioeconomic groups have a larger proportion of elderly people than the higher groups. A greater proportion of Aboriginal and Torres Strait Islander people and individuals with disability are also found in the lowest socioeconomic group (ABS 2010).
2.6 Comparison with attributable burden in 2003 The burden attributable to overweight and obesity was also estimated for the year 2003. To make this comparison, population exposure for the year 2003 was obtained from the ABS National Health Surveys, as well as the burden for each linked disease estimated for the year 2003, as previously calculated in the ABDS 2011.
2.7 Scenario modelling Scenario modelling was used to investigate changes in the health impacts from overweight and obesity if the prevalence of overweight and obesity differed. To estimate the health
Impact of overweight and obesity as a risk factor for chronic conditions 7

impacts from different rates of overweight and obesity in the population, burden due to overweight and obesity was estimated under three scenarios in the year 2020. The year 2020 was chosen as it aligns with the World Health Organization’s Global Action Plan for the Prevention and Control of Non-communicable Diseases 2013–2020 (WHO 2013).
The three scenarios used were:
• trend scenario: the estimated attributable burden in the year 2020 if the prevalence rate of overweight and obesity were to continue at its increasing trend as observed in measured BMI from the 2007–08, 2011–12 and 2014–15 ABS National Health Surveys
• stable rate scenario: the estimated attributable burden in the year 2020 if the prevalence rate of overweight and obesity were to remain as it was in the year 2011
• reduced scenario: the estimated attributable burden in the year 2020, if, in 2011, everyone in the population (with a BMI equal to or greater than 20) reduced their BMI by 1 kg/m2 and these rates were maintained in 2020 (for example, from a BMI of 28 to 27).
A BMI of 20 was used as the baseline in the reduced scenario, as this is the lowest TMRED possible within the range where disease risk can start to occur in this model, as discussed in Section 2.3.
The attributable burden estimates from these scenarios were compared to determine the impact, and differences between the three scenarios. Detailed information on the methods used for scenario modelling is in Appendix B.
Box 2.1: Key developments since the Australian Burden of Disease Study 2011 In this report, a number of methodological developments have occurred since the ABDS 2011. The updated methods used in this report and the potential impact on the final results are discussed here.
1. New risk estimation model and inputs
In this report, several components of the model to estimate disease risk were updated:
• TMRED was updated to 20–25 kg/m2 (it was 21–23 kg/m2 in the ABDS 2011).
• A new model was used to estimate the appropriate TMRED for each category of BMI exposure, based on the population distribution of BMI.
• Updated relative risks for breast cancer and musculoskeletal conditions were based on GBD 2015, and oesophageal cancer was based on review of the evidence.
The impact of the revised risk estimation model resulted in an extra 73,000 DALY due to overweight and obesity. These changes had the most substantial impact on the resulting estimates since the ABDS 2011.
2. Revised linked diseases
The ABDS 2011 based the diseases linked to overweight or obesity on those in GBD 2010. In this report, diseases were reviewed and updated based on the latest evidence:
• Eight (8) linked diseases (asthma in children, dementia, gallbladder disease, gout, leukaemia, liver cancer, ovarian cancer and thyroid cancer) were added.
(continued)
8 Impact of overweight and obesity as a risk factor for chronic conditions

Box 2.1 (continued): Key developments since the Australian Burden of Disease Study 2011 • Four (4) linked cardiovascular conditions were removed due to updates in GBD 2015.
The impact of the new linked diseases resulted in an extra 42,000 DALY. The removal of linked cardiovascular conditions decreased the total attributable DALY by 36,000 DALY. The revisions made to the linked diseases included in the analysis therefore resulted in a slight overall reduction in attributable DALY.
3. Extended age groups
The ABDS 2011 reported on burden due to overweight and obesity in adults aged 25 and over. In this report, this was extended to include those aged 5 and over. The impact of the extended age groups resulted in an additional 2,500 DALY.
Impact of overweight and obesity as a risk factor for chronic conditions 9

3 Burden due to overweight and obesity This chapter presents estimates of the burden attributable to overweight and obesity in Australia in 2011, including total, non-fatal and fatal burden by sex, age group and linked disease. Note there were no diseases found to be linked to overweight and obesity in those aged under 5. See Appendix Table B1 for a list of the linked diseases included in this analysis.
3.1 Total overweight and obesity burden Overweight and obesity was responsible for 7.0% of the total burden of disease and injuries in Australia in 2011, equivalent to 312,505 DALY (Table 3.1). This was 1.5 percentage points higher than that reported in the ABDS 2011 (245,816 DALY; 5.5%). The increase was largely due to changes to the model for estimating the association between the risk factor and the linked disease. It was also partly due to including additional linked diseases and excluding some existing linked diseases, based on the latest available evidence and on updates made in GBD 2015. See Box 2.1 for the key developments since the ABDS 2011, and the DALY impact of these differences.
The attributable burden due to overweight and obesity was higher in males (175,541 DALY; 7.3% of all burden) than in females (136,964 DALY; 6.6%). This is likely to be due both to higher prevalence rates of overweight/obesity among males, and to males experiencing a greater amount of disease burden than females for most of the diseases associated with overweight and obesity.
Table 3.1: Burden (DALY) attributable to overweight and obesity, by sex, 2011
Attributable DALY
Number % of total DALY
Males 175,541 7.3
Females 136,964 6.6
Persons 312,505 7.0
Source: AIHW analysis of burden of disease database, 2011.
Figure 3.1 shows the burden due to overweight and obesity (DALY counts and rates per 1,000 people) in males and females. The burden attributable to overweight and obesity increased with age in males up to age 74, with most of the burden experienced between ages 55 and 74. The burden in females peaked about 10 years later than observed in males, increasing up to age 74, with most of the burden experienced between ages 65 and 84. More burden due to overweight and obesity was experienced by males than females from age 25 onwards, as reflected in the higher DALY rates. The drop in DALY count in older age is also due to a reduced population in these age groups, rather than to decreases in the rate of burden due to overweight and obesity.
10 Impact of overweight and obesity as a risk factor for chronic conditions

Source: AIHW analysis of burden of disease database, 2011.
Figure 3.1: Burden (DALY) attributable to overweight and obesity, by age and sex, 2011
3.2 Which diseases account for the most burden due to overweight and obesity?
Around 38% of the burden attributable to overweight and obesity in Australia in 2011 was from cardiovascular diseases (118,284 DALY). Within this disease group, 27% of the entire disease burden due to overweight and obesity was due to coronary heart disease (85,324 DALY) and 9.5% due to stroke (29,684 DALY) (Table 3.2).
The collection of linked cancers accounted for 19% of the burden due to overweight and obesity from all linked diseases (60,311 DALY). Of these, breast cancer was responsible for the greatest number of DALY (15,843 DALY; 5.1%).
After coronary heart disease, diabetes was the specific disease accounting for the most burden due to overweight and obesity (53,696 DALY; 17%). Osteoarthritis was responsible for 12%, and chronic kidney disease for 5.1%, of the entire linked disease attributable burden (38,246 and 16,029 DALY, respectively). The remaining linked diseases were individually responsible for between 0.1% and 3.9% of the total disease burden due to overweight and obesity.
Attributable burden by sex In males, a greater amount of attributable burden was due to cardiovascular diseases (80,394 DALY; 50%), compared with females (37,890 DALY; 34%). This was primarily due to males experiencing greater burden due to coronary heart disease (62,220) than females (23,103).
Of the linked cancers that were not sex specific, males experienced a greater amount of burden due to overweight and obesity than females, except for gallbladder cancer (males 271 DALY; females 782 DALY). The greatest difference between the sexes of the linked cancers was seen in the top three contributing linked cancers; bowel, oesophageal and liver.
5–14 15–24 25–34 35–44 45–54 55–64 65–74 75–84 85+
Age group (years)
0
10,000
20,000
30,000
40,000
50,000
60,000
DALY (number)
0
20
40
60
80
100
DALY rate (per 1,000 people)
Females (DALY rate)Males (DALY rate)
Females (count)Males (count)
Impact of overweight and obesity as a risk factor for chronic conditions 11
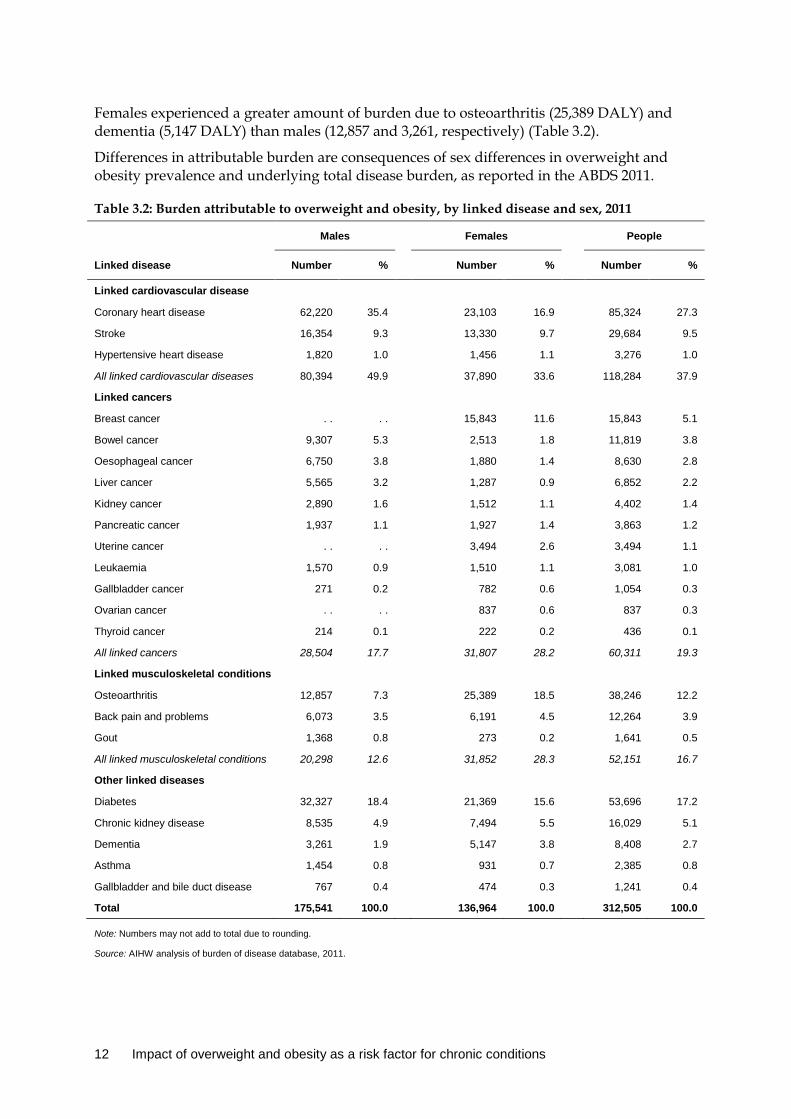
Females experienced a greater amount of burden due to osteoarthritis (25,389 DALY) and dementia (5,147 DALY) than males (12,857 and 3,261, respectively) (Table 3.2).
Differences in attributable burden are consequences of sex differences in overweight and obesity prevalence and underlying total disease burden, as reported in the ABDS 2011.
Table 3.2: Burden attributable to overweight and obesity, by linked disease and sex, 2011
Males Females People
Linked disease Number % Number % Number %
Linked cardiovascular disease
Coronary heart disease 62,220 35.4 23,103 16.9 85,324 27.3
Stroke 16,354 9.3 13,330 9.7 29,684 9.5
Hypertensive heart disease 1,820 1.0 1,456 1.1 3,276 1.0
All linked cardiovascular diseases 80,394 49.9 37,890 33.6 118,284 37.9
Linked cancers
Breast cancer . . . . 15,843 11.6 15,843 5.1
Bowel cancer 9,307 5.3 2,513 1.8 11,819 3.8
Oesophageal cancer 6,750 3.8 1,880 1.4 8,630 2.8
Liver cancer 5,565 3.2 1,287 0.9 6,852 2.2
Kidney cancer 2,890 1.6 1,512 1.1 4,402 1.4
Pancreatic cancer 1,937 1.1 1,927 1.4 3,863 1.2
Uterine cancer . . . . 3,494 2.6 3,494 1.1
Leukaemia 1,570 0.9 1,510 1.1 3,081 1.0
Gallbladder cancer 271 0.2 782 0.6 1,054 0.3
Ovarian cancer . . . . 837 0.6 837 0.3
Thyroid cancer 214 0.1 222 0.2 436 0.1
All linked cancers 28,504 17.7 31,807 28.2 60,311 19.3
Linked musculoskeletal conditions
Osteoarthritis 12,857 7.3 25,389 18.5 38,246 12.2
Back pain and problems 6,073 3.5 6,191 4.5 12,264 3.9
Gout 1,368 0.8 273 0.2 1,641 0.5
All linked musculoskeletal conditions 20,298 12.6 31,852 28.3 52,151 16.7
Other linked diseases
Diabetes 32,327 18.4 21,369 15.6 53,696 17.2
Chronic kidney disease 8,535 4.9 7,494 5.5 16,029 5.1
Dementia 3,261 1.9 5,147 3.8 8,408 2.7
Asthma 1,454 0.8 931 0.7 2,385 0.8
Gallbladder and bile duct disease 767 0.4 474 0.3 1,241 0.4
Total 175,541 100.0 136,964 100.0 312,505 100.0
Note: Numbers may not add to total due to rounding.
Source: AIHW analysis of burden of disease database, 2011.
12 Impact of overweight and obesity as a risk factor for chronic conditions
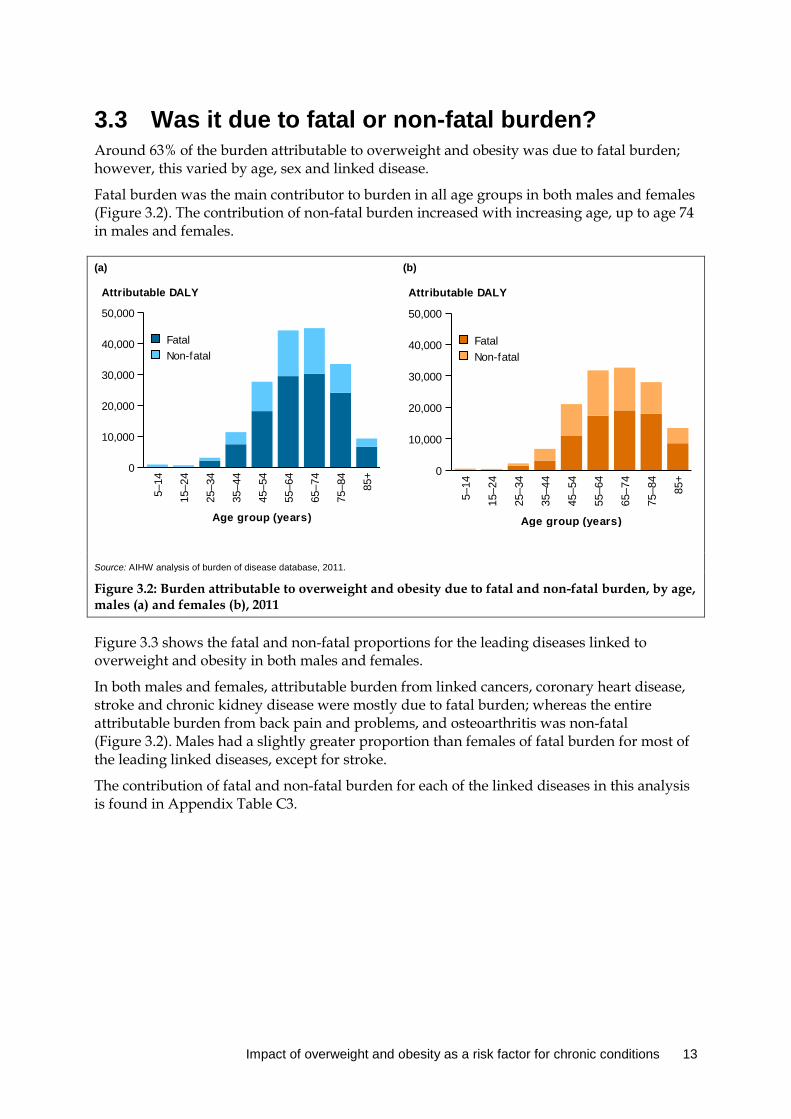
3.3 Was it due to fatal or non-fatal burden? Around 63% of the burden attributable to overweight and obesity was due to fatal burden; however, this varied by age, sex and linked disease.
Fatal burden was the main contributor to burden in all age groups in both males and females (Figure 3.2). The contribution of non-fatal burden increased with increasing age, up to age 74 in males and females.
(a) (b)
Source: AIHW analysis of burden of disease database, 2011.
Figure 3.2: Burden attributable to overweight and obesity due to fatal and non-fatal burden, by age, males (a) and females (b), 2011
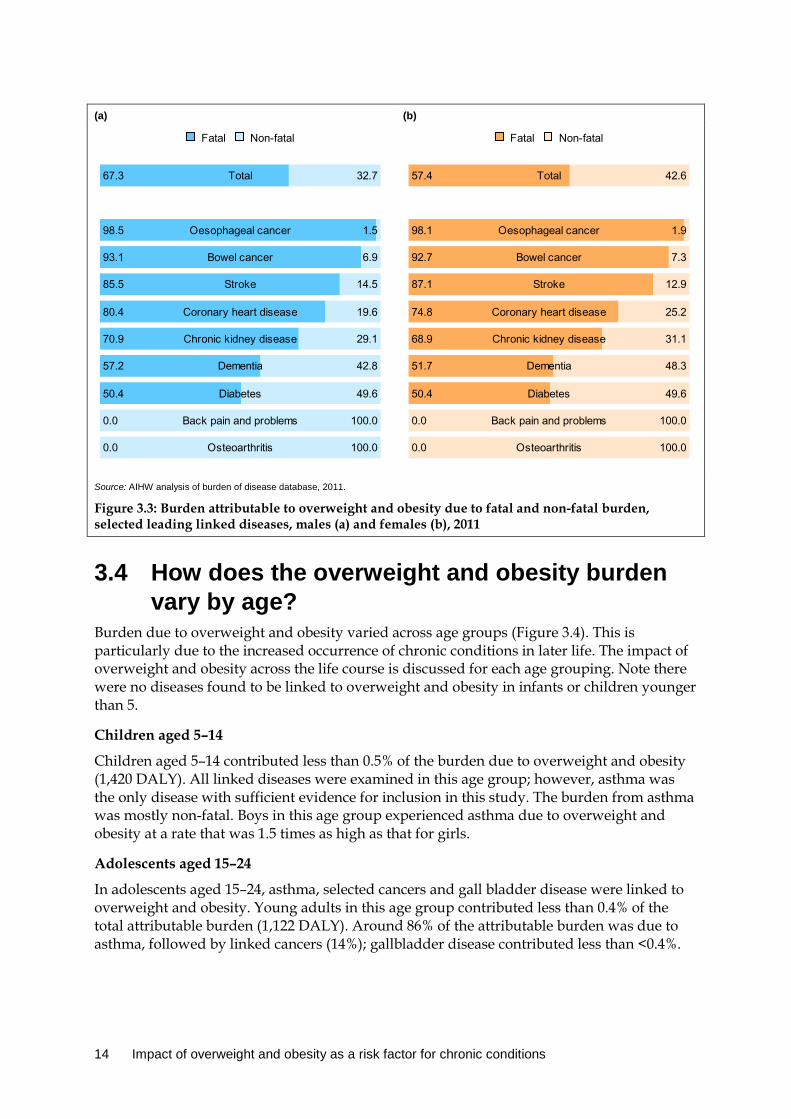
Figure 3.3 shows the fatal and non-fatal proportions for the leading diseases linked to overweight and obesity in both males and females.
In both males and females, attributable burden from linked cancers, coronary heart disease, stroke and chronic kidney disease were mostly due to fatal burden; whereas the entire attributable burden from back pain and problems, and osteoarthritis was non-fatal (Figure 3.2). Males had a slightly greater proportion than females of fatal burden for most of the leading linked diseases, except for stroke.
The contribution of fatal and non-fatal burden for each of the linked diseases in this analysis is found in Appendix Table C3.
5–14
15–2
4
25–3
4
35–4
4
45–5
4
55–6
4
65–7
4
75–8
4
85+
Age group (years)
0
10,000
20,000
30,000
40,000
50,000
Attributable DALY
Non-fatalFatal
5–14
15–2
4
25–3
4
35–4
4
45–5
4
55–6
4
65–7
4
75–8
4
85+
Age group (years)
0
10,000
20,000
30,000
40,000
50,000
Attributable DALY
Non-fatalFatal
Impact of overweight and obesity as a risk factor for chronic conditions 13
(a) (b)
Source: AIHW analysis of burden of disease database, 2011.
Figure 3.3: Burden attributable to overweight and obesity due to fatal and non-fatal burden, selected leading linked diseases, males (a) and females (b), 2011
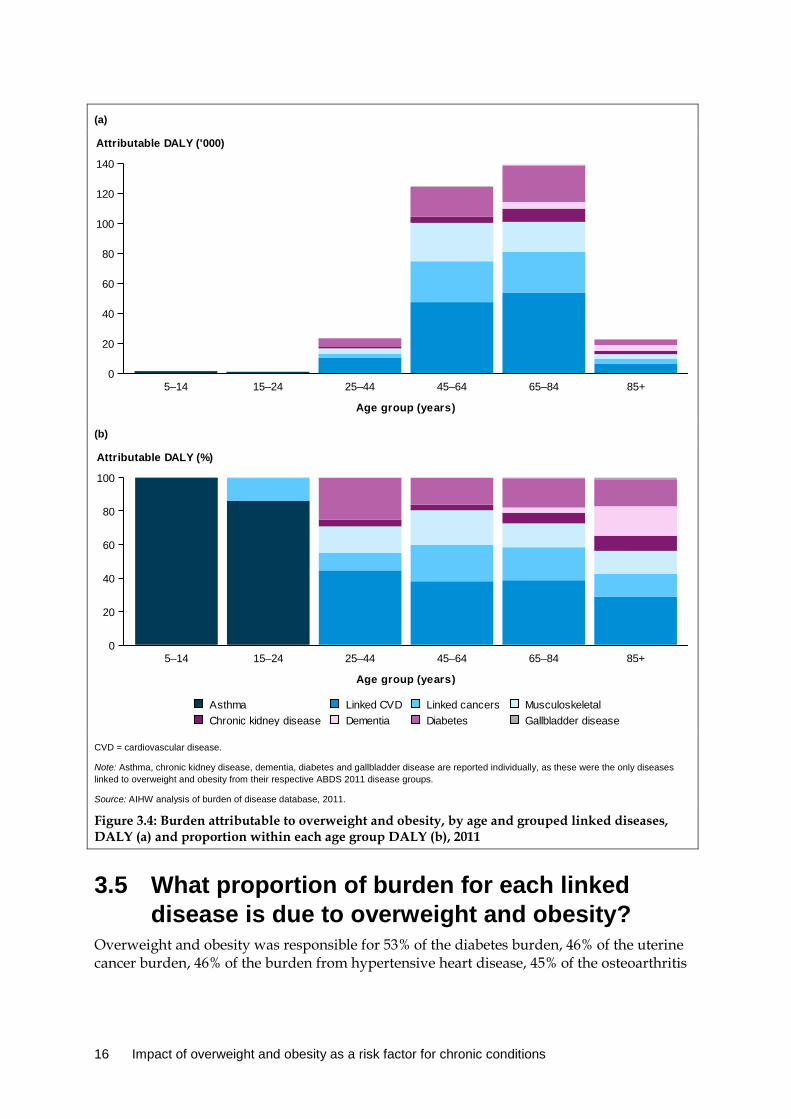
3.4 How does the overweight and obesity burden vary by age?
Burden due to overweight and obesity varied across age groups (Figure 3.4). This is particularly due to the increased occurrence of chronic conditions in later life. The impact of overweight and obesity across the life course is discussed for each age grouping. Note there were no diseases found to be linked to overweight and obesity in infants or children younger than 5.
Children aged 5–14
Children aged 5–14 contributed less than 0.5% of the burden due to overweight and obesity (1,420 DALY). All linked diseases were examined in this age group; however, asthma was the only disease with sufficient evidence for inclusion in this study. The burden from asthma was mostly non-fatal. Boys in this age group experienced asthma due to overweight and obesity at a rate that was 1.5 times as high as that for girls.
Adolescents aged 15–24
In adolescents aged 15–24, asthma, selected cancers and gall bladder disease were linked to overweight and obesity. Young adults in this age group contributed less than 0.4% of the total attributable burden (1,122 DALY). Around 86% of the attributable burden was due to asthma, followed by linked cancers (14%); gallbladder disease contributed less than <0.4%.
Non-fatalFatal
Total67.3 32.7
Oesophageal cancer98.5 1.5
Bowel cancer93.1 6.9
Stroke85.5 14.5
Coronary heart disease80.4 19.6
Chronic kidney disease70.9 29.1
Dementia57.2 42.8
Diabetes50.4 49.6
Back pain and problems0.0 100.0
Osteoarthritis0.0 100.0
Non-fatalFatal
Total57.4 42.6
Oesophageal cancer98.1 1.9
Bowel cancer92.7 7.3
Stroke87.1 12.9
Coronary heart disease74.8 25.2
Chronic kidney disease68.9 31.1
Dementia51.7 48.3
Diabetes50.4 49.6
Back pain and problems0.0 100.0
Osteoarthritis0.0 100.0
14 Impact of overweight and obesity as a risk factor for chronic conditions

Adults aged 25–44
Adults aged 25–44 contributed 7.5% of the burden due to overweight and obesity (23,456 DALY). Burden due to the onset of cardiovascular disease, diabetes and musculoskeletal conditions becomes evident in this age group.
The attributable burden in adults aged 25–44 is largely due to the impact of cardiovascular conditions (10,452 DALY), responsible for 45% of the attributable burden in this age group. Diabetes and musculoskeletal conditions become increasing causes of attributable burden, contributing 25% and 16%, respectively, of the burden in this age group.
Adults aged 45–64
In total, 40% of the burden due to overweight and obesity was from adults aged 45–64 (124,674 DALY). This is 5.3 times as high as the burden experienced by adults aged 25–44. The development of chronic conditions and the impact from overweight and obesity are evident with increasing age.
Around 38% of this burden was due to cardiovascular conditions (47,472 DALY). This was followed by linked cancers (27,218 DALY), diabetes (19,944) and musculoskeletal conditions (25,567). Linked cancers became an increased contributor—causing 22% of the attributable burden in this age group, compared with 11% in adults aged 25–44.
Adults aged 65–84
Adults aged 65–84 contributed 45% of the burden due to overweight and obesity (139,084 DALY). This age group experienced the greatest amount of burden due to overweight and obesity. This was mainly from cardiovascular disease (53,826), linked cancers (27,323) and diabetes (24,242).
The impact of dementia, chronic kidney disease and diabetes is increased in this age group, compared with that for adults aged 45–64. Dementia burden was responsible for 3.2% of the attributable burden in adults age 65–84 (4,398 DALY). Chronic kidney disease attributable burden increased from 4,182 DALY in those aged 45–64 to 8,852 DALY in those aged 65–84. For diabetes, this increased from 19,944 DALY to 24,242 DALY.
Adults aged 85+
In older Australians, the impact of overweight and obesity was mainly due to burden from cardiovascular conditions, dementia and diabetes (6,534, 4,010 and 3,660 DALY, respectively). The attributable burden in this age group is 6.1 times as low as the burden experienced by adults aged 65–84, mainly due to the smaller number of people still alive in this age group. However, the attributable burden due to dementia was similar to that for those aged 65–84, indicating that dementia burden increased with age.
Impact of overweight and obesity as a risk factor for chronic conditions 15
(a)
(b)
CVD = cardiovascular disease.
Note: Asthma, chronic kidney disease, dementia, diabetes and gallbladder disease are reported individually, as these were the only diseases linked to overweight and obesity from their respective ABDS 2011 disease groups.
Source: AIHW analysis of burden of disease database, 2011.
Figure 3.4: Burden attributable to overweight and obesity, by age and grouped linked diseases, DALY (a) and proportion within each age group DALY (b), 2011
3.5 What proportion of burden for each linked disease is due to overweight and obesity?
Overweight and obesity was responsible for 53% of the diabetes burden, 46% of the uterine cancer burden, 46% of the burden from hypertensive heart disease, 45% of the osteoarthritis
5–14 15–24 25–44 45–64 65–84 85+
Age group (years)
0
20
40
60
80
100
120
140
Attributable DALY ('000)
5–14 15–24 25–44 45–64 65–84 85+
Age group (years)
0
20
40
60
80
100
Attributable DALY (%)
Gallbladder diseaseDiabetesDementiaChronic kidney diseaseMusculoskeletalLinked cancersLinked CVDAsthma
16 Impact of overweight and obesity as a risk factor for chronic conditions

burden, 38% of the burden from oesophageal cancer and 38% of chronic kidney disease burden (Table 3.3).
Table 3.3: Number and proportion of disease burden due to overweight and obesity (attributable DALY), by linked disease, 2011
Linked disease Total DALY DALY attributable to overweight/ obesity
% of linked disease burden due to overweight/ obesity
Coronary heart disease 346,651 85,324 24.6
Diabetes 101,653 53,696 52.8
Osteoarthritis 85,806 38,246 44.6
Stroke 136,771 29,684 21.7
Chronic kidney disease 42,574 16,029 37.6
Breast cancer 70,675 15,843 22.4
Back pain and problems 163,788 12,264 7.5
Bowel cancer 92,422 11,819 12.8
Oesophageal cancer 22,584 8,630 38.2
Dementia 151,308 8,408 5.6
Liver cancer 29,376 6,852 23.3
Kidney cancer 17,774 4,402 24.8
Pancreatic cancer 44,428 3,863 8.7
Uterine cancer 7,622 3,494 45.8
Hypertensive heart disease 7,146 3,276 45.8
Leukaemia 30,629 3,081 10.1
Asthma 107,313 2,385 2.2
Gout 4,257 1,641 38.5
Gallbladder and bile duct disease 5,110 1,241 24.3
Gallbladder cancer 4,287 1,054 24.6
Ovarian cancer 19,421 837 4.3
Thyroid cancer 2,634 436 16.5
Total 4,494,427 312,505 7.0
Note: The ‘%’ column is the attributable DALY divided by the linked disease burden in 2011 of that row.
Source: AIHW analysis of burden of disease database, 2011.
The number of DALY due to overweight and obesity varied by sex for each linked disease (Figure 3.5). Males experienced a greater amount of burden attributable to overweight and obesity than females for all linked diseases that were not sex specific, except for dementia and osteoarthritis. The burden was similar for males and females for back pain and problems attributable burden.
Impact of overweight and obesity as a risk factor for chronic conditions 17
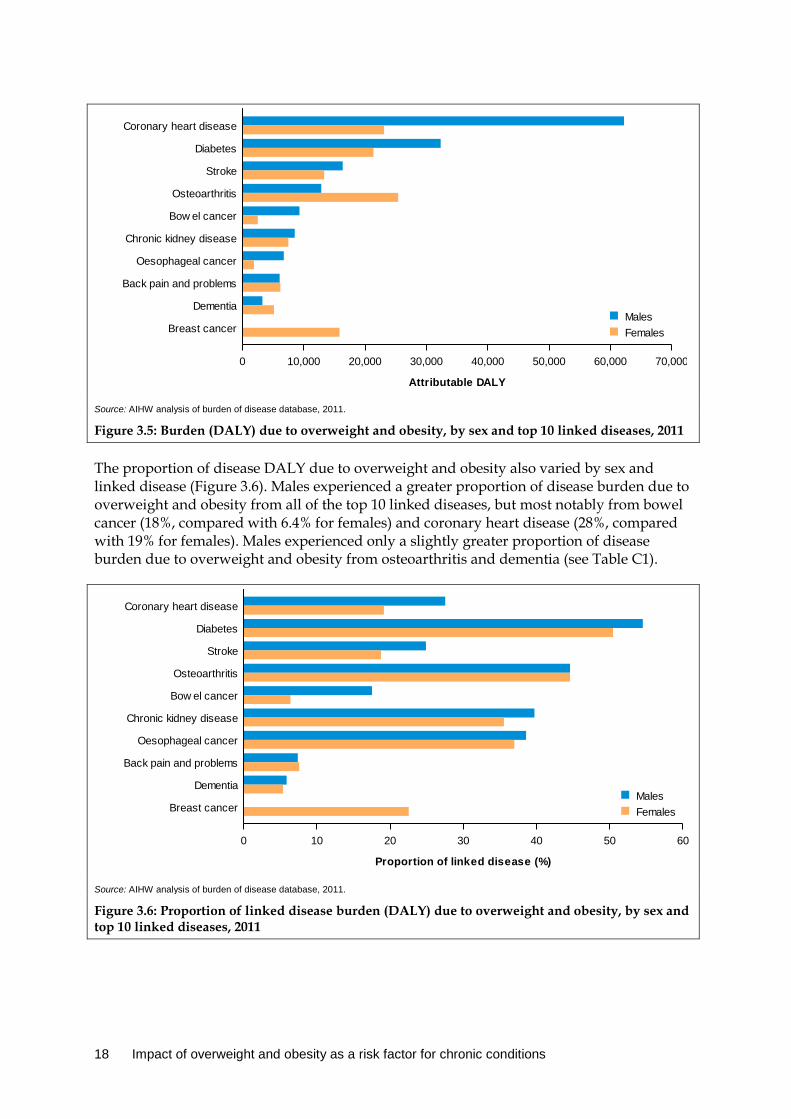
Source: AIHW analysis of burden of disease database, 2011.
Figure 3.5: Burden (DALY) due to overweight and obesity, by sex and top 10 linked diseases, 2011
The proportion of disease DALY due to overweight and obesity also varied by sex and linked disease (Figure 3.6). Males experienced a greater proportion of disease burden due to overweight and obesity from all of the top 10 linked diseases, but most notably from bowel cancer (18%, compared with 6.4% for females) and coronary heart disease (28%, compared with 19% for females). Males experienced only a slightly greater proportion of disease burden due to overweight and obesity from osteoarthritis and dementia (see Table C1).
Source: AIHW analysis of burden of disease database, 2011.
Figure 3.6: Proportion of linked disease burden (DALY) due to overweight and obesity, by sex and top 10 linked diseases, 2011
0 10,000 20,000 30,000 40,000 50,000 60,000 70,000
Attributable DALY
Breast cancer
Dementia
Back pain and problems
Oesophageal cancer
Chronic kidney disease
Bow el cancer
Osteoarthritis
Stroke
Diabetes
Coronary heart disease
FemalesMales
0 10 20 30 40 50 60
Proportion of linked disease (%)
Breast cancer
Dementia
Back pain and problems
Oesophageal cancer
Chronic kidney disease
Bow el cancer
Osteoarthritis
Stroke
Diabetes
Coronary heart disease
FemalesMales
18 Impact of overweight and obesity as a risk factor for chronic conditions
Detailed estimates for selected linked diseases Further detail is provided in this section on the burden due to overweight and obesity for cardiovascular conditions, cancer, diabetes, musculoskeletal conditions, dementia and chronic kidney disease.
Cardiovascular disease The greatest amount of burden attributable to overweight and obesity was from the three linked cardiovascular diseases (118,284 DALY; Table 3.2). Attributable burden from cardiovascular diseases was 2 times as high in males (80,394 DALY) as in females (37,890).
The majority of this burden was due to coronary heart disease (85,324 DALY), followed by stroke (29,684) and hypertensive heart disease (3,276). The attributable burden from all cardiovascular conditions increased with age, peaking at 15,557 DALY between ages 60 to 64. The attributable burden from stroke particularly increased after age 65, peaking at ages 75 to 79 (4,397 DALY).
In total, 25% of the coronary heart disease burden, 22% of the stroke burden and 46% of the hypertensive heart disease burden was attributable to overweight and obesity (Table 3.3).
Cancer Cancer contributed to 19% of the total burden from all diseases linked to overweight and obesity (Table 3.2). Burden due to overweight and obesity from linked cancers was slightly higher in females (31,807 DALY) than in males (28,504). The attributable burden from linked cancers increased with age, with the most burden occurring between ages 60 to 64 (10,157 DALY).
The cancer types attributable to overweight and obesity that caused the most burden were breast cancer in post-menopausal females (15,843 DALY), bowel cancer (11,819), oesophageal cancer (8,630) and liver cancer (6,854). These four cancer types were responsible for 72% of the cancer burden attributable to overweight and obesity.
Uterine, breast and ovarian cancer were estimated only for the female population, and only in women aged 50 and over for breast cancer. Overweight and obesity attributed to 46%, 22% and 4.0% of the uterine, breast and ovarian cancer burden, respectively.
For the remaining linked cancers, overweight and obesity was responsible for 25% of the gallbladder cancer burden, 25% of the kidney cancer burden, 16% of the thyroid cancer burden, 10% of leukaemia burden and 8.7% of the pancreatic burden.
Diabetes The second greatest amount of burden due to overweight and obesity from a single linked disease was diabetes—a total of 53,696 DALY. Burden due to overweight and obesity from diabetes was higher in males (32,327 DALY) than in females (21,369). The attributable burden from diabetes increased steeply with age, peaking at 7,203 DALY between ages 65 to 69. In total, 53% of the diabetes burden was attributable to overweight and obesity (Table 3.3).
Impact of overweight and obesity as a risk factor for chronic conditions 19
Musculoskeletal conditions Musculoskeletal conditions contributed to 17% of the burden due to overweight and obesity from all linked diseases (Table 3.2). Attributable burden from musculoskeletal conditions was 1.6 times as high in females (31,852 DALY) as in males (20,298). The attributable burden from all musculoskeletal conditions increased with age up to age 65, peaking at 7,783 DALY between ages 60 and 64.
Osteoarthritis contributed to 73% of the attributable musculoskeletal burden (38,246 DALY). Back pain and problems contributed the majority of the remaining linked musculoskeletal burden (12,264 DALY).
Burden due to overweight and obesity from osteoarthritis and gout was measured from age 25 onwards. The attributable burden from osteoarthritis increased steeply with age up to age 65, peaking at 5,808 DALY. After age 65, the attributable burden declined steeply. This pattern was also seen in the attributable burden from gout, but the overall burden was smaller.
The attributable burden from back pain and problems was measured from age 40 onwards, and occurred in younger age groups, compared with the other musculoskeletal conditions. The burden from back pain and problems primarily occurred between ages 40 to 59 (between 1,620–1,848 DALY).
Chronic kidney disease Chronic kidney disease contributed to 5.1% of the burden attributable to overweight and obesity from all linked diseases (16,029 DALY). Males and females experienced a similar amount of chronic kidney disease attributable burden (53% male; 47% female). The attributable burden from chronic kidney disease increased with age, with nearly two-thirds of the attributable burden occurring between ages 60 to 84, peaking between ages 75 to 79 (2,496 DALY).
Dementia Dementia contributed to 2.7% of the burden due to overweight and obesity from all linked diseases (Table 3.3). Attributable burden from dementia was 1.4 times as high in females (5,147 DALY) as in males (3,261 DALY). Most of the dementia burden occurred between ages 85 to 89 (2,136 DALY). The attributable burden from dementia was measured only from age 65 onwards.
20 Impact of overweight and obesity as a risk factor for chronic conditions
4 Variation across socioeconomic groups
The results in this section present the burden attributable to overweight and obesity by socioeconomic group.
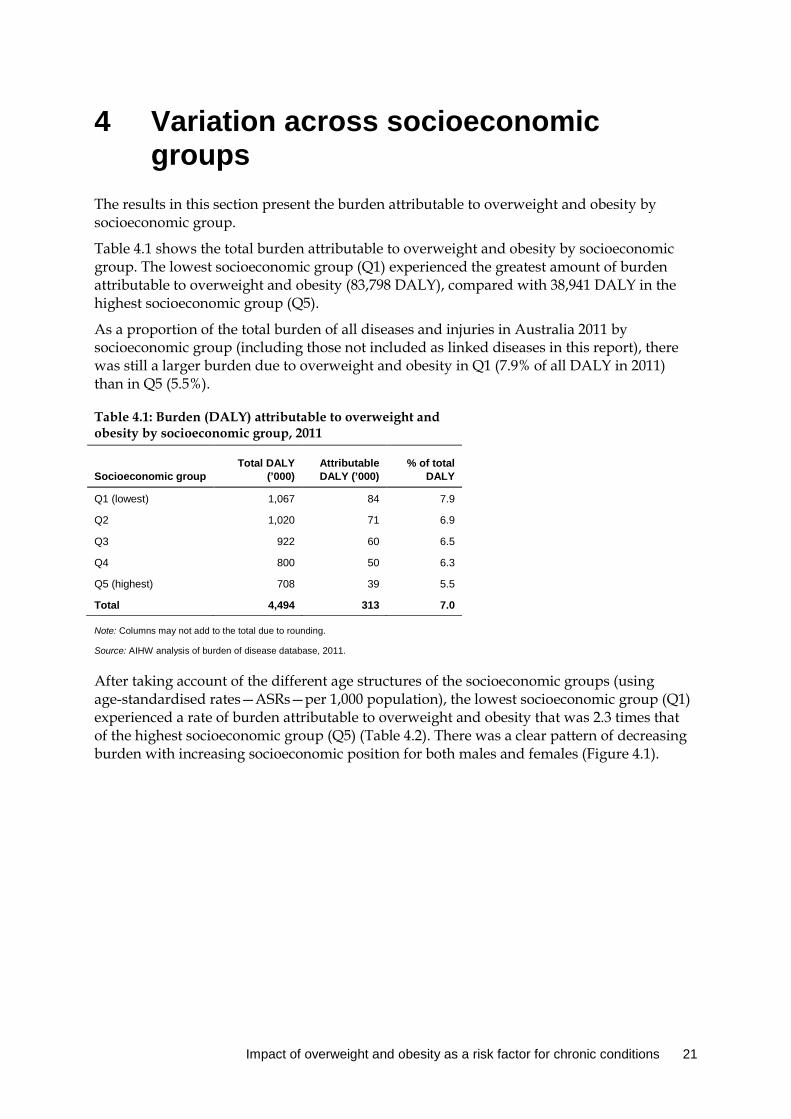
Table 4.1 shows the total burden attributable to overweight and obesity by socioeconomic group. The lowest socioeconomic group (Q1) experienced the greatest amount of burden attributable to overweight and obesity (83,798 DALY), compared with 38,941 DALY in the highest socioeconomic group (Q5).
As a proportion of the total burden of all diseases and injuries in Australia 2011 by socioeconomic group (including those not included as linked diseases in this report), there was still a larger burden due to overweight and obesity in Q1 (7.9% of all DALY in 2011) than in Q5 (5.5%).
Table 4.1: Burden (DALY) attributable to overweight and obesity by socioeconomic group, 2011
Socioeconomic group Total DALY
(’000) Attributable DALY (’000)
% of total DALY
Q1 (lowest) 1,067 84 7.9
Q2 1,020 71 6.9
Q3 922 60 6.5
Q4 800 50 6.3
Q5 (highest) 708 39 5.5
Total 4,494 313 7.0
Note: Columns may not add to the total due to rounding.
Source: AIHW analysis of burden of disease database, 2011.
After taking account of the different age structures of the socioeconomic groups (using age-standardised rates—ASRs—per 1,000 population), the lowest socioeconomic group (Q1) experienced a rate of burden attributable to overweight and obesity that was 2.3 times that of the highest socioeconomic group (Q5) (Table 4.2). There was a clear pattern of decreasing burden with increasing socioeconomic position for both males and females (Figure 4.1).
Impact of overweight and obesity as a risk factor for chronic conditions 21

Table 4.2: Attributable DALY (number, age-standardised rate (ASR) and rate ratio), by socioeconomic group, 2011
Socioeconomic group
Attributable DALY
Rate ratio Number (’000) ASR per 1,000
Q1 (lowest) 84 19.6 2.3
Q2 71 16.0 1.9
Q3 60 13.4 1.6
Q4 50 11.0 1.3
Q5 (highest) 39 8.5 1.0
Notes
1. Rates were age standardised to the 2001 Australian Standard Population, and are expressed per 1,000 people.
2. Rate ratios divide the ASR by the Q5 ASR.
Source: AIHW analysis of burden of disease database, 2011.
Note: Rates were age standardised to the 2001 Australian Standard Population, and are expressed per 1,000 people.
Source: AIHW analysis of burden of disease database, 2011.
Figure 4.1: Age-standardised attributable DALY rate due to overweight and obesity (per 1,000 people), by socioeconomic group and sex, 2011
Each socioeconomic group showed an increasing rate of burden due to overweight and obesity with increasing age (Figure 4.2). The greatest increase was seen in the lowest socioeconomic group. The disparity in attributable burden by socioeconomic group becomes evident in the older age groups. This is particularly so for age 65 and over, where the rate of burden due to overweight and obesity in the lowest socioeconomic group was almost double that of the highest socioeconomic group (63 DALY compared with 35 DALY per 1,000 people).
Q1 Q2 Q3 Q4 Q5
Socioeconomic group
0
5
10
15
20
25
DALY ASR
FemalesMales
22 Impact of overweight and obesity as a risk factor for chronic conditions

Source: AIHW analysis of burden of disease database, 2011.
Figure 4.2: Age-specific attributable DALY rate due to overweight and obesity (per 1,000 people), by socioeconomic group and age, 2011
This disparity across socioeconomic groups was seen in all the linked diseases (Appendix Table C3). Figure 4.3 shows the age-standardised DALY rate per 1,000 people for the leading diseases attributable to overweight and obesity. This shows a general pattern of decreasing burden due to overweight and obesity with increasing socioeconomic group, with the strongest gradients observed for diabetes (Q1:Q5 rate ratio of 2.8), chronic kidney disease (2.8) and coronary heart disease (2.5).
Note: Rates were age standardised to the 2001 Australian Standard Population, and are expressed per 1,000 people.
Source: AIHW analysis of burden of disease database, 2011.
Figure 4.3: Age-standardised attributable DALY rate due to overweight and obesity for top six linked diseases, by socioeconomic group, 2011
5–14 15–24 25–34 35–44 45–54 55–64 65+
Age group (years)
0
10
20
30
40
50
60
DALY rate (per 1,000 people)
Q5 (highest)Q4Q3Q2Q1 (low est)
diseaseCoronary heart Diabetes Osteoarthritis Stroke
diseaseChronic kidney Bow el cancer
Disease
0
2
4
6
8
10
12
Age standardised DALY rate (per 1,000)
Q5 (highest)Q4Q3Q2Q1 (low est)
Impact of overweight and obesity as a risk factor for chronic conditions 23

5 Changes between 2011 and 2003 This chapter compares the burden attributable to overweight and obesity in 2003 and 2011.
The total burden attributable to overweight and obesity was 10% higher in 2011 than in 2003 (312,505 DALY in 2011 compared with 280,205 DALY in 2003) (Table 5.1). This was due to an increase in the prevalence rate of overweight and obesity in the population and to increases in total burden for the linked diseases between 2003 and 2011. However, when taking into account differences between the 2011 and 2003 population size and age structure, the age-standardised attributable DALY rate was similar for 2003 and 2011 (rate ratio of 1.0).
The burden was higher in most age groups in 2011 than in 2003, with the greatest differences observed for ages 55–64, and those aged over 85 (Figure 5.1). Age-specific DALY rates in 2011 were similar to those in 2003 in people aged under 55. In people aged 55–74, DALY rates were higher in 2003 than in 2011, but in people aged 85 and over, rates were higher in 2011 than in 2003.
Table 5.1: Comparison of burden (DALY) attributable to overweight and obesity, 2003 and 2011 DALY count
Change in DALY (%)
% of total DALY DALY ASR ASR rate ratio
2011:2003
2003 2011 2003 2011 2003 2011
Males 162,796 175,541 7.3 7.2 7.3 16.6 15.8 1.1
Females 117,409 136,964 14.3 6.1 6.6 11.8 12.2 1.0
Persons 280,205 312,505 10.3 6.7 7.0 14.2 14.0 1.0
Note: The ‘% of total DALY’ column is the number of DALY divided by the total DALY in Australia of that row.
Source: AIHW analysis of burden of disease database, 2011.
Source: AIHW analysis of burden of disease database, 2011.
Figure 5.1: Number and rates of burden (DALY per 1,000 people) attributable to overweight and obesity, by age, 2003 and 2011
As discussed in this report, overweight and obesity is linked to a number of different diseases, the most prevalent being cardiovascular diseases. Between 2003 and 2011, there
5–14 15–24 25–34 35–44 45–54 55–64 65–74 75–84 85+
Age group (years)
0
20,000
40,000
60,000
80,000
100,000
DALY (number)
0
15
30
45
60
75
90
DALY rate (per 1,000 people)
2011 (DALY rate)2003 (DALY rate)
2011 (DALY count)2003 (DALY count)
24 Impact of overweight and obesity as a risk factor for chronic conditions
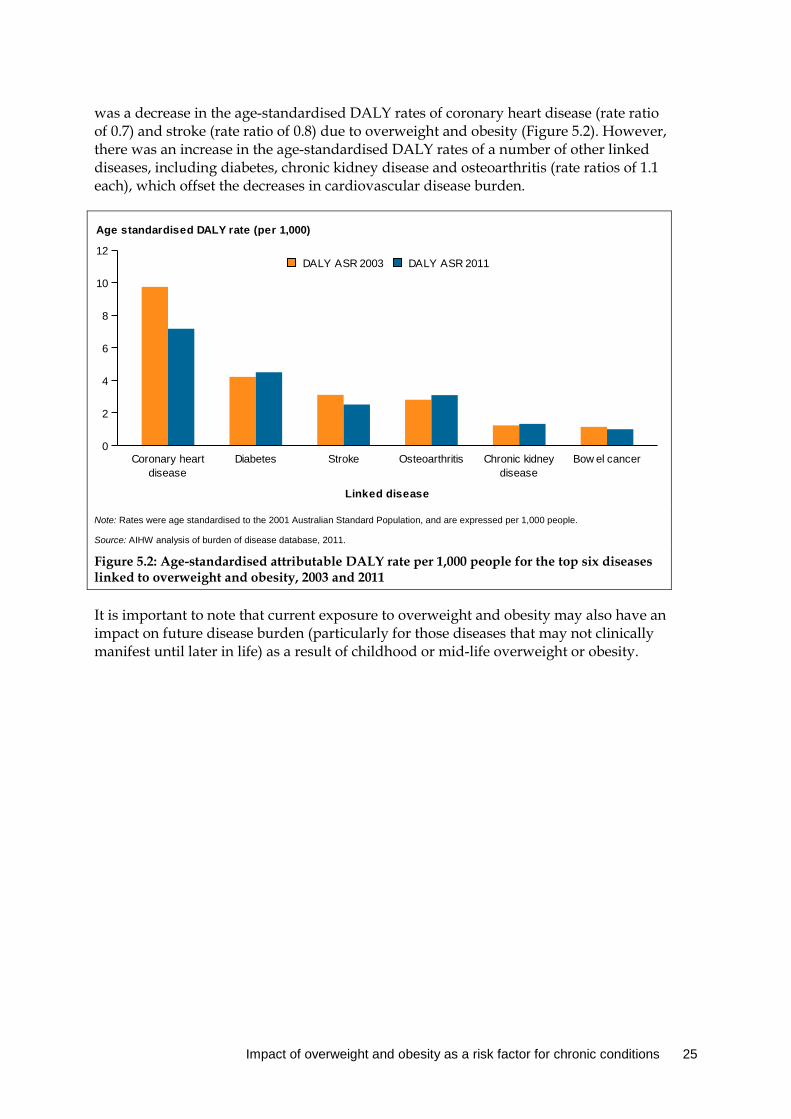
was a decrease in the age-standardised DALY rates of coronary heart disease (rate ratio of 0.7) and stroke (rate ratio of 0.8) due to overweight and obesity (Figure 5.2). However, there was an increase in the age-standardised DALY rates of a number of other linked diseases, including diabetes, chronic kidney disease and osteoarthritis (rate ratios of 1.1 each), which offset the decreases in cardiovascular disease burden.
Note: Rates were age standardised to the 2001 Australian Standard Population, and are expressed per 1,000 people.
Source: AIHW analysis of burden of disease database, 2011.
Figure 5.2: Age-standardised attributable DALY rate per 1,000 people for the top six diseases linked to overweight and obesity, 2003 and 2011
It is important to note that current exposure to overweight and obesity may also have an impact on future disease burden (particularly for those diseases that may not clinically manifest until later in life) as a result of childhood or mid-life overweight or obesity.
diseaseCoronary heart Diabetes Stroke Osteoarthritis
diseaseChronic kidney Bow el cancer
Linked disease
0
2
4
6
8
10
12
Age standardised DALY rate (per 1,000)
DALY ASR 2011DALY ASR 2003
Impact of overweight and obesity as a risk factor for chronic conditions 25

6 Scenario modelling Scenario modelling was used to assess the impact of overweight and obesity on the potential burden in 2020. The scenarios used to compare potential attributable burden in 2020 were:
• trend scenario: the estimated attributable burden in the year 2020 if the prevalence rate of overweight and obesity were to continue to rise at its current increasing trend
• stable rate scenario: the estimated attributable burden in the year 2020 if the prevalence rate of overweight and obesity were to remain at 2011 levels
• reduced scenario: the estimated attributable burden in the year 2020 if everyone in the population at risk in 2011 reduced their BMI by 1 kg/m2 and these rates were maintained to 2020.
Determining associations between chronic diseases and associated chronic disease burden in the future is complex. Hence, linked disease burden estimates in 2020 used in the scenario modelling were based on the underlying assumption that disease prevalence rates from the ABDS 2011 would stay the same to the year 2020, with increases due to population growth and ageing alone. This assumption is simplistic, but it provides a consistent baseline for each scenario in order to estimate the difference in attributable burden between them. This chapter compares the prevalence and potential burden due to overweight and obesity in 2020 under these three hypothetical scenarios. See Appendix A for further detail on the methods.
6.1 Overweight and obesity prevalence in 2020 In this scenario modelling analysis, the sole difference between the three scenarios is the difference in the projected overweight and obesity prevalence in 2020. It is important to note that the analysis in this report uses BMI as a continuous variable; disease risk starts from a BMI of 20, with risk increasing with higher BMI. The overweight and obesity categories in this section are used to demonstrate trends, and make comparisons with alternative studies. See Chapter 2 and Appendix A for a detailed description of the methods used to calculate TMRED values and disease risk.
The proportion of Australians estimated to be overweight or obese under the trend, stable rate and reduced scenarios in 2020 are shown in Table 6.1. If the prevalence of overweight and obesity is maintained at 2011 levels, 57% of the population is expected to be overweight or obese in 2020. In contrast, if current trends continued, 60% of the population is expected to be overweight or obese in 2020. Lastly, if everyone in the population with a BMI equal to or greater than 20 in 2011 reduced their BMI by 1 kg/m2, and these rates were maintained in 2020, 49% of the population is expected to be overweight or obese in 2020 (18% lower than if current trends continued).
When looking at overweight and obesity separately, and at males and females separately, some different patterns emerge. Based on current trends, the proportion of males who are overweight but not obese is expected to increase only slightly (by 2.1%) between 2011 and 2020, while the proportion of males who are obese is expected to increase by 8.5%. In contrast, the proportion of females who are overweight but not obese is expected to decrease by 5.2% between 2011 and 2020, while the proportion of females who are obese is expected
26 Impact of overweight and obesity as a risk factor for chronic conditions
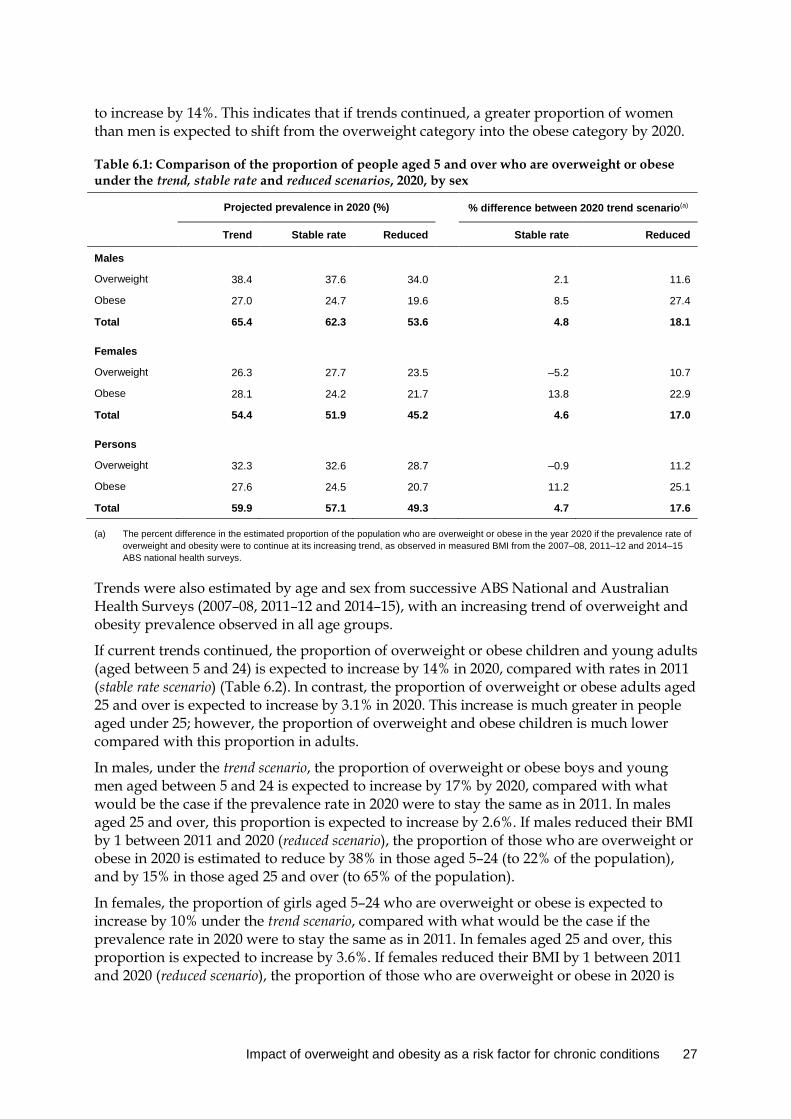
to increase by 14%. This indicates that if trends continued, a greater proportion of women than men is expected to shift from the overweight category into the obese category by 2020.
Table 6.1: Comparison of the proportion of people aged 5 and over who are overweight or obese under the trend, stable rate and reduced scenarios, 2020, by sex
Projected prevalence in 2020 (%) % difference between 2020 trend scenario(a)
Trend Stable rate Reduced Stable rate Reduced
Males
Overweight 38.4 37.6 34.0 2.1 11.6
Obese 27.0 24.7 19.6 8.5 27.4
Total 65.4 62.3 53.6 4.8 18.1
Females
Overweight 26.3 27.7 23.5 –5.2 10.7
Obese 28.1 24.2 21.7 13.8 22.9
Total 54.4 51.9 45.2 4.6 17.0
Persons
Overweight 32.3 32.6 28.7 –0.9 11.2
Obese 27.6 24.5 20.7 11.2 25.1
Total 59.9 57.1 49.3 4.7 17.6
(a) The percent difference in the estimated proportion of the population who are overweight or obese in the year 2020 if the prevalence rate of overweight and obesity were to continue at its increasing trend, as observed in measured BMI from the 2007–08, 2011–12 and 2014–15 ABS national health surveys.
Trends were also estimated by age and sex from successive ABS National and Australian Health Surveys (2007–08, 2011–12 and 2014–15), with an increasing trend of overweight and obesity prevalence observed in all age groups.
If current trends continued, the proportion of overweight or obese children and young adults (aged between 5 and 24) is expected to increase by 14% in 2020, compared with rates in 2011 (stable rate scenario) (Table 6.2). In contrast, the proportion of overweight or obese adults aged 25 and over is expected to increase by 3.1% in 2020. This increase is much greater in people aged under 25; however, the proportion of overweight and obese children is much lower compared with this proportion in adults.
In males, under the trend scenario, the proportion of overweight or obese boys and young men aged between 5 and 24 is expected to increase by 17% by 2020, compared with what would be the case if the prevalence rate in 2020 were to stay the same as in 2011. In males aged 25 and over, this proportion is expected to increase by 2.6%. If males reduced their BMI by 1 between 2011 and 2020 (reduced scenario), the proportion of those who are overweight or obese in 2020 is estimated to reduce by 38% in those aged 5–24 (to 22% of the population), and by 15% in those aged 25 and over (to 65% of the population).
In females, the proportion of girls aged 5–24 who are overweight or obese is expected to increase by 10% under the trend scenario, compared with what would be the case if the prevalence rate in 2020 were to stay the same as in 2011. In females aged 25 and over, this proportion is expected to increase by 3.6%. If females reduced their BMI by 1 between 2011 and 2020 (reduced scenario), the proportion of those who are overweight or obese in 2020 is
Impact of overweight and obesity as a risk factor for chronic conditions 27

estimated to reduce by 30% in those aged 5–24 (to 23% of the population) and by 15% in those aged 25 and over (to 53% of the population).
Table 6.2: Comparison of the proportion of people who are overweight or obese under the trend, stable rate and reduced scenarios, 2020, by sex and broad age group
Age (years)
Projected prevalence in 2020 (%) % difference between 2020 scenarios(a)
Trend(a) Stable rate Reduced Stable rate Reduced
Males
5–24 36.0 29.9 22.2 17.0 38.2
25+ 76.5 74.6 65.4 2.6 14.5
Females
5–24 33.0 29.7 23.3 10.1 29.5
25+ 61.9 59.6 52.8 3.6 14.7
Persons
5–24 34.6 29.8 22.8 13.8 34.2
25+ 69.1 67.0 59.0 3.1 14.6
(a) The percent difference in the estimated proportion of the population who are overweight or obese in the year 2020 if the prevalence rate of overweight and obesity were to continue at its increasing trend, as observed in measured BMI from the 2007–08, 2011–12 and 2014–15 ABS National Health Surveys.
6.2 Overweight /obesity burden comparison in 2020 Table 6.3 compares the estimated burden due to overweight and obesity in 2020 under the trend, stable rate and reduced scenarios.
If the prevalence of overweight and obesity were to continue to rise at its current rate, as demonstrated under the trend scenario, the disease burden due to overweight and obesity would be 6.3% (22,070 DALY) greater than if the overweight and obesity rate remained stable—that is, at 2011 levels. Furthermore, if everyone in the population at risk of linked diseases (those with a BMI equal to or greater than 20) in 2011 were to reduce their BMI by 1 kg/m2, and these rates were maintained to 2020, the burden due to overweight and obesity would be reduced by 14% (48,279 DALY) compared with what would be the case if overweight and obesity continued to rise at its current rate.
In males, 5.2% of future disease burden (10,816 DALY) due to overweight and obesity in 2020 could be avoided if prevalence rates were maintained at 2011 levels instead of continuing to rise. This increases to a 12% reduction if all males in the population were to reduce their BMI by 1 between 2011 and 2020.
In females, 7.8% of future disease burden (11,254 DALY) due to overweight and obesity in 2020 could be avoided if prevalence rates were to remain stable (that is, maintained at 2011 levels) compared with what would be the case if current trends continued. This increases to a 17% reduction if all females in the population were to reduce their BMI by 1 between 2011 and 2020.
Under each of the scenarios, the burden in 2020 is greater than that experienced in 2011, as described in Chapter 3. This is a consequence of population growth and ageing under the stable rate and reduced scenarios, and a combination of these factors and increased overweight and obesity in the population under the trend scenario.
28 Impact of overweight and obesity as a risk factor for chronic conditions

Table 6.3: Comparison of projected burden due to overweight and obesity in 2020
Attributable DALY avoided under scenarios
Attributable DALY under scenarios Stable rate(a) Reduced(b)
Trend Stable rate Reduced DALY %(c) DALY %(c)
Males 208,094 197,278 183,831 10,816 –5.2 24,263 –11.7
Females 143,583 132,329 119,567 11,254 –7.8 24,016 –16.7
Persons 351,676 329,606 303,398 22,070 –6.3 48,279 –13.7
(a) ‘DALY avoided’ refers to the difference between future attributable burden for each sex if the prevalence rate of overweight and obesity remained the same as in 2011 ‘stable rate scenario’ compared with the expected attributable burden under current trends ‘trend scenario’.
(b) ‘DALY avoided’ refers to the difference between future attributable burden for each sex if, in 2011, everyone were to reduce their BMI by 1 kg/m2 and this prevalence rate of overweight and obesity remained the same as in 2011 ‘reduced scenario’ compared with the expected attributable burden under current trends ‘trend scenario’.
(c) DALY avoided expressed as a percentage of projected attributable burden in 2020 under ‘trend scenario’.
Source: AIHW analysis of burden of disease database, 2011.
6.3 Scenario differences by age The estimated burden due to overweight and obesity in 2020 varies by age under the three different scenarios (Figure 6.1). In each of the scenarios, the attributable burden estimated for 2020 increased with increasing age up to age 74, with the greatest amount of burden due to overweight and obesity in ages 65–74.
This analysis suggests that, in terms of the absolute number of DALY avoided, the largest gains could be made in reducing overweight and obesity between ages 35 and 74. The largest DALY difference was in ages 65–74, where 5,379 DALY could be avoided in 2020 if prevalence were maintained at 2011 levels (stable rate scenario), compared with what would be the case if current trends continued (trend scenario).
Source: AIHW analysis of burden of disease database, 2011.
Figure 6.1: Burden (DALY) due to overweight and obesity by age, under the trend, stable rate and reduced scenarios, 2020
5–14 15–24 25–34 35–44 45–54 55–64 65–74 75–84 85+
Age group (years)
0
20,000
40,000
60,000
80,000
100,000
Attributable DALY in 2020
Reduced scenarioStable rate scenarioTrend scenario
Impact of overweight and obesity as a risk factor for chronic conditions 29
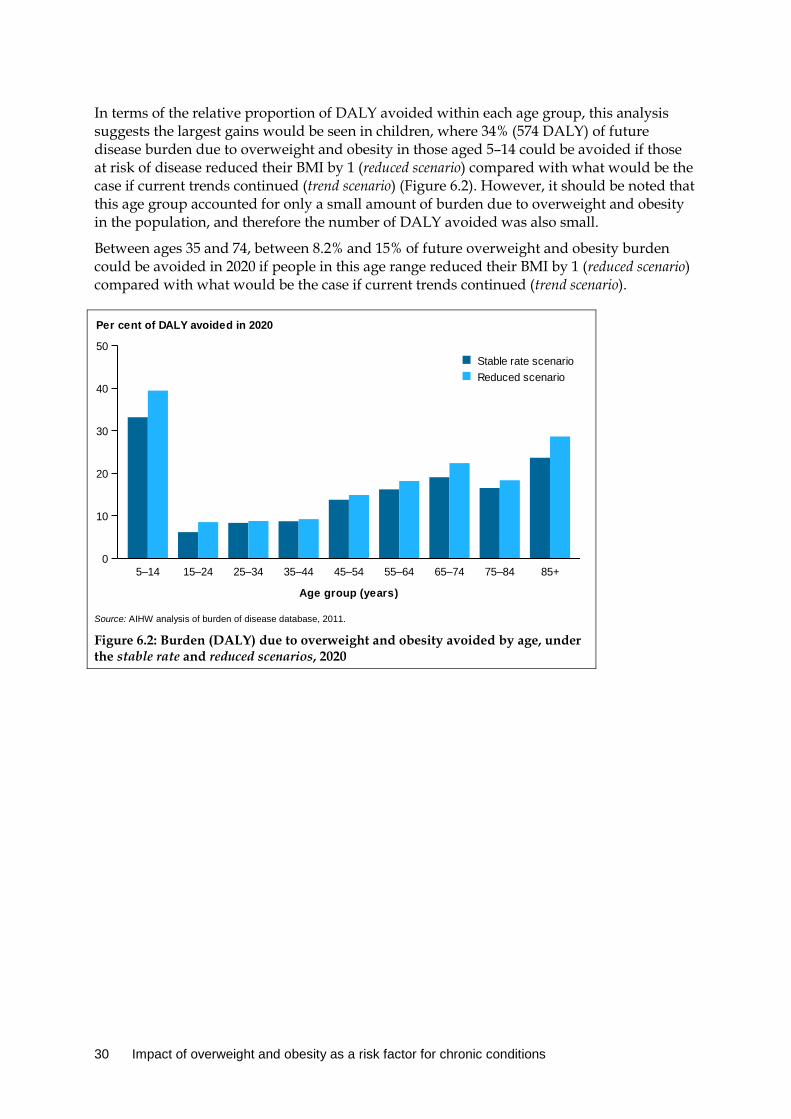
In terms of the relative proportion of DALY avoided within each age group, this analysis suggests the largest gains would be seen in children, where 34% (574 DALY) of future disease burden due to overweight and obesity in those aged 5–14 could be avoided if those at risk of disease reduced their BMI by 1 (reduced scenario) compared with what would be the case if current trends continued (trend scenario) (Figure 6.2). However, it should be noted that this age group accounted for only a small amount of burden due to overweight and obesity in the population, and therefore the number of DALY avoided was also small.
Between ages 35 and 74, between 8.2% and 15% of future overweight and obesity burden could be avoided in 2020 if people in this age range reduced their BMI by 1 (reduced scenario) compared with what would be the case if current trends continued (trend scenario).
Source: AIHW analysis of burden of disease database, 2011.
Figure 6.2: Burden (DALY) due to overweight and obesity avoided by age, under the stable rate and reduced scenarios, 2020
5–14 15–24 25–34 35–44 45–54 55–64 65–74 75–84 85+
Age group (years)
0
10
20
30
40
50
Per cent of DALY avoided in 2020
Reduced scenarioStable rate scenario
30 Impact of overweight and obesity as a risk factor for chronic conditions
7 Discussion This report describes the impact of overweight and obesity on the disease burden in Australia in 2011. This report updates estimates reported in the ABDS 2011 by including:
• revised linked diseases that have a causal association with overweight or obesity based on the latest evidence
• estimates in persons aged under 25 • disaggregation of burden estimates by socioeconomic group.
Results from scenario modelling are also presented, which estimated the disease burden that could be avoided if the prevalence of overweight or obesity in Australia reduced rather than continuing to rise.
7.1 Key findings Overweight and obesity accounted for 7.0% of the burden of disease and injuries (312,505 DALY) in Australia in 2011, which is 1.5 percentage points higher than that reported in the ABDS 2011 (245,816 DALY; 5.5%). This was largely due to improvements in the model used to estimate risk due to overweight and obesity since the ABDS 2011 (see Box 2.1).
The burden due to overweight and obesity was higher in males (7.3% of all disease burden) than in females (6.6%), with around 63% of the burden due to overweight and obesity being fatal. Around 84% of the overweight and obesity burden was experienced between ages 45 and 84, peaking at ages 60–64 in males and 75–79 in females. Children aged 5–14 and adolescents aged 15–24 each contributed less than 0.5% of the overweight and obesity burden; however, the health impacts are expected to mostly occur in adulthood through the development of associated chronic conditions.
Cardiovascular diseases accounted for 38% of the attributable overweight and obesity burden (118,284 DALY). This was followed by selected cancers (19%), diabetes (17%) and selected musculoskeletal conditions (17%).
Over half (53%) of the total diabetes burden was due to overweight and obesity. Other linked diseases which had over one-third of disease burden due to overweight and obesity were uterine cancer (46%), hypertensive heart disease (46%), osteoarthritis (45%), gout (39%), oesophageal cancer (38%) and chronic kidney disease (38%).
Large inequalities were found across socioeconomic groups, with the lowest socioeconomic group experiencing a rate of burden due to overweight and obesity that was 2.3 times that of the highest socioeconomic group. This disparity was seen in every linked disease, with the strongest gradients observed in diabetes (Q1:Q5 rate ratio of 2.8), chronic kidney disease (2.8) and coronary heart disease (2.5). The ABDS 2011 also reported burden inequalities by socioeconomic groups for diabetes and coronary heart disease (AIHW 2016a).
Despite increasing trends in overweight and obesity in Australia in recent years, the burden attributable to overweight and obesity was similar in 2003 and 2011. This was largely driven by increases in the rate of diabetes and chronic kidney disease total burden, which have both increased since 2003, coupled with decreases in underlying cardiovascular disease burden. However, current exposure to overweight and obesity may impact future disease burden,
Impact of overweight and obesity as a risk factor for chronic conditions 31
particularly for diseases that develop in later life as a result of childhood or mid-life overweight or obesity.
Around 6.3% of the future disease burden due to overweight and obesity could be avoided if increases in overweight and obesity in the population were halted (maintained at 2011 levels). If the population at risk in 2011 reduced their BMI by 1 and these rates were maintained to 2020, the overweight and obesity burden would be reduced by 14% (48,279 DALY), compared with what would be the case if overweight and obesity continued to rise. The largest gains in disease burden would be seen in ages 65–74, where 5,379 DALY could be avoided in 2020 if prevalence were maintained at 2011 levels (stable rate scenario), compared with what would be the case if current trends continued (trend scenario). The greatest percentage change of disease burden was seen in children, where up to 34% of future disease burden due to overweight and obesity among those aged 5–14 could be avoided if those at risk of disease in 2011 reduced their BMI by 1. However, this age group accounted for only a small amount of burden due to overweight and obesity in the population.
7.2 Potential for disease burden prevention This study provides insight into the contribution of overweight and obesity to chronic disease burden, and highlights the importance of reducing overweight and obesity to prevent the onset and/or reduce the severity of associated diseases in the population.
Health impacts from being overweight or obese are not always immediate, particularly for lifestyle-related diseases, and depend on when exposure occurs and the associated disease. In this report, asthma was the only linked disease with a direct association in childhood; however, childhood obesity is a risk factor for chronic disease in adulthood, with disease burden from these conditions arising in the future (Dietz 1998; Llewellyn et al. 2016). Furthermore, an obese child is more likely to stay obese into adulthood (Freedman et al. 2005; Guo & Chumlea 1999).
As well, being overweight and obese in mid-life is associated with increased dementia risk in late life, demonstrating a time lag from exposure to disease development (Pedditizi et al. 2016). Other studies also showed a reduction in cancer risk in adults who experienced weight loss 10 years prior, also suggesting a time lag (Renehan, Tyson et al. 2008).
Therefore, prevention and intervention efforts focused on maintaining a healthy weight in children, as well as reducing existing overweight and obesity in all age groups, are likely to result in increased health gains in the future.
7.3 Strengths, limitations and future directions
Strengths This study extends the work performed in the ABDS 2011, which measured and compared the impact of 200 diseases and injuries in Australia and attributed the burden from various risk factors, including overweight and obesity (referred to as ‘high body mass’ in the ABDS 2011). This study is the first to quantify disease burden due to overweight and obesity in all age groups —including children and adolescents—and to disaggregate by socioeconomic group.
32 Impact of overweight and obesity as a risk factor for chronic conditions

The estimates of attributable burden reported in this study rely on the best available evidence from recent studies and meta-analyses relevant to the Australian population that showed a convincing or probable causal association for relative risks, as well as disease and overweight and obesity prevalence data. This study included an additional four diseases linked to overweight and obesity, which were not estimated in GBD 2015 or the ABDS 2011 (dementia, gallbladder disease, gout and asthma), as well as removing some linked diseases previously included in GBD studies and in the ABDS 2011 (due to inconclusive evidence supporting a causal association, acknowledged in GBD 2015) (Forouzanfar et al. 2016).
This report also includes an updated model for estimating the TMRED; the TMRED range has been updated from 21–23 BMI to a wider range of 20–25 BMI, as estimated by GBD 2015 (Forouzanfar et al. 2016). A new model has also been used to estimate the appropriate TMRED value from within this range. This has been updated from the ABDS 2011 model; however, the model used in this study also differs from that used in GBD 2015. In this study, the position within the TMRED is in proportion to the distribution of BMI in the population. This method is different from that used in GBD 2015, which uses a theoretical minimum risk exposure level from within the range for each calculation, repeated 1,000 times in a model. In the GBD 2015 model, an individual is not considered to have an ideal position within the TMRED but rather can have any level within the range. Both methods take into account that a healthy BMI is a range of values as opposed to a single value for the entire population.
Estimates of overweight and obesity in the population were obtained from calculated BMI data based on individuals’ measured height and weight, by age and sex. Measured biomedical data provide a more accurate representation of overweight and obesity in the population, particularly as this tends to be underestimated in self-reported data (Ng et al. 2011).
This study illustrates the use of burden of disease data to undertake scenario modelling to look at how the prevalence of overweight and obesity in Australia affects disease burden. The results of the scenario analyses highlight the benefits, at the population level, of reducing overweight and obesity in preventing or delaying associated chronic diseases.
Limitations
Using BMI as a measure of body mass Population distributions of waist circumference or waist-to-hip ratio values are alternative measures used to identify disease risk associated with overweight and obesity. Central adiposity is considered a strong predictor of disease risk, particularly for cardiovascular diseases and diabetes (Huxley et al. 2010). Waist-to-hip ratios and waist circumference measures are a more defined measure of abdominal adiposity than BMI (Cameron et al. 2013; Dhaliwal & Welborn 2009). However, BMI was chosen for use in this report as there is a large amount of convincing evidence in the literature identifying it as a risk factor for disease. In addition, population BMI distributions were readily available for the years of data used in the analysis; relative risks available were specific to BMI measures; and other burden of disease studies (including the ABDS 2011) use BMI as the risk factor for body mass (and hence are somewhat comparable).
There are some limitations with BMI for particular population groups, as age, sex, ethnicity, and muscle mass all influence the relationship between body mass and BMI category (Gallagher et al. 1996; Rothman 2008). For example, older adults and women tend to have
Impact of overweight and obesity as a risk factor for chronic conditions 33
more body fat than younger adults and men for an equivalent BMI, elite athletes may have a high BMI because of increased muscle mass, and the cut-off levels for BMI indicating overweight and obesity in Asian populations is lower than that used in this report (Rothman 2008; WHO 2004). Body fat distributions between Indigenous and non-Indigenous Australians are also notably different for the same BMI, and the WHO recommends that cut-off BMI levels used in this report may not be appropriate for identifying overweight and obesity in the Indigenous population (Piers et al. 2003). Although BMI may not precisely reflect overweight and obesity in these subpopulations, it was considered the most appropriate and consistent measure of body mass at a population level.
Quantifying future disease burden due to childhood obesity and cohort effects As mentioned previously, childhood obesity is associated with chronic diseases in adulthood, and the rate of childhood obesity is on the rise. This is somewhat highlighted in the scenario modelling, where the greatest percentage increase in burden due to overweight and obesity is expected to be seen in the youngest age group if current trends continued, compared with if BMI was reduced in 2011 and those rates maintained to 2022 (34%). In this study, it could not be ascertained whether the burden experienced in adulthood was due to current exposure, exposure in childhood or both; therefore, the true extent to which overweight and obesity in children has an impact on disease burden is not included in this report. As well, the scenario modelling, while based on current age-specific rates of overweight and obesity, was not able to take into account the ‘cohort effect’ of younger people gaining weight faster than earlier cohorts (above and beyond the period effect). This would be an interesting piece of analysis to explore in future work on overweight and obesity and associated disease burden.
Overweight and obesity prevalence and ABDS 2011 data Data used to estimate overweight and obesity exposure in 2011 did not always have relative standard errors (RSEs) equal to or less than 25%, which is considered to have the highest reliability. This occurred in the highest BMI increments in the oldest and youngest age groups. It was important to include these groups in the analysis, as higher BMI levels pose the greatest risk for developing any of the linked diseases. Exposure data from these age groups and BMI increments may not be as accurate as those with RSEs less than 25%; however, the highest BMI increments represent a very small proportion of the exposed population.
The attributable burden estimates in this report are constrained by the underlying ABDS 2011 total burden for each disease. The total burden estimates are the direct impact of each disease. However, the risk of developing some diseases (or the severity of the disease) is increased if an individual already has another associated disease, which is referred to as ‘diseases-as-risks’. The indirect impact of ‘diseases-as-risks’ is not reported in the ABDS 2011, and therefore could not be explored in this report. For the indirect health impact of two diseases (diabetes and chronic kidney disease), see Diabetes and chronic kidney disease as risks for other diseases (AIHW 2016d).
Complexities with scenario modelling The overweight and obesity prevalence estimates calculated for the trend scenario are similar to previously published estimates. In this study, it was estimated that 69% of people aged 25 and over (77% in males; 62% in females) would be overweight or obese by 2020, based on the 2007–08, 2011–12 and 2014–15 ABS National and Australian Health Surveys.
34 Impact of overweight and obesity as a risk factor for chronic conditions

Other studies have previously projected similar rates of overweight and obesity in Australia. A report by the Organisation for Economic Co-operation and Development estimated that 64% of adults in Australia would be overweight or obese by 2019 (Sassi 2010). Another study (Funder & Leung 2014) projected that 74% of males and 67% of females aged over 20 in Australia would be overweight or obese in the year 2025. These projections were also based on the 2007–08, 2011–12 and 2014–15 ABS National and Australian Health Surveys; as well, they included analyses by Walls et al. (2012) using linked data from the Diabetes, Obesity, and Lifestyle (AusDiab) study and the Australian National Death Index. The years of data used to estimate prevalence projections of overweight and obesity in Australia greatly influence results. The Victorian Department of Human Services estimated that 83% of males and 75% of females aged 20 and over would be overweight or obese in the year 2025 in Australia (Victorian Department of Human Services 2008). These projections are higher than the estimates calculated in this report for adults; however, estimates in the previous study were based on the National Risk Factor Prevalence Survey and the National Nutrition Surveys from 1980–1995. The estimates from the Victorian Government study do not include trends for more recent years, and are based on years when overweight and obesity rates were increasing more quickly. That study also included estimates from AusDiab and projected to the year 2025, whereas this report estimated prevalence for the year 2020. In this study, we estimated 36% of males and 33% of females aged 5–24 would be overweight or obese by 2020 based on the 2007–08, 2011–12 and 2014-15 ABS National and Australian Health Surveys. This result is similar to that for the Victorian Government study, which estimated that 37% of males and 33% of females age 5–19 would be overweight or obese by the year 2025. The Victorian Government study, however, used slightly different age groups and its trends were based solely on data from the 1995 National Nutrition Survey (Department of Human Services 2008). The extrapolations of overweight and obesity under the trend scenario are, by nature, estimates about what might reasonably be expected in the future. Estimates based on historical trends and other available information can generate the best estimates possible with current information. However, there is no guarantee that they will be realised in the future, as there are many interrelated factors influencing trends over time. Including additional time points to estimate overweight and obesity trends (as new health survey data become available) is likely to increase the accuracy of future projections of overweight and obesity and associated disease burden.
Future directions This report provides a more detailed insight into the health impact of overweight and obesity in the Australian population than provided in the ABDS 2011; however, further work in the area could be performed to attain greater insight.
Overweight and obesity, as well as many of the linked chronic diseases, is highly prevalent among Aboriginal and Torres Strait Islander people, with this also varying by socioeconomic group. An analysis of the impact of overweight and obesity in the Indigenous population by socioeconomic group would be an important area of work to progress in future burden of disease studies. This could draw on the data already available from the ABDS 2011 on disease burden for the Indigenous population as well as Indigenous-specific BMI population distributions from ABS Indigenous health survey data, and apply relative risks used in this report or re-select from current literature.
Impact of overweight and obesity as a risk factor for chronic conditions 35

Preliminary extension analysis of overweight and obesity burden in the Indigenous population using the updated methods used in this report is underway.
Revised cancer burden estimates due to overweight and obesity for both the total Australia and Indigenous populations will be included in the upcoming report The burden of cancer in Australia: Australian Burden of Disease Study 2011, expected to be published in mid-2017 (AIHW forthcoming).
As part of the ABDS 2011, the AIHW has developed a system that will allow estimates of burden of disease in Australia to be updated and kept current with emerging information. This offers potential to monitor and update the estimates included in this study as new evidence emerges about the association between overweight and obesity and linked diseases, particularly as overweight and obesity prevalence in the population changes over time.
This report does not include the economic cost of overweight and obesity burden on the Australian health-care system. It was estimated that the total cost of overweight and obesity was $58.2 billion in Australia in 2008 (Access Economics 2008). This was primarily associated with disease burden ($49.9 billion). In addition, a recent study (Brown et al. 2017) estimated that the annual cost due to obesity in children aged between 2–4 is as high as $17 million. Further analyses linking disease burden to health expenditure would provide more insight into the impact of overweight and obesity on the Australian health-care system.
7.4 Conclusion This study demonstrates the impact of overweight and obesity on the disease burden in the Australian population and highlights the importance of reducing overweight and obesity to prevent the onset, or reduce the severity, of associated diseases in the population. The study also highlights the disparity between burden due to overweight and obesity in socioeconomic groups and the impact from increasing prevalence rates over time. Results from this study suggest that prevention and intervention efforts may best be focused on maintaining a healthy weight in children, as well as reducing existing overweight and obesity in all age groups, for maximum health gains in the future.
36 Impact of overweight and obesity as a risk factor for chronic conditions
Appendix A: Detailed methods Diseases with a strong causal association with overweight and obesity, also known as linked diseases, were identified using high-quality information on evidence of an association, following review of the literature. Relative risks, which indicate extra risk associated with the risk factor, were selected for each linked disease in the process. These were combined with overweight and obesity prevalence data, and disease burden estimates from the ABDS 2011, to quantify the disease burden due to overweight and obesity in the population.
In this study, the steps followed were: • select linked diseases and effect size • determine overweight and obesity exposure in the population • define the TMRED • calculate the population attributable fraction • quantify the disease burden due to overweight and obesity.
These steps are further explored below and form the structure of this chapter.
Select linked diseases Burden of disease studies use relative risks to measure the association between risk factors and disease outcomes. Linked diseases were included in the analysis if there was a convincing or probable association based on high-quality epidemiological studies. The diseases included also had to have burden estimated, or could be estimated appropriately from the ABDS 2011. The age ranges for each linked disease are shown in Table B1.
Linked diseases were included if there was evidence for a causal association with overweight and obesity—preferably from a meta-analysis or prospective studies—considered to be at a convincing or probable level.
A criterion from the World Cancer Research Fund was used to judge the level of association. The criterion is broken down into ‘convincing’, ‘probable’, ‘possible’ and ‘insufficient’ evidence. Linked disease was categorised as convincing or probable based on the robustness and volume of studies demonstrating a relationship. Convincing evidence describes a causal relationship that is ‘robust enough to be highly unlikely to be modified in the foreseeable future as new evidence accumulates’ (WCRF & AICR 2007).
Probable evidence suggests a causal relationship is often described and is unlikely to change with increased knowledge. The main reason for a classification of ‘probable evidence’ was that a meta-analysis had not been conducted, or only a few high-quality studies were available for selection.
Each relative risk was applied to both fatal and non-fatal burden. Most relative risks were adjusted for confounders. Appendix B gives a detailed description of the selection of linked diseases.
Linked diseases not included in analysis Heart failure is a recognised cardiovascular outcome that is increased in overweight and obese individuals; however, it was not considered a separate disease in the ABDS 2011. Instead, it was included as a consequence of numerous cardiovascular diseases. As such, its
Impact of overweight and obesity as a risk factor for chronic conditions 37
burden was not estimated separately in the ABDS 2011; therefore, it was not possible to individually calculate heart failure burden attributable to overweight and obesity. Heart failure, however, is captured in the burden estimates for coronary heart disease and hypertensive heart disease.
Conditions that may be associated with increased risk with overweight and obesity but which were excluded as they were not captured as a disease in the ABDS 2011 include sleep apnoea, obesity hypoventilation syndrome, binge eating disorder and metabolic syndrome. Metabolic syndrome is defined as a group of risk factors rather than a disease. High BMI, fasting plasma glucose levels, blood pressure and cholesterol were instead included as separate risk factors in the ABDS 2011, rather than estimating these combined effects experienced in metabolic syndrome.
A number of other conditions are associated with overweight and obesity but were not included in this study as they either did not meet the selection criteria, or there were no suitable relative risks to use in the analysis. This included depression, infertility, menstrual disorders and non-alcoholic liver disease.
Determine population exposure: prevalence of overweight and obesity For this study, exposure was treated as a continuous variable; that is, the prevalence exposed to a range of BMI (25, 26, 27, 28, 29 and so on) was compared with the prevalence of people with a BMI within or below the TMRED. Exposure to higher levels of BMI was associated with a higher relative risk for each linked disease. Exposure was aligned as best as possible with the evidence of causal association in the studies where relative risks were sourced.
Australian population distributions of BMI exposure by age and sex were sourced directly from the Australian Bureau of Statistics (ABS) Australian Health Survey 2011–12 (AIHW 2016b). The proportions exposed to different BMI were determined in the finest possible increments from the data source. To reduce the impact of survey error, data were extracted at a level where the RSE was 25% or less for most BMI categories by age and sex, with some data having RSEs at 25–50% when extracting data at finer increments was not possible.
The national prevalence of overweight and obesity in 2011 by sex was identified using BMI cut-off levels. In people aged 15 and over, a BMI equal to or greater than 25 kg/m2
was considered overweight or obese. For children and adolescents aged 5–14, age- and sex-specific BMI cut-off levels were derived from estimates published by Cole et al. (2000). As age is available only in whole years from the data source, the mid-year BMI cut-off level for each age group was used for the whole year. These exposure definitions for different age groups were used to guide data extraction.
Overweight and obesity in mid-life only is associated with increased dementia risk in late life (Anstey et al. 2011; Barnes & Yaffe 2011; Qiu et al. 2005). Mid-life exposure was calculated as the probability of both being exposed to the risk factor and being in mid-life (Barnes & Yaffe 2011; Norton 2014). Mid-life in this report is between ages 35 and 64.
The prevalence of a risk factor influences the attributable burden. That is, the attributable burden may be greater for a risk factor with a low relative risk and high prevalence than for one with a high relative risk and low population prevalence.
38 Impact of overweight and obesity as a risk factor for chronic conditions
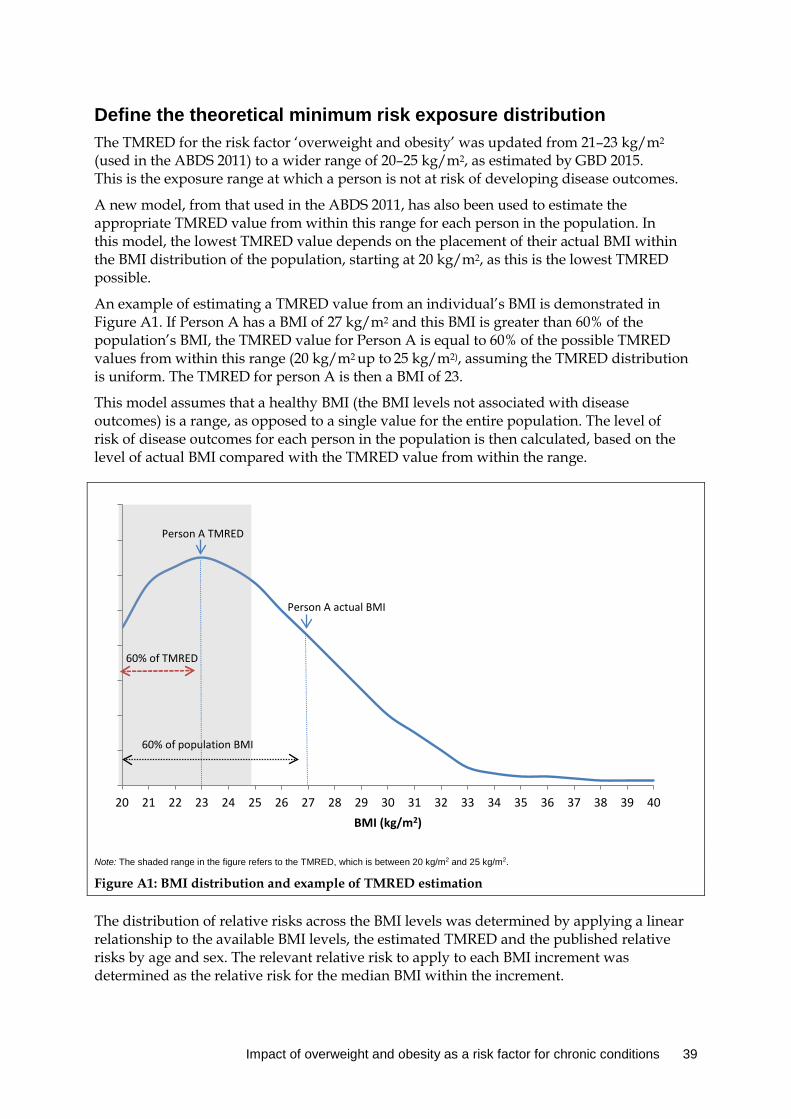
Define the theoretical minimum risk exposure distribution The TMRED for the risk factor ‘overweight and obesity’ was updated from 21–23 kg/m2 (used in the ABDS 2011) to a wider range of 20–25 kg/m2, as estimated by GBD 2015. This is the exposure range at which a person is not at risk of developing disease outcomes.
A new model, from that used in the ABDS 2011, has also been used to estimate the appropriate TMRED value from within this range for each person in the population. In this model, the lowest TMRED value depends on the placement of their actual BMI within the BMI distribution of the population, starting at 20 kg/m2, as this is the lowest TMRED possible.
An example of estimating a TMRED value from an individual’s BMI is demonstrated in Figure A1. If Person A has a BMI of 27 kg/m2 and this BMI is greater than 60% of the population’s BMI, the TMRED value for Person A is equal to 60% of the possible TMRED values from within this range (20 kg/m2 up to 25 kg/m2), assuming the TMRED distribution is uniform. The TMRED for person A is then a BMI of 23.
This model assumes that a healthy BMI (the BMI levels not associated with disease outcomes) is a range, as opposed to a single value for the entire population. The level of risk of disease outcomes for each person in the population is then calculated, based on the level of actual BMI compared with the TMRED value from within the range.
Note: The shaded range in the figure refers to the TMRED, which is between 20 kg/m2 and 25 kg/m2.
Figure A1: BMI distribution and example of TMRED estimation
The distribution of relative risks across the BMI levels was determined by applying a linear relationship to the available BMI levels, the estimated TMRED and the published relative risks by age and sex. The relevant relative risk to apply to each BMI increment was determined as the relative risk for the median BMI within the increment.
0
2
4
6
8
10
12
14
16
20 21 22 23 24 25 26 27 28 29 30 31 32 33 34 35 36 37 38 39 40BMI (kg/m2)
Person A actual BMI
Person A TMRED
60% of population BMI
60% of TMRED
Impact of overweight and obesity as a risk factor for chronic conditions 39

For example, the median value from the survey in respondents with a BMI of 36 or higher by sex and age group was used to estimate the exposure to which to apply the relative risk for the category.
Calculate the population attributable fractions Population attributable fractions (PAFs) determine the proportion of a particular disease that could have potentially been avoided if the population had never been exposed to a risk factor (Box 1.2).
The calculation of PAFs requires the input of:
• the effect size, or the relative risk (RR), of the risk factor on the outcome of interest, and • the prevalence of exposure in the population (P).
The PAF is calculated as:
𝑃𝑃𝑃𝑃𝑃𝑃 =𝑃𝑃(𝑅𝑅𝑅𝑅 − 1)
𝑃𝑃(𝑅𝑅𝑅𝑅 − 1) + 1
The burden attributable to overweight and obesity can be estimated using the calculated PAFs for each linked disease and the total burden estimated in the ABDS 2011.
Attributable burden (AB) is calculated as:
𝑃𝑃𝐴𝐴 = 𝑃𝑃𝑃𝑃𝑃𝑃 × 𝐶𝐶
where C = the total burden (DALY) of a specific outcome (for example, diabetes).
For detailed information about the most recent ABDS, and further information on the methods used to calculate disease burden, see Australian Burden of Disease Study: impact and causes of illness and death in Australia 2011 (AIHW 2016a) and Australian Burden of Disease Study: methods and supplementary material (AIHW 2016b).
Quantify the disease burden
Socioeconomic group analysis Analysis by socioeconomic group was based on the burden estimates by this disaggregation from the ABDS 2011, and population exposure to overweight and obesity in the equivalent socioeconomic groups.
In this report, socioeconomic groups are based on an index of relative socioeconomic disadvantage— known as SEIFA (Socio-Economic Indexes for Areas). SEIFA is a ranking defined by an individual’s residential area and measured on socioeconomic indicators, including household income, employment and education levels.
Scenario modelling The disease burden due to overweight and obesity was estimated for the year 2020 using three scenarios. The difference between these scenarios indicates the amount of burden that may be avoided if the increasing prevalence of overweight and obesity in the population is halted or reduced, compared with what would be the case if current trends continue.
40 Impact of overweight and obesity as a risk factor for chronic conditions

Results from both methods were compared with the 2011 burden to estimate the extent of impact between the three scenarios (see Chapter 6).
The year 2020 was chosen because it aligns with the World Health Organization’s Global Action Plan for the Prevention and Control of Non-communicable Diseases 2013–2020 (WHO 2013).
The scenarios used to investigate the impact of changes in overweight and obesity prevalence on future burden were:
• trend scenario: the estimated attributable burden in the year 2020 if the prevalence rate of overweight and obesity were to continue at its increasing trend until 2020
• stable rate scenario: the estimated attributable burden in the year 2020 if the prevalence rate of overweight and obesity were to remain as is in the year 2011
• reduced scenario: the estimated attributable burden in the year 2020 if the population at risk in 2011 reduced their BMI by 1 kg/m2 and these rates were maintained in 2020.
A BMI of 20 was used as the baseline in the reduced scenario, as this is the lowest TMRED possible.
Overweight and obesity prevalence in 2020 For the trend scenario, estimates of age- and BMI-specific prevalence of overweight and obesity were projected using the log-linear trends of actual prevalence in Australia, in successive ABS National and Australian Health Surveys. The median for each exposure increment was also projected using the log-linear trends.
For the stable rate scenario, the prevalence rate of overweight and obesity in 2011, and median of each BMI increment was used and maintained at 2011 levels to 2020. This provides an indication of the impact of halting the current rise in overweight and obesity in the population.
The proportion of people overweight or obese in the reduced scenario was estimated by reducing the BMI of every individual in 2011 by 1 kg/m2. The median of each BMI increment using the reduced BMI values was then used to estimate BMI exposure for the increment.
The definition of exposure in each of the scenarios was the same as for 2011.
Linked disease burden in 2020 For both scenarios, it was assumed that the 2011 burden rates of the linked diseases will remain the same to 2020, adjusted for expected changes in the population structure. Due to the complexity of possible associations between diseases, expected future changes in linked disease burden will require more consideration. This assumption was made for simplicity in the analysis for this report.
Impact of overweight and obesity as a risk factor for chronic conditions 41
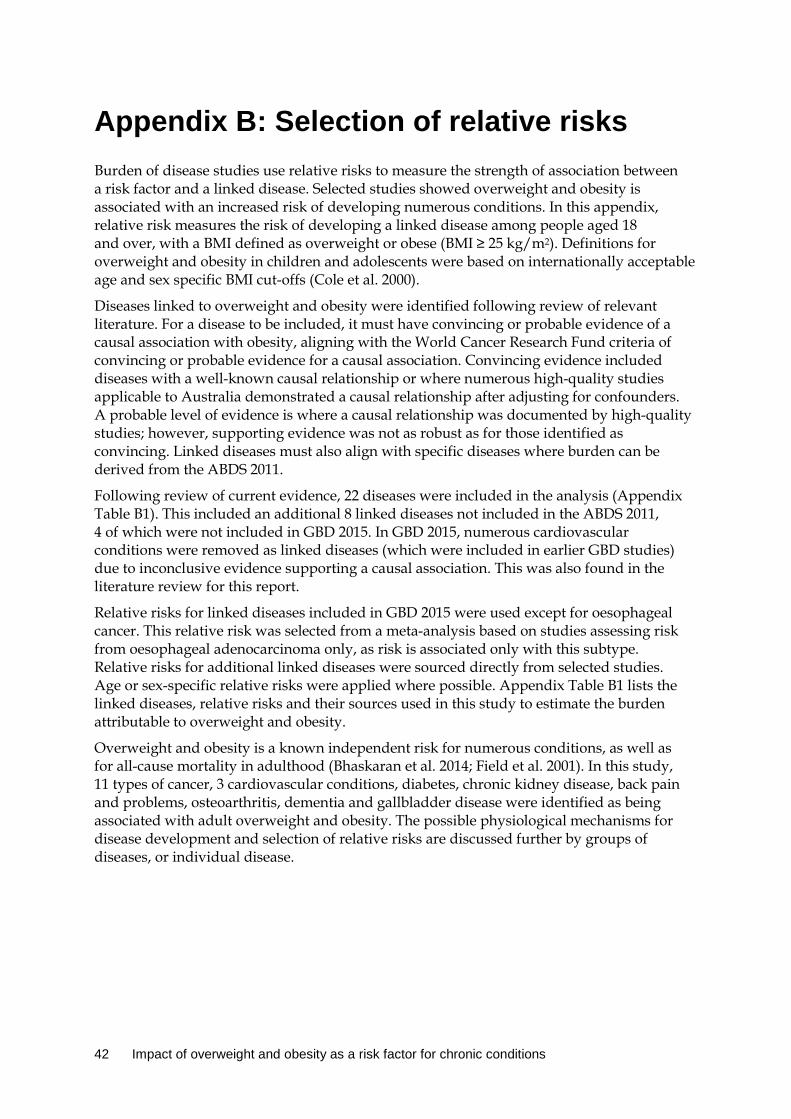
Appendix B: Selection of relative risks Burden of disease studies use relative risks to measure the strength of association between a risk factor and a linked disease. Selected studies showed overweight and obesity is associated with an increased risk of developing numerous conditions. In this appendix, relative risk measures the risk of developing a linked disease among people aged 18 and over, with a BMI defined as overweight or obese (BMI ≥ 25 kg/m2). Definitions for overweight and obesity in children and adolescents were based on internationally acceptable age and sex specific BMI cut-offs (Cole et al. 2000).
Diseases linked to overweight and obesity were identified following review of relevant literature. For a disease to be included, it must have convincing or probable evidence of a causal association with obesity, aligning with the World Cancer Research Fund criteria of convincing or probable evidence for a causal association. Convincing evidence included diseases with a well-known causal relationship or where numerous high-quality studies applicable to Australia demonstrated a causal relationship after adjusting for confounders. A probable level of evidence is where a causal relationship was documented by high-quality studies; however, supporting evidence was not as robust as for those identified as convincing. Linked diseases must also align with specific diseases where burden can be derived from the ABDS 2011.
Following review of current evidence, 22 diseases were included in the analysis (Appendix Table B1). This included an additional 8 linked diseases not included in the ABDS 2011, 4 of which were not included in GBD 2015. In GBD 2015, numerous cardiovascular conditions were removed as linked diseases (which were included in earlier GBD studies) due to inconclusive evidence supporting a causal association. This was also found in the literature review for this report.
Relative risks for linked diseases included in GBD 2015 were used except for oesophageal cancer. This relative risk was selected from a meta-analysis based on studies assessing risk from oesophageal adenocarcinoma only, as risk is associated only with this subtype. Relative risks for additional linked diseases were sourced directly from selected studies. Age or sex-specific relative risks were applied where possible. Appendix Table B1 lists the linked diseases, relative risks and their sources used in this study to estimate the burden attributable to overweight and obesity.
Overweight and obesity is a known independent risk for numerous conditions, as well as for all-cause mortality in adulthood (Bhaskaran et al. 2014; Field et al. 2001). In this study, 11 types of cancer, 3 cardiovascular conditions, diabetes, chronic kidney disease, back pain and problems, osteoarthritis, dementia and gallbladder disease were identified as being associated with adult overweight and obesity. The possible physiological mechanisms for disease development and selection of relative risks are discussed further by groups of diseases, or individual disease.
42 Impact of overweight and obesity as a risk factor for chronic conditions
Table B1: Relative risks and sources for linked diseases
Linked disease Age
(years)
Relative risk (95% CI*) Source of
relative risk Level of
evidence Males Females
Oesophageal cancer (adenocarcinoma) 15–100+ 1.52 (1.33–1.74) 1.51 (1.31–1.74) Renehan, Tyson
et al. 2008 Convincing
Liver cancer** 15–100+ 1.29 (1.11–1.49) 1.18 (1.03–1.36) GBD 2015 Convincing
Breast cancer 50–100+ . . 1.35 (1.28–1.61) GBD 2015 Convincing
Uterine cancer 15–100+ . . 1.61 (1.54–1.68) GBD 2015 Convincing
Bowel cancer 15–100+ 1.18 (1.15–1.21) 1.06 (1.03–1.08) GBD 2015 Convincing
Gallbladder cancer 15–100+ 1.16 (1.03–1.28) 1.34 (1.22–1.48) GBD 2015 Convincing
Pancreatic cancer 15–100+ 1.07 (1.00–1.15) 1.09 (1.04–1.14) GBD 2015 Convincing
Ovarian cancer** 15–100+ . . 1.04 (1.00–1.08) GBD 2015 Convincing
Kidney cancer 15–100+ 1.24 (1.17–1.31) 1.32 (1.25–1.39) GBD 2015 Convincing
Thyroid cancer** 15–100+ 1.22 (1.07–1.38) 1.14 (1.09–1.18) GBD 2015 Probable
Leukaemia** 15–100+ 1.09 (1.05–1.12) 1.13 (1.06–1.21) GBD 2015 Probable
Coronary heart disease 25–100+ 1.17–2.27 (1.09–3.69) 1.17–2.27 (1.09–3.69) GBD 2015 Convincing
Stroke 25–100+ 1.03–2.47 (1.00–5.34) 1.03–2.47 (1.00–5.34) GBD 2015 Convincing
Hypertensive heart disease 25–100+ 1.70–3.12 (1.07–5.50) 1.70–3.12 (1.07–5.50) GBD 2015 Convincing
Diabetes 15–100+ 1.46–3.55 (1.21–5.23) 1.46–3.55 (1.21–5.23) GBD 2015 Convincing
Chronic kidney disease 25–100+ 1.43–1.74 (0.8–2.79) 1.43–1.74 (0.8–2.79) GBD 2015 Convincing
Dementia** 65–100+ 1.41 (1.20–1.66) 1.41 (1.20–1.66) Pedditizi et al. 2016 Probable
Gallbladder disease** 20–100+ 1.08 (1.07–1.10) 1.04 (1.02–1.07) Stender et al. 2013 Probable
Gout** 25–100+ 1.55 (1.33–1.98) 1.55 (1.32–1.68) Aune et al.2014 Probable
Back pain and problems 40–100+ 1.10 (1.07–1.13) 1.10 (1.07–1.13) GBD 2015 Convincing
Osteoarthritis (knee) 40–100+ 2.03 (1.59–2.56) 2.03 (1.59–2.56) GBD 2015 Convincing
Osteoarthritis (hip) 40–100+ 1.11 (1.06–1.16) 1.11 (1.06–1.16) GBD 2015 Convincing
Asthma (children only)** 5–19 1.35 (1.15–1.58) 1.35 (1.15–1.58) Egan et al. 2013 Probable
* CI = confidence interval ** denotes additional linked diseases not included in the ABDS 2011.
Cancers There is strong and convincing evidence supporting overweight and obesity as a risk factor for development of several cancer types (WCRF & AICR 2007). Mechanisms for adiposity and cancer risk may be attributed to increased circulating insulin, insulin-like growth factor, leptin and sex steroid hormones (Calle & Kaaks 2004; Kolb et al. 2016). Adiposity is also associated with a constant inflammatory state and elevated pro-inflammatory cytokines may encourage cancer development (Renehan, Roberts et al. 2008).
In recent years, an extensive range of cancer types are being assessed for associations with increased body mass, mostly due to a landmark systematic review and meta-analysis by Renehan, Tyson et al. (2008), which included 221 data sets and 20 cancer types. Positive associations presented in the systematic review are supported by a large population-based
Impact of overweight and obesity as a risk factor for chronic conditions 43
cohort study of over 5 million adults in the United Kingdom (Bhaskaran et al. 2014). The GBD 2015 study also largely derived its modelled relative risks from these two studies.
The International Agency for Research on Cancer identified 13 site-specific cancers as demonstrating sufficient evidence for increased risk associated with a BMI greater than or equal to 25 kg/m2 (Lauby-Secretan et al. 2016). This included oesophageal (adenocarcinoma), bowel, liver, gallbladder, pancreas, breast (post-menopausal), uterine, ovarian, kidney and thyroid cancer. A causal association of overweight and obesity and stomach cancer, multiple myeloma and meningioma was also investigated; however, the relative risks were insignificant and therefore not included in this study.
The majority of relative risks for linked cancers used in this study were from the GBD 2015 study. Oesophageal cancer was included in the study; however, as the association is with oesophageal adenocarcinoma exclusively, relative risks with an outcome for histologically verified oesophageal adenocarcinoma were used instead.
Cardiovascular diseases Overweight and obesity is an established risk factor for cardiovascular disease, and strongly associated with cardiovascular mortality (Twig et al. 2016). Increased risk largely arises through the mediation of traditional vascular risks—such as hypertension and dyslipidaemia (Ndumele et al. 2016).
A pooled analysis of over 1.4 million individuals from large cohort pooling projects determined age-specific relative risks for metabolic risks factors—including increasing BMI—with a range of cardiovascular conditions (Singh et al. 2013). The associated risk declined with age for ischaemic heart disease (RR = 1.14–1.66), haemorrhagic stroke (RR = 1.05–2.54), ischaemic stroke (RR = 1.04–1.86) and hypertensive heart disease (RR = 1.45–2.15).
There is conflicting evidence that obesity is an independent risk, after adjusting for traditional vascular risks; however, the pathophysiology is not completely understood. A meta-analysis which included over 300,000 individuals demonstrated a 16% increased risk of coronary heart disease for every 5 kg/m2 increased BMI, after accounting for high blood pressure and cholesterol (Bogers et al. 2007). Potential mechanisms for independent associations include increased body mass associated with pro-inflammatory and pro-thrombotic states (Rost et al. 2001).
The age-specific relative risks in this study for linked cardiovascular outcomes were derived from the GBD 2015 study. These demonstrate the strong pattern of declining risk with increased age, as supported by Singh et al. (2013).
Diabetes Overweight and obesity is also a well-established risk factor for diabetes, with consistently strong and convincing evidence informing this association (Abdullah et al. 2010; Singh et al. 2013). The age-specific relative risks for diabetes in this study were derived from the GBD 2013 study, which were largely drawn from the large pooled analysis conducted by Singh et al. (2013). This study found the risk of diabetes ranged from 1.38–3.07, with an age-dependent risk decline. This risk also increased when studies in Asian populations were excluded, a potential effect of increased duration of exposure in Western countries (Wannamethee & Shaper 1999). Weight reduction has also been shown to reduce diabetes risk (Hamman et al. 2006; Horton 2009; Will et al. 2002).
44 Impact of overweight and obesity as a risk factor for chronic conditions

Chronic kidney disease Consistent and strong evidence supports overweight and obesity in the adult population as a risk factor for chronic kidney disease development. This was largely thought to be due to obesity increasing other vascular risks associated with chronic kidney disease; however, obesity has also been shown as an independent risk—suggesting that other biological pathways are involved.
Pooled relative risks from a meta-analysis and review conducted by Wang et al. (2008) found risk for chronic kidney disease in overweight (RR = 1.26) and obese (RR = 1.34) individuals and also for end-stage kidney disease (overweight RR = 1.68; obesity RR = 4.07). A large cohort study including over 320,000 adults with a 21-year follow-up found increased risk of end-stage kidney disease with BMI over 25 kg/m2, after confounding for age, sex, ethnicity, diabetes status and high blood pressure (Hsu et al. 2006).
Musculoskeletal conditions Individuals who are overweight or obese carry an increased load, placing additional stress on their musculoskeletal system. This could potentially lead to the development of musculoskeletal injuries or conditions, such as osteoarthritis or back pain. A meta-analysis of 33 studies identified an increased risk of overweight and obesity with chronic low back pain (Odds Ratio = 1.53), after adjusting for potential confounders and publication bias. This is supported by a population prospective study which showed an increased risk of developing chronic low back pain after an 11-year period. Similarly, an increased risk of osteoarthritis is observed in overweight and obese people; as well as diminished symptoms following weight reduction. The relative risks used in this report for back pain and problems and osteoarthritis were derived from the GBD 2015 study.
Gout has also been associated with overweight and obesity. This is thought to be primarily through the increased production of uric acid from increased sugar intake; however, it has been shown as an independent risk—suggesting other mechanisms are involved. The relative risks for gout were derived from a meta-analysis of 10 prospective studies, indicating a 55% increase in the risk of gout that was independent of confounders, including hypertension, high cholesterol, alcohol, diuretics, renal failure and dietary inadequacies.
Gallbladder disease Overweight and obesity is a risk factor for gallbladder disease; however, the precise pathophysiological mechanisms for this development are not completely understood. The relative risk used in this analysis is derived from a meta-analysis of over 77,000 individuals, and adjusted for a range of confounders that may also influence gallstone disease risk—including comparisons with risk in individuals with alleles associated with increased BMI.
Dementia Evidence supports an increased risk of dementia in later life for persons with a BMI greater than or equal to 30 kg/m2 in mid-life (35–64 years). In this report, the age groups were restricted to dementia in later life (65+ years), as there is greater evidence supporting an independent age-dependent association between obesity and dementia. This is potentially due to adiposity mediating insulin resistance and release of pro-inflammatory cytokines that have direct effects on brain regions implicated in dementia (Emmerzaal et al. 2015;
Impact of overweight and obesity as a risk factor for chronic conditions 45

Gustafson & Luchsinger 2013). The adjusted relative risk used in this analysis is derived from a recent meta-analysis.
Asthma There is accumulating evidence of an association between overweight and obesity and asthma in children in numerous cross-sectional, case-control and prospective studies (Liu et al. 2013; Magnusson et al. 2012; Yiallouros et al. 2013). The pro-inflammatory state associated with overweight and obesity, particularly from responses to adipose-derived inflammatory cytokines, is thought to initiate the development of asthma (Tantisira & Weiss 2001).
The relative risk (RR = 1.35) used in this analysis is derived from a meta-analysis of six prospective cohort studies of over 25,0000 children and adolescents aged under 18 (Egan et al. 2013). Only studies with an outcome of physician-diagnosed asthma were included, and most studies confounded for age, sex, ethnicity, smoking or maternal smoking, socioeconomic status and other potential causes of asthma. As this meta-analysis is based on only six studies, further studies are required to strengthen this association.
46 Impact of overweight and obesity as a risk factor for chronic conditions
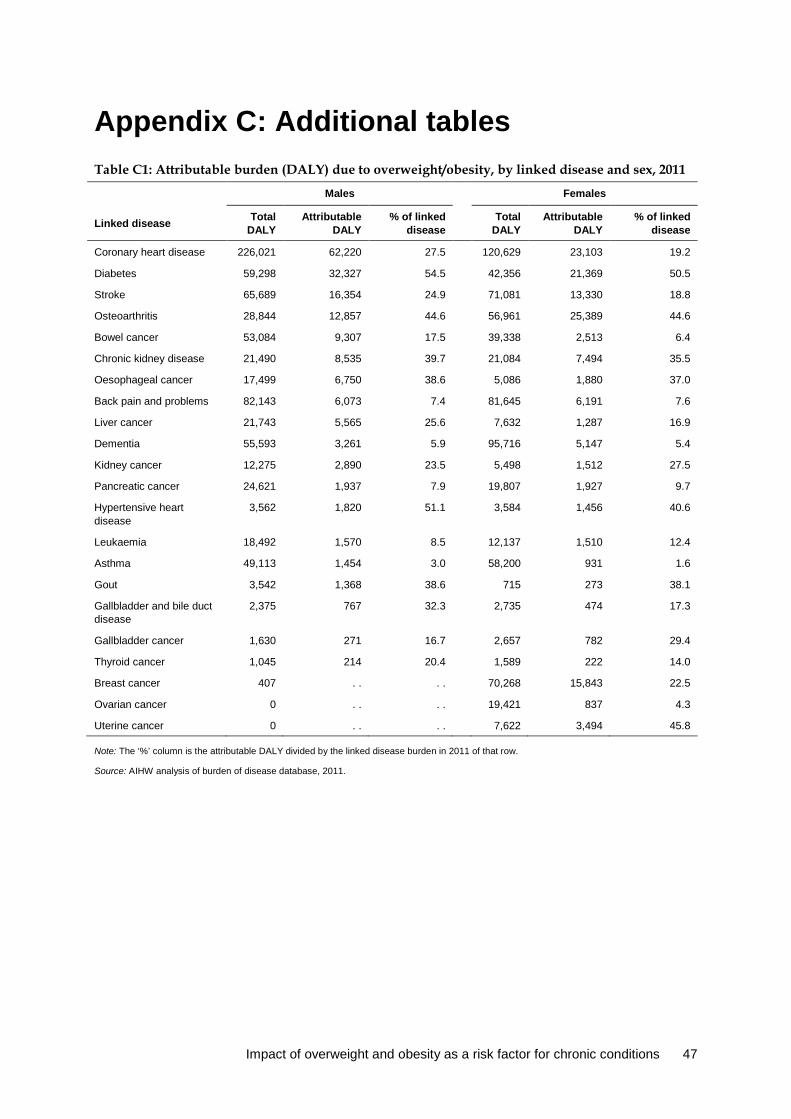
Appendix C: Additional tables Table C1: Attributable burden (DALY) due to overweight/obesity, by linked disease and sex, 2011
Males Females
Linked disease Total DALY
Attributable DALY
% of linked disease
Total DALY
Attributable DALY
% of linked disease
Coronary heart disease 226,021 62,220 27.5 120,629 23,103 19.2
Diabetes 59,298 32,327 54.5 42,356 21,369 50.5
Stroke 65,689 16,354 24.9 71,081 13,330 18.8
Osteoarthritis 28,844 12,857 44.6 56,961 25,389 44.6
Bowel cancer 53,084 9,307 17.5 39,338 2,513 6.4
Chronic kidney disease 21,490 8,535 39.7 21,084 7,494 35.5
Oesophageal cancer 17,499 6,750 38.6 5,086 1,880 37.0
Back pain and problems 82,143 6,073 7.4 81,645 6,191 7.6
Liver cancer 21,743 5,565 25.6 7,632 1,287 16.9
Dementia 55,593 3,261 5.9 95,716 5,147 5.4
Kidney cancer 12,275 2,890 23.5 5,498 1,512 27.5
Pancreatic cancer 24,621 1,937 7.9 19,807 1,927 9.7
Hypertensive heart disease
3,562 1,820 51.1
3,584 1,456 40.6
Leukaemia 18,492 1,570 8.5 12,137 1,510 12.4
Asthma 49,113 1,454 3.0 58,200 931 1.6
Gout 3,542 1,368 38.6 715 273 38.1
Gallbladder and bile duct disease
2,375 767 32.3
2,735 474 17.3
Gallbladder cancer 1,630 271 16.7 2,657 782 29.4
Thyroid cancer 1,045 214 20.4 1,589 222 14.0
Breast cancer 407 . . . . 70,268 15,843 22.5
Ovarian cancer 0 . . . . 19,421 837 4.3
Uterine cancer 0 . . . . 7,622 3,494 45.8
Note: The ‘%’ column is the attributable DALY divided by the linked disease burden in 2011 of that row.
Source: AIHW analysis of burden of disease database, 2011.
Impact of overweight and obesity as a risk factor for chronic conditions 47
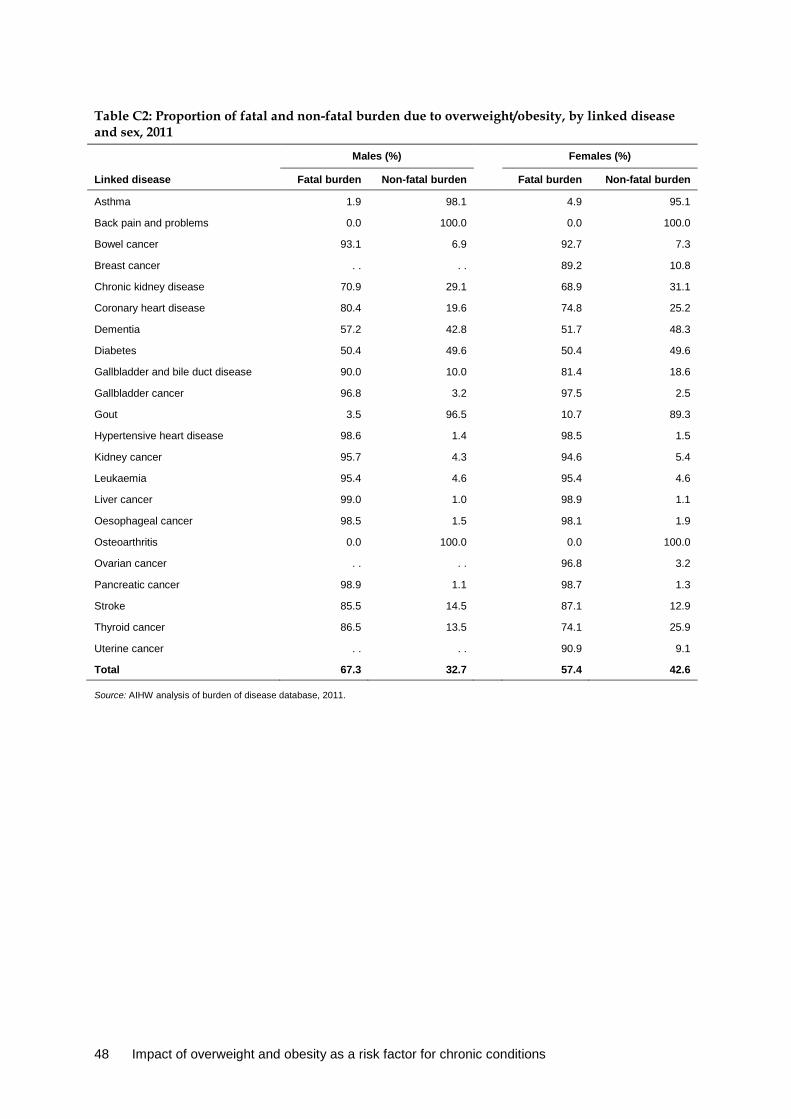
Table C2: Proportion of fatal and non-fatal burden due to overweight/obesity, by linked disease and sex, 2011
Males (%) Females (%)
Linked disease Fatal burden Non-fatal burden
Fatal burden Non-fatal burden
Asthma 1.9 98.1 4.9 95.1
Back pain and problems 0.0 100.0 0.0 100.0
Bowel cancer 93.1 6.9 92.7 7.3
Breast cancer . . . . 89.2 10.8
Chronic kidney disease 70.9 29.1 68.9 31.1
Coronary heart disease 80.4 19.6 74.8 25.2
Dementia 57.2 42.8 51.7 48.3
Diabetes 50.4 49.6 50.4 49.6
Gallbladder and bile duct disease 90.0 10.0 81.4 18.6
Gallbladder cancer 96.8 3.2 97.5 2.5
Gout 3.5 96.5 10.7 89.3
Hypertensive heart disease 98.6 1.4 98.5 1.5
Kidney cancer 95.7 4.3 94.6 5.4
Leukaemia 95.4 4.6 95.4 4.6
Liver cancer 99.0 1.0 98.9 1.1
Oesophageal cancer 98.5 1.5 98.1 1.9
Osteoarthritis 0.0 100.0 0.0 100.0
Ovarian cancer . . . . 96.8 3.2
Pancreatic cancer 98.9 1.1 98.7 1.3
Stroke 85.5 14.5 87.1 12.9
Thyroid cancer 86.5 13.5 74.1 25.9
Uterine cancer . . . . 90.9 9.1
Total 67.3 32.7 57.4 42.6
Source: AIHW analysis of burden of disease database, 2011.
48 Impact of overweight and obesity as a risk factor for chronic conditions

Table C3: Age-standardised DALY rates per 1,000 people of burden attributable to overweight/obesity, by socioeconomic group and linked disease, 2011
Linked disease Total
Socioeconomic group
Rate ratio Q1
(lowest) Q2 Q3 Q4 Q5
(highest)
Coronary heart disease 7.02 10.2 8.27 6.81 5.73 4.04 2.5
Diabetes 4.36 6.90 4.82 3.73 3.43 2.46 2.8
Osteoarthritis 3.00 3.45 3.25 3.17 3.21 2.38 1.5
Stroke 2.49 3.41 2.78 2.41 2.14 1.65 2.1
Chronic kidney disease 1.25 1.92 1.25 1.10 0.95 0.69 2.8
Breast cancer 1.20 1.36 1.23 1.21 1.21 1.12 1.2
Back pain and problems 1.02 1.11 1.17 1.05 0.97 0.86 1.3
Bowel cancer 0.97 1.36 1.06 0.99 0.91 0.70 1.9
Oesophageal cancer 0.70 0.96 0.84 0.75 0.62 0.43 2.2
Liver cancer 0.57 0.80 0.70 0.55 0.55 0.34 2.4
Dementia 0.47 0.86 0.80 0.68 0.61 0.52 1.7
Kidney cancer 0.35 0.46 0.35 0.42 0.33 0.26 1.8
Pancreatic cancer 0.31 0.39 0.34 0.33 0.30 0.24 1.6
Uterine cancer 0.27 0.32 0.29 0.24 0.29 0.24 1.4
Leukaemia 0.25 0.31 0.28 0.24 0.24 0.21 1.4
Hypertensive heart disease 0.23 0.34 0.34 0.23 0.15 0.11 3.1
Asthma 0.23 0.31 0.23 0.23 0.22 0.09 3.6
Gout 0.13 0.18 0.11 0.16 0.14 0.10 1.9
Gallbladder and bile duct disease 0.09 0.13 0.13 0.08 0.10 0.07 1.8
Gallbladder cancer 0.08 0.12 0.12 0.07 0.07 0.06 2.0
Ovarian cancer 0.07 0.08 0.07 0.07 0.06 0.06 1.3
Thyroid cancer 0.04 0.05 0.04 0.03 0.04 0.03 1.7
Notes
1. Rates were age standardised to the 2001 Australian Standard Population, and are expressed per 1,000 people.
2. Rate ratios divide the Q1 ASR by the Q5 ASR.
Source: AIHW analysis of burden of disease database, 2011.
Impact of overweight and obesity as a risk factor for chronic conditions 49
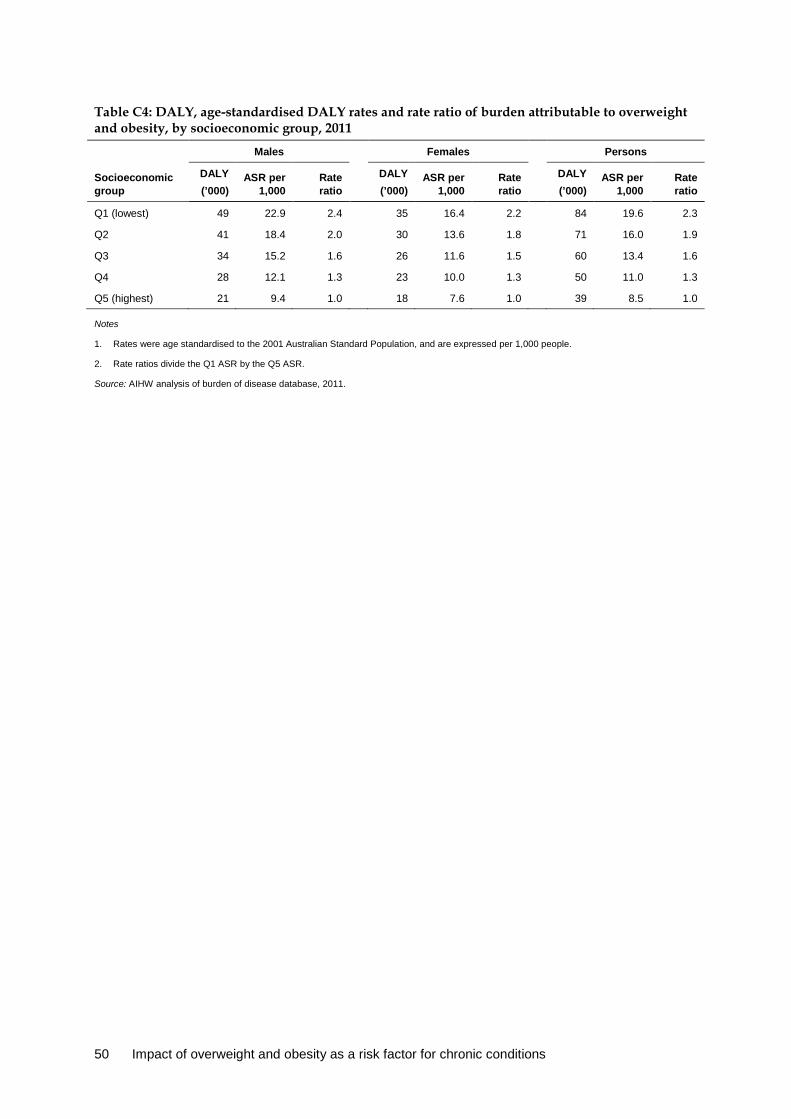
Table C4: DALY, age-standardised DALY rates and rate ratio of burden attributable to overweight and obesity, by socioeconomic group, 2011
Socioeconomic group
Males
Females Persons
DALY (’000)
ASR per 1,000
Rate ratio
DALY (’000)
ASR per 1,000
Rate ratio
DALY (’000)
ASR per 1,000
Rate ratio
Q1 (lowest) 49 22.9 2.4 35 16.4 2.2 84 19.6 2.3
Q2 41 18.4 2.0 30 13.6 1.8 71 16.0 1.9
Q3 34 15.2 1.6 26 11.6 1.5 60 13.4 1.6
Q4 28 12.1 1.3 23 10.0 1.3 50 11.0 1.3
Q5 (highest) 21 9.4 1.0 18 7.6 1.0 39 8.5 1.0
Notes
1. Rates were age standardised to the 2001 Australian Standard Population, and are expressed per 1,000 people.
2. Rate ratios divide the Q1 ASR by the Q5 ASR.
Source: AIHW analysis of burden of disease database, 2011.
50 Impact of overweight and obesity as a risk factor for chronic conditions
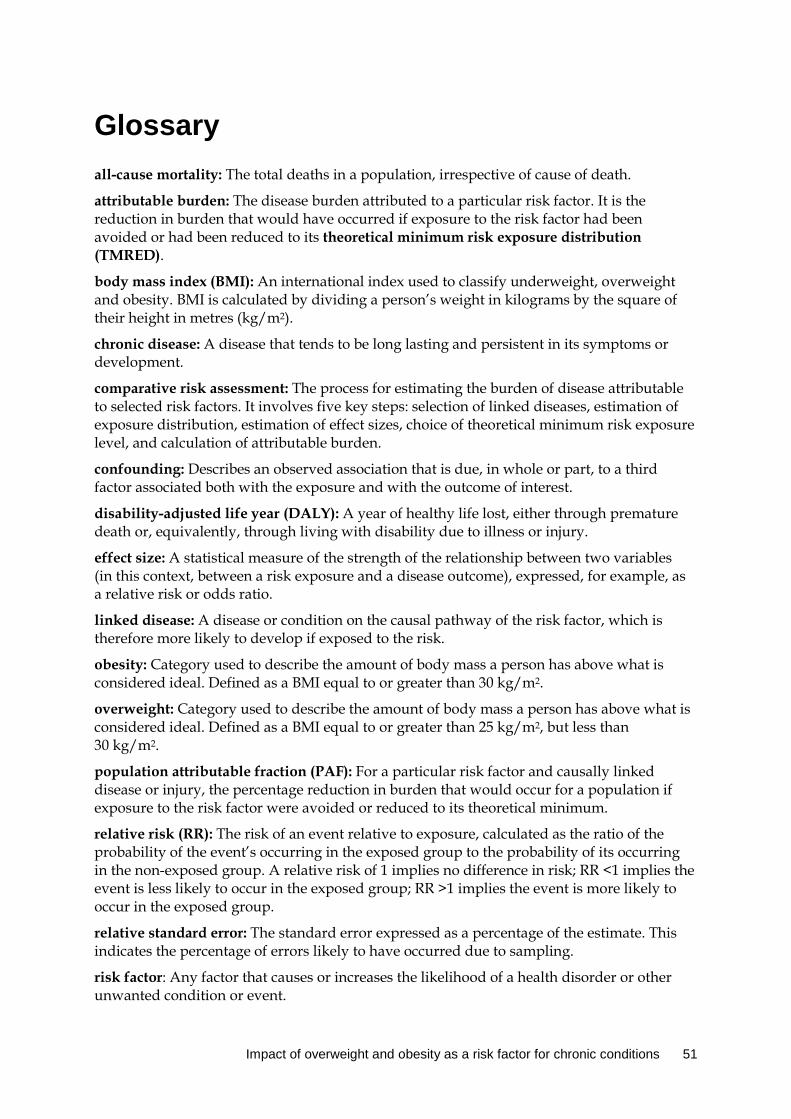
Glossary all-cause mortality: The total deaths in a population, irrespective of cause of death.
attributable burden: The disease burden attributed to a particular risk factor. It is the reduction in burden that would have occurred if exposure to the risk factor had been avoided or had been reduced to its theoretical minimum risk exposure distribution (TMRED).
body mass index (BMI): An international index used to classify underweight, overweight and obesity. BMI is calculated by dividing a person’s weight in kilograms by the square of their height in metres (kg/m2).
chronic disease: A disease that tends to be long lasting and persistent in its symptoms or development.
comparative risk assessment: The process for estimating the burden of disease attributable to selected risk factors. It involves five key steps: selection of linked diseases, estimation of exposure distribution, estimation of effect sizes, choice of theoretical minimum risk exposure level, and calculation of attributable burden.
confounding: Describes an observed association that is due, in whole or part, to a third factor associated both with the exposure and with the outcome of interest.
disability-adjusted life year (DALY): A year of healthy life lost, either through premature death or, equivalently, through living with disability due to illness or injury.
effect size: A statistical measure of the strength of the relationship between two variables (in this context, between a risk exposure and a disease outcome), expressed, for example, as a relative risk or odds ratio.
linked disease: A disease or condition on the causal pathway of the risk factor, which is therefore more likely to develop if exposed to the risk.
obesity: Category used to describe the amount of body mass a person has above what is considered ideal. Defined as a BMI equal to or greater than 30 kg/m2.
overweight: Category used to describe the amount of body mass a person has above what is considered ideal. Defined as a BMI equal to or greater than 25 kg/m2, but less than 30 kg/m2.
population attributable fraction (PAF): For a particular risk factor and causally linked disease or injury, the percentage reduction in burden that would occur for a population if exposure to the risk factor were avoided or reduced to its theoretical minimum.
relative risk (RR): The risk of an event relative to exposure, calculated as the ratio of the probability of the event’s occurring in the exposed group to the probability of its occurring in the non-exposed group. A relative risk of 1 implies no difference in risk; RR <1 implies the event is less likely to occur in the exposed group; RR >1 implies the event is more likely to occur in the exposed group.
relative standard error: The standard error expressed as a percentage of the estimate. This indicates the percentage of errors likely to have occurred due to sampling.
risk factor: Any factor that causes or increases the likelihood of a health disorder or other unwanted condition or event.
Impact of overweight and obesity as a risk factor for chronic conditions 51
theoretical minimum risk exposure distribution (TMRED): The risk factor exposure distribution that will lead to the lowest conceivable disease burden.
years lived with disability (YLD): A measure of the years of what could have been a healthy life that were instead spent in states of less than full health. This is also referred to as non-fatal burden.
years of life lost (YLL): A measure of the years of life lost due to premature mortality. This is also referred to as fatal burden.
52 Impact of overweight and obesity as a risk factor for chronic conditions

References Abdullah A, Peeters A, de Courten M & Stoelwinder J 2010. The magnitude of association between overweight and obesity and the risk of diabetes: a meta-analysis of prospective cohort studies. Diabetes Research and Clinical Practice 89:309–19.
ABS (Australian Bureau of Statistics) 2010. Measures of Australia’s progress, 2010. Cat. No. 1370.0. Canberra: ABS Viewed: 13 November 2015, <http://www.abs.gov.au/ausstats/[email protected]/cat/1370.0>.
Access Economics 2008. The growing cost of obesity in 2008: three years on. Canberra: Diabetes Australia.
AIHW (Australian Institute of Health and Welfare) 2014. Australia’s health 2014. Australia’s health series no. 14. Cat. no. AUS 178. Canberra: AIHW.
AIHW 2015. Cardiovascular disease, diabetes and chronic kidney disease—Australian facts: risk factors. Cardiovascular, diabetes and chronic kidney disease series no. 4. Cat. no. CDK 4. Canberra: AIHW.
AIHW 2016a. Australian Burden of Disease Study: impact and causes of illness and deaths in Australia 2011. Australian Burden of Disease Study series no. 3. Cat. no. BOD 4. Canberra: AIHW.
AIHW 2016b. Australian Burden of Disease Study 2011: methods and supplementary material. Australian Burden of Disease Study series no. 5. Cat no. BOD 6. Canberra: AIHW.
AIHW 2016c. Australia’s health 2016. Australia’s health series no. 15. Cat. no. AUS 199. Canberra: AIHW.
AIHW 2016d. Diabetes and chronic kidney disease as risks for other diseases: Australian Burden of Disease Study 2011. Australian Burden of Disease Study series no. 8. Cat. no. BOD 9. Canberra: AIHW.
AIHW 2016e. Healthy communities: overweight and obesity rates across Australia, 2014–15 (In Focus). Cat. no. HPF 2. Canberra: AIHW.
AIHW forthcoming. Burden of Cancer in Australia: Australian Burden of Disease Study 2011. Canberra: AIHW.
Anstey KJ, Cherbuin N, Budge M & Young J 2011. Body mass index in midlife and late-life as a risk factor for dementia: a meta-analysis of prospective studies. Obesity Reviews 12:e426–37.
Aune D, Norat T & Vatten LJ 2014. Body mass index and the risk of gout: a systematic review and dose-response meta-analysis of prospective studies. European Journal of Nutrition 53(8):1591–1601.
Barnes DE & Yaffe K 2011. The projected effect of risk factor reduction on Alzheimer’s disease prevalence. Lancet Neurology 10:819–28.
Bhaskaran K, Douglas I, Forbes H, dos-Santos-Silva I, Leon DA & Smeeth L 2014. Body-mass index and risk of 22 specific cancers: a population-based cohort study of 5.24 million UK adults. Lancet 384:755–65.
Impact of overweight and obesity as a risk factor for chronic conditions 53
Bogers RP, Bemelmans WJ, Hoogenveen RT, Boshuizen HC, Woodward M, Knekt P et al. 2007. Association of overweight with increased risk of coronary heart disease partly independent of blood pressure and cholesterol levels: a meta-analysis of 21 cohort studies including more than 300 000 persons. Archives of Internal Medicine 167:1720–8.
Brown V, Moodie M, Baur L, Wen L & Hayes A 2017. The high cost of obesity in Australian pre-schoolers. Australian and New Zealand Journal of Public Health. doi: 10.1111/1753-6405.12628.
Calle EE & Kaaks R 2004. Overweight, obesity and cancer: epidemiological evidence and proposed mechanisms. Nature Reviews Cancer 4:579–91.
Cameron AJ, Magliano DJ & Soderberg S 2013. A systematic review of the impact of including both waist and hip circumference in risk models for cardiovascular diseases, diabetes and mortality. Obesity Reviews 14:86–94.
Cole TJ, Bellizzi MC, Flegal KM & Dietz WH 2000. Establishing a standard definition for child overweight and obesity worldwide: international survey. British Medical Journal 320:1240–3.
Dhaliwal SS & Welborn TA 2009. Central obesity and multivariable cardiovascular risk as assessed by the Framingham prediction scores. American Journal of Cardiology 103:1403–7.
Dietz WH 1998. Health consequences of obesity in youth: childhood predictors of adult disease. Pediatrics 101:518–25.
Egan KB, Ettinger AS & Bracken MB 2013. Childhood body mass index and subsequent physician-diagnosed asthma: a systematic review and meta-analysis of prospective cohort studies. BMC Pediatrics 13:121.
Emmerzaal TL, Kiliaan AJ & Gustafson DR 2015. 2003–2013: a decade of body mass index, Alzheimer’s disease, and dementia. Journal of Alzheimer’s Disease 43:739–55.
Field AE, Coakley EH, Must A, Spadano JL, Laird N, Dietz WH et al. 2001. Impact of overweight on the risk of developing common chronic diseases during a 10-year period. Archives of Internal Medicine 161:1581–6.
Forouzanfar MH, Afshin A, Alexander LT, Anderson HR, Bhutta ZA, Biryukov S, et al. 2016. Global, regional, and national comparative risk assessment of 79 behavioural, environmental and occupational, and metabolic risks or clusters of risks, 1990–2015. Lancet 388(10053):1659–1724.
Freedman DS, Khan LK, Serdula MK, Dietz WH, Srinivasan SR & Berenson GS 2005. The relation of childhood BMI to adult adiposity: the Bogalusa Heart Study. Pediatrics 115:22–7.
Funder J & Leung J 2014. Obesity: a national epidemic and its impact on Australia. Obesity Australia.
Gallagher D, Visser M, Sepulveda D, Pierson RN, Harris T & Heymsfield SB 1996. How useful is body mass index for comparison of body fatness across age, sex, and ethnic groups? American Journal of Epidemiology 143:228–39.
Guo SS & Chumlea WC 1999. Tracking of body mass index in children in relation to overweight in adulthood. American Journal of Clinical Nutrition 70:145S–8S.
Gustafson DR & Luchsinger JA 2013. High adiposity: risk factor for dementia and Alzheimer’s disease? Alzheimer’s Research & Therapy 5:57.
54 Impact of overweight and obesity as a risk factor for chronic conditions

Hamman RF, Wing RR, Edelstein SL, Lachin JM, Bray GA, Delahanty L et al. 2006. Effect of weight loss with lifestyle intervention on risk of diabetes. Diabetes Care 29:2102–7.
Horton ES 2009. Effects of lifestyle changes to reduce risks of diabetes and associated cardiovascular risks: results from large scale efficacy trials. Obesity (Silver Spring) 17 (Supplement 3):S43–8.
Hsu C, McCulloch CE, Iribarren C, Darbinian J & Go AS 2006. Body mass index and risk for end-stage renal disease. Annals of Internal Medicine 144:21–8.
Huxley R, Mendis S, Zheleznyakov E, Reddy S & Chan J 2010. Body mass index, waist circumference and waist:hip ratio as predictors of cardiovascular risk–a review of the literature. European Journal of Clinical Nutrition 64:16–22.
Kelly AS, Barlow SE, Rao G, Inge TH, Hayman LL, Steinberger J et al. 2013. Severe obesity in children and adolescents: identification, associated health risks, and treatment approaches: a scientific statement from the American Heart Association. Circulation 128:1689–712.
Kolb R, Sutterwala FS & Zhang W 2016. Obesity and cancer: inflammation bridges the two. Current Opinion in Pharmacology 29:77–89.
Lauby-Secretan B, Scoccianti C, Loomis D, Grosse Y, Bianchini F & Straif K 2016. Body fatness and cancer—viewpoint of the IARC Working Group. New England Journal of Medicine 375:794–8.
Liu PC, Kieckhefer GM & Gau BS 2013. A systematic review of the association between obesity and asthma in children. Journal of Advanced Nursing 69:1446–65.
Llewellyn A, Simmonds M, Owen CG & Woolacott N 2016. Childhood obesity as a predictor of morbidity in adulthood: a systematic review and meta-analysis. Obesity Reviews 17:56–67.
Magnusson JO, Kull I, Mai XM, Wickman M & Bergstrom A 2012. Early childhood overweight and asthma and allergic sensitization at 8 years of age. Pediatrics 129:70–6.
Murray CJ, Ezzati M, Lopez AD, Rodgers A & Vander Hoorn S 2003. Comparative quantification of health risks conceptual framework and methodological issues. Population Health Metrics 1:1.
Ndumele CE, Matsushita K, Lazo M, Bello N, Blumenthal RS, Gerstenblith G et al. 2016. Obesity and subtypes of incident cardiovascular disease. Journal of the American Heart Association 5.
Ng SP, Korda R, Clements M, Latz I, Bauman A, Bambrick H et al. 2011. Validity of self-reported height and weight and derived body mass index in middle-aged and elderly individuals in Australia. Australian and New Zealand Journal of Public Health 35:557–63.
NHMRC (National Health and Medical Research Council) 2013. Clinical practice guidelines for the management of overweight and obesity in adults, adolescents and children in Australia. Melbourne: NHMRC.
Norton S, Matthews FE, Barnes DE, Yaffe K & Brayne C 2014. Potential for primary prevention of Alzheimer’s disease: an analysis of population-based data. Lancet Neurology 13:788–94.
Pedditizi E, Peters R & Beckett N 2016. The risk of overweight/obesity in mid-life and late life for the development of dementia: a systematic review and meta-analysis of longitudinal studies. Age Ageing 45:14–21.
Impact of overweight and obesity as a risk factor for chronic conditions 55
Piers LS, Rowley KG, Soares MJ & O’Dea K 2003. Relation of adiposity and body fat distribution to body mass index in Australians of Aboriginal and European ancestry. European Journal of Clinical Nutrition 57:956–63.
Pulgarón ER 2013. Childhood obesity: a review of increased risk for physical and psychological comorbidities. Clinical Therapeutics 35:A18–32.
Qiu C, Winblad B & Fratiglioni L 2005. The age-dependent relation of blood pressure to cognitive function and dementia. Lancet Neurology 4:487–99.
Renehan AG, Roberts DL & Dive C 2008. Obesity and cancer: pathophysiological and biological mechanisms. Archives of Physiology and Biochemistry 114:71–83.
Renehan AG, Tyson M, Egger M, Heller RF & Zwahlen M 2008. Body-mass index and incidence of cancer: a systematic review and meta-analysis of prospective observational studies. Lancet 371:569–78.
Rost NS, Wolf PA, Kase CS, Kelly-Hayes M, Silbershatz H, Massaro JM et al. 2001. Plasma concentration of C-reactive protein and risk of ischemic stroke and transient ischemic attack: the Framingham study. Stroke 32:2575–9.
Rothman KJ 2008. BMI-related errors in the measurement of obesity. International Journal of Obesity (Lond) 32 (Supplement 3):S56–9.
Sahoo K, Sahoo B, Choudhury AK, Sofi NY, Kumar R & Bhadoria AS 2015. Childhood obesity: causes and consequences. Journal of Family Medicine and Primary Care 4:187–92.
Sassi F 2010. Obesity and the economics of prevention: fit not fat. Paris: Organisation for Economic Co-operation and Development.
Singh GM, Danaei G, Farzadfar F, Stevens GA, Woodward M, Wormser D et al. 2013. The age-specific quantitative effects of metabolic risk factors on cardiovascular diseases and diabetes: a pooled analysis. Public Library of Science (PLoS) ONE 8:e65174.
Stender, Nordestgaard & Tybjarg-Hansen 2013. Elevated body mass index as a causal risk factor for symptomatic gallstone disease: a Mendelian randomization study. Hepatology 58:2133–41
Tantisira KG & Weiss ST 2001. Complex interactions in complex traits: obesity and asthma. Thorax 56 (Supplement 2):ii64–73.
Twig G, Yaniv G, Levine H, Leiba A, Goldberger N, Derazne E et al. 2016. Body-mass index in 2.3 million adolescents and cardiovascular death in adulthood. New England Journal of Medicine 374:2430–40.
Victorian Department of Human Services 2008. Future prevalence of overweight and obesity in Australian children and adolescents, 2005–2025. Melbourne: Victorian Department of Human Services.
Walls HL, Magliano DJ, Stevenson CE, Backholer K, Mannan HR, Shaw JE et al. 2012. Projected progression of the prevalence of obesity in Australia. Obesity (Silver Spring) 20:872–8.
Wang Y, Chen X, Song Y, Caballero B & Cheskin LJ 2008. Association between obesity and kidney disease: a systematic review and meta-analysis. Kidney International 73:19–33.
Wannamethee SG & Shaper AG 1999. Weight change and duration of overweight and obesity in the incidence of type 2 diabetes. Diabetes Care 22:1266–72.
56 Impact of overweight and obesity as a risk factor for chronic conditions

WHO (World Health Organization) 2004. Appropriate body-mass index for Asian populations and its implications for policy and intervention strategies. Lancet 363:157–63.
WHO 2013. Global Action Plan for the Prevention and Control of Noncommunicable Diseases 2013–2020. Geneva: WHO.
Will JC, Williamson DF, Ford ES, Calle EE & Thun MJ 2002. Intentional weight loss and 13-year diabetes incidence in overweight adults. American Journal of Public Health 92:1245–8.
WCRF & AICC (World Cancer Research Fund and American Institute for Cancer Research) 2007. Food, nutrition, physical activity, and the prevention of cancer: a global perspective Washington DC: AICC.
Yiallouros PK, Lamnisos D, Kolokotroni O, Moustaki M & Middleton N 2013. Associations of body fat percent and body mass index with childhood asthma by age and gender. Obesity (Silver Spring) 21:E474–82.
Impact of overweight and obesity as a risk factor for chronic conditions 57

List of tables Table 3.1: Burden (DALY) attributable to overweight and obesity, by sex, 2011 ................................. 10
Table 3.2: Burden attributable to overweight and obesity, by linked disease and sex, 2011 ............... 12
Table 3.3: Number and proportion of disease burden due to overweight and obesity (attributable DALY), by linked disease, 2011 ........................................................................... 17
Table 4.1: Burden (DALY) attributable to overweight and obesity by socioeconomic group, 2011 ................................................................................................................................................. 21
Table 4.2: Attributable DALY (number, age-standardised rate (ASR) and rate ratio), by socioeconomic group, 2011 .................................................................................................... 22
Table 5.1: Comparison of burden (DALY) attributable to overweight and obesity, 2003 and 2011 ................................................................................................................................ 24
Table 6.1: Comparison of the proportion of people aged 5 and over who are overweight or obese under the trend, stable rate and reduced scenarios, 2020, by sex ..................................... 27
Table 6.2: Comparison of the proportion of people who are overweight or obese under the trend, stable rate and reduced scenarios, 2020, by sex and broad age group ...................... 28
Table 6.3: Comparison of projected burden due to overweight and obesity in 2020 ............................ 29
Table B1: Relative risks and sources for linked diseases .......................................................................... 43
Table C1: Attributable burden (DALY) due to overweight/obesity, by linked disease and sex, 2011 ................................................................................................................................................. 47
Table C2: Proportion of fatal and non-fatal burden due to overweight/obesity, by linked disease and sex, 2011 .................................................................................................................... 48
Table C3: Age-standardised DALY rates per 1,000 people of burden attributable to overweight/obesity, by socioeconomic group and linked disease, 2011 .............................. 49
Table C4: DALY, age-standardised DALY rates and rate ratio of burden attributable to overweight and obesity, by socioeconomic group, 2011 ......................................................... 50
58 Impact of overweight and obesity as a risk factor for chronic conditions

List of figures Figure 3.1: Burden (DALY) attributable to overweight and obesity, by age and sex, 2011 .................. 11
Figure 3.2: Burden attributable to overweight and obesity due to fatal and non-fatal burden, by age, males (a) and females (b), 2011 ...................................................................................... 13
Figure 3.3: Burden attributable to overweight and obesity due to fatal and non-fatal burden, selected leading linked diseases, males (a) and females (b), 2011 ......................................... 14
Figure 3.4: Burden attributable to overweight and obesity, by age and grouped linked diseases, DALY (a) and proportion within each age group DALY (b), 2011 ........................ 16
Figure 3.5: Burden (DALY) due to overweight and obesity, by sex and top 10 linked diseases, 2011 ................................................................................................................................................. 18
Figure 3.6: Proportion of linked disease burden (DALY) due to overweight and obesity, by sex and top 10 linked diseases, 2011 ..................................................................................... 18
Figure 4.1: Age-standardised attributable DALY rate due to overweight and obesity (per 1,000 people), by socioeconomic group and sex, 2011 ..................................................... 22
Figure 4.2: Age-specific attributable DALY rate due to overweight and obesity (per 1,000 people), by socioeconomic group and age, 2011 .................................................... 23
Figure 4.3: Age-standardised attributable DALY rate due to overweight and obesity for top six linked diseases, by socioeconomic group, 2011 ........................................................................ 23
Figure 5.1: Number and rates of burden (DALY per 1,000 people) attributable to overweight and obesity, by age, 2003 and 2011 ............................................................................................. 24
Figure 5.2: Age-standardised attributable DALY rate per 1,000 people for the top six diseases linked to overweight and obesity, 2003 and 2011 .................................................................... 25
Figure 6.1: Burden (DALY) due to overweight and obesity by age, under the trend, stable rate and reduced scenarios, 2020 .......................................................................................... 29
Figure 6.2: Burden (DALY) due to overweight and obesity avoided by age, under the stable rate and reduced scenarios, 2020 .......................................................................................... 30
Figure A1: BMI distribution and example of TMRED estimation ............................................................. 39
Impact of overweight and obesity as a risk factor for chronic conditions 59

AIHW
Impact of overweight and obesity as a risk factor for chronic conditions
This report updates and extends estimates of the burden due to overweight and obesity reported in the Australian Burden of Disease Study 2011 to include burden in people aged under 25, revised diseases linked to overweight and obesity based on the latest evidence, and estimates by socioeconomic group. The report includes scenario modelling, undertaken to assess the potential impact on future health burden if overweight and obesity in the population continues to rise or is reduced. The enhanced analysis in the report shows that 7.0% of the total health burden in Australia in 2011 is due to overweight and obesity, and that this burden increased with increasing level of socioeconomic disadvantage.
Australian Burden of Disease StudyImpact of overw
eight and obesity as a risk factor for chronic conditions: Australian Burden of D
isease Study