Impact of oil well blowout at Baghjan oil field, Assam and ......Bora and Pranjal. We are thankful...
178
Impact of oil well blowout at Baghjan oil field, Assam and resulting oil spill, on surrounding landscape JULY 15, 2020
Transcript of Impact of oil well blowout at Baghjan oil field, Assam and ......Bora and Pranjal. We are thankful...
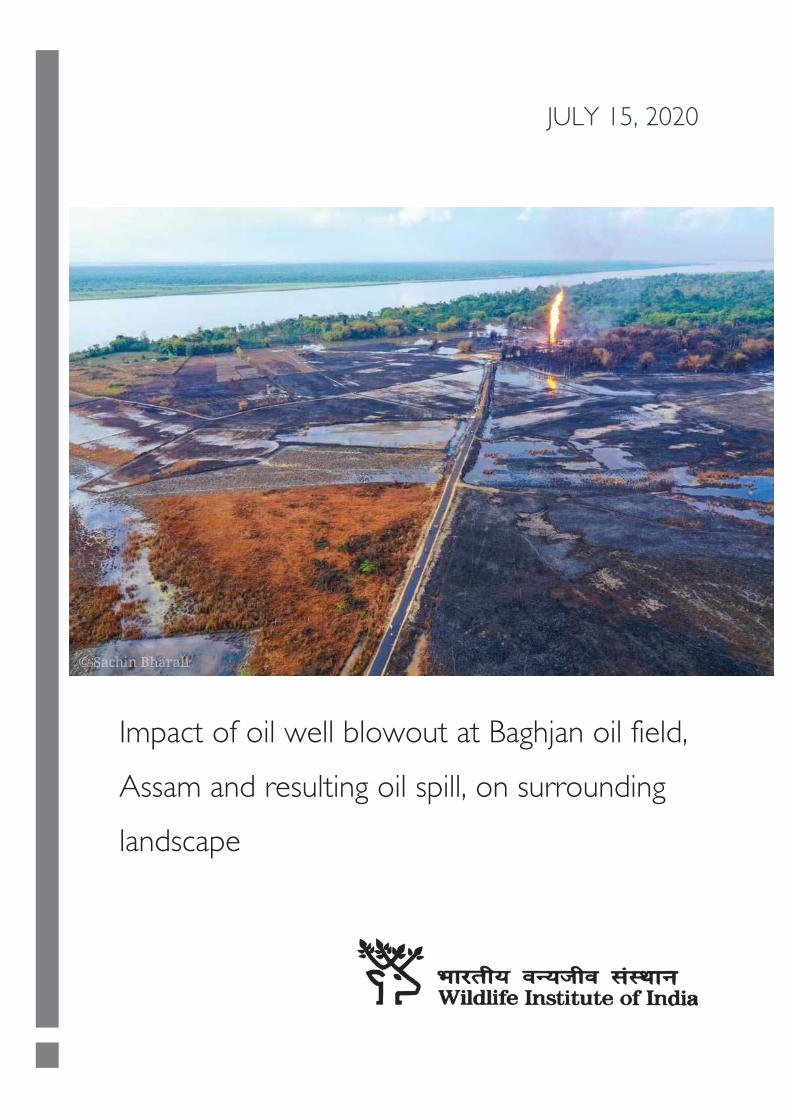
Impact of oil well blowout at Baghjan oil field,
Assam and resulting oil spill, on surrounding
landscape
JULY 15, 2020
RResearch Team
Scientists: Qamar Qureshi, Vishnupriya Kolipakam and Abdul Wakid
Researchers: Merin Jacob, Aaranya Gayathri, Vineet Singh, Anurag Rokade, Ranjana Negi, Hiyashri Sarma, Abhijit Konwar, Jitul Kalita, Syeda Tabassum Tasfia, Gargi Roy, Harshini Jhala, Sunny Deori, Vishrutha Rao, Kanad Roy, Karuna Gupta, Ayan Dutta, Madhavi Kumari, Sneha Mane, Subhasree Das, Archisman Mitra Collaborators: Dr. Firoz Ahmed (Herpetofauna, Aaranyak), Mridu Paban Phukan (birds),
Field assistants: Manoj Kumar Das, Nurjamal Hoque
Acknowledgement: We are thankful to MoEFCC & CAMPA for funding the impact assessment study. We thank ADG (Wildlife), MoEFCC, the Principal Chief Conservator of Forest (wildlife) and Chief Wildlife Warden of Government of Assam in facilitating and providing appropriate permits to conduct the study. We acknowledge the assistance provided by Shri Rajendra Singh Bharati (DFO-Tinsukia Wildlife Division) and his staff, without whom this work would have not been possible. We especially acknowledge the support by Forest Gaurds, Mohandeep Gogoi, Juri Bora and Pranjal. We are thankful to Mr. Pradipta Barua (DFO-Dibrugarh Forest Division) for field support. We sincerely acknowledge the help extended by Tinsukia District Administration to allow us to work in the affected area. Special thanks to Joynal Abedin (Benu) and his staff of Banashree eco camp for providing local logistics to conduct the study. We thank the Boat staff for helping us even in tough weather. We thank Kaiinos for helping with geospatial analysis and Shriram Institute of Industrial Research, New Delhi for chemical analysis. We thank Dr Deborshree Gogoi, Dr Ranjan Kumar Das, Mr Jiben Dutta Dr Abhijeet Das. Director and Dean, Wildlife Institute of India are acknowledged for their support.
TABLE OF CONTENTS
1 Executive Summary 1 2 Context 15 3 Landscape Fraglity 19 3.1 Introduction 19
3.2 River Morphology 20
3.3 Seismic activity 26
4 Contamination of air, water and terrestrial system 29 4.1 Impact on land surface temperature 33
4.2 River and Wetland Pollution mapping 33
5 Water quality assessment of Lohit river, Dibru river and Motapung—Maguri beel 35 5.1 Introduction 36
5.2 Water quality 38
5.3 Concentration of PAHs in surface water 42
5.4 Concentration of PAHs among sediment samples 43
5.5 Concentration of PAHs among Fish Species 43
5.6 Risk valuation of PAHs in aquatic ecosystem 50
5.6.1 Plants and Microbes 54
5.6.2 Fish 54
5.6.3 Reptiles and Amphibians 55
5.6.4 Birds 55
5.6.5 Mammals 56
6 Sound pollution from the oil well blowout 57 6.1 Surface noise monitoring 57
6.2 Underwater noise monitoring 61
7 Biodiversity Survey 65 7.1 Monitoring of Ganges River Dolphin (Platanista gangetica gangetica) 67
7.2 Acoustic monitoring of dolphins 70
7.3 Birds 74
7.4 Fishes 83
7.5 Long term effects on aquatic life from oil spill 88
7.6 Butterflies and odonates 90
7.7 Herpetofauna 93
7.8 People 96
8 Conclusion 97 9 Methods in detail 101 9.1 Measuring change: River morphology 101
9.2 Channel shift rate: 101
9.3 Braiding index 102
9.4 Measuring pollution levels using geospatial methods 102
9.5 Impact on land surface temperature 103
9.6 River and Wetland Pollution mapping 103
9.7 Pollution – water quality 104
9.8 Sound pollution: 105
9.9 Underwater noise monitoring 106
9.10 Dolphin monitoring 107
9.11 Acoustic monitoring of dolphins 107
9.12 Biodiversity methods 108
10 Reference 111 11 Appendix 1 – Burned area visualisation 121 12 Appendix 2 Checklists of birds recorded earlier from the grasslands (same grids we sampled) collected from eBird site. 122 13 Appendix 3 Checklists of birds recorded earlier from the wetland area (Maguri-Motapung Beel)(same grids we sampled) collected from eBird 127 14 Appendix 4 Checklist of birds recorded by us in grassland 144 15 Appendix 5 Checklist of birds recorded by us in wetland (Maguri-Motapung Beel) 145 16 Appendix 6 Checklist of fishes captured from Dibru River and Maguri – Motapung Beel 146 17 Appendix 7 List of species of Butterflies sighted during the survey 147 18 Appendix 8 List of species of odonates sighted during the survey 150 19 Appendix 9 List of herpetofaunal species encountered during the survey period 151 20 Appendix 10 List of herpetofauna found in this area 153 21 Appendix 11 Checklist of Herpetofauna (Source: Ahmed & Das, 2020) 160 22 Appendix 12 Post Mortem report of Ganges River Dolphin 164 23 Appendix 13 World Health Organization (WHO) Guidelines for noise based on the lowest levels of noise that affect health 169
LIST OF FIGURES
Figure 1.1 Landscape of Tinsukia and Dibrugarh districts. Protected areas in the vicinity are highlighted ..................... 1
Figure 1.2 Change in river courses from 1985 to 2020 around Dibru-Saikhowa Biosphere Reserve ............................... 3
Figure 1.3 Dead Ganges river dolphin found in Maguri-Motapung beel of Tinsukia. ........................................................ 5
Figure 1.4 Noise level with response to distance from the explosion site; *gray colour arrows show the distance at which the 70dB industrial zone threshold is achieved .............................................................................................................. 6
Figure 1.5 Baghjan oil spill site and dolphin sightings recorded during different temporal surveys. ................................ 7
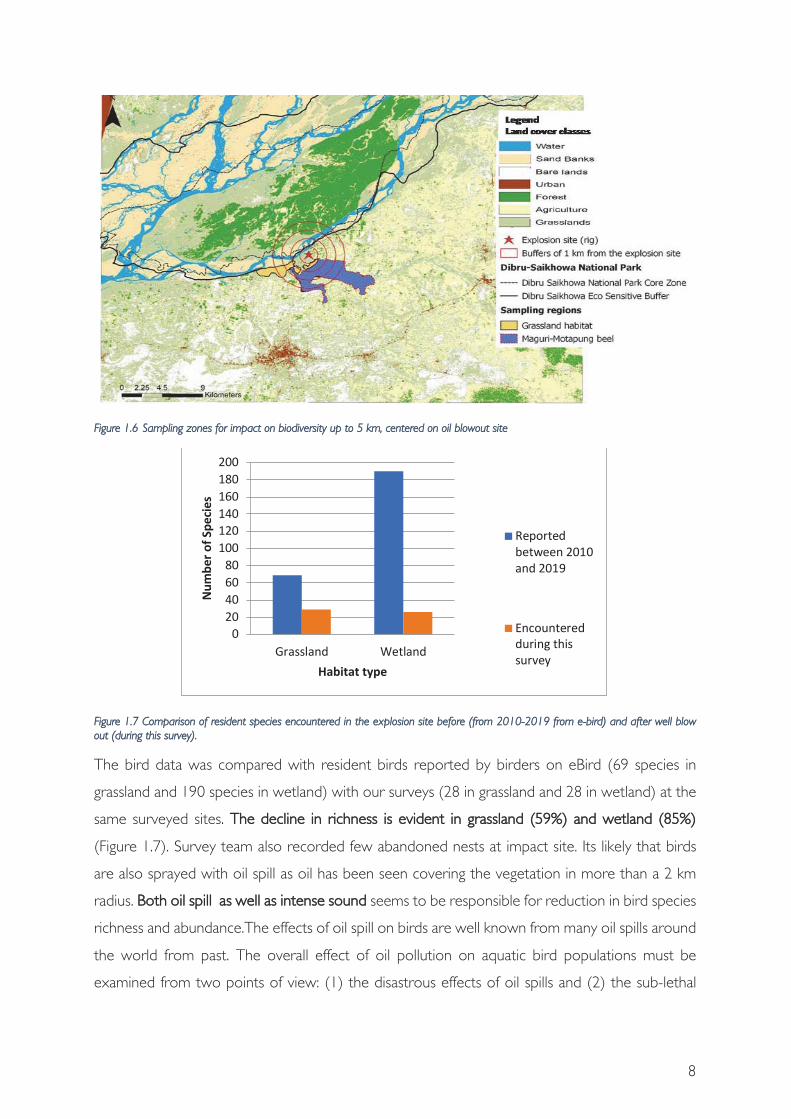
Figure 1.6 Sampling zones for impact on biodiversity up to 5 km, centered on oil blowout site ...................................... 8
Figure 1.7 Comparison of resident species encountered in the explosion site before (from 2010-2019 from e-bird) and after well blow out (during this survey). ...................................................................................................................................... 8
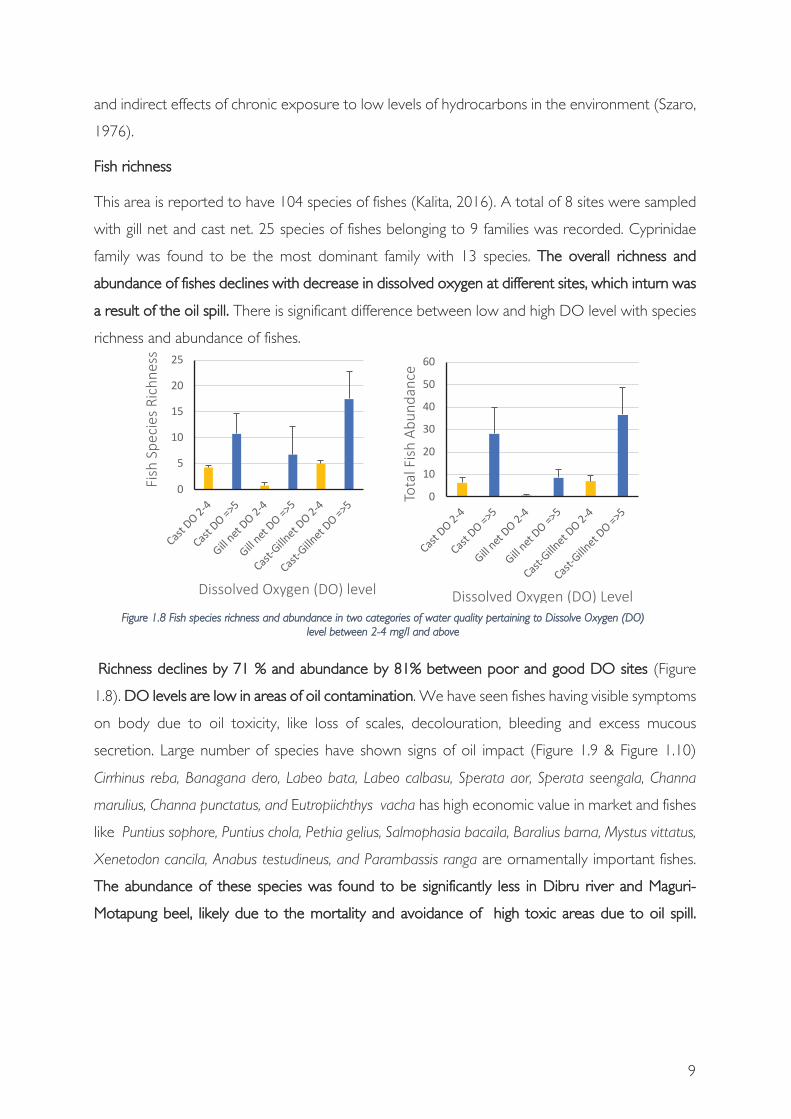
Figure 1.8 Fish species richness and abundance in two categories of water quality pertaining to Dissolve Oxygen (DO) level between 2-4 mg/l and above ................................................................................................................................................ 9
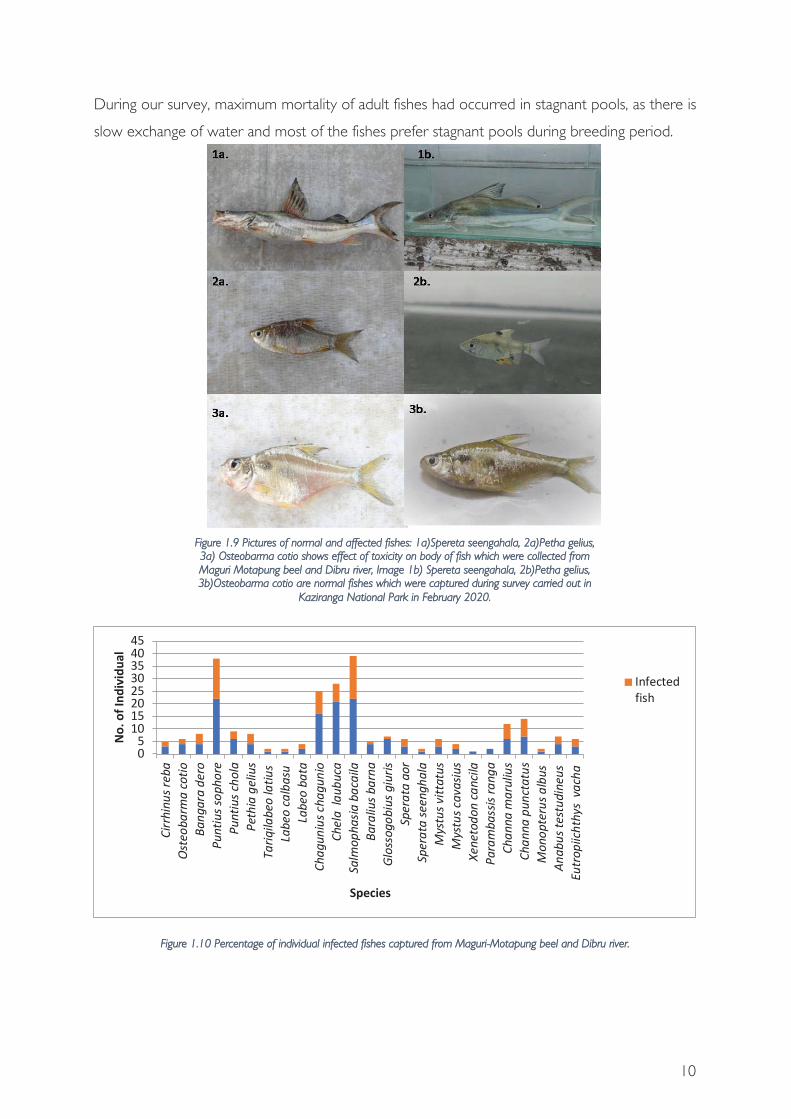
Figure 1.9 Pictures of normal and affected fishes: 1a)Spereta seengahala, 2a)Petha gelius, 3a) Osteobarma cotio shows effect of toxicity on body of fish which were collected from Maguri Motapung beel and Dibru river, Image 1b) Spereta seengahala, 2b)Petha gelius, 3b)Osteobarma cotio are normal fishes which were captured during survey carried out in Kaziranga National Park in February 2020. .............................................................................................................................. 10
Figure 1.10 Percentage of individual infected fishes captured from Maguri-Motapung beel and Dibru river. ............. 10
Figure 1.11 Species and number of butterflies encountered at varying distances from the explosion site at 5 minute intervals ........................................................................................................................................................................................... 11
Figure 2.1 Landscape of Tinsukia and Dibrugarh districts. Protected areas in the vicinity are highlighted ................... 16
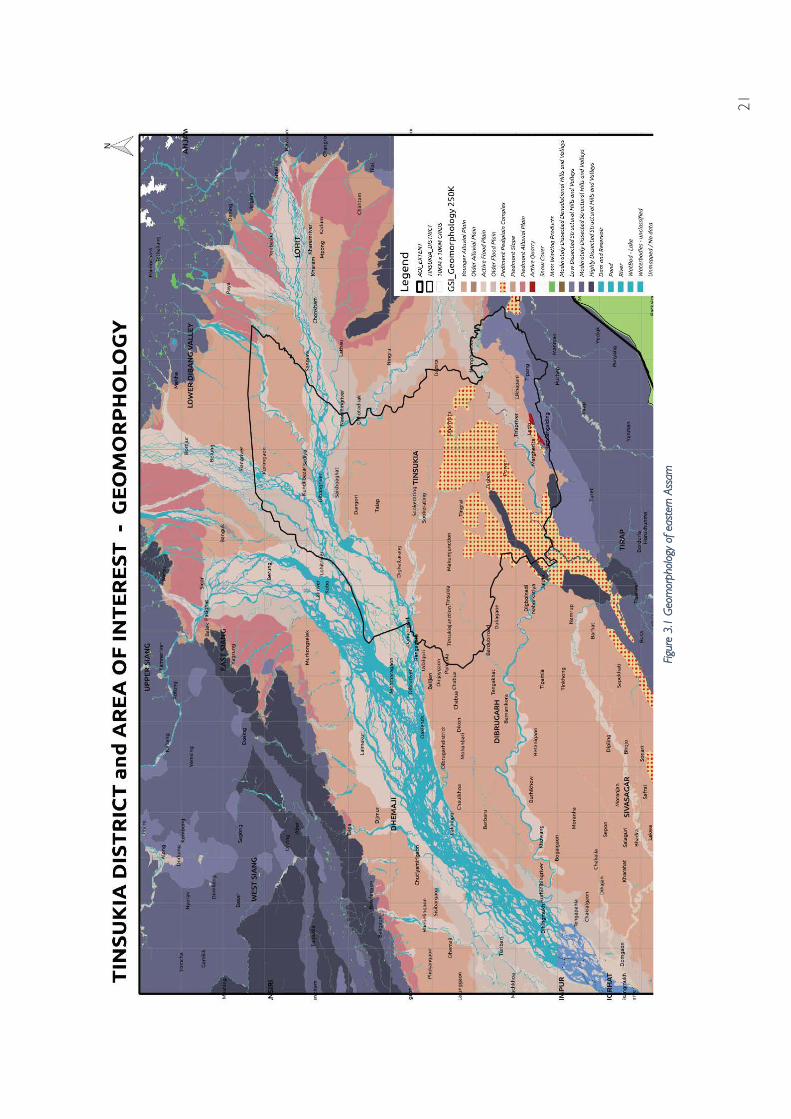
Figure 3.1 Geomorphology of eastern Assam .......................................................................................................................... 21
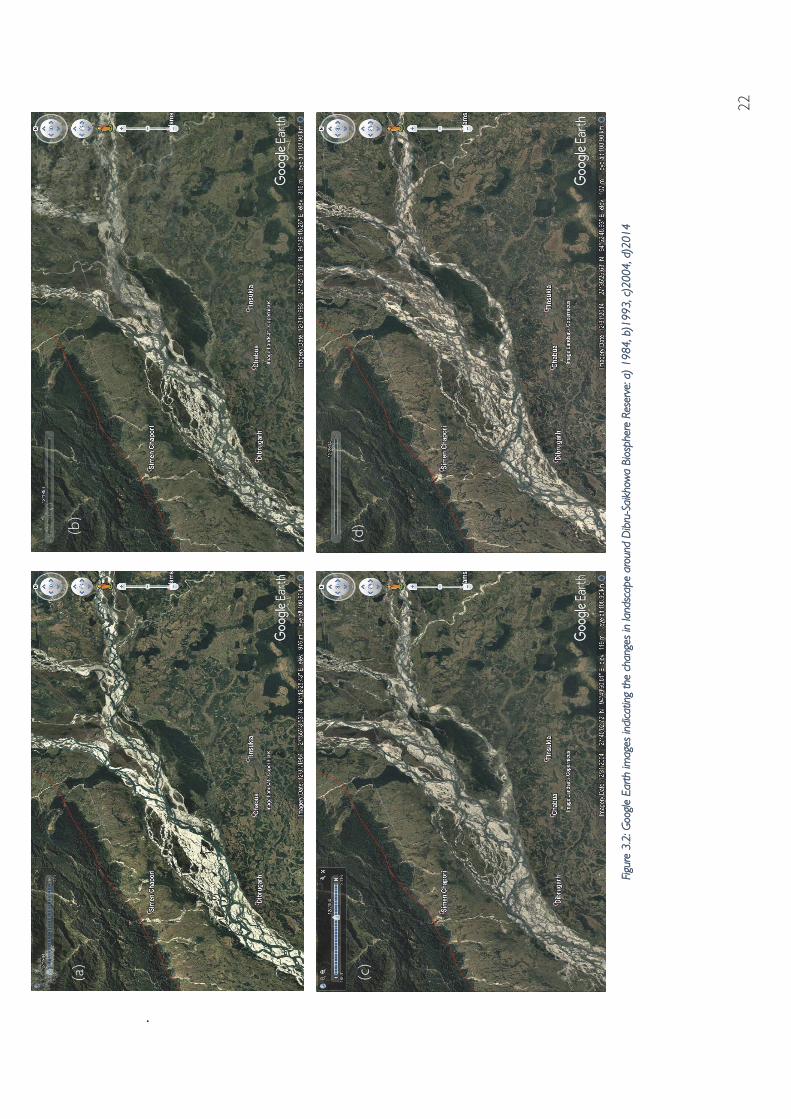
Figure 3.2: Google Earth images indicating the changes in landscape around Dibru-Saikhowa Biosphere Reserve: a) 1984, b)1993, c)2004, d)2014 ...................................................................................................................................................... 22
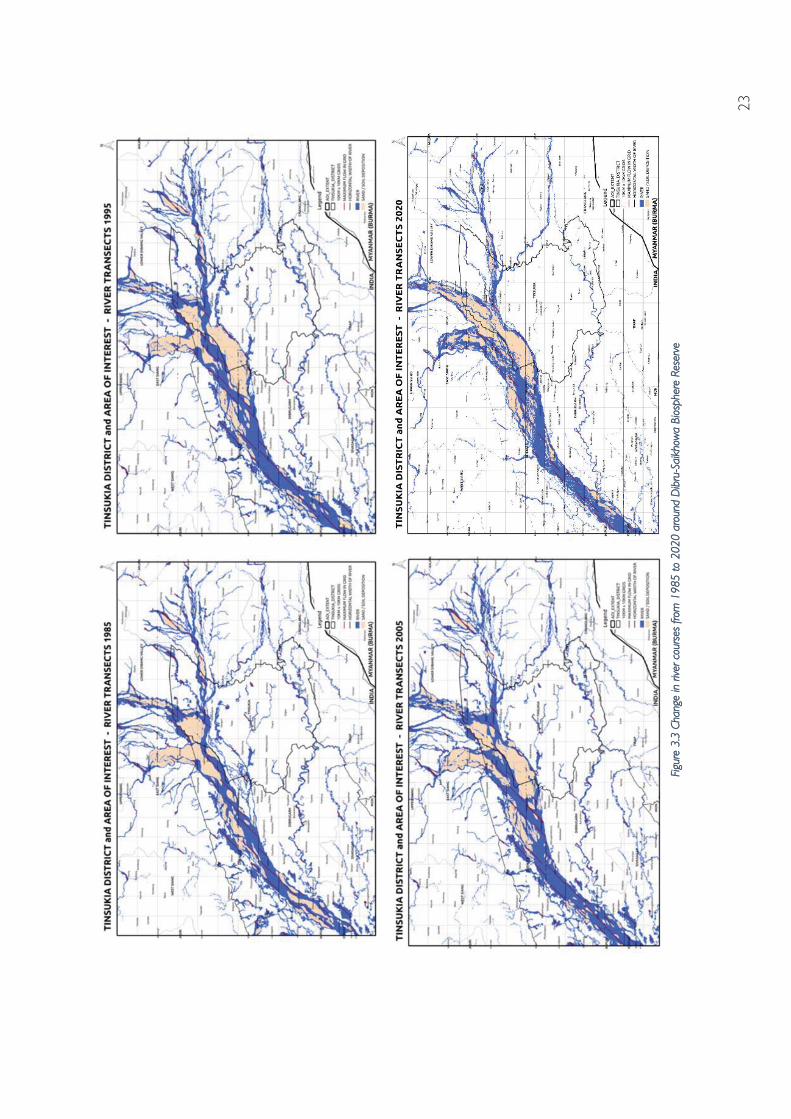
Figure 3.3 Change in river courses from 1985 to 2020 around Dibru-Saikhowa Biosphere Reserve ............................. 23
Figure 3.4 Landcover changes around Dibru-Saikhowa National Park, Dibrugarh and Tinsukia district - data derived from Landsat and LISS satellites ................................................................................................................................................ 24
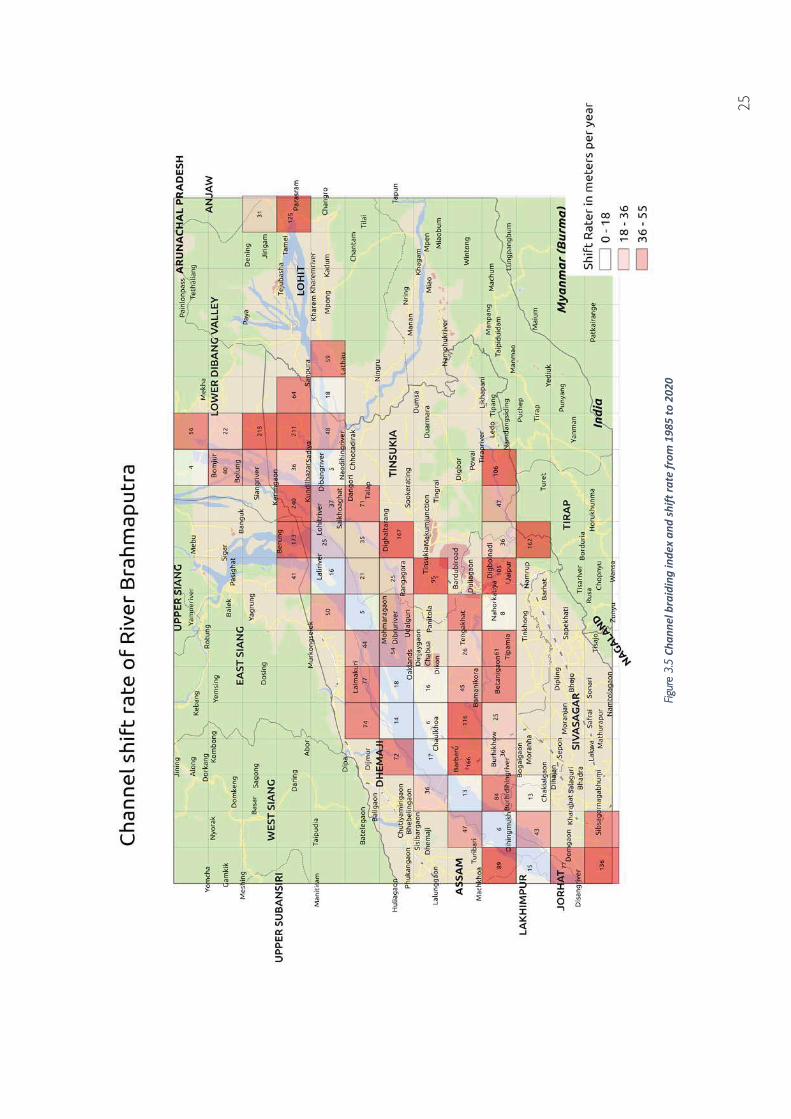
Figure 3.5 Channel braiding index and shift rate from 1985 to 2020 ................................................................................... 25
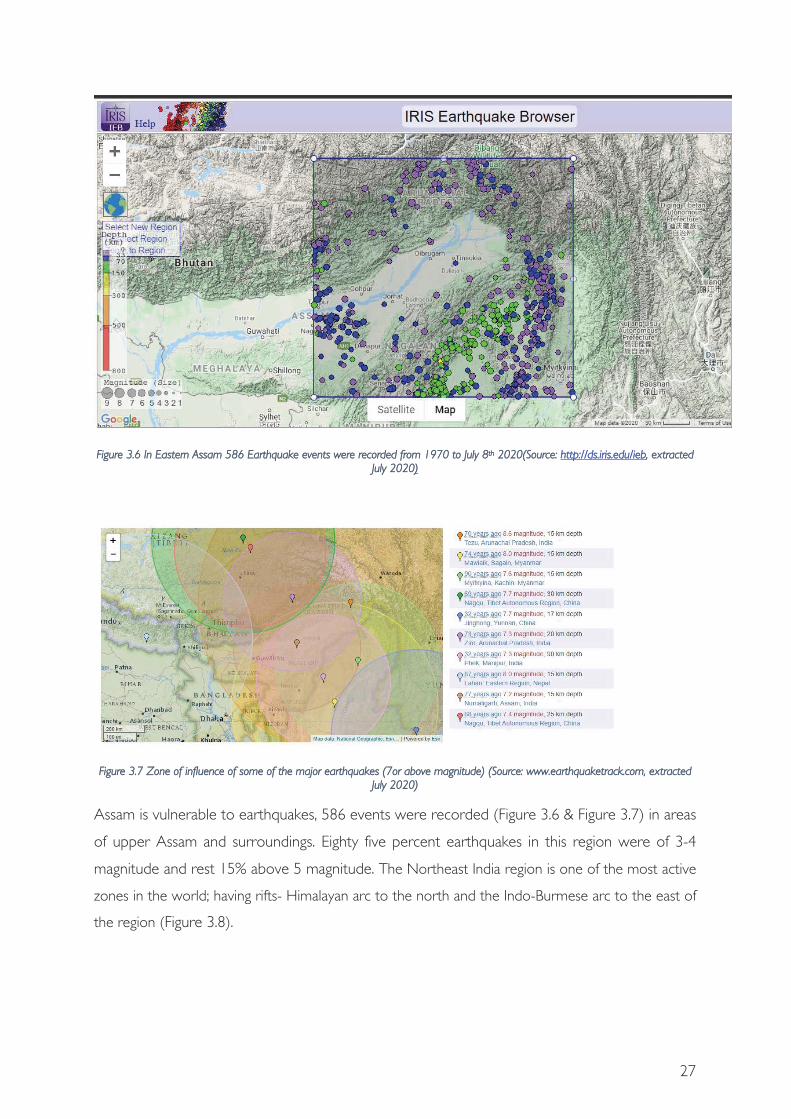
Figure 3.6 In Eastern Assam 586 Earthquake events were recorded from 1970 to July 8th 2020(Source: http://ds.iris.edu/ieb, extracted July 2020) .............................................................................................................................. 27
Figure 3.7 Zone of influence of some of the major earthquakes (7or above magnitude) (Source: www.earthquaketrack.com, extracted July 2020) ...................................................................................................................... 27
Figure 3.8 Tectonic map of the area around Dibru-Saikhowa Biosphere Reserve. Thrusts Defined by Narula et al (20000) and Borghain et al (2016) in this area are MBT (Main Boundary Thrust), MFT (Main Frontal Thrust), Mishmi Thrust, Tidding Suture, Lohit Thrust and Naga Thrust. ........................................................................................................ 28
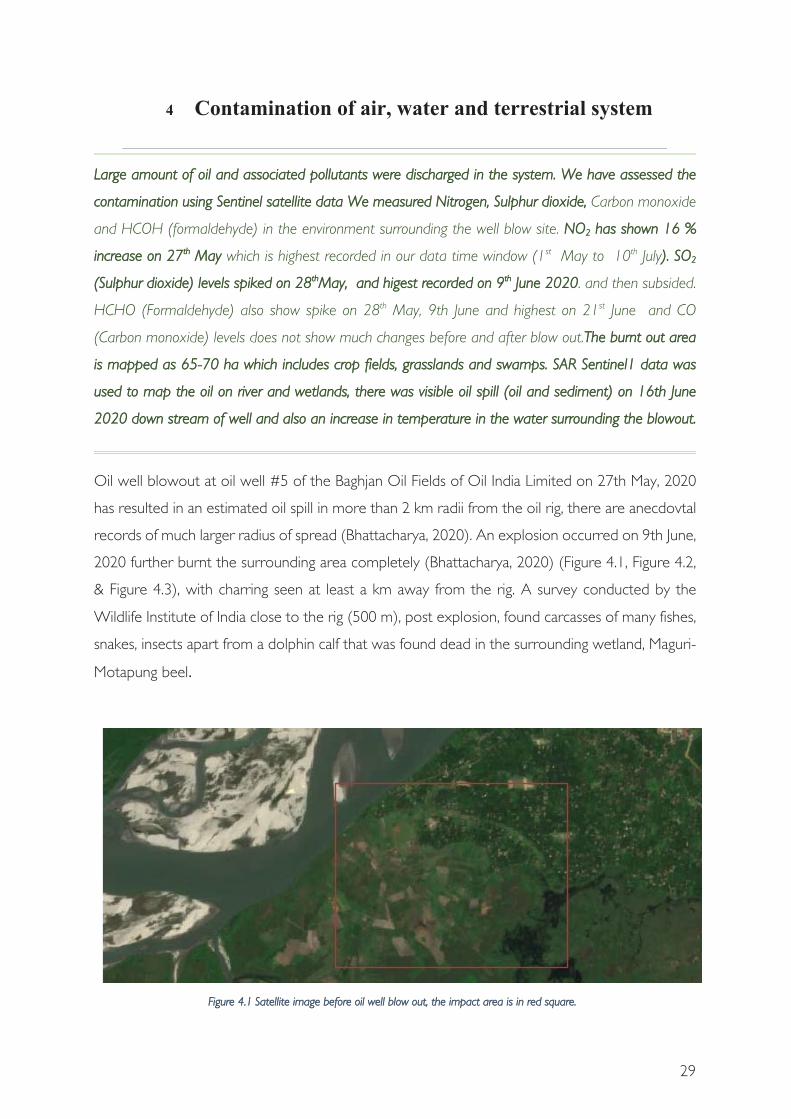
Figure 4.1 Satellite image before oil well blow out, the impact area is in red square. ........................................................ 29
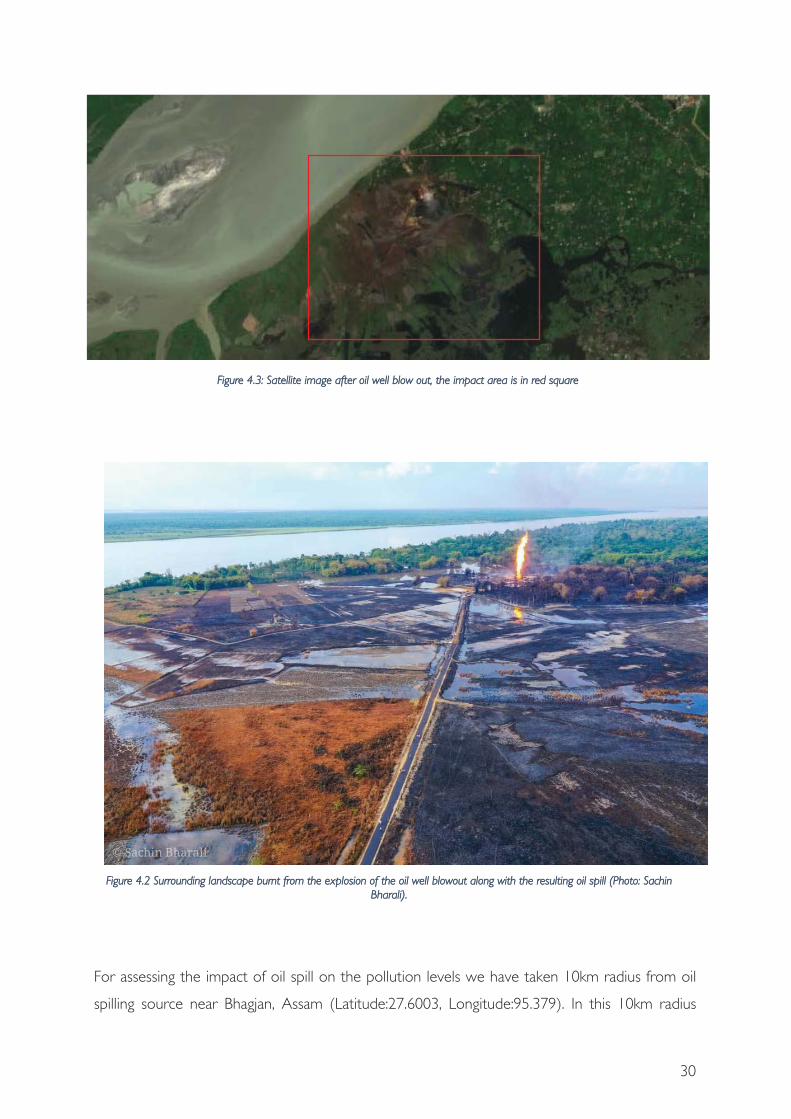
Figure 4.2 Surrounding landscape burnt from the explosion of the oil well blowout along with the resulting oil spill (Photo: Sachin Bharali). ................................................................................................................................................................ 30
Figure 4.3: Satellite image after oil well blow out, the impact area is in red square ............................................................ 30
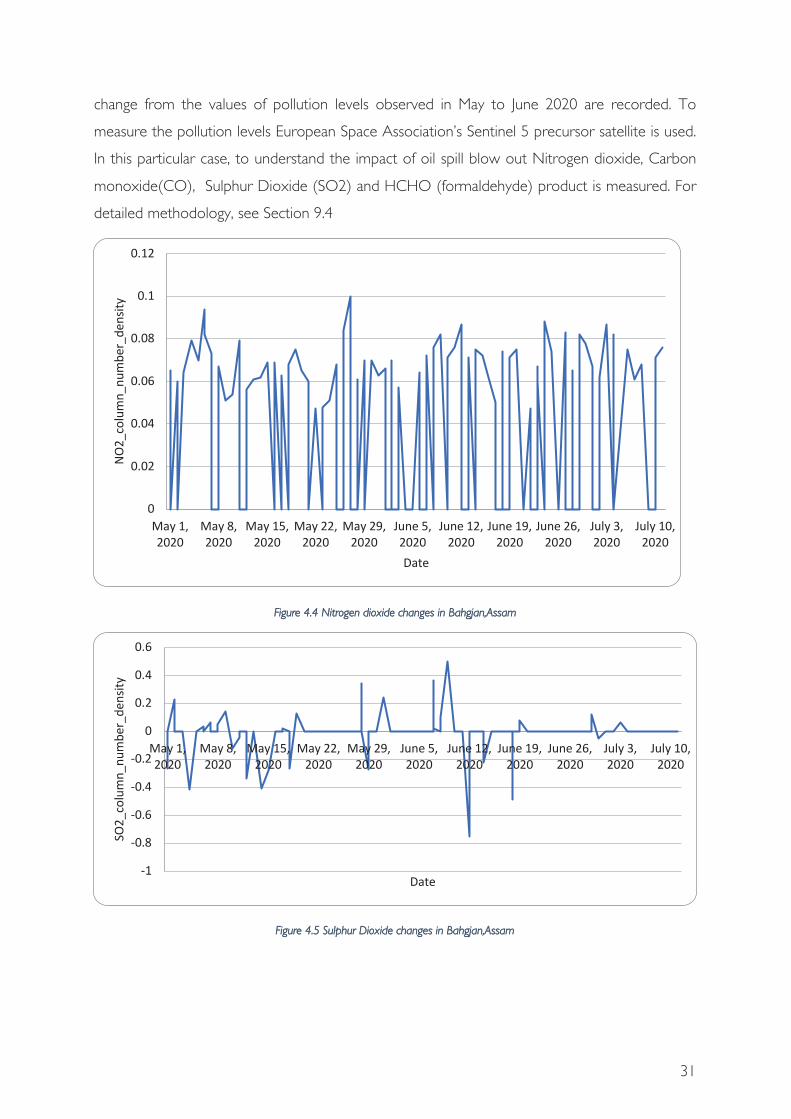
Figure 4.4 Nitrogen dioxide changes in Bahgjan,Assam ......................................................................................................... 31
Figure 4.5 Sulphur Dioxide changes in Bahgjan,Assam .......................................................................................................... 31
Figure 4.6 CHOH fluctuions in May and June in and around oil well blow out site. ........................................................ 32
Figure 4.7 Temperature profile around Baghjan well blowout site. ...................................................................................... 33
Figure 4.8: No Visible oil pollution on 23rd May at Maguri Motapung beel ........................................................................ 34
Figure 4.9: 16th June satellite imagery shows oil contamination on vegetation and water – after blow out on 9th June. .......................................................................................................................................................................................................... 34
Figure 5.1: a.Dead fish specimen;b.presence of oil in water near rig area; c. water sample collected from nearby area .......................................................................................................................................................................................................... 37
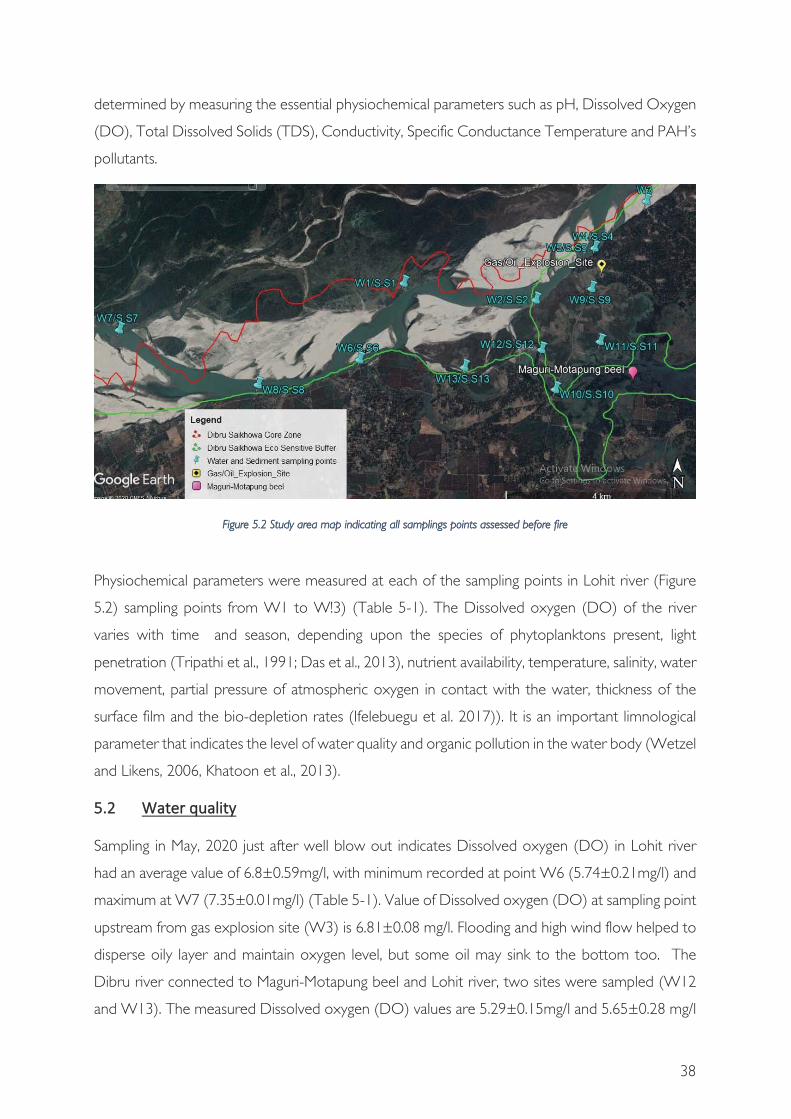
Figure 5.2 Study area map indicating all samplings points assessed before fire .................................................................. 38
Figure 6.1 A representative spectrogram of environmental noise. Horizontal axis represents time, and the vertical axis represents frequency. The amplitude is a third dimension of a particular frequency at a particular time and is represented by the intensity of the colour. ................................................................................................................................ 58
Figure 6.2 Sound levels of common sounds in air re 20 Pa. (© University of Rhode island) ........................................ 59
Figure 6.3 Noise level with response to distance from the explosion site. * Gray colour arrow show the distance at which 70dB industrial zone threshold is achieved ................................................................................................................... 61
Figure 6.4 Power Spectral Density (PSD) view in the spectrogram ...................................................................................... 63
Figure 7.1 Baghjan oil spill site and dolphin sightings recorded during different temporal surveys. .............................. 68
Figure 7.2 Dead Ganges river dolphin found in Maguri-Motapung beel of Tinsukia. ...................................................... 70
Figure 7.3 Density plot of diel activity patterns of Ganges river dolphins in Lohit river ................................................ 71
Figure 7.4 Density plot of diel activity patterns of Ganges river dolphins in Lohit river .................................................. 72
Figure 7.5 Map showing the of the location of CPOD deployment at River Lohit and Dibru area and Maguri-Motapung Beel area .......................................................................................................................................................................................... 72
Figure 7.6 Density plot of frequency usage of Ganges river dolphin in Lohit and Dibru river ....................................... 73
Figure 7.7 Density plot of average sound pressure level (SPL) usage of Ganges river dolphin in Lohit and Dibru river .......................................................................................................................................................................................................... 73
Figure 7.8 Density plot of number of clicks per train usage by Ganges river dolphin in Lohit and Dibru river .......... 74
Figure 7.9 Sampling regions, concentric circles of 1km from Baghjan well no.5 (accident site). ..................................... 75
Figure 7.10 Species accumulation curve for grassland at different distances (1,2,4,5 km buffer) and wetland (Ma) .... 76
Figure 7.11 Graph showing monthly records of species richness across different months in the grassland region (checklists =10, since 2010, source: eBird) ............................................................................................................................... 77
Figure 7.12 Graph showing monthly records of species abundance across different months in the grassland region (checklists =10, since 2010, source: eBird). .............................................................................................................................. 78
Figure 7.13 Graph showing monthly records of species richness across different months in the wetland region (checklists =421, since 2010, source: eBird) ............................................................................................................................. 79
Figure 7.14 Graph showing monthly records of species abundance across different months in the wetland region (checklists =421, since 2010, source: eBird). ............................................................................................................................ 80
Figure 7.15 Comparison of resident species encountered in the explosion site before (from 2010-2019 from e-bird) and after explosion (during this survey). ................................................................................................................................... 80
Figure 7.16 Showing Sampling sites in Dibru river and Maguri-Motapung Beel and sites where fish mortality was collected. ......................................................................................................................................................................................... 84
Figure 7.17 Fish species richness in two categories of Dissolved Oxygen (DO), DO between 2-4 mg/l and DO equal or more than 5 mg/l. .................................................................................................................................................................... 85
Figure 7.18 Fish species richness in two categories of Dissolved Oxygen (DO), DO between 2-4 and DO equal or more than 5 .................................................................................................................................................................................... 85
Figure 7.19 Percentage of normal and affected fishes captured from Maguri-Motapung beel and Dibru river. ........... 86
Figure 7.20 Images- Photographs of affected and normal fishes: 1a)Spereta seengahala, 2a)Petha gelius, 3a) Osteobarma cotio shows effect of toxicity on body of fish which were collected from Maguri Motapung beel and Dibru river, Image 1b) Spereta seengahala, 2b)Petha gelius, 3b)Osteobarma cotio are normal fishes which were captured during survey carried out in Kaziranga National Park in February 2020. ........................................................... 87
Figure 7.21 Carasses of (clockwise from upper left) 1.Channa punctatus, 2. Monopterus albus (eel), 3. Puntius sophore found at regions in and around the Maguri-Motapung beel .................................................................................................. 88
Figure 7.22 Species and number of butterflies encountered at varying distances from the explosion site ..................... 91
Figure 7.23 Species and number of butterflies encountered at varying distances from the explosion site at 5 minute intervals ........................................................................................................................................................................................... 91
Figure 7.24 Carcass of scarlet skimmer with visible coating of oil on the wings ................................................................ 92
Figure 7.25 Location of herpetofauna opportunistic encounters (both live and carcasses) during the survey period (02/06/2020 – 07/07/2020) (details of the herpetofauna are given in Appendix 9, 10 & 11 ) ....................................... 95
Figure 9.1 Flow diagram shows the process of deriving the geostatistics for the pollution levels. ................................ 102
Figure 9.2 Study area map indicating all samplings points assessed before explosion ..................................................... 105
Figure 9.3 Sampling regions, concentric circles of 1km from Baghjan well no.5 (accident site). ................................... 109
LIST OF TABLES
Table 5-1 Water quality parameters at the sampling points, post oil well blowout ............................................................ 41
Table 5-2 Essential water quality parameters at each sampling point after explosion at the site ..................................... 42
Table 5-3 Concentration (µg/Kg) of PAHs among water samples collected from the Lohit river, Maguri-Motapung Wetlands and Dibru river. ............................................................................................................................................................ 44
Table 5-4 Concentration (µg/L) of PAHs among sediment samples collected from the Lohit river, Maguri-Motapung Wetlands and Dibru river. ............................................................................................................................................................ 46
Table 5-5 Concentration (µg/Kg) of PAHs among fish collected from the Maguri-Motapung wetland and Lohit river. .......................................................................................................................................................................................................... 48
Table 5-6 The Acute Toxicity Level (LC50) of PAHs in some of the aquatic species (USEPA, 2012). ......................... 52
Table 6-1 Summary of the noise level recordings at various distance from the oil explosion site in Baghjan along Lohit river. ................................................................................................................................................................................................. 59
Table 6-2 Summary of the noise level recordings at various distance from the oil explosion site in Baghjan in the rig area on land .................................................................................................................................................................................... 60
Table 6-3 Centre pollution control Board (CPCB) permissible limits for noise level ........................................................ 60
Table 6-4 Typical Sound Pressure Levels for various sources by National Oceanic and Atmospheric Administration(NOAA) ............................................................................................................................................................... 62
Table 6-5 Mean SPL at various points in the upstream of river Lohit from the oil explosion site ................................. 62
Table 6-6 The mean SPL at various points in the downstream of river Lohit from the oil explosion site. ................... 63
Table 6-7 Effects of Human-Generated Sound on aquatic biodiversity (Rako-Gospic and Picciulin, 2019) ................ 64
Table 7-1 Estimates before and after oil spill within a 20km stretch of affected zone of the Brahmaputra River ....... 68
Table 7-2 Estimates of Ganges dolphin population during previous surveys in Lohit- Dibru stretch of Brahmaputra River. ............................................................................................................................................................................................... 69
Table 7-3 Effort and counts of species obtained during the survey period in comparison to data available from e-bird .......................................................................................................................................................................................................... 75
Table 7-4 Incidental sightings of nests were recorded in the sampling area in 3 locations in different microhabitats. 81
Table 9-1 Types of nets used and the effort invested in Maguri-Motapung Beel and Dibru for fish sampling. ......... 109

1
Impact of oil well blow out at Baghjan oil field,
Assam and resulting oil spill, on surrounding
landscape
The oil spill due to blow out of well number 5 of Baghjan on 27th May, 2020 and subsequent fire
on 9th June, 2020 destroyed about 60-70 ha of area around the site. The oil spread out not only
on land, but also dispersed into the surrounding rivers and wetlands. The loud noise due to the
explosion can be heard as far as 12 km and beyond, making the area extremely unhealthy for
humans and wildlife. The affected area is biodiversity rich and one of the important remaining
refuge for several endangered and range restricted species.
FFigure 1.1 Landscape of Tinsukia and Dibrugarh districts. Protected areas in the vicinity are highlighted
2
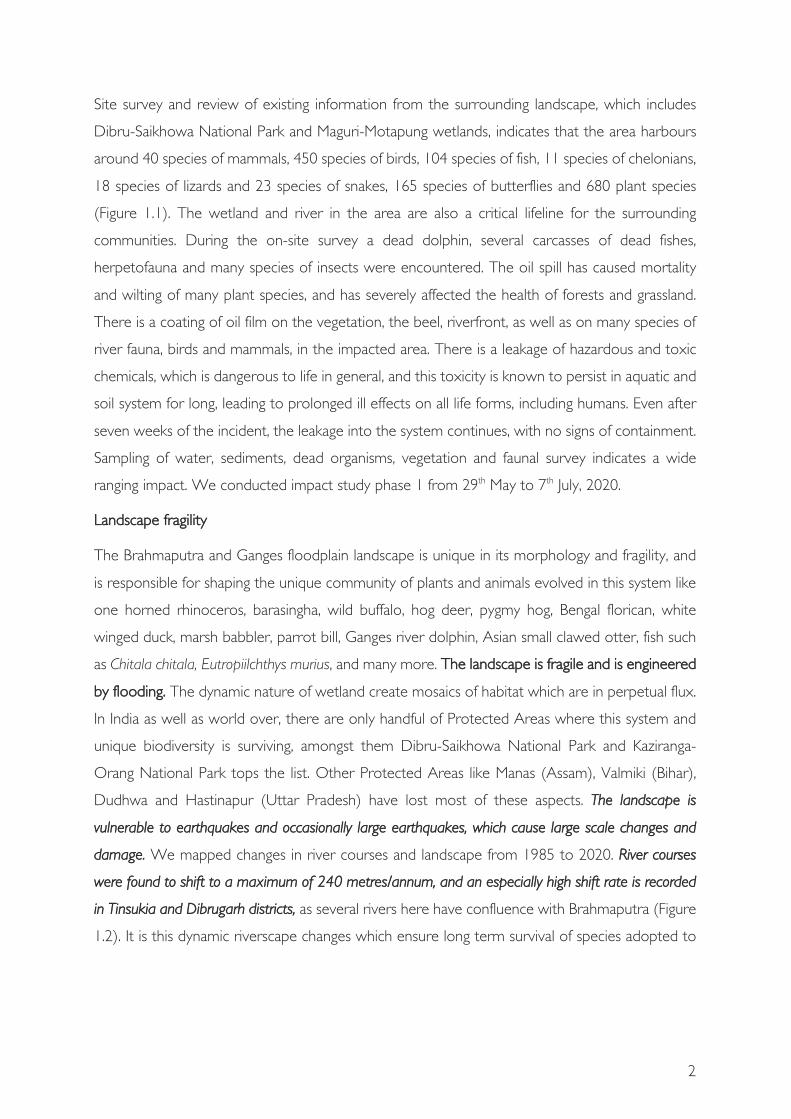
Site survey and review of existing information from the surrounding landscape, which includes
Dibru-Saikhowa National Park and Maguri-Motapung wetlands, indicates that the area harbours
around 40 species of mammals, 450 species of birds, 104 species of fish, 11 species of chelonians,
18 species of lizards and 23 species of snakes, 165 species of butterflies and 680 plant species
(Figure 1.1). The wetland and river in the area are also a critical lifeline for the surrounding
communities. During the on-site survey a dead dolphin, several carcasses of dead fishes,
herpetofauna and many species of insects were encountered. The oil spill has caused mortality
and wilting of many plant species, and has severely affected the health of forests and grassland.
There is a coating of oil film on the vegetation, the beel, riverfront, as well as on many species of
river fauna, birds and mammals, in the impacted area. There is a leakage of hazardous and toxic
chemicals, which is dangerous to life in general, and this toxicity is known to persist in aquatic and
soil system for long, leading to prolonged ill effects on all life forms, including humans. Even after
seven weeks of the incident, the leakage into the system continues, with no signs of containment.
Sampling of water, sediments, dead organisms, vegetation and faunal survey indicates a wide
ranging impact. We conducted impact study phase 1 from 29th May to 7th July, 2020.
LLandscape fragility
The Brahmaputra and Ganges floodplain landscape is unique in its morphology and fragility, and
is responsible for shaping the unique community of plants and animals evolved in this system like
one horned rhinoceros, barasingha, wild buffalo, hog deer, pygmy hog, Bengal florican, white
winged duck, marsh babbler, parrot bill, Ganges river dolphin, Asian small clawed otter, fish such
as Chitala chitala, Eutropiilchthys murius, and many more. The landscape is fragile and is engineered
by flooding. The dynamic nature of wetland create mosaics of habitat which are in perpetual flux.
In India as well as world over, there are only handful of Protected Areas where this system and
unique biodiversity is surviving, amongst them Dibru-Saikhowa National Park and Kaziranga-
Orang National Park tops the list. Other Protected Areas like Manas (Assam), Valmiki (Bihar),
Dudhwa and Hastinapur (Uttar Pradesh) have lost most of these aspects. The landscape is
vulnerable to earthquakes and occasionally large earthquakes, which cause large scale changes and
damage. We mapped changes in river courses and landscape from 1985 to 2020. River courses
were found to shift to a maximum of 240 metres/annum, and an especially high shift rate is recorded
in Tinsukia and Dibrugarh districts, as several rivers here have confluence with Brahmaputra (Figure
1.2). It is this dynamic riverscape changes which ensure long term survival of species adopted to
3
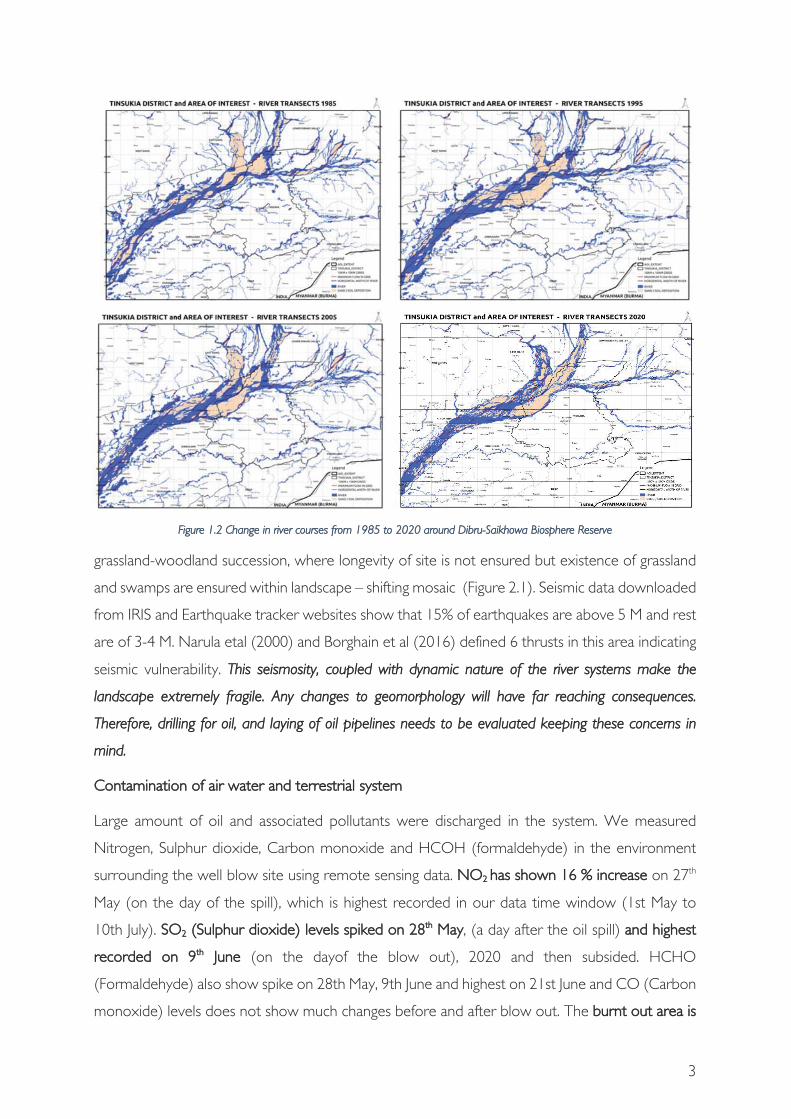
grassland-woodland succession, where longevity of site is not ensured but existence of grassland
and swamps are ensured within landscape – shifting mosaic (Figure 2.1). Seismic data downloaded
from IRIS and Earthquake tracker websites show that 15% of earthquakes are above 5 M and rest
are of 3-4 M. Narula etal (2000) and Borghain et al (2016) defined 6 thrusts in this area indicating
seismic vulnerability. This seismosity, coupled with dynamic nature of the river systems make the
landscape extremely fragile. Any changes to geomorphology will have far reaching consequences.
Therefore, drilling for oil, and laying of oil pipelines needs to be evaluated keeping these concerns in
mind.
Contamination of air water and terrestrial system
Large amount of oil and associated pollutants were discharged in the system. We measured
Nitrogen, Sulphur dioxide, Carbon monoxide and HCOH (formaldehyde) in the environment
surrounding the well blow site using remote sensing data. NO2 has shown 16 % increase on 27th
May (on the day of the spill), which is highest recorded in our data time window (1st May to
10th July). SO2 (Sulphur dioxide) levels spiked on 28th May, (a day after the oil spill) and highest
recorded on 9th June (on the dayof the blow out), 2020 and then subsided. HCHO
(Formaldehyde) also show spike on 28th May, 9th June and highest on 21st June and CO (Carbon
monoxide) levels does not show much changes before and after blow out. The burnt out area is
FFigure 1.2 Change in river courses from 1985 to 2020 around Dibru-Saikhowa Biosphere Reserve

4
mmapped as 65-70 ha which includes crop fields, grasslands and swamps. There was visible oil spill
(oil and sediment) on 16th June, 2020 down stream of well.
Water and sediment pollution
The quality of water was assesed by measuring the essential physiological parameters such as pH,
Dissolved Oxygen (DO), Total Dissolved Solids (TDS), Conductivity, Specific Conductance
Temperature and PAHs pollutants. The dissolved oxygen value for Brahmaputra is reported to
be 7.23 mg/l and maximum being 10.92 mg/l. We sampled when levels of DO were at their peak,
and the levels of DO ranged from 0.94 mg/l to 7.35 mg/l in all samples, which is lower than
minimum recorded value of Brahmaputra and barely above CPCB class A limits. DO level
declined from the day of blowout, till our last sampling session on 22nd June 2020. Maguri-
Motapung beel is worst affected and large scale death of aquatic fauna was observed. The
concentration of PAHs (16 types analysed) in water of Lohit, Dibru and Maguri-Motapung ranged
from 0.21 to 691.31 μg/L. The concentration was highest in Maguri-Motapung, followed by Dibru
and Lohit rivers. The carcinogenic PAHs ( CPAH, sum of BaA, BbF, BkF, BaP, InP, and DbA) were
also detected. It was found that PAH concentrations in the present study were significantly
higher than other studies in India (ranging from 6.0 – 143.2 μg/L (Malik et al, 2008, Chakraborty
et al, 2014) and other part of the world (0.02 to 1.27 μg/L ) (Brindha and Elango, 2013). The
PAHs in soil and sediment samples ranged from 37.6 to 395.8 μg/Kg in comparison to other
accidents in the world (96 to 2674 μg/Kg) (Yancheshmeh et al, 2014, Zeng et al, 2016).
In fish tissue samples the PAHs detected range between 104.3 to 7829.6 μg/Kg. The highest
concentration was observed in fishes collected from Maguri-Motapung wetland. Among the
detected PAHs in fish samples, Acenaphthene, Fluorene and Phenanthrene constituted the 95%
of the total detected concentration. The total PAHs concentration reported in fish samples
appears to be 10 - 100 fold higher than the earlier reported concentration in India (Dhananjayan
and Muralidharan, 2012) and other parts of the world ranging from 0.53 – 1064 μg/Kg (Zabik
et al, 1996; Akpambang et al, 2009 Levengood et al, 2011; Huang et al, 2014). The impact is
significant and will have long term effect, as many of these pollutants will leach into the ground
and contaminate ground water. Long term restorative efforts are needed for cleaning up these
pollutants.
From the results of the study it can be concluded that Maguri-Motapung beel was severely
damaged and polluted with respect to level of Dissolved Oxygen (DO), and total petroleum
hydrocarbons. Also, we should worry about the long-term impacts of the oil spill in such a
5
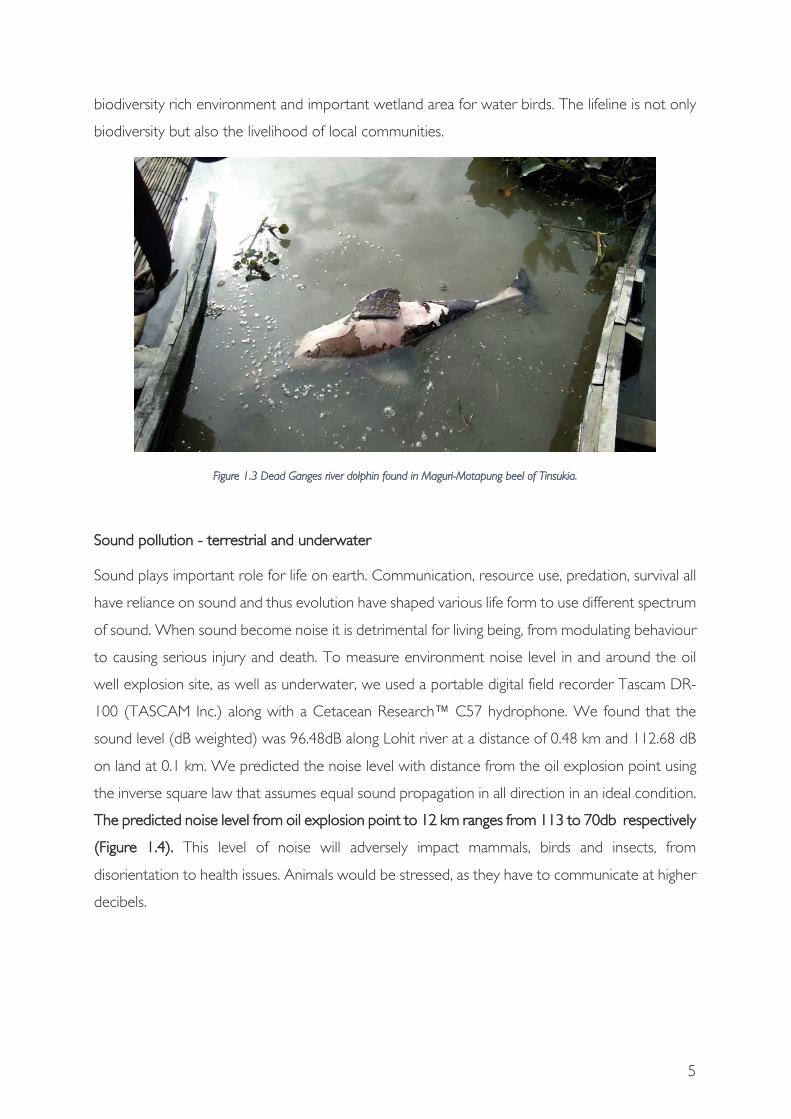
biodiversity rich environment and important wetland area for water birds. The lifeline is not only
biodiversity but also the livelihood of local communities.
FFigure 1.3 Dead Ganges river dolphin found in Maguri-Motapung beel of Tinsukia.
Sound pollution - terrestrial and underwater
Sound plays important role for life on earth. Communication, resource use, predation, survival all
have reliance on sound and thus evolution have shaped various life form to use different spectrum
of sound. When sound become noise it is detrimental for living being, from modulating behaviour
to causing serious injury and death. To measure environment noise level in and around the oil
well explosion site, as well as underwater, we used a portable digital field recorder Tascam DR-
100 (TASCAM Inc.) along with a Cetacean Research™ C57 hydrophone. We found that the
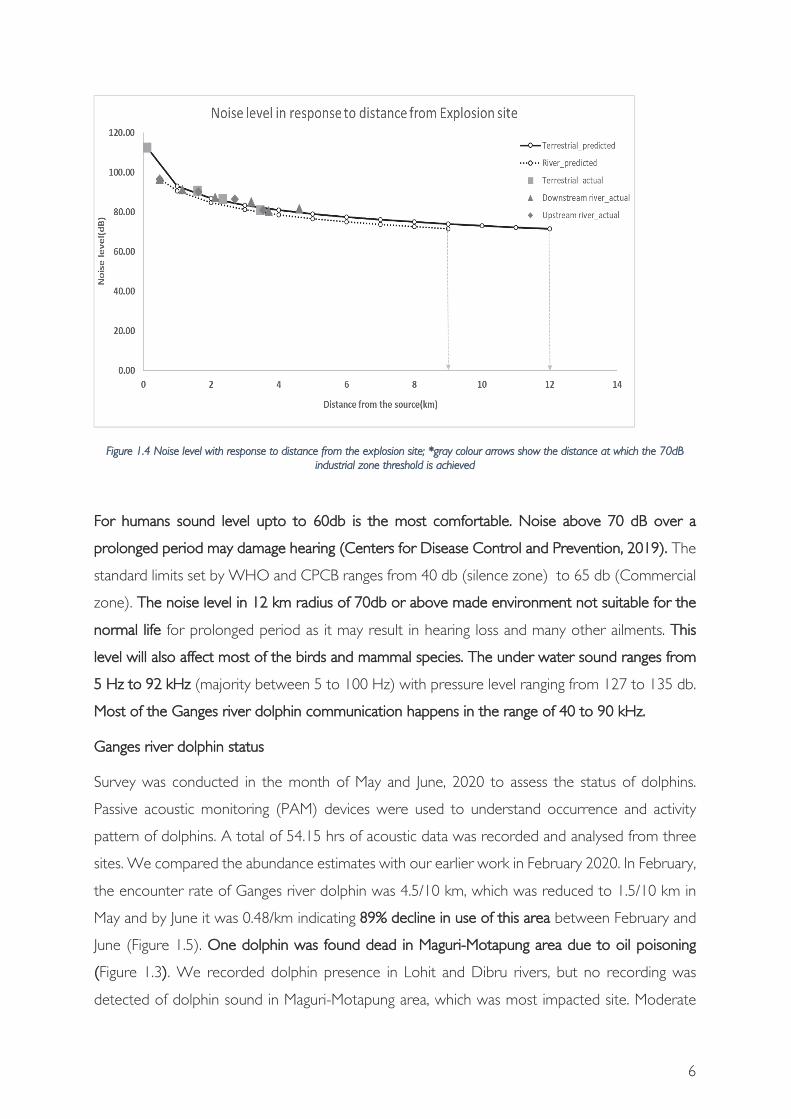
sound level (dB weighted) was 96.48dB along Lohit river at a distance of 0.48 km and 112.68 dB
on land at 0.1 km. We predicted the noise level with distance from the oil explosion point using
the inverse square law that assumes equal sound propagation in all direction in an ideal condition.
The predicted noise level from oil explosion point to 12 km ranges from 113 to 70db respectively
(Figure 1.4). This level of noise will adversely impact mammals, birds and insects, from
disorientation to health issues. Animals would be stressed, as they have to communicate at higher
decibels.
6
FFigure 1.4 Noise level with response to distance from the explosion site; *gray colour arrows show the distance at which the 70dB industrial zone threshold is achieved
For humans sound level upto to 60db is the most comfortable. Noise above 70 dB over a
prolonged period may damage hearing (Centers for Disease Control and Prevention, 2019). The
standard limits set by WHO and CPCB ranges from 40 db (silence zone) to 65 db (Commercial
zone). The noise level in 12 km radius of 70db or above made environment not suitable for the
normal life for prolonged period as it may result in hearing loss and many other ailments. This
level will also affect most of the birds and mammal species. The under water sound ranges from
5 Hz to 92 kHz (majority between 5 to 100 Hz) with pressure level ranging from 127 to 135 db.
Most of the Ganges river dolphin communication happens in the range of 40 to 90 kHz.
Ganges river dolphin status
Survey was conducted in the month of May and June, 2020 to assess the status of dolphins.
Passive acoustic monitoring (PAM) devices were used to understand occurrence and activity
pattern of dolphins. A total of 54.15 hrs of acoustic data was recorded and analysed from three
sites. We compared the abundance estimates with our earlier work in February 2020. In February,
the encounter rate of Ganges river dolphin was 4.5/10 km, which was reduced to 1.5/10 km in
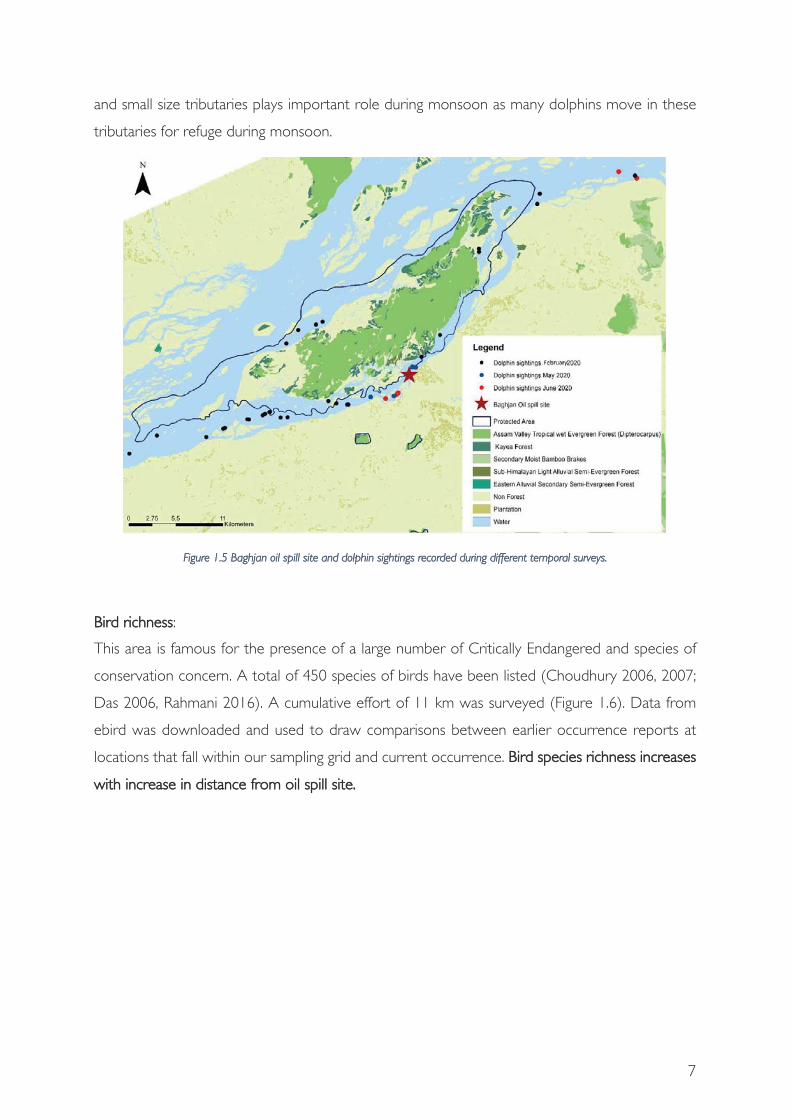
May and by June it was 0.48/km indicating 89% decline in use of this area between February and
June (Figure 1.5). One dolphin was found dead in Maguri-Motapung area due to oil poisoning
(Figure 1.3). We recorded dolphin presence in Lohit and Dibru rivers, but no recording was
detected of dolphin sound in Maguri-Motapung area, which was most impacted site. Moderate
7
and small size tributaries plays important role during monsoon as many dolphins move in these
tributaries for refuge during monsoon.
FFigure 1.5 Baghjan oil spill site and dolphin sightings recorded during different temporal surveys.
Bird richness:
This area is famous for the presence of a large number of Critically Endangered and species of
conservation concern. A total of 450 species of birds have been listed (Choudhury 2006, 2007;
Das 2006, Rahmani 2016). A cumulative effort of 11 km was surveyed (Figure 1.6). Data from
ebird was downloaded and used to draw comparisons between earlier occurrence reports at
locations that fall within our sampling grid and current occurrence. Bird species richness increases
with increase in distance from oil spill site.
8
FFigure 1.6 Sampling zones for impact on biodiversity up to 5 km, centered on oil blowout site
Figure 1.7 Comparison of resident species encountered in the explosion site before (from 2010-2019 from e-bird) and after well blow out (during this survey).
The bird data was compared with resident birds reported by birders on eBird (69 species in
grassland and 190 species in wetland) with our surveys (28 in grassland and 28 in wetland) at the
same surveyed sites. The decline in richness is evident in grassland (59%) and wetland (85%)
(Figure 1.7). Survey team also recorded few abandoned nests at impact site. Its likely that birds
are also sprayed with oil spill as oil has been seen covering the vegetation in more than a 2 km
radius. Both oil spill as well as intense sound seems to be responsible for reduction in bird species
richness and abundance.The effects of oil spill on birds are well known from many oil spills around
the world from past. The overall effect of oil pollution on aquatic bird populations must be
examined from two points of view: (1) the disastrous effects of oil spills and (2) the sub-lethal
9
and indirect effects of chronic exposure to low levels of hydrocarbons in the environment (Szaro,
1976).
FFish richness
This area is reported to have 104 species of fishes (Kalita, 2016). A total of 8 sites were sampled
with gill net and cast net. 25 species of fishes belonging to 9 families was recorded. Cyprinidae
family was found to be the most dominant family with 13 species. The overall richness and
abundance of fishes declines with decrease in dissolved oxygen at different sites, which inturn was
a result of the oil spill. There is significant difference between low and high DO level with species
richness and abundance of fishes.
Richness declines by 71 % and abundance by 81% between poor and good DO sites (Figure
1.8). DO levels are low in areas of oil contamination. We have seen fishes having visible symptoms
on body due to oil toxicity, like loss of scales, decolouration, bleeding and excess mucous
secretion. Large number of species have shown signs of oil impact (Figure 1.9 & Figure 1.10)
Cirrhinus reba, Banagana dero, Labeo bata, Labeo calbasu, Sperata aor, Sperata seengala, Channa
marulius, Channa punctatus, and Eutropiichthys vacha has high economic value in market and fishes
like Puntius sophore, Puntius chola, Pethia gelius, Salmophasia bacaila, Baralius barna, Mystus vittatus,
Xenetodon cancila, Anabus testudineus, and Parambassis ranga are ornamentally important fishes.
The abundance of these species was found to be significantly less in Dibru river and Maguri-
Motapung beel, likely due to the mortality and avoidance of high toxic areas due to oil spill.
Figure 1.8 Fish species richness and abundance in two categories of water quality pertaining to Dissolve Oxygen (DO) level between 2-4 mg/l and above
10
During our survey, maximum mortality of adult fishes had occurred in stagnant pools, as there is
slow exchange of water and most of the fishes prefer stagnant pools during breeding period.
FFigure 1.10 Percentage of individual infected fishes captured from Maguri-Motapung beel and Dibru river.
Figure 1.9 Pictures of normal and affected fishes: 1a)Spereta seengahala, 2a)Petha gelius, 3a) Osteobarma cotio shows effect of toxicity on body of fish which were collected from Maguri Motapung beel and Dibru river, Image 1b) Spereta seengahala, 2b)Petha gelius, 3b)Osteobarma cotio are normal fishes which were captured during survey carried out in
Kaziranga National Park in February 2020.

11
BButterflies and odonates richness
A total of 96 individuals belonging to 41 species of butterflies and 34 individuals of 13 species of
odonates were sighted. Close to accident sites less insect species were found. The species
richness at sites close to well saturated much faster, while site at 5 km has not saturated with
current sampling (Figure 1.11)
Species richness and abundance of butterflies increases with distance from well blow out site
indicating impact of oil spill.
Figure 1.11 Species and number of butterflies encountered at varying distances from the explosion site at 5 minute intervals
Direct exposure to oil is known to negatively affect insects by altering different functions such as
feeding and oviposition behaviour, gas exchange, cuticle permeability and cell membrane
structural and functional destruction (Beattie et al.1995; Mensah et al. 1995; Bogran et al. 2006).
Herpetofauna
This area is reported to have 17 amphibians, 13, turtle, 11 snakes and 8 lizard species. The survey
was restricted to day time as flooding and lockdown of site after fire created sampling issues and
thus it should be considered as partial. Work is underway and will be completed depending upon
flooding scenario in this area. The checklist of Ahmed and Das (2020) provides what will be
expected in this area.
Nine species of reptiles were recorded by us. The lack of any encounters of tadpoles in the
multiple water pools that were encountered in the grids, despite being breeding season for many
species, is a great concern. There was a direct impacts of explosion burn down at least in 500
m, and impacts of oil spill seems to be the likely cause for reduced encounter of species. We

12
have found live herpetofauna from 500 m up to 6 km from the oil well explosion site and
carcasses at 400 m and 6 km.
PPeople
We have not carried out any work on socio-economics and health impacts on humans. The oil
well blow out definitely seems to have impacted the physical and economic health of local
communities (Rishu Kalantri 2020, thelogicalindian.com). The contaminants will have long term
impact and need appropriate mitigation measures.
Issues with operation of Gas and oil wells
There are two major issues with companies operating oil and gas wells in Assam, a) Management
of oil spills from their wells, and b) emergency response readiness and effectiveness in terms of
major accidents. The oil leakage is a chronic problem and leaching of oil in water and underground
have ecological and health cost, as has been observed in the case of several wells across Eastern
Assam. As far as major accidents like well blowout in Assam is concerned, the entire focus seems
to be on closure of well and no restorative process is put in place for remediation of effect of oil
in terrestrial or aquatic system, it is left to nature to heal herself.
Two oil well blow outs earlier occurred in Assam, Dikom and Naharkatia-Deohal, and we seemed
to have not learned any lessons. We are unable to obtain any meaningful information about
restoration of areas surrounding earlier well blow outs. This seems to be the same in the case of
the blowout at Baghjan, with no effort to engage experts for remediation due to oil spill. The site
inspection by NBWL Standing committee report stated “We are deeply distressed that OIL, as a
leading public sector company, instead of serving as a beacon for environmental compliance to others
in the industry, appears to have evaded environmental norms” (Madhusudhan & Bindra, 2013). The
report also highlighted development of mitigation plan in case of incidences such as the one that
has just happened. OIL does not have any information on their website nor have they provided
information about their emergency plans as to how to deal with leaks and blowouts and
restoration plans in case of oil spill despite our request for this information.
Conclusion
The evaluation of landscape and biodiversity indicate large-scale impact of oil spill on flora and
fauna. Our evaluations and results point out to a substantially high level of PAHs pollutants, some
of which are carcinogenic, being present in the system. We also recorded excessive noise level,
which is detrimental to animal and human health. While the impact of sound may be taken care
after plugging, the effect of PAHs will remain in the system for a long time. Decline in Ganges

13
dolphin use of this area, as well as one dolphin mortality, death of fishes, insects, herpetofauna,
birds and impact on health of most of the animals observed, are related to oil spill and well
blowout. There is a substantial decline in the biodiversity of the area, resulting in an unsuitable
habitat for aquatic and terrestrial life, which is clearly visibile in the mortalities observed. Humans
in this area are also impacted. To counter the decline observed in mammals, birds, insects and
herpetofauna, it will take time and substantial restorative efforts to regain former diversity levels.
Vegetation in large area is also observed to be sprayed with oil due to blow out and has impacted
the landscape in its entirety. Given the fragility and seismicity of the landscape, the impact of the
oil blow out, and importance along with the uniqueness of biodiversity existing in the area,
following needs to be done for safeguarding this landscape:
1) The potential of oil blow out and oil spill like disaster like this a reality and therefore such oil
wells in the vicinity of Dibru-Saikhowa National park and IBA complex ( Maguri and Motapung,
Poba Reserve Forest, Kobo chapori, Amarpur chapori and) will be detrimental to the
conservation value of this unique ecosystem. Due consideration needs to be given to this
threat for future development.
2) More than 25 wells (Dibru-Saikhowa ESZ notification) are planned and almost same number
exist in this conservation complex/s (Dibru-Saikhowa National Park, Bherjan Wildlife
Sanctuary, Padumani Wildlife Sanctuary and Borajan Wildlife Sanctuary, Important Bird Areas
(IBA) Poba Reserve Forest, Kobo chapori, Amarpur chapori and Maguri and Motapung,
Dihing-Patkai Wildlife Sanctuary) needs to be re-evaluated for their cumulative impact on
biodiversity value of this landscape.
3) Safety audit for all other wells currently operating or planned need to be done. Risk
management study need to be done to ensure appropriate risk mitigation strategies Detail
management plan needs to be developed for safety measures and dealing with oil leakage.
4) Observing the ecological disaster caused by this incident, the proposed oil exploration and
development in Mechaki, Mechaki extension, Baghjan and Tinsukia Extension PML (MoEFCC
EC dated 9th April, 2020) needs to be reaassesed, since this is the habitat of Critically
Endangered species of this region.
5) OIL should have dedicated team and advanced training of their personnel to deal with
emergencies arising out of leakage, blow out and any other accidents which is possible due
to extraction, transportation and storage of highly volatile and risky chemicals.

14
6) Adequate finances should be for all restorative work in Wildlife areas Protected or otherwise
and compensate local people for their losses. There should be annual payment to Forest
Department for restoration and subsequently for management of this conservation complex.
Adequate consultation by Forest Department should be done to involve experts in the field
of Oil spill remediation and restoration.
7) A long term study should be initiated to understand the long-term impact of this oil spill and
blowout impact on the ecology and environment of Maguri-Motapung beel and Dibru-
Saikhowa National Park as well as on the health and socio-economic conditions of local
communities around the affected areas. Impact of the oil spill on the livelihood of local
communities especially on ecotourism based on Maguri-Motapung beel and Dibru-Saikhowa
National Park needs to be assessed.
8) Restoration will be long-term process and appropriate committee should be formed to
develop, monitor and guide the process.
15
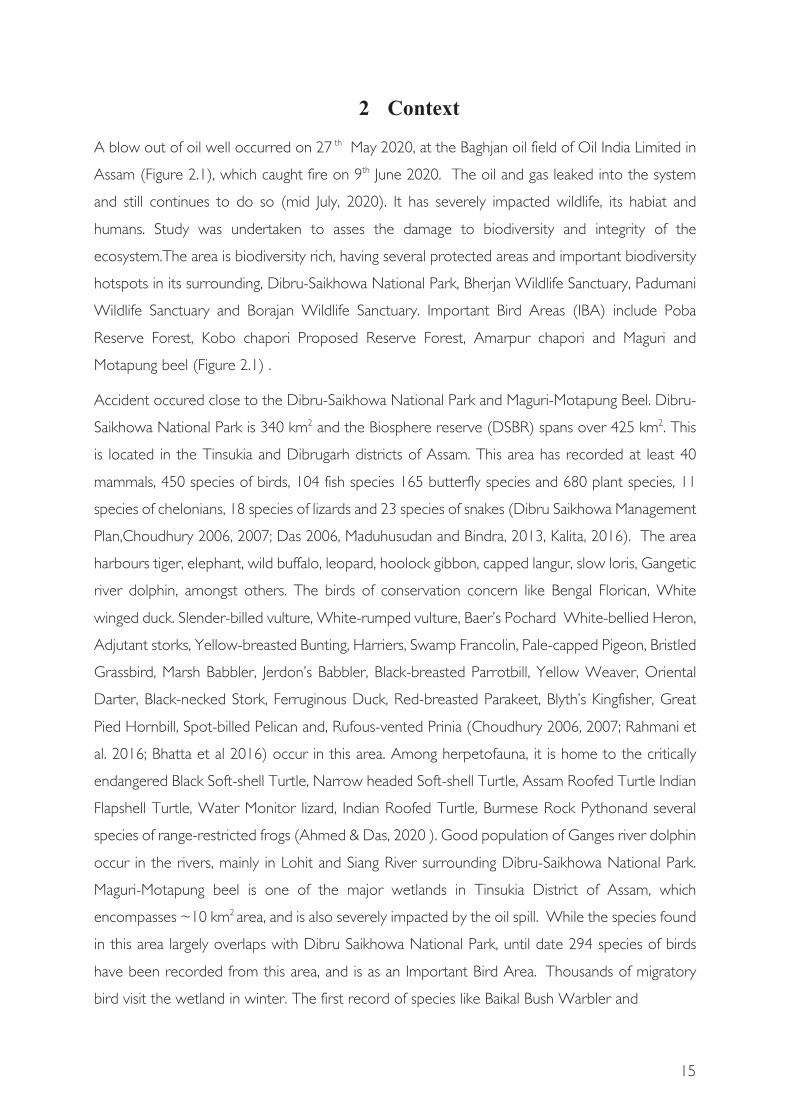
A blow out of oil well occurred on 27 th May 2020, at the Baghjan oil field of Oil India Limited in
Assam (Figure 2.1), which caught fire on 9th June 2020. The oil and gas leaked into the system
and still continues to do so (mid July, 2020). It has severely impacted wildlife, its habiat and
humans. Study was undertaken to asses the damage to biodiversity and integrity of the
ecosystem.The area is biodiversity rich, having several protected areas and important biodiversity
hotspots in its surrounding, Dibru-Saikhowa National Park, Bherjan Wildlife Sanctuary, Padumani
Wildlife Sanctuary and Borajan Wildlife Sanctuary. Important Bird Areas (IBA) include Poba
Reserve Forest, Kobo chapori Proposed Reserve Forest, Amarpur chapori and Maguri and
Motapung beel (Figure 2.1) .
Accident occured close to the Dibru-Saikhowa National Park and Maguri-Motapung Beel. Dibru-
Saikhowa National Park is 340 km2 and the Biosphere reserve (DSBR) spans over 425 km2. This
is located in the Tinsukia and Dibrugarh districts of Assam. This area has recorded at least 40
mammals, 450 species of birds, 104 fish species 165 butterfly species and 680 plant species, 11
species of chelonians, 18 species of lizards and 23 species of snakes (Dibru Saikhowa Management
Plan,Choudhury 2006, 2007; Das 2006, Maduhusudan and Bindra, 2013, Kalita, 2016). The area
harbours tiger, elephant, wild buffalo, leopard, hoolock gibbon, capped langur, slow loris, Gangetic
river dolphin, amongst others. The birds of conservation concern like Bengal Florican, White
winged duck. Slender-billed vulture, White-rumped vulture, Baer’s Pochard White-bellied Heron,
Adjutant storks, Yellow-breasted Bunting, Harriers, Swamp Francolin, Pale-capped Pigeon, Bristled
Grassbird, Marsh Babbler, Jerdon’s Babbler, Black-breasted Parrotbill, Yellow Weaver, Oriental
Darter, Black-necked Stork, Ferruginous Duck, Red-breasted Parakeet, Blyth’s Kingfisher, Great
Pied Hornbill, Spot-billed Pelican and, Rufous-vented Prinia (Choudhury 2006, 2007; Rahmani et
al. 2016; Bhatta et al 2016) occur in this area. Among herpetofauna, it is home to the critically
endangered Black Soft-shell Turtle, Narrow headed Soft-shell Turtle, Assam Roofed Turtle Indian
Flapshell Turtle, Water Monitor lizard, Indian Roofed Turtle, Burmese Rock Pythonand several
species of range-restricted frogs (Ahmed & Das, 2020 ). Good population of Ganges river dolphin
occur in the rivers, mainly in Lohit and Siang River surrounding Dibru-Saikhowa National Park.
Maguri-Motapung beel is one of the major wetlands in Tinsukia District of Assam, which
encompasses ~10 km2 area, and is also severely impacted by the oil spill. While the species found
in this area largely overlaps with Dibru Saikhowa National Park, until date 294 species of birds
have been recorded from this area, and is as an Important Bird Area. Thousands of migratory
bird visit the wetland in winter. The first record of species like Baikal Bush Warbler and

16
Figu
re 2
.1 L
ands
cape
of T
insu
kia
and
Dib
ruga
rh d
istric
ts. P
rote
cted
are
as in
the
vicin
ity a
re h
ighl
ight
ed
17
White-browed Crane are also from this area, highlighting the need to conserve IBA (D Gogoi,
pers.comm & eBird ). A similar incident occurred at the OIL well in Dikom in 2005, which took
almost a month to contain and that too with the help of international agency Boots & Coots Well
Control Inc (Naqvi, 2020). TThe site inspection by NBWL Standing committee report stated “We
are deeply distressed that OIL, as a leading public sector company, instead of serving as a beacon for
environmental compliance to others in the industry, appears to have evaded environmental norms”
(Madhusudhan & Bindra, 2013). The report also highlighted development of mitigation plan in
case of incidences such as the one that has just happened. There seems to be no clear information
on the mitigation plan as suggested by the site inspection report. DFO-Tinsukia, Wildlife Division,
has written to OIL seeking clarification on mitigation plan (DFO–Tinsukia Wildlife Division, pers
comm). It is important to note that the present spill has not stopped and is still polluting and
contaminating the surrounding areas. A similar incident in the Kalamazoo river, USA took several
years and millions of dollars to contain.
The current oil spill occurred in an area that is bordered by protected areas, rivers and important
wetlands and Important Bird Area, which are the lifeline of not only biodiversity but also the
livelihood of local communities. Having occurred in the monsoon season, the extent of impact
due to the spread of toxic hazardous gases and chemicals through air and water has spread far
more than the usual area of impact, causing large-scale damage. People in the area have reported
severe breathing difficulty, headaches and nausea.Noise pollution was big irritant causing severae
unease and health issues. Even our survey team has suffered from the same symptoms, and
experienced heavy presence of oil and chemicals in the environment and intolerable noise. The
sound can be heard even about 10-12 km away from the place of accident. The smell of oil
permeates the entire landscape, with plants covered with layers of oil due to continuous leakage
till now. There is seepage of oil to the nearby wetland and other water bodies adjacent to Baghjan
(D Gogoi, pers comm.).
Oil well blow out spews a wide range of chemicals in air, water and ground, contaminating the
impact zone and surroundings. The hydrocarbon component comprises of large number of
organic compounds, many of which are hazardous when released into the environment, for e.g.
Polycyclic aromatic hydrocarbons (PAHs) amongst others. The distressing aspect of these
compounds is their property of persistence and toxicity (Liu et al. 2020). These carcinogenic
compounds get widely distributed in water, soil, sediment and air, and as they do not get
photochemically and biologically oxidised or decomposed, their accumulation in these systems is
very high (Zhao et al. 2017; Gundlach 2017; Guzzella and De Paolis 1994). Some of the effects

18
of this type of contamination has been reported to be hypothermia, skin and eye irritation,
indigestion, dehydration, impaired reproduction and/or pneumonia in many taxa (Environmental
Protection Authority, 1993). These toxic chemicals persist in the environment in particulate
matter and sediments, and when environmental condition changes, they are again released into
water, leading to secondary pollution and long term toxicity in these areas, which is a worrying
scenario for all life forms, including humans.
Adding to the concerns is the high seismic nature of this area, where the oil wells are operating.
The whole region has been subjected to frequent changes in morphology owing to recurrent
earthquakes. These earthquakes are known to have caused extensive landslides and ground
fissuring, amongst other effects to morphology. The region is known to have experienced several
high magnitude earthquakes within a short period. Thrusts, faults and folds are a common
characteristic of the region, exacerbating the concerns of oil drilling in the region, where sediments
and rocks of the region have been experiencing compressive forces (Borgohain et al. 2016).
19
The Brahmaputra and Ganges floodplain landscape is unique and this uniqueness has shaped the
biotic community that have evolved in adaptation to this landscape, like the one horned rhinoceros,
barasingha, wild buffalo, hog deer, pygmy hog, Bengal florican, white winged , marsh babbler, parrot
bill, Ganges dolphin, Asian small clawed otter, fish such as Chitala chitala, Eutropiilchthys murius, and
many others. This landscape is particularly fragile and is engineered by flooding. The dynamic nature
of wetland creates mosaics of habitat which are in perpetual flux. In India as well as world over, there
are only handful of Protected Areas where this system and unique biodiversity is surviving, amongst
them Dibru-Saikhowa and Kaziranga-Orang tops the list. Other Protected Areas like Manas (Assam),
Valmiki (Bihar), Dudhwa and Hastinapur (Uttar Pradesh) have lost most of these aspects. This
landscape is also vulnerable to earthquakes, with many fault lines and occasionally large earthquakes,
causing changes and large scale damage. We mapped changes in river courses and landscape from
1985 to 2020. River courses are known to shift to a maximum 0f 240 m/annum, and an especially
high shift rate is recorded in Tinsukia and Dibrugarh districts, as several rivers have confluence with
Brahmaputra here. This high rate of change causes a shifting mosaic of grassland and swamps, where
the habitat at a particular site is not ensured, but due to constant change, the habitat exists within the
landscape. It is this dynamic riverscape changes which ensure long term survival of species adapted to
grassland-woodland succession. Seismic data downloaded from IRIS and Earthquake tracker websites
show that 15% of earthquakes are above 5 M and rest are of 3-4 M. Narula etal (2000) and
Borgohain et al (2016) defined 6 thrusts in this area, indicating seismic vulnerability. This seismosity,
coupled with dynamic nature of the river systems make the landscape extremely fragile, and any
changes to geomorphology having far reaching consequences. Therefore, drilling for oil, and laying of oil
pipelines needs to be evaluated keeping these concerns in mind.
Fragility and resilience of a landscape are interconnected and it is difficult to completely tease
them apart. In this particular context, fragility is more relevant as it proves to be an important
critera on which we need to evaluate the changes in landscape, either natural or manmade.
Fragility of a landscape defines the outcome of any action for all the elements within it i.e., wildlife
and humans, their interaction and subsequent effects. This section addresses the larger
20
conservation context, and how incidents like oil blowout and large scale developmental planning
without regard to ecology make a system fragile and robs it from the inherent capability of
resilience, leading to disastrous consequences.
Understanding the landscape fragility is especially crucial in the plains of Assam, as it is prone to
earthquakes, and the rivers flowing through this landscape are extremely dynamic, carrying heavy
sediment loads, making this landscape even more delicate. The Assam valley is a result of several
tonnes of deposition of sediment brought in by the rivers Brahmaputra and Barak (Baro and
Kumar, 2017). According to Angelier and Baruah (2009), the thickness of the sediment reaches
5 km from the ground surface. Below this heavy deposit of sediments lie several active tectonic
faults which have been the source faults of past earthquakes (Baro and Kumar, 2017). These
features make the Assam plain rivers vulnerable to change. Avulsion is a common geomorphic
process responsible for course changes with many rivers of the Ganga–Brahmaputra plain
(Borgohain et al 2016). Dibrugarh has 21.34% of forest cover and Tinsukia about 41.76 % cover
(Forest Survey of India, 2019 )(Figure 2.1). These districts have a mosaic of habitat comprising of
Salix Swamp Forest, Wet and Dry grasslands, Tropical Moist Deciduous, Tropical Semi-evergreen,
Evergreen Forests and Cropfilds-Orchards (Rahmani et al. 2016).
Geomorphology helps in understanding the relationship between river forms and processes,
water and sediment fluxes, ecosystem and habitat relationships. Owing to the dynamic nature of
rivers in the region, the changes in the tributaries of Brahmaputra, as well as main stream
Brahmaputra river, in and around Dibru Saikhowa National Park, at the site of oil spill was
estimated using time series land cover data. This helps in visualizing the changes in river
morphology. These quantifiable changes in river are used to derive braiding index to locate zones
which are prone to further change. Also channel displacement rate is calculated in these zones.
This data along with land cover changes is used to understand the changes in river morphology.
For detailed methodology, see Section 9.1& 9.3.
River course has undergone lot of changes around Dibru-Saikhowa national park. Sand bars have
shown considerable changes in this part of the river and so the braiding index also is seen changing
from 1985 to 2019-20. This continuous change in braiding index signifies the ever changing river
morphology. Braiding index helps correlating the geology with land cover changes to understand
the morphology of changes and the possibilities of future changes (see Section 9.3)
21
FFigu
re 3
.1 G
eom
orph
olog
y of
eas
tern
Ass
am
22
FFigu
re 3
.2: G
oogl
e Ea
rth im
ages
indi
catin
g th
e ch
ange
s in
land
scap
e ar
ound
Dib
ru-S
aikh
owa
Bios
pher
e Re
serv
e: a
) 19
84, b
)199
3, c
)200
4, d
)201
4
(a)
(b)
(c)
(d)
23
FFigu
re 3
.3 C
hang
e in
rive
r cou
rses
from
198
5 to
202
0 ar
ound
Dib
ru-S
aikh
owa
Bios
pher
e Re
serv
e

24
Figgu
re 3
.4 L
andc
over
cha
nges
aro
und
Dib
ru-S
aikh
owa
Nat
iona
l Par
k, D
ibru
garh
and
Tin
suki
a di
stric
t - d
ata
deriv
ed fr
om L
ands
at a
nd L
ISS
sate
llites
25
FFigu
re 3
.5
26
The area is composed with rocks of sedimentary origin, of these Sandstones, Shales and Unstable
sand, silt and clays are found in majority. Erosion of sedimentary rock-masses along river-flows
resulted in island-like formations, leading to changes in river-dynamics. In the area around Tinsukia
district surface water is consistently increasing from 1985. River course widened along alluvial
plains and floodplains. River braiding index is maximum along unstable clays, sand and silt
deposited along river course. Flood of 1988 caused change in the course of Lohit river, it started
flowing in Dongri river course and by 1995 completely captured it (Borgohain et al 2016)
Tinsukia and Dibrugarh districts have unique system of fluctuating grassland, scrubland and forest,
which has disappeared from most of the Brahmaputra and Ganga flood plains. This shifting mosaic
creates a unique habitat features crucial for survival of endangered fauna in the landscape like,
Wild buffalo, Bengal florican, Parrot bills, White winged duck, Swamp francolin, Prinia, Babblers
and many other species. This flooding process and change in landscape (Figure 3.2, Figure 3.4, &
Figure 3.5) means that habitat of a species within a landscape is ensured but its exact location is
not. With development happening all around Protected Areas in Tinsukia and Dibrigarh will alter
the flow pattern and affect this dynamic process which is evident in these maps (Figure 3.5). There
is a 14 percent increase in urbanization as well.
The proposed oil well operation in Dibru-Saikhowa will compromise this landscape. The
landscape is very dynamic and intervention to change the area for development will have long
term consequences on biodiversity of this area.
Seismic activity in this region is extracted from IRIS(www.iris.edu) and Earthquake tracker
(www.earthquaketrack.com) websites who operate on international data available from
monitoring stations.
27
FFigure 3.6 In Eastern Assam 586 Earthquake events were recorded from 1970 to July 8th 2020(Source: http://ds.iris.edu/ieb, extracted July 2020)
Figure 3.7 Zone of influence of some of the major earthquakes (7or above magnitude) (Source: www.earthquaketrack.com, extracted July 2020)
Assam is vulnerable to earthquakes, 586 events were recorded (Figure 3.6 & Figure 3.7) in areas
of upper Assam and surroundings. Eighty five percent earthquakes in this region were of 3-4
magnitude and rest 15% above 5 magnitude. The Northeast India region is one of the most active
zones in the world; having rifts- Himalayan arc to the north and the Indo-Burmese arc to the east of
the region (Figure 3.8).

28
FFigure 3.8 Tectonic map of the area around Dibru-Saikhowa Biosphere Reserve. Thrusts Defined by Narula et al (20000) and Borghain et al (2016) in this area are MBT (Main Boundary Thrust), MFT (Main Frontal Thrust), Mishmi Thrust, Tidding Suture, Lohit
Thrust and Naga Thrust.
Thrusts Defined by Narula et al (2000) and Borghain et al (2016) in this area are MBT (Main
Boundary Thrust), MFT (Main Frontal Thrust), Mishmi Thrust, Tidding Suture, Lohit Thrust and
Naga Thrust. All these makes this region very vulnerable. The region produced two great
earthquakes (M> 8.0) and about 20 large earthquakes (7.0>M>8.0) since 1897. The Shillong Plateau
was the source area for the 1897 great earthquake M 8.7, and the Assam Syntaxis zone for the 1950
great earthquake M 8.6. Several large earthquakes occurred along the Indo-Burma ranges (CSIR-NIST,
2015).
This seismosity, coupled with dynamic nature of the river systems make the landscape extremely fragile.
Any changes to geomorphology will have far reaching consequences. Therefore, drilling for oil, and laying
of oil pipelines needs to be evaluated keeping these concerns in mind.
29
LLarge amount of oil and associated pollutants were discharged in the system. We have assessed the
contamination using Sentinel satellite data We measured Nitrogen, Sulphur dioxide, Carbon monoxide
and HCOH (formaldehyde) in the environment surrounding the well blow site. NO2 has shown 16 %
increase on 27th May which is highest recorded in our data time window (1st May to 10th July). SO2
(Sulphur dioxide) levels spiked on 28thMay, and higest recorded on 9th June 2020. and then subsided.
HCHO (Formaldehyde) also show spike on 28th May, 9th June and highest on 21st June and CO
(Carbon monoxide) levels does not show much changes before and after blow out.The burnt out area
is mapped as 65-70 ha which includes crop fields, grasslands and swamps. SAR Sentinel1 data was
used to map the oil on river and wetlands, there was visible oil spill (oil and sediment) on 16th June
2020 down stream of well and also an increase in temperature in the water surrounding the blowout.
Oil well blowout at oil well #5 of the Baghjan Oil Fields of Oil India Limited on 27th May, 2020
has resulted in an estimated oil spill in more than 2 km radii from the oil rig, there are anecdovtal
records of much larger radius of spread (Bhattacharya, 2020). An explosion occurred on 9th June,
2020 further burnt the surrounding area completely (Bhattacharya, 2020) (Figure 4.1, Figure 4.2,
& Figure 4.3), with charring seen at least a km away from the rig. A survey conducted by the
Wildlife Institute of India close to the rig (500 m), post explosion, found carcasses of many fishes,
snakes, insects apart from a dolphin calf that was found dead in the surrounding wetland, Maguri-
Motapung beel
Figure 4.1 Satellite image before oil well blow out, the impact area is in red square.
30
For assessing the impact of oil spill on the pollution levels we have taken 10km radius from oil
spilling source near Bhagjan, Assam (Latitude:27.6003, Longitude:95.379). In this 10km radius
Figure 4.3: Satellite image after oil well blow out, the impact area is in red square
Figure 4.2 Surrounding landscape burnt from the explosion of the oil well blowout along with the resulting oil spill (Photo: Sachin Bharali).
31
change from the values of pollution levels observed in May to June 2020 are recorded. To
measure the pollution levels European Space Association’s Sentinel 5 precursor satellite is used.
In this particular case, to understand the impact of oil spill blow out Nitrogen dioxide, Carbon
monoxide(CO), Sulphur Dioxide (SO2) and HCHO (formaldehyde) product is measured. For
detailed methodology, see Section 9.4
FFigure 4.4 Nitrogen dioxide changes in Bahgjan,Assam
Figure 4.5 Sulphur Dioxide changes in Bahgjan,Assam
32
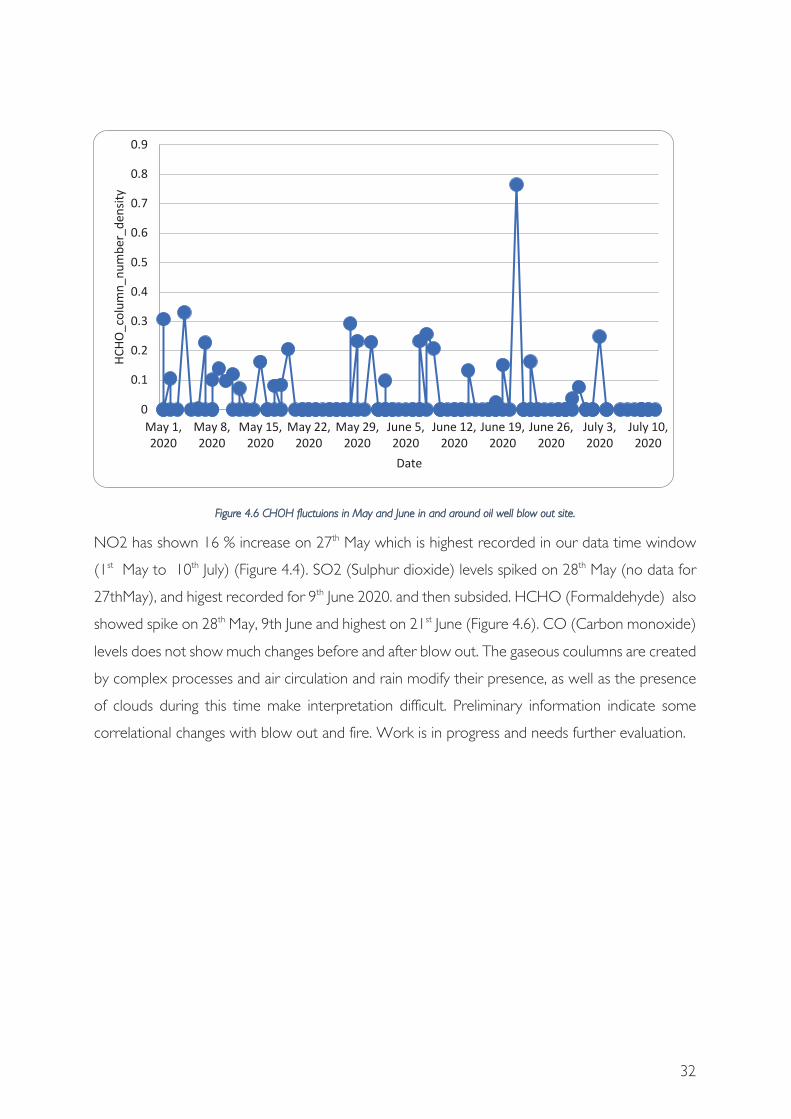
FFigure 4.6 CHOH fluctuions in May and June in and around oil well blow out site.
NO2 has shown 16 % increase on 27th May which is highest recorded in our data time window
(1st May to 10th July) (Figure 4.4). SO2 (Sulphur dioxide) levels spiked on 28th May (no data for
27thMay), and higest recorded for 9th June 2020. and then subsided. HCHO (Formaldehyde) also
showed spike on 28th May, 9th June and highest on 21st June (Figure 4.6). CO (Carbon monoxide)
levels does not show much changes before and after blow out. The gaseous coulumns are created
by complex processes and air circulation and rain modify their presence, as well as the presence
of clouds during this time make interpretation difficult. Preliminary information indicate some
correlational changes with blow out and fire. Work is in progress and needs further evaluation.

33
Figure 4.7 Temperature profile around Baghjan well blowout site.
There was a spike in surface temperature on 28th May and June 8th and 9th (Figure 4.7). Though
the temperature is lower than the levels in May, the spike might be induced by well fire.
The oil spill is hazardous for water and land pollution, impact depends upon nature of water body
and topography of the land. Oil and its complex ingredients float on surface, get mixed or settle
on bottom, even mid column water flow is reported all this depends on the density of componds.
As shown in the images, on 23rd May the islands and water in Lohit and Maguri-Motapung beel
were showing no signs of oil pollution (Figure 4.8). After the blow out on 27th May, images from
16th June (Figure 4.9) show oil on water. The upstream of the oil spill has vegetation intact the
oil deposits are largely downstream from the site.

34
FFigure 4.8: No Visible oil pollution on 23rd May at Maguri Motapung beel
Figure 4.9: 16th June satellite imagery shows oil contamination on vegetation and water – after blow out on 9th June.

35
OOil began leaking out of the well with blowout. The quality of water was assesed through measuring
the essential physiological parameters such as pH, Dissolved Oxygen (DO), Total Dissolved Solids
(TDS), Conductivity, Specific Conductance Temperature and Polycyclic Aromatic Hydrocarbons (PAHs)
pollutants. Ground sampling of 31 samples (water, soil and tissue of dead animals) from accident site
and surrounding areas was done. PAHs content in water, sediment and fish tissues was analysed by
using Gas Chromatography (GC-FID) and validated and confirmed by GC-MS/MS.
The dissolved oxygen value for Brahmaputra is normally reported to be 7.23 mg/l and maximum being
10.92. Our sampling peak time for DO was ranging from 0.94 mg/l to 7.35 mg/l in all samples, which
is lower than minimum recorded value of Brahmaputra and barely above CPCB class A limits. DO
level consistently declined from the day of blowout till our last sampling session on 22nd June, 2020.
Maguri-Motapung beel was found to be the worst affected, with large scale death of
aquatic fauna. The concentration of PAHs (16 types analysed) in water of Lohit, Dibru and Magui-
Motapung ranged from 0.21 to 691.31 μg/L. The concentration was highest in Maguri-Motapung,
followed by Dibru and Lohit rivers. The carcinogenic PAHs ( CPAH, sum of BaA, BbF, BkF, BaP,
InP, and DbA) were also detected.Iit was found that PAH concentrations in the present
study were significantly higher than other studies in India (ranging from 6.0 – 143.2
μg/L (Malik et al, 2008, Chakraborty et al, 2014) and other part of the world (0.02 to 1.27 μg/L )
(Brindha and Elango, 2013). The PAHs in soil and sediment samples ranged from 37.6 to 395.8 μg/Kg
in comparison to other accidents in the world (96 to 2674 μg/Kg) (Macias-Zamora et al, 2002,
Yancheshmeh et al, 2014, Zeng et al, 2016).
In fish tissue samples the PAHs detected range between 104.3 to 7829.6 μg/Kg. The highest
concentration was observed in fishes collected from Maguri-Motapung wetland. Among the detected
PAHs in fish samples, Acenaphthene, Fluorene and Phenanthrene constituted the 95% of the total
detected concentration. The total PAHs concentration reported in fish samples
appears to be 10 - 100 fold higher than the earlier reported concentration in
India (Dhananjayan and Muralidharan, 2012) and other parts of the world ranging from
0.53 – 1064 μg/Kg (Zabik et al, 1996; Akpambang et al, 2009 Levengood et al, 2011; Huang et al,
2014). The impact is highly significant and will have long term effect as many of
these pollutants will leach into the ground and contaminate ground water. Had

36
iit not been the flood time the impact would have been far more disastrous. Long term restorative
efforts are needed for cleaning up these pollutants.
From the results of the study it can be concluded that Motapung-Maguri beel was severely damaged
and polluted as regards to DO values, and total petroleum hydrocarbons. Also, we should worry about
the long-term impacts of the oil spill in such pristine environment and important wetland area for water
birds. This is a lifeline not only for biodiversity but also for the livelihood of local communities.
Oil began leaking out of the well on evening of blowout in river and wetlands along with the
mixture of gases and sound pollution. The leak continued uncontrolled from the well till date
(15th July 2020). Blowout and subsequent fire expose the entire locality and surroundings to range
of pollutants, chemicals, gases and sound. Petrochemicals ae complex chemical compounds and
exposure to them have both lethal and sub-lethal effects on the flora and fauna (Snyder et al,
2015; Venn-Watson et al, 2015; Paruk et al, 2014). Petroleum discharged on water spreads
quickly to cover large areas with a layer of oil varying from micro-meters to centi-meters thick.
Some oils, especially heavy crudes and refined products, sink and move below the surface or
along the bottom of the water body. Wave action and water currents mix the oil with water and
produce either an oil-in-water emulsion or a water-in-oil emulsion. Polycyclic aromatic
hydrocarbons (PAHs), which make up a substantial portion of many fossil fuels, including crude
oil, oil shales, and tar sands are considered the most toxic component of oil (Albers and Loughlin,
2003; Finch et al., 2011; Vidal et al., 2011). As a group of organic toxic compounds, PAHs have
been listed as priority pollutants by both the US Environmental Protection Agency and the
European Union. Since PAHs are resistant to degradation and can bio-accumulate though the
food chain, they may pose considerable threats to ecosystems over a long period (Wu et al,
2011). Due to their lipophilicity, persistence, and high toxicity, PAHs are difficult to be washed-
off, and particularly in aquatic environments, they tend to get adsorbed on particulate matters
and remain adsorbed for long periods. Their lipophilic nature enables them to cross biological
membranes and accumulate in organisms, causing considerable damage. PAHs are toxic,
carcinogenic, and mutagenic to all organisms, including humans (Nacci et al, 2002; Armstrong et
al, 2004). The metabolites of PAHs may bind to proteins and DNA, which causes biochemical
disruption and cell damage in animals and cancer in human (Armstrong et al, 2004). Also causing
a number of adverse effects to aquatic organisms, including endocrine alteration (Meador et al.,
37
2006), growth reduction (Christiansen et al, 1995), DNA damage (Caliani et al., 2009) and
malformations of embryos and larvae (Carls et al., 2008).
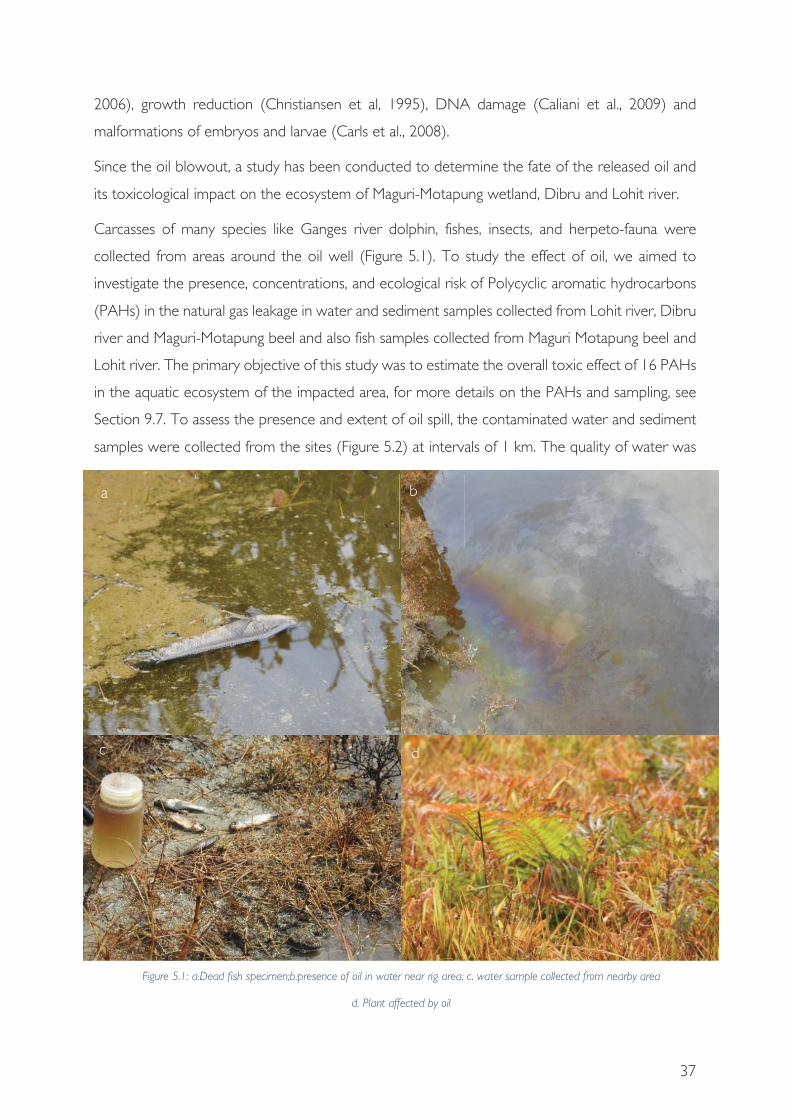
Since the oil blowout, a study has been conducted to determine the fate of the released oil and
its toxicological impact on the ecosystem of Maguri-Motapung wetland, Dibru and Lohit river.
Carcasses of many species like Ganges river dolphin, fishes, insects, and herpeto-fauna were
collected from areas around the oil well (Figure 5.1). To study the effect of oil, we aimed to
investigate the presence, concentrations, and ecological risk of Polycyclic aromatic hydrocarbons
(PAHs) in the natural gas leakage in water and sediment samples collected from Lohit river, Dibru
river and Maguri-Motapung beel and also fish samples collected from Maguri Motapung beel and
Lohit river. The primary objective of this study was to estimate the overall toxic effect of 16 PAHs
in the aquatic ecosystem of the impacted area, for more details on the PAHs and sampling, see
Section 9.7. To assess the presence and extent of oil spill, the contaminated water and sediment
samples were collected from the sites (Figure 5.2) at intervals of 1 km. The quality of water was
a b
c d
Figure 5.1: a.Dead fish specimen;b.presence of oil in water near rig area; c. water sample collected from nearby area
d. Plant affected by oil
38
determined by measuring the essential physiochemical parameters such as pH, Dissolved Oxygen
(DO), Total Dissolved Solids (TDS), Conductivity, Specific Conductance Temperature and PAH’s
pollutants.
FFigure 5.2 Study area map indicating all samplings points assessed before fire
Physiochemical parameters were measured at each of the sampling points in Lohit river (Figure
5.2) sampling points from W1 to W!3) (Table 5-1). The Dissolved oxygen (DO) of the river
varies with time and season, depending upon the species of phytoplanktons present, light
penetration (Tripathi et al., 1991; Das et al., 2013), nutrient availability, temperature, salinity, water
movement, partial pressure of atmospheric oxygen in contact with the water, thickness of the
surface film and the bio-depletion rates (Ifelebuegu et al. 2017)). It is an important limnological
parameter that indicates the level of water quality and organic pollution in the water body (Wetzel
and Likens, 2006, Khatoon et al., 2013).
Sampling in May, 2020 just after well blow out indicates Dissolved oxygen (DO) in Lohit river
had an average value of 6.8±0.59mg/l, with minimum recorded at point W6 (5.74±0.21mg/l) and
maximum at W7 (7.35±0.01mg/l) (Table 5-1). Value of Dissolved oxygen (DO) at sampling point
upstream from gas explosion site (W3) is 6.81±0.08 mg/l. Flooding and high wind flow helped to
disperse oily layer and maintain oxygen level, but some oil may sink to the bottom too. The
Dibru river connected to Maguri-Motapung beel and Lohit river, two sites were sampled (W12
and W13). The measured Dissolved oxygen (DO) values are 5.29±0.15mg/l and 5.65±0.28 mg/l
39
respectively. The average value recorded as 5.4±0.28mg/l. (Table 5-1). The minimum DO
recorded for Brahmaputra was 7.23 mg/l and maximum being 10.92 mg/l, the optimal time DO
was 8.63 mg/l (Central Water Commission, 2019). The value at all sites are lower than lowest
reported limits for Brahmaputra. The DO varies with time of day, this data was collected during
12 to 16 Hrs the peak time for DO level.
At locations closer to the source, many dead fish were found during sampling in Maguri-Motapung
beel because the level of Dissolved oxygen (DO) in the water influences the survival of fauna
dependent on it. In Maguri-Motapung beel, the average Dissolved Oxygen (DO) was 1.4±1.23
mg/l, minimum was recorded at point W9 (0.94±0.31mg/l) which was very close to the explosion
site and maximum value was recorded at W10 (1.74±1.30mg/l)l (Table 5-1). The measured
values are far below the permissible limits given by CPCB (6mg/l). Sampling in June 2020, indicate
lower DO values in all sites sampled (Table 5-2). There was a visible layer on surface of water,
and vegetation around the rig after well fire. We sampled four points in Dibru river after
explosion. The average Dissolved oxygen(DO) in the Dibru river had reduced further in
comparison to pre fire sampling (May 2020) and is much lower than the permissible limits (Table
5-2). Measured value of Dissolved oxygen(DO) in Dibru river kept decreasing as we moved
towards the Maguri beel indicating much poorer condition of beel and heavy oil pollution. A
number of fishes had also died in Maguri beel due to non-availability of oxygen and accumulation
of oil in gills. Oil slick formed on water surface hinders aeration of the water as it interferes with
the absorption of atmospheric oxygen. This is the reason of such low value of Dissolved oxygen
(DO) in Dibru river when sampled after the explosion. The oil film gradually diminishes with time
as it readily adsorbs suspended particulate matter and sinks to form sludge on the river bed
(McCauley 1966). Hydrocarbons bioaccumulate in organisms such as aquatic plants, fish, and
invertebrates (Anyakora and Coker, 2007). Values of Dissolved oxygen(DO) does not showed
much variation in Lohit river because of the dilution and dispersion of oil due to flood. All other
values (TDS, Sp. Conductance, Conductivity) did not show variations after the explosion.The
oxygen balance of beel may be affected by presence of oil layer that hinders aeration of the
water. Large quantities of oil were found in the water although the oil film never completely
covered the surface. Oil spill not only cause acute injury and mortality of organisms which are
directly exposed at the source point, but also those organisms that are present in and around the
affected area (Simcik et al., 1996; Anyakora et al., 2008; Pérez et al., 2008).
Water ttemperature is important parameter which determines the rate of oil decomposition,
sedimentation, and sludge formation. Most rapid oxidation of hydrocarbons occurs at
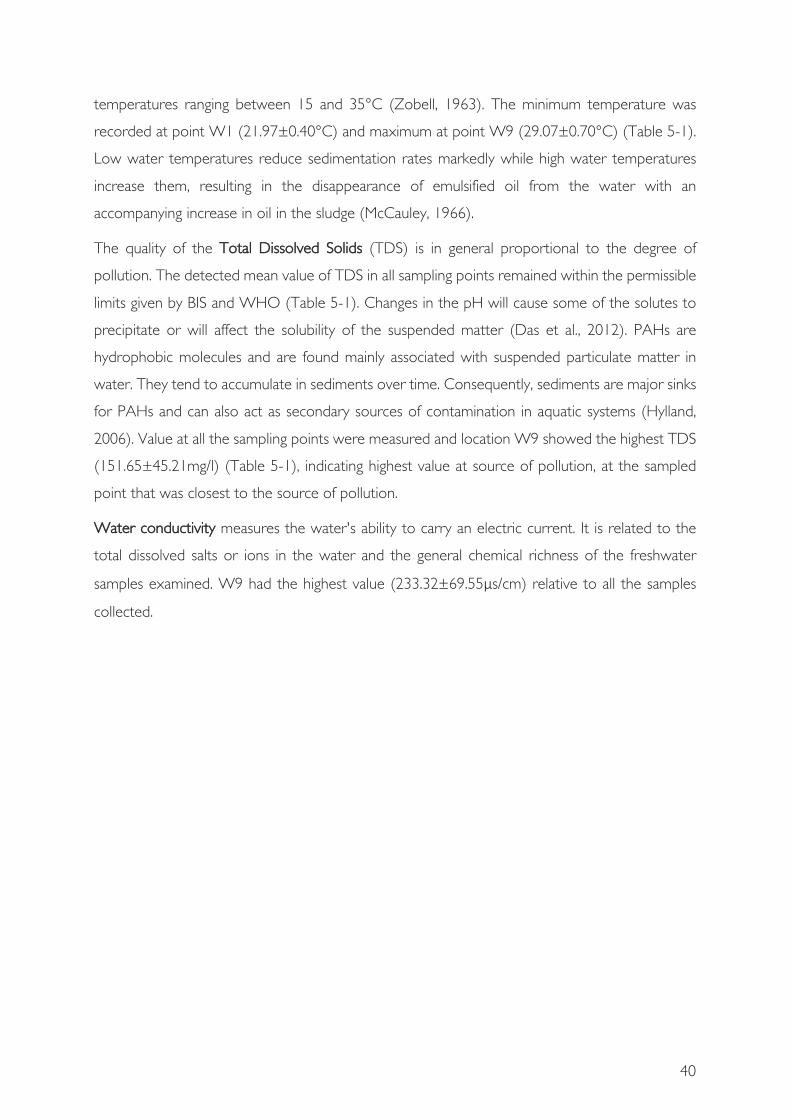
40
temperatures ranging between 15 and 35°C (Zobell, 1963). The minimum temperature was
recorded at point W1 (21.97±0.40°C) and maximum at point W9 (29.07±0.70°C) (Table 5-1).
Low water temperatures reduce sedimentation rates markedly while high water temperatures
increase them, resulting in the disappearance of emulsified oil from the water with an
accompanying increase in oil in the sludge (McCauley, 1966).
The quality of the TTotal Dissolved Solids (TDS) is in general proportional to the degree of
pollution. The detected mean value of TDS in all sampling points remained within the permissible
limits given by BIS and WHO (Table 5-1). Changes in the pH will cause some of the solutes to
precipitate or will affect the solubility of the suspended matter (Das et al., 2012). PAHs are
hydrophobic molecules and are found mainly associated with suspended particulate matter in
water. They tend to accumulate in sediments over time. Consequently, sediments are major sinks
for PAHs and can also act as secondary sources of contamination in aquatic systems (Hylland,
2006). Value at all the sampling points were measured and location W9 showed the highest TDS
(151.65±45.21mg/l) (Table 5-1), indicating highest value at source of pollution, at the sampled
point that was closest to the source of pollution.
Water conductivity measures the water's ability to carry an electric current. It is related to the
total dissolved salts or ions in the water and the general chemical richness of the freshwater
samples examined. W9 had the highest value (233.32±69.55 s/cm) relative to all the samples
collected.
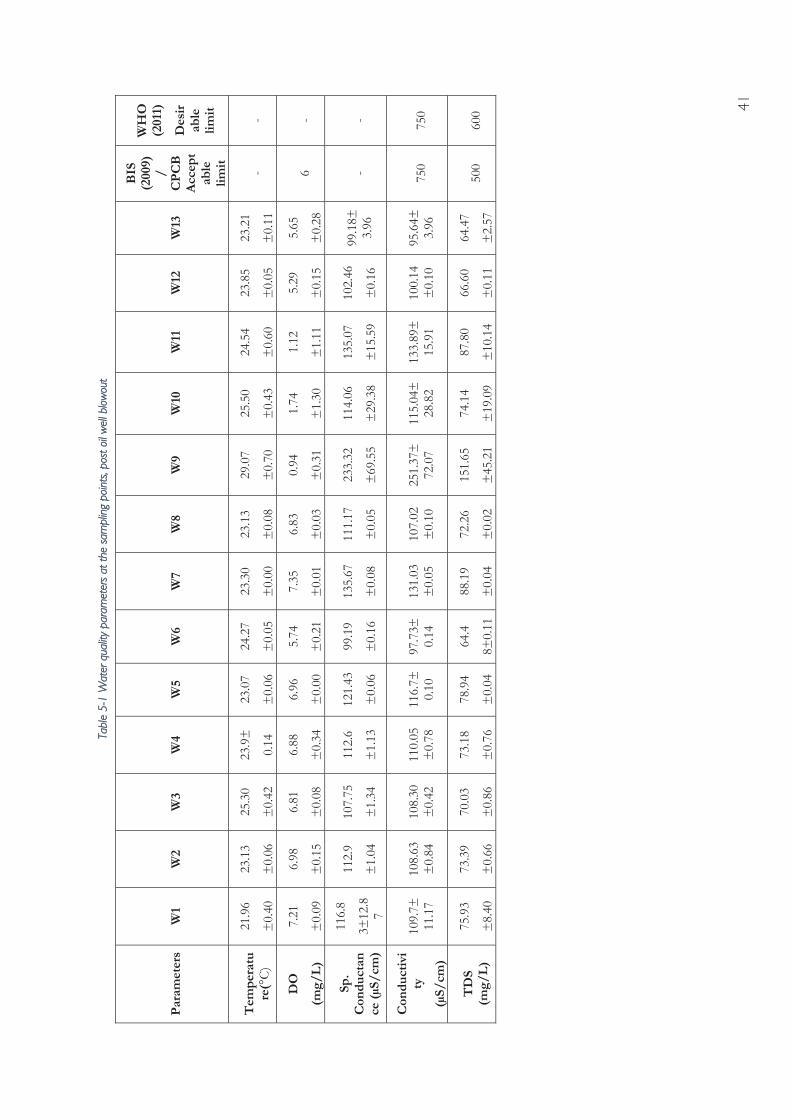
41
TTabl
e 5-
1 W
ater
qua
lity
para
met
ers
at th
e sa
mpl
ing
poin
ts, p
ost o
il w
ell b
low
out
Par
amet
ers
W1
W2
W3
W4
W5
W6
W7
W8
W9
W10
W
11
W12
W
13
BIS
(2
009)
/
C
PC
B
Acc
ept
able
lim
it
WH
O
(201
1)
Des
irab
le
limit
Tem
per
atu
re(°
C)
21.9
6
±0.
40
23.1
3
±0.
06
25.3
0
±0.
42
23.9
±
0.14
23.0
7
±0.
06
24.2
7
±0.
05
23.3
0
±0.
00
23.1
3
±0.
08
29.0
7
±0.
70
25.5
0
±0.
43
24.5
4
±0.
60
23.8
5
±0.
05
23.2
1
±0.
11
- -
DO
(mg/
L)
7.21
±0.
09
6.98
±0.
15
6.81
±0.
08
6.88
±0.
34
6.96
±0.
00
5.74
±0.
21
7.35
±0.
01
6.83
±0.
03
0.94
±0.
31
1.74
±1.
30
1.12
±1.
11
5.29
±0.
15
5.65
±0.
28
6 -
Sp.
Con
du
ctan
ce (µS
/cm
)
116.
8
3±12
.87
112.
9
±1.
04
107.
75
±1.
34
112.
6
±1.
13
121.
43
±0.
06
99.1
9
±0.
16
135.
67
±0.
08
111.
17
±0.
05
233.
32
±69
.55
114.
06
±29
.38
135.
07
±15
.59
102.
46
±0.
16
99.1
8±3.
96
- -
Con
du
ctiv
ity
(µS/
cm)
109.
7±11
.17
108.
63±
0.84
10
8.30
±0.
42
110.
05±
0.78
11
6.7±
0.10
97
.73±
0.14
13
1.03
±0.
05
107.
02±
0.10
25
1.37
±72
.07
115.
04±
28.8
2 13
3.89
±15
.91
100.
14±
0.10
95
.64±
3.96
75
0 75
0
TD
S (m
g/L
)
75.9
3
±8.
40
73.3
9
±0.
66
70.0
3
±0.
86
73.1
8
±0.
76
78.9
4
±0.
04
64.4
8±0.
11
88.1
9
±0.
04
72.2
6
±0.
02
151.
65
±45
.21
74.1
4
±19
.09
87.8
0
±10
.14
66.6
0
±0.
11
64.4
7
±2.
57
500
600
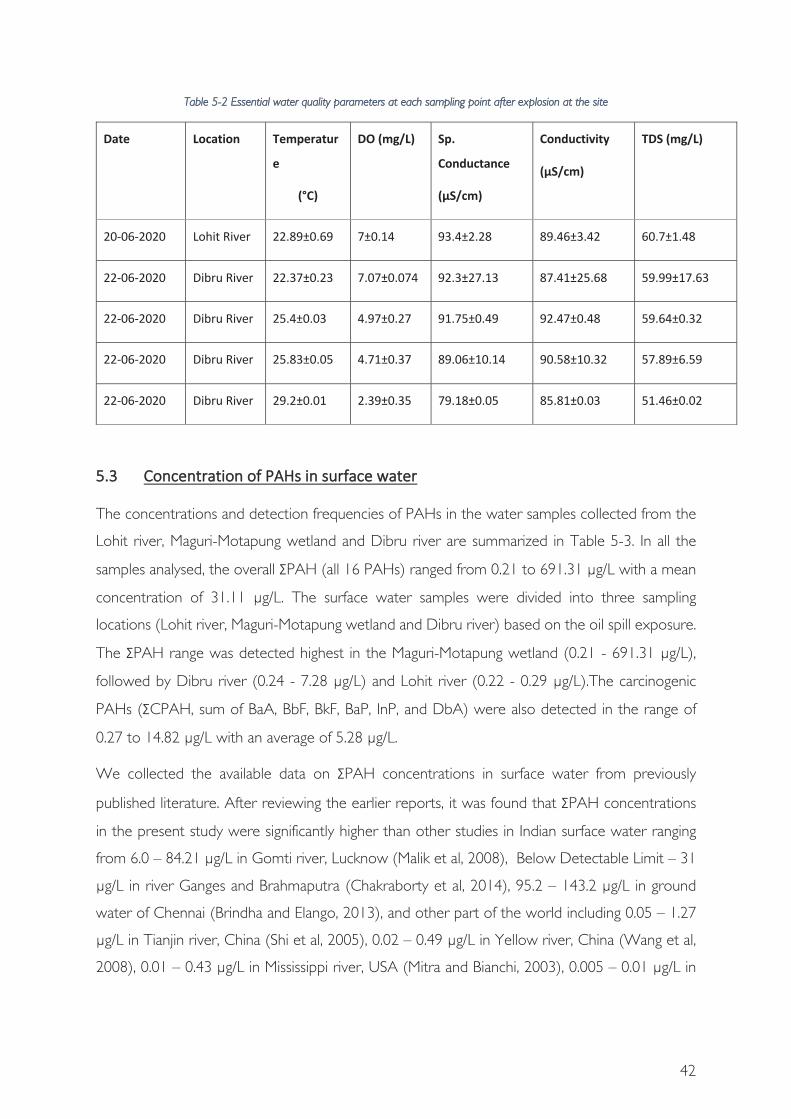
42
TTable 5-2 Essential water quality parameters at each sampling point after explosion at the site
The concentrations and detection frequencies of PAHs in the water samples collected from the
Lohit river, Maguri-Motapung wetland and Dibru river are summarized in Table 5-3. In all the
samples analysed, the overall PAH (all 16 PAHs) ranged from 0.21 to 691.31 μg/L with a mean
concentration of 31.11 μg/L. The surface water samples were divided into three sampling
locations (Lohit river, Maguri-Motapung wetland and Dibru river) based on the oil spill exposure.
The PAH range was detected highest in the Maguri-Motapung wetland (0.21 - 691.31 μg/L),
followed by Dibru river (0.24 - 7.28 μg/L) and Lohit river (0.22 - 0.29 μg/L).The carcinogenic
PAHs ( CPAH, sum of BaA, BbF, BkF, BaP, InP, and DbA) were also detected in the range of
0.27 to 14.82 μg/L with an average of 5.28 μg/L.
We collected the available data on PAH concentrations in surface water from previously
published literature. After reviewing the earlier reports, it was found that PAH concentrations
in the present study were significantly higher than other studies in Indian surface water ranging
from 6.0 – 84.21 μg/L in Gomti river, Lucknow (Malik et al, 2008), Below Detectable Limit – 31
μg/L in river Ganges and Brahmaputra (Chakraborty et al, 2014), 95.2 – 143.2 μg/L in ground
water of Chennai (Brindha and Elango, 2013), and other part of the world including 0.05 – 1.27
μg/L in Tianjin river, China (Shi et al, 2005), 0.02 – 0.49 μg/L in Yellow river, China (Wang et al,
2008), 0.01 – 0.43 μg/L in Mississippi river, USA (Mitra and Bianchi, 2003), 0.005 – 0.01 μg/L in

43
Brisbane river, Australia (Shaw et al, 2004), 0.005 – 0.26 μg/L in Poyang lake, China (Zhi et al,
2015).
Out of 16 PAHs, only 3 PAHs were detected in single sediment sample (S.S-9) collected from
the Maguri-Motapung wetland which was the maximum impacted area from the Oil blowout.
The concentration of PAHs in S.S-9 sample ranged from 37.6 to 395.8 μg/Kg with a mean
concentration of 195.23 μg/Kg (Table 5-4Table 5-5). The PAHs concentration reported in
sediment sample from Maguri-Motapung wetland appears to be middle level compared with
similar wetlands in other part of the world ranging from 371 – 2530 μg/Kg in Taihu Lake, China
(Zeng et al, 2016), 212.0 – 2674 μg/Kg in Anzali wetland, Iran (Yancheshmeh et al, 2014), 96
μg/Kg in Todos Santos Bay wetland, Mexico (Macias-Zamora et al, 2002), 36.5 – 1031.8 μg/Kg in
lower reaches of Shiwuli river, China (Wu et al, 2019).
Concentration of individual PAHs among fish species collected from the Maguri-Motapung
wetland and Lohit river are listed in Table 5-5. Elevated level of PAHs and CPAHs in the fish
samples was detected in ranges of 104.3 to 7829.6 μg/Kg and 145.1 to 169.3 μg/Kg, respectively.
The highest concentration of PAH was detected in the fish samples collected from the Maguri-
Motapung wetland. The total sum of PAH in different fish species were recorded as 11467.9
μg/Kg (Mystus Vittatus), followed by 11378.1 μg/Kg (Channa orientalis), 10877.7 μg/Kg (Rasbora
daniconus) and 10721.0 μg/Kg (Puntius Sophore). No PAHs concentration was detected in the
Eutropiichthys vacha collected from Lohit river. Among the detected PAHs in fish samples,
Acenaphthene, Fluorene and Phenanthrene constituted the 95% of the total detected
concentration.
The total PAHs concentration reported in fish samples collected from Maguri-Motapung wetland
appears to be 10 - 100 fold higher than the earlier reported concentration in India (17.43 – 70.44
μg/Kg) (Dhananjayan and Muralidharan, 2012) and other part of the world ranging from 26.8 –
104.1 μg/Kg in Western Nigeria (Akpambang et al, 2009), 0.73 – 17.04 μg/Kg in Portugal
(Ramalhosa et al, 2009), 23.83 – 79.74 μg/Kg in Turkey (Basak et al, 2010), 39.6 – 247.0 μg/Kg in
Kuwait (Alomirah et al, 2009), 2.5 – 9.4 μg/Kg in different marine fishes in Catalonia, Spain (Llobet
et al, 2006), 15 – 118 μg/Kg in marine fish, China (Cheung et al, 2007) Lake Michigan, USA (0.53
– 1064 μg/Kg) (Zabik et al, 1996; Levengood et al, 2011; Huang et al, 2014).

44
TTabl
e 5-
3 Co
ncen
tratio
n (μ
g/Kg
) of
PAH
s am
ong
wat
er s
ampl
es c
olle
cted
from
the
Lohi
t rive
r, M
agur
i-Mot
apun
g W
etla
nds
and
Dib
ru ri
ver.
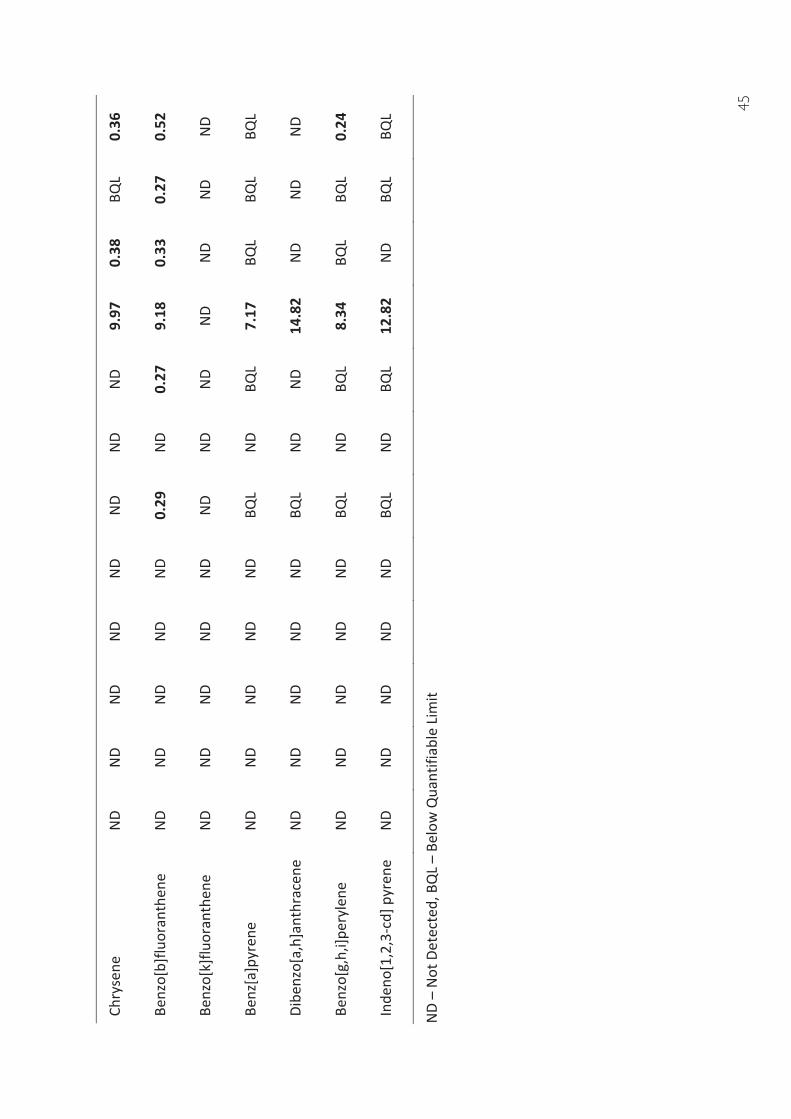
45

46
TTabl
e 5-
4 Co
ncen
tratio
n (μ
g/L)
of P
AHs
amon
g se
dim
ent s
ampl
es c
olle
cted
from
the
Lohi
t rive
r, M
agur
i-Mot
apun
g W
etla
nds
and
Dib
ru ri
ver.

47

48
TTabl
e 5-
5 Co
ncen
tratio
n (μ
g/Kg
) of
PAH
s am
ong
fish
colle
cted
from
the
Mag
uri-M
otap
ung
wet
land
and
Loh
it riv
er.

49
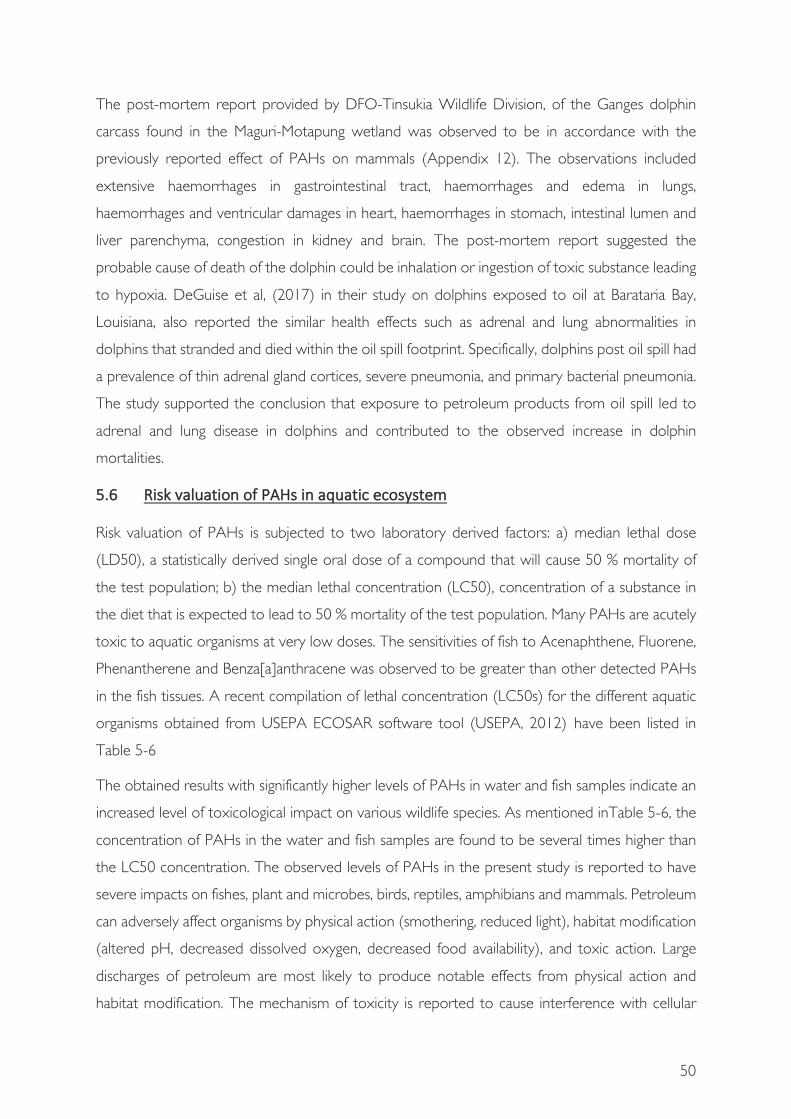
50
The post-mortem report provided by DFO-Tinsukia Wildlife Division, of the Ganges dolphin
carcass found in the Maguri-Motapung wetland was observed to be in accordance with the
previously reported effect of PAHs on mammals (Appendix 12). The observations included
extensive haemorrhages in gastrointestinal tract, haemorrhages and edema in lungs,
haemorrhages and ventricular damages in heart, haemorrhages in stomach, intestinal lumen and
liver parenchyma, congestion in kidney and brain. The post-mortem report suggested the
probable cause of death of the dolphin could be inhalation or ingestion of toxic substance leading
to hypoxia. DeGuise et al, (2017) in their study on dolphins exposed to oil at Barataria Bay,
Louisiana, also reported the similar health effects such as adrenal and lung abnormalities in
dolphins that stranded and died within the oil spill footprint. Specifically, dolphins post oil spill had
a prevalence of thin adrenal gland cortices, severe pneumonia, and primary bacterial pneumonia.
The study supported the conclusion that exposure to petroleum products from oil spill led to
adrenal and lung disease in dolphins and contributed to the observed increase in dolphin
mortalities.
Risk valuation of PAHs is subjected to two laboratory derived factors: a) median lethal dose
(LD50), a statistically derived single oral dose of a compound that will cause 50 % mortality of
the test population; b) the median lethal concentration (LC50), concentration of a substance in
the diet that is expected to lead to 50 % mortality of the test population. Many PAHs are acutely
toxic to aquatic organisms at very low doses. The sensitivities of fish to Acenaphthene, Fluorene,
Phenantherene and Benza[a]anthracene was observed to be greater than other detected PAHs
in the fish tissues. A recent compilation of lethal concentration (LC50s) for the different aquatic
organisms obtained from USEPA ECOSAR software tool (USEPA, 2012) have been listed in
Table 5-6
The obtained results with significantly higher levels of PAHs in water and fish samples indicate an
increased level of toxicological impact on various wildlife species. As mentioned inTable 5-6, the
concentration of PAHs in the water and fish samples are found to be several times higher than
the LC50 concentration. The observed levels of PAHs in the present study is reported to have
severe impacts on fishes, plant and microbes, birds, reptiles, amphibians and mammals. Petroleum
can adversely affect organisms by physical action (smothering, reduced light), habitat modification
(altered pH, decreased dissolved oxygen, decreased food availability), and toxic action. Large
discharges of petroleum are most likely to produce notable effects from physical action and
habitat modification. The mechanism of toxicity is reported to cause interference with cellular

51
membrane function and enzyme systems associated with the membrane (Neff, 1985). The
resulting biochemical disruptions and cell damage lead to mutations, developmental
malformations, tumours, and cancer (Eisler, 2000; Santodonato et al, 1981). The PAHs affects
different organisms at different level and in different ways based on their physical, chemical and
biological functions.
52
TTabl
e 5-
6 Th
e Ac
ute
Toxi
city
Leve
l (LC
50)
of P
AHs
in s
ome
of th
e aq
uatic
spe
cies
(USE
PA, 2
012)
.

53

54
The highest detected PAHs (Acenaphthene, Fluorene and Phenanthrene) in water and fish
sample have high toxic effect on the aquatic environment. Acenaphthene damages the DNA of
cells and affects endocrine activity. A bigger concern is the potential for acenaphthene to build
up in aquatic sediments, which could pose a risk to organisms that dwell in or near the bottom
of lakes and rivers. Effect of fluorene studied on fingerling bluegills showed that 62 μg/L adversely
affected their ability to capture prey, 120 μg/L reduced growth, and 1000 μg/L increased their
vulnerability to predation. Fluorene, at concentrations well below its solubility and at levels that
could realistically occur in the environment, represents a potential hazard to aquatic organisms
(Finger et al, 1985). In animal studies, exposure to fluorene affected the blood system and spleen
(USEPA, 2002). Ninty three percent mortality was observed in the embryo of rainbow trout
administrated with the phenanthrene (85 μg/L) self-explained its toxicity for fishes (Black et al,
1983).
Reports of the effects of petroleum spills or discharges on plants and microbes contain accounts
of injury or death of freshwater wetland vegetation (Burk, 1977; Baca et al., 1985); enhanced or
reduced biomass and photosynthetic activity of phytoplankton communities (Johansson et al,
1980; Shailaja, 1988); genetic effects on terrestrial plants (Klekowski, 1994); and microbial
community changes and increases in numbers of microbes (Braddock et al, 1995; Megharaj,
2000). Lethal and sublethal effects are caused by contact with oil or dissolved oil, systemic uptake
of oil compounds, blockage of air exchange through surface pores, and possibly by chemical and
physical alteration of soil and water, such as depletion of oxygen and nitrogen, pH change, and
decreased light penetration. Individual PAHs, at low concentrations (5 to 100 ppb) can stimulate
or inhibit growth and cell division in aquatic bacteria and algae. At high concentrations (0.2 to 10
ppm) the same PAHs interfere with cell division of bacteria and cell division and photosynthesis
of algae and macrophytes; they can also cause death (Neff, 1985; Eisler, 2000).
Heavy exposure to petroleum in adult and juvenile fish through ingestion of contaminated food
or water can lead to their death. Petroleum concentrations (total petroleum hydrocarbons) in
water of less than 500 μg/L during long-term exposure (Woodward et al, 1983). Sublethal effects
begin at concentrations of less than 500 μg/L and include changes in heart and respiratory rates,
gill structural damage, enlarged liver, reduced growth, fin erosion, corticosteriod stress response,
immunosuppression, impaired reproduction, increased external and decreased internal parasite
burdens, behavioral responses, and a variety of biochemical, blood, and cellular changes (Barnett

55
and Toews, 1978; Malins and Hodfins, 1981; Thomas and Budiantara, 1995; Kuehn, 1995; Gregg
et al, 1997; Khan, 1999; (Collier et al, 2013; Vinget et al, 2016). Eggs and larvae can suffer adverse
effects, including death, when exposed to concentrations of petroleum in water ranging from less
than 1 μg/L (total PAHs) up to 500 μg/L (total PAHs or total petroleum hydrocarbons) (Marty,
1997; Heintz et al, 1999; Carls et al, 1999). Effects of oil on eggs and larvae include death of
embryos and larvae, abnormal development, reduced growth, premature and delayed hatching
of eggs, DNA alterations, and other cellular abnormalities (Malins and Hodgins, 1981; Brown,
1996; Marty, 1997; Heintz et al, 1999; Carls et al, 1999)
Carcass of various species of reptiles and amphibians were found at the site of blowout. Earlier
studies have also reported death and sub lethal effects of PAHs such as grossly inflated lungs,
fatty livers, and abnormal behaviour in Bullfrog tadpoles (McGrath and Alexander, 1979).
Sensitivity of the amphibian larvae to oil is reported to be slightly less, but it can cause reduced
growth or reduced food (algae) densities and could prevent metamorphosis of green frogs at
high exposure (Mahaney, 1994; Lefcort, 1997)
Birds have also been reported to be affected by petroleum through external oiling, ingestion,
egg oiling, and habitat changes. External oiling disrupts feather structure, causes matting of
feathers, and produces eye and skin irritation. Death often results from drowning (Vermeer and
Vermeer, 1975; Tseng, 1993; Jenssen et al, 1994) Birds that spend much of their time in the
water, such as alcids (Alcidae), waterfowl (Anatidae) are the most vulnerable to surface oil.
Petroleum can be ingested through feather preening, consumption of contaminated food or
water, and inhalation of fumes from evaporating oil. Ingestion of oil is seldom lethal, but it can
cause many debilitating sublethal effects that promote death from other causes, including
starvation, disease, and predation. Effects include gastrointestinal irritation, pneumonia,
dehydration, red blood cell damage, impaired osmoregulation, immune system suppression,
hormonal imbalance, inhibited reproduction, retarded growth, and abnormal parental behaviour
(Eppley, 1992; Jenssen, 1994; Fowler et al, 1995; Walton, 1997). Petroleum spilled in avian
habitats can have immediate and long-term effects on birds. Fumes from evaporating oil, a
shortage of food, and clean-up activities can reduce use of an affected area (Parsons, 1994; Day,
1997).
56
The metabolism and effects of some PAHs have been well documented in laboratory rodents
and domestic mammals but poorly documented in wild mammals. Target organs for PAH toxic
action are skin, small intestine, kidney, and mammary gland; tissues of the hematopoietic,
lymphoid, and immune systems; and gametic tissue. Aquatic mammals are long-lived and have
relatively large amounts of body fat (necessary for energy storage, thermoregulation, etc.), placing
them at significant risk for accumulating lipophilic organic contaminants. This makes aquatic
mammals both vulnerable to and sensitive indicators of acute and chronic exposure to recalcitrant
contaminants. Chronic effects may impair reproductive performance, immune function, or even
survival for individuals and, if widespread, affect the status of a population and community (NRC
2003). Evidence suggests that chronic and/or acute exposure to oil may lead to a range of
ailments and conditions including skin irritation, conjunctivitis, hepatic and hypothalamic lesions,
hepatic necrosis, cancer, and poor survival of offspring (Engelhardt 1982, Martineau et al. 1994,
Loughlin et al. 1996, Peterson et al. 2003). Inhalation exposures are a concern for any air-
breathing organisms (e.g. sea turtles, mammals, birds, humans) near the oil spilled surface.
Cetaceans breathing just above the air/water interface would likely be more consistently exposed
to the highest concentrations of surface oil droplets, than either birds or humans. Large mammals
may also ingest prey that has oil or its metabolites in their tissues. Inhalation of evaporating oil is
a potential respiratory problem for mammals near or in contact with large quantities of
unweathered oil. Some of the previously described disorders are thought to be caused by
hypothermia, shock, and stress rather than direct toxic action; distinguishing between the two
types of causes can be difficult. Similarly, the unique cetacean physiological and anatomical
adaptations for respiratory efficiency associated with diving would increase the impacts of oil
inhalation and aspiration (Takeshita et al, 2017).
57
Noise levels upto 5 km from oil blow out, on surface and under water, was measured. Sound plays
important role for life on earth. Communication, resource use, predation, survival all have reliance on
sound and thus evolution have shaped various life form to use different spectrum of sound. When
sound become noise it is detrimental for living being, from modulating behaviour to causing serious
injury and death. To measure environment noise level in and around the oil well explosion site, we used
a portable digital field recorder Tascam DR-100 (TASCAM Inc.). Sound recording was done along Lohit
river 4 km upstream to 5km down stream from well blow out site and on land upto 4km.
We found that the sound level (dB weighted) was 96.48dB along Lohit river at a distance of 0.48 km
and 112.68 dB on land. The predicted noise level from oil explosion point upto 12 km ranges from
113 to 70db (Figure 5). For humans sound level upto to 60db is the most comfortable. Noise above
70 dB over a prolonged period may damage hearing (Centers for Disease Control and Prevention,
2019).The standard limits set by WHO and CPCPB ranges from 40 db (silence zone) to 65 db
(Commercial zone). The noise level in 12 km radius of 70db or above made environment not suitable
for the normal life for prolonged period as it may result in hearing loss and many other ailments. This
level will also affect most of the birds and mammal species. The under water sound ranges from 5 Hz
to 92 kHz (majority between 5 to 100 Hz) with pressure level ranging from 127 to 135 db. Most of
the Ganges dolphin communication happens in the range of 40 to 90 kHz.
To measure environment noise level in and around the oil well explosion site, we used a portable
digital field recorder Tascam DR-100 (TASCAM Inc.). Sound level in the surrounding
environment was recorded along the river Lohit on 3rd July, and in and around the explosion site
(rig area) at the oil fields on 4th July, 2020.
Along the Lohit river, sound level recording was done up to 5 km downstream (to Guijan ghat)
and 4 km upstream from the oil explosion site. Along this 9 km stretch, recording was carried
out every 500 m - 1 km. Around the rig area on land, sound level recording was done for up to
4 km distance from the explosion site, once every 1- 2 km. With the recordings,
a spectrogram was generated to visualize the spectrum of frequencies (i.e. the amount of energy
in the sound at each frequency) of the signal (Figure 6.1).
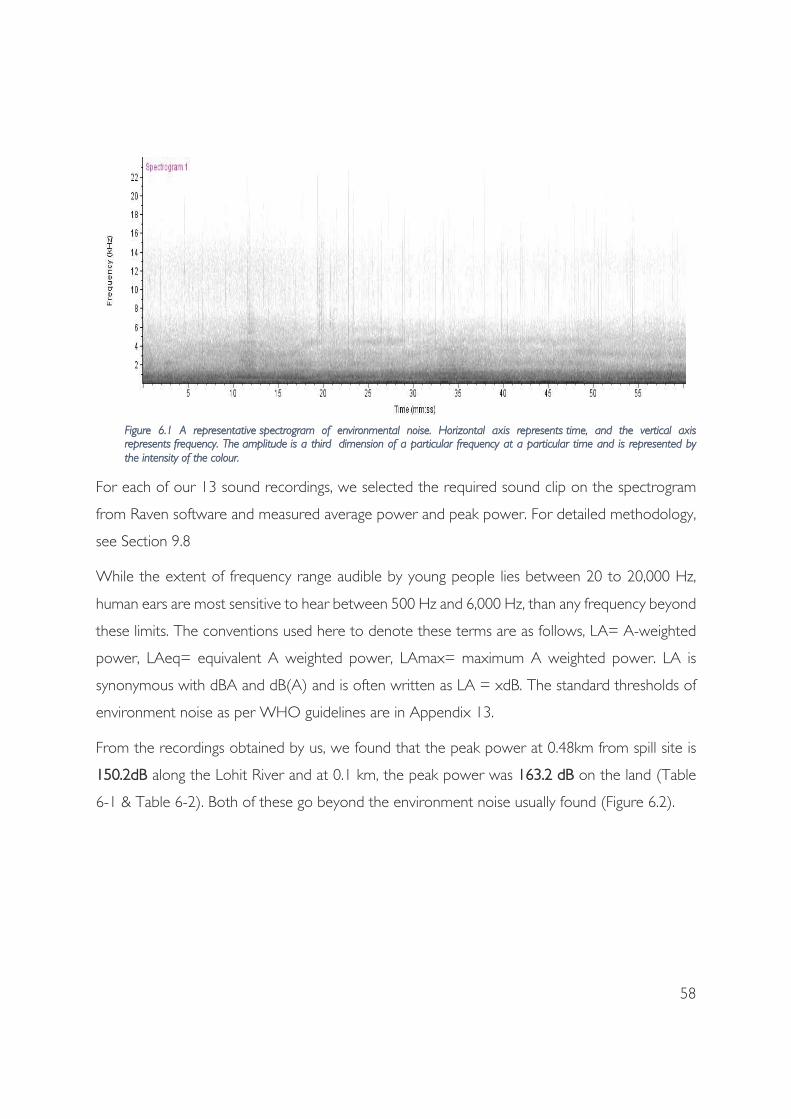
58
FFigure 6.1 A representative spectrogram of environmental noise. Horizontal axis represents time, and the vertical axis represents frequency. The amplitude is a third dimension of a particular frequency at a particular time and is represented by the intensity of the colour.
For each of our 13 sound recordings, we selected the required sound clip on the spectrogram
from Raven software and measured average power and peak power. For detailed methodology,
see Section 9.8
While the extent of frequency range audible by young people lies between 20 to 20,000 Hz,
human ears are most sensitive to hear between 500 Hz and 6,000 Hz, than any frequency beyond
these limits. The conventions used here to denote these terms are as follows, LA= A-weighted
power, LAeq= equivalent A weighted power, LAmax= maximum A weighted power. LA is
synonymous with dBA and dB(A) and is often written as LA = xdB. The standard thresholds of
environment noise as per WHO guidelines are in Appendix 13.
From the recordings obtained by us, we found that the peak power at 0.48km from spill site is
150.2dB along the Lohit River and at 0.1 km, the peak power was 163.2 dB on the land (Table
6-1 & Table 6-2). Both of these go beyond the environment noise usually found (Figure 6.2).

59
FFigure 6.2 Sound levels of common sounds in air re 20 Pa. (© University of Rhode island)
Table 6-1 Summary of the noise level recordings at various distance from the oil explosion site in Baghjan along Lohit river.
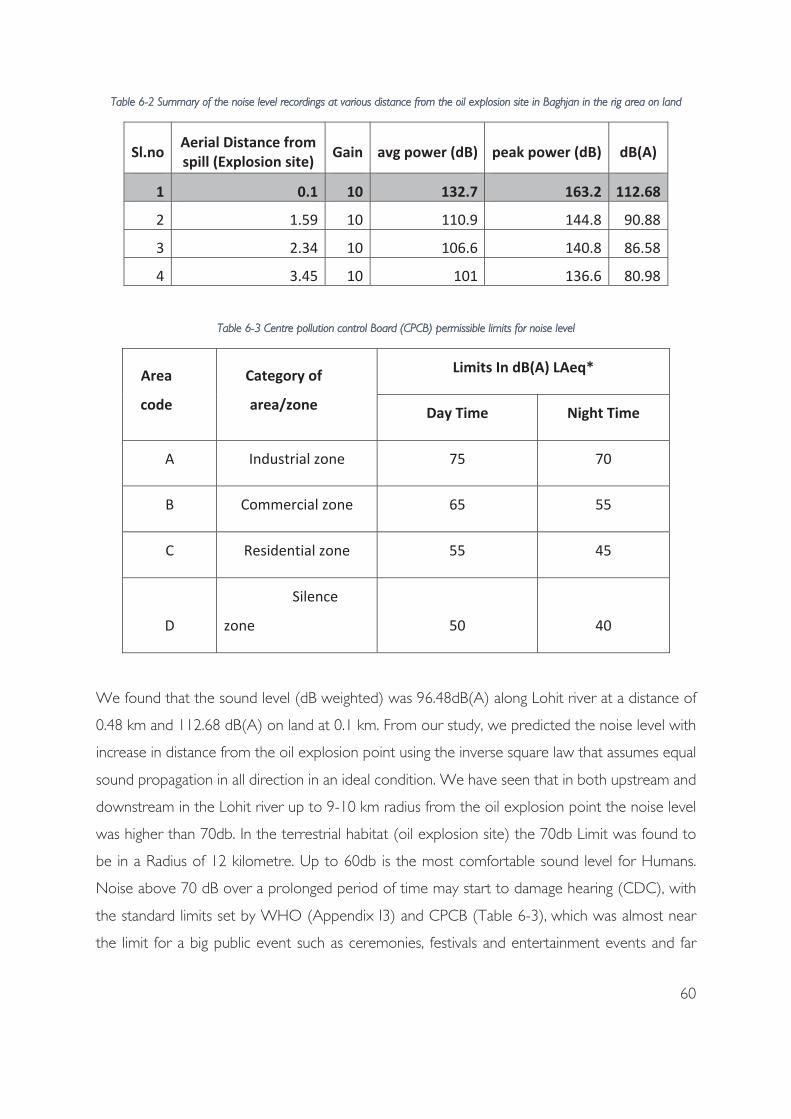
60
TTable 6-2 Summary of the noise level recordings at various distance from the oil explosion site in Baghjan in the rig area on land
Table 6-3 Centre pollution control Board (CPCB) permissible limits for noise level
We found that the sound level (dB weighted) was 96.48dB(A) along Lohit river at a distance of
0.48 km and 112.68 dB(A) on land at 0.1 km. From our study, we predicted the noise level with
increase in distance from the oil explosion point using the inverse square law that assumes equal
sound propagation in all direction in an ideal condition. We have seen that in both upstream and
downstream in the Lohit river up to 9-10 km radius from the oil explosion point the noise level
was higher than 70db. In the terrestrial habitat (oil explosion site) the 70db Limit was found to
be in a Radius of 12 kilometre. Up to 60db is the most comfortable sound level for Humans.
Noise above 70 dB over a prolonged period of time may start to damage hearing (CDC), with
the standard limits set by WHO (Appendix I3) and CPCB (Table 6-3), which was almost near
the limit for a big public event such as ceremonies, festivals and entertainment events and far
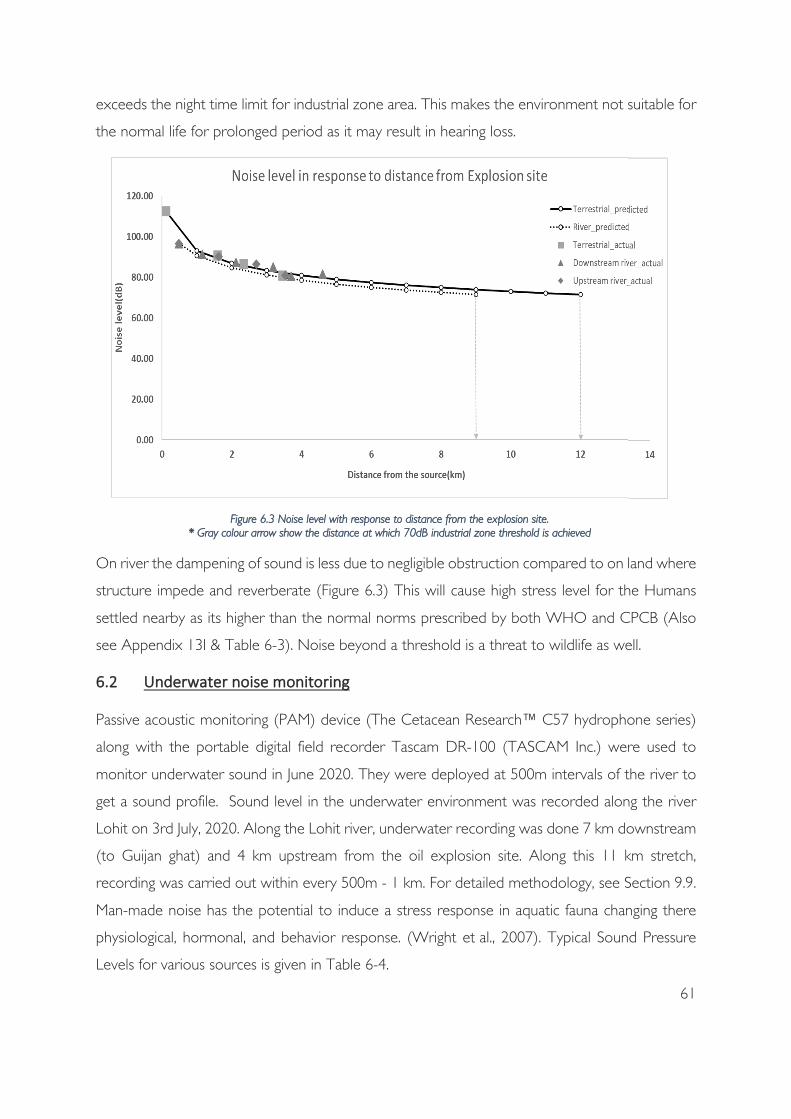
61
exceeds the night time limit for industrial zone area. This makes the environment not suitable for
the normal life for prolonged period as it may result in hearing loss.
On river the dampening of sound is less due to negligible obstruction compared to on land where
structure impede and reverberate (Figure 6.3) This will cause high stress level for the Humans
settled nearby as its higher than the normal norms prescribed by both WHO and CPCB (Also
see Appendix 13I & Table 6-3). Noise beyond a threshold is a threat to wildlife as well.
Passive acoustic monitoring (PAM) device (The Cetacean Research™ C57 hydrophone series)
along with the portable digital field recorder Tascam DR-100 (TASCAM Inc.) were used to
monitor underwater sound in June 2020. They were deployed at 500m intervals of the river to
get a sound profile. Sound level in the underwater environment was recorded along the river
Lohit on 3rd July, 2020. Along the Lohit river, underwater recording was done 7 km downstream
(to Guijan ghat) and 4 km upstream from the oil explosion site. Along this 11 km stretch,
recording was carried out within every 500m - 1 km. For detailed methodology, see Section 9.9.
Man-made noise has the potential to induce a stress response in aquatic fauna changing there
physiological, hormonal, and behavior response. (Wright et al., 2007). Typical Sound Pressure
Levels for various sources is given in Table 6-4.
FFigure 6.3 Noise level with response to distance from the explosion site. * Gray colour arrow show the distance at which 70dB industrial zone threshold is achieved
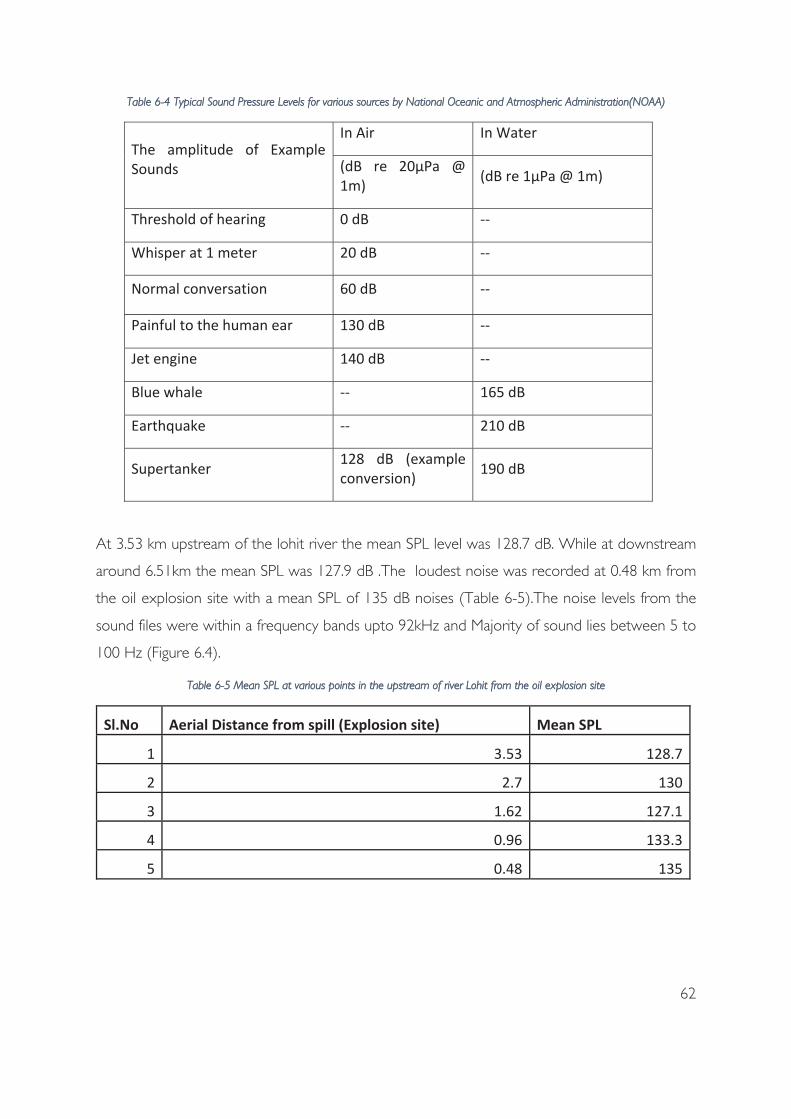
62
TTable 6-4 Typical Sound Pressure Levels for various sources by National Oceanic and Atmospheric Administration(NOAA)
At 3.53 km upstream of the lohit river the mean SPL level was 128.7 dB. While at downstream
around 6.51km the mean SPL was 127.9 dB .The loudest noise was recorded at 0.48 km from
the oil explosion site with a mean SPL of 135 dB noises (Table 6-5).The noise levels from the
sound files were within a frequency bands upto 92kHz and Majority of sound lies between 5 to
100 Hz (Figure 6.4).
Table 6-5 Mean SPL at various points in the upstream of river Lohit from the oil explosion site
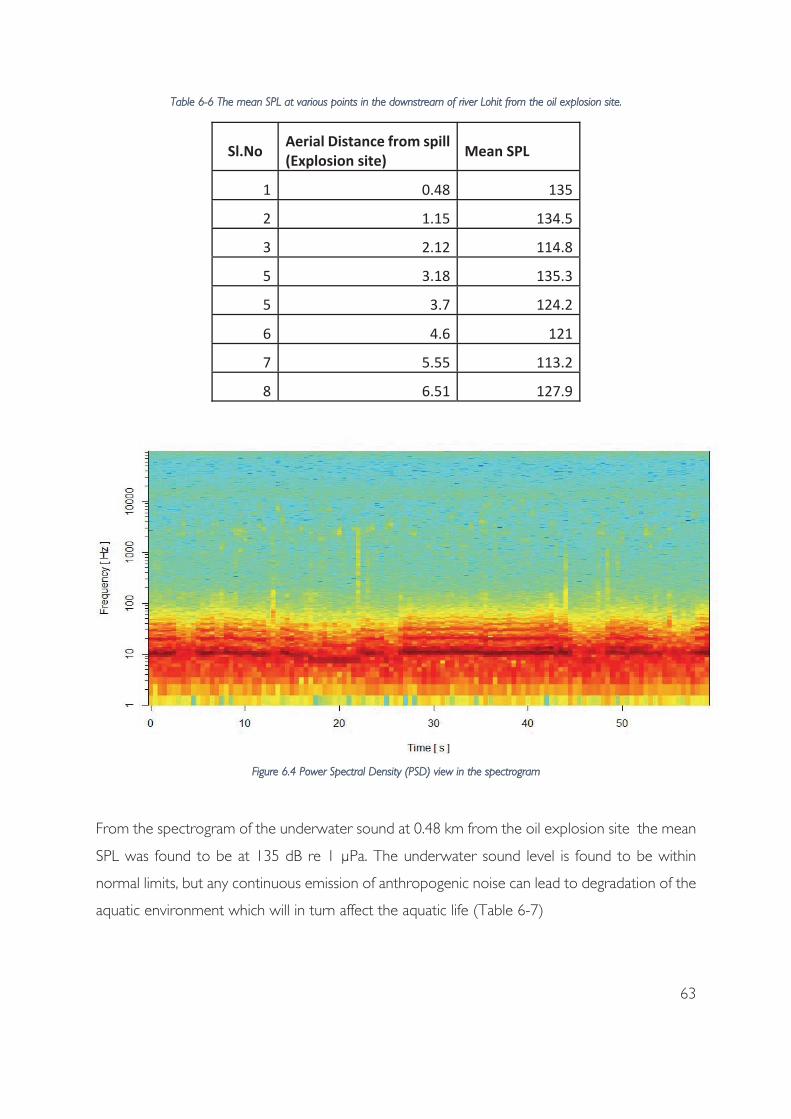
63
TTable 6-6 The mean SPL at various points in the downstream of river Lohit from the oil explosion site.
Figure 6.4 Power Spectral Density (PSD) view in the spectrogram
From the spectrogram of the underwater sound at 0.48 km from the oil explosion site the mean
SPL was found to be at 135 dB re 1 μPa. The underwater sound level is found to be within
normal limits, but any continuous emission of anthropogenic noise can lead to degradation of the
aquatic environment which will in turn affect the aquatic life (Table 6-7)
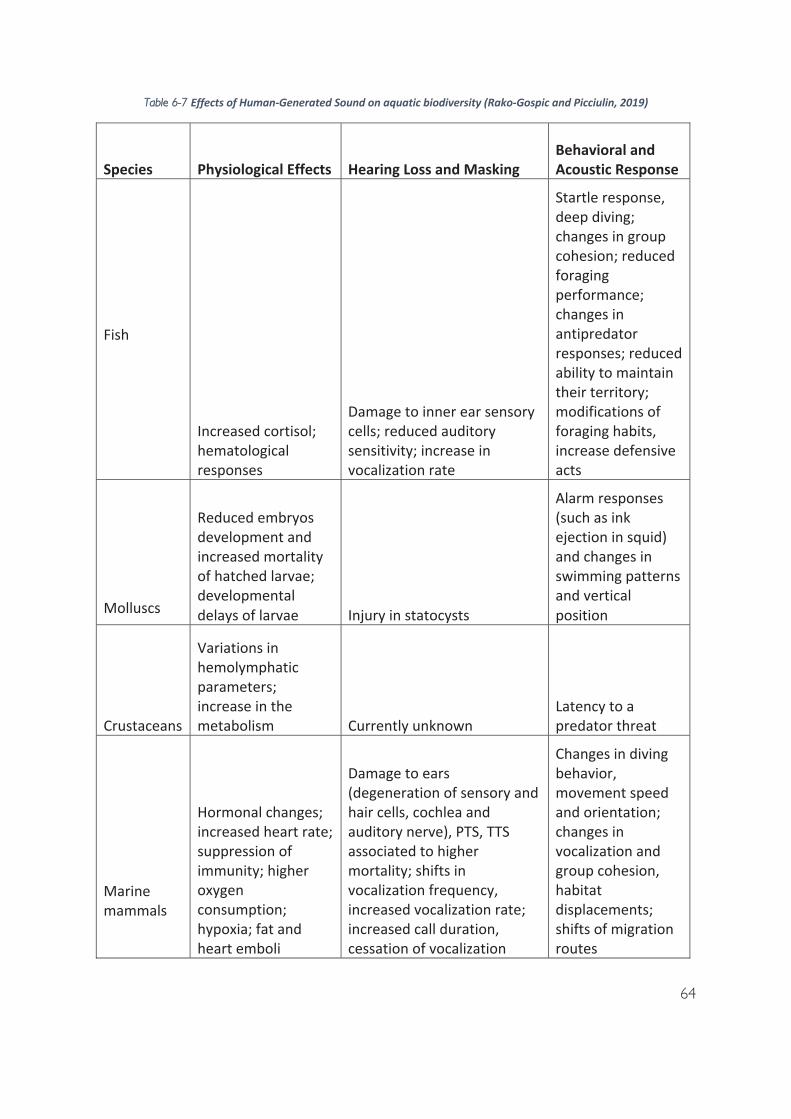
64
TTable 6-7
65
Dolphins: Compared to an earlier survey in February where the encounter rate of Ganges dolphin was
4.5/10 km, it was reduced to 1.5/10 km in May and by June it was 0.48/km, indicating 89% decline
in use of this area. One dolphin was found dead in Maguri-Motapung area most likely due to oil
poisoning. We recorded dolphin presence in Lohit and Dibru rivers but no recording was made of
dolphin sound in Maguri-Motapung area which was most impacted site.
Bird richness: This area is famous for Black-breasted Parrotbill, Marsh Babbler, White-winged
Duck, Bengal Florican, Jerdon’s Bushchat and Swamp Grass babbler. A total of 450 species of birds
have been listed (Choudhury 2006, 2007; Das 2006, Rahmani 2016). This area has six Critically
Endangered, six Endangered, 12 Vulnerable, and 16 Near Threatened species of birds (Rahmani, Islam
and Kasambe, 2016). The habitat in the affected area is segregated into Grassland and wetland.
Data from ebird was downloaded and used to draw comparisons between earlier occurrence reports
at locations that fall within our sampling grid and current occurrence. Bird species richness increases
with increase in distance from oil spill site. The bird data was compared with resident birds reported
by birders on eBird. The decline in richness is evident in grassland (59%) and wetland (85%). Survey
team has recorded abandoned nest at impact site. The effects of oil spill on birds are well known from
many oil spills around the world from past. The overall effect of oil pollution on aquatic bird populations
must be examined from two points of view: (1) the disastrous effects of oil spills and (2) the sub-lethal
and indirect effects of chronic exposure to low levels of hydrocarbons in the environment (Szaro, 1976).
Fish richness: Dibru-Saikhowa National Park part is reported to have 104 species of fishes. The
sampling was carried out with gill net and cast net at a total of eight sites. We have recorded about
25 species of fishes belonging to 9 families. Cyprinidae family was found to be the most dominant
family with 13 species. The overall richness and abundance of fishes declines with decrease in dissolved
oxygen at different sites. We have seen fishes having visible symptoms on body due to oil toxicity.
During our survey, maximum mortality of adult fishes had occurred in stagnant pools, as there is slow
exchange of water and most of the fishes prefer stagnant pools during breeding period. Cirrhinus reba,
Banagana dero, Labeo bata, Labeo calbasu, Sperata aor, Sperata seengala, Channa marulius, Channa
punctatus, Eutropiichthys vacha has high economic value in market and fishes like Puntius sophore,
66
Puntius chola, Pethia gelius, Salmophasia bacaila, Baralius barna, Mystus vittatus, Xenetodon
cancila, Anabus testudineus, and Parambassis ranga are ornamentally important fishes. The
abundance of these species was found to be very less in Dibru river and Maguri- Motapung beel, likely
due to the mortality or and avoiding high toxic areas due to oil spill.
Butterflies and odonates richness: A total of 96 individuals belonging to 41 species of butterflies and
34 individuals of 13 species of odonates were sighted. Species richness and abundance of butterflies
increases distance from well blow out site. Our survey team has found carcasses of burnt odonates as
well as live ones with oil film on wings. Direct exposure to oil is known to negatively affect insects by
altering different functions such as feeding and oviposition behaviour, gas exchange, cuticle permeability
and cell membrane structural and functional destruction (Beattie et al.1995; Mensah et al. 1995;
Bogran et al. 2006).
Herpetofauna: The survey was restricted to day as flooding and lockdown of site after fire created
night sampling issues and thus it should be considered as partial. Work is underway and will be
completed depending upon flooding scenario in this area. The checklist of Ahmed and Das (2020)
provides what will be expected in this area. Nine species of reptiles were recorded by us. The lack of
any encounters of tadpoles in the multiple water pools that were encountered in the grids, despite
being breeding season for many species, is a great concern. Though this time of the year in a flood-
prone season makes it difficult to discern whether the cause of apparent wipe out of herpetofauna is
floods or the explosion, the direct impacts of explosion through burn down is certain for at least 500
m, and impacts of oil spill remains a crucial component to answer. We have found live herpetofauna
from 500 m up to 6 km from the oil well explosion site and carcasses at 400 m to 6 km.
People: We have not done any work on socio-economics and health impacts on humans. The oil well
blow out had economic and health impact on humans (Rishu Kalantri 2020, thelogicalindian.com). The
contaminants will have long term impact and need appropriate mitigation measures.
Given that the maximum impact area was Dibru-Saikhowa National Park and Maguri-Motapung
Wetland, we started with our preliminary reconnaissance survey to assess the impact on flora
and fauna in the surrounding region. The animal sampling were carried out since 29th May 2020,
to 10th July 2020.

67
Earlier studies on cetacean (which includes whales, dolphins and porpoises) health due to
exposure to oil spills has reported lung injuries (Stabenau et al. 2006); physical injuries to the
respiratory tract by irritating tissues/membranes during aspiration of liquid oil deposited on the
blowhole (Gentina et al. 2001). These resulted into moderate to severe lung diseases causing
pneumonia, lung abscesses, pulmonary infections and adrenal toxicity (Schwacke et al. 2013,
Venn-Watson et al. 2015). On the other hand, ingestion of petroleum oil while foraging on oil-
contaminated prey resulted into deposition of petroleum hydrocarbons at highest level in blubber
followed by liver and other tissues (Geraci and St. Aubin 1982, Engel'hardt 1983). However,
another important aspect of effect of oil spill on cetacean is their ranging patterns and habitat
use. Experimental results reported from captive dolphins has demonstrated their ability to detect
slick oil conditions and avoid entering those areas consistently (Geraci et al., 1983; St Aubin et
al., 1985). While in wild, although they are capable of detecting slick and mousse oil conditions,
it was observed that eventually they enter those zones with some initial hesitations (Smultea and
Würsig, 1995). This was suggested as multi- year site fidelity to small home ranges in dolphins
(Wells et al. 1987, Wells et al. 2017) where they continuously access the area despite of having
noxious stimuli to oil. The strong impulse for migration, which is an important event of life history
of cetaceans, remained unaffected with the presence of oil on their way (Evans 1982). In both of
these cases, the chance of continuous exposure of the animal to the toxicity of petroleum
hydrocarbon product increases, which can remain in the area for longer duration (Wells et al.
2017, Mullin et al. 2017).
This study was conducted between May and July, 2020, to understand the changes in distribution
pattern of Ganges dolphin in Lohit- Dibru stretch of Brahmaputra due to the recent oil spill and
blowout of oil well that happened in the month of May, 2020 in that area. The affected Maguri-
Motapung Beel, has connectivity with the Lohit river, through Dibru river, stretch which is also a
potential habitat of Ganges dolphins. Two temporal surveys were carried out in the Lohit-Dibru
River. The first survey was conducted (post oil spill and before oil well explosion) in the month
of May 2020 covering a 32 km stretch with the blowout site as centre. The second survey was
conducted during June 2020 in a 62km stretch of Lohit River (Figure 7.1). The distribution was
then compared with previous years surveys conducted in this area in the month of February,
from 2012-2020.
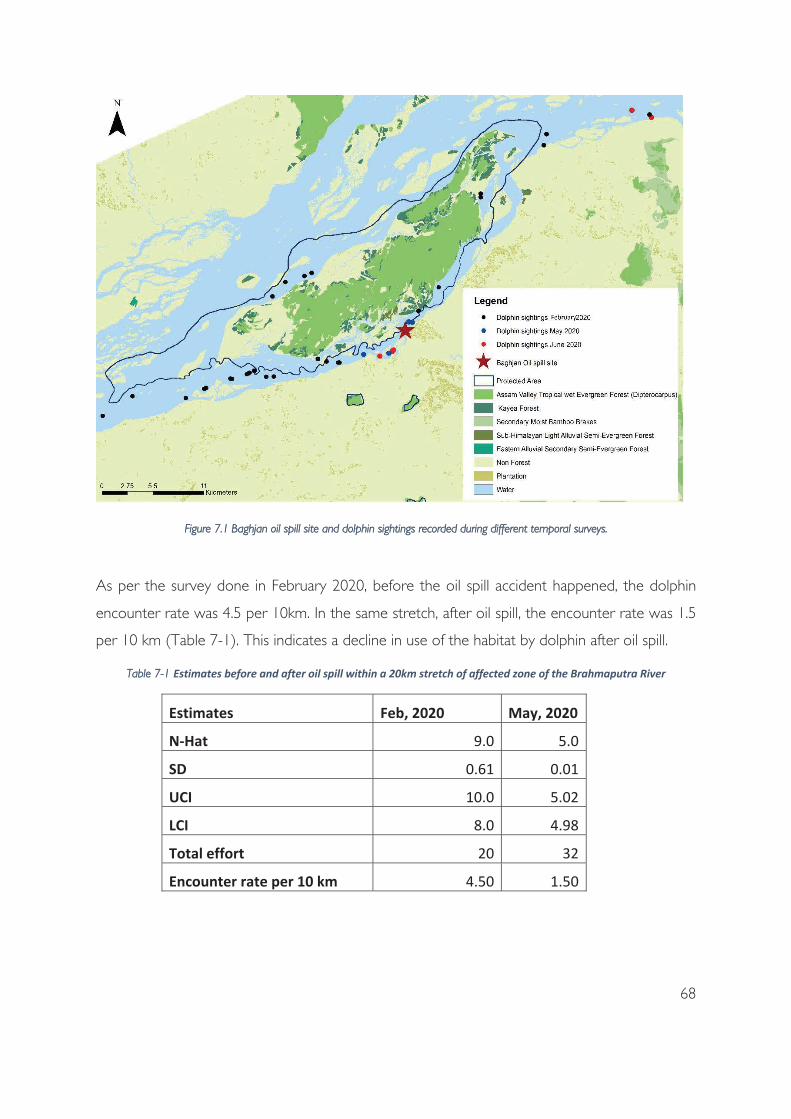
68
FFigure 7.1 Baghjan oil spill site and dolphin sightings recorded during different temporal surveys.
As per the survey done in February 2020, before the oil spill accident happened, the dolphin
encounter rate was 4.5 per 10km. In the same stretch, after oil spill, the encounter rate was 1.5
per 10 km (Table 7-1). This indicates a decline in use of the habitat by dolphin after oil spill.
Table 7-1

69
In June 2020 survey, we estimated a significantly lower encounter rate (0.48/ 10km stretch) in
the Lohit River (from Bhupen Hazarika Setu to Siang-Lohit confluence at Balijan), which shows
89% reduction (Table 7-2). While the previous surveys were carried out during low water
(winter) season, this particular survey was conducted during high water (monsoon) season. The
distribution pattern changes during monsoon as they are reported to move towards tributaries
to escape increasing water levels in the river main stem (Kasuya and Haque, 1972). In Dibru river,
5 dolphins were sighted in a 4 km stretch. But it is unlikely that the number solely declined at this
level in Lohit River due to migration. A decline in dolphin population solely due to increase in
water level is more likely to happen on northern side of Dibru-Saikhowa, in larger channel of
Brahmaputra, than in Lohit River.
Table 7-2 Estimates of Ganges dolphin population during previous surveys in Lohit- Dibru stretch of Brahmaputra River.
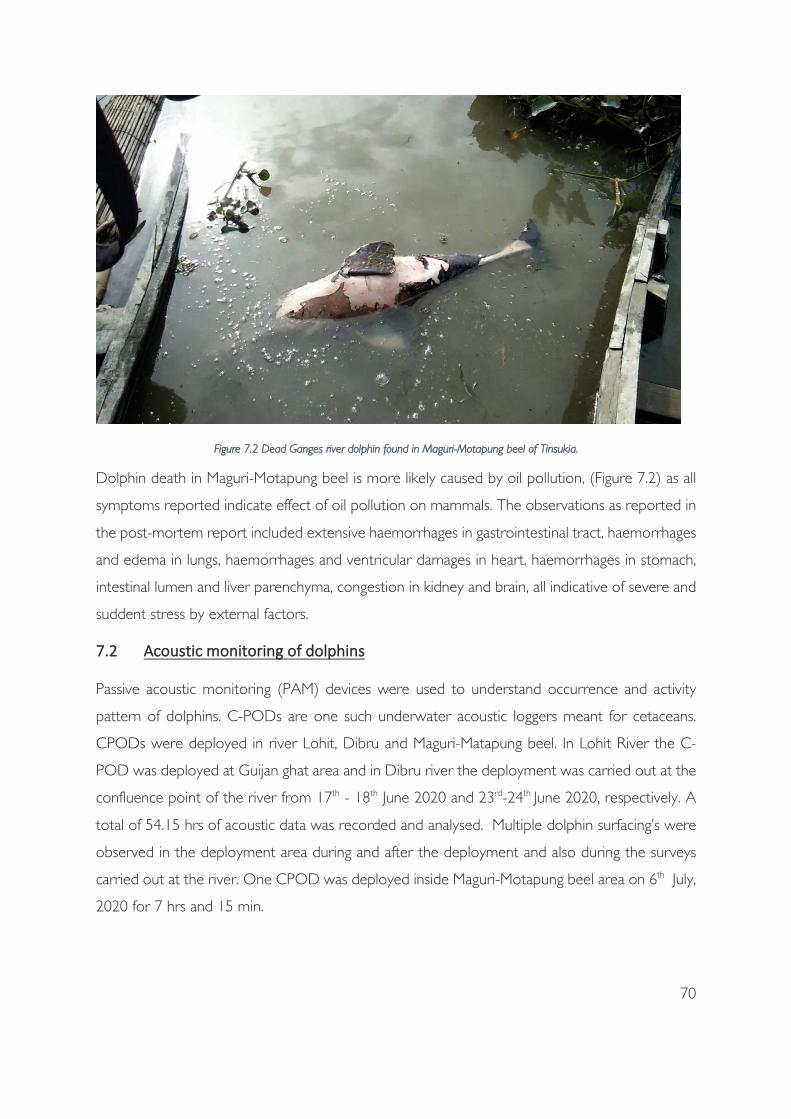
70
FFigure 7.2 Dead Ganges river dolphin found in Maguri-Motapung beel of Tinsukia.
Dolphin death in Maguri-Motapung beel is more likely caused by oil pollution, (Figure 7.2) as all
symptoms reported indicate effect of oil pollution on mammals. The observations as reported in
the post-mortem report included extensive haemorrhages in gastrointestinal tract, haemorrhages
and edema in lungs, haemorrhages and ventricular damages in heart, haemorrhages in stomach,
intestinal lumen and liver parenchyma, congestion in kidney and brain, all indicative of severe and
suddent stress by external factors.
Passive acoustic monitoring (PAM) devices were used to understand occurrence and activity
pattern of dolphins. C-PODs are one such underwater acoustic loggers meant for cetaceans.
CPODs were deployed in river Lohit, Dibru and Maguri-Matapung beel. In Lohit River the C-
POD was deployed at Guijan ghat area and in Dibru river the deployment was carried out at the
confluence point of the river from 17th - 18th June 2020 and 23rd-24th June 2020, respectively. A
total of 54.15 hrs of acoustic data was recorded and analysed. Multiple dolphin surfacing’s were
observed in the deployment area during and after the deployment and also during the surveys
carried out at the river. One CPOD was deployed inside Maguri-Motapung beel area on 6th July,
2020 for 7 hrs and 15 min.

71
During our study period there was no detection of dolphins in our passive acoustic monitoring
device (CPOD) which indicate the absence of dolphin inside the beel area during the study
period. But the Maguri-Motapung beel area during the study period. But (a) the presence of
dolphin in the Dibru river confluence area which was around 1.5 km downstream to the
deployment site at Maguri-Motapung beel, (b) secondary information from the villagers of sighting
of dolphins in beel area and (c) rescue location of dolphin carcass suggests that the beel area is
frequently using by dolphins during high water periods.
The diel activity pattern drawn using the number of clicks detected per minute in the dolphin
train shows that the dolphins are actively found in both the river Lohit and Dibru. In Lohit,
recording shows sparse detections of dolphins. In Dibru, recording had more dolphin click
detection than Lohit suggesting more active use of Dibru river than Lohit. The dolphins were
found to be using the Dibru river throughout the day with less detection in the morning hours
(Figure 7.3 & Figure 7.4). The most dominant frequency (maximum energy peak) was found to
be 57.31±16.01kHz in Dibru river and 56.77±11.67 kHz in Lohit river (Figure 7.6) The highest
frequency usage was found in Dibru river followed by Lohit river. The frequency shows a trimodal
frequency pattern. The average sound pressure level was 54.93±47.94 Pa in Lohit river,
77.10±53.31 Pa in Dibru river. (Figure 7.7). The maximum SPL usage by Ganges river dolphin in
Dibru river was 255 Pa and in Lohit river was 254 Pa. The number of click trains were found to
be more in Dibru river than lohit river (Figure 7.8).
FFigure 7.3 Density plot of diel activity patterns of Ganges river dolphins in Lohit river

72
FFigure 7.4 Density plot of diel activity patterns of Ganges river dolphins in Lohit river
Figure 7.5 Map showing the of the location of CPOD deployment at River Lohit and Dibru area and Maguri-Motapung Beel area
The dolphins were also found using the confluence area (Dibru river deployment area) almost
throughout the day (Figure 7.3). The deployment site being a confluence, with a linkage with
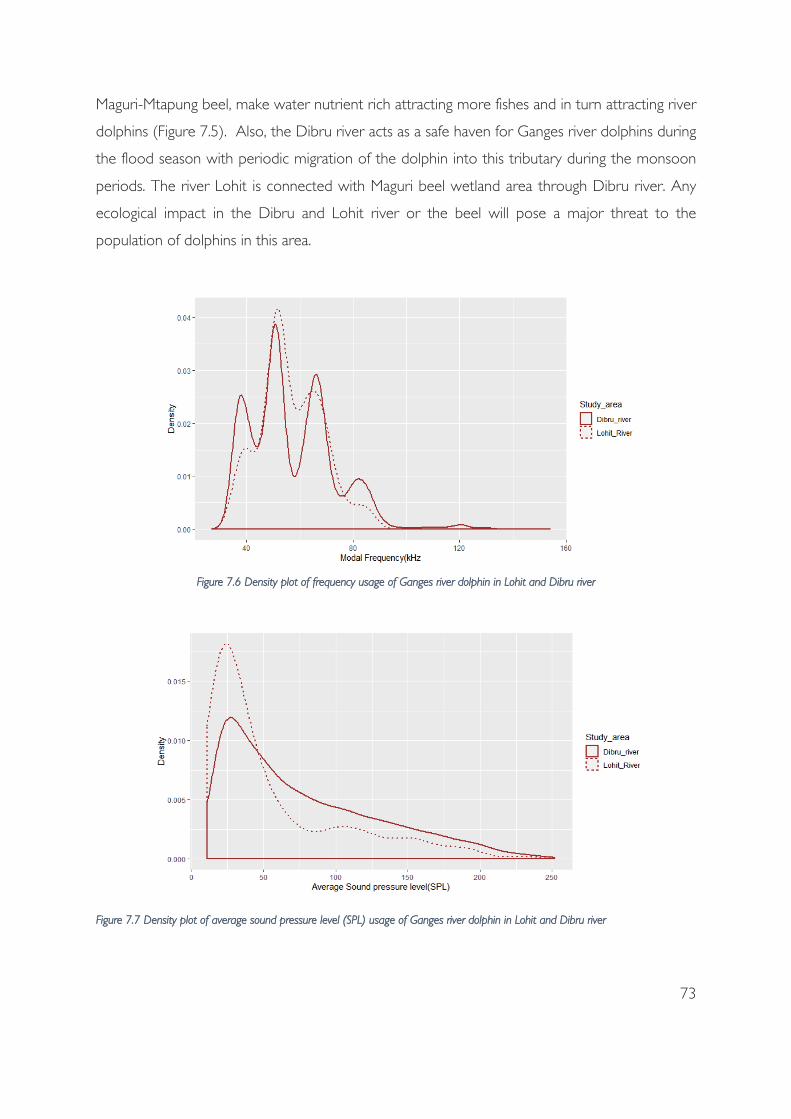
73
Maguri-Mtapung beel, make water nutrient rich attracting more fishes and in turn attracting river
dolphins (Figure 7.5). Also, the Dibru river acts as a safe haven for Ganges river dolphins during
the flood season with periodic migration of the dolphin into this tributary during the monsoon
periods. The river Lohit is connected with Maguri beel wetland area through Dibru river. Any
ecological impact in the Dibru and Lohit river or the beel will pose a major threat to the
population of dolphins in this area.
FFigure 7.6 Density plot of frequency usage of Ganges river dolphin in Lohit and Dibru river
Figure 7.7 Density plot of average sound pressure level (SPL) usage of Ganges river dolphin in Lohit and Dibru river
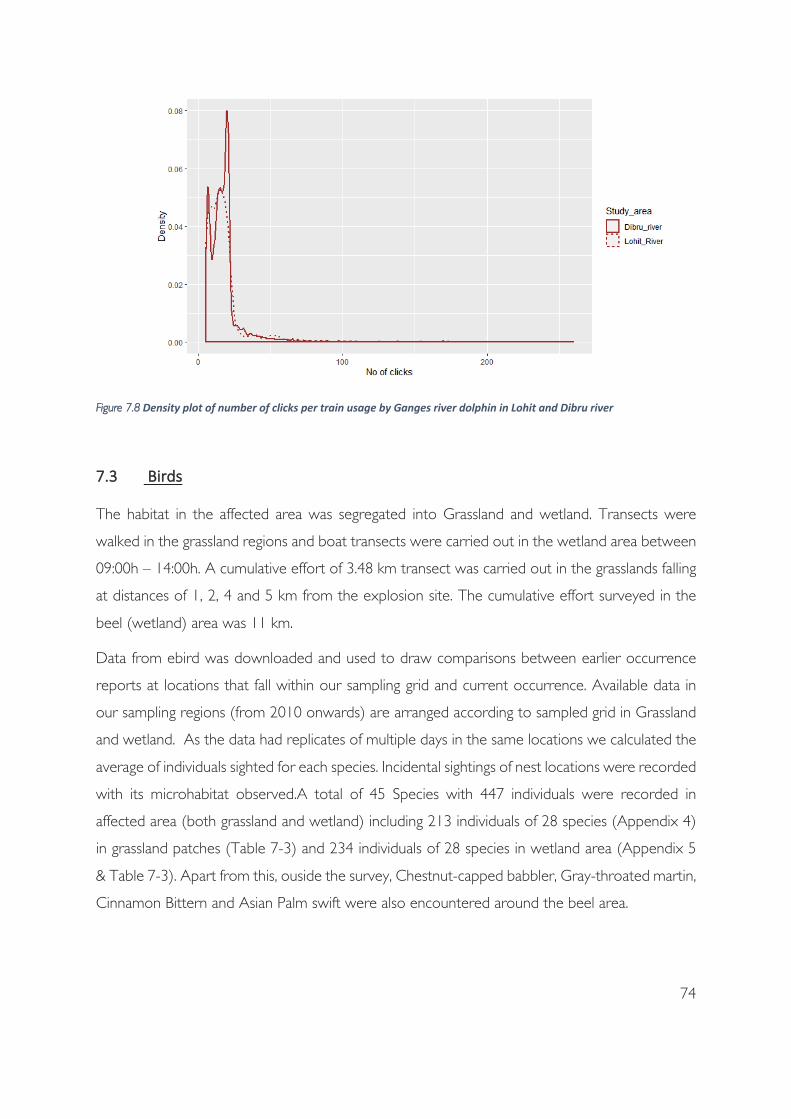
74
FFigure 7.8
The habitat in the affected area was segregated into Grassland and wetland. Transects were
walked in the grassland regions and boat transects were carried out in the wetland area between
09:00h – 14:00h. A cumulative effort of 3.48 km transect was carried out in the grasslands falling
at distances of 1, 2, 4 and 5 km from the explosion site. The cumulative effort surveyed in the
beel (wetland) area was 11 km.
Data from ebird was downloaded and used to draw comparisons between earlier occurrence
reports at locations that fall within our sampling grid and current occurrence. Available data in
our sampling regions (from 2010 onwards) are arranged according to sampled grid in Grassland
and wetland. As the data had replicates of multiple days in the same locations we calculated the
average of individuals sighted for each species. Incidental sightings of nest locations were recorded
with its microhabitat observed.A total of 45 Species with 447 individuals were recorded in
affected area (both grassland and wetland) including 213 individuals of 28 species (Appendix 4)
in grassland patches (Table 7-3) and 234 individuals of 28 species in wetland area (Appendix 5
& Table 7-3). Apart from this, ouside the survey, Chestnut-capped babbler, Gray-throated martin,
Cinnamon Bittern and Asian Palm swift were also encountered around the beel area.
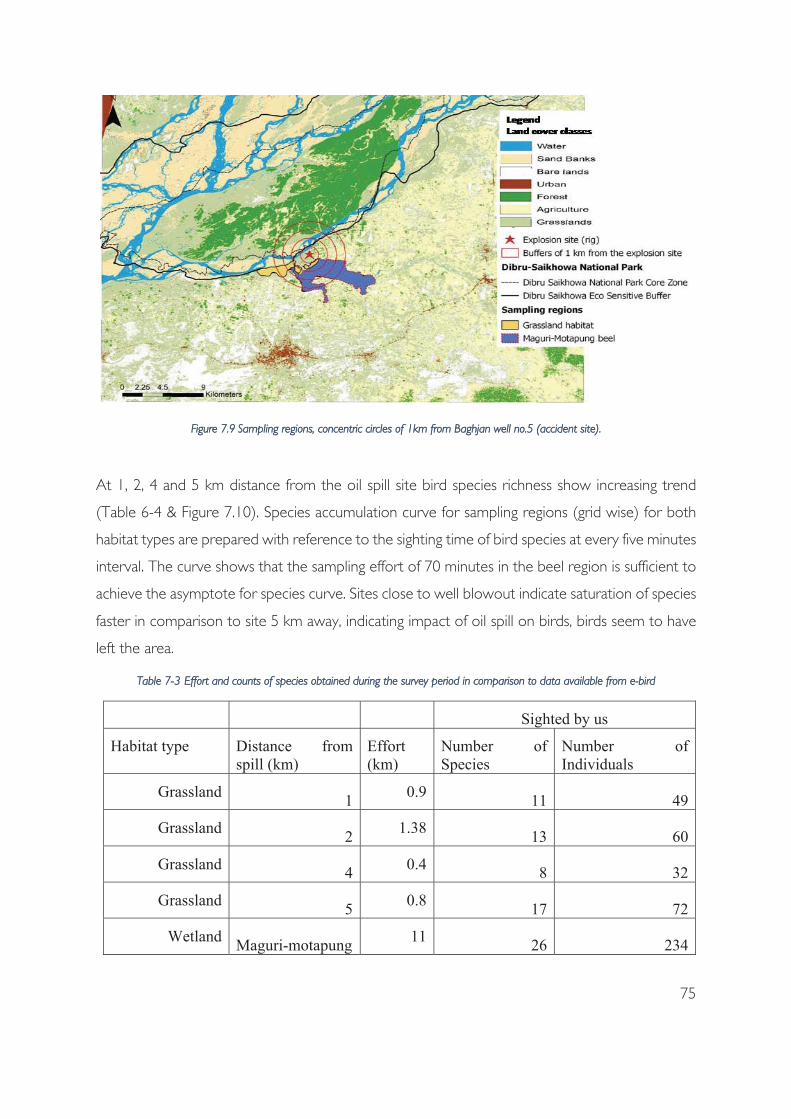
75
FFigure 7.9 Sampling regions, concentric circles of 1km from Baghjan well no.5 (accident site).
At 1, 2, 4 and 5 km distance from the oil spill site bird species richness show increasing trend
(Table 6-4 & Figure 7.10). Species accumulation curve for sampling regions (grid wise) for both
habitat types are prepared with reference to the sighting time of bird species at every five minutes
interval. The curve shows that the sampling effort of 70 minutes in the beel region is sufficient to
achieve the asymptote for species curve. Sites close to well blowout indicate saturation of species
faster in comparison to site 5 km away, indicating impact of oil spill on birds, birds seem to have
left the area.
Table 7-3 Effort and counts of species obtained during the survey period in comparison to data available from e-bird
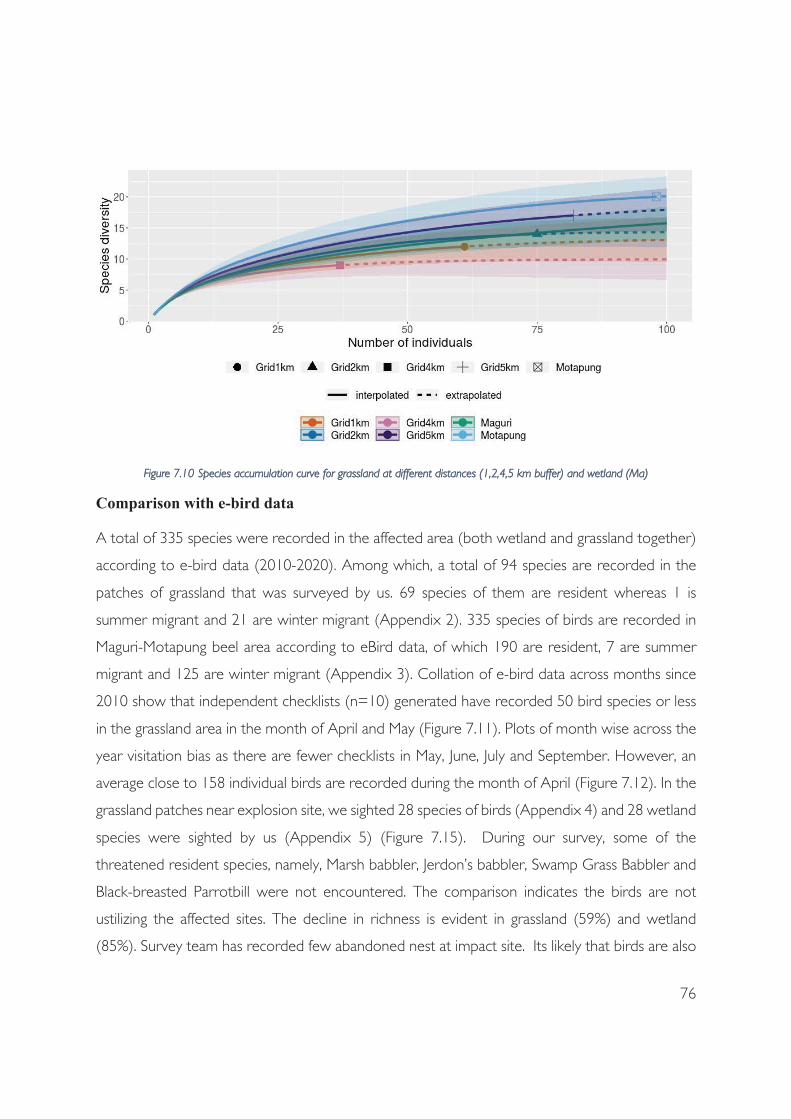
76
FFigure 7.10 Species accumulation curve for grassland at different distances (1,2,4,5 km buffer) and wetland (Ma)
A total of 335 species were recorded in the affected area (both wetland and grassland together)
according to e-bird data (2010-2020). Among which, a total of 94 species are recorded in the
patches of grassland that was surveyed by us. 69 species of them are resident whereas 1 is
summer migrant and 21 are winter migrant (Appendix 2). 335 species of birds are recorded in
Maguri-Motapung beel area according to eBird data, of which 190 are resident, 7 are summer
migrant and 125 are winter migrant (Appendix 3). Collation of e-bird data across months since
2010 show that independent checklists (n=10) generated have recorded 50 bird species or less
in the grassland area in the month of April and May (Figure 7.11). Plots of month wise across the
year visitation bias as there are fewer checklists in May, June, July and September. However, an
average close to 158 individual birds are recorded during the month of April (Figure 7.12). In the
grassland patches near explosion site, we sighted 28 species of birds (Appendix 4) and 28 wetland
species were sighted by us (Appendix 5) (Figure 7.15). During our survey, some of the
threatened resident species, namely, Marsh babbler, Jerdon’s babbler, Swamp Grass Babbler and
Black-breasted Parrotbill were not encountered. The comparison indicates the birds are not
ustilizing the affected sites. The decline in richness is evident in grassland (59%) and wetland
(85%). Survey team has recorded few abandoned nest at impact site. Its likely that birds are also
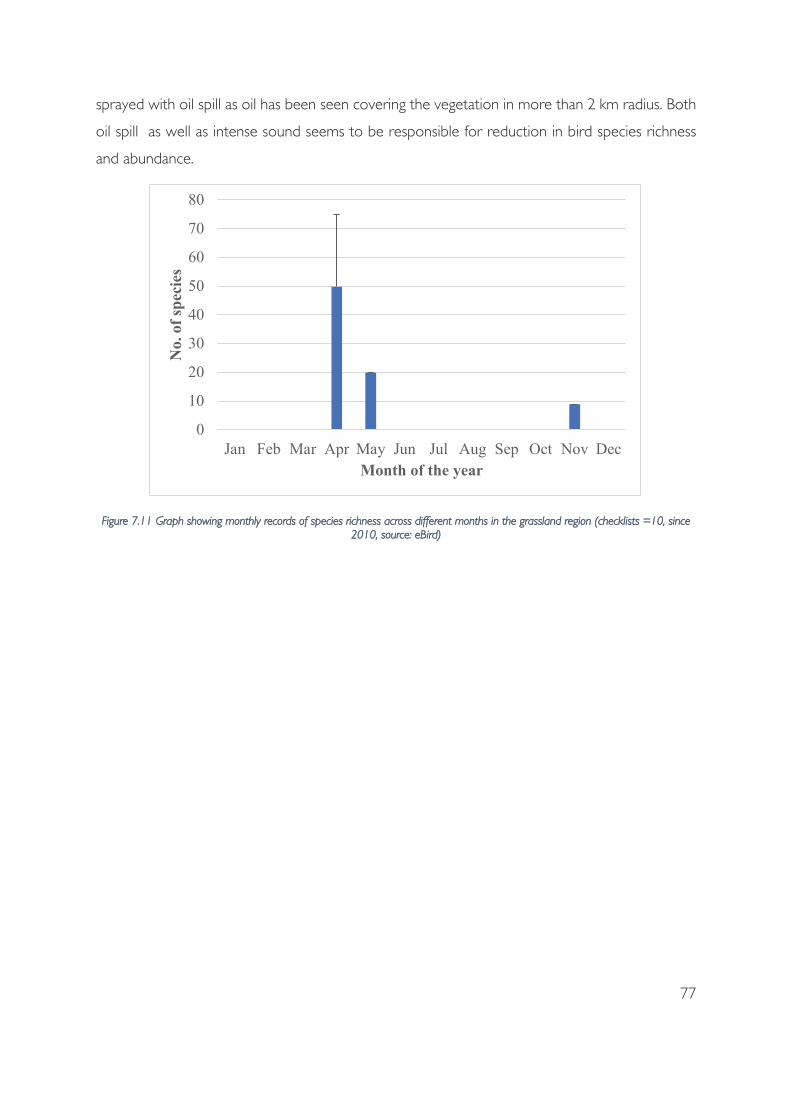
77
sprayed with oil spill as oil has been seen covering the vegetation in more than 2 km radius. Both
oil spill as well as intense sound seems to be responsible for reduction in bird species richness
and abundance.
FFigure 7.11 Graph showing monthly records of species richness across different months in the grassland region (checklists =10, since 2010, source: eBird)
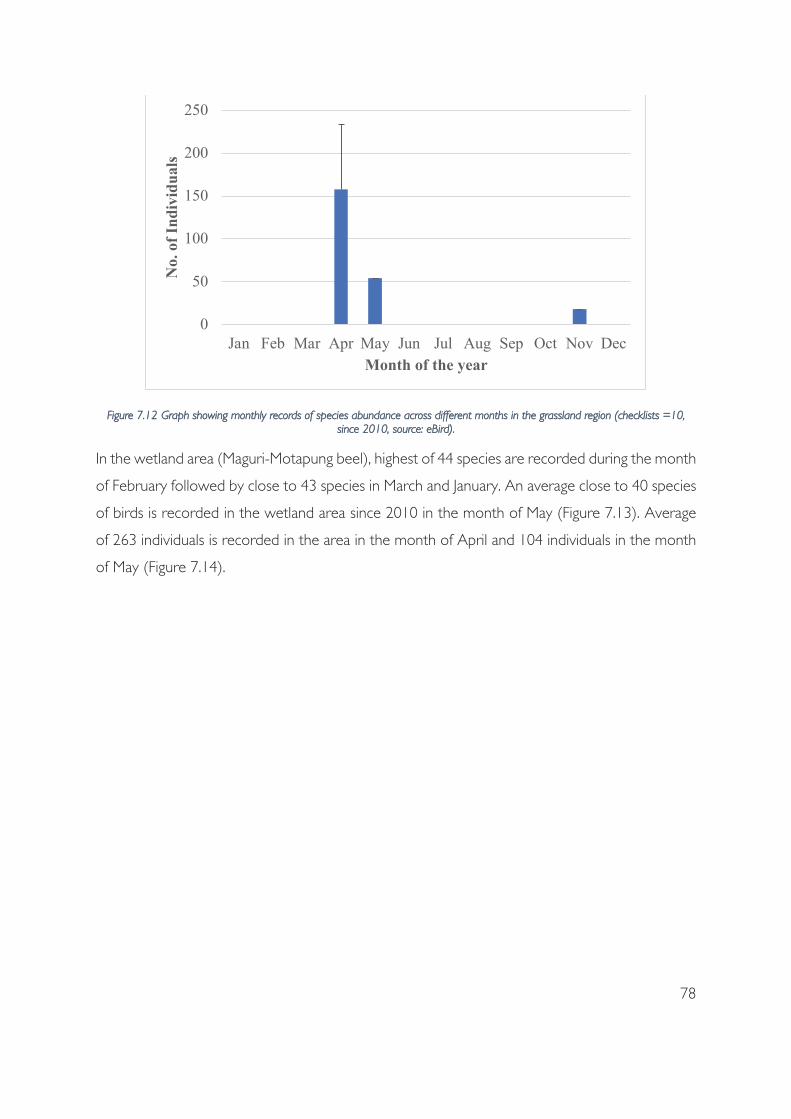
78
FFigure 7.12 Graph showing monthly records of species abundance across different months in the grassland region (checklists =10, since 2010, source: eBird).
In the wetland area (Maguri-Motapung beel), highest of 44 species are recorded during the month
of February followed by close to 43 species in March and January. An average close to 40 species
of birds is recorded in the wetland area since 2010 in the month of May (Figure 7.13). Average
of 263 individuals is recorded in the area in the month of April and 104 individuals in the month
of May (Figure 7.14).
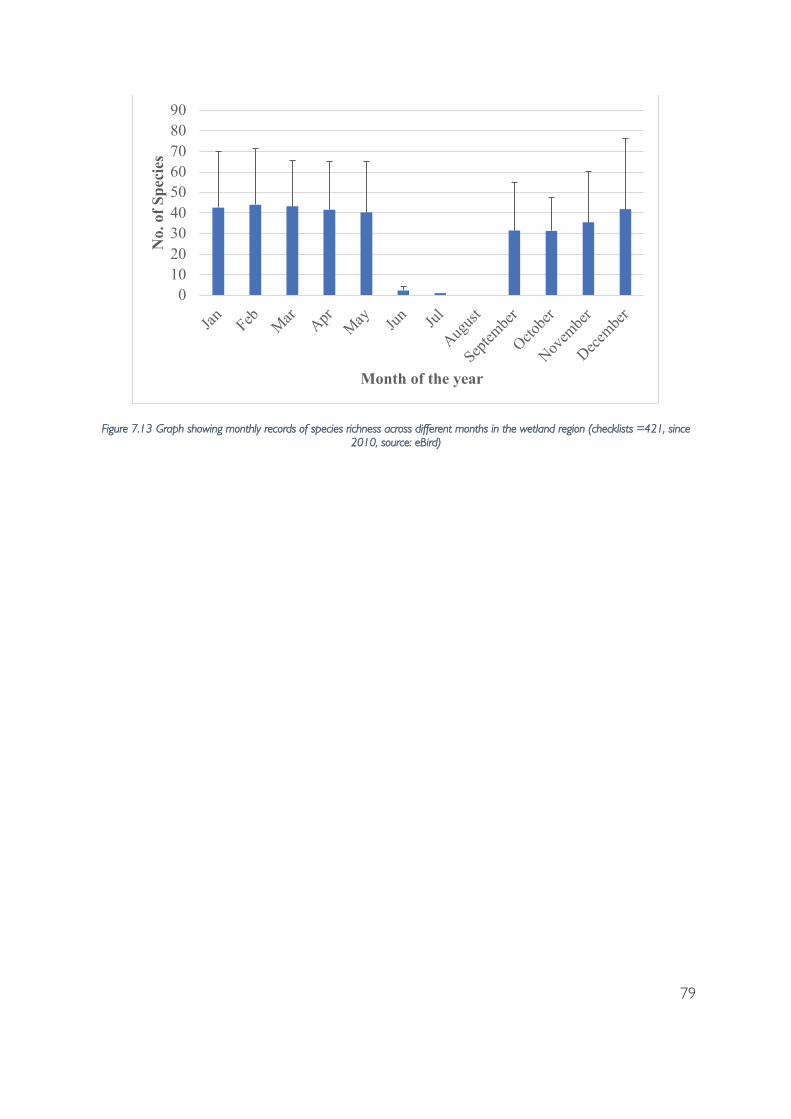
79
FFigure 7.13 Graph showing monthly records of species richness across different months in the wetland region (checklists =421, since 2010, source: eBird)

80
FFigure 7.14 Graph showing monthly records of species abundance across different months in the wetland region (checklists =421, since 2010, source: eBird).
Figure 7.15 Comparison of resident species encountered in the explosion site before (from 2010-2019 from e-bird) and after explosion (during this survey).
This region is potentially also a breeding or a nesting ground for many species. During the survey,
active as well as abandoned bird nests were observed and recorded (Table 7-4).
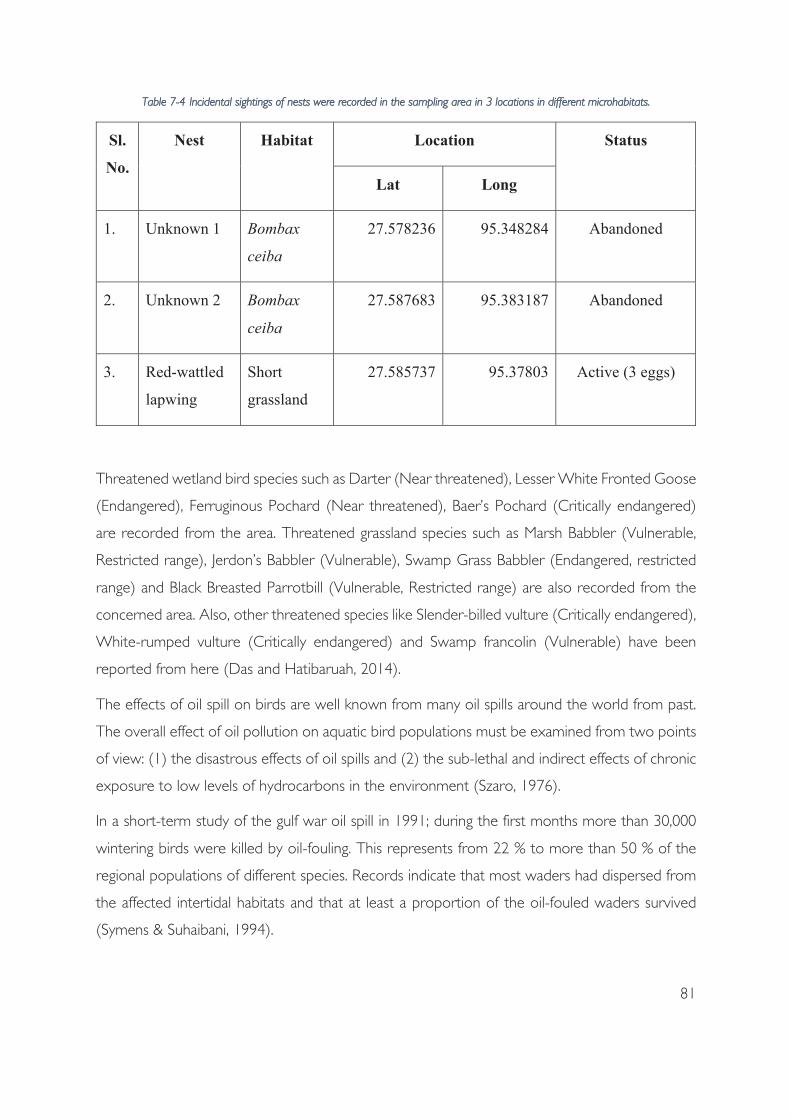
81
TTable 7-4 Incidental sightings of nests were recorded in the sampling area in 3 locations in different microhabitats.
Threatened wetland bird species such as Darter (Near threatened), Lesser White Fronted Goose
(Endangered), Ferruginous Pochard (Near threatened), Baer’s Pochard (Critically endangered)
are recorded from the area. Threatened grassland species such as Marsh Babbler (Vulnerable,
Restricted range), Jerdon’s Babbler (Vulnerable), Swamp Grass Babbler (Endangered, restricted
range) and Black Breasted Parrotbill (Vulnerable, Restricted range) are also recorded from the
concerned area. Also, other threatened species like Slender-billed vulture (Critically endangered),
White-rumped vulture (Critically endangered) and Swamp francolin (Vulnerable) have been
reported from here (Das and Hatibaruah, 2014).
The effects of oil spill on birds are well known from many oil spills around the world from past.
The overall effect of oil pollution on aquatic bird populations must be examined from two points
of view: (1) the disastrous effects of oil spills and (2) the sub-lethal and indirect effects of chronic
exposure to low levels of hydrocarbons in the environment (Szaro, 1976).
In a short-term study of the gulf war oil spill in 1991; during the first months more than 30,000
wintering birds were killed by oil-fouling. This represents from 22 % to more than 50 % of the
regional populations of different species. Records indicate that most waders had dispersed from
the affected intertidal habitats and that at least a proportion of the oil-fouled waders survived
(Symens & Suhaibani, 1994).

82
As the sampling area is an Eco Sensitive Zone and is a suitable habitat for more than 450 species
of resident and migratory birds and harbors 700 – 20000 individuals, this kind of oil explosion
can be disastrous for biodiversity. A total of 56 Species with 447 individuals were recorded during
sampling in affected area. The oil in the water and soil in the area might definitely harm the
species we found in the area. Moreover, the temperature of the fire and the high sound level in
and around the location can be very harmful for any species. The area holds many rare species
of birds also which should be taken in consideration as in 2014 Baikal bush warbler (Locustella
davidi) was recorded in Maguri beel which was its first record in India. It is also breeding season
for many birds and other species and their habitat should be in suitable condition. We found 3
nests in our sampling region in different habitats. Such oil spill and fire might destroy these nests
and breeding grounds for birds and other fauna. Comparison with resident birds reported on
eBird with our checklists indicate severae decline in use of grasslands and wetlands (Figure 7.15).
In long term study of the Exxon Valdez oil spill it was found that species richness was significantly
lower in the year of the oil spill for the same season even 1-2 year later, especially in heavily oiled
bays (Wiens, Crist, Day, Murphy, & Hayward, 1996). Species richness of several guilds of birds
feeding on or close to the shoreline was negatively related to initial oiling level (Wiens et al.,
1996). The richness of a guild of winter visitant and resident species showed the greatest negative
association with initial oiling. In winters, maguri beel also provides shelter and food to many
migratory birds every year. 309 species of birds were recorded in the affected area only in the
month of November, December, January, February and March according to Ebird data. In a short-
term case study on Peregrine Falcons after Prestige oil spill it was found that loss of clutches
during the incubation period increased significantly and was correlated with the loss of females.
The polycyclic aromatic hydrocarbon concentrations in the eggs, collected from five nests after
they were deserted, ranged from 21.20 ng/g to 461.08 ng/g, values which are high enough to
cause the death of the embryos and poisoning of adult birds (Zuberogoitia et al., 2006).
On examining trends of marine birds in the oiled and unoiled areas it was found that most taxa
for which injury was previously demonstrated were not recovering (Lance, Irons, Kendall, &
McDonald, 2001; McKnight et al., 2006). In a case study it was found that even after 10 years
harlequin duck population had not recovered (Esler et al., 2002). Similar status was seen for the
common scoter after the Sea Empress oil spill (Banks et al., 2008) were population fail to recover
after a decade. Guillemots populations remained depressed at oil spilled sites (Golet et al., 2002).
The reason for lack of recovery may be related to persistent oil remaining in the environment
83
(Lance et al., 2001). After the Prestige oil spill reproductive performance of Kentish plover was
lowered by reducing egg quality. Due to petroleum oil toxicosis. Microscopically, hemosiderin
deposits, related to cachexia and/or hemolytic anemia, were observed in those birds harboring
oil in the intestine (Balseiro et al., 2005). Migratory birds a ected by the oil spill experienced long
term flight impairment and delayed arrival to breeding, wintering, or crucial stopover sites and
subsequently su ered reductions in survival and reproductive success (Perez, Moye, Cacela,
Dean, & Pritsos, 2017).
Brahmaputra river sytem is rich in fish species due to diverse habitats, 229 species have been
reported, majority of the species belong to the order Cypriniformes (114 species), followed by
Siluriformes (57 species) and Perciformis (29 specie). One hundred and four species of fishes are
reported from Tinsukia-Dibrugarh area (Kalita, 2016).
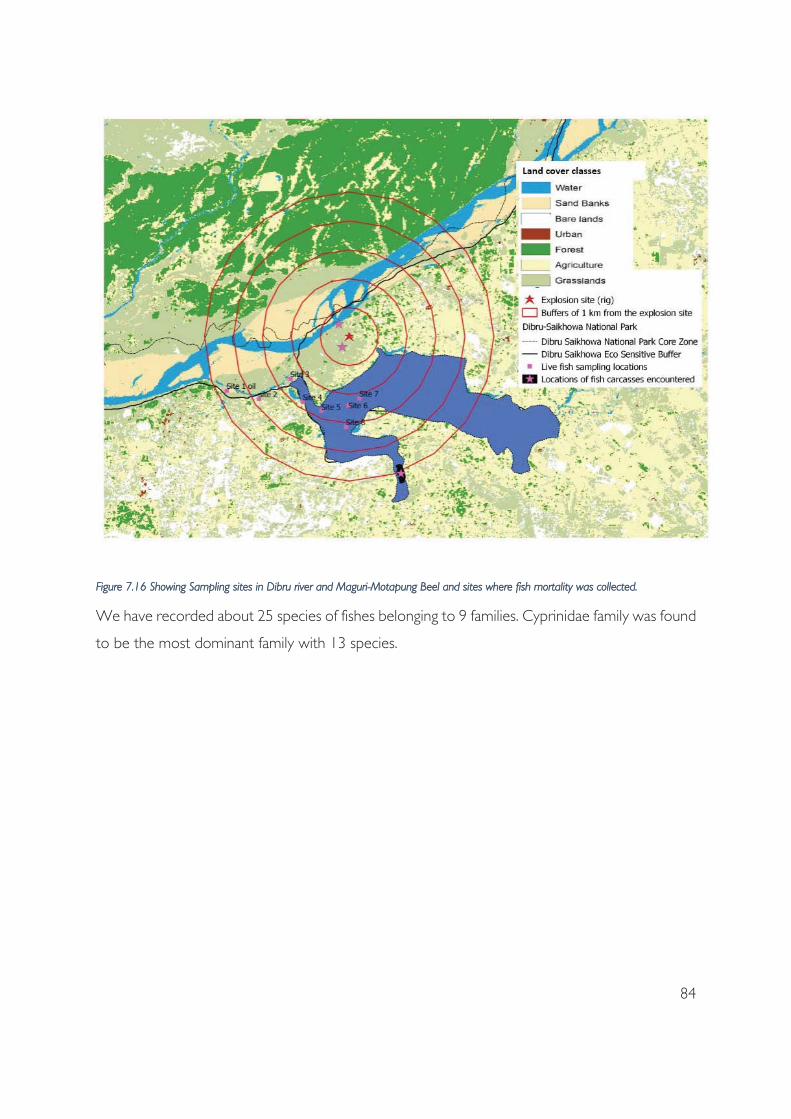
84
FFigure 7.16 Showing Sampling sites in Dibru river and Maguri-Motapung Beel and sites where fish mortality was collected.
We have recorded about 25 species of fishes belonging to 9 families. Cyprinidae family was found
to be the most dominant family with 13 species.

85
FFigure 7.17 Fish species richness in two categories of Dissolved Oxygen (DO), DO between 2-4 mg/l and DO equal or more than 5
mg/l.
Figure 7.18 Fish species richness in two categories of Dissolved Oxygen (DO), DO between 2-4 and DO equal or more than 5
Site 1, 2, 3 (Figure 7.16) are have high abundance of fishes as they are far from oil spill sites (2 to
4 km) compared to Site 4,5,6,7,8 which are stagnant pools or slow moving water and are near
wetland of Maguri beel where toxicity level is high.
These sites also have different DO levels. Fish species richness (Figure 7.17) and abundance
(Figure 7.18) significantly differ in poor (DO= 2-4) and better (DO=>5) sites. Richness declines
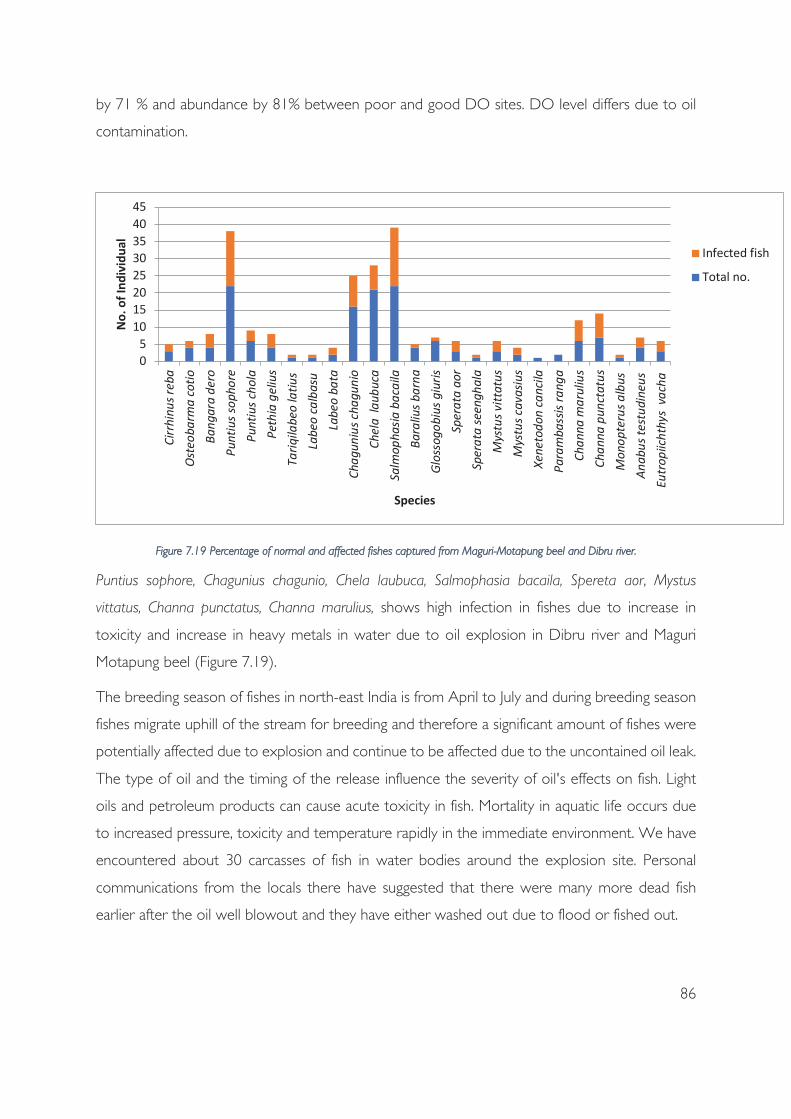
86
by 71 % and abundance by 81% between poor and good DO sites. DO level differs due to oil
contamination.
FFigure 7.19 Percentage of normal and affected fishes captured from Maguri-Motapung beel and Dibru river.
Puntius sophore, Chagunius chagunio, Chela laubuca, Salmophasia bacaila, Spereta aor, Mystus
vittatus, Channa punctatus, Channa marulius, shows high infection in fishes due to increase in
toxicity and increase in heavy metals in water due to oil explosion in Dibru river and Maguri
Motapung beel (Figure 7.19).
The breeding season of fishes in north-east India is from April to July and during breeding season
fishes migrate uphill of the stream for breeding and therefore a significant amount of fishes were
potentially affected due to explosion and continue to be affected due to the uncontained oil leak.
The type of oil and the timing of the release influence the severity of oil's effects on fish. Light
oils and petroleum products can cause acute toxicity in fish. Mortality in aquatic life occurs due
to increased pressure, toxicity and temperature rapidly in the immediate environment. We have
encountered about 30 carcasses of fish in water bodies around the explosion site. Personal
communications from the locals there have suggested that there were many more dead fish
earlier after the oil well blowout and they have either washed out due to flood or fished out.
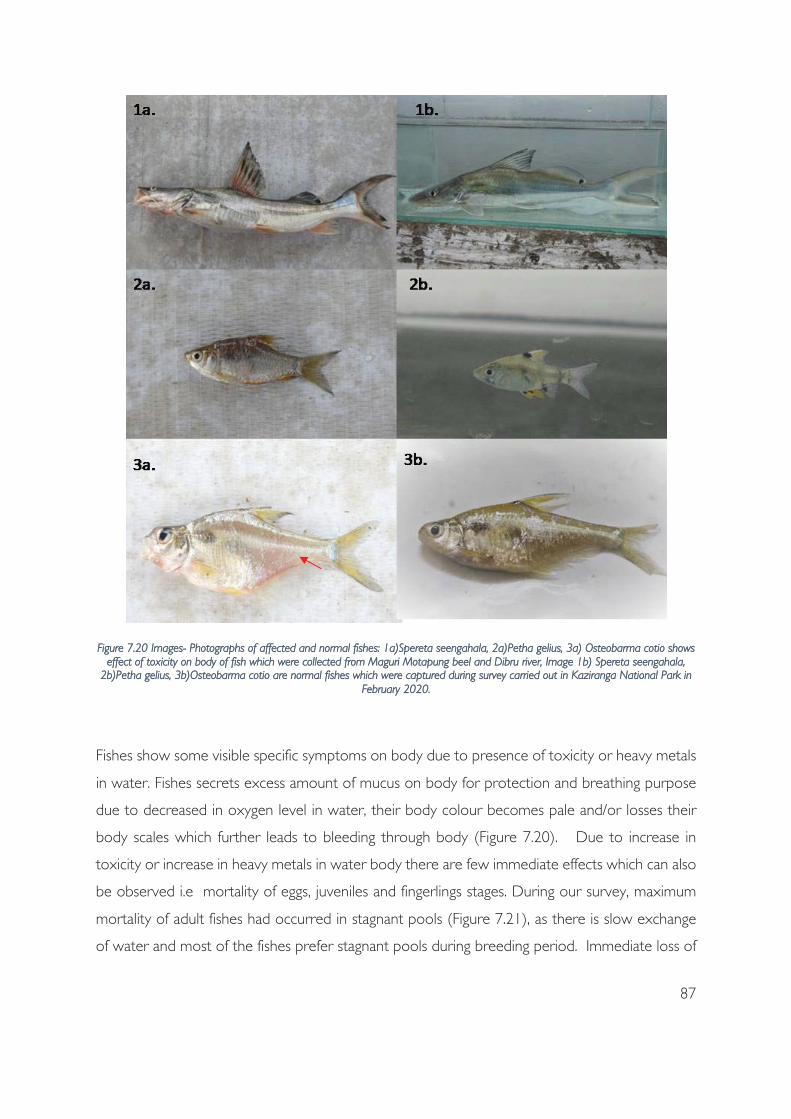
87
FFigure 7.20 Images- Photographs of affected and normal fishes: 1a)Spereta seengahala, 2a)Petha gelius, 3a) Osteobarma cotio shows effect of toxicity on body of fish which were collected from Maguri Motapung beel and Dibru river, Image 1b) Spereta seengahala,
2b)Petha gelius, 3b)Osteobarma cotio are normal fishes which were captured during survey carried out in Kaziranga National Park in February 2020.
Fishes show some visible specific symptoms on body due to presence of toxicity or heavy metals
in water. Fishes secrets excess amount of mucus on body for protection and breathing purpose
due to decreased in oxygen level in water, their body colour becomes pale and/or losses their
body scales which further leads to bleeding through body (Figure 7.20). Due to increase in
toxicity or increase in heavy metals in water body there are few immediate effects which can also
be observed i.e mortality of eggs, juveniles and fingerlings stages. During our survey, maximum
mortality of adult fishes had occurred in stagnant pools (Figure 7.21), as there is slow exchange
of water and most of the fishes prefer stagnant pools during breeding period. Immediate loss of
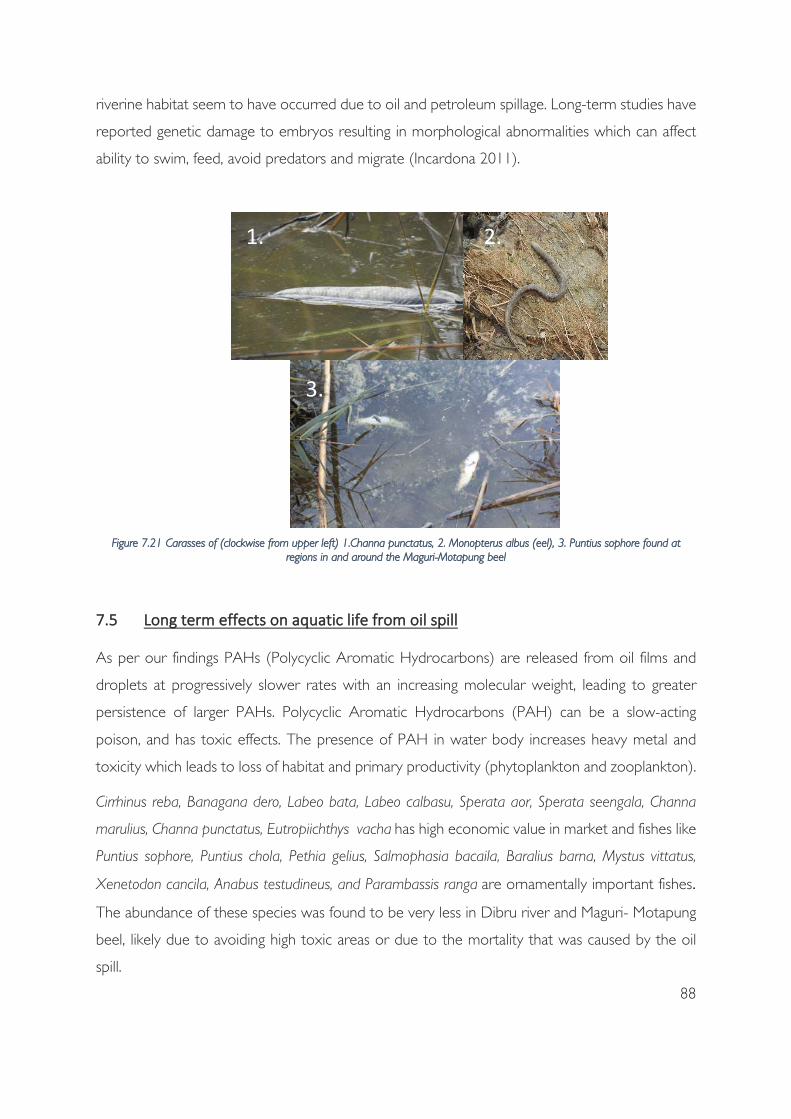
88
riverine habitat seem to have occurred due to oil and petroleum spillage. Long-term studies have
reported genetic damage to embryos resulting in morphological abnormalities which can affect
ability to swim, feed, avoid predators and migrate (Incardona 2011).
FFigure 7.21 Carasses of (clockwise from upper left) 1.Channa punctatus, 2. Monopterus albus (eel), 3. Puntius sophore found at
regions in and around the Maguri-Motapung beel
As per our findings PAHs (Polycyclic Aromatic Hydrocarbons) are released from oil films and
droplets at progressively slower rates with an increasing molecular weight, leading to greater
persistence of larger PAHs. Polycyclic Aromatic Hydrocarbons (PAH) can be a slow-acting
poison, and has toxic effects. The presence of PAH in water body increases heavy metal and
toxicity which leads to loss of habitat and primary productivity (phytoplankton and zooplankton).
Cirrhinus reba, Banagana dero, Labeo bata, Labeo calbasu, Sperata aor, Sperata seengala, Channa
marulius, Channa punctatus, Eutropiichthys vacha has high economic value in market and fishes like
Puntius sophore, Puntius chola, Pethia gelius, Salmophasia bacaila, Baralius barna, Mystus vittatus,
Xenetodon cancila, Anabus testudineus, and Parambassis ranga are ornamentally important fishes
The abundance of these species was found to be very less in Dibru river and Maguri- Motapung
beel, likely due to avoiding high toxic areas or due to the mortality that was caused by the oil
spill.
89
The oil well blowout has certainly caused loss of riverine habitat in its surrounding regions, caused
considerable mortality in fishes and livelihood of people and could have long-term impacts as
well.
The type of oil and the timing of the release influence the severity of oil's effects on fish. Fish eggs
and larvae are, in general, more vulnerable to oil spills than adult fish, partly due to their intrinsically
higher sensitivity to oil toxicity, even to short (2 – 24 hour) exposures to 50 μg/L of the water
soluble fraction of crude oil (Føyn and Serigstad 1989). Long-term exposure of fish embryos to
weathered oil (3- to 5-ringed PAHs) at ppb concentrations has population consequences through
indirect effects on growth, deformities, and behavior with long-term consequences on mortality
and reproduction (Charles H. Peterson et al.,2003). The Exxon Valdez spill had long-lasting
ecosystem impacts on neritic and pelagic habitats in Prince William Sound, causing increased
mortality in developing pink salmon for several years after the spill (Rice et al., 2001).
Research spanning the past two decades has revealed a common form of injury among teleost
embryos exposed to crude oil. Cardiotoxicity is generally the most sensitive phenotype, and this
is primarily evident as fluid accumulation (oedema) in the pericardial space or yolk sac. This loss
of circulatory function and corresponding change in morphology has been documented for
several different crude oils, including Alaska North Slope, Mesa light, Iranian heavy, and Bass Strait
(Couillard, 2002; Incardona et al., 2005; Jung et al., 2013; Pollino and Holdway, 2002) across a
range of freshwater and marine species, including mummichog (Fundulus heteroclitus (Couillard,
2002)), zebrafish (Danio rerio (Carls et al., 2008; Incardona et al., 2005)), rainbowfish
(Melanotaenia fluviatilis (Pollino and Holdway, 2002)), pink salmon (Oncorhynchus gorbuscha
(Marty et al., 1997b)), and Pacific herring (Clupea pallasi (Carls et al., 1999; Incardona et al., 2009)).
Many of the gross morphological features of the crude oil cardiac toxicity syndrome can be
attributed to secondary consequences of reduced circulatory function or heart failure (Incardona
et al., 2004). Chronic toxicity and stress may also reduce fecundity and survival through increased
susceptibility to predation, parasite infestation, and zoonotic diseases. The frequency of a single
symptom does not necessarily reflect the effects of oil on the organism, so the cumulative effects
of all symptoms of toxicity must be considered in evaluating acute and chronic effects of oil on
fish (Heintz et al., 2000). Contaminant exposure can make a spawning site unavailable for multiple
generations if the oil is detectable by the fish. (Cheung et al., 2009).

90
The overall impact of oil spill recorded following impacts; mortality of eggs and immature stages,
effects on organs, tissues and gills, physiological dysfunction, stress and altered respiration,
irregular or reduced heart rate, fluid accumulation, effect on swimming, feeding, reproductive and
migratory behaviours genetic damage to embryos resulting in morphological abnormalities,
displacement of individuals or portions of a population from preferred habitat (Nahrgang et al.,
2010; Boertmann, Mosbech, and Johansen, 1998; Jonsson et al., 2010; Pearson, Woodruff, and
Sugarman, 1984). Pinto, Pearson, and Anderson, 1984; Moles and Wade, 2001; Heintz et al.,
2000; Christiansen and George, 1995; Mahon, Addison, and Willis, 1987; Ott, Peterson, and Rice,
2001; Rice et al., 2000; Carls, Harris, and Rice, 2004; Short et al., 2004; Peterson et al., 2003)
For butterfly sampling a team of one observer and a recorder surveyed the designated grid for a
pre-determined time of 20 minutes between 0900h to 1400h. Between two spatial sets of the
time-constrained survey, a checklist of species sighted was generated at a point between the two
spatial sets. A time constrained survey of three spatially independent sets of 20 minutes each
were carried out in one of the grids (2 km from the rig, short-tall grassland interspersed with
water puddles) for sampling odonates. The dragonflies and damselflies were photographed in the
field and sometimes caught with a net and released without harming the individual after
identification. A checklist was generated of species encountered between the spatial sets.
A total of 96 individuals belonging to 41 species of butterflies have been sighted from both the
time constrained survey and the checklist generated at the sampled point (Appendix 7). The
number of individuals sighted appears to linearly increase from the site of explosion until 5 km in
the regions sampled (Figure 7.22). Species accumulation curve for 5 mins show that grids closer
to the explosion site saturated earlier than the grids away from the explosion site (Figure 7.23).
The habitats of all the grids sampled were similar; grids at 1km, 2km, 4km and 5km were short
grassland, short-tall grassland, tall grassland-shrubland and short grassland-Agriculture,
respectively. Our survey team has found carcasses of burnt odonates as well as live ones with oil
film on wings
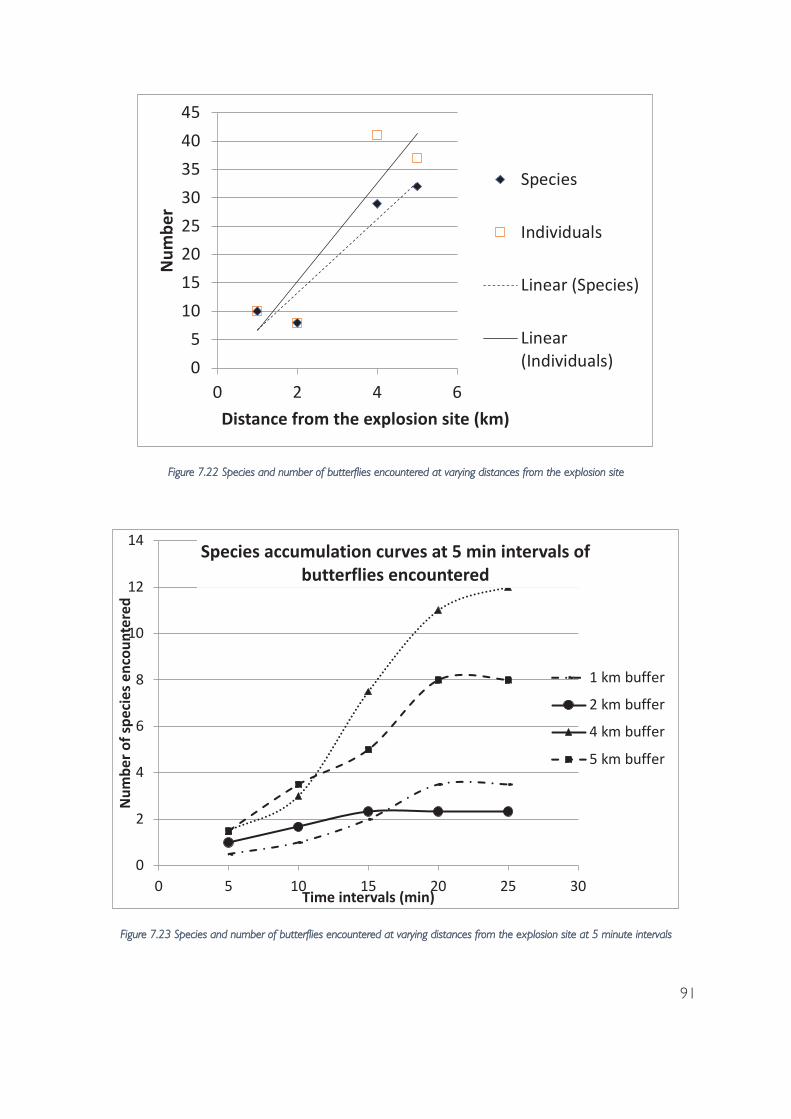
91
FFigure 7.22 Species and number of butterflies encountered at varying distances from the explosion site
Figure 7.23 Species and number of butterflies encountered at varying distances from the explosion site at 5 minute intervals

92
A total of 34 individuals of 13 species of odonates were sighted during the survey (Appendix 8),
and the IUCN status of all the species are Least Concern. Personal observations on field revealed
the presence of oil film on wings of green marsh hawk and ditch jewel dragonfly and a carcass of
a scarlet skimmer species with oil film on wings (Figure 7.24) were found.
The butterflies are very sensitive to minute changes in the ecosystem. Though the studies on
impacts of oil spill on butterflies have been highly neglected, it may have direct or indirect effects
on the population of butterflies. Different species prefer specific plant species as their host plants.
The blowout and explosion resulted in severe damage to the vegetation of surrounding area
including several host plants of butterflies. This may affect the oviposition, larval and pupal stages
of butterflies. We also encountered several dead specimens of butterflies during our survey. In
the area we surveyed, three species which are protected under Schedule II of the Wildlife
(Protection) Act, 1972, are found, shows the importance of the area for butterfly conservation.
However, to know the extent of effect of the incident on butterflies and their host plants short
term and long-term impact assessment studies are needed in the area.
FFigure 7.24 Carcass of scarlet skimmer with visible coating of oil on the wings
The dragonfly and damselfly spend the larval stages in water. A minute change in the water bodies
can have effects on the eggs and larva of dragonflies and damselflies. Due to oil deposition in
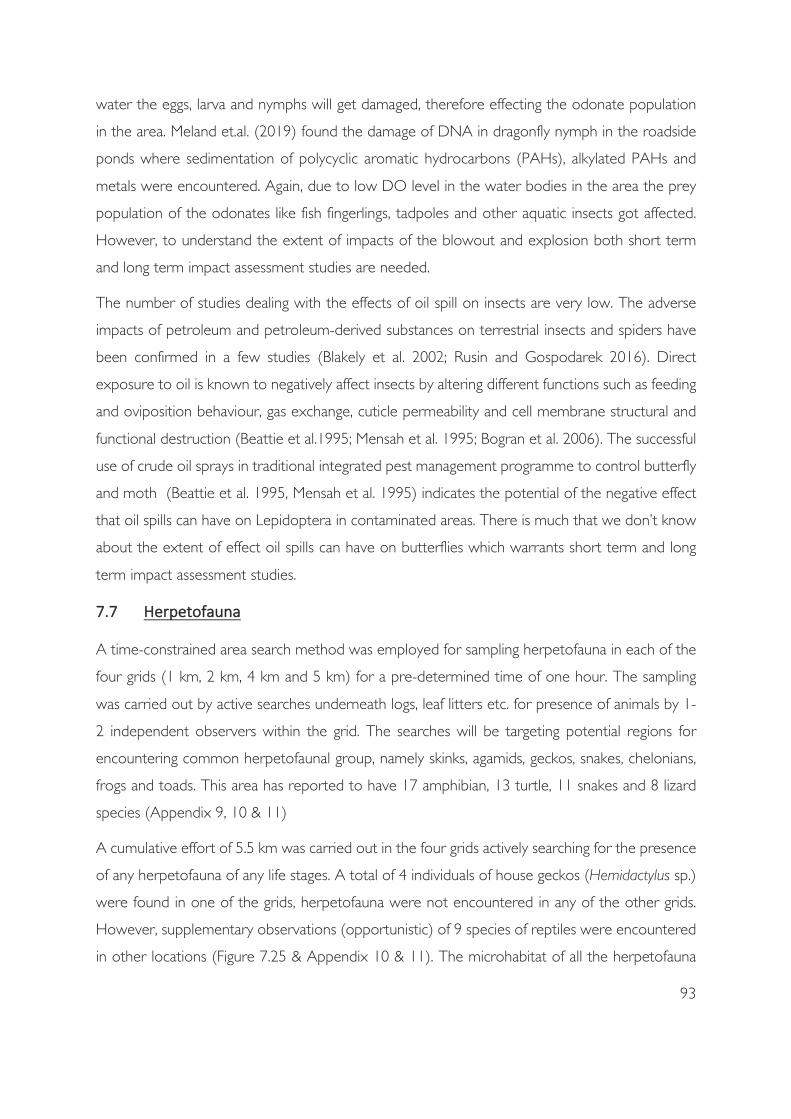
93
water the eggs, larva and nymphs will get damaged, therefore effecting the odonate population
in the area. Meland et.al. (2019) found the damage of DNA in dragonfly nymph in the roadside
ponds where sedimentation of polycyclic aromatic hydrocarbons (PAHs), alkylated PAHs and
metals were encountered. Again, due to low DO level in the water bodies in the area the prey
population of the odonates like fish fingerlings, tadpoles and other aquatic insects got affected.
However, to understand the extent of impacts of the blowout and explosion both short term
and long term impact assessment studies are needed.
The number of studies dealing with the effects of oil spill on insects are very low. The adverse
impacts of petroleum and petroleum-derived substances on terrestrial insects and spiders have
been confirmed in a few studies (Blakely et al. 2002; Rusin and Gospodarek 2016). Direct
exposure to oil is known to negatively affect insects by altering different functions such as feeding
and oviposition behaviour, gas exchange, cuticle permeability and cell membrane structural and
functional destruction (Beattie et al.1995; Mensah et al. 1995; Bogran et al. 2006). The successful
use of crude oil sprays in traditional integrated pest management programme to control butterfly
and moth (Beattie et al. 1995, Mensah et al. 1995) indicates the potential of the negative effect
that oil spills can have on Lepidoptera in contaminated areas. There is much that we don’t know
about the extent of effect oil spills can have on butterflies which warrants short term and long
term impact assessment studies.
A time-constrained area search method was employed for sampling herpetofauna in each of the
four grids (1 km, 2 km, 4 km and 5 km) for a pre-determined time of one hour. The sampling
was carried out by active searches underneath logs, leaf litters etc. for presence of animals by 1-
2 independent observers within the grid. The searches will be targeting potential regions for
encountering common herpetofaunal group, namely skinks, agamids, geckos, snakes, chelonians,
frogs and toads. This area has reported to have 17 amphibian, 13 turtle, 11 snakes and 8 lizard
species (Appendix 9, 10 & 11)
A cumulative effort of 5.5 km was carried out in the four grids actively searching for the presence
of any herpetofauna of any life stages. A total of 4 individuals of house geckos (Hemidactylus sp.)
were found in one of the grids, herpetofauna were not encountered in any of the other grids.
However, supplementary observations (opportunistic) of 9 species of reptiles were encountered
in other locations (Figure 7.25 & Appendix 10 & 11). The microhabitat of all the herpetofauna

94
found, including those found in the grid was human-habitation that had not burnt (Figure 7.25).
Reports of Euphlyctis cyanophlyctis (Common skittering frog) in beel in 2018 is reported
(iNaturalist, 2018). Though this one is a common species widely distributed across waters of
different quality, not an individual was found in the regions sampled. A species thought to be
extinct in wild was also rescued in a tea estate close by, the black soft-shell turtle Nilssonia nigricans
(news report by Mubina Akhtar, 2020). There are also reports of the river banks of Dibru-
Saikhowa National Park harbouring endangered species of turtles and also possibly their breeding.
Some of these include the endangered Chitra indica (Gray, 1831), an endangered and a rarely
sighted species, Nilsonnia gangeticus (Cuvier, 1825), a vulnerable and a frequently traded species,
Cuora amboinensis (Daudin, 1802), a vulnerable and a declining species with this National Park
being one of the strong holds of the wild population, Cyclemys gemeli Fritz, Guicking, Auer,
Sommer, Wink and Hundsdorfer, 2008, Pangshura tecta (Gray, 1831), Pangshura tentoria (Gray,
1834), a not evaluated and a poorly known species, Pangshura sylhetensis (Jerdon, 1870), an
endangered and a protected species and Melanochelys tricarinata (Blyth, 1856), a vulnerable
species whose populations are restricted to protected areas (Ahmed and Das, 2010).
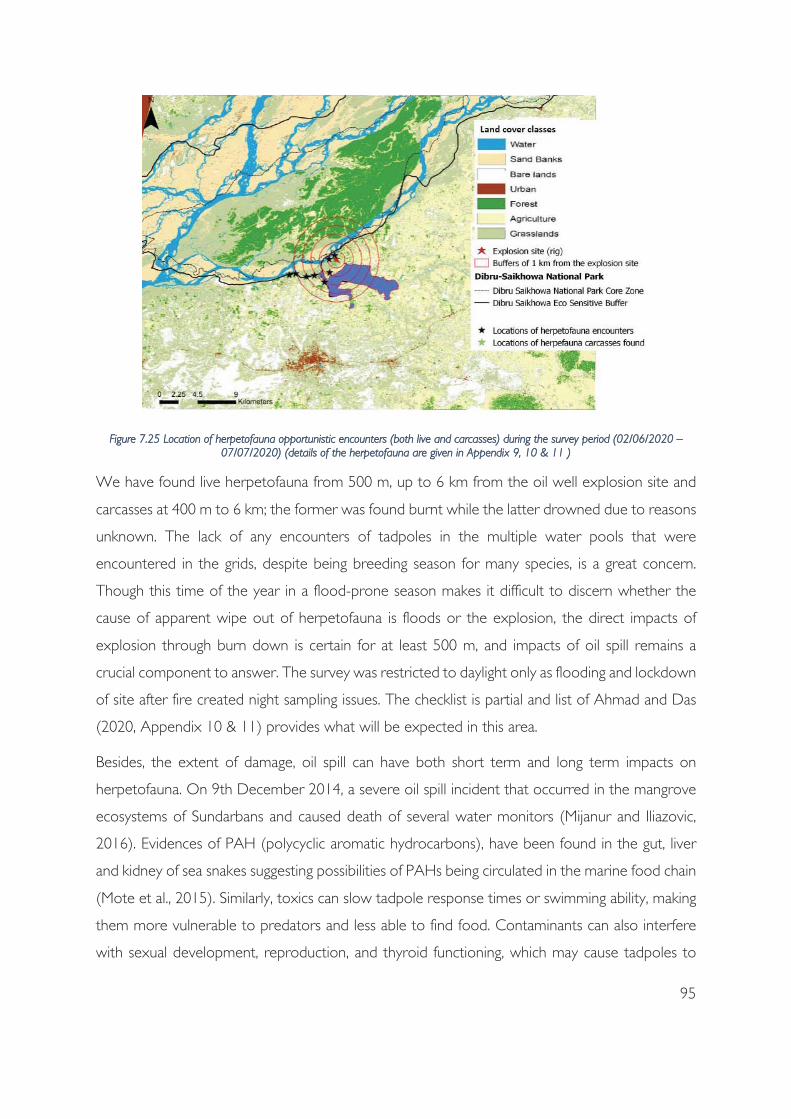
95
FFigure 7.25 Location of herpetofauna opportunistic encounters (both live and carcasses) during the survey period (02/06/2020 – 07/07/2020) (details of the herpetofauna are given in Appendix 9, 10 & 11 )
We have found live herpetofauna from 500 m, up to 6 km from the oil well explosion site and
carcasses at 400 m to 6 km; the former was found burnt while the latter drowned due to reasons
unknown. The lack of any encounters of tadpoles in the multiple water pools that were
encountered in the grids, despite being breeding season for many species, is a great concern.
Though this time of the year in a flood-prone season makes it difficult to discern whether the
cause of apparent wipe out of herpetofauna is floods or the explosion, the direct impacts of
explosion through burn down is certain for at least 500 m, and impacts of oil spill remains a
crucial component to answer. The survey was restricted to daylight only as flooding and lockdown
of site after fire created night sampling issues. The checklist is partial and list of Ahmad and Das
(2020, Appendix 10 & 11) provides what will be expected in this area.
Besides, the extent of damage, oil spill can have both short term and long term impacts on
herpetofauna. On 9th December 2014, a severe oil spill incident that occurred in the mangrove
ecosystems of Sundarbans and caused death of several water monitors (Mijanur and Iliazovic,
2016). Evidences of PAH (polycyclic aromatic hydrocarbons), have been found in the gut, liver
and kidney of sea snakes suggesting possibilities of PAHs being circulated in the marine food chain
(Mote et al., 2015). Similarly, toxics can slow tadpole response times or swimming ability, making
them more vulnerable to predators and less able to find food. Contaminants can also interfere
with sexual development, reproduction, and thyroid functioning, which may cause tadpoles to

96
grow but not undergo metamorphosis. They can also impair immune functions, making tadpoles
or juvenile frogs more vulnerable to disease (Sparling et al., 2010). Amphibians are one of the
sensitive taxa, especially their skin with many also having cutaneous respiration. Any oil film that
covers the skin is likely to cause a reduction in their respiration rates. Similarly, reptiles already
suffer from lack of large scale data (40 % remain not evaluated by the IUCN with 16% of the
evaluated ones stand as Data Deficient, IUCN, 2017) and communal myths and illegal trade that
threaten their lives across India. There are few habitats where the diversity and populations of
herpetofauna can flourish. Preserving these habitats is imperative to retaining our biodiversity
value. Dibru-Saikhowa Biosphere Reserve that includes the core zone of the National Park and
the Maguri-Motapung beel is recognized for the same purpose. Any potential hazards in this
region threatens one of the strong holds of population of at least 9 species of chelonians (turtles
and tortoises; Ahmed and Das, 2010), among the 42 species of reptiles and 17 species of
amphibians that inhabit this region (Nongmaithem et al., 2016)(Appendix 9, 10 & 11). This sums
up to one twelfth of reptilian species found in India. We suggest considering abatement of hazards
that will potentially threaten the efforts that are being made to conserve the biodiversity in these
regions. This holds true especially for oil well blowout, though at times accidental and at times
due to negligence of appropriate hazard management strategies that not only have a short term
impact but a long term and a far reaching impact. Flood prone regions, like our region of interest,
the Dibru-Saikhowa Biosphere Reserve, could spread the oil spill at far distances through the
running water that can have a devastating impact kilometers away from the actual site of oil well
blowout.
We have not done any work on socio-economics and health impacts on humans. The oil well
blow out had economic and health impact on humans (Rishu Kalantri 2020, thelogicalindian.com).
The contaminants will have long term impact on human heath, which need to be assessed
properly and need appropriate mitigation measures.
97
8 Conclusion
The area around the spill over is of high biodiversity value. The spill has resulted in mass mortality
and severely impacting the environmental condition resulting in debilitating conditions for species
to survive. The toxic fumes and oil coating has universally affected flora and fauna. The
contaminants and oil continue to be released in surrounding areas and immediate steps are
needed to contain this spill over. The toxins released are known to have long-term persistence
in soils and sediments, which will not only affect current life conditions, but due to sustained
release over a long period, pose a serious health risk for a longer term.
There are two major issues with companies operating oil and gas wells in Assam, a) Management
of oil spills from their wells, and b) emergency response readiness and effectiveness in terms of
major accidents. The oil leakage is a chronic problem and leaching of oil in water and underground
have ecological and health cost. As has been observed in the case of several wells across Eastern
Assam. As far as major accidents like well blowout in Assam the entire focus is on closure of well
and no restorative process is put in place for remediation of effect of oil in terrestrial or aquatic
system.
Two oil well blow outs earlier occurred in Assam, Dikom (Gogoi et al., 2007) and Naharkatia-
Deohal (Lahiri et al., 2012).. We are unable to get any meaningful information about restoration
of surrounding area. Same looks like the case in Baghjan with no effort to engage experts for
remediation due to oil spill. OIL does not have any information on their website nor they
provided information about their emergency plans as to how to deal with leaks and blowouts
and restoration plans in case of oil spill
The evaluation of landscape and biodiversity indicate large-scale impact of oil spill on flora and
fauna. Our evaluation indicates much higher level of PAHs pollutants some of which are
carcinogenic are in the ecosystem. Excessive noise level, produced by the blowout is detrimental
to animal and human health. Impact of sound may be taken care after plugging. Effect of PAHs
are going to be there in ecosystem for long term. Decline in Ganges dolphin use of this area, as
well as death of one dolphin, mortality of fishes, insects, herpetofauna, birds and impact on health
of most of the animals are related to oil spill and well blowout.Humans in this area are also
impacted. Decline in mammals, birds, insects and herpetofauna will take time and restorative
efforts are needed to regain to former diversity levels. Vegetation in large area is sprayed with oil
due to blow out and have impacted the landscape.
98
Given the fragility and seismicity of the landscape, the impact of the oil blow out, and importance
along with the uniqueness of biodiversity existing in the area, following needs to be done for
safeguarding this landscape:
1) The potential of oil blow out and oil spill like disaster like this a reality and therefore such oil wells
in the vicinity of Dibru-Saikhowa National park and IBA complex ( Maguri and Motapung, Poba
Reserve Forest, Kobo chapori, Amarpur chapori and) will be detrimental to the conservation
value of this unique ecosystem. Due consideration needs to be given to this threat for future
development.
2) More than 25 wells (Dibru-Saikhowa ESZ notification) are planned and almost same number
exist in this conservation complex/s (Dibru-Saikhowa National Park, Bherjan Wildlife Sanctuary,
Padumani Wildlife Sanctuary and Borajan Wildlife Sanctuary, Important Bird Areas (IBA) Poba
Reserve Forest, Kobo chapori, Amarpur chapori and Maguri and Motapung, Dihing-Patkai Wildlife
Sanctuary) needs to be re-evaluated for their cumulative impact on biodiversity value of this
landscape.
3) Safety audit for all other wells currently operating or planned need to be done. Risk management
study need to be done to ensure appropriate risk mitigation strategies Detail management plan
needs to be developed for safety measures and dealing with oil leakage.
4) Observing the ecological disaster caused by this incident, the proposed oil exploration and
development in Mechaki, Mechaki extension, Baghjan and Tinsukia Extension PML (MoEFCC EC
dated 9th April, 2020) needs to be reaassesed, since this is the habitat of Critically Endangered
species of this region.
5) OIL should have dedicated team and advanced training of their personnel to deal with
emergencies arising out of leakage, blow out and any other accidents which is possible due to
extraction, transportation and storage of highly volatile and risky chemicals.
6) Adequate finances should be for all restorative work in Wildlife areas Protected or otherwise
and compensate local people for their losses. There should be annual payment to Forest
Department for restoration and subsequently for management of this conservation complex.
Adequate consultation by Forest Department should be done to involve experts in the field of
Oil spill remediation and restoration.
7) A long term study should be initiated to understand the long-term impact of this oil spill and
blowout impact on the ecology and environment of Maguri-Motapung beel and Dibru-Saikhowa
National Park as well as on the health and socio-economic conditions of local communities

99
around the affected areas. Impact of the oil spill on the livelihood of local communities especially
on ecotourism based on Maguri-Motapung beel and Dibru-Saikhowa National Park needs to be
assessed.
8) Restoration will be long-term process and appropriate committee should be formed to develop,
monitor and guide the process.

100
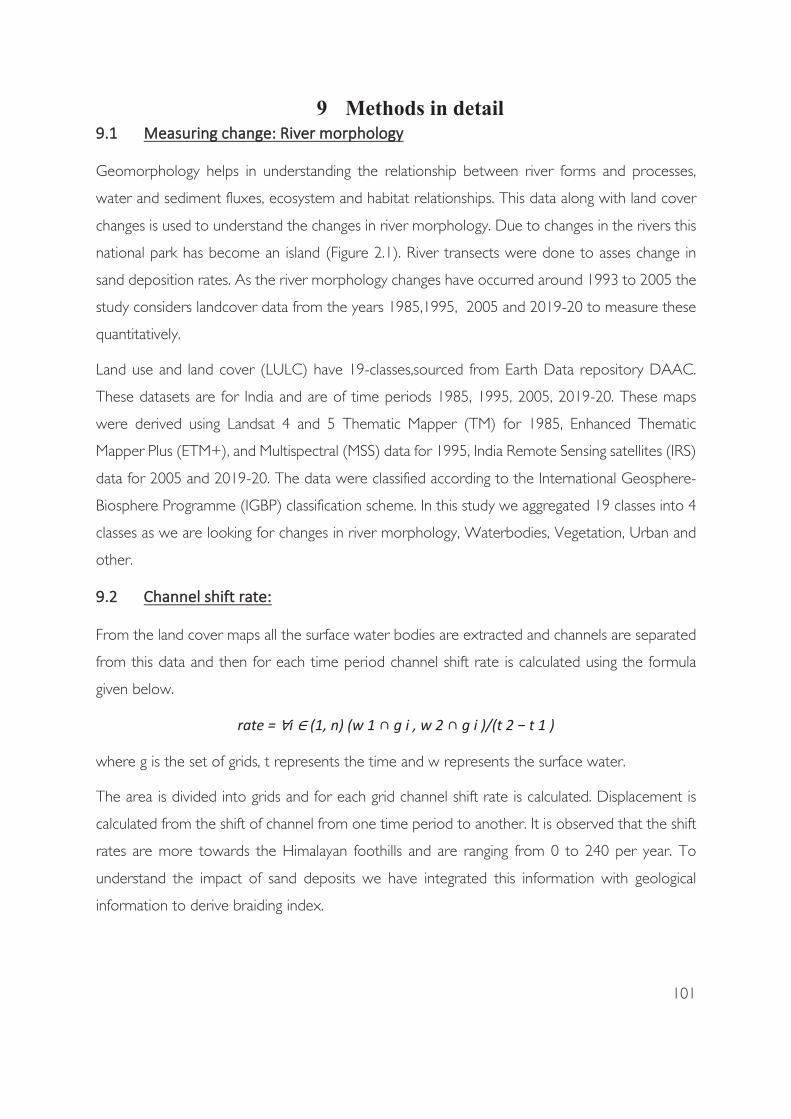
101
Geomorphology helps in understanding the relationship between river forms and processes,
water and sediment fluxes, ecosystem and habitat relationships. This data along with land cover
changes is used to understand the changes in river morphology. Due to changes in the rivers this
national park has become an island (Figure 2.1). River transects were done to asses change in
sand deposition rates. As the river morphology changes have occurred around 1993 to 2005 the
study considers landcover data from the years 1985,1995, 2005 and 2019-20 to measure these
quantitatively.
Land use and land cover (LULC) have 19-classes,sourced from Earth Data repository DAAC.
These datasets are for India and are of time periods 1985, 1995, 2005, 2019-20. These maps
were derived using Landsat 4 and 5 Thematic Mapper (TM) for 1985, Enhanced Thematic
Mapper Plus (ETM+), and Multispectral (MSS) data for 1995, India Remote Sensing satellites (IRS)
data for 2005 and 2019-20. The data were classified according to the International Geosphere-
Biosphere Programme (IGBP) classification scheme. In this study we aggregated 19 classes into 4
classes as we are looking for changes in river morphology, Waterbodies, Vegetation, Urban and
other.
From the land cover maps all the surface water bodies are extracted and channels are separated
from this data and then for each time period channel shift rate is calculated using the formula
given below.
where g is the set of grids, t represents the time and w represents the surface water.
The area is divided into grids and for each grid channel shift rate is calculated. Displacement is
calculated from the shift of channel from one time period to another. It is observed that the shift
rates are more towards the Himalayan foothills and are ranging from 0 to 240 per year. To
understand the impact of sand deposits we have integrated this information with geological
information to derive braiding index.

102
The Brahmaputra River flows along the alluvial valley as a wide braided river. Braiding also happens
in tributaries of Brahmaputra in Assam plains. The width of the river varies with time along its
course. The braiding intensity of this river is estimated using the braiding index (BI) of Brice
(1964). River width is extracted from land cover data. River transects are done to assses sand
bars formed along the river and then the ratio of that with the length of the river is found to
derive the braiding index.
Also it is observed that channel width has a positive correlation with braiding index and so there
is an increase in the index value with the increase in channel width.
Li = sum of the length of the braid bars and islands in a particular segment of the river
L = length of the course of the river in that particular segment.
The river transects are done for every grid to understand the silt deposits and water flow. This
output is used in deriving the braiding index across the region.
Figure 9.1 Flow diagram shows the process of deriving the geostatistics for the pollution levels.
To measure the pollution levels European Space Association’s Sentinel 5 precursor satellite is
used (Figure 9.1). This satellite is specifically launched to monitor air quality with high temporal
103
resolution. There are several products available in Sentinel 5P mission to understand and
quantitatively assess air quality. NO2, SO2, CH4, CO are all available for different scenarios. In
this particular case to understand the impact of oil spill blow out Carbon monoxide(CO), Sulphur
Dioxide (SO2) and HCHO (formaldehyde) product is used.TROPOMI instrument gives
product at a spatial resolution of 7 km by 3.5 km which is fairly good to estimate impact of
pollution at regional level. This data is accessed from sentinel Copernicus openhub. The data
comes in NetCDF format and SNAP tool of ESA is used to convert the product to a raster to
extract the required information. Data before the blow out and after the blow out are taken to
check the levels in Tinsukia. Extraction at small scale is challenging interms of picking localized
changes.
Pollution level is calculated using following formula
G = set of raster grids and bbox is the referenced envelope of the area of interest.
In this case study we have used EPSG:4326 for map projections.
Once pollution level is calculated, percentage change is calculated using the formula below
These delta values are plotted to observe the variations in CO and SO2 levels.
Landsat and MODIS LST product is used to make some observations.Both morning and night
temperatures are captured by MODIS Aqua and Terra satellites which provide better picture of
the variations.
For mapping oil pollution Sentinel 1 SAR was used (Ozigis et al 2018) as it can penetrate clouds
and detect changes in the land surfaces.

104
The primary objective of this study was to estimate the overall toxic effect of 16 PAHs
compounds [Naphthalene (NaP), Acenaphthylene (Acpy), Acenaphthene (Acp), Fluorene (Fl),
Phenanthrene (Phe), Anthracene (Ant), Fluoranthene (Flu), Pyrene (Pyr), Benz[a]anthracene
(BaA), Chrysene (Chr), Benzo[b]fluoranthene (BbF), Benzo[k]fluoranthene (BkF), Benz[a]pyrene
(BaP), Dibenzo[a,h]anthracene (DbA), Benzo[g,h,i]perylene (BghiP), Indeno[1,2,3-cd] pyrene
(InP)] in the aquatic ecosystem of the impacted area.
A detailed sampling was conducted to evaluate the impact of oil blowout and a total of 29
samples, including water (n – 12), sediments (n – 12) and fishes (n – 5) were collected from the
highly impacted area of the Maguri-Motapung wetland, Dibru and Lohit river. The blubber sample
(n - 2) of endangered Gangetic dolphin was also collected from the carcass of dolphin found in
Maguri-Motapung wetland. Water samples (1 lit) at each sampling point were collected into pre-
cleaned sterilized amber HDPE (High Density Polyethylene) bottles from the Maguri-Motapung
wetland and from the main channel of Lohit and Dibru rivers. Waterbed sediments (100 gm)
were grabbed in sampling container from the bottom and banks of the river and wetlands where
fine-textured substrate had accumulated. Dead fish samples (n - 5) of five different species,
namely Mystus Vittatus, Channa orientalis, Rasbora daniconus, Puntius Sophore and Eutropiichthys
vacha were collected from the two sites (Maguri—Motapung wetland and Lohit river). After
sampling, all collected samples (water, sediment, fish & blubber) were immediately stored in an
ice-chest at 4°C and transported to the Shriram Institute of Industrial Research, New Delhi
(accredited by National Accreditation Board for Testing and Calibration Laboratories (NABL), a
constituent board of Quality Council of India (QCI) as per ISO/IEC: 17025 in the field of testing)
for laboratory analysis. PAHs content in water, sediment and fish tissues was analysed by using
Gas Chromatography (GC-FID) and validated and confirmed by GC-MS/MS.
To assess the presence and extent of oil spill, the contaminated water and sediment samples
were collected from the sites (Figure 9.2) at intervals of 1 km. Along with sample collection, water
quality was also assessed at the same points. Testing the quality of water is an important part of
environmental monitoring (Ritabrata, 2018). The results obtained from our study were compared
with guidelines values (permissible limits) which is standardized by BIS (Bureau of Indian
standards,1991) CPCB (IS 2296:1992) and WHO (World Health Organisation, 2011). The
quality of water can be determined through measuring the essential physiological parameters
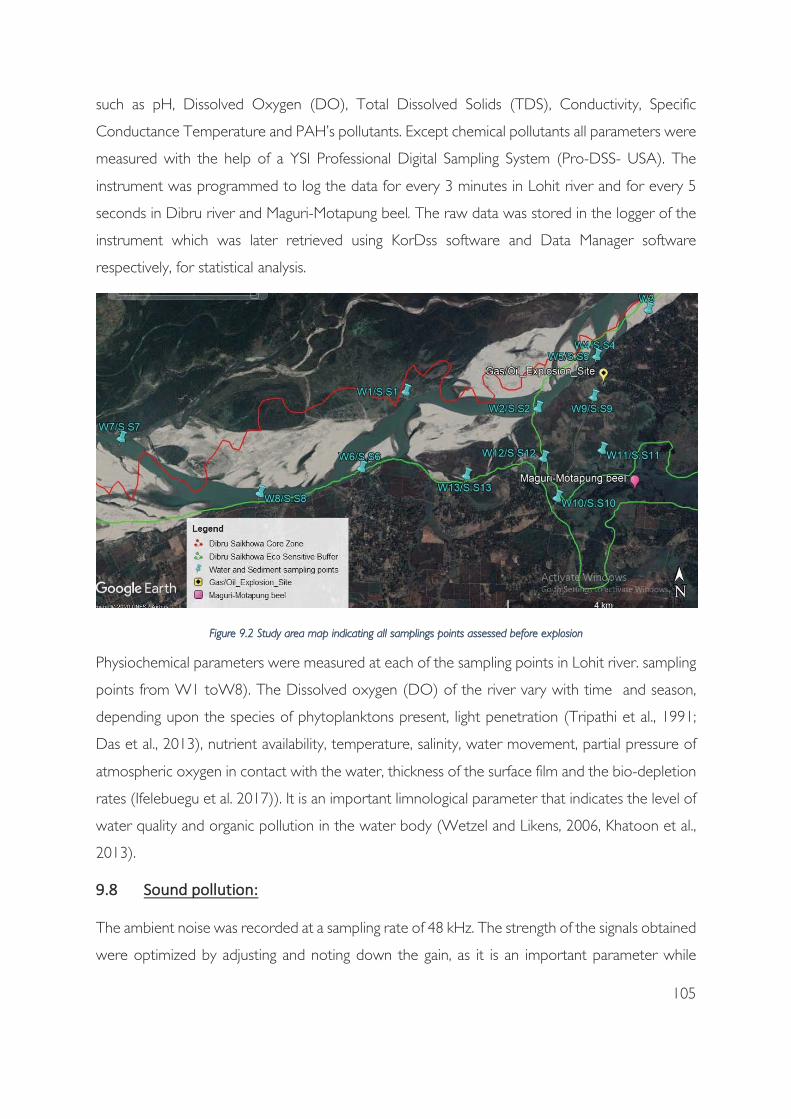
105
such as pH, Dissolved Oxygen (DO), Total Dissolved Solids (TDS), Conductivity, Specific
Conductance Temperature and PAH’s pollutants. Except chemical pollutants all parameters were
measured with the help of a YSI Professional Digital Sampling System (Pro-DSS- USA). The
instrument was programmed to log the data for every 3 minutes in Lohit river and for every 5
seconds in Dibru river and Maguri-Motapung beel. The raw data was stored in the logger of the
instrument which was later retrieved using KorDss software and Data Manager software
respectively, for statistical analysis.
FFigure 9.2 Study area map indicating all samplings points assessed before explosion
Physiochemical parameters were measured at each of the sampling points in Lohit river. sampling
points from W1 toW8). The Dissolved oxygen (DO) of the river vary with time and season,
depending upon the species of phytoplanktons present, light penetration (Tripathi et al., 1991;
Das et al., 2013), nutrient availability, temperature, salinity, water movement, partial pressure of
atmospheric oxygen in contact with the water, thickness of the surface film and the bio-depletion
rates (Ifelebuegu et al. 2017)). It is an important limnological parameter that indicates the level of
water quality and organic pollution in the water body (Wetzel and Likens, 2006, Khatoon et al.,
2013).
The ambient noise was recorded at a sampling rate of 48 kHz. The strength of the signals obtained
were optimized by adjusting and noting down the gain, as it is an important parameter while
106
recording the sounds using microphone; low gain misses quieter sounds and high gain saturates
the recording.
A total of 13 soundwave files were obtained and analysed using Raven Pro 1.5 software (The
Cornell Lab). With the recordings, a spectrogram was generated to visualize
the spectrum of frequencies (i.e. the amount of energy in the sound at each frequency) of the
signal.
For each of our 13 sound recordings, we selected the required sound clip on the spectrogram
from Raven software and measured the following
aa) Average Power: In a grayscale spectrogram, it is the value of the power spectrum (the power
spectral density of a single column of spectrogram values) averaged over the frequency extent of
the selection. The values of the power spectrum are summed between the lower and upper
frequency bounds of the selection, and the result is divided by the number of frequency bins in
the selection.
Units: dB.
b) Maximum/peak power: In a selection it is the power at the darkest point in the selection. Units:
dB re 1 dimensionless sample unit.
From the power and frequency values obtained, we converted the dB reference level to A-
weighted dB levels in RStudio. A-weighted dB filter is a psycho-acoustical measure that that
converts the sound level into a human subjective measure. The full frequency range for young
people is 20 to 20,000 Hz, and between 500 Hz and 6,000 Hz human ears are more sensitive
than that to lower or higher frequencies. The conventions used here to denote these terms are
as follows, LA= A-weighted power, LAeq= equivalent A weighted power, LAmax= maximum
A weighted power. LA is synonymous with dBA and dB(A) and is often written as LA = xdB.
Passive acoustic monitoring (PAM) device (The Cetacean Research™ C57 hydrophone series)
along with the portable digital field recorder Tascam DR-100 (TASCAM Inc.) were used to
monitor underwater sound in July 2020. They were deployed at 500m intervals of the river to
get a sound profile. The sampling rate (the number of samples per unit taken from a continuous
signal to make a discrete or digital signal) was 192kHz, and the gain was set at 5 to get recordings
without saturating the file. The analysis was done for 12 records in RStudio after calibrating for
107
hydrophone sensitivity at that particular gain to get the absolute measure to draw comparison
spatially. Each recording was 1 minute long, adding up to a total of 12 minutes.
Independent double observer method was followed for the Ganges dolphin surveys (Smith,
2006). In double-platform independent observer surveys, sighting data from each platform
represents an independent capture occasion, were used in a two-sample capture-recapture
framework for estimation of population abundance along with estimates of capture probabilities
and precision. We used Chapman’s unbiased estimator (Chapman, 1951) to obtain an estimate
of the number of dolphins.
Passive acoustic monitoring (PAM) devices were used to understand occurrence and activity
pattern of dolphins. C-PODs are one such underwater acoustic loggers meant for cetaceans, that
have a single hydrophone with a frequency range of 20 to 160 kHz. The data are logged on to a
memory card and retrieved using the C-POD software. Dolphin clicks are separated from other
108
ambient noise using the in-built function in the software, the KERNON classifier. The automated
classifier segregates all acoustic recordings into ‘NBHF’ (narrow band high frequency), ‘Other
Cetacean’ (which includes river dolphin), ‘Sonar’ and ‘Unclassified’. The classifier also classifies the
click trains to ‘high’, ‘moderate’, ‘low’ or ‘doubtful’ clicks, where ‘high’ indicates click trains that
have a ≥75% likelihood of being dolphins. To reduce false positives, we used only ‘high’ and
‘moderate’ quality click trains of river dolphins. The CPODs were moored with the required
weight and buoys to aid in maintaining the hydrophone in the 30-50% of the water column. This
aids in reducing sediment noise and surface noise and optimizes capturing cetacean sounds.
The survey was done from May, to July 2020. Survey for all these taxa was carried out in grids
identified within the concentric circles around well blow out site (Fig 9.3)
Bird:
The habitat in the affected area is segregated into Grassland and wetland. Transects were walked
in the grassland regions and boat transects were carried out in the wetland area between 09:00h
– 14:00h. A cumulative effort of 3.48 km transect was carried out in the grasslands falling at
distances of 1, 2, 4 and 5 km from the explosion site. A cumulative effort of 11 km was in the
beel (wetland) area. Data from ebird was downloaded and used to draw comparisons between
earlier occurrence reports at locations that fall within our sampling grid and current occurrence.
Available data in our sampling regions (from 2010 onwards) are arranged according to sampled
grid in Grassland and wetland.
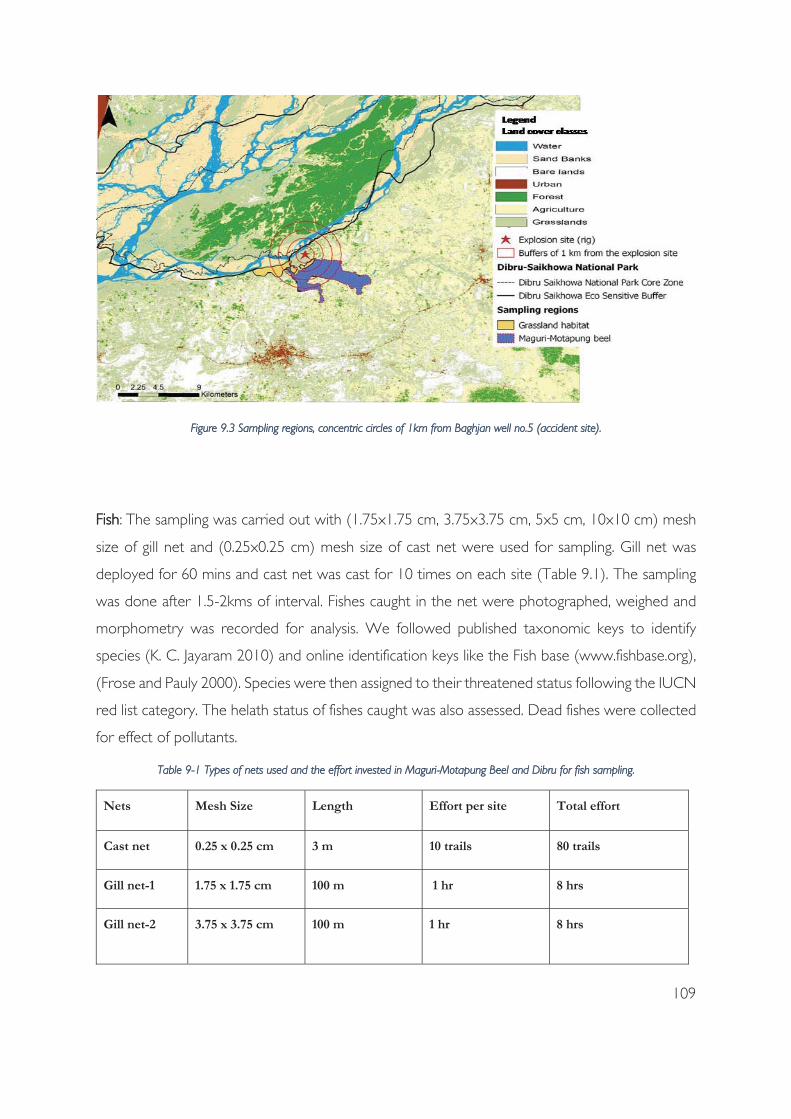
109
FFigure 9.3 Sampling regions, concentric circles of 1km from Baghjan well no.5 (accident site).
Fish: The sampling was carried out with (1.75x1.75 cm, 3.75x3.75 cm, 5x5 cm, 10x10 cm) mesh
size of gill net and (0.25x0.25 cm) mesh size of cast net were used for sampling. Gill net was
deployed for 60 mins and cast net was cast for 10 times on each site (Table 9.1). The sampling
was done after 1.5-2kms of interval. Fishes caught in the net were photographed, weighed and
morphometry was recorded for analysis. We followed published taxonomic keys to identify
species (K. C. Jayaram 2010) and online identification keys like the Fish base (www.fishbase.org),
(Frose and Pauly 2000). Species were then assigned to their threatened status following the IUCN
red list category. The helath status of fishes caught was also assessed. Dead fishes were collected
for effect of pollutants.
Table 9-1 Types of nets used and the effort invested in Maguri-Motapung Beel and Dibru for fish sampling.
Nets Mesh Size Length Effort per site Total effort
Cast net 0.25 x 0.25 cm 3 m 10 trails 80 trails
Gill net-1 1.75 x 1.75 cm 100 m 1 hr 8 hrs
Gill net-2 3.75 x 3.75 cm 100 m 1 hr 8 hrs
110
Gill net-3 5×5 cm 100 m 1 hr 8 hrs
Gill net-4 10 x 10 cm 100 m 1 hr 8 hrs
BButterflies and Odonates: A team of one observer and a recorder surveyed the designated grid
for a pre-determined time of 20 minutes between 0900h to 1400h. Between two spatial sets of
the time-constrained survey, a checklist of species sighted was generated at a point between the
two spatial sets. A time constrained survey of three spatially independent sets of 20 minutes each
were carried out in one of the grids (2 km from the rig, short-tall grassland interspersed with
water puddles) for sampling odonates. The dragonflies and damselflies were photographed in the
field and sometimes caught with a net and released without harming the individual after
identification. A checklist was generated of species encountered between the spatial sets.
Herpetofauna:
A time-constrained area search method was employed for sampling herpetofauna in each of the
four grids (1 km, 2 km, 4 km and 5 km) for a pre-determined time of one hour. The sampling
was carried out by active searches underneath logs, leaf litters etc. for presence of animals by 1-
2 independent observers within the grid. The searches will be targeting potential regions for
encountering common herpetofaunal group, namely skinks, agamids, geckos, snakes, chelonians,
frogs and toads. This area has reported to have 17 amphibian, 13, turtle, 11 snakes and 8 lizard
species. A cumulative effort of 5.5 km was carried out in the four grids actively searching for the
presence of any herpetofauna of any life stages. Sampling was done only during day time, so the
list is partial. The checklist of the area (Ahmed and Das, 2010) will be used to assess the probable
species present in the area

111
Able, K.W., López-Duarte, P.C., Fodrie, F.J. et al. (2015). Fish Assemblages in Louisiana Salt Marshes: Effects of the Macondo
Oil Spill. Estuaries and Coasts, 38, 1385–1398. https://doi.org/10.1007/s12237-014-9890-6 Accidental Oil Spills and Gas Releases; Information, Models, and Estimates; and Supporting Figures, Tables, and Maps.
Appendix A, OSRA Report. Posted at: https://www.boem.gov/Liberty/ Ahmed, M. F., & Das, A. (2010). Tortoises and Turtles of Northeast India: Saving them from Extinction. Draft) Technical
Report, Aaranyak, HRCP: 01/2010. Akpambang, V.O.E., Purcaro, G., Lajide, L., Amoo, I. A., Conte, L.S., Moret, S. (2009). Determination of polycyclic aromatic
hydrocarbons (PAHs) in commonly consumed Nigerian smoked/grilled fish and meat. Food Addit. Contam. 26:1096-1103
Albers, P.H., Loughlin, T.R. (2003). Effects of PAHs on marine birds, mammals and reptiles. In: Douben PET (ed) PAHs: an ecotoxicological perspective. Wiley, Chichester, pp 243–261
Alomirah, H., Al-Zenki, S., Husain, A., Ahmed, N., Al-Rashdan, A., Gevao, B. (2009). Dietary exposure to polycyclic aromatic hydrocarbons from commercially important seafood of the Arabian Gulf. J. Food Agric. Environ. 7:9-15.
Anyakora, C., Arbabi, M., Coker, H., (2008). A screen of benzo(a)pyrene in fish samples from crude oil polluted environments. American Journal of Environmental Sciences 4, 145-150.
Anyakora, C., Coker, H., (2007). Assessment of polynuclear aromatic hydrocarbon content in four species of fish in the Niger Delta by gas chromatography/mass spectrometry. African Journal of Biotechnology 6, 737-743.
Armstrong, B., Hutchinson, E., Unwin, J., Fletcher, T. (2004). Lung cancer risk after exposure to polycyclic aromatic hydrocarbons: a review and meta-analysis,” Environmental Health Perspectives, vol. 112, no. 9, pp. 970–978.
Assam oil well fire rages on. Two firefighters dead; at least 7,000 villagers affected. Oil spill in a two-km radius - Gaonconnection | Your Connection with Rural India. (n.d.). Retrieved July 16, 2020, from https://en.gaonconnection.com/assam-oil-well-fire-rages-on-two-firefighters-dead-at-least-7000-villagers-affected-oil-spill-in-a-two-km-radius/
Baca, B. J., Getter, C. D., Lindstedt-Siva, J. (1985). Freshwater oil spill considerations: Protection and cleanup, in Proc. 1985 Oil Spill Conf., Publ. 4385, American Petroleum Institute, Washington, D.C., 385.
Balseiro, A., Espí, A., Márquez, I., Pérez, V., Ferreras, M. C., García Marín, J. F., & Prieto, J. M. (2005). Pathological features in marine birds affected by the prestige’s oil spill in the north of Spain. Journal of Wildlife Diseases, 41(2), 371–378. https://doi.org/10.7589/0090-3558-41.2.371
Bam, W., Hooper-Bui, L. M., Strecker, R. M., Adhikari, P. L., & Overton, E. B. (2018). Coupled effects of oil spill and hurricane on saltmarsh terrestrial arthropods. PloS one, 13(4), e0194941. https://doi.org/10.1371/journal.pone.0194941
Banks, A. N., Sanderson, W. G., Hughes, B., Cranswick, P. A., Smith, L. E., Whitehead, S., … Fairney, N. P. (2008). The Sea Empress oil spill (Wales, UK): Effects on Common Scoter Melanitta nigra in Carmarthen Bay and status ten years later. Marine Pollution Bulletin, 56(5), 895–902. https://doi.org/10.1016/j.marpolbul.2008.01.032
Barber ,E. W., McDonald, L. L., Erickson, P. W. & Vallarino, M. (1995) Effect of the Exxon Valdez Oil Spill on Intertidal Fish: A Field Study, Transactions of the American Fisheries Society, 124(4), 461-476, DOI: 10.1577/1548-8659(1995)124<0461:EOTEVO>2.3.CO;2
Barnett, J., Toews, D. (1978). The effects of crude oil and the dispersant, Oilsperse 43, on respiration and coughing rates in Atlantic salmon (Salmo salar), Can. J. Zool., 56, 307.
Baro, O., & Kumar, A. (2017). Seismic source characterization for the Shillong Plateau in Northeast India. Journal of Seismology, 21(5), 1229-1249.
Basak, S., Sengor, G.F., Karakoc, F.T. (2010). The detection of potential carcinogenic PAHs using HPLC procedure in two different smoked fish, case study: Istanbul/Turkey. Turk. J. Fish. Aquat. Sci. 10:351-355.
Beattie, G. A. C., Liu, Z. M., Watson, D. M., Clift, A. D., & Jiang, L. (1995). Evaluation of petroleum spray oils and polysaccharides for control of Phyllocnistis citrella Stainton (Lepidoptera: Gracillariidae). Australian Journal of Entomology, 34(4), 349-353. https://doi.org/10.1111/j.1440-6055.1995.tb01353.x
112
Berglund, Birgitta, Lindvall, Thomas, Schwela, Dietrich H & World Health Organization. Occupational and Environmental Health Team. (1999). Guidelines for community noise. World Health Organization. https://apps.who.int/iris/handle/10665/66217
Bhatta, L. D., Chaudhary, S., Pandit, A., Baral, H., Das, P. J., & Stork, N. E. (2016). Ecosystem service changes and livelihood impacts in the maguri-motapung wetlands of assam, India. Land, 5(2), 15.
Black, J.A., Birge, W.J, Westerman, A.G., Francis, P.C. (1983). Comparative Aquatic Toxicology of Aromatic Hydrocarbons. FUNDAMENTAL AND APPLIED TOXICOLOGY 3:353-358.
Blakely, J. K., Neher, D. A., & Spongberg, A. L. (2002). Soil invertebrate and microbial communities, and decomposition as indicators of polycyclic aromatic hydrocarbon contamination. Applied Soil Ecology, 21(1), 71-88. https://doi.org/10.1016/S0929-1393(02)00023-9
Bogran, C. E., Ludwig, S., & Metz, B. (2006). Using oils as pesticides. Texas FARMER Collection. http://hdl.handle.net/1969.1/86885
Borgohain, S., Das, J., Saraf, A. K., Singh, G., & Baral, S. S. (2016). Morphodynamic changes of Lohit River, NE India: GIS-based study. Current Science, 1810-1816.
Braddock, J. F., Lindstrom, J. E., Brown, E. J. (1995). Distribution of hydrocarbon-degrading microorganisms in sediments from Prince William Sound, Alaska, following the Exxon Valdez oil spill, Mar. Pollut. Bull., 30, 125.
Brindha, K., Elango, L., (2013). PAHs contamination in groundwater from a part of metropolitan city, India: a study based on sampling over a 10-year period. Environ Earth Sci, 71:5113-5120.
Brown, E. D. (1996). Injury to the early life history stages of Pacific herring in Prince William Sound after the Exxon Valdez oil spill, in Proc. Exxon Valdez Oil Spill Symp., Symposium 18, American Fisheries Society, Bethesda, 448.
Burk, C. J. (1977). A four-year analysis of vegetation following an oil spill in a freshwater marsh, J. Appl. Ecol., 14, 515. Caliani I., Porcelloni S., Mori G., Frenzilli G., Ferraro M., Marsili L., Casini S., Fossi M.C. (2009). Genotoxic effects of produced
waters in mosquito fish (Gambusia affinis). Ecotoxicology 18: 75-80 Carls, M. G., Rice, S. D., Hose, J. E. (1999). Sensitivity of fish embryos to weathered crude oil: Part I. Low-level exposure
during incubation causes malformations, genetic damage, and mortality in larval Pacific herring (Clupea pallasi), Environ. Toxicol. Chem., 18, 481.
Carls, M.G., Holland, L., Larsen, M., Collier, T.K., Scholz, N.L., Incardona, J.P. (2008). Fish embryos are damaged by dissolved PAHs, not oil particles. Aquatic toxicology (Amsterdam, Netherlands), 88(2), 121–127
Centre for Conservation Bioacoustics. (2014). Raven Pro: Interactive Sound Analysis Software (Version 1.5) [Computer software]. Ithaca, NY: The Cornell Lab of Ornithology. Available from http://ravensoundsoftware.com/.
Chakraborty, P., Sakthivel, S., Kumar, B., Kumar, S., Mishra, M., Verma, V.V., Gaur, R. (2014). Spatial distribution of persistent organic pollutants in the surface water of River Brahmaputra and River Ganga in India. Rev Environ Health; 29(1-2): 45–48.
Chapman, D.G. (1951). Some properties of the hypergeometric distribution with application to zoological censuses. University of California Publiction on Statistics 1:131-160.
Cheung, K.C., Leung, H.M., Kong, K.Y., Wang, M.H. (2007). Residual levels of DDTs and PAHs in freshwater and marine fish from Hong Kong markets and their health risk assessment. Chemosphere 66:460-468.
Christiansen, R., Glette, J., LIE, ø., Torrissen, O.J. Waagbø, R. (1995). Antioxidant status and immunity in Atlantic salmon, Salmo salar L., fed semi purified diets with and without astaxanthin supplementation. Journal of Fish Diseases, 18: 317-328.
Collier, T.K., Anulacion, B.F., Arkoosh, M.R., Dietrich, J.P., Incardona, J.P., Johnson, L.L., Ylitalo, G.M., Myers, M.S. (2013). Effects on fish of polycyclic aromatic hydrocarbon (pahs) and naphthenic acid exposures. Fish Physiol 33, 195–225.
CPCB|Central Pollution Control Board. (n.d.). Retrieved July 16, 2020, from https://cpcb.nic.in/who-guidelines-for-noise-quality/
CSIR-North East Institute of Science and Technology (2015). Literature Survey of Available Earthquake Hazard Assessment Studies related to North Eastern Region. Final Report, pp 501.
Culbertson, J. B., Valiela, I., Olsen, Y. S., & Reddy, C. M. (2008). Effect of field exposure to 38-year-old residual petroleum hydrocarbons on growth, condition index, and filtration rate of the ribbed mussel, Geukensia demissa. Environmental Pollution, 154(2), 312-319. https://doi.org/10.1016/j.envpol.2007.10.008
113
Das, B. K., Ghosh, A. and Kar, D., (2013). Icthyofaunal Diversity of Simen River in Assam and Arunachal Pradesh, India. International Journal of Current Science and Technology, 1(1), 55-58.
Das, B. K., Kar, S. and Kar, D., (2012). Studies on Intensity of Cestodes Parasite Infecting Monopterus cuchia in Cachar District, Assam. Biological Forum- An International Journal, 4(2), 71-74.
Das, G.N., Tamuly, T., Hussain, A., Boruah, A., Das, S. (2017). An update list of butterflies (Lepidoptera) of Dibru-Saikhowa National Park, North-East India. Munis Entomology and Zoology Journal, 12(2), 408-418
Das, R.K. (2006). Birds of Dibru-Saikhowa Biosphere Reserve. Newsletter for Birdwatchers, 46(1), 6 -14. Day, R. H., Murphy, S. M., Wiens, J. A., Hayward, G. D., Harner, E. J., & Smith, L. N. (1997). Effects of the Exxon Valdez oil
spill on habitat use by birds in Prince William Sound, Alaska. Ecological Applications, 7(2), 593–613. https://doi.org/10.1890/1051-0761(1997)007[0593:EOTEVO]2.0.CO;2
DeGuise, S., Levin, M., Gebhard, E., Jasperse, L., Hart, L.B., Smith, C.R., Venn-Watson, S., Townsend, F., Wells, R., Balmer, B., Zolman, E., Rowles, T., Schwacke, L. (2017). Changes in immune functions in bottlenose dolphins in the northern Gulf of Mexico associated with the Deepwater Horizon oil spill. Endang Species Res 33:291-303.
Dhananjayan, V., Muralidharan, S. (2012). Polycyclic Aromatic Hydrocarbons in Various Species of Fishes from Mumbai Harbour, India, and Their Dietary Intake Concentration to Human. International Journal of Oceanography, 645178, 6.
Eisler, R. (2000). Polycyclic aromatic hydrocarbons, in Handbook of Chemical Risk Assessment, Vol. 2, Lewis Publishers, Boca Raton, FL, Chap. 25.
Engel’hardt, F.R. (1983). Petroleum effect on Marine mammals. Aquatic Toxicology, 4 0983) 199-217 199 Elsevier. Engelhardt, F.R. (1982). Hydrocarbon metabolism and cortisol balance in oil-exposed ringed seals, Phoca hispida. Comparative
Biochemistry and Physiology 72C:133-136. EPA, U. (1993). Understanding Oil Spills and Oil Spill Response. (July), 1–39. Eppley, Z. A. (1992). Assessing indirect effects of oil in the presence of natural variation: The problem of reproductive failure
in south polar skuas during the Bahia Paraiso oil spill, Mar. Pollut. Bull., 25, 307. Esler, D., Bowman, T. D., Trust, K. A., Ballachey, B. E., Dean, T. A., Jewett, S. C., & O’Clair, C. E. (2002). Harlequin duck
population recovery following the “Exxon Valdez” oil spill: Progress, process and constraints. Marine Ecology Progress Series, 241, 271–286. https://doi.org/10.3354/meps241271
Evans, W. (1982). A study to determine if gray whales detect oil. In: Geraci JR, St. Aubin DJ (eds) Study on the effects of oil on cetaceans. Contract AA 551-CT9-22. Final report to U.S. Dept. of Interior, BLM, Washington, DC, p 47–61.
Finger, S.E., Little, E.F., Henry, M.G., Fairchild, J.F., Boyle, T.P. (1985). Comparison of laboratory and field assessment of fluorene - Part I: effects of fluorene on the survival, growth, reproduction, and behavior of aquatic organisms in laboratory tests. Pages 120-133 in T.P. Boyle (ed.). Validation and predictability of laboratory methods for assessing the fate and effects of contaminants in aquatic ecosystems. ASTM STP 865. American Society for testing and Materials, Philadelphia, Pennsylvania.
Forest Survey of India, (2019). India State of Forest Report 2019. Volume II, Forest Survey of India, Dehradun p 23-33. Fowler, G. S., Wingfield, J. C., Goersma, P. D. (1995). Hormonal and reproductive effects of low levels of petroleum fouling
in Magellanic penguins (Spheniscus magellanicus), The Auk, 112, 382. Galli, Andre & Butz, André & Scheepmaker, Remco & Hasekamp, Otto & Landgraf, J. & Tol, Paul & Wunch, D. & Deutscher,
Nicholas & Toon, G. & Wennberg, Paul & Griffith, D. & Aben, I.. (2012). CH4, CO, and H2O spectroscopy for the Sentinel-5 Precursor mission: an assessment with the Total Carbon Column Observing Network measurements. Atmospheric Measurement Techniques Discussions. 5. 2131-2167. https://doi.org/10.5194/amtd-5-2131-2012.
Gentina, T., Tillie-Leblond, I., Birolleau, S., Faycal, S. et al. (2001). Fire-eater’s lung:seventeen cases and a review of the literature. Medicine 80: 291−297
Geraci, J. R., D. J. St. Aubin & R. J. Reisman, (1983). Bottlenose dolphins, Tursiops truncatus, can detect oil. Can. J. Fish. Aquat. Sci. 40(9): 1515–1522.
Geraci, J.R. and D.J. St. Aubin, (1982). Study of the effects of oil on cetaceans. Report for U.S. Department of the Interior, Bureau of Land Management, Contract No. AA-551-CT9-29, 274 pp.

114
Gogoi, M.M., Bhuyan P. K. and Morthy, K. K. (2007): Possible impact of a major oil-well fire on aerosol optical depth at Dibrugarh. Current Science, 92(8): 1047-1049.
Golet, G. H., Seiser, P. E., McGuire, A. D., Roby, D. D., Fischer, J. B., Kuletz, K. J., … Newman, S. H. (2002). Long-term direct and indirect effects of the “Exxon Valdez” oil spill on pigeon guillemots in Prince William Sound, Alaska. Marine Ecology Progress Series, 241, 287–304. https://doi.org/10.3354/meps241287
Gomez, C. & Green, D. (2014). The impact of Oil and Gas drilling accidents on EU fisheries. Goodale, D.R., Hyman, M.A.M. and Winn, H.E. (1981). Cetacean responses in association with REGAL SWORD oil spill, ch.
XI. In: A characterization of marine mammals and turtles in the Mid- and North Atlantic areas of the U.S. outer continental shelf, edited by R.K. Edel, M.A. Hyman and M.F. Tyrell, Cetacean and Turtle Assessment Program, Annual Report 1979, University of Rhode Island, pp. XI-I to Xl-15.
Gospodarek, J. (2009). Effect of oil derivative spill on epigeal invertebrates. Ecological Chemistry and Engineering. A, 16(3), 263-270.
Gospodarek, J., Kołoczek, H., & Petryszak, P. (2012). Dynamics of arachnid occurrence in soil contaminated with petrol, diesel fuel and engine oil during bioremediation process. Ecological Chemistry and Engineering. A, 19(9), 1099-1106.
Gracia, A., Murawski, S. & Vázquez-Bader, A. (2020). Impacts of Deep Oil Spills on Fish and Fisheries. 10.1007/978-3-030-11605-7_25.
Gregg, J. C, Fleeger, J. W., Carman, K. R. (1997). Effects of suspended, diesel-contaminated sediment on feeding rate in the darter goby, Gobionellus boleosoma (Teleostei: Gobiidae), Mar. Pollut. Bull., 34, 269.
Gundlach, E. R. (2017). Oil Spills. In Encyclopedia of Earth Sciences Series pp. 1–5. Springer International Publishing. https://doi.org/10.1007/978-3-319-48657-4_233-2
Guzzella, L., & De Paolis, A. (1994). Polycyclic aromatic hydrocarbons in sediments of the Adriatic Sea. Marine Pollution Bulletin, 28(3), 159-165.
Hamilton, H., Caballero, S., Collins, A.G. and Brownell, R.L. (2001). Evolution of river dolphins. Proceedings of the Royal Society of London. Series B: Biological Sciences 268: 549–556. https://doi.org/10.1098/rspb.2000.1385
Han, Z., Li, B., Mu, Z., Niu, S., Zhang, J., & Ren, L. (2017). Energy Efficient Oil–Water Separation of Biomimetic Copper Membrane with Multiscale Hierarchical Dendritic Structures. Small, 13(34), 1701121. https://doi.org/10.1002/smll.201701121
Heintz, R. A., Short, J. W., Rice, S. D. (1999). Sensitivity of fish embryos to weathered crude oil: Part II. Increased mortality of pink salmon (Oncorhynchus gorbuscha) embryos incubating downstream from weathered Exxon Valdez crude oil, Environ. Toxicol. Chem., 18, 494.
Huang, L., Chernyak, S.M., Batterman, S.A. (2014). PAHs, nitro-PAHs, hopanes, and steranes in lake trout from Lake Michigan. Environ. Toxicol. Chem. 33, 1792–1801.
Hylland, K. (2006). Polycyclic aromatic hydrocarbon (PAH) ecotoxicology in marine ecosystems. Journal of Toxicology and Environmental Health, Part A, 69(1-2), 109-123.
Ifelebuegu, Augustine O., Justina E. Ukpebor, Anita U. Ahukannah, Ernest O. Nnadi, and Stephen C. Theophilus. (2017). “Environmental Effects of Crude Oil Spill on the Physicochemical and Hydrobiological Characteristics of the Nun River, Niger Delta.” Environmental Monitoring and Assessment 189 (4): 173. https://doi.org/10.1007/s10661-017-5882-x.
Incardona, J., Collier, T. & Scholz, N. (2011). Oil spills and fish health: exposing the heart of the matter. J Expo Sci Environ Epidemiol 21, 3–4 https://doi.org/10.1038/jes.2010.51
Indian Standard Specification for Drinking Water, Bureau of Indian Standards. BIS: 10500, (1991). Jenssen, B. M. (1994). Review article: Effects of oil pollution, chemically treated oil, and cleaning on the thermal balance of
birds, Environ. Pollut., 86, 207. Johansson, S., Larsson, U., Boehm, P. (1980). The Tsesis oil spill. Impact on the pelagic ecosystem, Mar. Pollut. Bull., 11, 284. Jung, M. P., Kim, S. T., Kim, H., & Lee, J. H. (2008). Species diversity and community structure of ground-dwelling spiders in
unpolluted and moderately heavy metal-polluted habitats. Water, air, and soil pollution, 195(1-4), 15. https://doi.org/10.1007/s11270-008-9723-y
Kalita, P., Pathak, S., & Deka, P. (2016). A preliminary study on ichthyofaunal resource of Motapung-Maguri Beel of Tinsukia district of Assam, India. Intl J of Fauna and Biol Studies, 3(4), 97-102.
115
Kasuya, T., Haque, A.K.M. (1972). Some information on distribution and seasonal movement of Ganges dolphin. Science Reprints. Whales research Institute, 24, 109-115.
Khan, R. A. (1999). Study of pearl dace (Margariscus margarita) inhabiting a stillwater pond contaminated with diesel fuel, Bull. Environ. Contam. Toxicol., 62, 638.
Khatoon, N., Rehman, M. and Khan A. F., (2013). Study of Seasonal Variation in the water quality among different Ghats of River Ganga, Kanpur, India, Journal of Environmental Research and Development, 8 (1), 1-10.
Klekowski, E. J., Jr. (1994). Petroleum pollution and mutation in mangroves, Mar. Pollut. Bull., 28, 166. Kuehn, R. L. (1995). Relationships among petroleum refining, water and sediment contamination, and fish health, J. Toxicol.
Environ. Health, 46, 101. Lahiri, SK., Chutia, M., Gogoi, A., Borgohain, H. (2016): Gas leakage from palaeogene reservoir in Assam – a geophysical
puzzle. Current Science, 111(7): 1242-1246. Lance, B. K., Irons, D. B., Kendall, S. J., & McDonald, L. L. (2001). An evaluation of marine bird population trends following
the Exxon Valdez oil spill, Prince William Sound, Alaska. Marine Pollution Bulletin, 42(4), 298–309. https://doi.org/10.1016/S0025-326X(00)00155-7
Laurel, B., Copeman, L., Iseri, P., Spencer, M., Hutchinson, G., Nortug, T., Donald, C., Meier, S., Allan, S., Boyd, D., Ylitalo, G., Cameron, J., French, B., Linbo, T., Scholz, N., Incardona, J. (2019).Trace Embryonic Crude Oil Exposure Leads to Long-Term Bioenergetic Impacts in a Keystone Arctic Marine Forage Fish. Available at SSRN: https://ssrn.com/abstract=3382221 or http://dx.doi.org/10.2139/ssrn.3382221
Lefcort, H. (1997). The effects of used motor oil, silt, and the water mold Saprolegnia parasitica on the growth and survival of mole salamanders (Genus Ambystoma), Arch. Environ. Contam. Toxicol., 32, 383.
Levengood, J.M., Schaeffer, D.J. (2011). Polycyclic aromatic hydrocarbons in fish and crayfish from the Calumet region of southwestern Lake Michigan. Ecotoxicology, 20, 1411–1421.
Liu, Y., Bu, Q., Cao, H., Zhang, H., Liu, C., He, X., & Yun, M. (2020). Polycyclic Aromatic Hydrocarbons in Surface Water from Wuhai and Lingwu Sections of the Yellow River: Concentrations, Sources, and Ecological Risk. Journal of Chemistry, 2020.
Llobet, J.M., Falco, G., Bocio, A., Domingo, J.L. (2006). Exposure to polycyclic aromatic hydrocarbons through consumption of edible marine species in Catalonia, Spain. J. Food Prot. 61:2493-2499.
Loughlin, T.R., Bellachey, B.E., Wright, B.A. (1996). Overview of studies to determine injury caused by the Exxon Valdez oil spill to marine mammals. American Fisheries Society Symposium 18:798-808.
Macıas-Zamora, J.V., Mendoza-Vega, E., Villaescusa-Celaya, J.A. (2002). PAHs composition of surface marine sediments: A comparison to potential local sources in Todos Santos Bay, BC, Mexico. Chemosphere, 46, 459–468.
Madhusudhan, M. & Bindra, P. 2013. Site inspection report regarding Oil and Gas pipelines in upper Assam. Submitted to the the Standing Committee of the National Board for WildlifeNaqvi, S. 2020. Blowout at Oil India well threatens national park in upper Assam. Down to Earth. URL retrieved on 03.06.2020
(https://www.downtoearth.org.in/news/pollution/blowout-at-oil-india-well-threatens-national-park-in-upper-assam- 71464#:~:text=At%20least%202%2C000%20people%20have,in%20Upper%20Assam's%20Tinsukia%20district.&text= A%201.5%20kilometre%2Dradius%20area,a%20statement%20on%20May%2029.)
Mahaney, P. A. (1994). Effects of freshwater petroleum contamination on amphibian hatching and metamorphosis, Environ. Toxicol. Chem., 13, 259.
Malik, A., Ojha, P., Singh, K.P. (2008). Distribution of polycyclic aromatic hydrocarbons in edible fish fromGomti river, India. Bulletin of Environmental Contamination and Toxicology, vol. 80, no. 2, pp. 134–138.
Malik, A., Verma, P., Singh, A.K., Singh, K.P. (2011). Distribution of polycyclic aromatic hydrocarbons in water and bed sediments of the Gomti River, India. Environ Monit Assess,172:529–545.
Malins, D. C., Hodgins, H. O. (1981). Petroleum and marine fishes: A review of uptake, disposition, and effects, Environ. Sci. Technol., 15, 1272.
Marsh, H., and Sinclair, D.F. (1989). Correcting for Visibility Bias in Strip Transect Aerial Surveys of Aquatic Fauna. The Journal of Wildlife Management, Vol. 53, No. 4 (Oct., 1989), pp. 1017-1024
116
Martineau, D., DeGuise, S., Fournier, M., Shugart, L., Girard, C., Lagacé, A., Béland, P. (1994). Pathology and toxicology of beluga whales from the St. Lawrence estuary, Quebec, Canada, past, present and future. Sci. Total Environ. 154:201-215.
Marty, G. D. (1997). Histopathology and cytogenetic evaluation of Pacific herring larvae exposed to petroleum hydrocarbons in the laboratory or in Prince William Sound, Alaska, after the Exxon Valdez oil spill, Can. J. Fish. Aquat. Sci., 54, 1846.
McCall, B. D., & Pennings, S. C. (2012). Disturbance and recovery of salt marsh arthropod communities following BP Deepwater Horizon oil spill. PloS one, 7(3), e32735. https://doi.org/10.1371/journal.pone.0032735
McCauley, Rita N. (1966). “The Biological Effects Of Oil Pollution In A River1: Oil Pollution A River.” Limnology and Oceanography 11 (4): 475–86. https://doi.org/10.4319/lo.1966.11.4.0475.
McGrath, E.A., Alexander, M.M. (1979). Observations on the exposure of larval bullfrogs to fuel oil, Trans. N.E. Sect. Wildl. Soc., 36, 45.
McGurk, D., M. & Brown, D., E. (1996). Egg–larval mortality of Pacific herring in Prince William Sound, Alaska, after the Exxon Valdez oil spill. Canadian Journal of Fisheries and Aquatic Sciences, 53(10), 2343-2354 https://doi.org/10.1139/f96-172
Meador, J.P., Sommers, F.C., Ylitalo, G.M., Sloan, C.A. (2006). Altered growth and related physiological responses in juvenile Chinook salmon (Oncorhynchus tshawytscha) from dietary exposure to polycyclic aromatic hydrocarbons (PAHs). Can. J. Fish. Aquat. Sci. 63: 2364–2376.
Megharaj, M. (2000). Influence of petroleum hydrocarbon contamination on microalgae and microbial activities in a long-term contaminated soil, Arch. Environ. Contam. Toxicol., 38, 439.
Meland, S., Gomes, T., Petersen, K., Håll, J., Lund, E., Kringstad, A. and Grung, M. (2019). Road related pollutants induced DNA damage in dragonfly nymphs (Odonata, Anisoptera) living in highway sedimentation ponds. Scientific reports, 9(1): 1-15.
Mensah, R. K., Harris, W. E., & Beattie, G. A. C. (1995). Response ofHelicoverpa spp. (Lep.: Noctuidae) and their natural enemies to petroleum spray oil in cotton in Australia. Entomophaga, 40(2), 263-272. https://doi.org/10.1007/BF02373072
Mijanur, R. K. M. (2016). Consequences of habitat loss and habitat fragmentation on the survival of monitor lizard populations in Bangladesh: a review and prospectus. J. Bio. Env. Sci, 2016(2), 139–145. Retrieved from http://www.innspub.net
Mitra, S., Bianchi, T.S. (2003). A preliminary assessment of polycyclic aromatic hydrocarbon distributions in the lower Mississippi River and Gulf of Mexico, Mar. Chem., 82(3–4), 273–288, doi:10.1016/ S0304-4203(03)00074-4.
Mote, S., Kumar, R., Naik, B. G., & Ingole, B. S. (2015). Polycyclic aromatic hydrocarbons (PAHS) and n-alkanes in beaked sea snake Enhydrina schistose (Daudin, 1803) from the Mandovi Estuary, Goa. Bulletin of environmental contamination and toxicology, 94(2), 171-177.
Mubina Akhtar, (2020). Baghjan: A classic example of plunder by extracting industries on endangered ecosystems. https://nenow.in/environment/baghjan-a-classic-example-of-plunder-by-extracting-industries-on-endangered-ecosystems.html, NORTHEAST NOW, June 12, 2020 6:22 pm. Accessed on 10 July 2020.
Mullin, K.D., McDonald, T., Wells, R.S., Balmer, B.C., Speakman, T., Sinclair, C., et al. (2017). Density, abundance, survival, and ranging patterns of common bottlenose dolphins (Tursiops truncatus) in Mississippi Sound following the Deepwater Horizon oil spill. PLoS ONE 12(10): e0186265. https://doi.org/10.1371/journal.pone.0186265.
Nacci, D.E., Kohan, M., Pelletier, M., George, E. (2002). Effects of benzo[a]pyrene exposure on a fish population resistant to the toxic effects of dioxin-like compounds. Aquatic Toxicology, vol. 57, no. 4, pp. 203–215.
Narula, P. L., Acharyya, S. K. and Banerjee, J., (2000). Seismotectonic Atlas of India and its Environs, Geological Survey of India, SEISAT-15–17.
National Oceanic and Atmospheric Administration (NOAA), (2015), Ocean explorer, Retrieved from http://oceanexplorer.noaa.gov/explorations/sound01/background/acoustics/acoustics.html
Neff, J.M. (1985). Polycyclic aromatic hydrocarbons, in Fundamentals of Aquatic Toxicology, Rand, G. M. and Petrocilli, S. R., Eds., Hemisphere, New York, Chap. 14.
Nongmaithem, R., Lodhi, M.S., Samal, P.K., Dhyani, P.P. and Sharma, S. (2016). Faunal diversity and threats of the Dibru-Saikhowa Biosphere Reserve: A study from Assam, India. International journal of conservation science, 7(2): 523-532.

117
NRC (National Research Council) (2003). Oil in the Sea III. Inputs, Fates and Effects. The National Academies Press, Washington, D.C., USA.
O’Hara, P. D., Davidson, P., & Burger, A. E. (2009). Aerial surveillance and oil spill impacts based on beached bird survey data collected in southern British Columbia. Marine Ornithology, 37(1), 61–65.
Oakley, K. L., & Kuletz, K. J. (1996). Population, reproduction, and foraging of Pigeon Guillemots at Naked Island, Alaska, before and after the Exxon Valdez oil spill. Proceedings of the Exxon Valdez Oil Spill Symposium, (9), 759–769.
Osuagwu, E. S., Olaifa, E. (2018). Effects of oil spills on fish production in the Niger Delta. PLoS ONE 13(10): e0205114. https://doi.org/10.1371/journal.pone.0205114
Ozigis, M.S.; Kaduk, J.; Jarvis, C.H. (2018). Mapping terrestrial oil spill impact using machine learning random forest and Landsat 8 OLI imagery: A case site within the Niger Delta region of Nigeria. Environ. Sci. Pollut. Res. 26, 3621–3635.
Parsons, K. C. (1994). The Arthur Kill oil spills: Biological effects in birds, in Before and After an Oil Spill: The Arthur Kill, Burger, J., Ed., Rutgers University Press, Rutgers, NJ, 305.
Paruk, J. D., Long, D., Ford, S.L., Evers, D.C. (2014). Common Loons (Gavia immer) wintering off the Louisiana coast tracked to Saskatchewan during the breeding season. Waterbirds (Special Publication 1) 37: 47-52
Pasparakis, C., Esbaugh, A.J., Burggren, W., Grosell M. (2019). Impacts of deepwater horizon oil on fish. Comp Biochem Physiol C Toxicol Pharmacol. 2019;224:108558. doi:10.1016/j.cbpc.2019.06.002
Perez, C. R., Moye, J. K., Cacela, D., Dean, K. M., & Pritsos, C. A. (2017). Low level exposure to crude oil impacts avian flight performance: The Deepwater Horizon oil spill effect on migratory birds. Ecotoxicology and Environmental Safety, 146(June), 98–103. https://doi.org/10.1016/j.ecoenv.2017.05.028
Pérez, C., Velando, A., Munilla, I., López-Alonso, M., Oro, D., (2008). Monitoring polycyclic aromatic hydrocarbon pollution in the marine environment after the Prestige oil spill by means of seabird blood analysis. Environmental Science and Technology 42, 707-713.
Petchey, O. L., Downing, A. L., Mittelbach, G. G., Persson, L., Steiner, C. F., Warren, P. H., & Woodward, G. (2004). Species loss and the structure and functioning of multitrophic aquatic systems. Oikos, 104(3), 467-478.
Peterson, C.H., Rice, S.D., Short, J.W., Esler, D., Bodkin, J.L. Bellachey, B.E., Irons, D.B. (2003). Long-term ecosystem response to the Exxon Valdez oil spill. Science 302:2082- 2086
Piatt, J. F., & Ford, G. R. (1996). How many seabirds were killed by the Exxon Valdez oil spill? American Fisheries Society Symposium, 18(October), 712–719.
Rako-Gospic, N., & Picciulin, M. (2019). Underwater Noise: Sources and Effects on Marine Life. World Seas: An Environmental Evaluation, 367–389. doi:10.1016/b978-0-12-805052-1.00023-1
Ramalhosa, M.J., Paiga, P., Morals, S., Delerue-Matos, C., Oliveira, M.B.P.P. (2009). Analysis of polycyclic aromatic hydrocarbons in fish: evaluation of a quick, easy, cheap, effective, rugged, and safe extraction method. J. Sep. Sci. 32:3529-3538.
Reed, M., Spaulding, L. M., Lorda, E., Walker, H., Saila, B.S.(1984). Oil spill fishery impact assessment modeling: The fisheries recruitment problem, Estuarine, Coastal and Shelf Science, 19, 591-610, ISSN 0272-7714, https://doi.org/10.1016/0272-7714(84)90017-9.
Rice ,D. S., Thomas , E. R., Carls , G. M., Heintz , A. R., Wertheimer , C. A., Murphy , L. M., Short, W.J. & Moles, A. (2001). Impacts to Pink Salmon Following the Exxon Valdez Oil Spill: Persistence, Toxicity, Sensitivity, and Controversy, Reviews in Fisheries Science, 9(3), 165-211.
Rissik, D. & Esdaile, J. (2011). Recovery of fish communities in two freshwater wetlands on Moreton Island impacted by the 'Pacific Adventurer' oil spill [online]. Proceedings of the Royal Society of Queensland,117, 477-483. Availability: <https://search.informit.com.au/documentSummary;dn=552960297263353;res=IELAPA> ISSN: 0080-469X. [cited 24 Jun 20].
Ritabrata, Roy. (2018). “An Introduction to Water Quality Analysis.” International Journal for Environmental Rehabilitation and Conservation IX (2): 94–100. https://doi.org/10.31786/09756272.18.9.2.214.
Roy, P. S., Meiyappan, P., Joshi, P. K., Kale, M. P., Srivastav, V. K., Srivastava, S. K., Behera, M. D., Roy, A., Sharma, Y., Ramachandran, R. M., Bhavani, P., Jain, A. K., & Krishnamurthy, Y. V. N. (2016). Decadal Land Use and Land Cover Classifications across India, 1985, 1995, 2005. ORNL Distributed Active Archive Center. https://doi.org/10.3334/ORNLDAAC/1336
RStudio Team (2020). RStudio: Integrated Development for R. Rstudio, PBC, Boston MA .URL: http://www.rstudio.com/.
118
Rusin, M., & Gospodarek, J. (2016). The Occurrence of Springtails (Collembola) and Spiders (Araneae) as anEffectiveness Indicator of Bioremediation of Soil Contaminated by Petroleum-Derived Substances. International Journal of Environmental Research, 10(3), 449-458. doi: 10.22059/ijer.2016.58764
Santodonato, S., Howard, P., Basu, D. (1981). Health and ecological assessment of polynuclear aromatic hydrocarbons, J. Environ. Pathol. Toxicol., Special Issue, 5.
Sarma, J. N., & Acharjee, S. (2018). A Study on Variation in Channel Width and Braiding Intensity of the Brahmaputra River in Assam, India. Geosciences, 8(9), 343.
Schwacke, L.H, Smith, C.R., Townsend, F. I., Wells, F.S., Hart, L.B., Balmer, B.C., et al. (2013). Health of Common Bottlenose Dolphins (Tursiops truncatus) in Barataria Bay, Louisiana, Following the Deepwater Horizon Oil Spill. dx.doi.org/10.1021/es403610f | Environ. Sci. Technol. 2014, 48, 93−103. © 2013 American Chemical Society.
Seber, G.A.F. (1970). The effects of trap response on tag- recapture estimates. Biometrika 26:13-22. Shailaja, M. S. (1988). The influence of dissolved petroleum hydrocarbon residues on natural phytoplankton biomass, Mar.
Environ. Res., 25, 315. Shaw, M., Tibbetts, I. R., Muller, J. F. (2004). Monitoring PAHs in the Brisbane River and Moreton Bay, Australia, using
semipermeable membrane devices and EROD activity in yellowfin bream, Acanthopagrus australis. Chemosphere, 56, 237–246.
Shi, Z., Tao, S., Pan, B., Fan, W., He, X.C., Zuo, Q., Wu, S.P., Li, B.G., Cao, J., Liu, W.X., Xu, F.L., Wang, X.J., Shen, W.R., Wong, P.K. (2005). Contamination of rivers in Tianjin, China by polycyclic aromatic hydrocarbons. Environ. Pollut. 134, 97–111
Short, J. (2010). Long-Term Effects of Crude Oil on Developing Fish: Lessons from the Exxon Valdez Oil Spill. Energy Sources, Energy Sources, 2003 - Taylor & Francis, 25(6), 509-517.
Smith, B.D., Braulik, G., Strindberg, S., Ahmed, B., and Mansur, R. (2006). Abundance of Irrawaddy dolphins (Orcaella brevirostris) and Ganges River dolphins (Platanista gangetica gangetica) estimated using concurrent counts made by independent teams in waterways of the Sundarbans mangrove forest in Bangladesh. Marine Mammal Science 22: 527–547.
Smith, D. C. (2005). Rehabilitating oiled aquatic birds. 2005 International Oil Spill Conference, IOSC 2005, 6869. Smultea, M.A and Würsig, B.,(1995). Behavioral reactions of bottlenose dolphins to the Mega Borg oil spill, Gulf of Mexico
1990. Aquatic Mammals 1995, 21.3, 171–181 Snyder, S.M., Pulster, E.L., Wetzel, D.L., Murawski, S.A. (2015). PAH exposure in Gulf of Mexico demersal fishes, post-
Deepwater Horizon. Environ. Sci. Technol. 2015, 49, 8786–8795. Souza-Bastos, R. L. & Freire, C. (2011). Osmoregulation of the resident estuarine fish Atherinella brasiliensis was still affected
by an oil spill (Vicuna tanker, Paranagua Bay, Brazil), 7 months after the accident. The Science of the total environment, 409(7), 1229-34. 10.1016/j.scitotenv.2010.08.035.
Sparling, D., Rattner, B. A. and Barclay, J. S. (2010). The Toll of Toxics: Investigating Environmental Contaminants. The Wildlife Society, 4(2):24-30.
Symens, P., & Suhaibani, A. (1994). The impact of the 1991 Gulf War oil spill on bird populations in the northern Arabian Gulf - a review. 47–54.
Szaro, R. C. (1976). Effects of Petroleum on Birds. (Hartung 1967), 374–381. Takeshita, R., Sullivan, L., Smith, C., Collier, T., Hall, A., Brosnan, T., Rowles, T., Schwacke, L. (2017). The Deepwater Horizon
oil spill marine mammal injury assessment. Endang Species Res 33:95-106.
Thermal Infrared Sensor (TIRS) « Landsat Science. (n.d.). Retrieved July 12, 2020, from https://landsat.gsfc.nasa.gov/thermal-infrared-sensor-tirs/
Thomas, P., Budiantara, L. (1995). Reproductive life history stages sensitive to oil and naphthalene in Atlantic croaker, Mar. Environ. Res., 39, 147.
Tinsukia Check List · iNaturalist. (n.d.). Retrieved July 11, 2020, from https://www.inaturalist.org/check_lists/34848-Tinsukia-Check-List
Tseng, F. S. (1993). Care of oiled seabirds: A veterinary perspective, in Proc. 1993 Int. Oil Spill Conf., Publ. 4580, American Petroleum Institute, Washington, D.C., 421.
119
U.S. Environmental Protection Agency (EPA). (2002). Provisional Peer Reviewed Toxicity Values for Fluorene (CASRN 86-73-7). Washington, DC.
USEPA, (2012). Methodology Document for The Ecological Structure–Activity Relationship Model (ECOSAR) Class Program. United States Environmental Protection Agency, Washington, DC, USA
Venn-Watson, S., Colegrove, K.M., Litz, J., Kinsel, M., Terio, K., Saliki, J. (2015). Adrenal Gland and Lung Lesions in Gulf of Mexico Common Bottlenose Dolphins (Tursiops truncatus) Found Dead following the Deepwater Horizon Oil Spill. PLoS ONE 10(5): e0126538. https://doi.org/10.1371/journal.pone.0126538
Vermeer, K., Vermeer, R. (1975). Oil threat to birds on the Canadian coast, Can. Field-Nat., 89, 278. Vidal, C.B., Barros, A.L., Moura, C.P., de Lima, A.C.A., Dias, F.S., Vasconcellos, L.C.G., Fechine, P.B.A., Nascimento, R.F.
(2011). Adsorption of polycyclic aromatic hydrocarbons from aqueous solutions by modified periodic mesoporous organosilica. J. Colloid Interface Sci. 357, 466-473.
Vidal, M., & Domínguez, J. (2015). Did the Prestige oil spill compromise bird reproductive performance? Evidences from long-term data on the Kentish Plover (Charadrius alexandrinus) in NW Iberian Peninsula. Biological Conservation, 191, 178–184. https://doi.org/10.1016/j.biocon.2015.06.031
Vignet, C., Larcher, T., Davail, B., Joassard, L., Menach, K.L., Guionnet, T., Lyphout, L., Ledevin, M., Goubeau, M., Budzinski, H., Begout, M.L., Cousin, X. (2016). Fish reproduction is disrupted upon lifelong exposure to environmental PAHs fractions revealing different modes of action. Toxics 4 (4), 26.
Walton, P. (1997). Sub-lethal effects of an oil pollution incident on breeding kittiwakes, Rissa tridactyla, Mar. Ecol. Prog. Ser., 155, 261.
Wang, J.Z., Nie, Y.F., Luo, X.L. Zeng, E.Y. (2008). Yellow River occurrence and phase distribution of polycyclic aromatic hydrocarbons in riverine runoff of the Pearl Delta, China. Marine Pollution Bulletin, 57, 767–774.
Ward, E.J., Oken, K.L., Rose, K.A. et al. (2018). Applying spatiotemporal models to monitoring data to quantify fish population responses to the Deepwater Horizon oil spill in the Gulf of Mexico. Environ Monit Assess, 190, 530. https://doi.org/10.1007/s10661-018-6912-z
What Noises Cause Hearing Loss? | NCEH | CDC. (n.d.). Retrieved July 16, 2020, from https://www.cdc.gov/nceh/hearing_loss/what_noises_cause_hearing_loss.html
Wiens, J. A., Crist, T. O., Day, R. H., Murphy, S. M., & Hayward, G. D. (1996). Effects of the Exxon valdez oil spill on marine bird communities in Prince William Sound, Alaska. Ecological Applications, 6(3), 828–841. https://doi.org/10.2307/2269488
Wiley, Michael. (2006). Geomorphology and River Management. Wetlands. 26. 884-885. https://doi.org/10.1672/0277-5212(2006)26[884:GARM]2.0.CO;2.
Woodward, D. F., Riley, R. G., Smith, C. E. (1983). Accumulation, sublethal effects, and safe concentration of a refined oil as evaluated with cutthroat trout, Arch. Environ. Contam. Toxicol., 12, 455.
World Health Organisation (WHO). Guidelines for drinking-water quality. 4th ed. Geneva. (2011). Wright, A.J., Soto, N.A., Baldwin, A.L., Bateson, M., Beale, C.M., Clark, C., Deak, T., Edwards, E.F., Fernández, A., Godinho,
A. and Hatch, L.T., (2007). Do marine mammals experience stress related to anthropogenic noise?. International Journal of Comparative Psychology, 20(2).
Wu, B., Zhang, R., Cheng, S. P., Ford, T., Li, A. M., Zhang, X.X. (2011). Risk assessment of polycyclic aromatic hydrocarbons in aquatic ecosystems. Ecotoxicology (London, England), 20(5), 1124–1130.
Wu, H., Sun, B., Li, J. (2019). Polycyclic Aromatic Hydrocarbons in Sediments/Soils of the Rapidly Urbanized Lower Reaches of the River Chaohu, China. Int. J. Environ. Res. Public Health, 16, 2302.
Yancheshmeh, R.A., Bakhtiari, A.R., Mortazavi, S., Savabieasfahani, M. (2014). Sediment PAH: Contrasting levels in the Caspian Sea and Anzali wetland. Mar. Pollut. Bull, 84, 391–400.
Zabik, M.E., Booren, A., Zabik, M.J., Welch, R., Humphrey, H. (1996). Pesticide residues, PCBs and PAHs in baked, charbroiled, salt boiled and smoked Great Lakes lake trout. Food Chem, 55, 231–239.
Zeng, X.Y. Liu, J. He, L.X. Liu, Z.Y. Yu, Z.Q. Sheng, G.Y. Fu, J.M. (2016). Occurrence of organic pollutant in sediments from several river mouths in western part of Taihu Lake and their potential environmental significance. Asian J. Ecotoxicol. 11, 465–472.

120
Zhao, Z., Qin, Z., Cao, J., & Xia, L. (2017). Source and ecological risk characteristics of PAHs in sediments from Qinhuai River and Xuanwu Lake, Nanjing, China. Journal of Chemistry, 2017.
Zhi, H., Zhao, Z., Zhang, L. (2015). The fate of polycyclic aromatic hydrocarbons (PAHs) and organochlorine pesticides (OCPs) in water from Poyang Lake, the largest freshwater lake in China. Chemosphere, 119, 1134–1140.
Zobell, C. E; (1946). Action of microorganisms on hydrocarbons. Bacterial. Rev., 10: l-49. -. 1963. The occurrence, effects, and fate of oil polluting the sea. Intern. J. Air Water Pollution, 7: 173-198.
Zuberogoitia, I., Martínez, J. A., Iraeta, A., Azkona, A., Zabala, J., Jiménez, B., Gómez, G. (2006). Short-term effects of the prestige oil spill on the peregrine falcon (Falco peregrinus). Marine Pollution Bulletin, 52(10), 1176–1181. https://doi.org/10.1016/j.marpolbul.2006.02.016
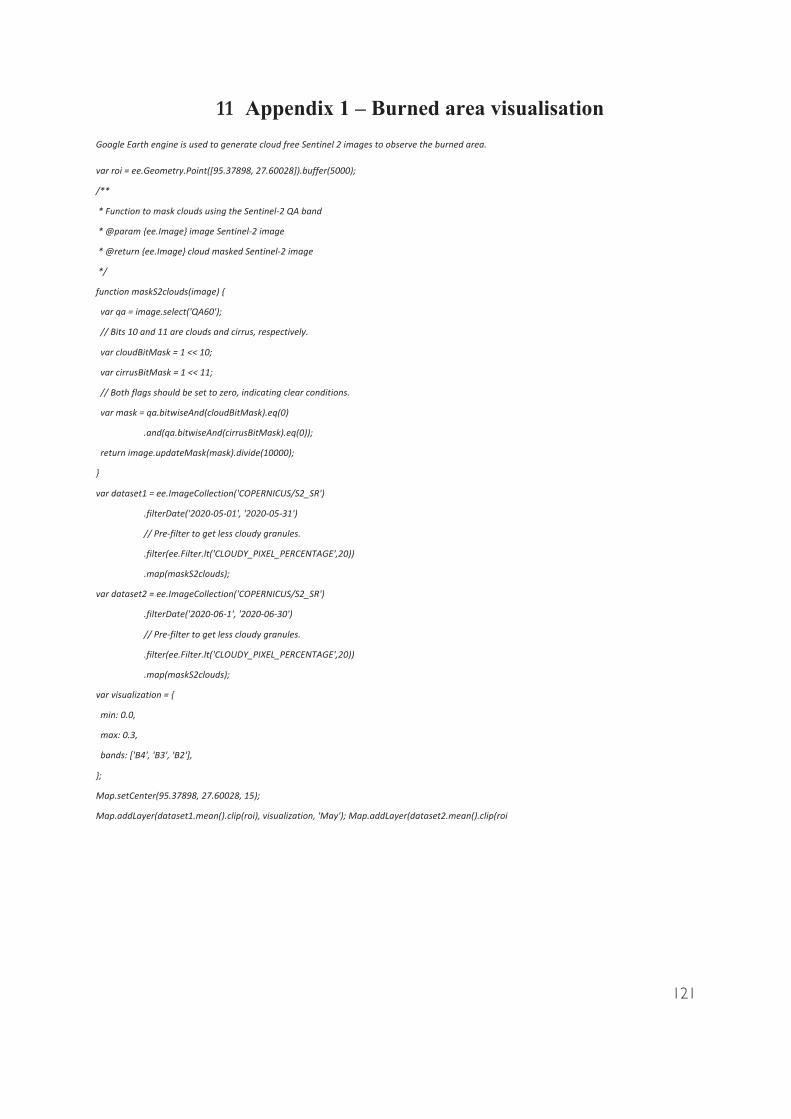
121
11
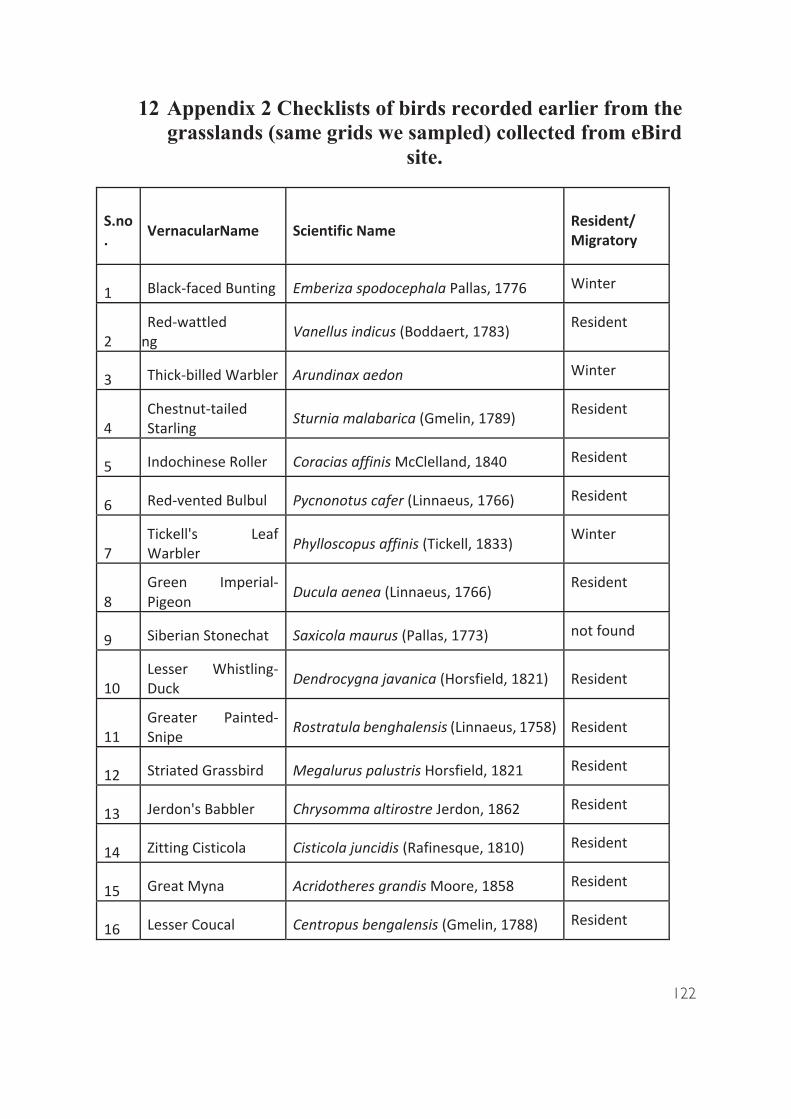
122

123

124

125

126
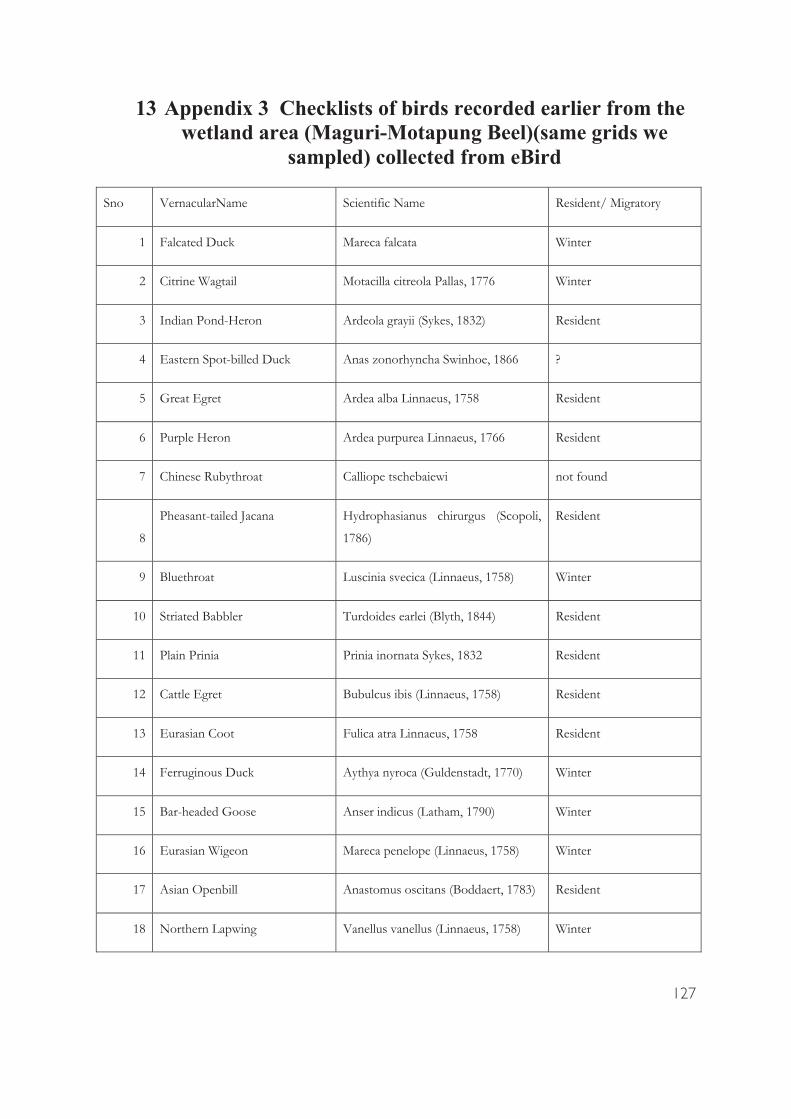
127
Sno VernacularName Scientific Name Resident/ Migratory
1 Falcated Duck Mareca falcata Winter
2 Citrine Wagtail Motacilla citreola Pallas, 1776 Winter
3 Indian Pond-Heron Ardeola grayii (Sykes, 1832) Resident
4 Eastern Spot-billed Duck Anas zonorhyncha Swinhoe, 1866 ?
5 Great Egret Ardea alba Linnaeus, 1758 Resident
6 Purple Heron Ardea purpurea Linnaeus, 1766 Resident
7 Chinese Rubythroat Calliope tschebaiewi not found
8
Pheasant-tailed Jacana Hydrophasianus chirurgus (Scopoli,
1786)
Resident
9 Bluethroat Luscinia svecica (Linnaeus, 1758) Winter
10 Striated Babbler Turdoides earlei (Blyth, 1844) Resident
11 Plain Prinia Prinia inornata Sykes, 1832 Resident
12 Cattle Egret Bubulcus ibis (Linnaeus, 1758) Resident
13 Eurasian Coot Fulica atra Linnaeus, 1758 Resident
14 Ferruginous Duck Aythya nyroca (Guldenstadt, 1770) Winter
15 Bar-headed Goose Anser indicus (Latham, 1790) Winter
16 Eurasian Wigeon Mareca penelope (Linnaeus, 1758) Winter
17 Asian Openbill Anastomus oscitans (Boddaert, 1783) Resident
18 Northern Lapwing Vanellus vanellus (Linnaeus, 1758) Winter
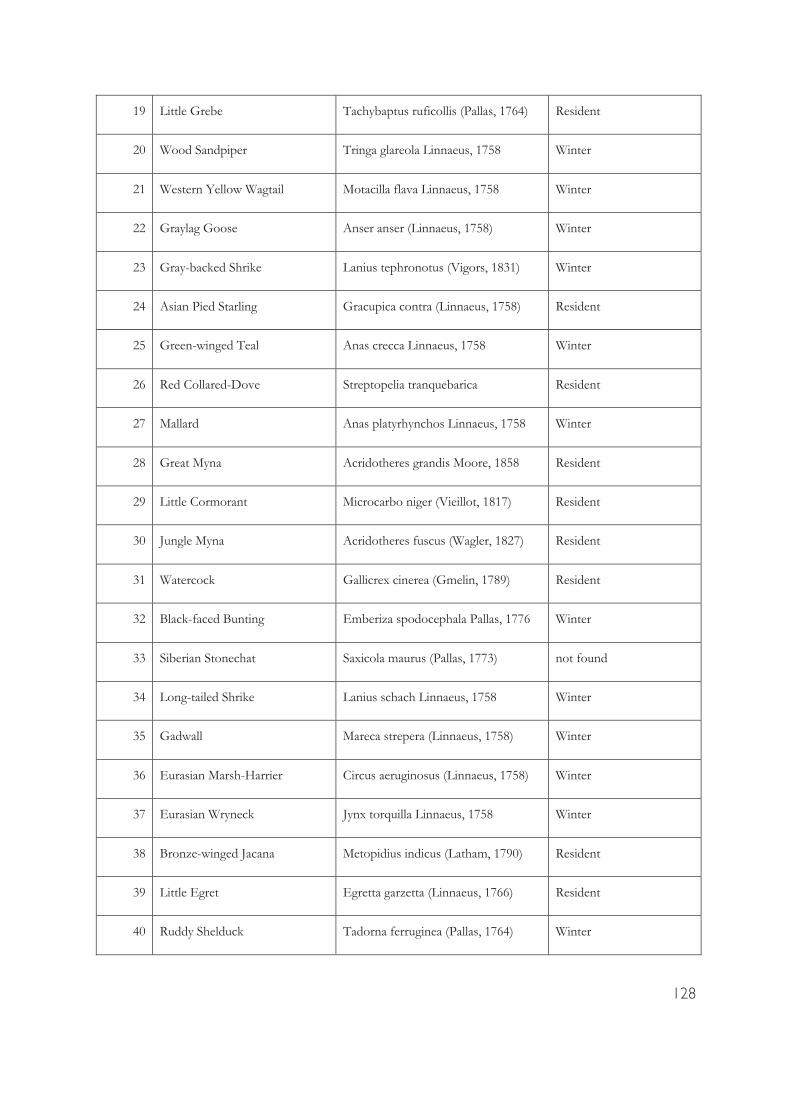
128
19 Little Grebe Tachybaptus ruficollis (Pallas, 1764) Resident
20 Wood Sandpiper Tringa glareola Linnaeus, 1758 Winter
21 Western Yellow Wagtail Motacilla flava Linnaeus, 1758 Winter
22 Graylag Goose Anser anser (Linnaeus, 1758) Winter
23 Gray-backed Shrike Lanius tephronotus (Vigors, 1831) Winter
24 Asian Pied Starling Gracupica contra (Linnaeus, 1758) Resident
25 Green-winged Teal Anas crecca Linnaeus, 1758 Winter
26 Red Collared-Dove Streptopelia tranquebarica Resident
27 Mallard Anas platyrhynchos Linnaeus, 1758 Winter
28 Great Myna Acridotheres grandis Moore, 1858 Resident
29 Little Cormorant Microcarbo niger (Vieillot, 1817) Resident
30 Jungle Myna Acridotheres fuscus (Wagler, 1827) Resident
31 Watercock Gallicrex cinerea (Gmelin, 1789) Resident
32 Black-faced Bunting Emberiza spodocephala Pallas, 1776 Winter
33 Siberian Stonechat Saxicola maurus (Pallas, 1773) not found
34 Long-tailed Shrike Lanius schach Linnaeus, 1758 Winter
35 Gadwall Mareca strepera (Linnaeus, 1758) Winter
36 Eurasian Marsh-Harrier Circus aeruginosus (Linnaeus, 1758) Winter
37 Eurasian Wryneck Jynx torquilla Linnaeus, 1758 Winter
38 Bronze-winged Jacana Metopidius indicus (Latham, 1790) Resident
39 Little Egret Egretta garzetta (Linnaeus, 1766) Resident
40 Ruddy Shelduck Tadorna ferruginea (Pallas, 1764) Winter
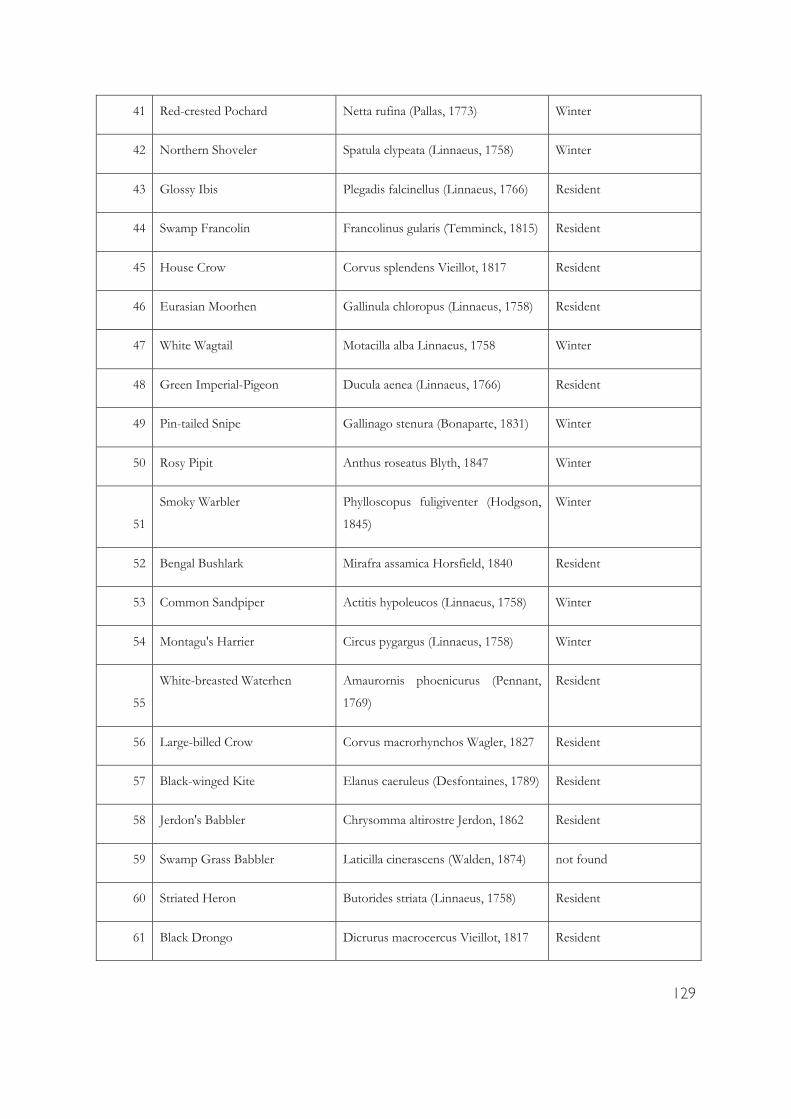
129
41 Red-crested Pochard Netta rufina (Pallas, 1773) Winter
42 Northern Shoveler Spatula clypeata (Linnaeus, 1758) Winter
43 Glossy Ibis Plegadis falcinellus (Linnaeus, 1766) Resident
44 Swamp Francolin Francolinus gularis (Temminck, 1815) Resident
45 House Crow Corvus splendens Vieillot, 1817 Resident
46 Eurasian Moorhen Gallinula chloropus (Linnaeus, 1758) Resident
47 White Wagtail Motacilla alba Linnaeus, 1758 Winter
48 Green Imperial-Pigeon Ducula aenea (Linnaeus, 1766) Resident
49 Pin-tailed Snipe Gallinago stenura (Bonaparte, 1831) Winter
50 Rosy Pipit Anthus roseatus Blyth, 1847 Winter
51
Smoky Warbler Phylloscopus fuligiventer (Hodgson,
1845)
Winter
52 Bengal Bushlark Mirafra assamica Horsfield, 1840 Resident
53 Common Sandpiper Actitis hypoleucos (Linnaeus, 1758) Winter
54 Montagu's Harrier Circus pygargus (Linnaeus, 1758) Winter
55
White-breasted Waterhen Amaurornis phoenicurus (Pennant,
1769)
Resident
56 Large-billed Crow Corvus macrorhynchos Wagler, 1827 Resident
57 Black-winged Kite Elanus caeruleus (Desfontaines, 1789) Resident
58 Jerdon's Babbler Chrysomma altirostre Jerdon, 1862 Resident
59 Swamp Grass Babbler Laticilla cinerascens (Walden, 1874) not found
60 Striated Heron Butorides striata (Linnaeus, 1758) Resident
61 Black Drongo Dicrurus macrocercus Vieillot, 1817 Resident
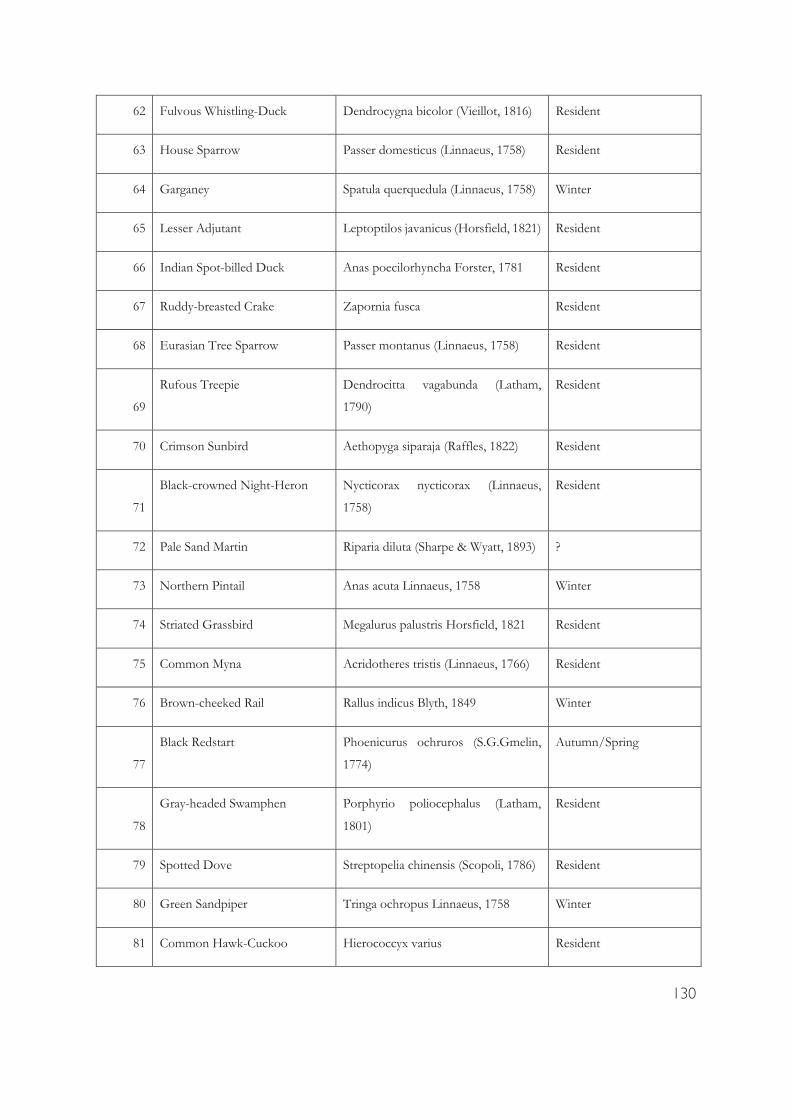
130
62 Fulvous Whistling-Duck Dendrocygna bicolor (Vieillot, 1816) Resident
63 House Sparrow Passer domesticus (Linnaeus, 1758) Resident
64 Garganey Spatula querquedula (Linnaeus, 1758) Winter
65 Lesser Adjutant Leptoptilos javanicus (Horsfield, 1821) Resident
66 Indian Spot-billed Duck Anas poecilorhyncha Forster, 1781 Resident
67 Ruddy-breasted Crake Zapornia fusca Resident
68 Eurasian Tree Sparrow Passer montanus (Linnaeus, 1758) Resident
69
Rufous Treepie Dendrocitta vagabunda (Latham,
1790)
Resident
70 Crimson Sunbird Aethopyga siparaja (Raffles, 1822) Resident
71
Black-crowned Night-Heron Nycticorax nycticorax (Linnaeus,
1758)
Resident
72 Pale Sand Martin Riparia diluta (Sharpe & Wyatt, 1893) ?
73 Northern Pintail Anas acuta Linnaeus, 1758 Winter
74 Striated Grassbird Megalurus palustris Horsfield, 1821 Resident
75 Common Myna Acridotheres tristis (Linnaeus, 1766) Resident
76 Brown-cheeked Rail Rallus indicus Blyth, 1849 Winter
77
Black Redstart Phoenicurus ochruros (S.G.Gmelin,
1774)
Autumn/Spring
78
Gray-headed Swamphen Porphyrio poliocephalus (Latham,
1801)
Resident
79 Spotted Dove Streptopelia chinensis (Scopoli, 1786) Resident
80 Green Sandpiper Tringa ochropus Linnaeus, 1758 Winter
81 Common Hawk-Cuckoo Hierococcyx varius Resident

131
82 Red-wattled Lapwing Vanellus indicus (Boddaert, 1783) Resident
83 Himalayan Griffon Gyps himalayensis Hume, 1869 Winter
84 Chestnut-capped Babbler Timalia pileata Horsfield, 1821 Resident
85 Slender-billed Vulture Gyps tenuirostris G.R.Gray, 1844 Resident
86 Chestnut-eared Bunting Emberiza fucata Winter
87 Yellow Bittern Ixobrychus sinensis Resident
88 Common Pochard Aythya ferina (Linnaeus, 1758) Winter
89 Paddyfield Warbler Acrocephalus agricola (Jerdon, 1845) Winter
90 Dusky Warbler Phylloscopus fuscatus (Blyth, 1842) Winter
91 Hen Harrier Circus cyaneus (Linnaeus, 1766) Winter
92 Common Kingfisher Alcedo atthis (Linnaeus, 1758) Resident
93 Ashy Woodswallow Artamus fuscus Vieillot, 1817 Resident
94 Gray Wagtail Motacilla cinerea Tunstall, 1771 Winter
95 Spotted Bush Warbler Locustella thoracica (Blyth, 1845) Winter
96 Pied Harrier Circus melanoleucos (Pennant, 1769) Winter
97 Pied Kingfisher Ceryle rudis (Linnaeus, 1758) Resident
98 Chestnut Munia Lonchura atricapilla (Vieillot, 1807) Resident
99 Little Ringed Plover Charadrius dubius Scopoli, 1786 Resident
100
Lesser Whistling-Duck Dendrocygna javanica (Horsfield,
1821)
Resident
101 Stork-billed Kingfisher Pelargopsis capensis (Linnaeus, 1766) Resident
102
Oriental Honey-buzzard Pernis ptilorhynchus (Temminck,
1821)
Resident
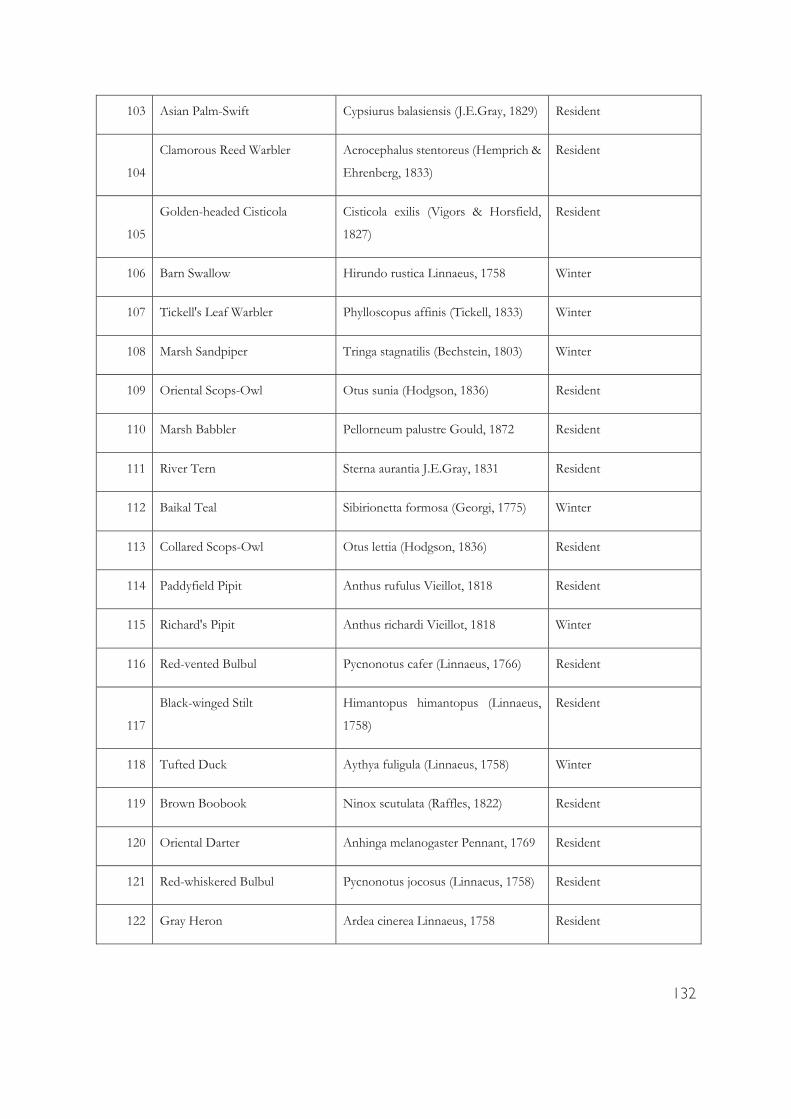
132
103 Asian Palm-Swift Cypsiurus balasiensis (J.E.Gray, 1829) Resident
104
Clamorous Reed Warbler Acrocephalus stentoreus (Hemprich &
Ehrenberg, 1833)
Resident
105
Golden-headed Cisticola Cisticola exilis (Vigors & Horsfield,
1827)
Resident
106 Barn Swallow Hirundo rustica Linnaeus, 1758 Winter
107 Tickell's Leaf Warbler Phylloscopus affinis (Tickell, 1833) Winter
108 Marsh Sandpiper Tringa stagnatilis (Bechstein, 1803) Winter
109 Oriental Scops-Owl Otus sunia (Hodgson, 1836) Resident
110 Marsh Babbler Pellorneum palustre Gould, 1872 Resident
111 River Tern Sterna aurantia J.E.Gray, 1831 Resident
112 Baikal Teal Sibirionetta formosa (Georgi, 1775) Winter
113 Collared Scops-Owl Otus lettia (Hodgson, 1836) Resident
114 Paddyfield Pipit Anthus rufulus Vieillot, 1818 Resident
115 Richard's Pipit Anthus richardi Vieillot, 1818 Winter
116 Red-vented Bulbul Pycnonotus cafer (Linnaeus, 1766) Resident
117
Black-winged Stilt Himantopus himantopus (Linnaeus,
1758)
Resident
118 Tufted Duck Aythya fuligula (Linnaeus, 1758) Winter
119 Brown Boobook Ninox scutulata (Raffles, 1822) Resident
120 Oriental Darter Anhinga melanogaster Pennant, 1769 Resident
121 Red-whiskered Bulbul Pycnonotus jocosus (Linnaeus, 1758) Resident
122 Gray Heron Ardea cinerea Linnaeus, 1758 Resident

133
123 Temminck's Stint Calidris temminckii (Leisler, 1812) Winter
124 Shikra Accipiter badius (Gmelin, 1788) Resident
125 Baya Weaver Ploceus philippinus (Linnaeus, 1766) Resident
126 Yellow-bellied Prinia Prinia flaviventris (Delessert, 1840) Resident
127 Intermediate Egret Ardea intermedia Wagler, 1827 Resident
128 Eurasian Sparrowhawk Accipiter nisus (Linnaeus, 1758) Resident
129 Whiskered Tern Chlidonias hybrida Winter
130 Great Cormorant Phalacrocorax carbo (Linnaeus, 1758) Winter
131 Common Tailorbird Orthotomus sutorius (Pennant, 1769) Resident
132 Oriental Magpie-Robin Copsychus saularis (Linnaeus, 1758) Resident
133
Cotton Pygmy-Goose Nettapus coromandelianus (Gmelin,
1789)
Resident
134 Oriental Skylark Alauda gulgula Franklin, 1831 Resident
135 Zitting Cisticola Cisticola juncidis (Rafinesque, 1810) Resident
136 Baikal Bush Warbler Locustella davidi (La Touche, 1923) ?
137 Common Snipe Gallinago gallinago (Linnaeus, 1758) Winter
138
Kentish Plover Charadrius alexandrinus Linnaeus,
1758
Winter
139 Asian Barred Owlet Glaucidium cuculoides (Vigors, 1831) Resident
140 Himalayan Shortwing Brachypteryx cruralis not found
141 Cinereous Tit Parus cinereus Vieillot, 1818 Resident
142 Black Stork Ciconia nigra (Linnaeus, 1758) Winter
143 White-rumped Vulture Gyps bengalensis (Gmelin, 1788) Resident
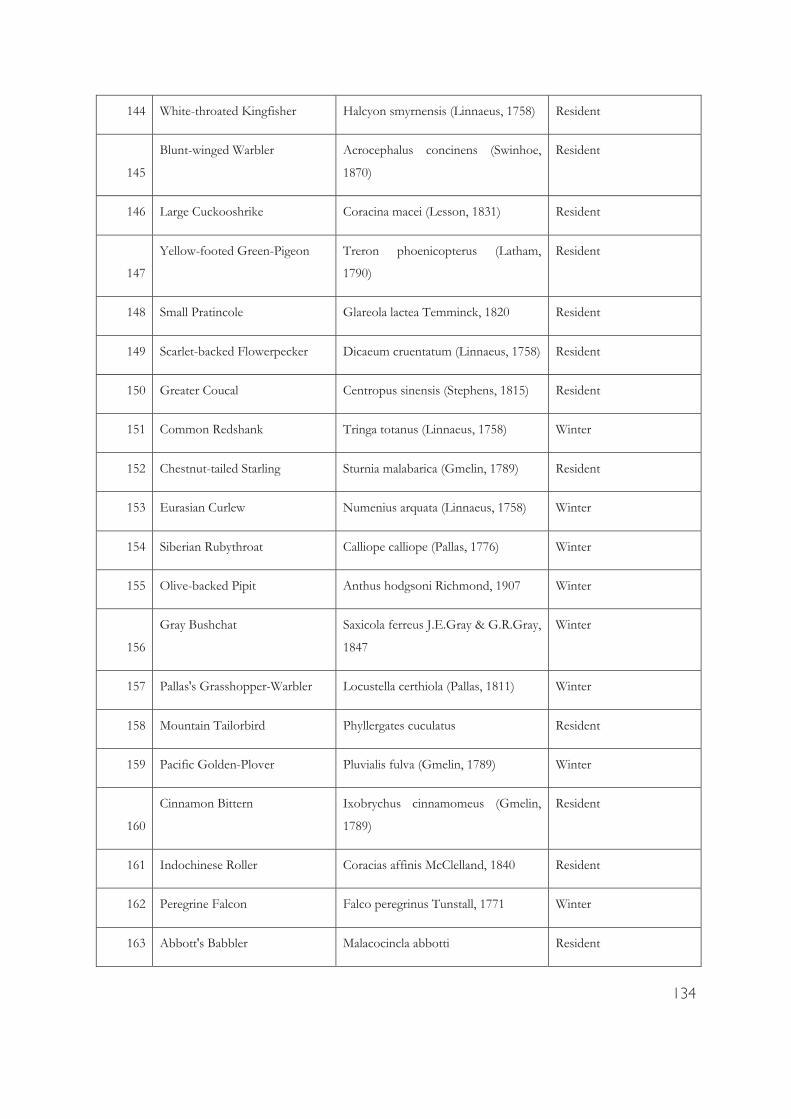
134
144 White-throated Kingfisher Halcyon smyrnensis (Linnaeus, 1758) Resident
145
Blunt-winged Warbler Acrocephalus concinens (Swinhoe,
1870)
Resident
146 Large Cuckooshrike Coracina macei (Lesson, 1831) Resident
147
Yellow-footed Green-Pigeon Treron phoenicopterus (Latham,
1790)
Resident
148 Small Pratincole Glareola lactea Temminck, 1820 Resident
149 Scarlet-backed Flowerpecker Dicaeum cruentatum (Linnaeus, 1758) Resident
150 Greater Coucal Centropus sinensis (Stephens, 1815) Resident
151 Common Redshank Tringa totanus (Linnaeus, 1758) Winter
152 Chestnut-tailed Starling Sturnia malabarica (Gmelin, 1789) Resident
153 Eurasian Curlew Numenius arquata (Linnaeus, 1758) Winter
154 Siberian Rubythroat Calliope calliope (Pallas, 1776) Winter
155 Olive-backed Pipit Anthus hodgsoni Richmond, 1907 Winter
156
Gray Bushchat Saxicola ferreus J.E.Gray & G.R.Gray,
1847
Winter
157 Pallas's Grasshopper-Warbler Locustella certhiola (Pallas, 1811) Winter
158 Mountain Tailorbird Phyllergates cuculatus Resident
159 Pacific Golden-Plover Pluvialis fulva (Gmelin, 1789) Winter
160
Cinnamon Bittern Ixobrychus cinnamomeus (Gmelin,
1789)
Resident
161 Indochinese Roller Coracias affinis McClelland, 1840 Resident
162 Peregrine Falcon Falco peregrinus Tunstall, 1771 Winter
163 Abbott's Babbler Malacocincla abbotti Resident
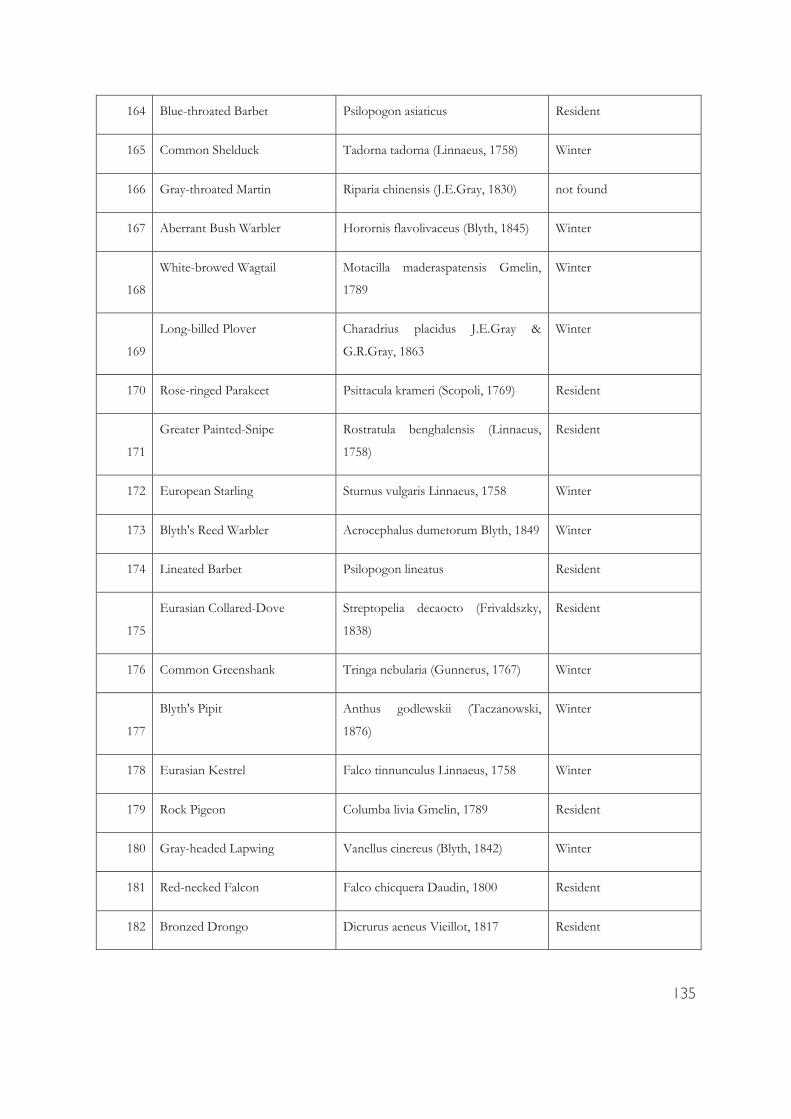
135
164 Blue-throated Barbet Psilopogon asiaticus Resident
165 Common Shelduck Tadorna tadorna (Linnaeus, 1758) Winter
166 Gray-throated Martin Riparia chinensis (J.E.Gray, 1830) not found
167 Aberrant Bush Warbler Horornis flavolivaceus (Blyth, 1845) Winter
168
White-browed Wagtail Motacilla maderaspatensis Gmelin,
1789
Winter
169
Long-billed Plover Charadrius placidus J.E.Gray &
G.R.Gray, 1863
Winter
170 Rose-ringed Parakeet Psittacula krameri (Scopoli, 1769) Resident
171
Greater Painted-Snipe Rostratula benghalensis (Linnaeus,
1758)
Resident
172 European Starling Sturnus vulgaris Linnaeus, 1758 Winter
173 Blyth's Reed Warbler Acrocephalus dumetorum Blyth, 1849 Winter
174 Lineated Barbet Psilopogon lineatus Resident
175
Eurasian Collared-Dove Streptopelia decaocto (Frivaldszky,
1838)
Resident
176 Common Greenshank Tringa nebularia (Gunnerus, 1767) Winter
177
Blyth's Pipit Anthus godlewskii (Taczanowski,
1876)
Winter
178 Eurasian Kestrel Falco tinnunculus Linnaeus, 1758 Winter
179 Rock Pigeon Columba livia Gmelin, 1789 Resident
180 Gray-headed Lapwing Vanellus cinereus (Blyth, 1842) Winter
181 Red-necked Falcon Falco chicquera Daudin, 1800 Resident
182 Bronzed Drongo Dicrurus aeneus Vieillot, 1817 Resident
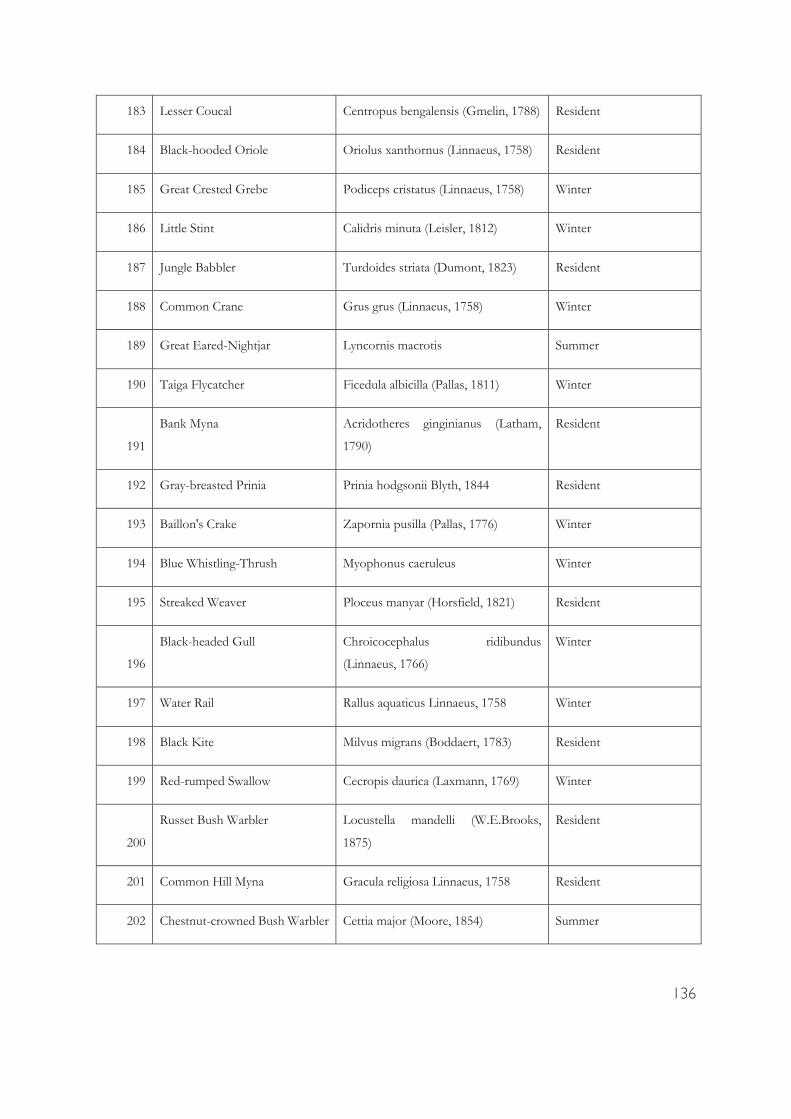
136
183 Lesser Coucal Centropus bengalensis (Gmelin, 1788) Resident
184 Black-hooded Oriole Oriolus xanthornus (Linnaeus, 1758) Resident
185 Great Crested Grebe Podiceps cristatus (Linnaeus, 1758) Winter
186 Little Stint Calidris minuta (Leisler, 1812) Winter
187 Jungle Babbler Turdoides striata (Dumont, 1823) Resident
188 Common Crane Grus grus (Linnaeus, 1758) Winter
189 Great Eared-Nightjar Lyncornis macrotis Summer
190 Taiga Flycatcher Ficedula albicilla (Pallas, 1811) Winter
191
Bank Myna Acridotheres ginginianus (Latham,
1790)
Resident
192 Gray-breasted Prinia Prinia hodgsonii Blyth, 1844 Resident
193 Baillon's Crake Zapornia pusilla (Pallas, 1776) Winter
194 Blue Whistling-Thrush Myophonus caeruleus Winter
195 Streaked Weaver Ploceus manyar (Horsfield, 1821) Resident
196
Black-headed Gull Chroicocephalus ridibundus
(Linnaeus, 1766)
Winter
197 Water Rail Rallus aquaticus Linnaeus, 1758 Winter
198 Black Kite Milvus migrans (Boddaert, 1783) Resident
199 Red-rumped Swallow Cecropis daurica (Laxmann, 1769) Winter
200
Russet Bush Warbler Locustella mandelli (W.E.Brooks,
1875)
Resident
201 Common Hill Myna Gracula religiosa Linnaeus, 1758 Resident
202 Chestnut-crowned Bush Warbler Cettia major (Moore, 1854) Summer

137
203 Oriental Turtle-Dove Streptopelia orientalis (Latham, 1790) Resident
204 Brown Crake Zapornia akool Resident
205 Ashy Prinia Prinia socialis Sykes, 1832 Resident
206 Brown Shrike Lanius cristatus Linnaeus, 1758 Winter
207
Jack Snipe Lymnocryptes minimus (Brunnich,
1764)
Winter
208 Asian Koel Eudynamys scolopaceus Resident
209 Greater Spotted Eagle Clanga clanga (Pallas, 1811) Winter
210 Graceful Prinia Prinia gracilis (Lichtenstein, 1823) Resident
211 Coppersmith Barbet
Psilopogon haemacephalus (M├╝ller,
1776)
Resident
212 Streak-throated Woodpecker
Picus xanthopygaeus (J.E.Gray &
G.R.Gray, 1847)
Resident
213 Spot-billed Pelican Pelecanus philippensis Gmelin, 1789 Resident
214 Thick-billed Warbler Arundinax aedon Winter
215 Red-breasted Parakeet Psittacula alexandri (Linnaeus, 1758) Resident
216 Baer's Pochard Aythya baeri (Radde, 1863) Winter
217 Hair-crested Drongo
Dicrurus hottentottus (Linnaeus,
1766)
Resident
218 Gray-headed Canary-Flycatcher
Culicicapa ceylonensis (Swainson,
1820)
Winter
219 Indian White-eye
Zosterops palpebrosus (Temminck,
1824)
Resident
220 Alexandrine Parakeet Psittacula eupatria (Linnaeus, 1766) Resident
221 Black-breasted Parrotbill Paradoxornis flavirostris Gould, 1836 Resident
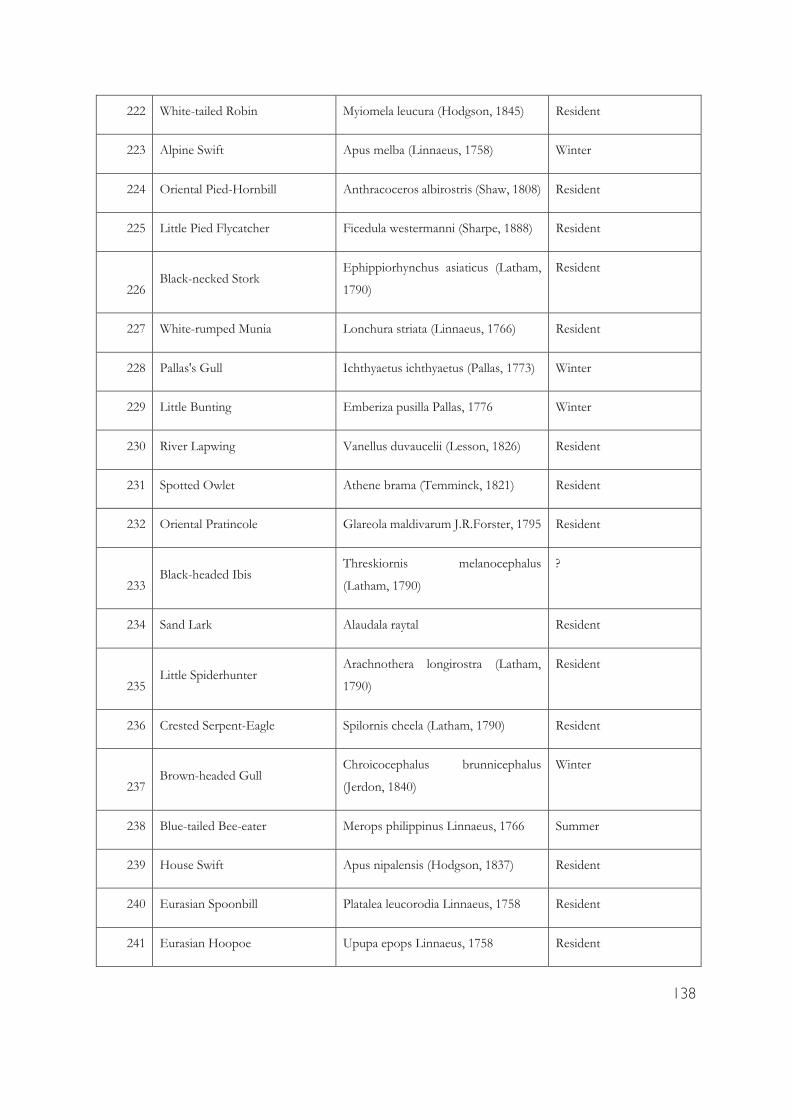
138
222 White-tailed Robin Myiomela leucura (Hodgson, 1845) Resident
223 Alpine Swift Apus melba (Linnaeus, 1758) Winter
224 Oriental Pied-Hornbill Anthracoceros albirostris (Shaw, 1808) Resident
225 Little Pied Flycatcher Ficedula westermanni (Sharpe, 1888) Resident
226 Black-necked Stork
Ephippiorhynchus asiaticus (Latham,
1790)
Resident
227 White-rumped Munia Lonchura striata (Linnaeus, 1766) Resident
228 Pallas's Gull Ichthyaetus ichthyaetus (Pallas, 1773) Winter
229 Little Bunting Emberiza pusilla Pallas, 1776 Winter
230 River Lapwing Vanellus duvaucelii (Lesson, 1826) Resident
231 Spotted Owlet Athene brama (Temminck, 1821) Resident
232 Oriental Pratincole Glareola maldivarum J.R.Forster, 1795 Resident
233 Black-headed Ibis
Threskiornis melanocephalus
(Latham, 1790)
?
234 Sand Lark Alaudala raytal Resident
235 Little Spiderhunter
Arachnothera longirostra (Latham,
1790)
Resident
236 Crested Serpent-Eagle Spilornis cheela (Latham, 1790) Resident
237 Brown-headed Gull
Chroicocephalus brunnicephalus
(Jerdon, 1840)
Winter
238 Blue-tailed Bee-eater Merops philippinus Linnaeus, 1766 Summer
239 House Swift Apus nipalensis (Hodgson, 1837) Resident
240 Eurasian Spoonbill Platalea leucorodia Linnaeus, 1758 Resident
241 Eurasian Hoopoe Upupa epops Linnaeus, 1758 Resident
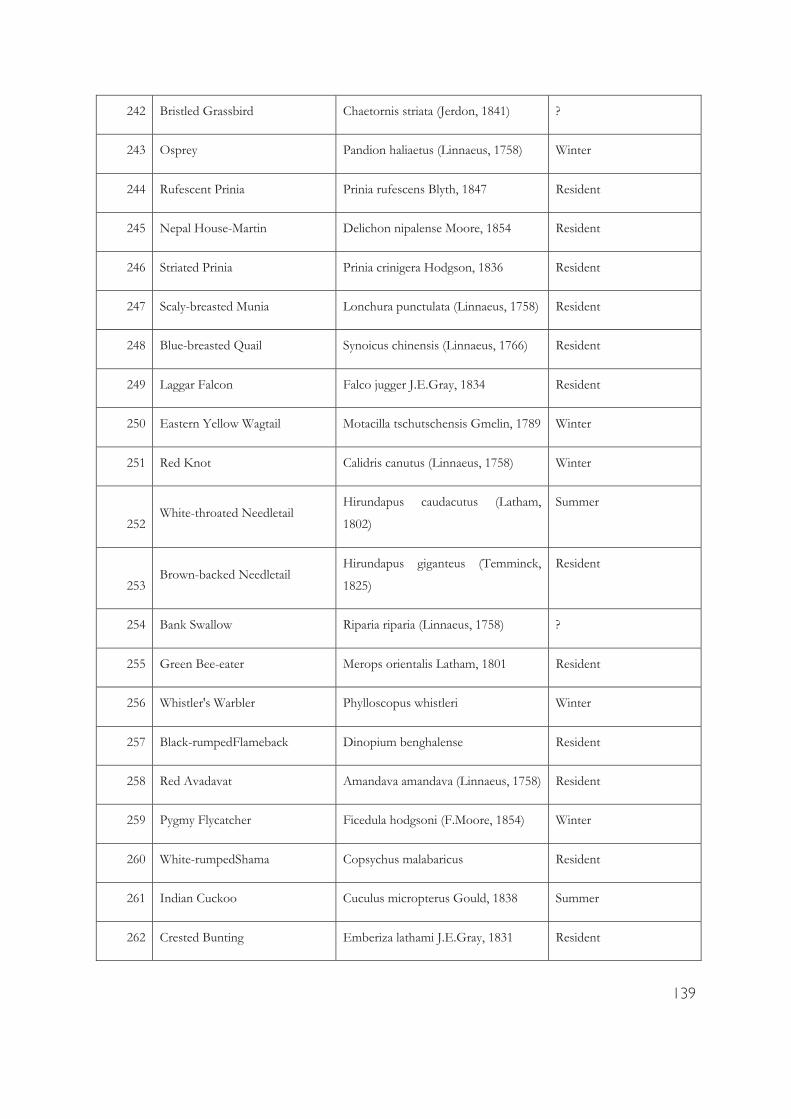
139
242 Bristled Grassbird Chaetornis striata (Jerdon, 1841) ?
243 Osprey Pandion haliaetus (Linnaeus, 1758) Winter
244 Rufescent Prinia Prinia rufescens Blyth, 1847 Resident
245 Nepal House-Martin Delichon nipalense Moore, 1854 Resident
246 Striated Prinia Prinia crinigera Hodgson, 1836 Resident
247 Scaly-breasted Munia Lonchura punctulata (Linnaeus, 1758) Resident
248 Blue-breasted Quail Synoicus chinensis (Linnaeus, 1766) Resident
249 Laggar Falcon Falco jugger J.E.Gray, 1834 Resident
250 Eastern Yellow Wagtail Motacilla tschutschensis Gmelin, 1789 Winter
251 Red Knot Calidris canutus (Linnaeus, 1758) Winter
252 White-throated Needletail
Hirundapus caudacutus (Latham,
1802)
Summer
253 Brown-backed Needletail
Hirundapus giganteus (Temminck,
1825)
Resident
254 Bank Swallow Riparia riparia (Linnaeus, 1758) ?
255 Green Bee-eater Merops orientalis Latham, 1801 Resident
256 Whistler's Warbler Phylloscopus whistleri Winter
257 Black-rumpedFlameback Dinopium benghalense Resident
258 Red Avadavat Amandava amandava (Linnaeus, 1758) Resident
259 Pygmy Flycatcher Ficedula hodgsoni (F.Moore, 1854) Winter
260 White-rumpedShama Copsychus malabaricus Resident
261 Indian Cuckoo Cuculus micropterus Gould, 1838 Summer
262 Crested Bunting Emberiza lathami J.E.Gray, 1831 Resident
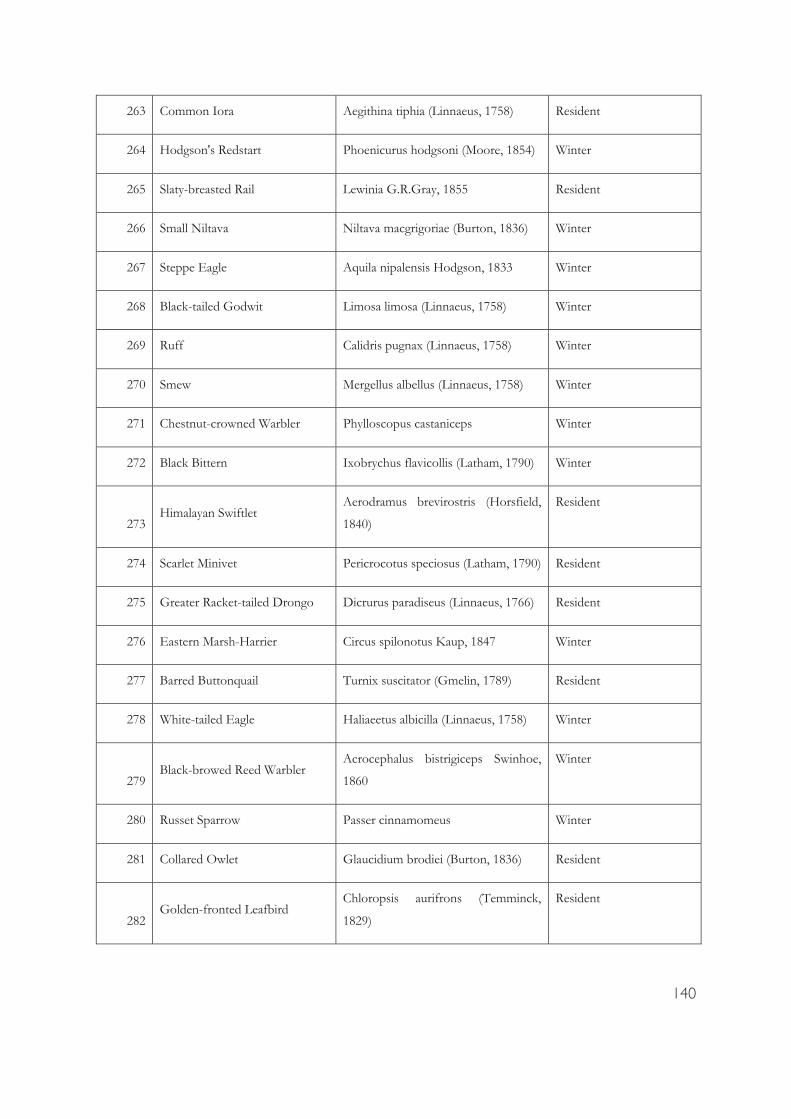
140
263 Common Iora Aegithina tiphia (Linnaeus, 1758) Resident
264 Hodgson's Redstart Phoenicurus hodgsoni (Moore, 1854) Winter
265 Slaty-breasted Rail Lewinia G.R.Gray, 1855 Resident
266 Small Niltava Niltava macgrigoriae (Burton, 1836) Winter
267 Steppe Eagle Aquila nipalensis Hodgson, 1833 Winter
268 Black-tailed Godwit Limosa limosa (Linnaeus, 1758) Winter
269 Ruff Calidris pugnax (Linnaeus, 1758) Winter
270 Smew Mergellus albellus (Linnaeus, 1758) Winter
271 Chestnut-crowned Warbler Phylloscopus castaniceps Winter
272 Black Bittern Ixobrychus flavicollis (Latham, 1790) Winter
273 Himalayan Swiftlet
Aerodramus brevirostris (Horsfield,
1840)
Resident
274 Scarlet Minivet Pericrocotus speciosus (Latham, 1790) Resident
275 Greater Racket-tailed Drongo Dicrurus paradiseus (Linnaeus, 1766) Resident
276 Eastern Marsh-Harrier Circus spilonotus Kaup, 1847 Winter
277 Barred Buttonquail Turnix suscitator (Gmelin, 1789) Resident
278 White-tailed Eagle Haliaeetus albicilla (Linnaeus, 1758) Winter
279 Black-browed Reed Warbler
Acrocephalus bistrigiceps Swinhoe,
1860
Winter
280 Russet Sparrow Passer cinnamomeus Winter
281 Collared Owlet Glaucidium brodiei (Burton, 1836) Resident
282 Golden-fronted Leafbird
Chloropsis aurifrons (Temminck,
1829)
Resident

141
283 Striated Swallow Cecropis striolata (Schlegel, 1844) Resident
284 Pin-striped Tit-Babbler Mixornis gularis Resident
285 Crested Goshawk Accipiter trivirgatus (Temminck, 1824) Resident
286 Dunlin Calidris alpina (Linnaeus, 1758) Winter
287 Spotted Redshank Tringa erythropus (Pallas, 1764) Winter
288 Pied Bushchat Saxicola caprata (Linnaeus, 1766) Winter
289 Blue-eared Barbet Psilopogon duvaucelii Resident
290 Plaintive Cuckoo Cacomantis merulinus (Scopoli, 1786) Resident
291 Pallas's Fish-Eagle Haliaeetus leucoryphus (Pallas, 1771) Resident
292 Amur Falcon Falco amurensis Radde, 1863 Winter
293 Ashy Drongo Dicrurus leucophaeus Vieillot, 1817 Resident
294 Puff-throated Babbler Pellorneum ruficeps Swainson, 1832 Resident
295 Spot-winged Starling Saroglossa spiloptera (Vigors, 1831) Resident
296 Green-billed Malkoha Phaenicophaeus tristis (Lesson, 1830) Resident
297 Vernal Hanging-Parrot Loriculus vernalis (Sparrman, 1787) Resident
298 White-eyed Buzzard Butastur teesa (Franklin, 1831) Resident
299 Greater Scaup Aythya marila (Linnaeus, 1761) Winter
300 Striated Bulbul Pycnonotus striatus (Blyth, 1842) Resident
301 Eurasian Griffon Gyps fulvus (Hablizl, 1783) Winter
302 Daurian Redstart Phoenicurus auroreus (Pallas, 1776) Winter
303 White-browed Crake Amaurornis cinerea (Vieillot, 1819) not found
304 Purple Sunbird Cinnyris asiaticus (Latham, 1790) Resident

142
305 Changeable Hawk-Eagle Nisaetus cirrhatus (Gmelin, 1788) Resident
306 Gray-sided Bush Warbler Cettia brunnifrons (Hodgson, 1845) Winter
307 Eurasian Hobby Falco subbuteo Linnaeus, 1758 Winter
308 Plain Flowerpecker Dicaeum minullum Swinhoe, 1870 Resident
309 Greenish Warbler
Phylloscopus trochiloides (Sundevall,
1837)
Winter
310 Blue-eared Kingfisher Alcedo meninting Horsfield, 1821 Resident
311 Gray Treepie Dendrocitta formosae Swinhoe, 1863 Resident
312 Large Hawk-Cuckoo Hierococcyx sparverioides Summer
313 Black-breasted Weaver Ploceus benghalensis (Linnaeus, 1758) Resident
314 Painted Stork Mycteria leucocephala (Pennant, 1769) Winter
315 Dollarbird
Eurystomus orientalis (Linnaeus,
1766)
Resident
316 Pied Avocet Recurvirostra avosetta Linnaeus, 1758 Winter
317 Lesser Sand-Plover Charadrius mongolus Pallas, 1776 Winter
318 White-tailed Stonechat Saxicola leucurus (Blyth, 1847) Resident
319 Short-eared Owl Asio flammeus (Pontoppidan, 1763) Winter
320 Black-throated Prinia Prinia atrogularis (Moore, 1854) Resident
321 Indian Golden Oriole Oriolus kundoo Sykes, 1832 ?
322 Lesser Cuckoo Cuculus poliocephalus Latham, 1790 Summer
323 Black-crested Bulbul Rubigula Blyth, 1845 Resident
324 Yellow-vented Flowerpecker
Dicaeum chrysorrheum Temminck,
1829
Resident

143
325 Crested Kingfisher Megaceryle lugubris (Temminck, 1834) Resident
326 Yellow-browed Warbler Phylloscopus inornatus (Blyth, 1842) Winter
327 Black Bulbul
Hypsipetes leucocephalus (Gmelin,
1789)
Resident
328 Barred Cuckoo-Dove Macropygia unchall (Wagler, 1827) Resident
329 Rufous-capped Babbler Cyanoderma ruficeps Resident
330 White-throated Bulbul Alophoixus flaveolus (Gould, 1836) Resident
331 Rufous-bellied Niltava Niltava sundara Hodgson, 1837 Winter
332 Slaty-bellied Tesia Tesia olivea (McClelland, 1840) Winter
333 Gray-cheeked Warbler Phylloscopus poliogenys Winter
334 Greater Yellownape Chrysophlegma flavinucha Resident
335 Blyth's Leaf Warbler Phylloscopus reguloides (Blyth, 1842) Winter
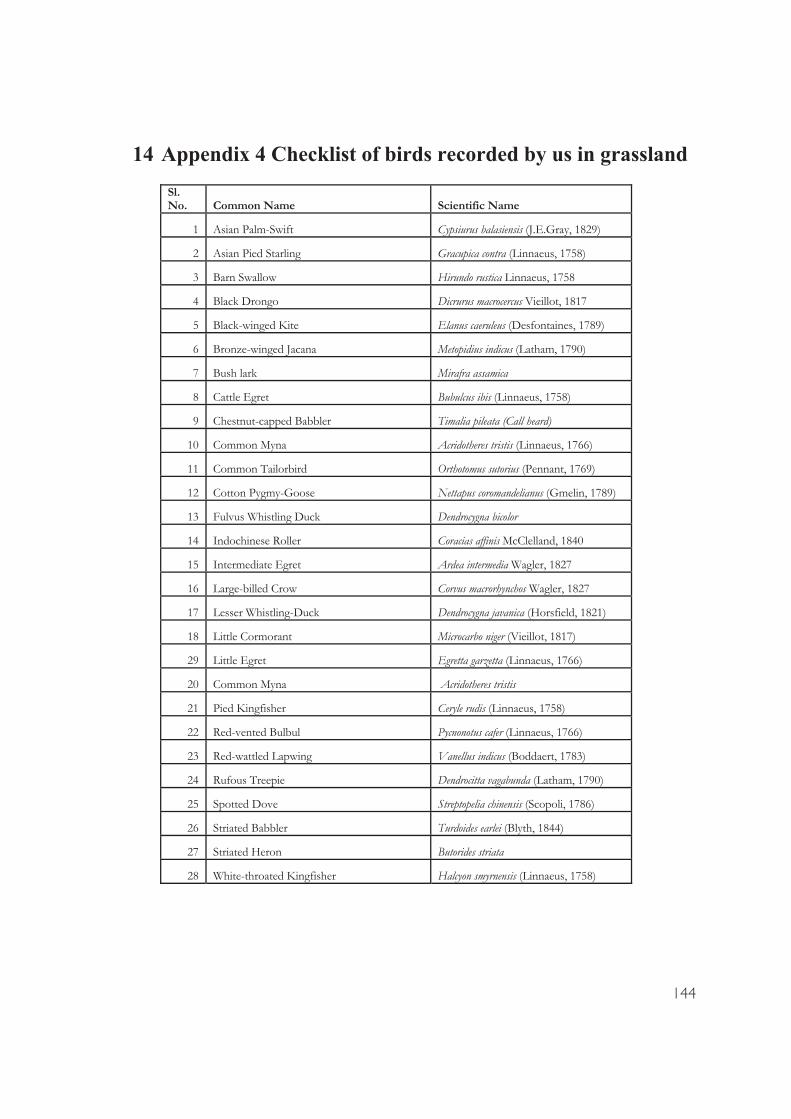
144
Sl. No. Common Name Scientific Name
1 Asian Palm-Swift Cypsiurus balasiensis (J.E.Gray, 1829)
2 Asian Pied Starling Gracupica contra (Linnaeus, 1758)
3 Barn Swallow Hirundo rustica Linnaeus, 1758
4 Black Drongo Dicrurus macrocercus Vieillot, 1817
5 Black-winged Kite Elanus caeruleus (Desfontaines, 1789)
6 Bronze-winged Jacana Metopidius indicus (Latham, 1790)
7 Bush lark Mirafra assamica
8 Cattle Egret Bubulcus ibis (Linnaeus, 1758)
9 Chestnut-capped Babbler Timalia pileata (Call heard)
10 Common Myna Acridotheres tristis (Linnaeus, 1766)
11 Common Tailorbird Orthotomus sutorius (Pennant, 1769)
12 Cotton Pygmy-Goose Nettapus coromandelianus (Gmelin, 1789)
13 Fulvus Whistling Duck Dendrocygna bicolor
14 Indochinese Roller Coracias affinis McClelland, 1840
15 Intermediate Egret Ardea intermedia Wagler, 1827
16 Large-billed Crow Corvus macrorhynchos Wagler, 1827
17 Lesser Whistling-Duck Dendrocygna javanica (Horsfield, 1821)
18 Little Cormorant Microcarbo niger (Vieillot, 1817)
29 Little Egret Egretta garzetta (Linnaeus, 1766)
20 Common Myna Acridotheres tristis
21 Pied Kingfisher Ceryle rudis (Linnaeus, 1758)
22 Red-vented Bulbul Pycnonotus cafer (Linnaeus, 1766)
23 Red-wattled Lapwing Vanellus indicus (Boddaert, 1783)
24 Rufous Treepie Dendrocitta vagabunda (Latham, 1790)
25 Spotted Dove Streptopelia chinensis (Scopoli, 1786)
26 Striated Babbler Turdoides earlei (Blyth, 1844)
27 Striated Heron Butorides striata
28 White-throated Kingfisher Halcyon smyrnensis (Linnaeus, 1758)
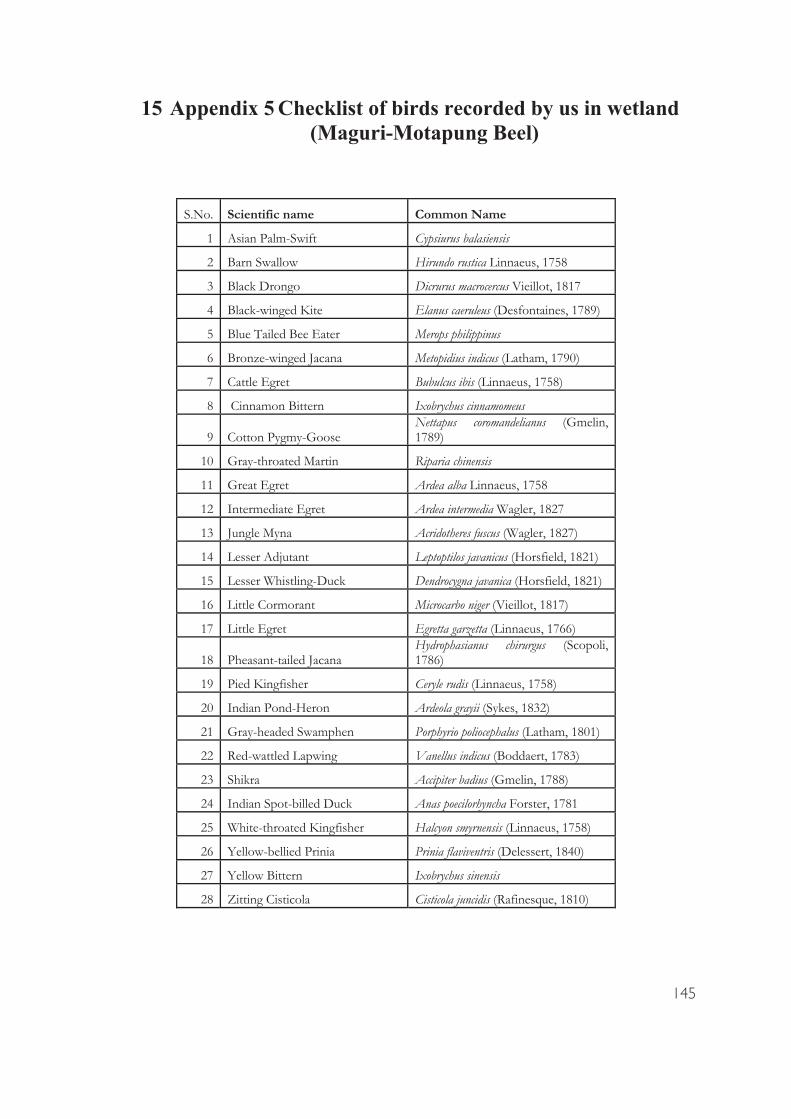
145
S.No. Scientific name Common Name
1 Asian Palm-Swift Cypsiurus balasiensis
2 Barn Swallow Hirundo rustica Linnaeus, 1758
3 Black Drongo Dicrurus macrocercus Vieillot, 1817
4 Black-winged Kite Elanus caeruleus (Desfontaines, 1789)
5 Blue Tailed Bee Eater Merops philippinus
6 Bronze-winged Jacana Metopidius indicus (Latham, 1790)
7 Cattle Egret Bubulcus ibis (Linnaeus, 1758)
8 Cinnamon Bittern Ixobrychus cinnamomeus
9 Cotton Pygmy-Goose Nettapus coromandelianus (Gmelin, 1789)
10 Gray-throated Martin Riparia chinensis
11 Great Egret Ardea alba Linnaeus, 1758
12 Intermediate Egret Ardea intermedia Wagler, 1827
13 Jungle Myna Acridotheres fuscus (Wagler, 1827)
14 Lesser Adjutant Leptoptilos javanicus (Horsfield, 1821)
15 Lesser Whistling-Duck Dendrocygna javanica (Horsfield, 1821)
16 Little Cormorant Microcarbo niger (Vieillot, 1817)
17 Little Egret Egretta garzetta (Linnaeus, 1766)
18 Pheasant-tailed Jacana Hydrophasianus chirurgus (Scopoli, 1786)
19 Pied Kingfisher Ceryle rudis (Linnaeus, 1758)
20 Indian Pond-Heron Ardeola grayii (Sykes, 1832)
21 Gray-headed Swamphen Porphyrio poliocephalus (Latham, 1801)
22 Red-wattled Lapwing Vanellus indicus (Boddaert, 1783)
23 Shikra Accipiter badius (Gmelin, 1788)
24 Indian Spot-billed Duck Anas poecilorhyncha Forster, 1781
25 White-throated Kingfisher Halcyon smyrnensis (Linnaeus, 1758)
26 Yellow-bellied Prinia Prinia flaviventris (Delessert, 1840)
27 Yellow Bittern Ixobrychus sinensis
28 Zitting Cisticola Cisticola juncidis (Rafinesque, 1810)
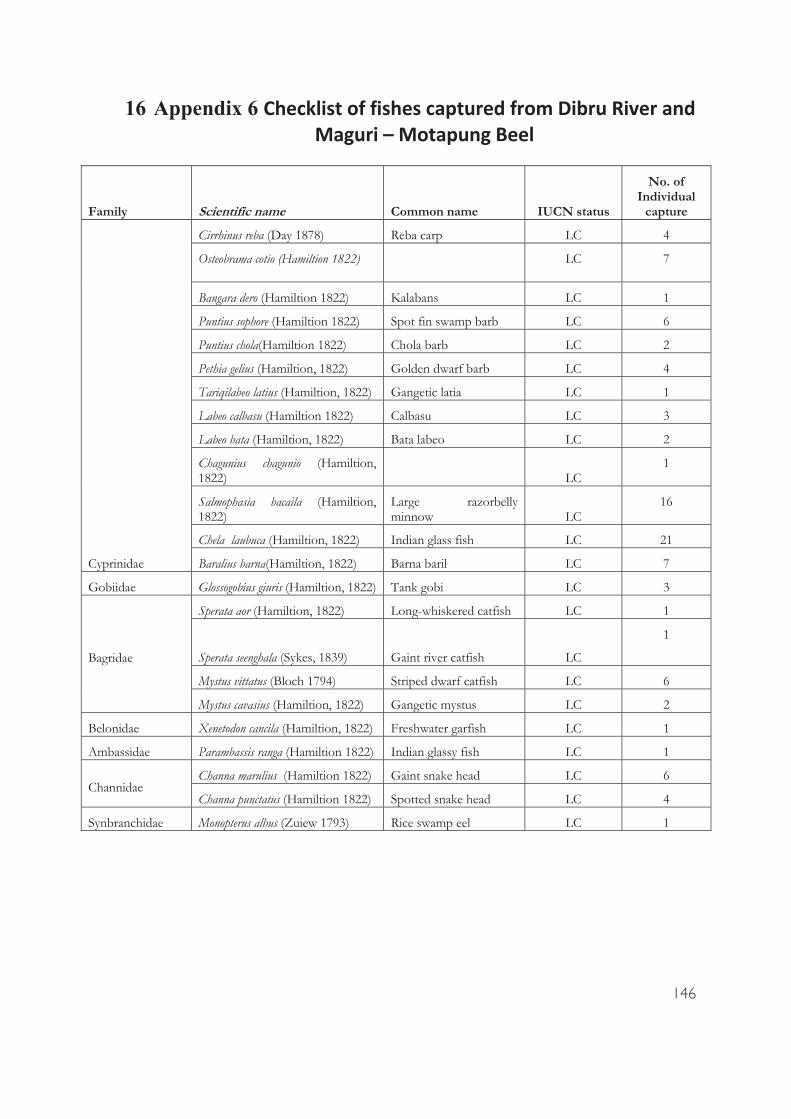
146
Family Scientific name Common name IUCN status
No. of Individual
capture
Cyprinidae
Cirrhinus reba (Day 1878) Reba carp LC 4
Osteobrama cotio (Hamiltion 1822)
LC 7
Bangara dero (Hamiltion 1822) Kalabans LC 1
Puntius sophore (Hamiltion 1822) Spot fin swamp barb LC 6
Puntius chola(Hamiltion 1822) Chola barb LC 2
Pethia gelius (Hamiltion, 1822) Golden dwarf barb LC 4
Tariqilabeo latius (Hamiltion, 1822) Gangetic latia LC 1
Labeo calbasu (Hamiltion 1822) Calbasu LC 3
Labeo bata (Hamiltion, 1822) Bata labeo LC 2
Chagunius chagunio (Hamiltion, 1822) LC
1
Salmophasia bacaila (Hamiltion, 1822)
Large razorbelly minnow LC
16
Chela laubuca (Hamiltion, 1822) Indian glass fish LC 21
Baralius barna(Hamiltion, 1822) Barna baril LC 7
Gobiidae Glossogobius giuris (Hamiltion, 1822) Tank gobi LC 3
Bagridae
Sperata aor (Hamiltion, 1822) Long-whiskered catfish LC 1
1
Sperata seenghala (Sykes, 1839) Gaint river catfish LC
Mystus vittatus (Bloch 1794) Striped dwarf catfish LC 6
Mystus cavasius (Hamiltion, 1822) Gangetic mystus LC 2
Belonidae Xenetodon cancila (Hamiltion, 1822) Freshwater garfish LC 1
Ambassidae Parambassis ranga (Hamiltion 1822) Indian glassy fish LC 1
Channidae Channa marulius (Hamiltion 1822) Gaint snake head LC 6
Channa punctatus (Hamiltion 1822) Spotted snake head LC 4
Synbranchidae Monopterus albus (Zuiew 1793) Rice swamp eel LC 1

147
Scientific Name Common Name IUCN status IWPA Status
Family Papilionidae
Papilio nephelus Yellow Helen Not Evaluated
Graphium sarpedon Common Bluebottle Not Evaluated
Papilio demoleus Lime Not Evaluated
Graphium agamemnon Tailed Jay Not Evaluated
Papilio memnon Great Mormon Not Evaluated
Troides aeacus Golden Birdwing Least Concern
Papilio castor Common Raven Not Evaluated
Family Nymphalidae
Ypthima baldus Common Fivering Not Evaluated
Neptis hylas Common Sailer Not Evaluated
Junonia atlites Grey Pansy Not Evaluated
Mycalesis perseus Common Bushbrown Not Evaluated
Ariadne merione Common Castor Not Evaluated
Cethosia cyane Leopard Lacewing Not Evaluated
Parantica aglea Glassy Tiger Not Evaluated
Ariadne ariadne Angled Castor Not Evaluated
Danaus genutia Common Tiger Not Evaluated
Euploea core Common Indian Crow Least Concern

148
Junonia almana Peacock Pansy Least Concern
Tirumala limniace Blue Tiger Not Evaluated
Euthalia aconthea Baron Not Evaluated
Athyma perius Common Sergeant Not Evaluated
Hypolimnas bolina Great Eggfly Not Evaluated
Danaus chrysippus Plain Tiger Not Evaluated
Tanaecia lepidea Grey Count Not Evaluated Schedule II
Tirumala septentrionis Dark blue tiger
Melanitis leda Common Evening Brown Not Evaluated
Family Lycaenidae
Castalius rosimon Common Pierrot Not Evaluated
Jamides celeno Common Cerulean Not Evaluated
Hypolycaena erylus Common Tit Not Evaluated
Surendra quercetorum Common Acacia Blue Not Evaluated
Prosotas nora Common Lineblue Not Evaluated
Apharitis lilacinus Lilac Silverline Schedule II
Anthene lycaenina Pointed Ciliate Blue Not Evaluated Schedule II
Chilades lajus Lime Blue Not Evaluated
Family Riodinidae
Zemeros flegyas Punchinello Not Evaluated
Family Hesperiidae
Aeromachus pygmaeus Pygmy Scrub Hopper Not Evaluated

149
Ampittia dioscorides Bush Hopper Not Evaluated
Family Pieridae
Eurema blanda Three Spot grass yellow Not Evaluated
Catopsilia pomona Common Emigrant Not Evaluated
Eurema brigitta Small Grass Yellow Least Concern
Delias descombesi Redspot Jezebel Not Evaluated
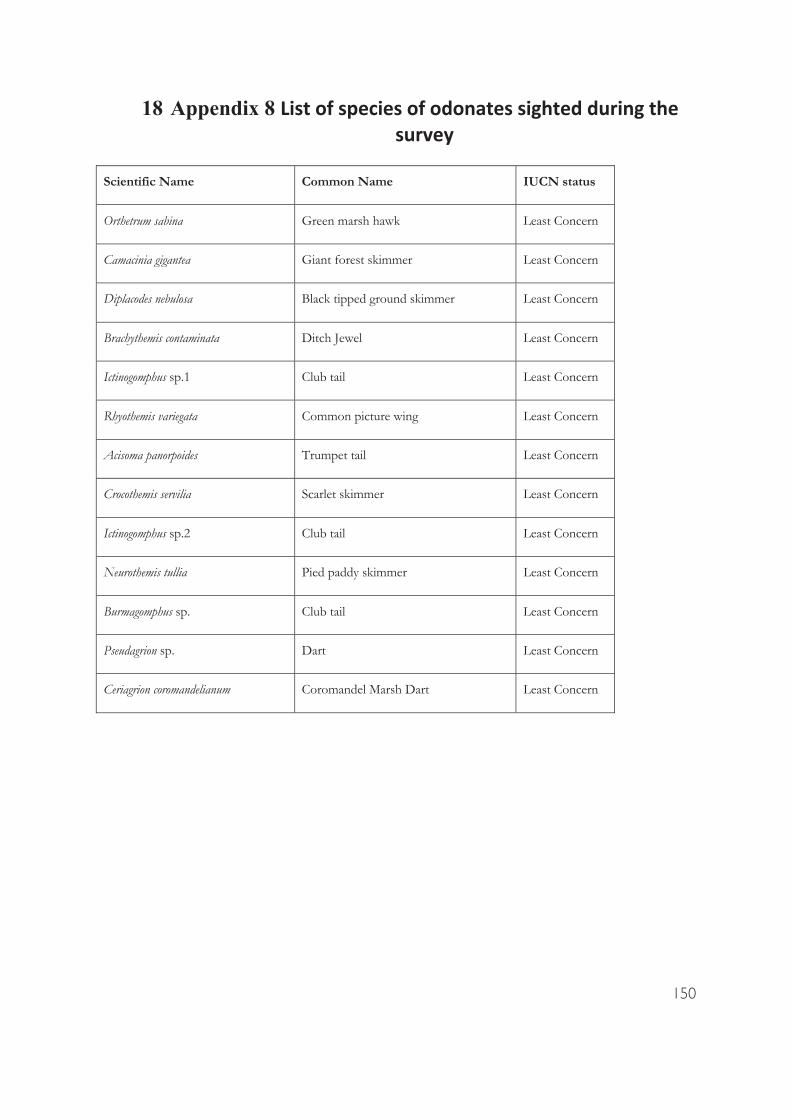
150
Scientific Name Common Name IUCN status
Orthetrum sabina Green marsh hawk Least Concern
Camacinia gigantea Giant forest skimmer Least Concern
Diplacodes nebulosa Black tipped ground skimmer Least Concern
Brachythemis contaminata Ditch Jewel Least Concern
Ictinogomphus sp.1 Club tail Least Concern
Rhyothemis variegata Common picture wing Least Concern
Acisoma panorpoides Trumpet tail Least Concern
Crocothemis servilia Scarlet skimmer Least Concern
Ictinogomphus sp.2 Club tail Least Concern
Neurothemis tullia Pied paddy skimmer Least Concern
Burmagomphus sp. Club tail Least Concern
Pseudagrion sp. Dart Least Concern
Ceriagrion coromandelianum Coromandel Marsh Dart Least Concern

151
Date of
encounter
Scientific
Name
Common
Name
Microhabitat Status Distance to
the explosion
site (km)
30/05/2020 Rhabdophis
subminiatus
(SCHLEGEL,
1837)
Red-necked
keelback
Water puddle
along river
Lohit
Live 0.50
30/05/2020 Varanus salvator
(LAURENTI,
1768)
Common Water
Monitor
Forest along
river Lohit
Live 0.75
02/06/2020 Fowlea piscator
(SCHNEIDER,
1799)
Checkered
Keelback
Grassland Carcass 0.43
22/06/2020 Fowlea piscator
(SCHNEIDER,
1799)
Checkered
Keelback
River Live 2.96
23/06/2020 Ptyas mucosa
(LINNAEUS,
1758)
Oriental
Ratsnake
Human
Habitation
Live 5.19
23/06/2020 Calotes versicolor
(DAUDIN,
1802)
Common
Garden Lizard
Human
habitation
Live 5.19
03/07/2020 Hemidactylus
frenatus
DUMÉRIL &
BIBRON, 1836
Common
House Gecko
Human
habitation
Live (4) 3.70
04/07/2020 Boiga siamensis
NUTAPHAND,
1971
Eyed Cat Snake Human
habitation
Live 5.19
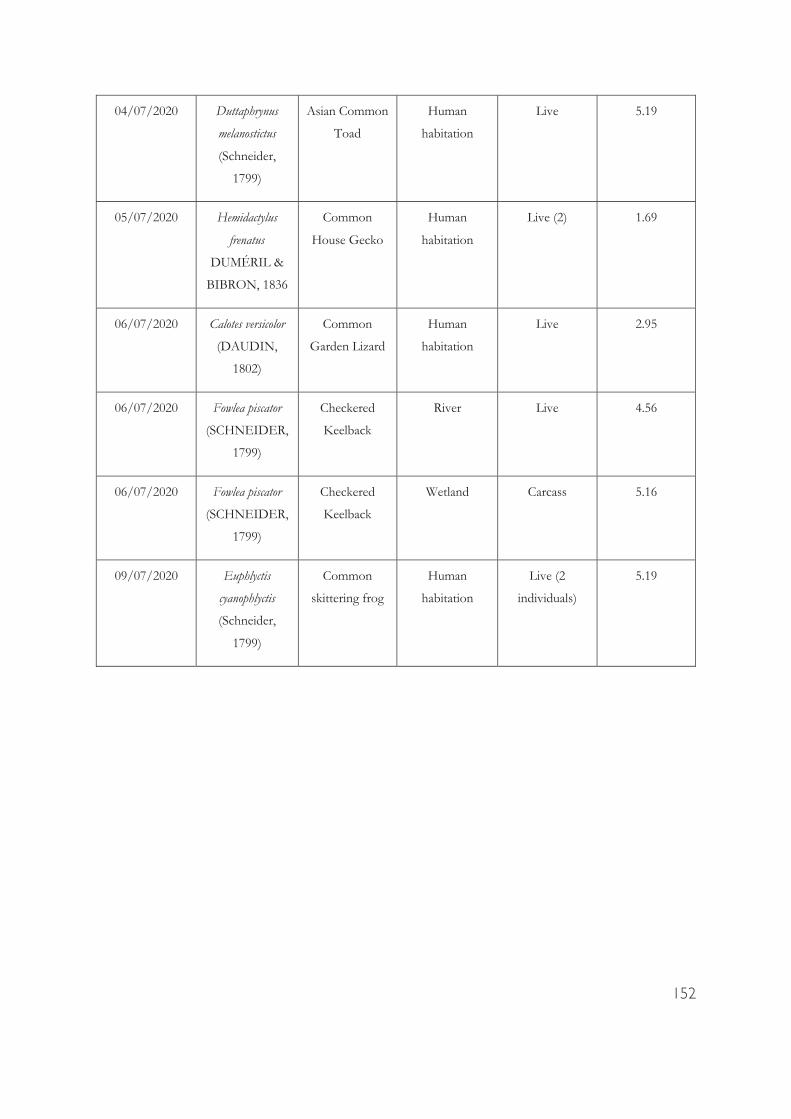
152
04/07/2020 Duttaphrynus
melanostictus
(Schneider,
1799)
Asian Common
Toad
Human
habitation
Live 5.19
05/07/2020 Hemidactylus
frenatus
DUMÉRIL &
BIBRON, 1836
Common
House Gecko
Human
habitation
Live (2) 1.69
06/07/2020 Calotes versicolor
(DAUDIN,
1802)
Common
Garden Lizard
Human
habitation
Live 2.95
06/07/2020 Fowlea piscator
(SCHNEIDER,
1799)
Checkered
Keelback
River Live 4.56
06/07/2020 Fowlea piscator
(SCHNEIDER,
1799)
Checkered
Keelback
Wetland Carcass 5.16
09/07/2020 Euphlyctis
cyanophlyctis
(Schneider,
1799)
Common
skittering frog
Human
habitation
Live (2
individuals)
5.19
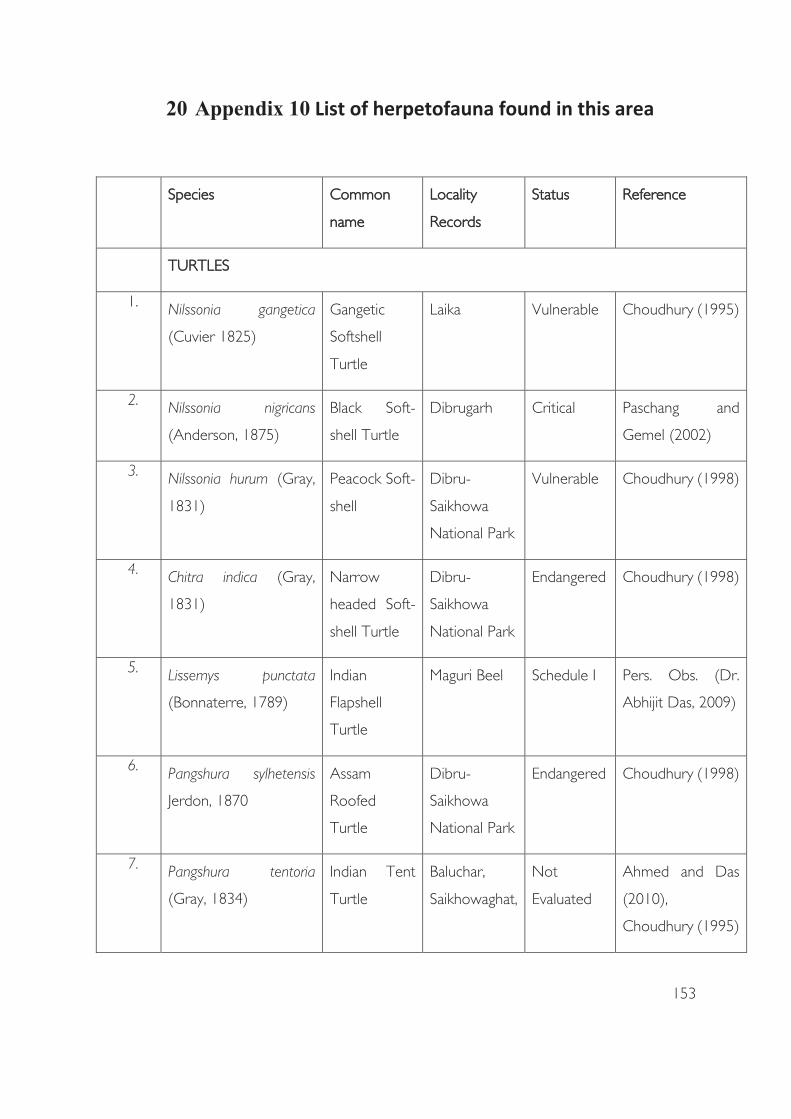
153
SSpecies CCommon
name
LLocality
Records
SStatus RReference
TTURTLES
1. Nilssonia gangetica
(Cuvier 1825)
Gangetic
Softshell
Turtle
Laika Vulnerable Choudhury (1995)
2. Nilssonia nigricans
(Anderson, 1875)
Black Soft-
shell Turtle
Dibrugarh Critical Paschang and
Gemel (2002)
3. Nilssonia hurum (Gray,
1831)
Peacock Soft-
shell
Dibru-
Saikhowa
National Park
Vulnerable Choudhury (1998)
4. Chitra indica (Gray,
1831)
Narrow
headed Soft-
shell Turtle
Dibru-
Saikhowa
National Park
Endangered Choudhury (1998)
5. Lissemys punctata
(Bonnaterre, 1789)
Indian
Flapshell
Turtle
Maguri Beel Schedule I Pers. Obs. (Dr.
Abhijit Das, 2009)
6. Pangshura sylhetensis
Jerdon, 1870
Assam
Roofed
Turtle
Dibru-
Saikhowa
National Park
Endangered Choudhury (1998)
7. Pangshura tentoria
(Gray, 1834)
Indian Tent
Turtle
Baluchar,
Saikhowaghat,
Not
Evaluated
Ahmed and Das
(2010),
Choudhury (1995)
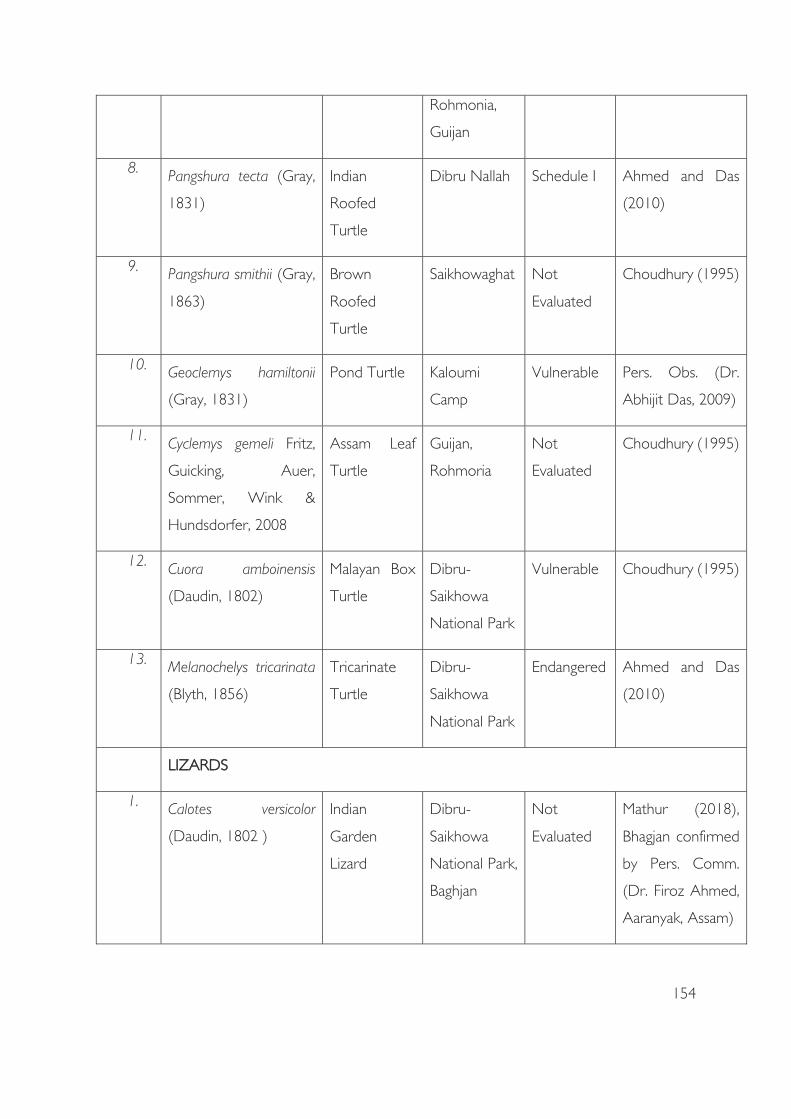
154
Rohmonia,
Guijan
8. Pangshura tecta (Gray,
1831)
Indian
Roofed
Turtle
Dibru Nallah Schedule I Ahmed and Das
(2010)
9. Pangshura smithii (Gray,
1863)
Brown
Roofed
Turtle
Saikhowaghat Not
Evaluated
Choudhury (1995)
10. Geoclemys hamiltonii
(Gray, 1831)
Pond Turtle Kaloumi
Camp
Vulnerable Pers. Obs. (Dr.
Abhijit Das, 2009)
11. Cyclemys gemeli Fritz,
Guicking, Auer,
Sommer, Wink &
Hundsdorfer, 2008
Assam Leaf
Turtle
Guijan,
Rohmoria
Not
Evaluated
Choudhury (1995)
12. Cuora amboinensis
(Daudin, 1802)
Malayan Box
Turtle
Dibru-
Saikhowa
National Park
Vulnerable Choudhury (1995)
13. Melanochelys tricarinata
(Blyth, 1856)
Tricarinate
Turtle
Dibru-
Saikhowa
National Park
Endangered Ahmed and Das
(2010)
LLIZARDS
1. Calotes versicolor
(Daudin, 1802 )
Indian
Garden
Lizard
Dibru-
Saikhowa
National Park,
Baghjan
Not
Evaluated
Mathur (2018),
Bhagjan confirmed
by Pers. Comm.
(Dr. Firoz Ahmed,
Aaranyak, Assam)
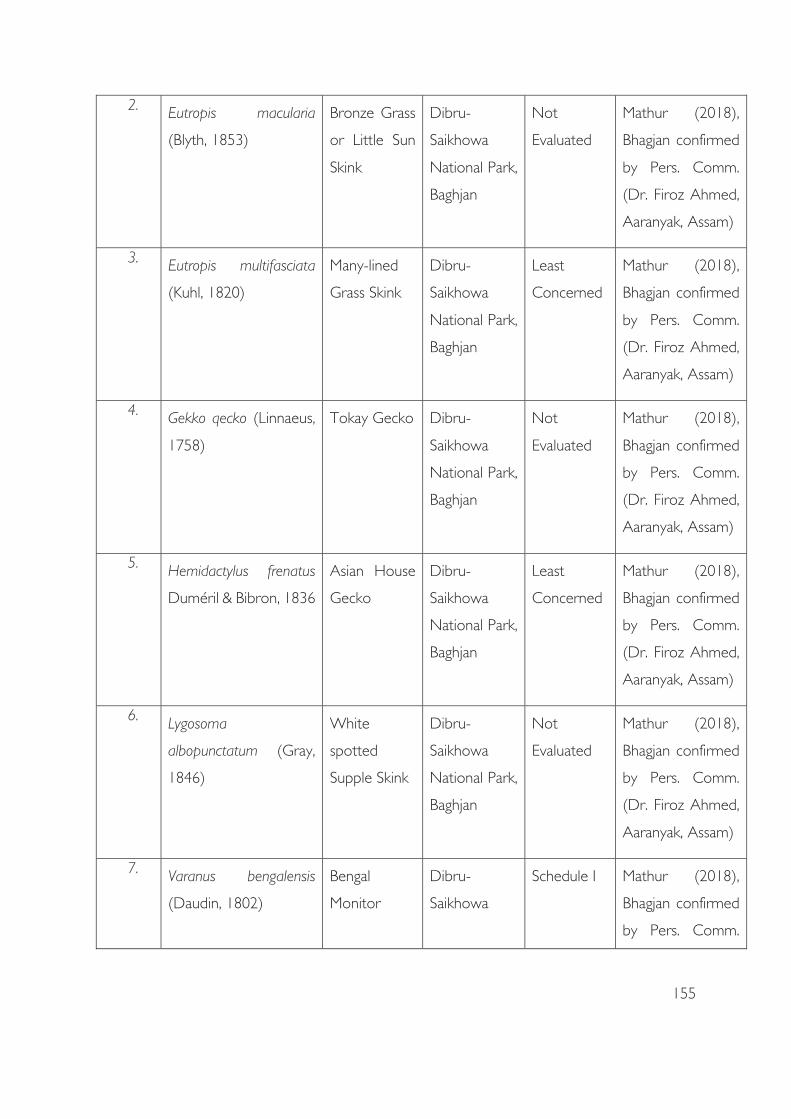
155
2. Eutropis macularia
(Blyth, 1853)
Bronze Grass
or Little Sun
Skink
Dibru-
Saikhowa
National Park,
Baghjan
Not
Evaluated
Mathur (2018),
Bhagjan confirmed
by Pers. Comm.
(Dr. Firoz Ahmed,
Aaranyak, Assam)
3. Eutropis multifasciata
(Kuhl, 1820)
Many-lined
Grass Skink
Dibru-
Saikhowa
National Park,
Baghjan
Least
Concerned
Mathur (2018),
Bhagjan confirmed
by Pers. Comm.
(Dr. Firoz Ahmed,
Aaranyak, Assam)
4. Gekko qecko (Linnaeus,
1758)
Tokay Gecko Dibru-
Saikhowa
National Park,
Baghjan
Not
Evaluated
Mathur (2018),
Bhagjan confirmed
by Pers. Comm.
(Dr. Firoz Ahmed,
Aaranyak, Assam)
5. Hemidactylus frenatus
Duméril & Bibron, 1836
Asian House
Gecko
Dibru-
Saikhowa
National Park,
Baghjan
Least
Concerned
Mathur (2018),
Bhagjan confirmed
by Pers. Comm.
(Dr. Firoz Ahmed,
Aaranyak, Assam)
6. Lygosoma
albopunctatum (Gray,
1846)
White
spotted
Supple Skink
Dibru-
Saikhowa
National Park,
Baghjan
Not
Evaluated
Mathur (2018),
Bhagjan confirmed
by Pers. Comm.
(Dr. Firoz Ahmed,
Aaranyak, Assam)
7. Varanus bengalensis
(Daudin, 1802)
Bengal
Monitor
Dibru-
Saikhowa
Schedule I Mathur (2018),
Bhagjan confirmed
by Pers. Comm.

156
National Park,
Baghjan
(Dr. Firoz Ahmed,
Aaranyak, Assam)
8. Varanus salvator
(Laurenti, 1768)
Water
Monitor
Guijan, Dibru-
Saikhowa
National Park
Schedule I Choudhury (1998)
SSNAKES
1. Python bivittatus Kuhl,
1820
Burmese
Rock Python
Laika, kaloumi Schedule I Pers. Obs. (Dr.
Abhijit Das, 2009)
2. Pareas monticola
(Cantor 1839)
Assam Snail
Eater
Dibru-
Saikhowa
National Park
Schedule IV Pers. Obs. (Dr.
Abhijit Das, 2009)
3. Dendrelaphis pictus
(Gmelin, 1789)
Painted
Bronzeback
Tree Snake
Dibru-
Saikhowa
National Park
Not
Evaluated
Mathur (2018)
4. Enhydris enhydris
(Schneider, 1799)
Smooth
Water Snake
Maguri Beel Schedule IV Pers. Obs. (Dr.
Abhijit Das, 2009)
5. Fowlea piscator
(Schneider, 1799)
Checkered
Keelback
Kalumi Schedule II Pers. Obs. (Dr.
Abhijit Das, 2009)
6. Xenochrophis
cerasogaster (Cantor,
1839)
Glossy Bellied
Mash Snake
Maguri Beel Schedule IV Pers. Obs. (Dr.
Abhijit Das, 2009)
7. Rhabdophis
subminiatus(Schlegel,
1837)
Red Necked
Keelback
Laika, Dodhia Schedule IV Pers. Obs. (Dr.
Abhijit Das, 2009)
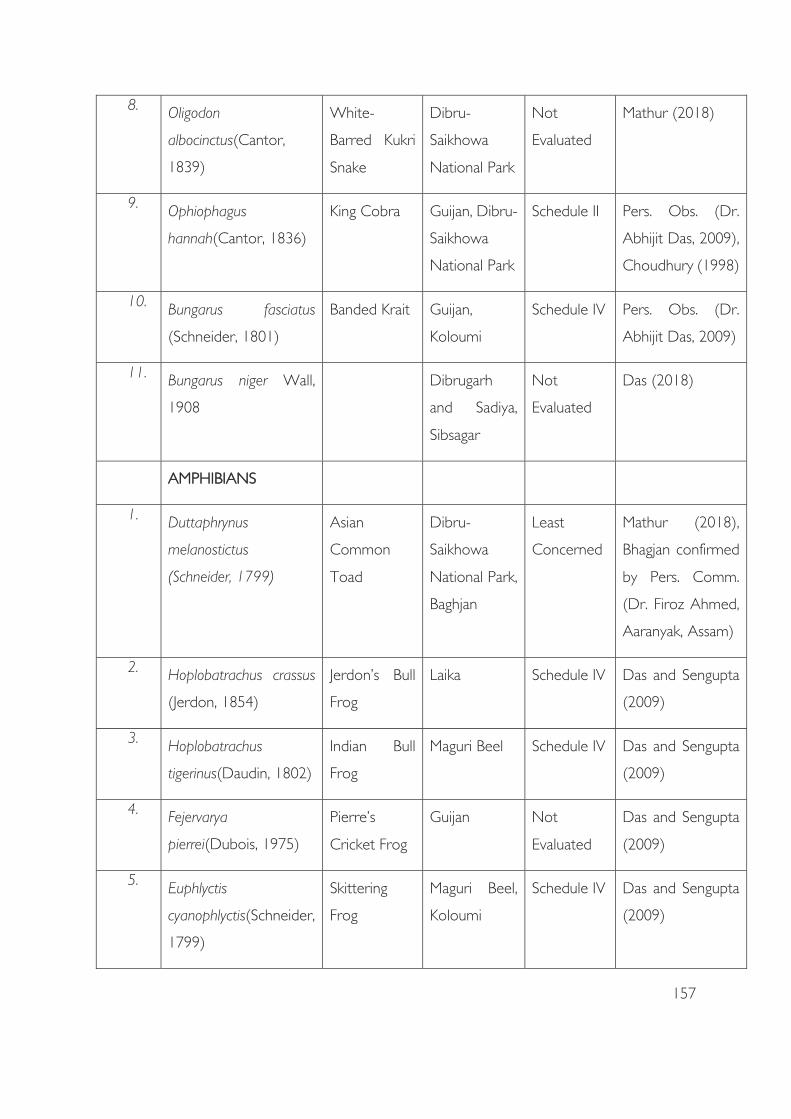
157
8. Oligodon
albocinctus(Cantor,
1839)
White-
Barred Kukri
Snake
Dibru-
Saikhowa
National Park
Not
Evaluated
Mathur (2018)
9. Ophiophagus
hannah(Cantor, 1836)
King Cobra Guijan, Dibru-
Saikhowa
National Park
Schedule II Pers. Obs. (Dr.
Abhijit Das, 2009),
Choudhury (1998)
10. Bungarus fasciatus
(Schneider, 1801)
Banded Krait Guijan,
Koloumi
Schedule IV Pers. Obs. (Dr.
Abhijit Das, 2009)
11. Bungarus niger Wall,
1908
Dibrugarh
and Sadiya,
Sibsagar
Not
Evaluated
Das (2018)
AAMPHIBIANS
1. Duttaphrynus
melanostictus
(Schneider, 1799)
Asian
Common
Toad
Dibru-
Saikhowa
National Park,
Baghjan
Least
Concerned
Mathur (2018),
Bhagjan confirmed
by Pers. Comm.
(Dr. Firoz Ahmed,
Aaranyak, Assam)
2. Hoplobatrachus crassus
(Jerdon, 1854)
Jerdon’s Bull
Frog
Laika Schedule IV Das and Sengupta
(2009)
3. Hoplobatrachus
tigerinus(Daudin, 1802)
Indian Bull
Frog
Maguri Beel Schedule IV Das and Sengupta
(2009)
4. Fejervarya
pierrei(Dubois, 1975)
Pierre’s
Cricket Frog
Guijan Not
Evaluated
Das and Sengupta
(2009)
5. Euphlyctis
cyanophlyctis(Schneider,
1799)
Skittering
Frog
Maguri Beel,
Koloumi
Schedule IV Das and Sengupta
(2009)
158
6. Hydrophylax leptoglossa
(Anderson, 1871)
Assam Forest
Frog
Guijan Schedule IV Das and Sengupta
(2009)
7. Humerana
humeralis(Boulenger,
1887)
Bhamo Frog Dibru-
Saikhowa
National Park
Schedule IV Das and Sengupta
(2009)
8. Hylarana tytleri
Theobald, 1868
Leaf Frog Koloumi
Camp
Not
Evaluated
Das and Sengupta
(2009)
9. Chiromentis simus
(Annandale, 1915)
Annandale’s
Pigmy Tree
Frog
Dibru-
Saikhowa
National Park
Least
Concerned
Das and Sengupta
(2009)
10. Philautus vittatus
(Boulenger, 1887)
Two Striped Dodhia village Least
Concerned
Das and Sengupta
(2009)
11. Rhacophorus
bipunctatus Ahl, 1927
Twin Spotted
Tree Frog
Dibru-
Saikhowa
National Park
Least
Concerned
Das and Sengupta
(2009)
12. Rhacophorus
smaragdinus Blyth, 1852
Large Tree
Frog
Dibru-
Saikhowa
National Park
Least
Concerned
Das and Sengupta
(2009)
13. Polypedates teraiensis
(Dubois, 1987)
Terai tree
frog
Laika, Dodhia Least
Concerned
Das and Sengupta
(2009)
14. Uperodon
globulosus(Gunther,
1864)
Indian
Balloon Frog
Guijan Least
Concerned
Das and Sengupta
(2009)
15. Hylarana taipehensis
(Van Denburgh, 1909)
Taipeh Frog Dibru-
Saikhowa
Least
Concerned
Mathur (2018),
Bhagjan confirmed
by Pers. Comm.
159
National Park,
Baghjan
(Dr. Firoz Ahmed,
Aaranyak, Assam)
16. Microhyla ornata
(Dumeril and Bibron,
1841)
Ornamented
Pygmy Frog
Dibru-
Saikhowa
National Park,
Baghjan
Least
Concerned
Mathur (2018),
Bhagjan confirmed
by Pers. Comm.
(Dr. Firoz Ahmed,
Aaranyak, Assam)
17. Minervarya syhadrensis
(Annandale, 1919)
Southern
Cricket Frog
Baghjan Least
Concerned
Pers. Comm. (Dr.
Firoz Ahmed,
Aaranyak, Assam)
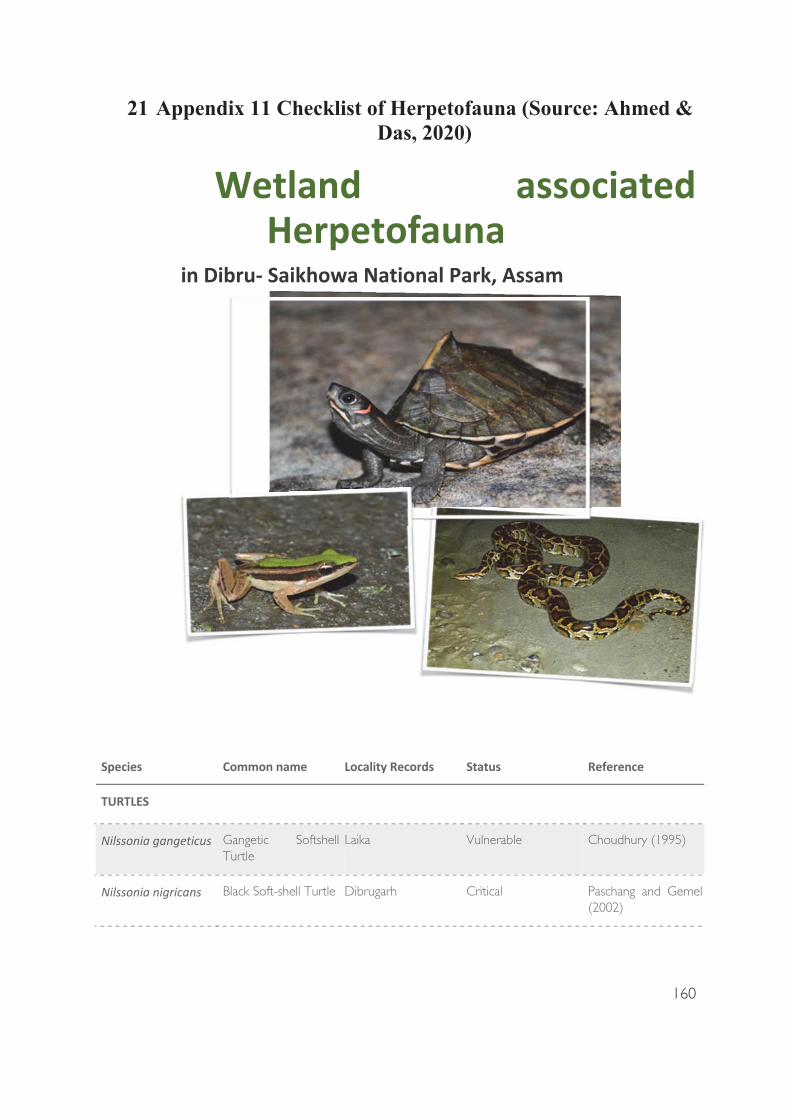
160
Gangetic Softshell Turtle
Laika Vulnerable Choudhury (1995)
Black Soft-shell Turtle Dibrugarh Critical Paschang and Gemel (2002)

161
Peacock Soft-shell Dibru-Saikhowa National Park
Vulnerable Choudhury (1998)
Narrow headed
Soft-shell Turtle
Dibru-Saikhowa National Park
Endangered Choudhury (1998)
Indian Flapshell Turtle Maguri Beel Schedule I Das (2009)
Assam Roofed Turtle Dibru-Saikhowa
National Park Endangered Choudhury (1998)
Indian Tent Turtle Baluchar,
Saikhowaghat,
Rohmonia, Guijan
Not Evaluated Ahmed and Das
(2010),
Choudhury
(1995)
Indian Roofed Turtle Dibru Nallah Schedule I Ahmed and Das (2010)
Brown Roofed Turtle Saikhowaghat Not Evaluated Choudhury (1995)
Pond Turtle Kaloumi Camp Vulnerable Das (2009)
Assam Leaf Turtle Guijan, Rohmoria Not Evaluated Choudhury (1995)
Malayan Box Turtle Dibru-Saikhowa National Park
Vulnerable Choudhury (1995)
Tricarinate Turtle Dibru-Saikhowa
National Park Ahmed and Das
(2010)
Water Monitor Guijan,
Dibrusaikhowa
National Park
Schedule I Choudhury (1998)
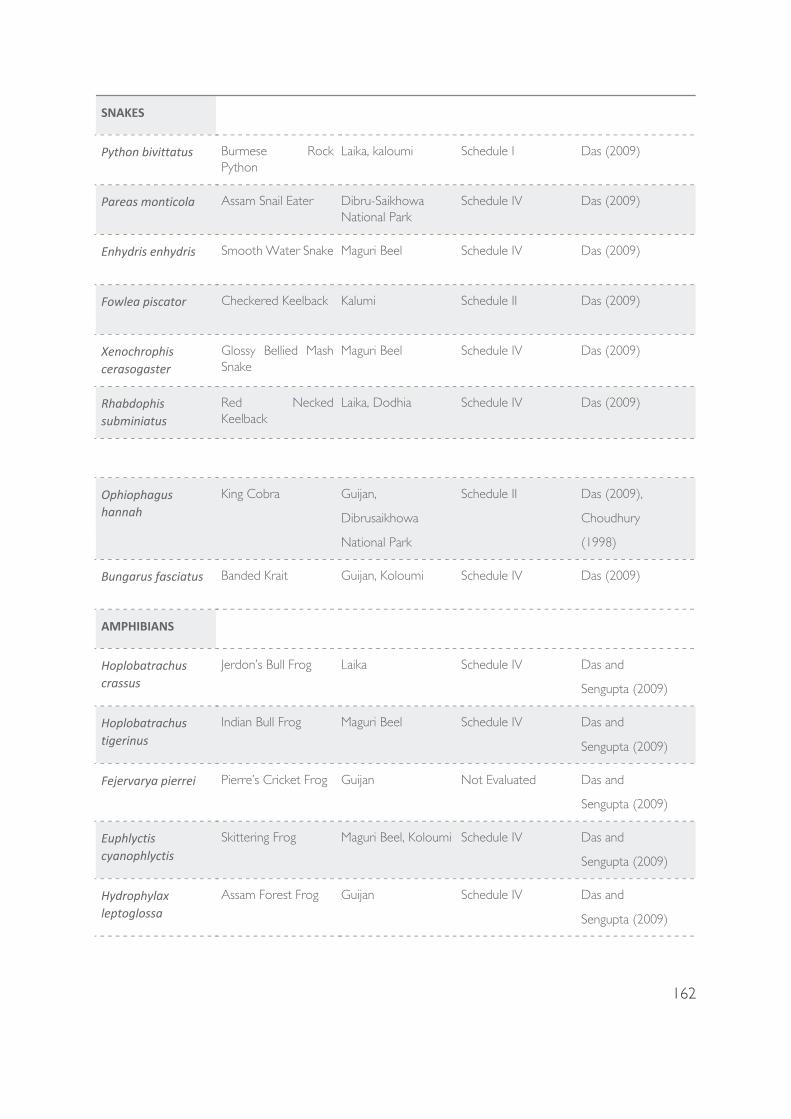
162
Burmese Rock Python
Laika, kaloumi Schedule I Das (2009)
Assam Snail Eater Dibru-Saikhowa National Park
Schedule IV Das (2009)
Smooth Water Snake Maguri Beel Schedule IV Das (2009)
Checkered Keelback Kalumi Schedule II Das (2009)
Glossy Bellied Mash Snake
Maguri Beel Schedule IV Das (2009)
Red Necked Keelback
Laika, Dodhia Schedule IV Das (2009)
King Cobra Guijan,
Dibrusaikhowa
National Park
Schedule II Das (2009),
Choudhury
(1998)
Banded Krait Guijan, Koloumi Schedule IV Das (2009)
Jerdon’s Bull Frog Laika Schedule IV Das and
Sengupta (2009)
Indian Bull Frog Maguri Beel Schedule IV Das and
Sengupta (2009)
Pierre’s Cricket Frog Guijan Not Evaluated Das and
Sengupta (2009)
Skittering Frog Maguri Beel, Koloumi Schedule IV Das and
Sengupta (2009)
Assam Forest Frog Guijan Schedule IV Das and
Sengupta (2009)
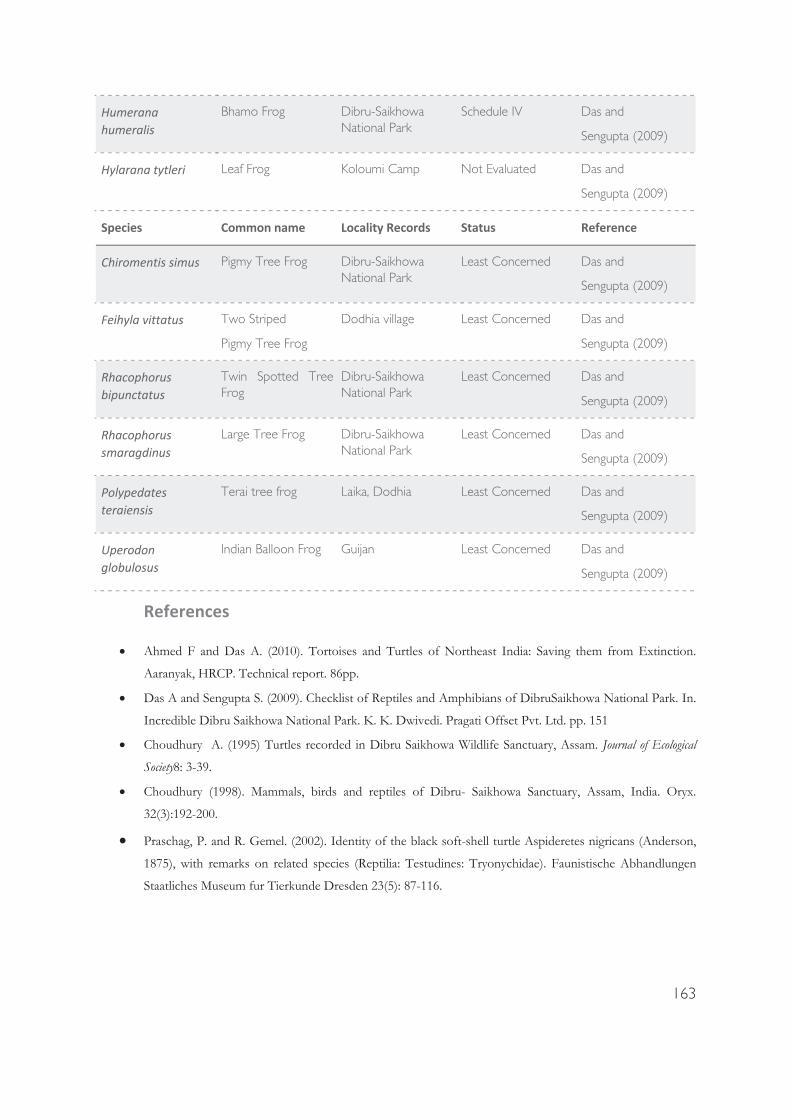
163
Bhamo Frog Dibru-Saikhowa
National Park Schedule IV Das and
Sengupta (2009)
Leaf Frog Koloumi Camp Not Evaluated Das and
Sengupta (2009)
Pigmy Tree Frog Dibru-Saikhowa National Park
Least Concerned Das and
Sengupta (2009)
Two Striped
Pigmy Tree Frog
Dodhia village Least Concerned Das and
Sengupta (2009)
Twin Spotted Tree Frog
Dibru-Saikhowa National Park
Least Concerned Das and
Sengupta (2009)
Large Tree Frog Dibru-Saikhowa
National Park Least Concerned Das and
Sengupta (2009)
Terai tree frog Laika, Dodhia Least Concerned Das and
Sengupta (2009)
Indian Balloon Frog Guijan Least Concerned Das and
Sengupta (2009)
• Ahmed F and Das A. (2010). Tortoises and Turtles of Northeast India: Saving them from Extinction.
Aaranyak, HRCP. Technical report. 86pp.
• Das A and Sengupta S. (2009). Checklist of Reptiles and Amphibians of DibruSaikhowa National Park. In.
Incredible Dibru Saikhowa National Park. K. K. Dwivedi. Pragati Offset Pvt. Ltd. pp. 151
• Choudhury A. (1995) Turtles recorded in Dibru Saikhowa Wildlife Sanctuary, Assam. Journal of Ecological
Society8: 3-39.
• Choudhury (1998). Mammals, birds and reptiles of Dibru- Saikhowa Sanctuary, Assam, India. Oryx.
32(3):192-200.
• Praschag, P. and R. Gemel. (2002). Identity of the black soft-shell turtle Aspideretes nigricans (Anderson,
1875), with remarks on related species (Reptilia: Testudines: Tryonychidae). Faunistische Abhandlungen
Staatliches Museum fur Tierkunde Dresden 23(5): 87-116.

164
Scanned by TapScanner
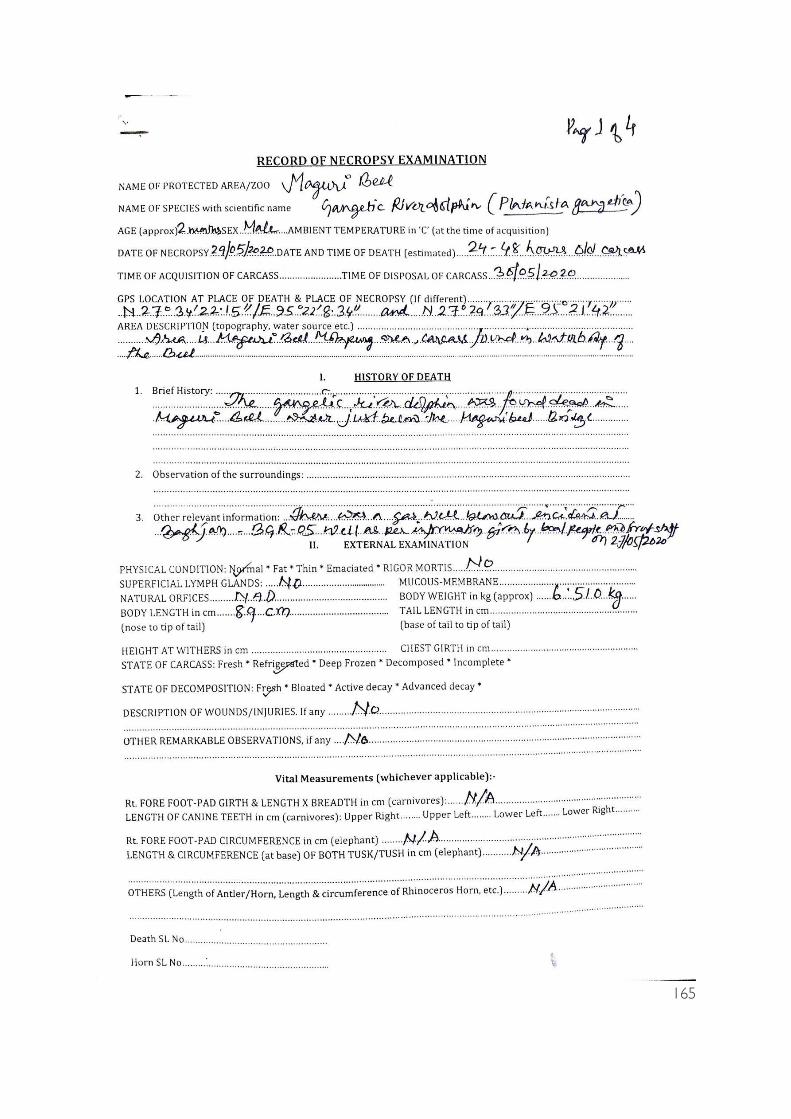
165
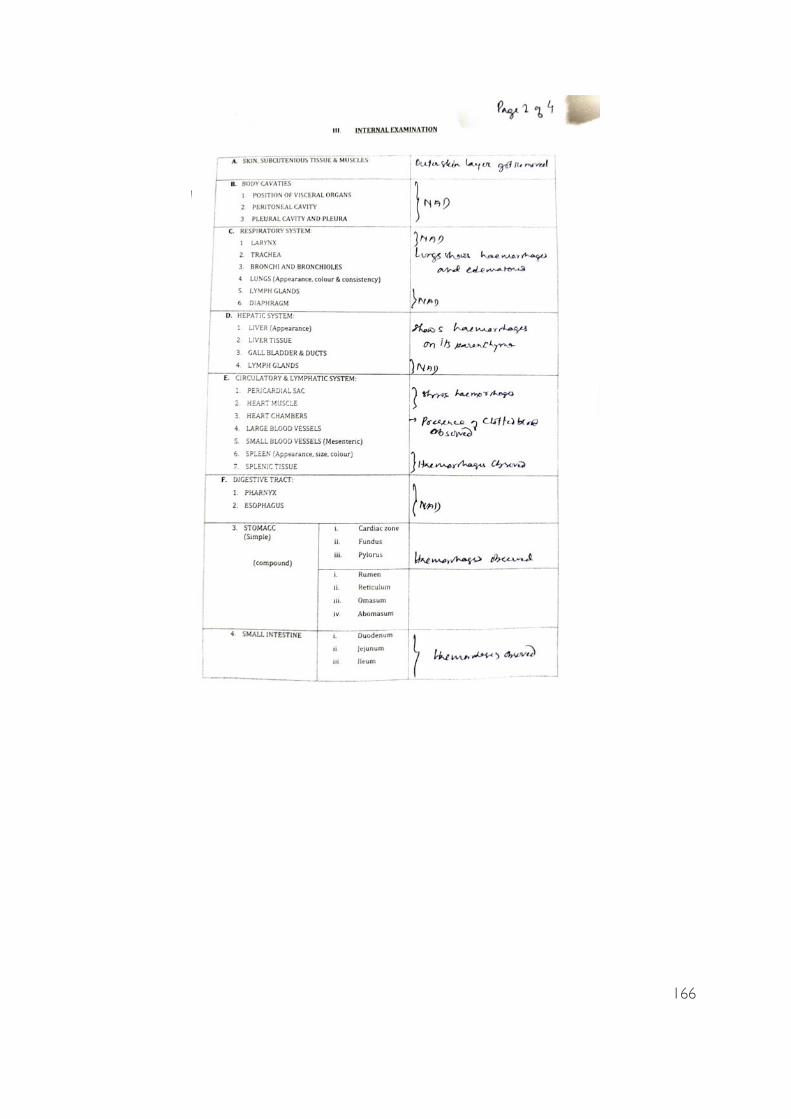
166
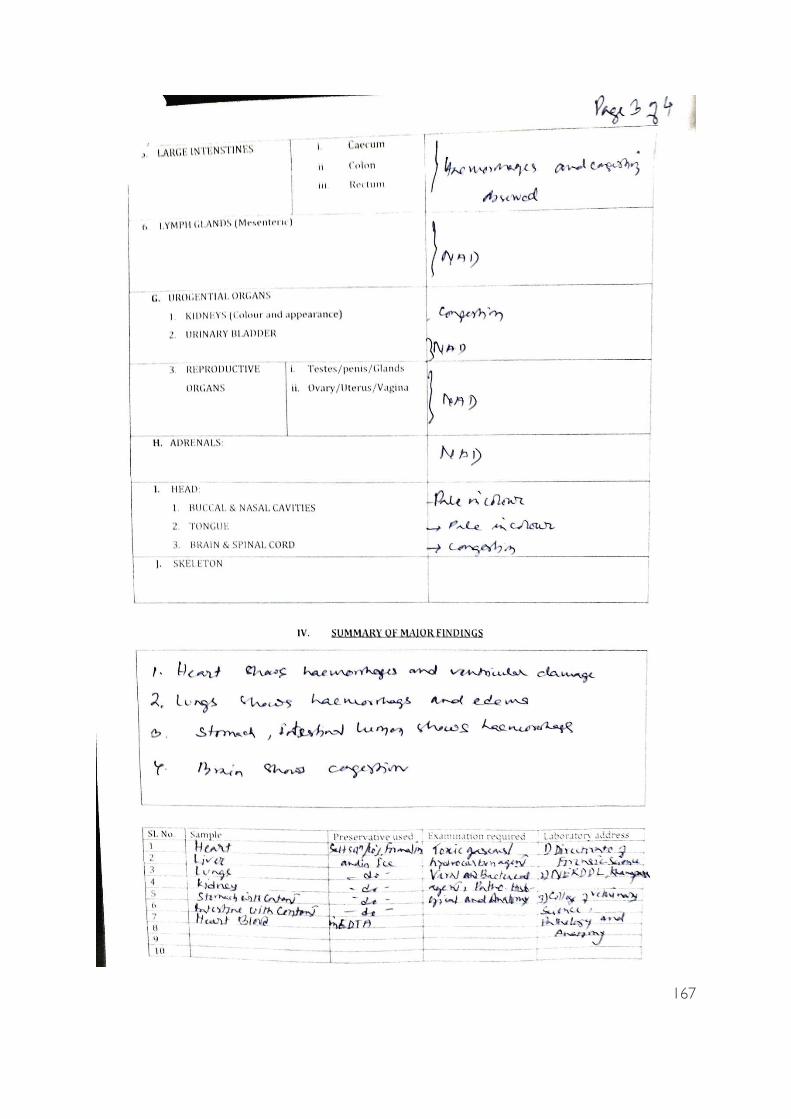
167

168
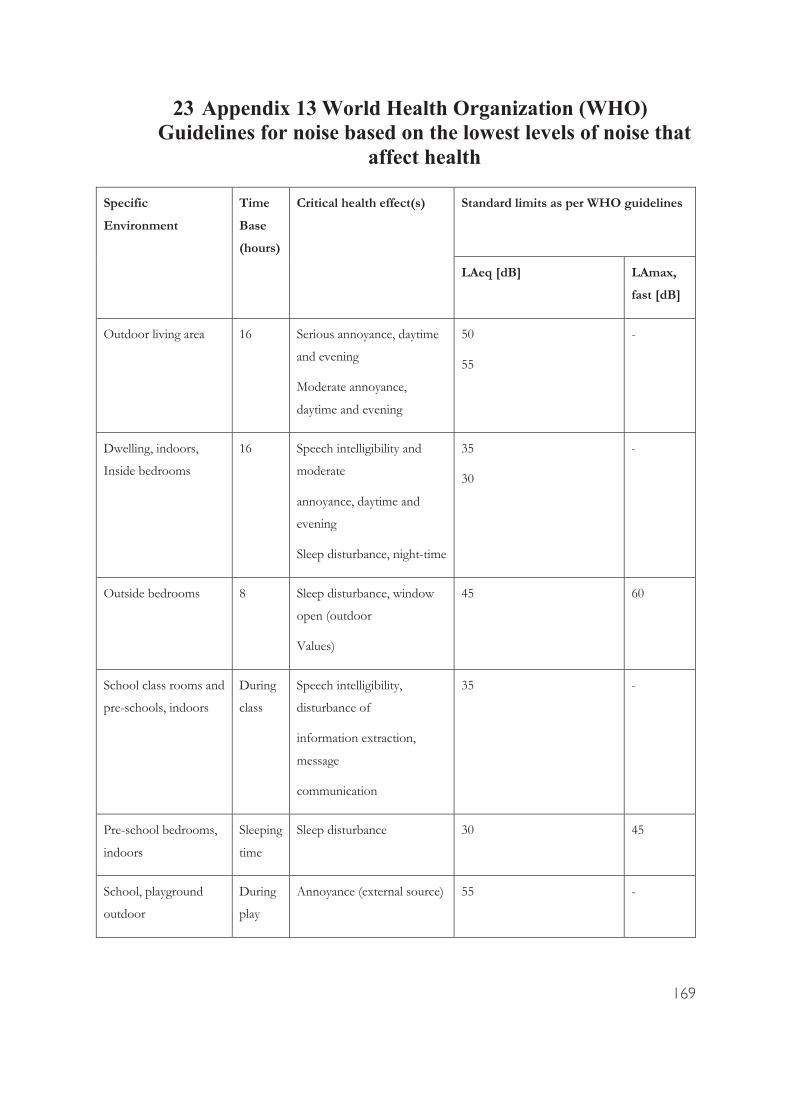
169
Specific
Environment
Time
Base
(hours)
Critical health effect(s) Standard limits as per WHO guidelines
LAeq [dB] LAmax,
fast [dB]
Outdoor living area 16 Serious annoyance, daytime
and evening
Moderate annoyance,
daytime and evening
50
55
-
Dwelling, indoors,
Inside bedrooms
16 Speech intelligibility and
moderate
annoyance, daytime and
evening
Sleep disturbance, night-time
35
30
-
Outside bedrooms 8 Sleep disturbance, window
open (outdoor
Values)
45 60
School class rooms and
pre-schools, indoors
During
class
Speech intelligibility,
disturbance of
information extraction,
message
communication
35 -
Pre-school bedrooms,
indoors
Sleeping
time
Sleep disturbance 30 45
School, playground
outdoor
During
play
Annoyance (external source) 55 -
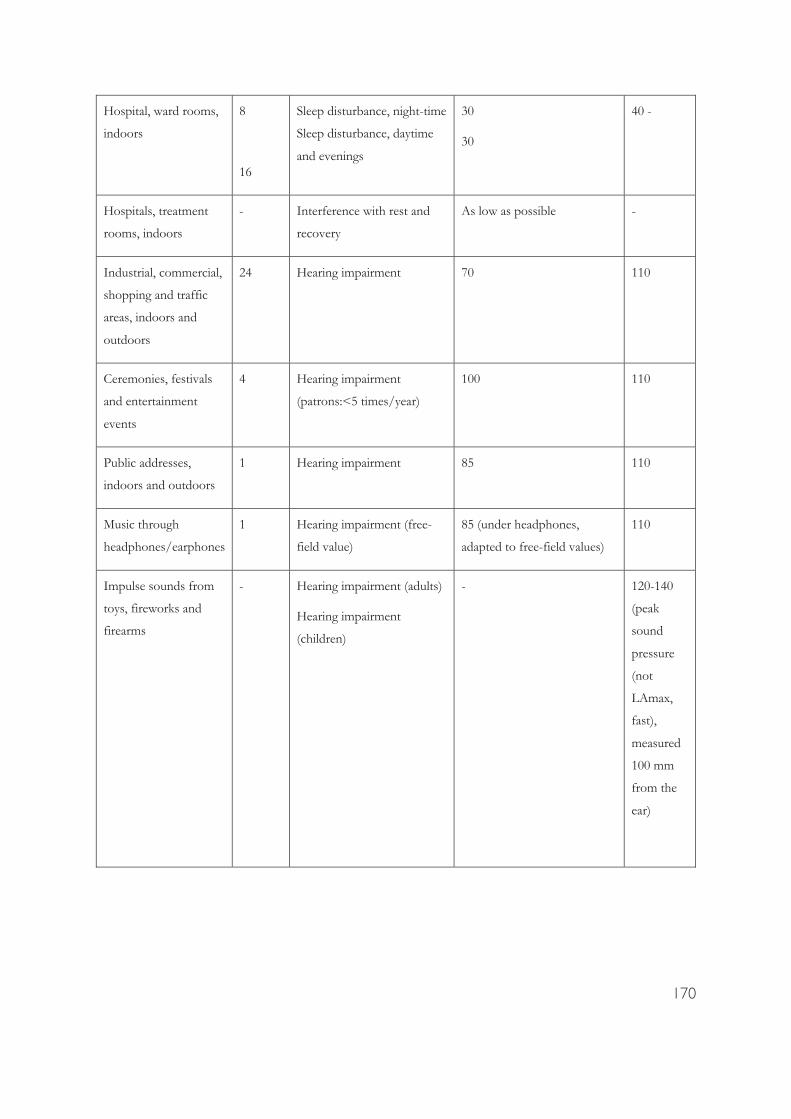
170
Hospital, ward rooms,
indoors
8
16
Sleep disturbance, night-time
Sleep disturbance, daytime
and evenings
30
30
40 -
Hospitals, treatment
rooms, indoors
- Interference with rest and
recovery
As low as possible -
Industrial, commercial,
shopping and traffic
areas, indoors and
outdoors
24 Hearing impairment 70 110
Ceremonies, festivals
and entertainment
events
4 Hearing impairment
(patrons:<5 times/year)
100 110
Public addresses,
indoors and outdoors
1 Hearing impairment 85 110
Music through
headphones/earphones
1 Hearing impairment (free-
field value)
85 (under headphones,
adapted to free-field values)
110
Impulse sounds from
toys, fireworks and
firearms
- Hearing impairment (adults)
Hearing impairment
(children)
- 120-140
(peak
sound
pressure
(not
LAmax,
fast),
measured
100 mm
from the
ear)

171
Outdoors in parkland
and conservation
areas
Disruption of tranquillity existing quiet outdoor areas
should be preserved and the
ratio of intruding noise to
natural background sound
should be kept low
-------------------------------------------------- End of Report ---------------------------------------------------


![RobustCommunication-OptimalDistributedClusteringAlgorithms · arXiv:1703.00830v3 [cs.DS] 6 Mar 2019 RobustCommunication-OptimalDistributedClusteringAlgorithms∗ Pranjal Awasthi Rutgers](https://static.fdocuments.in/doc/165x107/5f4e4601051da27eb87878a7/robustcommunication-optimaldistributedclusteringalgorithms-arxiv170300830v3-csds.jpg)