Impact of Obesity and Expression of Obesity-Related Genes ...
59
University of South Florida Scholar Commons Graduate eses and Dissertations Graduate School March 2018 Impact of Obesity and Expression of Obesity- Related Genes in the Progression of Prostate Cancer in African American Men Mmadili Nancy Ilozumba University of South Florida, [email protected] Follow this and additional works at: hp://scholarcommons.usf.edu/etd Part of the Epidemiology Commons is esis is brought to you for free and open access by the Graduate School at Scholar Commons. It has been accepted for inclusion in Graduate eses and Dissertations by an authorized administrator of Scholar Commons. For more information, please contact [email protected]. Scholar Commons Citation Ilozumba, Mmadili Nancy, "Impact of Obesity and Expression of Obesity-Related Genes in the Progression of Prostate Cancer in African American Men" (2018). Graduate eses and Dissertations. hp://scholarcommons.usf.edu/etd/7171
Transcript of Impact of Obesity and Expression of Obesity-Related Genes ...

University of South FloridaScholar Commons
Graduate Theses and Dissertations Graduate School
March 2018
Impact of Obesity and Expression of Obesity-Related Genes in the Progression of ProstateCancer in African American MenMmadili Nancy IlozumbaUniversity of South Florida, [email protected]
Follow this and additional works at: http://scholarcommons.usf.edu/etd
Part of the Epidemiology Commons
This Thesis is brought to you for free and open access by the Graduate School at Scholar Commons. It has been accepted for inclusion in GraduateTheses and Dissertations by an authorized administrator of Scholar Commons. For more information, please contact [email protected].
Scholar Commons CitationIlozumba, Mmadili Nancy, "Impact of Obesity and Expression of Obesity-Related Genes in the Progression of Prostate Cancer inAfrican American Men" (2018). Graduate Theses and Dissertations.http://scholarcommons.usf.edu/etd/7171

Impact of Obesity and Expression of Obesity-
Related Genes in the Progression of Prostate Cancer
in African American Men
by
Mmadili Nancy Ilozumba
A thesis submitted in partial fulfillment
of the requirements of the degree of
Master of Science in Public Health
Department of Epidemiology and Biostatistics
with a concentration in Epidemiology
College of Public Health
University of South Florida
Major Professor: Janice Zgibor, M.P.H., RPh, Ph.D.
Committee: Jong Park, M.S., M.P.H., Ph.D.
Committee: Skai Schwartz, B.A., M.A., Ph.D.
Date of Approval:
March 13, 2018
Keywords: biochemical recurrence of prostate cancer, gene expression, obesity, health disparity
Copyright (c) 2018, Mmadili Nancy Ilozumba

DEDICATION
This thesis is dedicated to my loving family. Thank you daddy for sponsoring my
Master’s program in the US, despite the economic recession in our country, Nigeria. You
provided all my needs and I really do not know how to thank you enough. Thank you for
encouraging me to do my best and prove myself. Thank you for being proud of me. Thank you
mummy for being my rock, for your ceaseless prayers and for your encouragement. Indeed, your
answered prayers are evident in my life. Thank you for your love, Mum. Thank you mum and
dad for being my role models and for raising me to be the kind of woman I am today. I love you
so much, mum and dad. To my lovely sisters and brother: Chinasa, Usochi, Odichi, Eziolu and
Ebube, thanks for the moral support, encouragement and care. I would not have come this far
without your presence in my life. I love you, guys! God bless everyone of you!

ACKNOWLEDGEMENTS
I immensely thank the Almighty God who made this thesis a dream come true. I would
not have been able to get this work done without His infinite mercy and grace. I am also thankful
to God for an opportunity to further my education far away from my country, Nigeria. The
struggles and challenges were so real but God kept me strong even when it seemed like I could
not go on. Thank You, Jesus!
My profound gratitude goes to Dr. Jong Park who has been an incredible and a kind
mentor. Your humility and great sense of humor are commendable. I remember how you swiftly
responded to my email when I asked for an opportunity in prostate cancer research. You
immediately added me to your team and working with you has been swell. You always spared
some time for me whenever I had questions regarding my thesis work despite how busy you
were. You always welcomed me in your office and patiently answered all my questions. I would
not have been able to start and finish my thesis without you providing me with data and
mentorship. Thank you so much!
My profound gratitude also goes to Dr. Janice Zgibor, my academic advisor and faculty
mentor. Thank you so much for being so kind, welcoming and for helping me navigate my
Masters’ program. You selflessly decided to be a major professor in my thesis so that you could
assist me in the best way possible. Thank you for your advices, corrections, writing aid,
supervision and mentorship.

My profound appreciation goes to Dr. Skai Schwartz and Dr Hung Luu. Thank you for
the contributions you made in my thesis. Thank you for the insightful suggestions and
corrections. I really appreciate your mentorship.
I want to thank Ganna Chornokur, who contributed to this project during her post-
doctoral training at Moffitt Cancer Center and Research Institute. I also want to thank my
colleague Bashir Dabo for his contribution to this project.

i
TABLE OF CONTENTS
LIST OF TABLES ii
LIST OF FIGURES iii
ABSTRACT iv
INTRODUCTION 1
Health Disparity of Prostate Cancer 1
Obesity and Prostate Cancer Risk 3
Overview of Genetic Variation and Prostate Cancer Risk 4
Gene Mutation 4
Genetic Polymorphism 5
Gene Expression 6
Significance of the Study 8
METHODOLOGY 10
Tissue Processing and Sample Selection 10
Expression Assay 10
Gene Selection 11
Statistical Analysis 11
RESULTS 14
DISCUSSION 32
Limitation 34
CONCLUSION 35
REFERENCES 37
APPENDICES 43
Appendix A 44

ii
LIST OF TABLES
Table 1: Descriptive and Clinical Characteristics for the 48 African American Prostate
Cancer Patients 18
Table 2: Dichotomous Clinical and Demographic Characteristics for the 48 African
American Prostate Cancer Patients 19
Table 3: Comparing the Means for Gene Expression among Tumor Tissue Prostatic
Intraepithelial Neoplasia (PIN) and Normal Tissue 20
Table 4: Comparing the Means for Gene Expression among the Tissue Types Stratified
by Obesity (Obese and Non-obese) 21
Table 5: Testing the Association between Obesity and the Recurrence of Prostate
Cancer 22
Table 6: Simple Logistic Regression Testing the Association between Gene Expression
and Biochemical Recurrence of Prostate cancer 23
Table 7: Multiple Logistic Regression Testing the Association between Gene Expression
and Biochemical recurrence of Prostate cancer 24
Table 8: An overlap of Genes 25
Table 9: P-value for a Kaplan Meier Curve Depicting the Role of Obesity in Prostate
Cancer progression 25

iii
LIST OF FIGURES
Figure 1: Kaplan Meier Curve depicting the role of obesity in prostate cancer Progression 26
Figure 2: Trend of Gene Expression in Normal, PIN and Tumor Tissue Sample 27

iv
ABSTRACT
In the US, the incidence and mortality rates of prostate cancer (PCa) are higher among
African American men compared to European American men. Obesity is an important risk factor
of PCa. Obesity is known to alter the gene expression profiles in prostate tumors. This study
evaluates the impact of obesity and the expression of obesity-related genes on the progression of
PCa in African American men.
The primary outcome of interest is biochemical recurrence (BCR) of PCa. There were
48 African American prostate cancer patients in the study. The tissue samples included 42
normal tissues, 40 Prostate Intraepithelial Neoplasia (PIN) and 45 tumor tissues (127 tissue
samples in total). We assembled 99 obesity-related genes and determined the levels of their
expression in the three types of tissue samples using Nanostring Technologies. An ANOVA test
was used to compare the means for gene expression among normal, PIN and tumor tissue
samples. Unconditional logistic regression models were used to calculate odds ratios (ORs) and
their respective 95% confidence intervals (95% CIs) to determine the association between
obesity and BCR as well as gene expression and BCR. Results were regarded as statistically
significant if p-values were less than 0.05. A Kaplan Meier Curve was constructed to depict the
survival time and time to event (BCR) among obese and non-obese African American prostate
cancer patients. Patients were followed up from the date of first surgery to the date of
biochemical recurrence or date of last follow-up. Statistical analysis was done with SAS 9.4
software.
v
Forty-three obesity-related genes were statistically significantly associated with
biochemical recurrence. There was no association between obesity and biochemical recurrence
(BCR) in obese African American men compared to non-obese African American men (OR=
2.03, 95% CI = 0.22 - 18.77, p-value= 0.53). Twenty genes showed an upward trend in gene
expression among normal, PIN and tumor tissue samples including ADIPOR1, AKRIC4,
ALOX12, ALOX15, CRYBB2, EIF5A, ERG, GNPDA2, HNF1B, HSD3B1, KLK4, LEP, MC4R,
MTCH2, PCSK1, PIK3CB, SLC2A2, STAT1, SULT1A1, YY1. The probability of survival (not
having BCR) is lower in obese African American men compared to non-obese African American
men as indicted in the Kaplan Meier curve. In other words, the probability of developing BCR is
higher in obese African American men compared to non-obese African American men.
We did not find a significant association between obesity and biochemical recurrence.
However, we elucidated some obesity-related genes that could explain PCa carcinogenesis.
Further studies are needed to determine functional significance of these selected obesity-related
genes and the role they play in encouraging PCa progression in African American men.

1
INTRODUCTION
Health Disparities in Prostate Cancer
There is an apparent disparity in prostate cancer (PCa) among different races in the
United States (US). African American men (AAM) are disproportionately affected by the burden
of prostate cancer. Amongst European American men, the incidence rate of prostate cancer is
approximately 113 per 100,000 persons while the prostate cancer incidence rate is approximately
189 per 100,000 persons in African American males (National Cancer Institute, 2017b). In terms
of prostate cancer death rates, approximately 19 per 100,000 White men die from prostate cancer
while 42 per 100, 000 AAM die from prostate cancer (National Cancer Institute, 2017b). Hence,
African American males have both the highest incidence rate and mortality rate of prostate
cancer compared to other races in the US. There are risk factors that are likely responsible for
these disparities. The socio-economic status (SES) of an individual is a potential risk factor for
prostate cancer disparity. A study by (Byers et al., 2008) showed that low SES significantly
elevated the risk of dying from prostate cancer among men. The risk was elevated because of
later diagnosis of prostate cancer and less aggressive treatment. Being a minority population in
the US, AAM are more likely to have a low SES. Low SES compromises the health of
individuals. These individuals tend to lack access to health care and health insurance coverage
(Becker & Newsom, 2003, American Cancer Society, 2016, Fiscella & Williams, 2004). In terms
of median value of assets, Whites have a net worth of $103976 while Blacks have a net worth of
$9211 (US Census Bureau, 2017). Low SES encourages behavioral risk factors that increase the
risk of prostate cancer development.

2
Behavioral risk factors for prostate cancer disparities including lack of access to healthy
foods, obesity, physical inactivity, cigarette smoking, alcohol consumption and other health
behaviors are more common among people with low SES and minority population (Pampel,
Krueger, & Denney, 2010). In terms of diet and prostate cancer risk, consumption of red meat,
high fat diets and low carotenoid intake increases the risk of prostate cancer (Jianjun, Dhakal,
Greene, Lang, & Kadlubar, 2011). A study by Taksler, Keating, & Cutler (2012) that was aimed
at elucidating the differences in prostate cancer attributed to race revealed that the estimated
disparity in prostate cancer mortality was 1320 more cases per 100000 males amongst Black
males compared with White males. This disparity was due to an increased number of new cases
of prostate cancer among Black males (76%) as well as an increased stage-specific death rate at
diagnosis (24%). Twenty-nine percent of the difference in the number of new cases of metastatic
prostate cancer between Black men compared to White men was attributed to the variation in
income, pre-existing health conditions and prostate specific antigen (PSA) testing while the
characteristics of tumor at diagnosis explained fifty percent in racial differences of prostate
cancer (Taksler et al., 2012).
3
Obesity and Prostate Cancer Risk
Obesity, which is a chronic health condition is a risk factor for other chronic diseases
including high blood pressure, stroke and different types of cancer like breast and prostate cancer
(American Cancer Society, 2016). Epidemiological evidence revealed that obesity is associated
with poorer treatment outcomes and higher risk of mortality due to prostate cancer
(Buschemeyer & Freedland, 2007). Obese men are more likely to experience prostate cancer
recurrence after treatment than non-obese men. A study by (Freedland et al., 2004) revealed that
obesity rate is 31% in African American men compared to 21% in White men. They also showed
that obesity is linked with higher grade tumors. In the US, the prevalence of obesity is greater in
Black men than in Whites men. The obesity prevalence is 38% in Black men compared to 35%
in White men (American Cancer Society, 2016). Physical activity reduces the risk of cancer
remission but the prevalence of no leisure physical activity is 34% in Black men compared to
25% in White men (American Cancer Society, 2016). Among men treated with radical
prostatectomy, obese patients were more likely to have more pronounced biochemical failure
rates (Freedland et al., 2004). Obesity also modifies the levels of certain hormones that are
related to prostate cancer risk such as testosterone, leptin, insulin-like-growth-factor-1 and
estrogen (Buschemeyer & Freedland, 2007, Freedland & Aronson, 2004).
The association between obesity and aggressive prostate cancer as a health outcome can
be explained through different mechanisms of action. These mechanisms may be more
pronounced in an obese patient, who has general hormone changes that leads to increased
estradiol, lower sex hormone binding protein and low free testosterone, which results in an
aggressive form of prostate cancer (Freedland & Aronson, 2004). Another mechanism in obese
males is insulin resistance leading to high insulin levels, which results in an aggressive form of

4
prostate cancer (Buschemeyer & Freedland, 2007). Adiponectin, a protein hormone found in
adipose tissues is responsible for the regulation of fatty acids and glucose in the body and plays a
crucial role in obesity-related cancers including cancer of the prostate (Kelesidis, Kelesidis, &
Mantzoros, 2006, Rider et al., 2015, RJ & English, 2006). A low level of adiponectin in the body
suggests risk for the progression and aggressiveness of prostate cancer (Obeid & Hebbard,
2012).
Overview of Genetic Variation and Prostate Cancer Risk
Variation occurs whenever the order of the bases in a DNA sequence changes. Variations
can involve only one base or many bases (National Institute of Health, 2017). If the two strands
of a chromosome are thought of as nucleotides threaded on a string, then, for example, a string
can break and the order of the bases can vary. One or more nucleotides may be changed, added,
or removed. In chromosomes, these changes are called Single Nucleotide Polymorphisms
(SNPS) (National Institute of Health, 2017), insertions, and deletions (Mullaney, Mills, Stephen
Pittard, & Devine, 2010).
In addition to these changes, some DNA sequences called “repeats” like to insert extra
copies of themselves several times. Chromosomes can also undergo more dramatic changes
called translocations (Nambiar & Raghavan, 2011). These occur when an entire section of DNA
on one chromosome switches places with a section on another. The risk for prostate cancer can
be exacerbated in the presence of a variation in the gene of an individual. This variation could be
brought about by some mechanisms such as gene mutations, miRNA alterations, genetic
polymorphisms and epigenetic modification (Arun et al., 2017).

5
Gene Mutation
An inheritance of a mutated gene poses a risk for prostate cancer as well as the
aggressiveness of the disease. Family history of prostate cancer is important in determining the
risk of prostate cancer (American Cancer Society, 2017). Mutation in genes such as BRCA1,
BRCA2, HOXB13 (National Cancer Institute, 2017c) are good predictors of prostate cancer risk.
A study conducted by (Pritchard et al., 2016) found that men with metastatic prostate cancer
were more likely to have an inherited mutation in the gene responsible for DNA-repair compared
with men diagnosed with a localized prostate cancer. They identified mutations in 16 genes
including BRCA2, ATM, CHEK2, BRCA1, PALB2 and RAD51D. The number of new cases of
mutations in DNA repair genes was approximately 12% in men with metastatic prostate cancer,
which exceeded the number of DNA repair gene mutation in men with localized prostate cancer
(Pritchard et al., 2016). DNA-repair genes are responsible for the maintenance of genes,
prevention and correction of errors during DNA replication (Cancer Information and Support
Network, 2017).
Genetic Polymorphisms
Single Nucleotide Polymorphisms (SNP) is a type of genetic variation in which there is a
change in the arrangement of nucleotides in a DNA (National Institute of Health, 2017). A study
carried out by Lipson et al., (2014) was aimed at determining whether the GWAS replication
SNPs and candidate SNPs that showed evidence for prostate cancer susceptibility can also
indicate prostate cancer aggressiveness. They found that among the 34 GWAS replicated SNPs,
4 were associated with prostate cancer aggressiveness in African American males. These SNPs
were rs2660753, rs13254738, rs10090154, rs2735839. Two of the SNPs were found on 8q24
while the other two SNPs were found on 3p12 and 19q13. Jianjun et al., (2011) evaluated

6
whether there was an association between the polymorphism in hOGG1 and XRCC1 genes and
risk of prostate cancer. They found a positive association and the effect of the genes were
modified by plasma antioxidants. These genes are involved in the repair of oxidative DNA
damage. Thus, an existence of variation in these genes increases the risk of prostate cancer.
Genetic variation in the HNF1B is associated with prostate cancer risk (Chornokur et al., 2013),
although the underlying mechanistic pathway(s) remain elusive. Obese men with rs7501939 C-
allele were found to have a higher risk of prostate cancer. rs7501939 is located in the HNF1B
gene that regulates proliferation of prostate cancer (Ross-Adams et al., 2015). Furthermore, 4 of
the 12 single nucleotide polymorphisms (rs10993994, rs5945619, rs4430796, and rs9364554)
studied by Grisanzio et al., (2012) showed a strong association with five genes: MSMB, NCOA4,
NUDT11, HNF1B, and SLC22A3. These genes were involved in prostate cancer pathogenesis.
Gene Expression and Prostate Cancer Risk
Ideally, DNA are the building blocks of genes. Genes produce functional end-products
such as proteins through the process of gene-expression (National Cancer Institute, 2018). For
every gene, individuals have different levels of proteins. Enzymes are proteins and different
people have variation of the same enzyme. The process of gene expression starts with a DNA,
which undergoes transcription to form an RNA. The RNA is then translated into a protein
(National Cancer Institute, 2018). In other words, the presence or absence of a functional enzyme
depends on whether an individual expresses the gene responsible for the enzyme as well as the
level at which the gene is expressed. Consequently, expression levels of certain enzymes likely
have an association with prostate cancer risk (Donkena & Young, 2011, Nghiem et al., 2016).
Proteins may also come in the form of hormones. Androgen metabolism genetics and prostate
cancer risk has been well established. Higher levels of androgen increases the risk of prostate

7
cancer (Michaud, Billups, & Partin, 2015). African American males usually have higher levels of
androgen compared to other races (C. M. Zeigler-Johnson et al., 2008). Although impact of
testosterones on the risk of prostate cancer is still inconclusive, testosterone metabolites, such as
dihydotestosterone (DHL) increase the risk of prostate cancer (Gann, Hennekens, Ma,
Longcope, & Stampfer, 1996). Variations in certain enzymes such as CYP3A4, CYP3A43 and
CYP3A5 which are responsible for the activation of testosterone hormone, are associated with the
aggressiveness of prostate cancer both in African American males and European American males
(C. Zeigler-Johnson et al., 2004). Park et al., (2006) found that there was an association between
the deletion polymorphism of an enzyme called UDP-Glucuronosyltransferase 2B17 and an
increased risk of prostate cancer among AAM and Caucasian men. The enzyme is responsible
for the glucuronidation of many chemicals as well as androgen. In other words, UDP-
Glucuronosyltransferase 2B17 facilitates the excretion of these chemicals and hormones.
Preliminary studies have evaluated the association of gene expression and the risk of
prostate cancer progression. Nghiem et al., (2016) analyzed the association between the
expression of mismatch repair enzymes and prostate cancer risk. They found no association
between the mismatch repair enzymes and biochemical recurrence. Powell et al.,( 2013) showed
that genes associated with prostate cancer are expressed differently between European American
males and African American males. Singh et al., (2002) demonstrated that the expression of
genes can predict the behavioral outcome of prostate cancer in patients. Chandran et al., (2007)
delineated the potential genes expressed in prostate cancer patients that influence the progression
of the disease. In a study conducted by Yu et al., (2004), there was evidence of a difference in
the genes expressed in the tumor and non-tumor samples. They also found that the expression of
these genes might serve as a prognosticative factor in determining the aggressiveness of prostate

8
cancer. Mortensen et al., (2015) discovered the expression of twelve genes that were predictors
of biochemical recurrence of prostate cancer. They also found that patients with recurrence had
an up-regulated expression of SFRP gene.
Significance of the Study
Obesity is known to alter the gene expression profiles in prostate tumors (Ornish et al.,
2008, Ribeiro et al., 2012). Hence, it is imperative to understand the role of obesity in prostate
cancer risk in order to inform adequate control of prostate cancer. There is evidence that tumors
derived from African American men are more aggressive in nature compared to tumors from
European American men (Castro et al., 2009, Lipson et al., 2014, Timofeeva et al., 2009,
Zeigler-Johnson et al., 2004). It is possible that obesity would influence prostate carcinogenesis
in African- American males (AAM), although the studies aimed to verify this hypothesis are
lacking.
Our study hypothesis is that obesity may be associated with an increased risk for prostate
cancer progression in obese African American men compared to non-obese African American
men. We selected a novel candidate-driven selective approach over the traditional non-candidate
gene expression profiling. We tested this hypothesis by:
a. Comparing the means for gene expression among tumor tissue, Prostatic Intraepithelial
Neoplasia (PIN) and normal tissue.
b. Testing the trend of gene expression among tumor, PIN and normal tissues.
c. Comparing the means for gene expression among tumor tissue, Prostatic Intraepithelial
Neoplasia (PIN) and normal tissue stratified by obese and non-obese patients.
d. Testing the association between obesity and the biochemical recurrence of prostate
cancer after initial surgery with the use of a multiple logistic regression

9
e. Testing the association between gene expression and biochemical recurrence of prostate
cancer using logistic regression models at a 95% confidence interval.
f. Constructing a Kaplan Meier Curve depicting the time to event (biochemical recurrence)
among obese and non-obese African American prostate cancer patients.

10
METHODOLOGY
Tissue Processing and Sample Selection
We obtained tissue samples from 48 African American prostate cancer patients Total
Cancer Care bank (a biological specimen repository at Moffitt). The tissue samples included 42
normal tissues, 40 Prostate intraepithelial Neoplasia (PIN) and 45 Tumor tissues. There was a
total of 127 tissue samples in our study. The samples are formalin fixed paraffin embedded
(FFPE). These samples are linked to the epidemiological, clinical and follow up data. Our
primary outcome is the biochemical recurrence of prostate cancer (BCR). Patients’ demographic
and clinical data were obtained, including, age, height, weight, BMI, Gleason score (including
primary and secondary Gleason scores), Prostate Specific Antigen (PSA), Cancer of the Prostate
Risk Assessment (CAPRA) Score, seminal vesicle invasion, surgical margins, lymph node
invasion and extra capsular extension. Patients were followed up from the date of first surgery to
the date of biochemical recurrence or date of last follow-up. A Moffitt pathologist identified and
marked tumor, PIN and normal regions. RNA samples were extracted from marked tissues for
gene expression profiling.
Expression Assay
We used the nCounter gene expression assays by NanoString technologies (Nanostring
Technologies, 2017). These innovative assays can analyze the formalin fixed, paraffin embedded
(FFPE) blocks, as well as fresh-frozen (FF) tumor tissues with comparable accuracy. The nCounter
gene expression assays can analyze up to 800 genes in a single reaction using 100ng or less of total
RNA or FFPE extract. These assays were provided at the Moffitt Center genomics core.

11
Gene Selection
We assembled a list of “obesity-related” genes. A total of 99 obesity-related genes were
included in the gene expression profiling. The databases including “Gene” by NCBI (National
Center for Biotechnology Information, 2017), GeneCards (GeneCards, 2017) and Cancer
Genome Anatomy Project (National Cancer Institute, 2017a) were used to ensure comprehensive
search.
Statistical Analysis
We recoded and categorized the BMI scores in order to identify patients who were
overweight and obese in the sample. The obese and overweight group were those with BMI ≥ 25
while the non-obese and non-overweight group had BMI < 25. We decided to use a cut point of
25 for BMI because overweight and obesity are likely related to an increased risk of prostate cancer
recurrence after treatment (American Cancer Society, 2018). We also recoded and categorized the
Gleason scores in order to determine the number of patients and their respective tissue samples
with an aggressive Gleason score. Gleason scores determines the likelihood of prostate cancer
spreading to other normal tissues (Stark et al., 2009). Gleason score ≥ 7 were recoded as aggressive
while Gleason scores less than 7 were coded as non-aggressive Gleason scores.
Descriptive statistics were used to summarize the participants’ demographic and clinical
characteristics. Mean, standard deviation, minimum, maximum and range were calculated for
continuous variables whereas frequency and percentage were generated for categorical variables.
Gene expressions was normalized using internal housekeeping reference genes, and summarized
using descriptive statistics. We also summarized the descriptive statistics of the expression of 99
genes for the three types of tissue sample using the mean, standard deviation and range. To

12
compare the means for gene expression among tumor tissue, prostatic intraepithelial neoplasia
(PIN) and normal tissue, we used F test. Genes less than the alpha level of 0.05 were regarded as
being differently expressed among the three types of tissue samples and statistically significant.
We constructed a logistic regression model to test the association between obesity and the
biochemical recurrence of prostate cancer after initial surgery. In order to control for
confounding, we carried out a stepwise selection procedure for all covariates including age,
height, weight, BMI, Gleason score, Prostate Specific Antigen (PSA), Cancer of the Prostate
Risk Assessment (CAPRA) Score, seminal vesicle invasion, surgical margins, lymph node
invasion and extra capsular extension. The result of the stepwise selection determined the
significant covariates that would be adjusted for in the logistic regression. No covariate met the
significance level of entry (0.15) and significant level of stay (0.15) in the stepwise selection
model. Hence, we did not adjust for any covariate in the final logistic model.
To determine the association between biochemical recurrence and gene expression, we
first carried out a simple logistic regression for each of the 99 genes present in the study. We
went further to generate a multiple logistic regression in order to control the presence of
confounder. A stepwise selection procedure was done for the 99 genes individually. Variables
such as age, height, weight, BMI, Gleason score, Prostate Specific Antigen (PSA), Cancer of the
Prostate Risk Assessment (CAPRA) Score, seminal vesicle invasion, surgical margins, lymph
node invasion and extra capsular extension were included in the stepwise selection procedure.
The result of each stepwise selection procedure determined the significant covariates adjusted for
each gene in the logistic regression. P-values ≤ 0.05 were regarded as statistically significant.
The odds-ratio and 95% confidence interval for the association between gene expression and
biochemical recurrence were recorded for the results with p-values ≤ 0.05.

13
We constructed a Kaplan Meier’s Curve to determine the time to event, in this case,
prostate cancer recurrence among obese and non-obese African American prostate cancer
patients. Data analyses were performed using SAS 9.4 software (SAS Institute Inc., Cary, NC,
USA).
14
RESULTS
Table 1 shows a summary of the demographic and clinical characteristics of the prostate
cancer patients in our sample. The statistics were stratified into the three types of tissues that we
obtained, namely, normal tissue, prostatic intraepithelial neoplasia (PIN) and tumor tissue.
Patients with normal tissue and PIN had a mean age of 54 years while patients with tumor tissue
had a mean age of 55 years. The minimum and maximum heights of the patients were 161.50cm
and 188cm respectively, while they had a minimum and maximum weights of 62.46kg and
119.67kg respectively. The maximum BMI in our sample was 39.42 kg/m2.The average BMI for
normal and tumor tissues was 29.08 kg/m2 while it was 28.90 kg/m2 in prostatic intraepithelial
neoplasia. The prostate specific antigen (PSA) had a mean above 7ng/ml and a maximum value
of 33.10ng/ml in the sample. This is as expected since all the patients in our sample already had
prostate cancer. PSA levels ≤ 4ng/ml is regarded as normal, levels above 4ng/ml but less than
10ng/ml could pose a threat while levels >10ng/ml significantly increase the risk of prostate
cancer (American Cancer Society, 2017). On a scale of 0-12, the Capra score had a maximum
value of 11 for both normal and tumor tissues but a score of 9 for PIN. Capra score predicts the
likelihood of prostate cancer progression after initial prostatectomy (Punnen et al., 2014). The
average Gleason score for normal tissue, PIN and tumor tissue were 6.64, 6.58 and 6.62
respectively. Normal and tumor tissues had a maximum Gleason score of 9 while PIN had a
maximum value of 9.
Table 2 shows the dichotomous clinical and demographic characteristics of the patients.
Ten patients had a biochemical recurrence while thirty-eight patients did not have a biochemical

15
recurrence. Eighty-three percent (83%) of the patients were obese while 16.67% were non-obese.
Aggressive Gleason score was evident in twenty-nine patients. In terms of metastasis of prostate
cancer, two patients had a seminal vesicle invasion, twelve patients had surgical margins, one
patient had a lymph node invasion while 14.58% of the patients had an extracellular extension.
Table 3 shows the result of the F test used to compare the means of gene expression
among the three types of tissue samples. Only expressed genes that were statistically
significantly different among the three tissue samples are presented. A total of 29 genes were
significantly expressed differently in the normal tissue, PIN and tumor tissue.
Table 4 shows the result of the F test used to compare the means of gene expression
among normal, PIN and tumor tissues stratified by obese and non-obese patients. Genes that
were statistically significantly different among obese and non-obese are marked with asterisk. A
total of 6 genes out of the 29 obesity-related genes that showed a difference in the means for
gene expression among tumor tissue, Prostatic Intraepithelial Neoplasia (PIN) and normal tissue,
were significantly expressed differently between the obese and non-obese African American
prostate cancer patients.
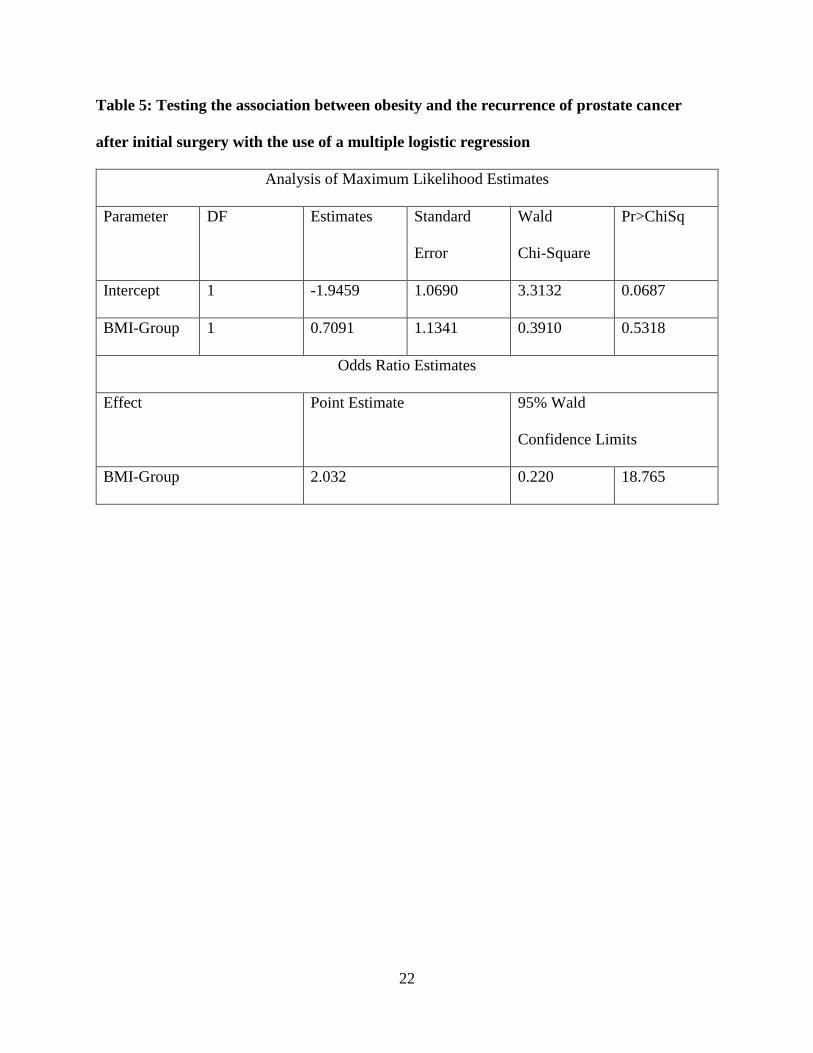
Table 5 shows the result of the test of association between obesity and recurrence of
prostate cancer after initial surgery. We found no association between obesity and biochemical
recurrence of prostate cancer in African American obese patients compared to African American
non-obese patients (OR= 2.032, 95% CI = 0.220- 18.765, p-value= 0.5318). There is no
association between obesity and biochemical recurrence because the p-value is above the alpha
level of 0.05.
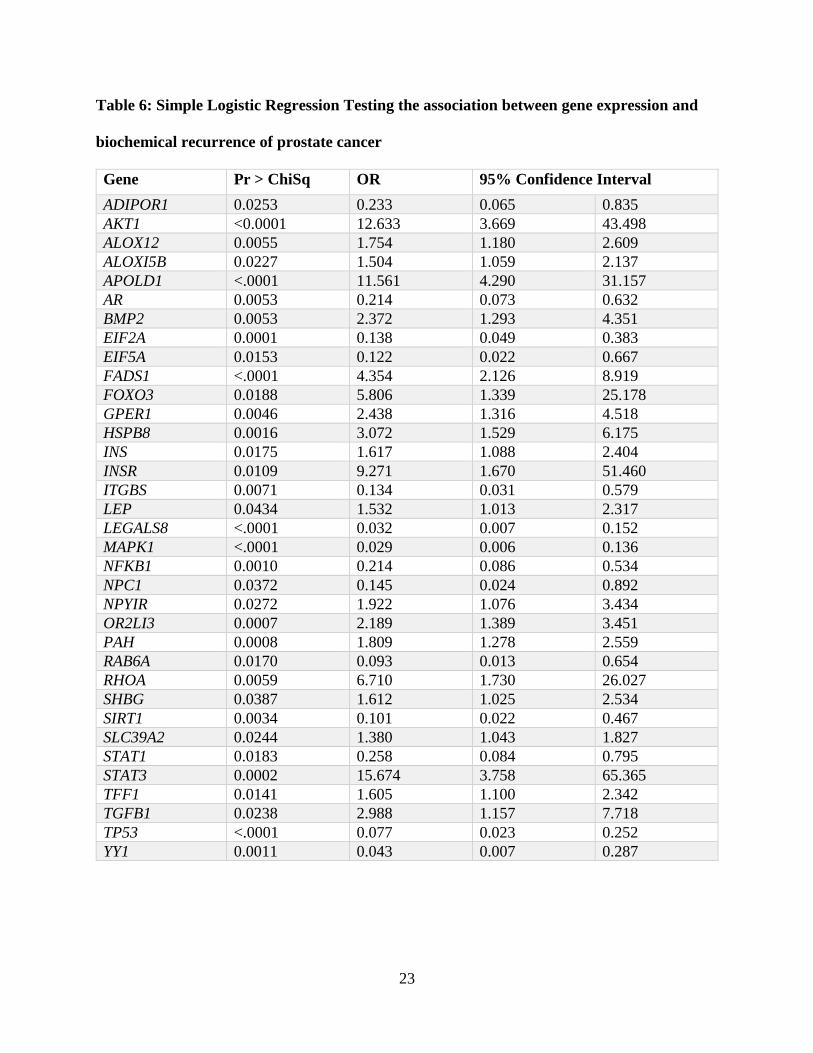
Table 6 illustrates the result of the test of association between gene expression and
biochemical recurrence of prostate cancer with no adjustment of covariates. A total of 35 genes

16
showed a statistically significant association with biochemical recurrence of prostate cancer with
a p-value less than 0.05. Their respective odds ratios and 95% confidence intervals are also
represented.
Table 7 illustrates the result of the test of association between gene expression and
biochemical recurrence of prostate cancer with the adjustment of potential covariates. The
covariates we adjusted for include age, height, weight, BMI, Gleason score, Prostate Specific
Antigen (PSA), Cancer of the Prostate Risk Assessment (CAPRA) Score, seminal vesicle
invasion, surgical margins, lymph node invasion and extra capsular extension. A total of 43
genes out of the 99 obesity-related genes showed a statistically significant association with
biochemical recurrence of prostate cancer with a p-value less than 0.05. Their respective odds
ratios and 95% confidence intervals are also represented.
In the Kaplan Meier curves illustrated in Figures 1, the probability of having no
biochemical recurrence of prostate cancer at day zero is 100% or 1 for both the obese and non-
obese African American (AA) patients. However, over time the probability reduces such that at
time 1000days, approximately 15% of obese patients have a biochemical recurrence (BCR) of
prostate cancer while 0% of non-obese patients have BCR. In other words, the probability that an
obese patient will not have a biochemical recurrence of prostate cancer (BCR) beyond the 1000th
day of follow up is approximately 85% while the probability that a non-obese patient will not
have BCR beyond the 1000th day is 100%. At 2000th day of follow up, the probability that an
obese patient will not have BCR is 70% while the probability of not experiencing BCR is
approximately 80% in non-obese AA prostate cancer patients. The probability that an obese
patient will not have BCR beyond 3000days of follow-up is 62% in the obese AA patients
compared to approximately 80% in the non-obese AA patients. The comparison between the two
17
survival curves for obese and no-obese was not statistically significant as indicated by the (p-
value = 0.3118).
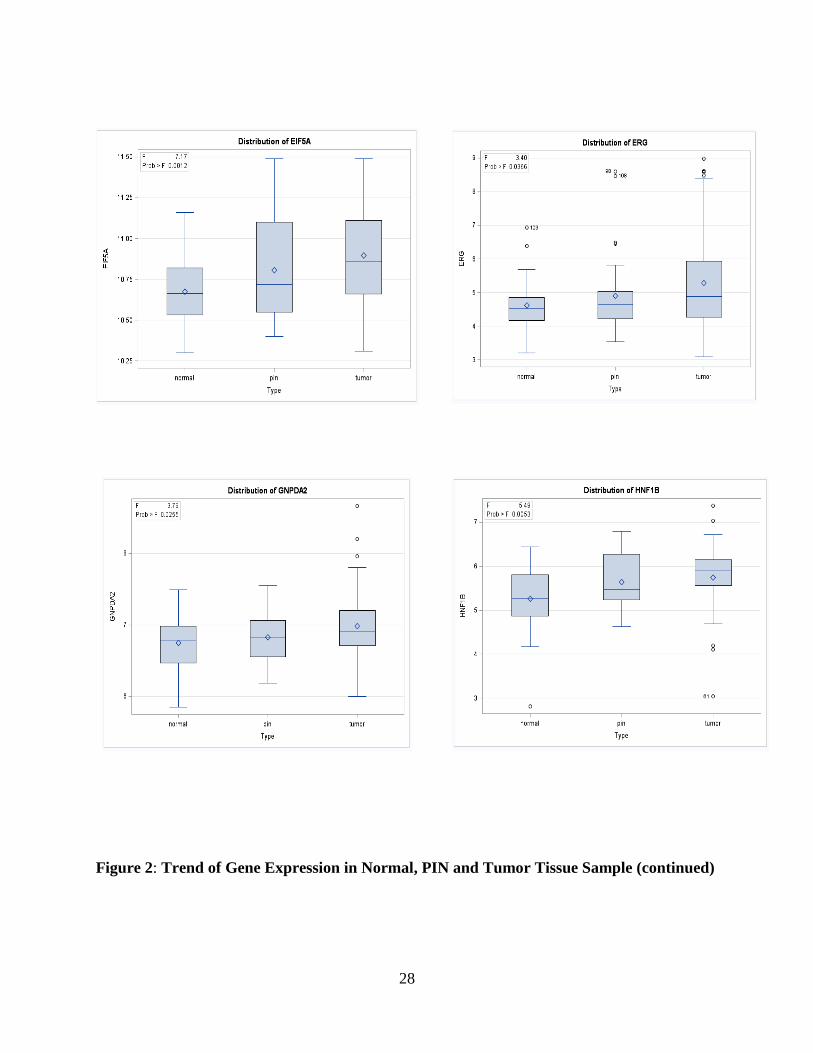
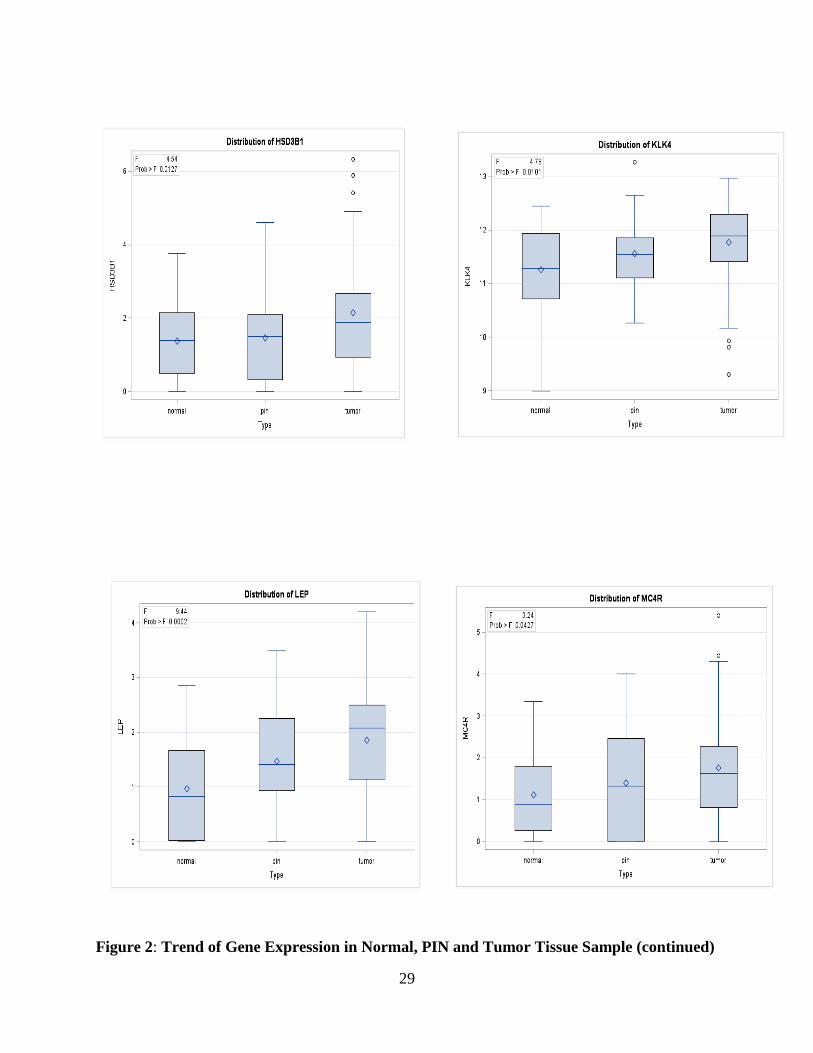
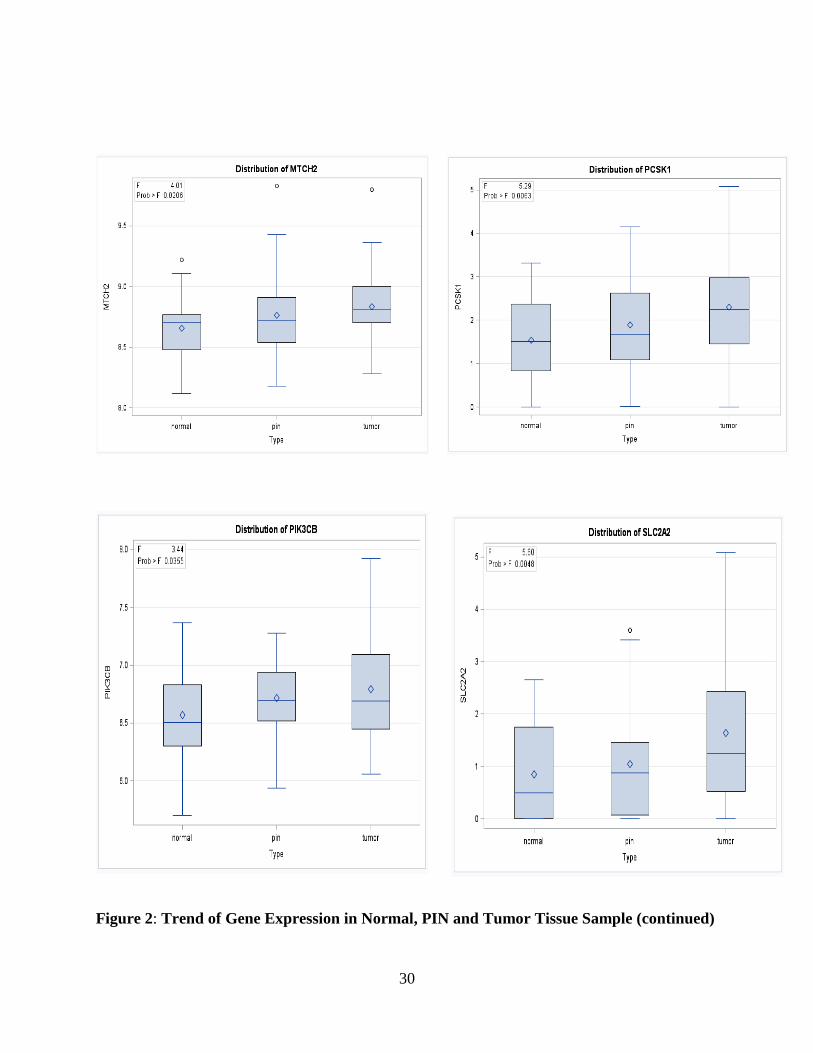
Figure 2 shows the trend analysis of gene expression in normal, prostatic intraepithelial
neoplasia and tumor tissue samples. Twenty genes showed an upward trend in gene expression
including ADIPOR1, AKRIC4, ALOX12, ALOX15, CRYBB2, EIF5A, ERG, GNPDA2, HNF1B,
HSD3B1, KLK4, LEP, MC4R, MTCH2, PCSK1, PIK3CB, SLC2A2, STAT1, SULT1A1, YY1.
Table 8 shows the list of genes that showed an overlap between the result from the trend
test for gene expression among the three tissue samples and the result from the means
comparison of gene expression that were significantly different between obese and non-obese
patients among normal, PIN and tumor tissues.

18
Table 1: Descriptive and Clinical Characteristics for the 48 African American Prostate
Cancer Patients
Normal
Variable Mean Standard
Deviation
Minimum Maximum Range
Age 54.29 7.20 40 72 32
Height 177.17 6.31 161.50 188.00 26.50
Weight 91.66 14.29 62.46 119.67 57.21
PSA 7.50 5.77 1.30 33.10 31.80
Capra
Score
2.38 2.46 0 11 11
BMI 29.08 4.80 19.97 39.42 19.45
Gleason
Score
6.64 0.62 6 9 3
PIN
Variable Mean Standard
Deviation
Minimum Maximum Range
Age 54.03 6.90 40 66 26
Height 177.41 6.13 161.50 188.00 26.50
Weight 90.78 14.81 62.46 118.01 55.55
PSA 7.26 5.72 1.40 33.10 31.70
Capra
Score
2.15 2.17 0 9.0 9.0
BMI 28.90 4.93 19.97 39.42 19.45
Gleason
Score
6.58 0.50 6 7 1
Tumor
Variable Mean Standard
Deviation
Minimum Maximum Range
Age 54.51 6.66 40 70 32
Height 176.81 6.10 161.50 188.00 26.50
Weight 90.75 14.41 62.46 119.67 57.21
PSA 7.13 5.63 1.30 33.10 31.80
Capra
Score
2.04 2.40 0 11.00 11.00
BMI 29.08 4.80 19.97 39.42 19.45
Gleason
Score
6.62 0.61 6 9 3

19
Table 2: Dichotomous Clinical and Demographic Characteristics for the 48 African
American Prostate Cancer Patients
Variable Frequency (%)
Biochemical Recurrence
Yes 10 (20.83)
No 38 (79.17)
Obesity
High BMI 40 (83.33)
Low BMI 8 (16.67)
Aggressive Gleason Score
Yes 29 (60.42)
No 19 (39.58)
Seminal Vesicle Invasion
Yes 2 (4.17)
No 46 (95.83)
Surgical Margins
Yes 12 (25)
No 36 (75)
Lymph Node Invasion
Yes 1 (2.08)
No 47 (97.92
Extracellular Extension
Yes 7 (14.58)
No 41 (85.42)

20
Table 3: Comparing the means for gene expression among Tumor Tissue, Prostatic
Intraepithelial Neoplasia (PIN) and Normal Tissue.
Gene Normal
Mean ± SD
PIN
Mean ± SD
Tumor
Mean ± SD
Pr > F
ADIPOR1 8.67 ± 0.33 8.84±0.31 8.85±0.35 0.00238
AKRIC4 0.96 ± 0.84 1.18±1.01 1.78±1.34 0.0021
ALOX12 1.91±1.12 2.27±1.06 2.51±1.16 0.0475
ALOX15 2.01±0.85 2.84±0.95 3.24±1.15 <.0001
ANGPT1 7.95±0.60 7.59±0.61 7.36±0.78 0.0004
CRYBB2 2.56±0.91 2.75±0.87 3.11±1.09 0.0282
EIF5A 10.67±0.20 10.81±0.31 10.90±0.30 0.0012
ERG 4.62±0.69 4.90±1.20 5.29±1.53 0.0366
FADS1 7.08±0.71 7.01±0.75 6.69±0.83 0.0488
GNPDA2 6.75±0.34 6.82±0.32 6.98±0.50 0.0255
HNF1B 5.27±0.66 5.64±0.59 5.74±0.78 0.0053
HSD3B1 10.70±0.56 1.46±1.21 2.15±1.57 0.0127
HSPB8 10.70±0.56 5.64±0.59 10.24±0.89 0.0115
IL6 7.46±1.73 6.99±1.60 6.57±1.56 0.0441
INSR 8.97±0.26 9.12±0.27 9.03±0.24 0.0464
KLK4 11.26±0.80 11.55±0.65 11.77±0.83 0.0101
LEP 0.96±0.80 1.48±0.93 1.86±1.09 0.0002
MC4R 5.05±1.48 1.39±1.24 1.75±1.29 0.0427
MTCH2 8.66±0.24 8.76±0.34 8.83±0.30 0.0206
PCSK1 1.53±0.97 1.89±0.99 2.30±1.29 0.0063
PIK3CB 6.57±0.39 6.72±0.32 6.79±0.47 0.0355
PSCA 7.19±1.73 7.69±2.34 6.54±1.69 0.0305
SLC2A2 0.85±0.93 1.04±1.04 1.64±1.40 0.0048
SRD5A2 8.27±0.51 7.99±0.61 7.92±0.71 0.0248
STAT1 9.57±0.33 9.77±0.41 9.85±0.47 0.0066
SULT1A1 6.55±0.62 6.70±0.61 6.95±0.70 0.0168
TFF1 4.48±1.04 4.92±1.35 4.15±1.01 0.0127
TIMP3 11.41±0.48 10.97±0.48 10.83±0.55 <.0001
YY1 8.72±0.22 8.85±0.28 8.86±0.23 0.0108

21
Table 4: Comparing the Means for Gene Expression among the Tissue types stratified by
Obesity (Obese and Non-obese)
Gene Normal
PIN Tumor
Obese by Non-obese Obese by Non-obese Obese by Non-obese
Pr > F Pr > F Pr > F
ADIPOR1 0.7443 0.2154 0.5617
AKRIC4 0.4752 0.2755 0.7141
ALOX12 0.1407 0.3353 0.9110
ALOX15 0.5497 0.6929 0.3508
ANGPT1 0.6079 0.8102 0.3083
CRYBB2 0.4120 0.9135 0.2009
EIF5A 0.1239 0.6994 0.0329*
ERG 0.4665 0.7902 0.6115
FADS1 0.8594 0.4347 0.7493
GNPDA2 0.9875 0.3207 0.1825
HNF1B 0.7697 0.8566 0.07710
HSD3B1 0.9710 0.5307 0.9136
HSPB8 0.7937 0.7953 0.6937
IL6 0.5406 0.5112 0.0242*
INSR 0.4926 0.5637 0.8049
KLK4 0.9703 0.9860 0.0527
LEP 0.7613 0.5702 0.3050
MC4R 0.5935 0.0362* 0.9865
MTCH2 0.2883 0.9962 0.0479*
PCSK1 0.7244 0.5192 0.8320
PIK3CB 0.4733 0.1993 0.3659
PSCA 0.5922 0.3288 0.4886
SLC2A2 0.9801 0.7198 0.6501
SRD5A2 0.5081 0.6497 0.8810
STAT1 0.3280 0.4771 0.0894
SULT1A1 0.0894 0.8403 0.0227*
TFF1 0.8745 0.2061 0.1437
TIMP3 0.8546 0.3463 0.0057*
YY1 0.3644 0.4651 0.6183
22
Table 5: Testing the association between obesity and the recurrence of prostate cancer
after initial surgery with the use of a multiple logistic regression
Analysis of Maximum Likelihood Estimates
Parameter DF Estimates Standard
Error
Wald
Chi-Square
Pr>ChiSq
Intercept 1 -1.9459 1.0690 3.3132 0.0687
BMI-Group 1 0.7091 1.1341 0.3910 0.5318
Odds Ratio Estimates
Effect Point Estimate 95% Wald
Confidence Limits
BMI-Group 2.032 0.220 18.765
23
Table 6: Simple Logistic Regression Testing the association between gene expression and
biochemical recurrence of prostate cancer
Gene Pr > ChiSq OR 95% Confidence Interval
ADIPOR1 0.0253 0.233 0.065 0.835
AKT1 <0.0001 12.633 3.669 43.498
ALOX12 0.0055 1.754 1.180 2.609
ALOXI5B 0.0227 1.504 1.059 2.137
APOLD1 <.0001 11.561 4.290 31.157
AR 0.0053 0.214 0.073 0.632
BMP2 0.0053 2.372 1.293 4.351
EIF2A 0.0001 0.138 0.049 0.383
EIF5A 0.0153 0.122 0.022 0.667
FADS1 <.0001 4.354 2.126 8.919
FOXO3 0.0188 5.806 1.339 25.178
GPER1 0.0046 2.438 1.316 4.518
HSPB8 0.0016 3.072 1.529 6.175
INS 0.0175 1.617 1.088 2.404
INSR 0.0109 9.271 1.670 51.460
ITGBS 0.0071 0.134 0.031 0.579
LEP 0.0434 1.532 1.013 2.317
LEGALS8 <.0001 0.032 0.007 0.152
MAPK1 <.0001 0.029 0.006 0.136
NFKB1 0.0010 0.214 0.086 0.534
NPC1 0.0372 0.145 0.024 0.892
NPYIR 0.0272 1.922 1.076 3.434
OR2LI3 0.0007 2.189 1.389 3.451
PAH 0.0008 1.809 1.278 2.559
RAB6A 0.0170 0.093 0.013 0.654
RHOA 0.0059 6.710 1.730 26.027
SHBG 0.0387 1.612 1.025 2.534
SIRT1 0.0034 0.101 0.022 0.467
SLC39A2 0.0244 1.380 1.043 1.827
STAT1 0.0183 0.258 0.084 0.795
STAT3 0.0002 15.674 3.758 65.365
TFF1 0.0141 1.605 1.100 2.342
TGFB1 0.0238 2.988 1.157 7.718
TP53 <.0001 0.077 0.023 0.252
YY1 0.0011 0.043 0.007 0.287

24
Table 7: Multiple Logistic Regression Testing the association between gene expression and
biochemical recurrence of prostate cancer
Gene Pr > ChiSq OR 95% Confidence Interval
ADIPOR1 0.0094 0.134 0.030 0.611
ADIPOR2 0.0450 0.294 0.089 0.973
AKT1 <.0001 30.802 6.500 145.963
ALOX12 0.0089 1.815 1.161 2.838
APOLD1 <.0001 12.807 4.597 35.685
AR 0.0136 0.260 0.089 0.758
BMP2 0.0035 2.908 1.422 5.947
CXCR4 0.0320 1.814 1.053 3.126
CYLD 0.0082 1.081 1.001 1.168
EIF2A 0.0001 0.132 0.046 0.375
EIF5A 0.0100 0.061 0.007 0.513
ESR2 0.0456 1.742 1.011 3.000
FADS1 0.0001 6.206 2.466 15.615
FOXO3 0.0167 7.479 1.439 38.881
GPER1 0.0047 2.918 1.388 6.132
HSPB8 0.0009 3.857 1.739 8.553
IGFBP3 0.0088 2.207 1.221 3.988
INS 0.0215 1.725 1.084 2.747
INSR 0.0119 14.381 1.800 114.915
ITGB5 0.0046 0.121 0.028 0.522
LGALS8 <.0001 0.036 0.008 0.172
MAPK1 <.0001 0.009 0.001 0.068
MMP9 0.0275 0.667 0.465 0.956
NFKB1 0.0009 0.185 0.068 0.504
NPC1 0.0116 0.062 0.007 0.538
NPYIR 0.0024 3.127 1.496 6.534
OR2LI3 0.0007 2.339 1.427 3.832
PAH 0.0007 1.858 1.300 2.654
PIK3C3 0.0303 5.950 1.185 29.864
PIK3CB 0.0256 0.264 0.082 0.850
PIK3RI 0.0469 3.340 1.017 10.973
PLA2G2A 0.0388 0.705 0.506 0.982
RAB6A 0.0320 0.116 0.016 0.830
RHOA 0.0015 17.569 2.995 103.049
SIRT1 0.0016 0.068 0.013 0.363
SLC39A2 0.0048 1.585 1.151 2.183
STAT1 0.0068 0.161 0.043 0.604
STAT3 <.0001 126.617 14.071 >999.999
TCF7L2 0.0312 9.453 1.225 72.931

25
Table 7: Multiple Logistic Regression Testing the association between gene expression and
biochemical recurrence of prostate cancer (continued)
TFF1 0.0170 1.685 1.098 2.587
TGFB1 0.0126 4.007 1.347 11.914
TP53 <.0001 0.061 0.017 0.220
YY1 0.0006 0.030 0.004 0.222
Table 8: An overlap of Genes
Table 9: P-value for a Kaplan Meier Curve depicting the role of obesity in prostate cancer
progression.
Test of Equality over Strata
Test Chi-Square DF Pr > Chi-Square
Log-Rank 1.0230 1 0.3118
Wilcoxon 0.7888 1 0.3745
-2Log(LR) 1.5797 1 0.2088
Gene
EIF5A
MC4R
MTCH2
SULT1A1

26
Figure 1: Kaplan Meier Curve depicting the role of obesity in prostate cancer progression.

27
Figure 2: Trend of Gene Expression in Normal, PIN and Tumor Tissue Sample
28
Figure 2: Trend of Gene Expression in Normal, PIN and Tumor Tissue Sample (continued)
29
Figure 2: Trend of Gene Expression in Normal, PIN and Tumor Tissue Sample (continued)
30
Figure 2: Trend of Gene Expression in Normal, PIN and Tumor Tissue Sample (continued)

31
Figure 2: Trend of Gene Expression in Normal, PIN and Tumor Tissue Sample (continued)

32
DISCUSSION
Our study examined the association between obesity and biochemical recurrence of
prostate cancer as well as the association between the RNA expression of obesity-related genes
and biochemical recurrence of prostate cancer among African American men. The analysis
between obesity and biochemical recurrence (Table 5) showed no association between obesity
and biochemical recurrence of prostate cancer in obese African American men (AAM) compared
to non-obese African American men. Reasons for this lack of association could be due to low
statistical power and small sample size in our study. The Kaplan Meier Curve (Figure 1) depicts
the survival time and time to event (biochemical recurrence) among obese and non-obese
African American prostate cancer patients. The probability of survival (not having BCR) is lower
in obese African American men compared to non-obese African American men. In other words,
the probability of having biochemical recurrence is higher in obese African American men
compared to non-obese African American men.
In terms of the association between gene expression and biochemical recurrence of
prostate cancer, we found forty-three obesity-related genes that were associated with biochemical
recurrence after adjusting for potential confounders (Table 7). The confounders adjusted for in
the multivariate models varied for each individual gene. The typical adjusted confounders were
age at diagnosis, height, prostate specific antigen (PSA), Gleason score, surgical margins,
CAPRAS score and extracapsular extension. The results (Table 7) suggests the importance of
these genes in the progression of prostate cancer. Our findings is consistent with the study by
(Wallace et al., 2008) which found that genes CXCR4 and MMP9 were highly expressed

33
metastasis-associated genes in African American men. Taichman et al., (2002) showed the
mechanism of prostate cancer invasion of bones through the SDF-1/CXCR4 pathway. Literature
supports the role of BMP2 in prostate cancer metastasis (Jin, Dayyani, & Gallick, 2011, Powell
et al., 2013). TP53 was responsible for prostate cancer recurrence in a study by (Ecke et al.,
2010), which is similar to our result.
The analysis comparing the means of gene expression among normal, prostate
intraepithelial neoplasia (PIN) and tumor tissues generated twenty-nine obesity-related genes that
were differentially expressed out of the ninety-nine obesity-related genes (Table 3). We further
stratified each tissue sample by obesity status. Out of the twenty-nine obesity-related genes,
EIF5A, IL6, MC4R, MTCH2, SULT1A1 and TIMP3 were expressed differently among normal,
PIN and tumor tissue samples (Table 4). IL6 which is called interleukin-6 causes inflammation
and prostate cancer metastasis as discussed by (Nguyen, Li, & Tewari, 2014).
A trend test comparing the means of gene expression among the three tissue samples
(Figure 2) generated twenty obesity-related genes that showed a positive (upward) trend of the
expression of genes and progression of the disease from normal tissue to prostate intraepithelial
neoplasia to tumor tissue. This shows a potential biological plausibility of the expression of the
genes in relation to the progression of the prostate cancer. Flajollet et al., (2011) showed how
ERG increases the expression of Osteopontin, a protein that is highly implicated in prostate
cancer metastasis. Our finding showed an expression of ERG in a manner that explains prostate
cancer progression.
We determined the presence of an overlap between EIF5A, IL6, MC4R, MTCH2,
SULT1A1, TIMP3 and the twenty obesity-related genes that showed a trend in gene expression.
We found that four genes: EIF5A, MC4R, MTCH2, SULT1A1 showed an overlap (Table 8).
34
EIF5A has been isolated as a cancer biomarker because of its overexpression and cancer
proliferation function (Acta, 2016). Studies have shown the association between SULT1A1 and
prostate cancer risk (Arslan, Silig, & Pinarbasi, 2011, Nowell et al., 2004).
Limitations
Sample size is a major limitation in our study. We had only 48 African American prostate
cancer patients. Hence, we were unable to determine the true association between obesity and
biochemical recurrence of prostate cancer due to a low statistical power. Larger sample size in
future analysis is required in order to give a better estimate of this association. Additionally, we
had nine obese patients with biochemical recurrence and only one non-obese patient with
biochemical failure rate in our study. This suggests evidence of biased results since the size of
the high risk subgroup (biochemical recurrence) is much larger for the exposed group (obese)
than for the unexposed group (non-obese). Sample size is also the main reason why we had a cut
point of 25 for BMI although overweight and obese individuals are likely to experience prostate
cancer remission after treatment (American Cancer Society, 2018)
In determining the presence of within subject correlation in our sample, we analyzed the
43 obesity-related genes that were significant in the multiple logistic model testing the
association between gene expression and biochemical recurrence. A spearman rho correlation
test was conducted on the 43 obesity-related genes with BMI as a continuous variable. Only gene
TCF7L2 showed a moderate negative correlation with BMI (-0.336, p-value = 0.0196). Hence, a
linear relationship exists between gene TCF7L2 and BMI.

35
CONCLUSION
In summary, we found no association between obesity and biochemical recurrence among
obese African American men compared to non-obese African American men. We also elucidated
obesity-related genes, which may play a role in biochemical recurrence of prostate cancer.
Further analysis is vital to determine the functional significance of the selected genes in prostate
carcinogenesis.
Although we found no association between obesity and biochemical recurrence in our
study, a study investigating the effect of obesity on biochemical control showed that obese
patients were more likely to have a more pronounced biochemical failure rates (Freedland et al.,
2004). This simply suggests that more research on this subject is needed to determine the true
impact of obesity on biochemical recurrence. Obesity is a chronic disease and it is a risk factor
for other chronic diseases including heart disease and cancer. Hence, it was imperative to
understand the role of obesity in prostate cancer risk in order to inform adequate control of
prostate cancer. According to the American Cancer Society, (2016), physical activity reduces
cancer recurrence and mortality in general. Obesity can impact the gene expression profiles in
African American prostate cancer patients and influences their prostate cancer biochemical
recurrence as shown in our study. Gene expression predicts the behavioral outcome of prostate
cancer in patients (Singh et al., 2002) . Studies have shown that gene expression explains the
progression and aggressiveness of prostate cancer (Chandran et al., 2007, Mortensen et al., 2015,
Yu et al., 2004) . With the use of the selected genes from our study, genotyping and other
molecular research methods can further explain the functional role of these obesity-related genes

36
in prostate cancer proliferation. Our research findings can be used to develop hypothesis for
individualized prostate cancer risk estimation in African American men. Our research findings
can also be used in the future to select the most appropriate treatment modalities and to estimate
the risk of prostate cancer progression.

37
REFERENCES
Acta, B. B. (2016). HHS Public Access, 1849(7), 836–844.
https://doi.org/10.1016/j.bbagrm.2015.05.002.The
American Cancer Society. (2016). Cancer Facts & Figures for African Americans 2016-2018,
12–14. Retrieved from https://www.cancer.org/content/dam/cancer-org/research/cancer-
facts-and-statistics/cancer-facts-and-figures-for-african-americans/cancer-facts-and-figures-
for-african-americans-2016-
2018.pdf%5Cnhttp://www.cancer.org/acs/groups/content/@editorial/documents
American Cancer Society. (2017). Prostate Cancer Risk Factors. Retrieved December 7, 2017,
from https://www.cancer.org/cancer/prostate-cancer/causes-risks-prevention/risk-
factors.html
American Cancer Society. (2018). What does the American Cancer Society recommend about
body weight? Retrieved January 18, 2018, from https://www.cancer.org/cancer/cancer-
causes/diet-physical-activity/body-weight-and-cancer-risk/acs-recommendations.html
Arslan, S., Silig, Y., & Pinarbasi, H. (2011). Sulfotransferase 1A1 Arg213His polymorphism and
prostate cancer risk. Experimental and Therapeutic Medicine, 2(6), 1159–1162.
https://doi.org/10.3892/etm.2011.334
Arun, B., Sanjeev K, S., Mohammad Aslam, K., Prajapati1, V. K., Seema, S., James E., C., &
Ajay P., S. (2017). HHS Public Access, 10(4), 4173–4183.
https://doi.org/10.1021/acsnano.5b07425.Molecular
Becker, G., & Newsom, E. (2003). Socioeconomic Status and Dissatisfaction with Health Care
among Chronically Ill African Americans. American Journal of Public Health, 93(5), 742–
748. https://doi.org/10.2105/AJPH.93.5.742
Bureau, U. C. (2017). Wealth, Asset Ownership, & Debt of Households Detailed Tables:
2013. Retrieved from https://www.census.gov/data/tables/2013/demo/wealth/wealth-asset-
ownership.html
Buschemeyer, W. C., & Freedland, S. J. (2007). Obesity and prostate cancer: epidemiology and
clinical implications. European Urology, 52(2), 331–343.
https://doi.org/10.1016/j.eururo.2007.04.069
Byers, T. E., Wolf, H. J., Bauer, K. R., Bolick-Aldrich, S., Chen, V. W., Finch, J. L., … Yin, X.
(2008). The impact of socioeconomic status on survival after cancer in the United States:
Findings from the National Program of Cancer Registries patterns of care study. Cancer,
113(3), 582–591. https://doi.org/10.1002/cncr.23567

38
Cancer Information and Support Network. (2017). CISN - Oncogenes, Tumor-Suppressor Genes
and DNA Repair Genes. Retrieved December 7, 2017, from
http://cisncancer.org/research/what_we_know/advances/oncogenes.html
Castro, P., Creighton, C. J., Ozen, M., Berel, D., Mims, M. P., & Ittmann, M. (2009). Genomic
Profiling of Prostate Cancers from African American Men. Neoplasia, 11(3), 305–312.
https://doi.org/10.1593/neo.81530
Chandran, U. R., Ma, C., Dhir, R., Bisceglia, M., Lyons-Weiler, M., Liang, W., … Monzon, F.
A. (2007). Gene expression profiles of prostate cancer reveal involvement of multiple
molecular pathways in the metastatic process. BMC Cancer, 7, 1–21.
https://doi.org/10.1186/1471-2407-7-64
Chornokur, G., Amankwah, E. K., Davis, S. N., Phelan, C. M., Park, J. Y., Pow-Sang, J., &
Kumar, N. B. (2013). Variation in HNF1B and Obesity May Influence Prostate Cancer Risk
in African American Men: A Pilot Study. Prostate Cancer, 2013, 384594.
https://doi.org/10.1155/2013/384594
Donkena, K. V, & Young, C. Y. (2011). Vitamin d, sunlight and prostate cancer risk.
Adv.Prev.Med, 2011, 281863-. https://doi.org/10.4061/2011/281863
Ecke, T. H., Schlechte, H. H., Schiemenz, K., Sachs, M. D., Lenk, S. V., Rudolph, B. D., &
Loening, S. A. (2010). TP53 gene mutations in prostate cancer progression. Anticancer
Research, 30(5), 1579–1586.
Fiscella, K., & Williams, D. R. (2004). Health Disparities Based on SE Inequalities. Academic
Medicine.
Flajollet, S., Tian, T. V., Flourens, A., Tomavo, N., Villers, A., Bonnelye, E., … Duterque-
Coquillaud, M. (2011). Abnormal Expression of the ERG Transcription Factor in Prostate
Cancer Cells Activates Osteopontin. Molecular Cancer Research, 9(7), 914–924.
https://doi.org/10.1158/1541-7786.MCR-10-0537
Freedland, S. J., & Aronson, W. J. (2004). Examining the Relationship Between Obesity and
Prostate Cancer. Reviews in Urology, 6(2), 73–81. Retrieved from
http://www.ncbi.nlm.nih.gov/pmc/articles/PMC1550782/%5Cnhttps://www.ncbi.nlm.nih.go
v/pmc/articles/PMC1550782/pdf/RIU006002_0073.pdf
Freedland, S. J., Aronson, W. J., Kane, C. J., Presti, J. C., Amling, C. L., Elashoff, D., & Terris,
M. K. (2004). Impact of obesity on biochemical control after radical prostatectomy for
clinically localized prostate cancer: A report by the shared equal access regional cancer
hospital database study group. Journal of Clinical Oncology, 22(3), 446–453.
https://doi.org/10.1200/JCO.2004.04.181
Gann, P. H., Hennekens, C. H., Ma, J., Longcope, C., & Stampfer, M. J. (1996). Prospective
Study of Sex Hormone Levels and Risk of Prostate Cancer. JNCI Journal of the National
Cancer Institute, 88(16), 1118–1126. https://doi.org/10.1093/jnci/88.16.1118
GeneCards. (2017). GeneCards - Human Genes | Gene Database | Gene Search. Retrieved
November 29, 2017, from http://www.genecards.org/
39
Grisanzio, C., Werner, L., Takeda, D., Awoyemi, B. C., Pomerantz, M. M., Yamada, H., …
Freedman, M. L. (2012). Genetic and functional analyses implicate the NUDT11, HNF1B,
and SLC22A3 genes in prostate cancer pathogenesis. Proceedings of the National Academy
of Sciences, 109(28), 11252–11257. https://doi.org/10.1073/pnas.1200853109
Jianjun, Z., Dhakal, I. B., Greene, G., Lang, N. P., & Kadlubar, F. F. (2011). Polymorphisms in
hOGG1 and XRCC1 and Risk of Prostate Cancer: Effects Modified by Plasma
Antioxidants. Urology, 75(4), 779–785.
https://doi.org/10.1016/j.urology.2009.08.063.Polymorphisms
Jin, J. K., Dayyani, F., & Gallick, G. E. (2011). Steps in prostate cancer progression that lead to
bone metastasis. International Journal of Cancer, 128(11), 2545–2561.
https://doi.org/10.1002/ijc.26024
Kelesidis, I., Kelesidis, T., & Mantzoros, C. S. (2006). Adiponectin and cancer: a systematic
review. British Journal of Cancer, 94(9), 1221–1225.
https://doi.org/10.1038/sj.bjc.6603051
Lipson, E. J., Vincent, J. G., Loyo, M., Kagohara, L. T., Brandon, S., Wang, H., … Taube, J. M.
(2014). NIH Public Access, 73(1), 1–20. https://doi.org/10.1158/2326-6066.CIR-13-
0034.PD-L1
Michaud, J. E., Billups, K. L., & Partin, A. W. (2015). Testosterone and prostate cancer: An
evidence-based review of pathogenesis and oncologic risk. Therapeutic Advances in
Urology, 7(6), 378–387. https://doi.org/10.1177/1756287215597633
Mortensen, M. M., Høyer, S., Lynnerup, A. S., Ørntoft, T. F., Sørensen, K. D., Borre, M., &
Dyrskjøt, L. (2015). Expression profiling of prostate cancer tissue delineates genes
associated with recurrence after prostatectomy. Scientific Reports, 5(June), 1–11.
https://doi.org/10.1038/srep16018
Mullaney, J. M., Mills, R. E., Stephen Pittard, W., & Devine, S. E. (2010). Small insertions and
deletions (INDELs) in human genomes. Human Molecular Genetics, 19(R2), 131–136.
https://doi.org/10.1093/hmg/ddq400
Nambiar, M., & Raghavan, S. C. (2011). How does DNA break during chromosomal
translocations? Nucleic Acids Research, 39(14), 5813–5825.
https://doi.org/10.1093/nar/gkr223
Nanostring Technologies. (2017). Gene Expression Panels. Retrieved November 29, 2017, from
https://www.nanostring.com/products/gene-expression-panels
National Cancer Institute. (2017a). Cancer Genome Anatomy Project. Retrieved November 29,
2017, from https://cgap.nci.nih.gov/Pathways/BioCarta_Pathways
National Cancer Institute. (2017b). Cancer of the Prostate - Cancer Stat Facts. Retrieved
December 7, 2017, from https://seer.cancer.gov/statfacts/html/prost.html
National Cancer Institute. (2017c). Genetics of Prostate Cancer. Retrieved December 1, 2017,
from http://www.ncbi.nlm.nih.gov/pubmed/26389227

40
National Cancer Institute. (2018). Definition of gene expression - NCI Dictionary of Cancer
Terms. Retrieved January 7, 2018, from
https://www.cancer.gov/publications/dictionaries/cancer-terms?CdrID=537335
National Center for Biotechnology Information. (2017). Genes - NCBI. Retrieved November 29,
2017, from https://www.ncbi.nlm.nih.gov/home/genes/
National Institute of Health. (2017). What are single nucleotide polymorphisms (SNPs)? -
Genetics Home Reference. Retrieved December 7, 2017, from
https://ghr.nlm.nih.gov/primer/genomicresearch/snp
Nghiem, B., Zhang, X., Lam, H.-M., True, L. D., Coleman, I., Higano, C. S., … Morrissey, C.
(2016). Mismatch repair enzyme expression in primary and castrate resistant prostate
cancer. Asian Journal of Urology, 3(4), 223–228. https://doi.org/10.1016/j.ajur.2016.09.002
Nguyen, D. P., Li, J., & Tewari, A. K. (2014). Inflammation and prostate cancer: The role of
interleukin 6 (IL-6). BJU International, 113(6), 986–992. https://doi.org/10.1111/bju.12452
Nowell, S., Ratnasinghe, D. L., Ambrosone, C. B., Williams, S., Teague-ross, T., Trimble, L., …
Lang, N. P. (2004). Association of SULT1A1 Phenotype and Genotype with Prostate
Cancer Risk in African-Americans and Caucasians Association of SULT1A1 Phenotype
and Genotype with Prostate Cancer Risk in African-Americans and Caucasians,
13(February), 270–276. https://doi.org/10.1158/1055-9965.EPI-03-0047
Obeid, S., & Hebbard, L. (2012). Role of adiponectin and its receptors in cancer. Cancer Biology
& Medicine, 9(4), 213–20. https://doi.org/10.7497/j.issn.2095-3941.2012.04.001
Ornish, D., Magbanua, M. J. M., Weidner, G., Weinberg, V., Kemp, C., Green, C., … Carroll, P.
R. (2008). Changes in prostate gene expression in men undergoing an intensive nutrition
and lifestyle intervention. Proceedings of the National Academy of Sciences, 105(24),
8369–8374. https://doi.org/10.1073/pnas.0803080105
Pampel, F. C., Krueger, P., & Denney, J. (2010). Socioeconomic disparities in health behaviors.
Annual Review of Sociology, 36, 349–370.
https://doi.org/10.1146/annurev.soc.012809.102529.Socioeconomic
Park, J., Chen, L., Ratnashinge, L., Sellers, T. A., Tanner, J. P., Lee, J. H., … Pow-Sang, J.
(2006). Deletion polymorphism of UDP-glucuronosyltransferase 2B17 and risk of prostate
cancer in African American and Caucasian men. Cancer Epidemiology Biomarkers and
Prevention, 15(8), 1473–1478. https://doi.org/10.1158/1055-9965.EPI-06-0141
Powell, I. J., Dyson, G., Land, S., Ruterbusch, J., Bock, C. H., Lenk, S., … Bollig-Fischer, A.
(2013). Genes Associated with Prostate Cancer Are Differentially Expressed in African
American and European American Men, 5(22), 891–897. https://doi.org/10.1158/1055-
9965.EPI-12-1238
Pritchard, C. C., Mateo, J., Walsh, M. F., De Sarkar, N., Abida, W., Beltran, H., … Nelson, P. S.
(2016). Inherited DNA-Repair Gene Mutations in Men with Metastatic Prostate Cancer.
New England Journal of Medicine, 375(5), 443–453.
https://doi.org/10.1056/NEJMoa1603144

41
Punnen, S., Freedland, S. J., Presti, J. C., Aronson, W. J., Terris, M. K., Kane, C. J., …
Cooperberg, M. R. (2014). Multi-institutional validation of the CAPRA-S score to predict
disease recurrence and mortality after radical prostatectomy. European Urology, 65(6),
1171–1177. https://doi.org/10.1016/j.eururo.2013.03.058
Ribeiro, R., Monteiro, C., Catalan, V., Hu, P., Cunha, V., Rodriguez, A., … Fruhbeck, G. (2012).
Obesity and prostate cancer: gene expression signature of human periprostatic adipose
tissue. BMC.Med., 10(1741–7015 (Electronic)), 108. https://doi.org/10.1186/1741-7015-10-
108
Rider, J. R., Fiorentino, M., Kelly, R., Gerke, T., Jordahl, K., Sinnott, J. A., … Finn, S. (2015).
Tumor expression of adiponectin receptor 2 and lethal prostate cancer. Carcinogenesis,
36(6), 639–647. https://doi.org/10.1093/carcin/bgv048
RJ, M., & English, D. (2006). Body size and composition and prostate cancer risk: systematic
review and meta-regression analysis. Cancer Causes & Control, 17(December), 989–1003.
https://doi.org/10.1007/s10552-006-0049-z
Ross-Adams, H., Ball, S., Lawrenson, K., Halim, S., Russell, R., Wells, C., … Mills, I. G.
(2015). <i>HNF1B</i> variants associate with promoter methylation and
regulate gene networks activated in prostate and ovarian cancer. Oncotarget, 7(46).
https://doi.org/10.18632/oncotarget.12543
Singh, D., Febbo, P. G., Ross, K., Jackson, D. G., Manola, J., Ladd, C., … Sellers, W. R. (2002).
Gene expression correlates of clinical prostate cancer behavior. Cancer Cell, 1(2), 203–209.
https://doi.org/10.1016/S1535-6108(02)00030-2
Stark, J. R., Perner, S., Stampfer, M. J., Sinnott, J. A., Finn, S., Eisenstein, A. S., … Mucci, L. A.
(2009). Gleason score and lethal prostate cancer: Does 3 + 4 = 4 + 3? Journal of Clinical
Oncology, 27(21), 3459–3464. https://doi.org/10.1200/JCO.2008.20.4669
Taichman, R. S., Cooper, C., Keller, E. T., Pienta, K. J., Taichman, N. S., & Mccauley, L. K.
(2002). Use of the Stromal Cell-derived Factor-1 / CXCR4 Pathway in Prostate Cancer
Metastasis to Bone Use of the Stromal Cell-derived Factor-1 / CXCR4 Pathway in Prostate
Cancer Metastasis to Bone 1, 1832–1837.
Taksler, G. B., Keating, N. L., & Cutler, D. M. (2012). Explaining racial differences in prostate
cancer mortality. Cancer, 118(17), 4280–4289. https://doi.org/10.1002/cncr.27379
Timofeeva, O. A., Zhang, X., Ressom, H. W., Varghese, R. S., Kallakury, B. V. S., Wang, K., …
Dritschilo, A. (2009). Enhanced expression of SOS1 is detected in prostate cancer epithelial
cells from African-American men. International Journal of Oncology, 35(4), 751–760.
https://doi.org/10.3892/ijo-00000388
Wallace, T. A., Prueitt, R. L., Yi, M., Howe, T. M., Gillespie, J. W., Yfantis, H. G., … Ambs, S.
(2008). Tumor immunobiological differences in prostate cancer between African-American
and European-American men. Cancer Research, 68(3), 927–936.
https://doi.org/10.1158/0008-5472.CAN-07-2608
42
Yu, Y. P., Landsittel, D., Jing, L., Nelson, J., Ren, B., Liu, L., … Luo, J. H. (2004). Gene
expression alterations in prostate cancer predicting tumor aggression and preceding
development of malignancy. Journal of Clinical Oncology, 22(14), 2790–2799.
https://doi.org/10.1200/JCO.2004.05.158
Zeigler-Johnson, C., Friebel, T., Walker, A. H., Wang, Y., Spangler, E., Panossian, S., …
Rebbeck, T. R. (2004). CYP3A4, CYP3A5, and CYP3A43 genotypes and haplotypes in the
etiology and severity of prostate cancer. Cancer Research, 64(22), 8461–7.
https://doi.org/10.1158/0008-5472.CAN-04-1651
Zeigler-Johnson, C. M., Spangler, E., Jalloh, M., Gueye, S. M., Rennert, H., & Rebbeck, T. R.
(2008). Genetic susceptibility to prostate cancer in men of African descent: implications for
global disparities in incidence and outcomes. The Canadian Journal of Urology, 15(1),
3872–3882. https://doi.org/10.1016/j.bbi.2008.05.010

43
APPENDICES
44
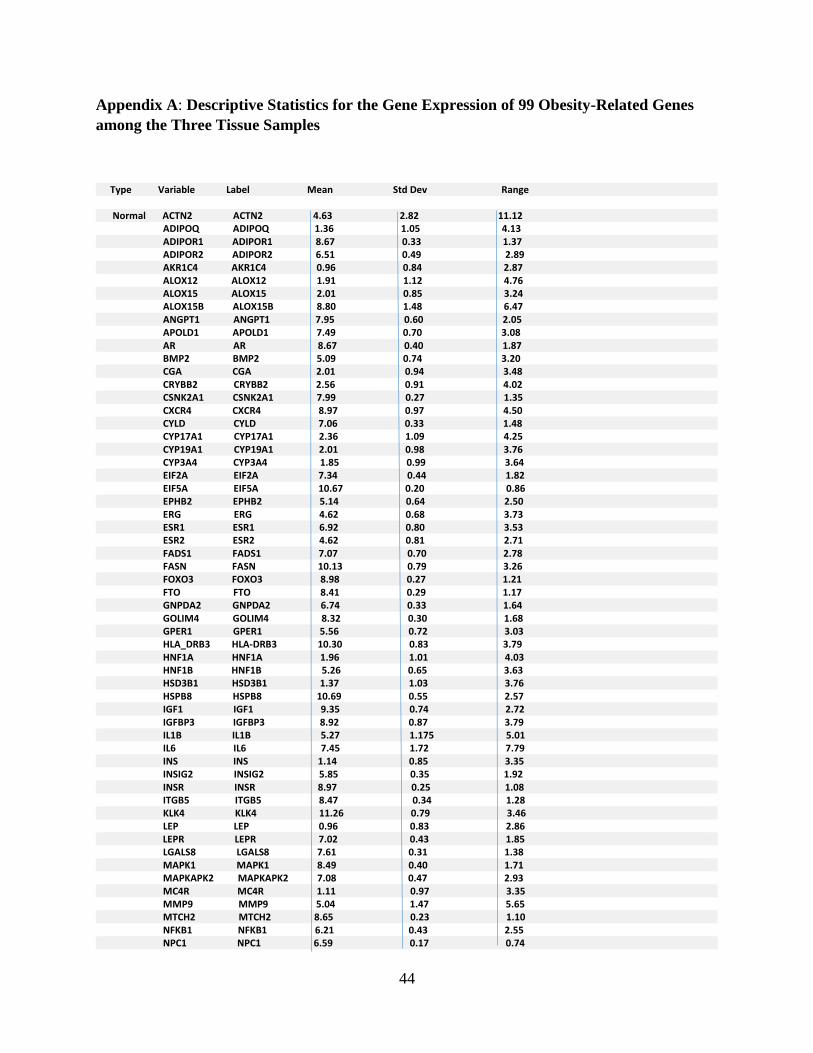
Appendix A: Descriptive Statistics for the Gene Expression of 99 Obesity-Related Genes
among the Three Tissue Samples
Type Variable Label Mean Std Dev Range Normal ACTN2 ACTN2 4.63 2.82 11.12 ADIPOQ ADIPOQ 1.36 1.05 4.13 ADIPOR1 ADIPOR1 8.67 0.33 1.37 ADIPOR2 ADIPOR2 6.51 0.49 2.89 AKR1C4 AKR1C4 0.96 0.84 2.87 ALOX12 ALOX12 1.91 1.12 4.76 ALOX15 ALOX15 2.01 0.85 3.24 ALOX15B ALOX15B 8.80 1.48 6.47 ANGPT1 ANGPT1 7.95 0.60 2.05 APOLD1 APOLD1 7.49 0.70 3.08 AR AR 8.67 0.40 1.87 BMP2 BMP2 5.09 0.74 3.20 CGA CGA 2.01 0.94 3.48 CRYBB2 CRYBB2 2.56 0.91 4.02 CSNK2A1 CSNK2A1 7.99 0.27 1.35 CXCR4 CXCR4 8.97 0.97 4.50 CYLD CYLD 7.06 0.33 1.48 CYP17A1 CYP17A1 2.36 1.09 4.25 CYP19A1 CYP19A1 2.01 0.98 3.76 CYP3A4 CYP3A4 1.85 0.99 3.64 EIF2A EIF2A 7.34 0.44 1.82 EIF5A EIF5A 10.67 0.20 0.86 EPHB2 EPHB2 5.14 0.64 2.50 ERG ERG 4.62 0.68 3.73 ESR1 ESR1 6.92 0.80 3.53 ESR2 ESR2 4.62 0.81 2.71 FADS1 FADS1 7.07 0.70 2.78 FASN FASN 10.13 0.79 3.26 FOXO3 FOXO3 8.98 0.27 1.21 FTO FTO 8.41 0.29 1.17 GNPDA2 GNPDA2 6.74 0.33 1.64 GOLIM4 GOLIM4 8.32 0.30 1.68 GPER1 GPER1 5.56 0.72 3.03 HLA_DRB3 HLA-DRB3 10.30 0.83 3.79 HNF1A HNF1A 1.96 1.01 4.03 HNF1B HNF1B 5.26 0.65 3.63 HSD3B1 HSD3B1 1.37 1.03 3.76 HSPB8 HSPB8 10.69 0.55 2.57 IGF1 IGF1 9.35 0.74 2.72 IGFBP3 IGFBP3 8.92 0.87 3.79 IL1B IL1B 5.27 1.175 5.01 IL6 IL6 7.45 1.72 7.79 INS INS 1.14 0.85 3.35 INSIG2 INSIG2 5.85 0.35 1.92 INSR INSR 8.97 0.25 1.08 ITGB5 ITGB5 8.47 0.34 1.28 KLK4 KLK4 11.26 0.79 3.46 LEP LEP 0.96 0.83 2.86 LEPR LEPR 7.02 0.43 1.85 LGALS8 LGALS8 7.61 0.31 1.38 MAPK1 MAPK1 8.49 0.40 1.71 MAPKAPK2 MAPKAPK2 7.08 0.47 2.93 MC4R MC4R 1.11 0.97 3.35 MMP9 MMP9 5.04 1.47 5.65 MTCH2 MTCH2 8.65 0.23 1.10 NFKB1 NFKB1 6.21 0.43 2.55 NPC1 NPC1 6.59 0.17 0.74

45
Appendix A: Descriptive Statistics for the Gene Expression of 99 Obesity-Related Genes
among the Three Tissue Samples (Continued)
NPY1R NPY1R 5.50 0.77 3.89 NPY5R NPY5R 2.50 0.85 3.97 OR2L13 OR2L13 2.18 1.06 4.18 PAH PAH 3.29 1.35 5.97 PCGEM1 PCGEM1 3.72 1.79 7.00 PCSK1 PCSK1 1.53 0.96 3.31 PI3 PI3 3.58 1.28 5.81 PIK3CB PIK3CB 6.56 0.39 1.67 PIK3CA PIK3CA 7.06 0.27 1.34 PIK3R1 PIK3R1 9.02 0.40 1.63 PLA2G2A PLA2G2A 10.28 1.33 6.19 POMC POMC 2.47 1.07 4.42 PRKAA2 PRKAA2 6.84 0.39 1.96 PSCA PSCA 7.19 1.73 6.87 PSPH PSPH 6.79 0.55 3.03 PTEN PTEN 8.95 0.35 1.50 RAB6A RAB6A 9.50 0.19 0.86 RHOA RHOA 9.59 0.37 1.52 SCD SCD 8.86 0.99 3.68 SHBG SHBG 2.97 0.75 2.69 SIRT1 SIRT1 7.08 0.29 1.36 SLC2A2 SLC2A2 0.84 0.92 2.66 SLC2A3 SLC2A3 2.54 0.71 3.41 SLC2A4 SLC2A4 7.01 0.72 2.98 SLC39A1 SLC39A1 8.38 0.27 1.15 SLC39A2 SLC39A2 3.06 1.29 5.44 SRD5A2 SRD5A2 8.26 0.50 2.62 STAT1 STAT1 9.57 0.32 1.28 STAT3 STAT3 10.87 0.29 1.33 SULT1A1 SULT1A1 6.55 0.61 3.19 TCF7L2 TCF7L2 8.59 0.27 1.31 TFF1 TFF1 4.48 1.03 5.16 TGFB1 TGFB1 8.60 0.48 2.20 TIMP3 TIMP3 11.41 0.48 2.08 TNF TNF 3.75 0.93 4.10 TP53 TP53 7.05 0.45 2.25 VDR VDR 3.91 0.67 3.19 YY1 YY1 8.71 0.22 1.01 Type Variable Label Mean Std Dev Range Pin ACTN2 ACTN2 3.57 2.08 8.00 ADIPOQ ADIPOQ 1.51 0.90 3.70 ADIPOR1 ADIPOR1 8.84 0.31 1.30 ADIPOR2 ADIPOR2 6.54 0.34 1.49 AKR1C4 AKR1C4 1.17 1.01 3.42 ALOX12 ALOX12 2.26 1.06 4.32 ALOX15 ALOX15 2.84 0.95 4.13 ALOX15B ALOX15B 8.81 1.25 5.01 ANGPT1 ANGPT1 7.58 0.61 2.40 APOLD1 APOLD1 7.34 0.77 3.07 AR AR 8.67 0.50 2.21 BMP2 BMP2 4.98 0.55 2.83 CGA CGA 2.40 1.14 4.59 CRYBB2 CRYBB2 2.75 0.87 3.24 CSNK2A1 CSNK2A1 8.12 0.29 1.32 CXCR4 CXCR4 8.74 0.80 3.62

46
Appendix A: Descriptive Statistics for the Gene Expression of 99 Obesity-Related Genes
among the Three Tissue Samples (Continued)
CYLD CYLD 7.02 0.43 2.16 CYP17A1 CYP17A1 2.51 1.34 5.22 CYP19A1 CYP19A1 2.19 0.97 4.64 CYP3A4 CYP3A4 2.09 1.27 4.18 EIF2A EIF2A 7.40 0.53 2.26 EIF5A EIF5A 10.80 0.30 1.09 EPHB2 EPHB2 5.12 0.50 2.23 ERG ERG 4.90 1.19 5.06 ESR1 ESR1 7.11 0.57 2.51 ESR2 ESR2 4.59 0.95 4.16 FADS1 FADS1 7.00 0.74 3.18 FASN FASN 10.45 0.80 3.29 FOXO3 FOXO3 8.95 0.30 1.26 FTO FTO 8.42 0.23 0.92 GNPDA2 GNPDA2 6.82 0.32 1.36 GOLIM4 GOLIM4 8.23 0.28 1.39 GPER1 GPER1 5.62 0.74 3.07 HLA_DRB3 HLA-DRB3 10.11 0.69 2.40 HNF1A HNF1A 2.45 1.03 4.15 HNF1B HNF1B 5.63 0.58 2.17 HSD3B1 HSD3B1 1.46 1.21 4.60 HSPB8 HSPB8 10.40 0.59 2.32 IGF1 IGF1 9.10 0.72 3.02 IGFBP3 IGFBP3 8.88 0.80 3.13 IL1B IL1B 5.26 1.36 6.21 IL6 IL6 6.98 1.60 5.86 INS INS 1.34 0.98 3.60 INSIG2 INSIG2 5.89 0.48 2.20 INSR INSR 9.12 0.26 1.19 ITGB5 ITGB5 8.54 0.29 1.28 KLK4 KLK4 11.55 0.65 3.01 LEP LEP 1.47 0.92 3.50 LEPR LEPR 6.99 0.41 1.65 LGALS8 LGALS8 7.64 0.34 1.50 MAPK1 MAPK1 8.52 0.43 1.79 MAPKAPK2 MAPKAPK2 7.04 0.41 1.89 MC4R MC4R 1.38 1.24 4.00 MMP9 MMP9 5.36 1.47 5.59 MTCH2 MTCH2 8.76 0.34 1.65 NFKB1 NFKB1 6.09 0.51 2.04 NPC1 NPC1 6.55 0.21 0.96 NPY1R NPY1R 5.54 0.71 2.96 NPY5R NPY5R 2.77 0.77 3.58 OR2L13 OR2L13 2.45 0.98 3.85 PAH PAH 3.83 1.42 5.99 PCGEM1 PCGEM1 3.94 1.84 6.75 PCSK1 PCSK1 1.89 0.99 4.13 PI3 PI3 3.70 1.32 5.45 PIK3CB PIK3CB 6.71 0.31 1.34 PIK3CA PIK3CA 7.01 0.26 0.91 PIK3R1 PIK3R1 8.88 0.36 1.42 PLA2G2A PLA2G2A 11.05 1.31 5.38 POMC POMC 2.50 0.93 3.95 PRKAA2 PRKAA2 6.93 0.35 1.32 PSCA PSCA 7.68 2.33 9.62 PSPH PSPH 6.84 0.53 2.59 PTEN PTEN 8.95 0.33 1.79 RAB6A RAB6A 9.55 0.26 1.17 RHOA RHOA 9.49 0.32 1.39 SCD SCD 9.13 0.92 3.65 SHBG SHBG 2.79 0.80 2.92

47
Appendix A: Descriptive Statistics for the Gene Expression of 99 Obesity-Related Genes
among the Three Tissue Samples (Continued)
SIRT1 SIRT1 7.09 0.31 1.37 SLC2A2 SLC2A2 1.04 1.03 3.60 SLC2A3 SLC2A3 2.60 0.72 3.24 SLC2A4 SLC2A4 6.86 0.62 2.94 SLC39A1 SLC39A1 8.43 0.24 1.36 SLC39A2 SLC39A2 3.51 1.86 6.44 SRD5A2 SRD5A2 7.99 0.61 2.75 STAT1 STAT1 9.76 0.40 1.50 STAT3 STAT3 10.93 0.34 1.46 SULT1A1 SULT1A1 6.69 0.61 2.76 TCF7L2 TCF7L2 8.67 0.22 1.09 TFF1 TFF1 4.92 1.35 5.23 TGFB1 TGFB1 8.47 0.40 1.61 TIMP3 TIMP3 10.97 0.47 2.01 TNF TNF 3.54 0.88 4.13 TP53 TP53 7.17 0.56 2.38 VDR VDR 3.90 0.71 2.86 YY1 YY1 8.85 0.27 1.18 Type Variable Label Mean Std Dev Range Tumor ACTN2 ACTN2 4.45 2.66 10.65 ADIPOQ ADIPOQ 1.82 1.43 4.83 ADIPOR1 ADIPOR1 8.85 0.35 1.49 ADIPOR2 ADIPOR2 6.54 0.37 2.01 AKR1C4 AKR1C4 1.77 1.34 4.40 ALOX12 ALOX12 2.51 1.15 5.25 ALOX15 ALOX15 3.23 1.14 4.78 ALOX15B ALOX15B 8.92 1.61 7.02 ANGPT1 ANGPT1 7.36 0.77 3.34 APOLD1 APOLD1 7.38 0.66 2.76 AR AR 8.75 0.42 1.92 BMP2 BMP2 4.69 0.95 4.81 CGA CGA 2.41 1.36 5.44 CRYBB2 CRYBB2 3.11 1.09 5.27 CSNK2A1 CSNK2A1 8.12 0.26 1.12 CXCR4 CXCR4 8.99 0.88 4.46 CYLD CYLD 7.06 0.43 2.34 CYP17A1 CYP17A1 3.01 1.42 5.38 CYP19A1 CYP19A1 2.21 1.20 4.88 CYP3A4 CYP3A4 2.30 1.09 4.72 EIF2A EIF2A 7.43 0.52 2.72 EIF5A EIF5A 10.89 0.30 1.18 EPHB2 EPHB2 5.42 0.72 2.98 ERG ERG 5.29 1.53 5.90 ESR1 ESR1 7.03 0.66 3.46 ESR2 ESR2 4.83 0.95 3.61 FADS1 FADS1 6.69 0.83 3.09 FASN FASN 10.57 0.90 4.10 FOXO3 FOXO3 8.92 0.33 1.35 FTO FTO 8.43 0.31 1.47 GNPDA2 GNPDA2 6.98 0.50 2.66 GOLIM4 GOLIM4 8.35 0.32 1.19 GPER1 GPER1 5.47 0.79 2.95 HLA_DRB3 HLA-DRB3 10.48 0.81 3.31
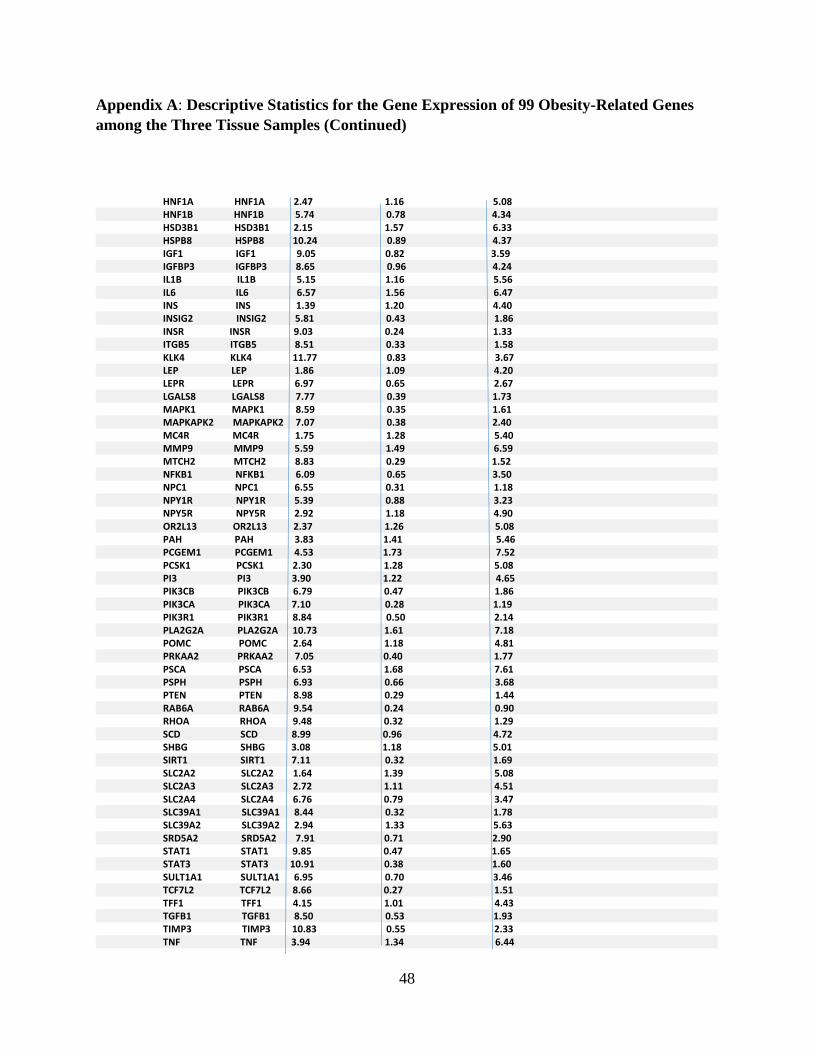
48
Appendix A: Descriptive Statistics for the Gene Expression of 99 Obesity-Related Genes
among the Three Tissue Samples (Continued)
HNF1A HNF1A 2.47 1.16 5.08 HNF1B HNF1B 5.74 0.78 4.34 HSD3B1 HSD3B1 2.15 1.57 6.33 HSPB8 HSPB8 10.24 0.89 4.37 IGF1 IGF1 9.05 0.82 3.59 IGFBP3 IGFBP3 8.65 0.96 4.24 IL1B IL1B 5.15 1.16 5.56 IL6 IL6 6.57 1.56 6.47 INS INS 1.39 1.20 4.40 INSIG2 INSIG2 5.81 0.43 1.86 INSR INSR 9.03 0.24 1.33 ITGB5 ITGB5 8.51 0.33 1.58 KLK4 KLK4 11.77 0.83 3.67 LEP LEP 1.86 1.09 4.20 LEPR LEPR 6.97 0.65 2.67 LGALS8 LGALS8 7.77 0.39 1.73 MAPK1 MAPK1 8.59 0.35 1.61 MAPKAPK2 MAPKAPK2 7.07 0.38 2.40 MC4R MC4R 1.75 1.28 5.40 MMP9 MMP9 5.59 1.49 6.59 MTCH2 MTCH2 8.83 0.29 1.52 NFKB1 NFKB1 6.09 0.65 3.50 NPC1 NPC1 6.55 0.31 1.18 NPY1R NPY1R 5.39 0.88 3.23 NPY5R NPY5R 2.92 1.18 4.90 OR2L13 OR2L13 2.37 1.26 5.08 PAH PAH 3.83 1.41 5.46 PCGEM1 PCGEM1 4.53 1.73 7.52 PCSK1 PCSK1 2.30 1.28 5.08 PI3 PI3 3.90 1.22 4.65 PIK3CB PIK3CB 6.79 0.47 1.86 PIK3CA PIK3CA 7.10 0.28 1.19 PIK3R1 PIK3R1 8.84 0.50 2.14 PLA2G2A PLA2G2A 10.73 1.61 7.18 POMC POMC 2.64 1.18 4.81 PRKAA2 PRKAA2 7.05 0.40 1.77 PSCA PSCA 6.53 1.68 7.61 PSPH PSPH 6.93 0.66 3.68 PTEN PTEN 8.98 0.29 1.44 RAB6A RAB6A 9.54 0.24 0.90 RHOA RHOA 9.48 0.32 1.29 SCD SCD 8.99 0.96 4.72 SHBG SHBG 3.08 1.18 5.01 SIRT1 SIRT1 7.11 0.32 1.69 SLC2A2 SLC2A2 1.64 1.39 5.08 SLC2A3 SLC2A3 2.72 1.11 4.51 SLC2A4 SLC2A4 6.76 0.79 3.47 SLC39A1 SLC39A1 8.44 0.32 1.78 SLC39A2 SLC39A2 2.94 1.33 5.63 SRD5A2 SRD5A2 7.91 0.71 2.90 STAT1 STAT1 9.85 0.47 1.65 STAT3 STAT3 10.91 0.38 1.60 SULT1A1 SULT1A1 6.95 0.70 3.46 TCF7L2 TCF7L2 8.66 0.27 1.51 TFF1 TFF1 4.15 1.01 4.43 TGFB1 TGFB1 8.50 0.53 1.93 TIMP3 TIMP3 10.83 0.55 2.33 TNF TNF 3.94 1.34 6.44

49
Appendix A: Descriptive Statistics for the Gene Expression of 99 Obesity-Related Genes
among the Three Tissue Samples (Continued)
TP53 TP53 7.31 0.47 2.13 VDR VDR 4.04 0.67 3.28 YY1 YY1 8.86 0.23 0.86