Performance of polymer-coated urea (ESN) as a nitrogen source for corn

IMPACT OF NEEM COATED UREA ON PRODUCTION, PRODUCTIVITY AND SOIL HEALTH IN KARNATAKA
Report Submitted to
Directorate of Economics & Statistics, Department of Agriculture, Cooperation & Farmers Welfare, Ministry of Agriculture & Farmers Welfare, Government of India, New Delhi
Agricultural Development and Rural Transformation CentreINSTITUTE FOR SOCIAL AND ECONOMIC CHANGEBengaluru - 560 072

Dr. K.B. Ramappa Dr. A.V. Manjunatha
Research TeamVilas JadhavRamya L.G.Shrikantha T. MulimaniBangarappa
Citation: K.B, Ramappa and A.V. Manjunatha (2017), Impact of Neem Coated Urea on Production,
Productivity and Soil Health in Karnataka, Agriculture Development and Rural Transformation Centre
Report, Institute for Social and Economic Change, Bengaluru, Karnataka
Design by: dataworx, Bengaluru; website: www.dataworx.co.in
Project Leaders

Report Submittedto
Directorate of Economics & Statistics, Department of Agriculture, Cooperation & Farmers Welfare, Ministry of Agriculture & Farmers Welfare,
Government of India, New Delhi
Agricultural Development and Rural Transformation Centre (ADRTC) Institute for Social and Economic Change
Bengaluru - 560 072
May 2017
K.B. Ramappa A.V. Manjunatha
IMPACT OF NEEM COATED UREA ON PRODUCTION,PRODUCTIVITY AND SOIL HEALTH IN KARNATAKA

The present study entrusted by the Department of Fertilizers (DoF)
and its own Integrated Nutrient Management (INM) division of the
Ministry of Agriculture and Farmers Welfare (MoA & FW) to the
Agricultural Development and Rural Transformation Centre (ADRTC) of
the Institute for Social and Economic Change, Bengaluru.
The specific objectives of the study is to assess the impact of NCU on
production, productivity and soil health, and to document the status and
implementation of soil health card scheme with a view to improving the
efficiency of these significant initiatives using farm household survey in
the state of Karnataka. The reference period for the study is kharif 2015,
and the crops included were paddy and tur. In this report, perceptions of
the farmers regarding Neem Coated Urea (NCU) as compared to Normal
Urea (NU) and the Soil Health Card (SHC) Scheme has been documented.
In the course of study immense support was received from the officials
of the State Department of Agriculture, Government of Karnataka and
the MoA & FW. We sincerely thank them for their cooperation.
We would also like to thank Dr. I. Maruthi, Associate Professor and Head;
Prof. Parmod Kumar, ADRTC and Prof. M. G. Chandrakanth, Director, ISEC
for sustained support and encouragement throughout this study.
AuthorsK.B. Ramappa
A.V. Manjunatha
ACKNOWLEDGEMENTS
iv
Impact of Neem Coated Urea on Production, Productivity and Soil Health in Karnataka

Sl.No. Particulars Page No.
i List of Tables vii
ii List of Figures viii
iii Acknowledgement iv
iv Executive Summary ix-xii
Chapter I INTRODUCTION 1-8
1.1 Background of the Study 1
1.2 Review of Literature 3
1.3 Need for the Study 5
1.4 Objectives of the Study 5
1.5 Limitations of the study 6
1.6 Data and Methodology 6
1.7 Organization of the Report 7
Chapter II TRENDS IN UREA CONSUMPTION IN KARNATAKA STATE 9-16
2.1 Trends in Urea consumption/sales in Karnataka 9
2.2 District-wise relative share of urea consumption/ sale in the total fertilizer consumption/ sale in Karnataka 11
2.3 Urea Price trend in Karnataka 14
2.4 Trends in district-wise distribution of NCU/NU 15
Chapter III SOCIO-ECONOMIC CHARACTERISTICS OF SAMPLE HOUSEHOLDS 17-32
3.1 Socio-economic characteristics of the sample households 17
3.2 Details of operational land holdings 19
3.3 Cropping pattern and sources of irrigation 19
3.4 Purchasing pattern of NCU & NU and source of purchasing 23
3.5 Usage of inputs and profitability of reference crops 24
3.6 Details of agricultural credit availed 28
3.7 Training programmes attended on fertilizer application 30
Chapter IV STATUS OF AWARENESS AND APPLICATION OF NEEM COATED UREA 33-42
4.1 Awareness & sources of information on NCU 33
4.2 Status of application of Urea in relation to NCU 35
4.3 Perceptions of farmers regarding NCU and its benefits as compared to NU 36
4.4 Diversion of NU & NCU towards other than crop purposes 40
4.5 Constraints involved and suggestions regarding NCU and its adoption 40
TABLE OF CONTENTS
v
Impact of Neem Coated Urea on Production, Productivity and Soil Health in Karnataka

Sl.No. Particulars Page No.
Chapter V AWARENESS STATUS AND ADOPTION LEVEL OF SOIL TESTING TECHNOLOGY 43-50
5.1 Details of soil testing 44
5.2 Awareness and sources of information on soil testing 45
5.3 Reasons for soil testing or not testing 46
5.4 Adoption of recommended doses of fertilizer application based on soil test report 48
5.5 Problems faced in soil testing and suggestions for improvement in Soil Health Card scheme 49
Chapter VI IMPACT OF NCU APPLICATION ON CROP PRODUCTION AND SOIL HEALTH 51-58
6.1 Impact on yield of reference crops among the sample households 51
6.2 Impact on cost of cultivation of reference crops 53
6.3 Economic feasibility of NCU: a partial budgeting framework 54
6.4 Impact on soil heath and crop growth 56
CHAPTER VII SUMMARY, CONCLUSIONS AND POLICY SUGGESTIONS 59-68
7.1 Background 59
7.2 Summary of Findings 60
7.3 Conclusions 65
7.4 Policy Suggestions 67
REFERENCES 69
ACTION TAKEN REPORT 73
vi
Impact of Neem Coated Urea on Production, Productivity and Soil Health in Karnataka

Table No. Particulars Page No.
2.1 District-wise triennium trends in consumption/sale of urea in Karnataka (2000-01 to 2015-16) 10
2.2 Average district-wise relative share of urea consumption/ sale in the total ferti-lizer consumption/ sale in Karnataka over 2006-07 to 2015-16 13
2.3 Price of urea during 2012 to 2015-16 14
2.4 District-wise distribution/ consumption/ sale of NCU/ NU in Karnataka during 2015-16 15
3.1 General characteristics of sample farmers 17
3.2 Average operational landholdings of the sample farmers 20
3.3 The sample farmers Source of irrigation 21
3.4 Cropping pattern adopted by paddy respondents during kharif season 22
3.5 Cropping pattern followed by Tur respondents during Kharif season 23
3.6 Purchase pattern of NCU (for the reference year ) 23
3.7 Source of purchase NCU and Normal Urea 24
3.8 Input use, output and returns per acre realized by Paddy farmers 25
3.9 Input use, output and returns per acre realized by tur farmers 26
3.10 Input use, output and returns per acre realized by paddy & tur farmers 27
3.11 Credit details of farmers for the reference period 29
3.12 Purpose behind borrowing loans by farmers for the reference period 30
3.13 Training/s attended by respondents with respect to the application of fertilizers 31
4.1 Awareness status and sources of information on NCU among the respondents 33
4.2 Factors with which farmers differentiated between NCU and NU 35
4.3 Application of NCU across different seasons by respondents 35
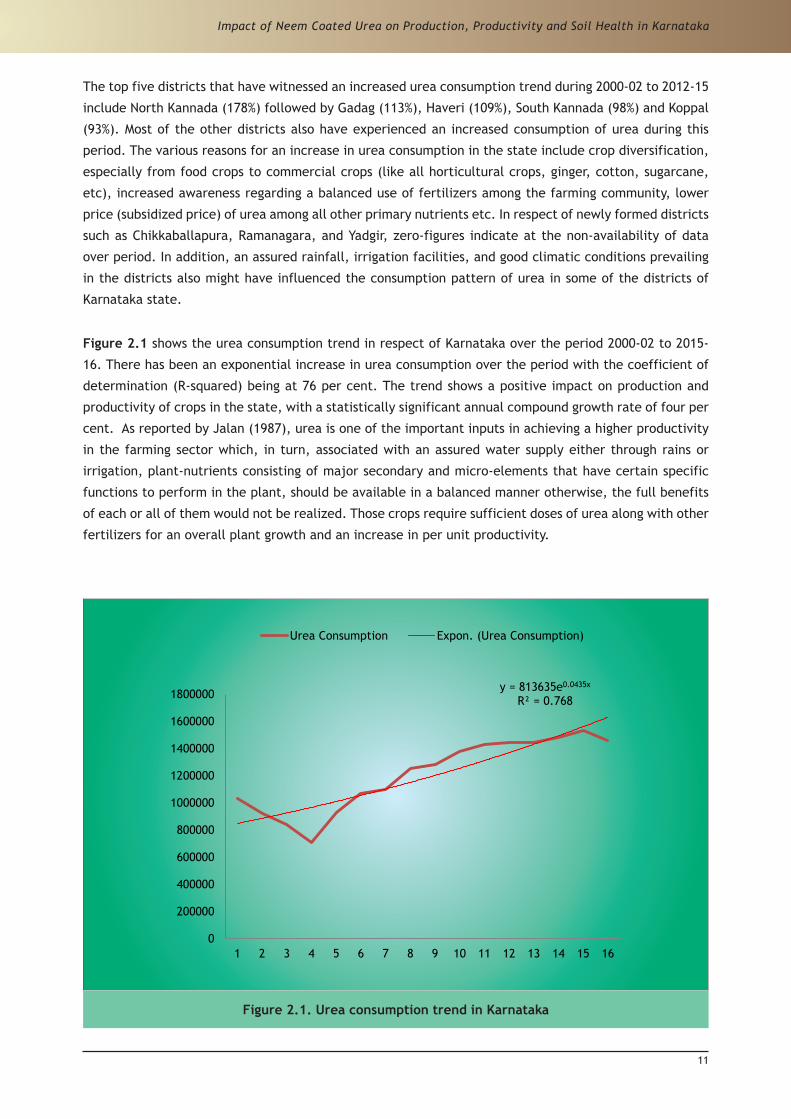
4.4 Split doses of NCU / Normal Urea application by respondents 36
4.5 Comparative Benefits of NCU over NU in the case of Paddy and Tur 37
4.6 Relative benefits of NCU reflected in soil health improvements vis-a-vis NU 38
4.7 Qualitative benefits of NCU with respect to reference crops 38
4.8 Perceptions regarding NCU in relation to NU 39
4.9 Major problems faced in adoption of NCU fertilizer 41
4.10 Major suggestions for improving NCU fertilizers usage 41
5.1 Details of soil testing by the respondents 44
5.2 Places of soil testing of the sample farmers 44
5.3 Different sources of information about soil testing and soil sample collection 45
LIST OF TABLES
vii
Impact of Neem Coated Urea on Production, Productivity and Soil Health in Karnataka

Table No. Particulars Page No.
5.4 Reasons for soil testing by the respondents 46
5.5 Reasons for not testing soil by the control farmers in the study area 47
5.6 Elucidation of Recommended Doses of Fertilizers (RDF) with respect to reference crops 48
5.7 Recommended doses of fertilizer adopted by the respondents 49
5.8 Major problems faced by farmers in respect of soil testing 50
5.9 Major suggestions for improving the SHC scheme 50
6.1 Impact of NCU on production and marketing of paddy 52
6.2 Impact of NCU on production and marketing of Tur 53
6.3 Impact of NCU on input costs of paddy 53
6.4 Impact of NCU on input costs of Tur 54
6.5 Economic feasibility of NCU in paddy (using partial budgeting framework) 55
6.6 Economic feasibility of NCU in tur (using partial budgeting framework) 56
6.7 Impact of NCU on soil health improvement 57
LIST OF FIGURES
Figure No. Particulars Page No.
2.1 Urea consumption trend in Karnataka 11
2.2 Urea price trend in Karnataka 14
3.1 Occupational distribution of overall sample farmers 18
3.2 Subsidiary occupations of the overall sample farmers 18
viii
Impact of Neem Coated Urea on Production, Productivity and Soil Health in Karnataka

Coating normal urea with neem (NCU) has based on the agronomical trials at research and farm
levels, proved that crop yields increase with the application of NCU as compared to NU. The
government has made mandatory the production of NCU (vide notification dated 25.05.2015)
recently. This policy intervention is mainly aimed at controlling an excessive use of urea which is observed
to have been affecting the soil health adversely and thereby the yield levels of crops in general. On the
other hand, both the state and central governments have been implemented several programmes focused
on soil health stability, improvement and sustainability. A recent programme, Soil Health Card Scheme
(SHCS), launched on 19th February, 2015, by the Government of India, aims at improving the yield levels
of crops through a judicious use of fertilizers. Under the scheme, soil health cards have been issued to
individual farmers containing crop-wise recommendations of nutrients and fertilizers required for plant
growth. Against this backdrop, to assess the impact of NCU on production, productivity and soil health,
and to document the status and implementation of soil health card scheme with a view to improving
the efficiency of these significant initiatives, the Department of Fertilizers (DoF) and its own Integrated
Nutrient Management (INM) division of the Ministry of Agriculture and Farmers Welfare entrusted this
study to the Agricultural Development and Rural Transformation Centre of the Institute for Social and
Economic Change, Bengaluru, with the following objectives:
Ø To analyze the trends in usage and prices of Urea vis-a-vis NCU in the state of Karnataka.
Ø To analyze the adoption behaviour of NCU among the selected farmers across irrigated and un-
irrigated regions.
Ø To analyze the impact of adoption of NCU on crop productivity and farmers’ income.
Ø To document the status and implementation of soil health card scheme in the state.
Ø To suggest suitable policy measures for adoption of NCU and implementation of SHCs scheme in the
state.
To fulfil the objectives, both the primary and secondary data were collected from four districts of
Karnataka. The reference period for the study is kharif 2015. Both paddy and tur (kharif) crops under
irrigated and rainfed conditions were selected. Two districts, namely, Davanagere and Raichur for paddy,
Kalburgi and Vijayapura for tur were selected, based on highest area, and urea consumption under
selected crops. From each district selected, two taluks were selected based on the same criterion. Thus,
Davanagere and Harihara taluks from Davanagere district, and Manvi and Sindhanur taluks from Raichur
district were selected for paddy. Similarly, Chittapur and Kalburgi taluks from Kalburgi district, and
Sindagi and Muddebihal taluks from Vijapura district were selected for tur crop. From the selected taluks,
two clusters of villages comprising 3-4 villages per cluster were selected for the primary survey. A sample
of 50 farmers from each taluk, adding to 100 farmers in the case of each district, ultimately totalling to
200 farmers for each crop was selected for the study. Based on the post-classification of the data there
were a total of 138 NCU users and 62 NU users in the case of paddy crop, and 28 users of NCU and 178 NU
EXECUTIVE SUMMARY
ix
Impact of Neem Coated Urea on Production, Productivity and Soil Health in Karnataka

users with respect to tur crop. Also an adequate representation was given to different farm-size groups
based on operational land holdings.
The major findings of the study are presented as follows:
Ø The consumption of urea shows an increase from 933 thousand MT in 2012-13 to 1480 thousand MT
during 2015-16 in the state of Karnataka, which is 59 per cent higher as compared to the previous
period.
Ø The share of urea consumption for the reference period in the state amounts to 38 per cent in the
total fertilizer consumption with an annual compound growth rate of 4.35 per cent, which could be
attributed to a rapid expansion of irrigation, spread of HYV seeds, introduction of Retention Price
Scheme-2, distribution of fertilizers to farmers at affordable prices, expansion of dealers’ network,
improvement in fertilizer availability.
Ø The average net operational landholding in the study region comes to 11.79 acres/ household, but
it is comparatively higher in the case of paddy farmers (12.69 acres/ household) than in respect of
tur-farmers (10.88 acres/ household). The major sources of irrigation among the sample farmers
are bore wells (33% of the area) followed by canals (31% of the area), open/ dug wells (seven per
cent of the area), with the remaining area covered by tanks, ponds, streams etc.
Ø The consumption of urea by paddy farmers is slightly higher as compared to tur-farmers, mainly
due to the fact that irrigated crops (like paddy) require more of fertilizers than un-irrigated crops
(like tur).
Ø The price of NCU averages slightly higher (Rs. 362/- per 50 kg bag) than NU (Rs. 347/- per 50 kg bag)
for the reference period, mainly due to an additional cost incurred on coating of NU, with neem.
Ø The cost of paddy cultivation (paid-out costs) is slightly higher for kharif 2015 as compared to kharif
2014, whereas, in the case of tur, the cost amounts to relatively the same for kharif 2015 and kharif
2014, mainly due to drought conditions prevailing in those areas.
Ø The cost on plant protection chemicals shows a relative decrease for kharif 2015 as compared to
kharif 2014 in respect of paddy, perhaps due to pesticide effect of neem present in NCU fertilizers.
Ø The total paddy output (main and by-product) for kharif 2015 amounts to 36 quintals per acre of
main product as against 28 quintals per acre, and 67 quintals of by-product as against 62 quintals
for kharif 2014; this might be due to the application of NCU instead of NU. Accordingly, the net
returns for 2015 are highest for marginal & small farmers followed by large farmers, and medium
farmers. The output of both main and by-product show a decline to two quintals/ acre in respect
of tur for kharif 2015 as compared to kharif 2014 (three quintals/ acre) due to drought conditions.
Consequently, both gross and net returns show a decreasing trend.
Ø The level of awareness is much higher among paddy (irrigated) farmers (68%) in Karnataka as
compared to tur (un-irrigated) (13%) farmers due to consecutive drought situations in the tur
growing areas of the state. The officials of State Department of Agriculture (Agricultural Officers
and Farmer Facilitators) act as a major source of information for both paddy and tur farmers across
all categories, followed by fellow farmers, and input suppliers (companies).
x
Impact of Neem Coated Urea on Production, Productivity and Soil Health in Karnataka

Ø Similarly, a higher proportion of paddy farmers notice a difference between NCU and NU use as
compared to tur-farmers in that the proportion ranges from 18 to 24 per cent in the case of paddy
farmers, while it is just four to six per cent in the case of tur-farmers.
Ø On-the-bag leaf is the major indicator for differentiating between NCU and NU followed by colour,
and price in respect of both paddy and tur-farmers.
Ø As regards the impact of NCU on yield, a majority of paddy (85%) farmers have observed an increase
in yield to an extent of 12 per cent in contrast to tur farmers, in that a majority ( >80%) have
noticed no change in yield, due to the application of NCU in place of NU.
Ø The costs incurred on pest and disease control and weed management show a decline to the tune of
18 per cent, and 20 per cent, respectively, as revealed by 60 per cent and 21 per cent of paddy and
tur farmers, respectively. But a majority (>80%) of tur-farmers have found no change in the cost of
pest and diseases control, and weed management.
Ø More than 59 per cent of paddy farmers also have noticed an improvement in soil health, quality
of grains, and market acceptability of grains because of NCU application, whereas, the proportion
amounts to 15-18 per cent in the case of tur.
Ø There has been an improvement in soil health, quality of grains, and their market acceptability post
the adoption of NCU in place of NU, as reported by 59 per cent, 68 per cent, and 70 per cent of
paddy-farmers respectively. On the other hand, more than 80 per cent tur farmers have observed no
change in soil health, quality of grains, and their market acceptability post the application of NCU.
Ø Higher prices of NCU, lack of information, and lack of awareness regarding NCU benefits as compared
to NU are the major problems being faced by both paddy and tur farmers in Karnataka.
Ø Over the last three years, only about 28 per cent of paddy and 13 per cent of tur farmers have
tested their soil systems. However, a majority (94% of paddy and 96% of tur) of farmers are
observed to have got their soil tested at laboratories of KVKs and State Department of Agriculture.
The State Department of Agriculture is the major agent involved in the collection of soil samples
and spreading awareness regarding soil testing followed by KVKs and SAUs in the state, as revealed
by 76 per cent of the overall farmers.
Ø A greater proportion of farmers have their soil tested for understanding the usefulness of soil test
technology in view of their being unaware of anything about this technology and its use earlier, and
also for understanding the fertilizer requirements of crops both in the case of paddy and tur. On the
other hand, ‘don’t not know whom to contact for details on soil testing’, followed by ‘do not know
how to take soil samples’, ‘soil testing not required for my field as crop yield is good’, and ‘soil
testing laboratories are located far away’ are the most important reasons for not testing their soil.
Ø Out of the soil-tested farmers, only about eight per cent of the overall farmers (10% of paddy
and four per cent of tur) are aware of Recommended Doses of Fertilizers (RDFs) on the basis
of information provided in soil health cards (SHCs). Although soil testing was done by a meagre
proportion of the sample farmers, a majority have not received soil health cards on time. However,
a majority of the farmers have not followed the recommendations strictly as mentioned in the soil
health cards, and in fact, a majority of famers had applied insufficient quantities of fertilizers.
xi
Impact of Neem Coated Urea on Production, Productivity and Soil Health in Karnataka

Ø There has been a positive impact on both the main product as well as yield of paddy. The average
yield of paddy is higher in the case of farmers used NCU (28.94 quintals/ acre) as compared to NU
users (26.11 quintals/ acre). The per cent change in yield due to the application of NCU in place
of NU works out to 10 per cent. In contrast, the application of NU or NCU show a negative impact
on both main product and by-products of tur for the reference period, mainly due to successive
droughts in the tur growing areas of Karnataka for the last two years (2014-15 to 2015-16).
Ø Excepting the cost of other fertilizers, all other selected input costs show a decrease in the case
of paddy crop. The extent of decrease is about four per cent each in the case of pest and disease
control, cost of weed management, and the cost of NCU/ NU itself in respect of NCU users vis-a-vis
NU users. In the case of tur, excepting the cost of pest and disease control, all other costs show an
increase due to scarcity of moisture content during crop growth.
Ø The difference in added or incremental cost and returns works out to Rs. 4,288/- per acre in the case
of paddy with the use of NCU instead of NU. In contrast, reduced returns were noticed in the case
of tur crop both in terms of main product and by-product yield for farmers using NCU in place of NU.
Ø Regarding the impact of NCU on soil characteristics, farmers’ perceptions correspond to an equal
proportion in respect of an improvement in soil texture, water infiltration rate, moisture retention
capacity, soil compactness and softness in the case of both tur and paddy farmers.
Based on the results and discussion, the major policy suggestions derived are as follows:
Ø As a majority of farmers perceive NCU as being better than NU, it can be expected that there won’t
be any problem in continuing with the production of NCU across the country. However, special
efforts are required in respect of creating awareness among the farming community regarding
NCU and its associated benefits vis-a-vis NU across the state, as the new policy of the central
government has completely stopped the production of NU. An increase in the yield levels of both
the main product and by-product in the case of paddy crop for the reference period also supports
this statement.
Ø There has been a delay in the distribution of Soil Health Cards across the state under different
programmes related to soil testing, and as a result, farmers are likely to lose their confidence in
these programmes. Therefore, there is a need for promoting farmers’ confidence through a prompt
distribution of SHCs on time.
Ø It is noticed that out of the soil-tested farmers, a small proportion of the farmers possesses SHCs
with a few of them following the recommended doses of fertilizers. Hence, there is a need for
educating the farming community regarding the importance of soil health, benefits of soil testing,
cards/ report, and the information on SHCs, knowledge about SHC recommendations etc., as part
of educating farmers regarding the importance of judicious/ balanced use of chemical fertilizers
and optimizing the crop yield levels. Special training programmes/ camps can be organized for
various stakeholders in the agricultural sector.
Ø For a successful implementation of the SHC scheme, there is a need for capacity building of the
field level staff along with the required facilities and equipments such as Soil Test Laboratories
(STLs), manpower, high quality GPS devices, etc., across the state.
xii
Impact of Neem Coated Urea on Production, Productivity and Soil Health in Karnataka

1.1. Background of the Study
Karnataka is the eighth largest state (191.79 lakh ha) in India and accounts for 5.05 per cent of the
country’s total population (6.11 crore, as per 2011 Census). Out of the total geographical area in the
state, gross cropped area constitutes 122.67 lakh hectares and net cropped area 99.23 lakh hectares. The
state accounts for 52 per cent of the total geographical area under agriculture with a cropping intensity of
124 per cent (Economic Survey of Karnataka 2015-16, 2016). With its diversified agro-climatic conditions,
the state produces a variety of agricultural crops viz., rice, ragi, jowar, maize and pulses (Tur and gram),
oilseeds and cash crops. Also, happens to be one of the three largest producing states of total coarse
cereals (7.57 million tonnes), sunflower (0.21 million tonnes) and other cash crops (41.90 million tonnes)
in the country as of 2014-15 (DoF, MoC&F, 2015).
The increasing trend in the production of agricultural crops, especially food grains, has been the result
of increased consumption of chemical fertilizers and adoption of High Yielding Varieties (HYVs) across the
country along with an expansion in groundwater irrigation. This has resulted in nutrient deficiencies in
soils and thereby as deficiency symptoms in plants. Therefore, to increase the yield levels, the demand
for fertilizers has been growing across India as part of meeting the food security needs of the growing
population.
Over time, there has been a steady increase in the consumption of fertilizers (NPK) in India. In fact, the
use of chemical fertilizers in India over the last 50 years has grown nearly 170 times (FAO, 2006). Like
any other state in the country, the consumption of NPK fertilizers in the Karnataka state has increased
enormously. The total consumption of nitrogenous (N), phosphatic (P) and potassic (K) fertilizers shows
an increase from 1.53 lakh tonnes in 1970-71 to 23.4 lakh tonnes for 2011-12 (GoK, 2016), and a further
increase of 18.37 lakh tonnes is noticed for 2014-15, although, there was a prevailing drought conditions
in the State. Karnataka is the sixth largest chemical fertilizer consuming state in India. It is worth noting
here that the per hectare consumption of NPK fertilizers in the state has increased from 30.10 Kg. N,
23.56 Kg. P, and 13.42 Kg. K in 1991-92 to 96.31 Kg. N, 47.89 Kg. P, and 31.95 Kg. K during the year 2014-15
(Ramappa and Elumalai, 2015). Thus, as Suma (2007) points out, over time, there has been a substantial
growth in the production and consumption of chemical fertilizers in the state.
Among NPK nutrients, urea is the most common nitrogen-fertilizer used uniformly throughout the world
and India is no exception. A wide acceptance of urea is because of its agronomic acceptability and
its relatively lower cost as compared to other fertilizers. Besides being widely used as an excellent
fertilizer for plant growth, it can also be used in a number products such as animal feed, commercial
products, glue, resin, cosmetics, pharmaceuticals, dish soaps, hair conditioners, tooth whiteners and
so on. The other forms of Nitrogen fertilizer produced and consumed in the country include Ammonium
Sulphate (AS), Calcium Ammonium Nitrate (CAN) and Ammonium Chloride. Urea accounts for 82 per cent
of the total consumption of straight N fertilizers. Other straight N fertilizers such as CAN and ammonium
chloride account for only 2 per cent. The share of N through DAP and other complex fertilizers is about
16 percent (FAO, 2005).
CHAPTER I
INTRODUCTION
1
Impact of Neem Coated Urea on Production, Productivity and Soil Health in Karnataka

There has been a great interest in improving the Nitrogen Use Efficiency (NUE) through optimization of
nitrogen use. By doing so, higher yields can be achieved with minimal negative impacts (Agostini et.al.,
2010; Burns, 2006; Neeteson and Carton, 2001; Rahn, 2002). The status paper on ‘Enhancing nitrogen
use efficiency - challenges and options’ by Biswas and Subba Rao (2015) reveals that an average ‘N’
recovery efficiency for fields managed by farmers ranges from 20 per cent to 30 per cent under rainfed
conditions and 30 per cent to 40 per cent under irrigated conditions. NUE is the result of two main
components: (i) N uptake efficiency - the ability of crops to absorb N from soils (Burns, 2006, and
Greenwood et.al., 1989); and (ii) use efficiency - the efficiency with which crops use absorbed N for high
yields (Janssen, 1998 and Schenk, 2006). These efficiencies may differ within the same crop because
they depend on different organs and mechanisms and, different environmental factors as well.
In view of an augmented synthetic fertilizer usage, the impact on human, animal and soil health became
adverse, with this scientists diverting their research towards finding natural and eco-friendly chemicals.
In this regard, neem based pesticides or chemicals are found much safer as they have no ill-effects on
humans and animals, and there are no residual effects on agricultural produce (Brahmachari, 2004,
and Kak, 2000). In this respect, Bains et.al. (1971) were the first to have reported an increased NUE
after treating urea with ethanol extract of neem seeds. The field experiments have shown that neem
cake stimulates algal growth, triple biomass and increases N-fixation activity by ten-fold (Grant et. al.,
1983). Similarly, a field experiment conducted by Singh and Shivay (2003) also proves that in addition to
improving the agronomic traits such as growth, yield attributes, grain and straw yields, nitrogen uptake
and apparent N recovery, NCU improves the uptake of N, P and K significantly, and helps reduce the
environmental hazards.
Considering the various benefits of neem coating and their positive impact on environment, National
Fertilizer Limited (NFL) developed a process for the production of Neem Coated Urea (NCU) on commercial
scale in 2002. Later, realizing the potential of NCU and its acceptance by farmers, Ministry of Agriculture,
Government of India, included NCU in Fertilizer Control Order (FCO) from July 2004. Thus, NFL became
the first company in India with granted the permission to produce and market NCU (vide Government of
India Notification No S.O.807 (E) dated 9 July 2004). In the initial years, the total production of NCU was
limited up to 35 per cent. Later, from March 2015, the Department of Fertilizer (DOF) made it mandatory
on all indigenous producers of urea to produce 75 per cent of their production as NCU, and from 25th May,
2015, the cap was increased to 100 per cent.
In Indian agriculture, an extensive use of fertilizers and HYVs on the one side, and low addition of
organic matters, imbalanced use of fertilizers, and non-replacement of depleted nutrients, on the other,
have led to depleting nutrient deficiencies in soils, decline in water table, decrease in organic matter
content and deterioration in soil health. In this context, both the state and central governments have
implemented various schemes and programmes for creating awareness among the farming community
regarding the importance of soil health and its management through soil test technology. One such
government programme launched by the Karnataka state happens to be ‘Soil Health Mission - Karnataka’
(2014-15) with the main objective of issuing Soil Health Cards (SHCs) to all farmers within a span of
three years. Similarly, Government of India launched a Soil Health Card Scheme on 19th February, 2015
with a focus on soil health of farm lands across the country as part of enhancing productivity through a
judicious use of inputs, especially fertilizers. Under this scheme, the soil testing is done with respect to
its main characteristics such as organic carbon, pH, electrical conductivity, macro and micro nutrients,
2
Impact of Neem Coated Urea on Production, Productivity and Soil Health in Karnataka

degradation type, color, texture and so on. The reports are given in the form of a soil health card, which
contains crop-wise recommendations of fertilizers required for their farm lands. It helps farmers identify
soil health and use soil nutrients judiciously through a proper monitoring.
1.2. Review of Literature
In this section, various research studies related to the historical development of NCU and its superiority
over Normal Urea (NU) have been reviewed and discussed in a chronological order as under:
Roxburgh (1874) listed neem as a tropical evergreen tree native to Indian sub-continent. It has a great
potential in the field of pest management, environment protection and medicine. It is a natural source
of eco-friendly insecticides, pesticides and agrochemicals (Brahmachari, 2004). The tree is said to have
anti-microbial properties besides being used as a bio-control agent in controlling plant diseases (Kak,
2000).
Ketkar (1983) found that admixing neem cake with urea fertilizer improved the efficiency of fertilizer
use in crop production through a gradual release of nitrogen to crops. He argues that a considerable
usage of synthetic chemicals during post green revolution had led to a large scale production of a variety
of chemical pesticides, with the side effects being more serious than the problems themselves. A study
by Sateesh (1998) on the health problems facing farmers, supports this statement. He observes that,
annually 2,20,000 deaths occur due to an acute poisoning caused by the use of synthetic pesticides, based
on the estimations of World Health Organization.
Bremner & Krogmeier (1988) report the adverse effects of urea, among others, use on seed germination,
seedling growth, and early plant growth.
Govindachari (1992), reports that Robert Larson was the person to have observed the use of neem
extract in rural areas of India for saving crops from insects and the multifarious uses of neem products in
villages. With the advice and assistance of USDA, Baltimore, Maryland, USA, he developed a neem kernel
formulation, named Margosan-O, standardised to contain 3000 ppm azadirachtin. When diluted 150-fold,
this would afford a spray solution with 20ppm azadirachtin, adequate to control many pests.
Nagalakshmi et.al., 1996; Verma et.al., 1998 observed that Neem kernel cake mixed with poultry feed
results an increased feeding value and protein utilization with a spectacular growth.
Majumdar and Gupta (2000) observe that excess nitrogen not absorbed by plants leaches into groundwater
aquifers and rivers, enters human body as drinking water, resulting in health disorders.
Townsend et.al. (2003) report that urea can inhibit crop growth and affect the dynamics of several
vector-borne diseases.
Fageria et.al. (2003a) find that the main reason for ‘N’ deficiency in crops is the loss of ‘N’ through
leaching, volatilization, surface runoff, denitrification, and plant canopy. They also point out intensive
agricultural production systems and low rates of N fertilizers as the other reasons for ‘N’ deficiency in the
context of developing countries.
3
Impact of Neem Coated Urea on Production, Productivity and Soil Health in Karnataka

The past studies have shown that neem plant residue is a potential source of organic manure (Brahmachari,
2004); neem cake coated with urea increases nitrogen assimilation as compared to untreated urea;
neem leaves have both fertilizer and pesticidal potential when used in the preparation of vermi-compost
(Gajalakshmi and Abbasi, 2004).
Apart from using neem as a natural pesticide and an admixture of fertilizers in agriculture, it is also used
as animal feed. A research study shows that neem leaf meal contains 92.42 per cent dry matter, 7.58 per
cent moisture, 20.68 per cent crude protein, 16.60 per cent crude fiber, 4.13 per cent ether extract, 7.10
per cent ash and 43.91 per cent nitrogen-free extract (Esonu et. al., 2005; Oforjindu, 2006; Ogbuewu,
2008).
Dayan, et.al., 2009 point out that a chemical content in neem ‘azadirachtin’ is a potent antifeedant
to many insects (Isman, 2006) such as aphids, armyworms and other caterpillars, beetles (including
Colorado potato beetle), borers, budworms, cutworms, leafhoppers, leaf miners, lepidopterist larvae,
loopers, lygus, maggots, mealy bugs, psyllids, scale, stink bugs, weevils, whiteflies, and other insects.
To develop standard specifications for neem oil as a raw material of Neem Oil Coated Urea (NOCU), a
study was undertaken by Kumar Rajesh et.al., 2007. They evaluated 25 samples of neem oils comprising
11 samples of expeller grade (EG) oils, eight samples of cold pressed (CP) oils, three samples of solvent-
extracted oils and two commercial formulations. The soils fertilized with NOCUs (200 ppm of urea-N)
were incubated at 27o C and 50 per cent water-holding capacity for a period of 15 days with Nitrapyrin
(0.5% of N) coated urea kept as the reference and prilled urea as control. Samples were analyzed for
NH4 +-N, NO2 --N, and NO3 --N using standard methods and calculated % nitrification inhibition (NI). The
results revealed that all of the neem oils caused NI ranging from 4.0 to 30.9 per cent. It was found that
two samples of EG oils and two commercial formulations were the best, causing 27.0-30.9 per cent NI.
A study on the efficiency of different urea treatments like prilled urea (Pu), Pu (2 splits), PU (4 splits),
Sulphur Coated Urea (SCU) and Neem Coated Urea (NCU) at the rate of 360 kg N/ha on fresh and dry
herb yield, nitrogen use efficiency and essential oil production of lemon balm plant was carried out. It
was found that urea fertilizer significantly increased the dry herb and essential oil yields of the plant
as compared to control. However, the impact was highest in terms of dry herb yield, essential oil yield
(I/ha), N uptake, N recovery, N-agronomy efficiency and N-physiological efficiency was highest in respect
of over prilled urea by using SCU, Pu (4 splits) and NCU, respectively as compared to other urea treatments
(Aziz and El-Ashry, 2009).
A study conducted by Akiyama et.al., (2010), for evaluating the overall effectiveness of enhanced
efficiency-fertilizers such as nitrification inhibitors (NIs), polymer-coated fertilizers (PCFs), and urease
inhibitors (UIs) on N2O and NO emissions through a meta- analysis using field experiment data indicated
that NIs and PCFs had significantly reduced N2O emissions as compared to those of conventional fertilizers,
whereas UIs were not effective in reducing N2O. The effectiveness of NIs was relatively consistent across
the various types of inhibitors and land uses, while PCFs showed contrasting results across soil and land use
type: they were significantly effective for imperfectly drained Gleysol grassland, but were ineffective for
well-drained Andosol upland fields. NIs were effective in reducing N2O emissions from both the chemical
and organic fertilizers.
4
Impact of Neem Coated Urea on Production, Productivity and Soil Health in Karnataka

1.3. Need for the Study
NCU is superior to Normal Urea (NU) as indicated by the extensive laboratory and field experiments
conducted by various scientists world-wide. The neem coated urea minimizes loss due to leaching;
prevents its misuse as well as puts the fertiliser in a slow release mode, thereby nourishing the saplings
for a longer period; avoids the repeated use of fertilizer and economizes the quantity of urea required
by crops (enhancing Nitrogen-Use Efficiency (NUE)); increases the shelf-life of the product; reduces
caking during storage and improves the availability of nitrogen to crops; results in better crop yields and
efficient pest control management; reduces the leaching of nitrates into groundwater aquifers and thus
helps reduce their pollution and so on.
With this background, Government of India included Neem Coated Urea, a slow release fertilizer, in the
Fertilizer (Control) Order, 1985 and made it mandatory on the part all the indigenous producers of urea
to produce 100 per cent of their total production of subsidized urea as NCU from 2015. In addition, it
has taken various steps towards promoting NCU with a view to improving the soil health status and also
realising higher yield per hectare. Therefore, the INM division of the Ministry of Agriculture entrusted the
Agricultural Development and Rural Transformation Centre (ADRTC) of the Institute for Social and Economic
Change (ISEC) with the task of assessing the impact of NCU on production and yield of major crops in
India. The study was undertaken in six states, namely, Bihar, Madhya Pradesh, Karnataka, Maharashtra
and Punjab, covering five major crops such as paddy, sugarcane, maize, soybean and tur (red gram) from
both the irrigated and un-irrigated tracts of the country. The ADRTC is co-ordinating this project with five
other Agro Economic Research Centres in the country.
Being a top producer of food grains, Karnataka state was also involved in the study as it is the sixth
largest fertilizer consuming state in India in terms of NPK nutrients. The present study was proposed to
examine the coverage of NCU, its adoption behaviour of farmers and its impact on yield across selected
crops in Karnataka state. Further, the study also tried to understand the diversion of Urea/NCU towards
non-agricultural purposes within the farming community and to document the baseline information on the
status and implementation of Soil Health Card Scheme, as a closely linked area of concern in the state.
1.4. Objectives of the Study
The specific objectives of the study were as follows:
1. To analyze the trends in usage and prices of Urea vis-a-vis NCU in Karnataka state.
2. To analyze the adoption behavior of NCU among the selected farmers across irrigated and un-
irrigated tracts.
3. To analyze the impact of adoption of NCU on crop productivity and farmers’ income.
4. To document the status and implementation of Soil Health Card scheme.
5. To suggest suitable policy measures for adoption of NCU and implementation of SHCs scheme.
5
Impact of Neem Coated Urea on Production, Productivity and Soil Health in Karnataka

1.5. Limitations of the study
The important limitations of the present study were as follows:
i. The study was undertaken in a very short period from the policy implementation on 100 per cent
production of NCU from May 2015 and hence, it was difficult to assess the impact of NCU on crop
productivity and farmers’ income within this limited period. However, the reference period of
the study was Kharif 2015.
ii. Because of the delay in policy implementation, there was a lack of timely availability of NCU at
the base level. Further, there was the availability of old stock of Normal Urea (NU) during the
study period and hence, many farmers applied both NCU and NU during the same period.
iii. There was a lack of awareness among the farming community regarding NCU and hence, it was
difficult for the farmers to differentiate or identify NCU from Normal Urea (NU). The farmers
were also mislead by fertilizer dealers by selling both fertilizers at the same rate despite a slight
increase in price of NCU. Therefore, the classification of users and non-users of NCU was done
based on the perceptions of farmers.
iv. Some of the parameters related to soil health/ characteristics viz. soil texture, soil water/
moisture retention capacity/ infiltration rate, soil softness etc., used in the study were highly
scientific that required a scientific analysis to judge. However, farmers’ views regarding these
parameters were considered for carrying out the study.
v. The study was limited to sample districts and crops and hence, it was difficult to generalise the
results for Karnataka.
1.6. Data and Methodology
The present study relied both on primary and secondary data collected from Karnataka. The reference
period for the study was kharif 2015. Both paddy and tur (kharif) crops produced under the irrigated and
un-irrigated conditions of the state were selected for the study. Two districts each, namely, Davanagere
and Raichur for paddy, Kalburgi and Vijayapura for tur crop were selected based on the area under the
selected crops within Karnataka. From each selected district, two taluks were selected again based
on the same criterion. Thus, Davanagere and Harihara taluks from Davanagere district, and Manvi and
Sindhanur taluks from Raichur district were selected for paddy crop. Similarly, Chittapur and Kalburgi
taluks from Kalburgi district, and Sindagi and Muddebihal taluks from Vijapura district were selected for
tur crop in the state. From the selected taluk, two clusters of villages comprising 3-4 villages per cluster
were selected for conducting the primary survey. A sample of 50 farmers from each taluk, adding up to
100 farmers in the case of each district, totalling to 200 farmers in all for each crop were selected as
the sample for the study. Households were selected randomly for assessing the use of NCU fertilisers
and their impact on crop production. The post classification of households were included two categories
i.e., users of NCU and farmer’s not using NCU (those who have used Normal Urea) mainly to differentiate
the impact of NCU from other mixtures. Further, an adequate care was taken to ensure that the selected
crops were grown under chosen irrigated/un-irrigated conditions in the state. Thus, a total of 200 (NCU/
NU) farmers for each crop were interviewed. The post-classification of the data revealed that there were
138 NCU users and 62 NU users in the case of paddy crop, while there were 28 users of NCU and 178 NU
6
Impact of Neem Coated Urea on Production, Productivity and Soil Health in Karnataka

users in the case of tur crop in the sample. An adequate representation was given to different farm-size
groups classified on the basis of operational land holdings.
In order to estimate the contribution of NCU out of total returns, a partial budgeting analysis was
employed. The technique consider the additional costs in adoption of NCU, reduced returns from NCU
on the debit side, and the reduced costs (savings due to NCU) and added returns due to NCU on the
credit side. The difference between credit and debit sides of partial budgeting quantifies the economic
feasibility of NCU. In addition, it also provide the economic contribution of NCU, in the form of increase/
decrease in cost of pest and disease control, labor, other fertilizers, and yield of both main product and
by-product as economic indicators.
1.7. Organization of the Report
The present report has been divided into seven chapters. First Chapter relates to the background
information regarding the importance of agriculture in the state, usage of fertilizers, development of
neem coated urea over the period, and issues related to the use of nitrogen fertilizers in the state as
well as the country including a review of literature, need for the study, objectives, limitations of the
study, and methodology aspects. The trends in urea consumption and prices in the state are dealt with
in Chapter Two. Third Chapter presents socio-economic profile of the respondent farmers, their cropping
pattern, and purchasing patterns of fertilizers in general and NCU in specific, details of credit availed
etc. Fourth Chapter dwells on the status of awareness among farmers and application of NCU by farmers
and their perception regarding NCU as compared to NU. The issue of diversion NU/ NCU to purposes for
other than crop production by the farming community is discussed in the same chapter. Fifth Chapter
look into the implementation of different soil health programmes introduced by both the central and
state governments, the level of adoption of soil test technology and the use of recommended doses of
fertilizers by farmers in the state. The impact of NCU application on production, productivity of crops
and soil health in the study areas is elaborated in Chapter Six, followed by a summary of the findings,
conclusions and policy suggestions in Chapter Seven.
7
Impact of Neem Coated Urea on Production, Productivity and Soil Health in Karnataka

A women farmer showing Soil Health Card to the Field Investigators
Field Investigator interviewing a farmer in the sample area
8
Impact of Neem Coated Urea on Production, Productivity and Soil Health in Karnataka

The nitrogenous fertilizer (Urea) is identified as a life changing event in the history of agriculture. Urea
is the world’s most common nitrogen-fertilizer, which has been used consistently in the agricultural and
allied sectors. Never before this, had agriculture seen such booming heights in production as well as
prosperity. The last decade has seen urea as a marvelous substitute for ammonium nitrate, unleashing
new unsurpassed production records during 2015-16 (Singh Bijay, 2016). The white, crystalline solid
comprises a proportionate compound mixture of more than one nutrient besides containing 46 per cent
of nitrogen. Cultivators have long identified with this chemical fertilizer as a great ladder for achieving a
huge success in farm production. Recent reforms in the fertilizer sector include a mandatory production
of NCU. Neem-coating prevents the diversion of urea to industrial uses, and also benefits farmers by
reducing nitrogen losses from the soil through providing a greater nutrient to crops. As a result, farmers
need a less quantity of urea for achieving the same level of production.
Out of all fertilizers, urea is the most produced, most consumed, and the most imported fertilizer in
the country. In fact, subsidized urea suffers from three types of leakage: First of all, diversion among
inefficient urea producers, diversion to non-agricultural uses and abroad, consumption by larger/ richer
farmers. Second, under-pricing urea, relative to other fertilizers, especially P & K, encourages overuse
which, in turn, results in significant environmental externalities, including the depletion of soil quality.
Third, multiple distortions in terms of price and movement controls, manufacturer subsidies, import
restrictions feed on each other, making it difficult, in the process, to reallocate resources within the
sector to more efficient uses.
2.1. Trends in urea consumption/sales in Karnataka
The need for increasing agricultural production and productivity cannot be overstated. The use of
chemical fertilizers assumes a greater significance in this context. The Indian National Food Security Act,
2013, aims at providing subsidized food grains to approximately two thirds of India’s 1.2 billion people.
To achieve this objective, agricultural productivity needs to be further enhanced which is possible only
through a balanced use of chemical fertilizers and bringing more cultivable land under fertilizer use
(MoCF, GoI, 2013).
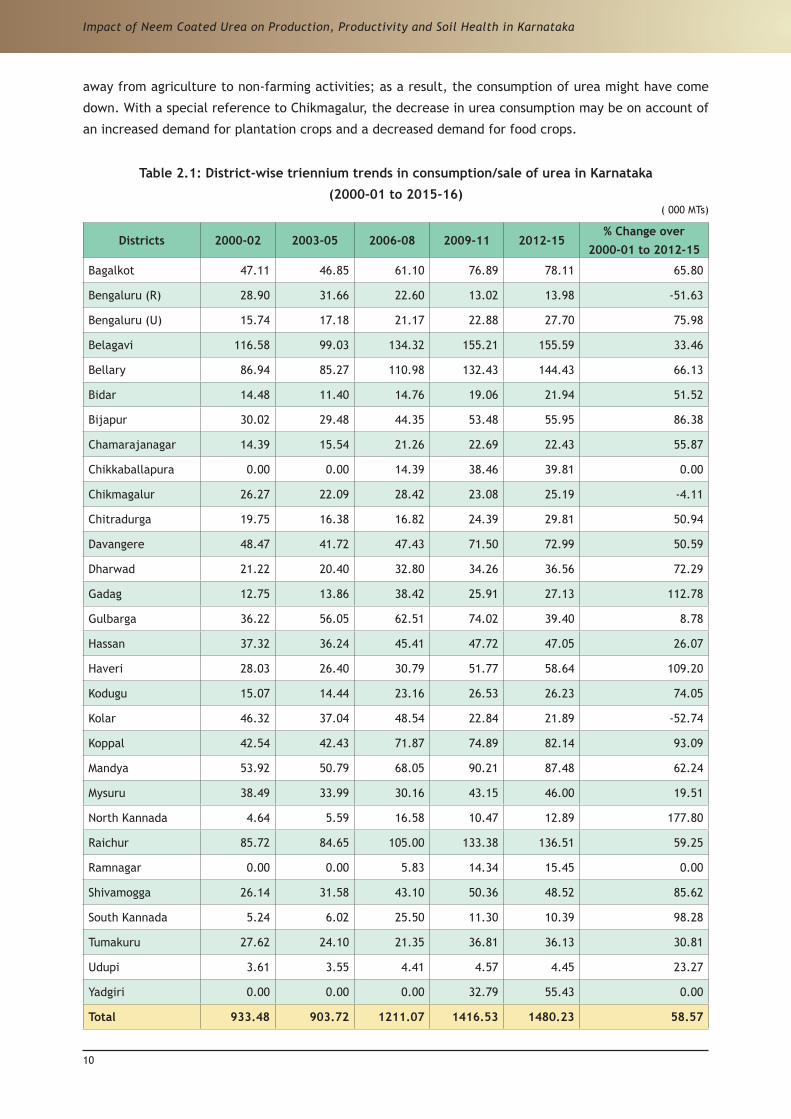
The district-wise triennium trends in consumption/sale of urea in Karnataka are presented in Table 2.1
and Figure 2.1. It was noticed from table that during 2000-01, the consumption of urea was 933.48
thousand MT, which rose up to 1480.23 thousand MT by the period 2012-13 to 2015-16. The percentage
change over from 2000-01 to 2012-15 is found to be as high as 59 per cent in respect of Karnataka.
Similarly, the district-wise consumption of urea over a period shows an increasing trend in respect of
a majority of districts of the state. However, a few districts like Bengaluru (R), Chikmagalur and Kolar
exhibit a decreasing trend in urea consumption with respect to the selected period. The decrease in
demand for urea in Bengaluru (R) might be attributed to higher conversion of agricultural land to non-
agricultural purposes such as industrial development and real estates. In the case of Kolar district, the
successive droughts and depleting water resources have made farmers shift their cropping pattern from
water-intensive crops to dry-land crops on the one hand, and on the other, many farmers, have moved
CHAPTER IITRENDS IN UREA CONSUMPTION IN KARNATAKA STATE
9
Impact of Neem Coated Urea on Production, Productivity and Soil Health in Karnataka
away from agriculture to non-farming activities; as a result, the consumption of urea might have come
down. With a special reference to Chikmagalur, the decrease in urea consumption may be on account of
an increased demand for plantation crops and a decreased demand for food crops.
Table 2.1: District-wise triennium trends in consumption/sale of urea in Karnataka
(2000-01 to 2015-16)( 000 MTs)
Districts 2000-02 2003-05 2006-08 2009-11 2012-15% Change over
2000-01 to 2012-15
Bagalkot 47.11 46.85 61.10 76.89 78.11 65.80
Bengaluru (R) 28.90 31.66 22.60 13.02 13.98 -51.63
Bengaluru (U) 15.74 17.18 21.17 22.88 27.70 75.98
Belagavi 116.58 99.03 134.32 155.21 155.59 33.46
Bellary 86.94 85.27 110.98 132.43 144.43 66.13
Bidar 14.48 11.40 14.76 19.06 21.94 51.52
Bijapur 30.02 29.48 44.35 53.48 55.95 86.38
Chamarajanagar 14.39 15.54 21.26 22.69 22.43 55.87
Chikkaballapura 0.00 0.00 14.39 38.46 39.81 0.00
Chikmagalur 26.27 22.09 28.42 23.08 25.19 -4.11
Chitradurga 19.75 16.38 16.82 24.39 29.81 50.94
Davangere 48.47 41.72 47.43 71.50 72.99 50.59
Dharwad 21.22 20.40 32.80 34.26 36.56 72.29
Gadag 12.75 13.86 38.42 25.91 27.13 112.78
Gulbarga 36.22 56.05 62.51 74.02 39.40 8.78
Hassan 37.32 36.24 45.41 47.72 47.05 26.07
Haveri 28.03 26.40 30.79 51.77 58.64 109.20
Kodugu 15.07 14.44 23.16 26.53 26.23 74.05
Kolar 46.32 37.04 48.54 22.84 21.89 -52.74
Koppal 42.54 42.43 71.87 74.89 82.14 93.09
Mandya 53.92 50.79 68.05 90.21 87.48 62.24
Mysuru 38.49 33.99 30.16 43.15 46.00 19.51
North Kannada 4.64 5.59 16.58 10.47 12.89 177.80
Raichur 85.72 84.65 105.00 133.38 136.51 59.25
Ramnagar 0.00 0.00 5.83 14.34 15.45 0.00
Shivamogga 26.14 31.58 43.10 50.36 48.52 85.62
South Kannada 5.24 6.02 25.50 11.30 10.39 98.28
Tumakuru 27.62 24.10 21.35 36.81 36.13 30.81
Udupi 3.61 3.55 4.41 4.57 4.45 23.27
Yadgiri 0.00 0.00 0.00 32.79 55.43 0.00
Total 933.48 903.72 1211.07 1416.53 1480.23 58.57
10
Impact of Neem Coated Urea on Production, Productivity and Soil Health in Karnataka
The top five districts that have witnessed an increased urea consumption trend during 2000-02 to 2012-15
include North Kannada (178%) followed by Gadag (113%), Haveri (109%), South Kannada (98%) and Koppal
(93%). Most of the other districts also have experienced an increased consumption of urea during this
period. The various reasons for an increase in urea consumption in the state include crop diversification,
especially from food crops to commercial crops (like all horticultural crops, ginger, cotton, sugarcane,
etc), increased awareness regarding a balanced use of fertilizers among the farming community, lower
price (subsidized price) of urea among all other primary nutrients etc. In respect of newly formed districts
such as Chikkaballapura, Ramanagara, and Yadgir, zero-figures indicate at the non-availability of data
over period. In addition, an assured rainfall, irrigation facilities, and good climatic conditions prevailing
in the districts also might have influenced the consumption pattern of urea in some of the districts of
Karnataka state.
Figure 2.1 shows the urea consumption trend in respect of Karnataka over the period 2000-02 to 2015-
16. There has been an exponential increase in urea consumption over the period with the coefficient of
determination (R-squared) being at 76 per cent. The trend shows a positive impact on production and
productivity of crops in the state, with a statistically significant annual compound growth rate of four per
cent. As reported by Jalan (1987), urea is one of the important inputs in achieving a higher productivity
in the farming sector which, in turn, associated with an assured water supply either through rains or
irrigation, plant-nutrients consisting of major secondary and micro-elements that have certain specific
functions to perform in the plant, should be available in a balanced manner otherwise, the full benefits
of each or all of them would not be realized. Those crops require sufficient doses of urea along with other
fertilizers for an overall plant growth and an increase in per unit productivity.
Figure 2.1. Urea consumption trend in Karnataka
y = 813635e0.0435x
R² = 0.768
0
200000
400000
600000
800000
1000000
1200000
1400000
1600000
1800000
1 2 3 4 5 6 7 8 9 10 11 12 13 14 15 16
Urea Consumption Expon. (Urea Consumption)
11
Impact of Neem Coated Urea on Production, Productivity and Soil Health in Karnataka

2.2. District-wise relative share of urea consumption / sale in the total fertilizer consumption / sale in Karnataka
Plants/ crops require nutrients for growth and development which, in turn, help increase the yield of produce. These nutrient requirements of plants are not fully met from the soil reserve; these have to be added to the soil systems through fertilizers and manures. Considering that the main intention of farmers is to increase the crop yield, they tend to apply higher quantities of fertilizers. As a result, the fertility status of soil systems improves with a possible increase in the yield level expected. If fertilizers are not used, crops will not refuse to grow, but they will be underfed and will not produce an expected amount of yield and therefore, fertilizers are a key component in the growth of the agricultural sector in the context of any country. Fertilizers constitute a major expenditure component of agriculture driven economies. Keeping with the importance of the sector that India happens to be the world’s second-largest consumer of fertilizers (China is the first) and the world’s third-largest producer. It is important to keep in view that a balanced/ judicious use of fertilizers helps optimize yield levels under a favorable environment, or else there is a possibility of causing an adverse effect on plant growth besides an excessive fertilizer use increasing the chances of environmental contamination due to leaching.
It can be observed from Table 2.2 that the average total fertilizer consumption in the state during the last decade (from 2006-07 to 2015-16) has been 3669 thousand tonnes, of which urea consumption amounts to 1380 thousand tonnes. The share of urea consumption in the state works out at 38 per cent in the total fertilizer consumption, with a statistically significant rate of 4.35 per cent. This growth in urea consumption in the state may be due to a rapid expansion of irrigation, spread of HYV seeds, introduction of Retention Price Scheme-2, distribution of fertilizers to farmers at affordable prices, expansion of dealers’ network, and improvement in fertilizer availability with virtually no change in farm gate urea prices for the past 10 years.
It is evident from the table that across districts, the share of urea consumption/sale in the total fertilizers was highest (70%) in Ramanagara followed by Bagalkot (49%), Bijapur (45%), Mandya and Belgaum (43% each), Haveri, Bellary, Raichur and Koppal (42% each) and Gadag (39%) districts, respectively. In respect of all these districts, the rate of growth has varied from four per cent to nine per cent, and was found significant at below five per cent level. Except Yadgir district, the share of urea consumption shown a fluctuation between 28 per cent to 39 per cent in respect of all other remaining districts of the state. As regards the annual growth rate in the consumption of urea, a maximum (12%) positive growth was observed for Chikkaballapura followed by Ramanagara and North Kannada (nine per cent each), Gadag and Haveri (seven per cent each), South Kannada, Bijapur and Koppal (six per cent each), Kodugu, Shimoga, Koppal, Bagalkot, Bangalore (U), Bellary and Davanagere (five per cent each). A one to four per cent annual compound growth rate has been observed for the rest of the districts. A negative growth in urea consumption noticed in respect of Bangalore (R) (seven per cent) followed by Kolar (six per cent) and Chikkamagalore (less than one per cent) districts might be mainly due to water scarcity, real estate development, and the prevalence of drought conditions in recent years. However, in case of Yadgir district, although the share was minimum (three per cent), the rate of growth was highest i.e., nine per cent, and is found statistically significant at one per cent level.
Among the sample districts, the share of consumption of urea is as high as 45 per cent in the case of Bijapur, followed by Raichur (42%), Gulbarga (35%) and Davanagere (33%). The consumption of urea share mainly depended on the availability of irrigation, crop grown in the district, area under cultivation, total agricultural area in the district etc. Interestingly, the growth rate in the urea consumption lies between
12
Impact of Neem Coated Urea on Production, Productivity and Soil Health in Karnataka

four to five per cent in the case of paddy growing districts. Whereas, the rate of growth is more than five per cent in Bijapur district and less than one per cent in Gulbarga district, among tur/ redgram growing districts. The highest growth rate in urea consumption in Bijapur might be due to grape production in this district. Because of successive drought condition in Gulbarga, the urea consumption might have decreased. Further, Gulbarga is the major redgram/ tur producing district in the state.
Table 2.2: Average district-wise relative share of urea consumption/ sale in the total fertilizer
consumption/ sale in Karnataka over 2006-07 to 2015-16(% to total)
DistrictsAverage Fertilizer
Consumption (000 MTs)
Average Urea Consumption
(000 MTs)Share (%) CAGR (%)
Bagalkot 149.50 72.64 48.59 4.71***
Bangalore (R ) 49.72 16.28 32.74 -7.26***
Bangalore (U) 84.93 24.30 28.61 4.68***
Belgaum 348.52 149.10 42.78 3.29***
Bellary 313.49 130.80 41.72 4.59***
Bidar 53.92 18.92 35.09 4.42**
Bijapur 116.12 51.73 44.55 5.68***
Chamarajanagar 57.66 22.16 38.42 3.77***
Chikkaballapura 110.65 31.78 28.72 12.61*
Chikmagalur 80.84 25.52 31.57 -0.04 NS
Chitradurga 64.41 24.29 37.70 4.37***
Davangere 198.45 64.87 32.69 4.6**
Dharwad 92.04 34.74 37.74 5.30***
Gadag 77.27 30.15 39.02 7.45**
Gulbarga 163.66 56.72 34.66 0.35 Ns
Hassan 153.04 46.76 30.55 2.29***
Haveri 115.00 48.22 41.93 7.04***
Kodugu 87.58 25.40 29.00 5.26***
Kolar 78.45 30.17 38.46 -6.01***
Koppal 187.30 76.89 41.05 5.73***
Mandya 192.17 82.47 42.91 4.71**
Mysore 134.05 40.39 30.13 1.75 Ns
North Kannada 35.55 13.27 37.33 8.68***
Raichur 302.62 126.12 41.67 4.32***
Ramanagara 17.48 12.23 69.96 9.46**
Shimoga 134.79 47.44 35.20 5.18***
South Kannada 52.54 15.19 28.92 6.25**
Tumkur 89.11 31.90 35.79 2.99 NS
Udupi 13.12 4.47 34.11 1.82 ***
Yadgiri 1814.62 50.90 2.80 8.95***
Total 3669.16 1380.37 37.62 4.35***
Note : ***,** and * represent 1, 5 and 10 per cent level significance
13
Impact of Neem Coated Urea on Production, Productivity and Soil Health in Karnataka

2.3. Urea Price trend in Karnataka
Since urea belongs to controlled fertilizers under the central government, urea prices are controlled by the government. Looking into the trends in urea prices over 2003-04 to 2015-16 (Table 2.3 and Figure 2.2), reveals that price of urea has been constant at Rs. 243 per 50 kg bag till 2010, wherein, the prices were reviewed and fixed at Rs. 266 per bag of 50 kgs (10% increase over 2003). Thereafter, during 2012, the prices rose to Rs. 286 per 50 kgs till 2015-16, again, which rose to Rs. 300 per 50 kgs during 2015-16 only, with the introduction of NCU in the market with the growth rate being at about one per cent. As the Ministry of Chemicals and Fertilizers allowed Neem Coated Urea manufacturer to sell NCU at five per cent above MRP, to recover the cost of Neem coating. However, cost of neem kernel oil and production as such of Neem Coated Urea has increased significantly since 2008. As the awareness on NCU is limited, a majority fertilizer suppliers have sold urea at the (higher) rate of NCU prices only, instead of selling at a differential prices, wherever, NCU was available in the market. It was also revealed from the primary survey that, more of NCU was available in the northern States of India than the other part of the country.
Table 2.3: Price of urea during 2012 to 2015-16
Years Price Rs./ 50 Kgs2003 242
2010 266
2012 286
2013 286
2014 286
2015 286
2016 300Source: FAI, 2010-11 and DoF, Ministry of Chemicals and Fertilizers, 2014
Source: FAI, 2010-11 and DoF, Ministry of Chemicals and Fertilizers, 2014
Figure 2.2. Urea Price Trend in Karnataka
y = 248.59e0.0282x
R² = 0.7373
0
50
100
150
200
250
300
350
1 2 3 4 5 6 7
Price Rs/50Kgs Expon. (Price Rs/50Kgs)
14
Impact of Neem Coated Urea on Production, Productivity and Soil Health in Karnataka

2.4. Trends in district-wise distribution of NCU/NU
Coating of urea with Neem oil or Neem cake has proved to be an effective natural alternative to these
chemicals. It has been scientifically established that Neem oil serves as an effective inhibitor if coated on
Urea and that Neem coating leads to a gradual release of urea, helping plants gain more nutrients besides
resulting in higher yields. The district-wise distribution/ sale of NCU/ NU during 2015-16 is presented in
Table 2.4 and Figure 2.3.
Table 2.4: District-wise distribution / consumption / sale of NCU / NU in Karnataka during 2015-16
DistrictsNCU/ NU
(Metric Tonnes)% to total fertilizers
Bagalkot 76659 5.24
Bangalore (R ) 14962 1.02
Bangalore (U) 26064 1.78
Belgaum 156517 10.70
Bellary 125383 8.57
Bidar 17885 1.22
Bijapur 58212 3.98
Chamarajanagar 22931 1.57
Chikkaballapura 44728 3.06
Chikmagalur 26916 1.84
Chitradurga 35472 2.42
Davangere 71409 4.88
Dharwad 43915 3.00
Gadag 30250 2.07
Gulbarga 39898 2.73
Hassan 47348 3.24
Haveri 65135 4.45
Kodugu 29365 2.01
Kolar 21911 1.50
Koppal 65943 4.51
Mandya 88409 6.04
Mysore 49847 3.41
North Kannada 16617 1.14
Raichur 118510 8.10
Ramanagara 16731 1.14
Shimoga 41779 2.86
South Kannada 9689 0.66
Tumkur 39256 2.68
Udupi 4023 0.28
Yadgiri 57038 3.90
Total 1462802 100.00
15
Impact of Neem Coated Urea on Production, Productivity and Soil Health in Karnataka

A perusal of the table reveals that a share of 11 per cent (highest) NCU/ NU distributed in Belgaum
district of Karnataka followed by Bellary (nine per cent), Raichur (eight per cent), Mandya (six per cent),
Bagalkot, Davangere, and Koppal (five per cent each), Haveri, Bijapur and Yadgiri (four per cent each),
Mysore, Hassan and Dharwad (three per cent each). The share of urea ranged from less than one to three
per cent for rest of the state during 2015-16; this might be due to drought conditions in the state during
the year, delay in policy implementation and non availability of urea stock at the district level.
16
Impact of Neem Coated Urea on Production, Productivity and Soil Health in Karnataka

CHAPTER IIISOCIO-ECONOMIC CHARACTERISTICS OF SAMPLE HOUSEHOLDS
To understand the socio-economic conditions of the sample farmers, information relating to family size,
its composition, literacy status, caste, and land using pattern, operational holdings, cropping pattern,
production, pattern of inputs usage, sources of irrigation, asset holdings, credit details, and training
programs attended on fertilizer application, yield levels, and profitability of the reference crops are
collected, analyzed and discussed in detail in this chapter. These characteristics of the respondents play
an important role in the adoption of any technology in the agricultural sector.
3.1. Socio-economic characteristics of the sample households
The general characteristics of the sample farmers in Karnataka are shown in Table 3.1. The table reveals
that the average age of farmers was 44 years, with all of them being male respondents in respective of
paddy and Tur. On an average, the family size of the respondents consists of seven members out of which
three both are engaged in farming with an experience of more than 24 years in farming. With regard to
the literacy level a majority (36%) of them have completed primary schooling followed by pre-university
(28%), matriculation (18.25%), higher primary (10%) and illiterates (8%). However, in the case of paddy
farmers, about 33 per cent highest have studied pre-university and above, whereas in the case of tur
farmers, about 43 per cent have studied up to primary. At the aggregate level, a majority of the sample
farmers belong to general (45%) and Other Backward Classes (OBCs) (39%), followed by Scheduled Castes
(10%) and Scheduled Tribes (7%). The proportion remains relatively the same in respect of both the crops.
Table 3.1: General characteristics of the sample farmers (% of farmers)
Particulars Paddy Tur Overall
Average age of respondents (Years) 43.00 45.80 44.40
Male respondents (-per cent to the total) 100.00 100.00 100.00
Average family members engaged fully in farming (No.) 2.49 3.03 2.76
Average years of farming experience 23.08 25.57 24.33
Average family size (No.) 6.94 7.19 7.07
Literacy level (% of farmers)
a. Illiterates 5.50 10.00 7.75
b. Primary (1 to 4) 29.00 43.00 36.00
c. Higher primary (5 to 9) 12.50 7.00 9.75
d. Matriculation (10) 20.00 16.50 18.25
e. Pre University (10+2) & above 33.00 23.50 28.25
Caste ( per cent of farmers)
a. General 44.50 45.00 44.75
b. OBC 38.00 40.00 39.00
c. SC 7.50 12.00 9.75
d. ST 10.00 3.00 6.50
Source: Authors
17
Impact of Neem Coated Urea on Production, Productivity and Soil Health in Karnataka

The occupational distribution of the sample farmers is given in Figures 3.1 and 3.2. It is quite obvious
that 98 per cent of the respondents were engaged in agriculture and allied activities, while about two
per cent are also dependent on subsidiary activities. Out of the farmers engaged in subsidiary activities,
about 40 per cent of them were salaried workers and the rest self employed in small scale industries,
working as agricultural laborers, non-agricultural casual labourers, etc.
Figure 3.1. Occupational distribution of overall sample farmers
Figure 3.2. Subsidiary occupations of the overall sample farmers
Agriculture & allied97%
Subsidiary3%
Salaried workers
40%
Other10%Agricultural
labor10%
Self employed in SSIs10%
Self employed in services
20%
Non-agricultural casual labors
10%
18
Impact of Neem Coated Urea on Production, Productivity and Soil Health in Karnataka

3.2. Details of operational land holdings
The details of operational land holdings of the sample farmers (presented in Table 3.2) indicate that
the average land owned per household works out to 10.34 acres, which was relatively the same both in
respect of tur and paddy farmers. As usual, large farmers account for the highest average landholding size
of 19.76 acres followed by medium farmers (7.87 acres) and marginal and small farmers (3.40 acres). The
leased-in land was found to be more among paddy-farmers (3.65 acres/household) than tur-farmers (0.19
acres/household). The small area under leased-in land among tur-farmers is due to drought conditions
prevailing in these areas for the last two years, and moreover tur is mostly grown in rainfed areas.
However, in both the cases, large farmers account for higher share in leased-in land. A small area under
both uncultivated/ fallow land (0.15 acre / household), and leased-out land (0.82 acre/ household) was
found only in the case of paddy farmers. With this, the average net operational area in the study region
amounts to 11.79 acres / household, which was comparatively more in the case of paddy-farmers (12.69
acres/ household) than tur-farmers (10.88 acres / household). Large farmers have occupy the highest
average area of 23.53 acres (26.61 acres in the case of paddy and 20.44 acres in tur) followed by medium
farmers with an average area of 8.44 acres (8.34 acres in paddy and 8.44 acres in the case of tur) and
marginal and small farmers with an average area of 3.40 acres (3.13 acres in the case of paddy and 3.66
acres in the case of tur-farmers).
With regard to irrigation, as an irrigated crop paddy occupies the major area (90%) and the remaining
area comes under to rainfed conditions. Similarly, tur is majorly grown under rainfed conditions in the
state and hence, the major area (82%). However, about 20 per cent of the farmers grow tur under
irrigated conditions as well. Overall, the total irrigated land was estimated to be 54 per cent in the
state. Interestingly, across categories of farmers, the highest percentage of irrigated land was with both
marginal and small, and medium farmers (55% each) as compared to large farmers (52%). On the other
hand, more than 90 per cent of the land was under irrigation in the case of both the marginal and small
farmers, and medium farmers in respect paddy. The proportion was 85 per cent in the case of large paddy-
farmers. Conversely, the irrigated area is almost the same (17 to 18%) in the case of tur-farmers. The
average rental value of leased-in land amounts to Rs.14,368/ acre for paddy, and Rs. 8048/ acre for tur
in the study area. Across categories, the rental value of leased-in land was highest (Rs. 20514/acre) for
marginal and small farmers followed by large farmers (Rs.11847/ acre) in respect of paddy, whereas, it
was large farmers (Rs.10111/ acre) followed by medium farmers (Rs.10033/ acre) in the case of tur crop.
3.3. Cropping pattern and sources of irrigation
3.3.1. The sample farmers Sources of irrigation
Irrigation is considered to be one of the foremost inputs in agriculture. Crop failure in many parts of India
happens due to lack of sufficient irrigation water. Bore well, canal, well, tank, and open/dug irrigations
are the major sources of irrigation in India. It can be seen from Table 3.3 that at the aggregate, out of
the total operated area (11.79 acres), bore wells (33% of the area) and canals (31% of the area) form the
major sources of irrigation among the sample farmers in the state. Open/ dug wells irrigate about seven
per cent of the area, and the remaining area was covered by irrigation sources such as tanks, ponds,
streams etc.
19
Impact of Neem Coated Urea on Production, Productivity and Soil Health in Karnataka

Tabl
e 3.
2: A
vera
ge o
pera
tion
al la
ndho
ldin
gs o
f th
e sa
mpl
e fa
rmer
s(A
cres
/Hou
seho
ld)
Part
icul
ars
Padd
yTu
rO
vera
ll
Mar
gina
l &
Smal
lM
ediu
mLa
rge
Tota
l/ A
vgM
argi
nal
&Sm
all
Med
ium
Larg
eTo
tal/
Avg
Mar
gina
l &
Smal
lM
ediu
mLa
rge
Tota
l/ A
vg
Num
ber
of H
ouse
hold
s70
7555
200
7956
6520
014
913
112
040
0
Ow
ned
land
3.14
7.38
19.5
210
.01
3.66
8.36
20.0
010
.67
3.40
7.87
19.7
610
.34
Unc
ulti
vate
d/ F
allo
w0.
39-
0.05
0.15
--
--
0.20
-0.
030.
08
Leas
ed-i
n0.
381.
678.
893.
65-
0.18
0.44
0.21
0.19
0.92
4.67
1.93
Leas
ed-o
ut-
0.71
1.75
0.82
--
--
-0.
350.
880.
41
Net
Ope
rati
onal
Are
a (1
-2+3
-4)
3.13
8.34
26.6
112
.69
3.66
8.54
20.4
410
.88
3.40
8.44
23.5
311
.79
% ir
riga
ted
93.2
991
.24
84.5
989
.71
17.2
118
.04
19.5
718
.27
55.2
554
.64
52.0
853
.99
% un
irri
gate
d6.
718.
7615
.41
10.2
982
.79
81.9
680
.43
81.7
344
.75
45.3
647
.92
46.0
1
Rent
al v
alue
of
leas
ed-i
n la
nd
(Rs/
Acre
)20
514
1074
411
847
1436
840
0010
033
1011
180
4812
257
1038
810
979
1120
8
Rent
al v
alue
of
leas
ed-o
ut la
nd
(Rs/
Acre
)23
142
1400
014
642
1726
135
00-
8000
3833
1332
170
0011
321
1054
7
20
Impact of Neem Coated Urea on Production, Productivity and Soil Health in Karnataka

Across crops, major paddy area was irrigated by canal (52% of area) followed by bore well (42% of area)
sources, whereas, in the case of tur, bore wells were the major source (24% of area) followed by canal
and open/ dug wells (10% of area each). About four per cent of the paddy area was also irrigated by open/
dug wells. A negligible proportion of the tur and paddy both under (one to two per cent of the total area)
was irrigated by tanks. It is obvious that about 56 per cent of the area under tur was not covered by any
of the sources of irrigation, while none of the farmers grows paddy without any of the irrigation sources.
Table 3.3: The sample farmers source of irrigation(% Operational Area)
Districts Paddy Tur Overall
Open/ Dug well 3.50 9.50 6.50
Bore well 41.50 23.50 32.50
Canal 52.00 10.00 31.00
Tank 1.50 1.00 1.25
Others* 1.50 - 0.75
No Source of irrigation - 56.00 28.00
Total 100.00 100.00 100.00
Note: *Others includes streams, ponds etc.
3.3.2 Cropping pattern followed by the paddy-farmers during kharif season
As noticed above, the cropping pattern followed by paddy farmers depends upon the availability of
irrigation, soil condition, traditional agricultural practices and so on. In order to analyze the impact of
NCU on production, productivity and soil health in India, it is worthwhile to study the cropping pattern
adopted by farmers in general and, reference crops, in particular. The cropping pattern details of reference
crops for Karnataka state, namely, paddy and tur are furnished in Tables 3.4 and Table 3.5, respectively.
Crops grown by paddy-farmers are shown in Table 3.4. The paddy-farmers in Karnataka grow crops
like paddy, maize, cotton and other crops such as vegetables, pulses and oilseeds during kharif season
(particularly the reference period). It evident from the table that the overall cropped area under paddy
was highest (31.41 acres) across all categories of paddy farmers, and all of them produce paddy only
under irrigated conditions, as it happens to be as water intensive crop. The remaining irrigated as well
as rainfed land was utilized for the production of crops like maize, cotton and other crops. Overall, large
farmers account for as high as 90 per cent of the cropped area (24.01 acres) under paddy cultivation
followed by medium farmers (74% (6.13 acres) of the cropped area) and marginal and small farmers (41%
(1.27 acres) of the cropped area). About 27 per cent and 23 per cent of the land was allotted to maize
and cotton respectively, by the majority irrigated marginal and small farmers, whereas about 66 per cent
and 34 per cent of the land was devoted to maize and other crops by the same categories of farmers under
rainfed conditions. In addition, about 63 per cent and 37 per cent of the land was allocated to cotton and
maize by the large categories of rainfed farmers. What this implies is that a majority of the marginal
and small farmers are relatively able to risk-averse in that they devote their land to more than one crop
in order to reap fair returns from one or the other crop in the case of crop failure on account of pests,
21
Impact of Neem Coated Urea on Production, Productivity and Soil Health in Karnataka

insects, droughts, floods, diseases, or whatever. It was also noticed that a majority of the farmers who
had opted out of paddy, grow more of commercial crops like cotton and maize under irrigated areas,
while rainfed farmers grow food crops like pulses, jowar, oil seeds and so on, which require less water.
It is interesting to note that none of the medium rainfed farmers produce paddy or any other crop under
rainfed areas.
Table 3.4: Cropping pattern adopted by paddy respondents during kharif season(Acre)
Particulars
Irrigated Rainfed Total
Marginal &Small
Medium LargeMarginal &
SmallMedium Large
Marginal &Small
Medium Large
Paddy1.27
(48.86)6.13
(73.50)24.01
(93.94)- - -
1.27(40.59)
6.13(73.50)
24.01(90.22)
Maize0.49
(18.84)1.16
(13.90)1.30
(5.16)0.35
(66.04)- -
0.84(26.83)
1.16(13.90)
1.30(4.90)
Cotton0.71
(27.30)0.45
(5.39)- - -
0.66(62.85)
0.71(22.68)
0.45(5.39)
0.66(2.48)
Others*0.13
(5.00)0.60
(7.19)0.25
(0.90)0.18
(33.96)-
0.39(37.14)
0.31(9.90)
0.60(7.19)
0.64(2.40)
Total2.60
(100.00)8.34
(100.00)25.56
(100.00)0.53
(100.00)-
1.05(100.00)
3.13(100.00)
8.34(100.00)
26.61(100.00)
Note: Figures in parentheses denotes percentage share to the total cropped area; *Others include pulses, vegetables, oilseeds, jowar etc.
3.3.3. Cropping pattern of Tur farmers during kharif season
The cropping pattern of tur respondents during kharif season is presented in Table 3.5. It is observed from
the table that the total area under kharif crop comes to 32.69 acres. Tur followed by maize, bajra, onion,
cotton and green gram were the crops cultivated by sample farmers during kharif season with respect to
the reference period. Tur crop alone accounts for a share considerable amount (74% or 24.25 acres) in the
cropped area among the sample respondents. Similarly, across categories about 81 per cent, 67 per cent
and 53 per cent of the cropped area of large, medium, and marginal and small farmers respectively, was
allocated to tur alone. At the aggregate, there are very few marginal and small, and medium tur-farmers
with irrigation sources and none of the large farmers. As in the case of paddy-farmers, a majority of them
marginal and small tur-farmers also have diversified their land towards different crops. Out of their total
net cropped area, about 17 per cent was used for growing bajra followed by maize (13%), and green gram
(5%). It was also noticed that a majority of the farmers with irrigation sources have opted for maize and
bajra while rainfed farmers grow bajra and green gram. About 4 per cent of the operated land of marginal
and small, 22 per cent of the medium, and 19 per cent of the large farmers was also under other crops
such as pulses, vegetable, oil seeds and so on.
22
Impact of Neem Coated Urea on Production, Productivity and Soil Health in Karnataka

Table 3.5: Cropping pattern followed by tur respondents during kharif season(Acre)
Particulars
Irrigated Rainfed Total
Marginal &Small
Medium LargeMarginal &
SmallMedium Large
Marginal &Small
Medium Large
Tur1.33
(54.28)4.25
(63.24)-
0.61(50.41)
1.50(82.42)
16.56(81.02)
1.94(53.04)
5.75(66.93)
16.56(81.01)
Maize0.44
(17.95)0.53
(7.15)-
0.02(1.65)
- -0.46
(12.56)0.53
(6.16)-
Bajra0.43
(17.55)- -
0.19(15.74)
- -0.62
(16.93)- -
Onion0.10
(4.08)- -
0.06(4.95)
- -0.16
(4.37)- -
Cotton0.05
(2.06)0.41
(6.10)-
0.07(5.78)
- -0.12
(3.27)0.41
(4.77)-
Green Gram - - -0.20
(16.52)- -
0.20(5.46)
- -
Others0.10
(4.08)1.58
(23.51)-
0.06(4.95)
0.32(17.58)
3.88(18.98)
0.16(4.37)
1.90(22.14)
3.88(18.99)
Total2.45
(100.00)6.72
(100.00)-
1.21(100.00)
1.82(100.00)
20.44(100.00)
3.66(100.00)
8.59(100.00)
20.44(100.00)
Note: Figures in parentheses denotes percentage share to the total cropped area; *Others include pulses, vegetables, oilseeds, jowar etc.
3.4. Purchasing pattern of NCU & NU and source of purchasing
The purchase pattern of NCU for the reference period (2015-16) is presented in Table 3.6. The table
gives a comparative picture of the usage of NU and NCU in respect of paddy and tur crops. Overall, NCU
farmers purchase a higher quantity (571 kgs/ household) as compared to NU users (526 kgs/ household).
The average price of NCU was Rs. 362/- per 50 kg bag, which was slightly high as compared to NU (Rs.
347/- per 50 kg bag). This additional cost was mainly due to additional cost of neem coating on NU. On
an average, farmers purchase these fertilizers from the nearby markets within a radius of 10-12 kms. It is
apparent that the transport cost was relatively the same (Rs. 21/- per bag) for both NCU and NU.
Table 3.6: Purchase pattern of NCU (for the reference year)(Per household)
ParticularsPaddy Tur Overall
NCU NU NCU NU NCU NU
Quantity bought (Kg) 732 711 405 326 571 526
Price (Rs per bag of 50kg) 327 320 396 374 362 347
Distance from farm (Kms) 7.18 7.86 13.11 15.68 10.2 11.80
Transport cost (Rs per bag of 50kg) 14 17 28 26 21 21
Total cost (Rs per bag of 50kg) 342 337 424 400 383 369
In the case of paddy-farmers, NCU users tend to buy a little higher quantity of NCU (732 kgs) as compared
to NU (711 kgs) with a difference-price of Rs. seven per bag of 50 kgs. The average distance from farm to
23
Impact of Neem Coated Urea on Production, Productivity and Soil Health in Karnataka

market for paddy-farmers was 7-8 kms, which was considerably less as compared to tur-farmers (13-16
kms). This is true for the reason that fertilizer and pesticide application was more in the case of paddy and
hence, many input dealers are found in these areas. Interestingly, the transport cost was comparatively
high in the case of NU due to stickiness of NU quality especially in respect of irrigated regions. Similarly,
in the case of tur-farmers also, NCU users tend to buy higher quantities of NCU (405 kgs/ household) as
compared to NU users (326 kgs/ household). The price of NCU/ NU were much more in these regions
(Rs. 396/- per bag of 50 kg NCU and Rs. 374/- per bag of 50 kg NU) than in paddy regions. This is due to
a lower usage in respect of dry land crops, with dealer charging higher prices for these fertilizers. The
average distance travelled for purchasing fertilizers in the case of tur farmers was around 13 to 16 kms
and accordingly the transport prices were also found more higher.
It is evident from Table 3.7 that overall private fertilizer dealers were the most trusted source for
purchase of NCU (33% farmers) and NU (50% farmers) both in the case of paddy (54% of NCU users and 19%
of NU users) and tur (13% of NCU users and 81% of NU users) crops. The second source was cooperative
societies, which account for nine per cent of the overall NCU users and six per cent of the overall NU
purchasers. However, the contribution of cooperative societies was more (17% of NCU users and six per
cent of NU users) in respect of paddy farmers as compared to tur farmers (around one per cent of NCU
users and 7% of NU users). The role of Raitha Samparka Kendras (RSKs)/ Agriculture Department was
negligible in the sale of fertilizers.
Table 3.7: Source of purchase NCU and Normal Urea(% farmers)
ParticularsPaddy Tur Overall
NCU NU NCU NU NCU NU
Private fertilizer dealers 53.50 19.00 12.50 80.50 33.00 49.75
Cooperative societies 17.00 5.50 0.50 6.50 8.75 6.00
Raitha Samparka Kendras/ Agriculture Department 3.50 1.00 - - 1.75 0.50
Others (Specify) 0.50 - - - 0.25 -
Total 74.50 25.50 13.00 87.00 43.75 56.25
3.5. Usage of inputs and profitability of reference crops
The input use, output and returns per acre of paddy and tur crops are presented in Table 3.8 and Table
3.9. It is revealed from Table 3.8 that the overall total paid-out cost incurred by paddy farmers works
out to Rs. 29,712/- per acre for 2015, as against to Rs.27,729/- for 2014. This increase in cost was
distributed across all inputs used in the production of paddy. Among these inputs, the top five costs
include chemical fertilizers both on urea and other fertilizers (Rs. 6,797/- acre in 2015 & Rs. 6,538/- in
2014), plant protection chemicals (Rs. 4,717/- in 2015 & Rs. 4,742/- in 2014), ploughing and sowing
charges (Rs. 3,731/- in 2015 & Rs. 3,290/- in 2014), harvesting and threshing charges (Rs. 3,461/- and Rs.
3,315/- for 2015 and 2014, respectively) and hired labor charges (Rs. 2,970/- for 2015 and Rs. 2,804/-
during 2014). Among these top five costs, cost on plant protection chemicals shows a relative decrease
for 2015 as compared to 2014, which might be due to the pesticide effect of neem in NCU fertilizers.
Across categories of farmers, per acre variable cost incurred by large farmers was the lowest followed by
24
Impact of Neem Coated Urea on Production, Productivity and Soil Health in Karnataka

medium farmers, and marginal and small farmers during both kharif 2015 and 2014. However, when we
compare across seasons, the total cost shows an increase in respect of all categories of farmers for 2015.
The total paddy output (main and by-product) for the year 2015 amount to 28 quintals per acre of main
product output, and 67 quintals of by-product as against the output of 28 quintals per acre, for 2014.
One of the reasons for the increase in yield of both the main product and by-product might be NCU.
Accordingly, the per acre net return shows an increase from Rs.13,492/- in 2014 to Rs.21,474/- in 2015.
Among the four categories of farmers, the marginal & small farmers accounted for the highest value of
output to the extent of Rs. 23,258/- per acre followed by large farmers (Rs.22,089/-) and medium farmers
(Rs.19,076/-) for the year 2015, whereas, the net returns for 2014 were the highest among large farmers
(Rs.16,133/-) followed by medium farmers (Rs.14,274/-), and marginal & small farmers (Rs.10,069/-).
Table 3.8: Input use, output and returns per acre realized by Paddy farmers(Rs. per acre)
Particulars
2015 2014
Marginal & Small
Medium Large AverageMarginal &
SmallMedium Large Average
Input use and their costs
Ploughing and sowing charges (only machinery)
4125 4094 2973 3731 3442 3699 2729 3290
Seed cost/ purchase of seedlings
947 868 780 865 879 819 748 815
Organic/FYM 1260 870 657 929 1028 671 520 740
Urea/NCU 723 758 659 713 603 641 623 622
Chemical fertilizers (Other than Urea/NCU)
6743 6647 7000 6797 6756 6273 6585 6538
Plant protection chemicals 4431 4700 5019 4717 4474 4729 5023 4742
Irrigation charges 249 136 132 172 102 140 118 120
Harvesting & threshing charges 3480 3082 3820 3461 3273 2947 3725 3315
Hired labour charges ( including ploughing charges till planting, cost or sowing/ transplanting )
2179 4516 2214 2970 2105 4167 2139 2804
Imputed value of family labour 3175 1316 788 1760 2603 1273 770 1549
Hired labor (amount paid) 2563 2337 2265 2388 2214 2179 2196 2197
Maintenance costs on assets used for the reference crop
1355 1301 973 1210 1077 1057 859 998
Total paid-out costs including imputed value of own labor
31229 30626 27280 29712 28557 28595 26035 27729
Returns
Output (Main product in quintal) 29 30 25 28 31 30 23 28
By product 81 64 55 67 67 60 60 62
Gross returns 54487 49702 49369 51186 38664 42869 42168 41233
Net returns 23258 19076 22089 21474 10069 14274 16133 13492
25
Impact of Neem Coated Urea on Production, Productivity and Soil Health in Karnataka

Table 3.9 gives the input use, output and returns per acre realized by tur-farmers in Karnataka. Overall,
the total paid-out cost incurred by tur-farmers works out to Rs. 10,902/- per acre for 2015, which is very
close to 2014 (Rs. 10,977/- per acre). Across different inputs, the costs are comparatively the same for
kharif 2014 and kharif 2015 because of drought condition prevailing in the sample area. In fact, costs
shows slight decrease for 2015. Unlike paddy, the top five costs in respect tur in 2015 include ploughing
and sowing charges (Rs. 2,151/- per acre), harvesting charges and threshing charges (Rs. 1,640/- per
acre), plant protection chemicals (Rs. 1,610/- per acre), chemical fertilizers (other than NCU/ NU) (Rs.
1,340/- per acre) and organic manures/ FYM (Rs. 1,108/- per acre). What is interesting note here is that
the usage of NCU/ NU in the case of tur was negligible than for paddy crop.
Table 3.9: Input use, output and returns per acre realized by Tur farmers(Rs. per acre)
Particulars
2015 2014
Marginal & Small
Medium Large AverageMarginal &
SmallMedium Large Average
Input use and their costs
Ploughing and sowing charges (only machinery)
2379 2167 1908 2151 2231 2006 1863 2034
Seed cost/ purchase of seedlings
457 400 395 417 369 325 343 346
Organic/FYM 1619 947 893 1153 1762 871 843 1159
Urea & NCU 289 274 240 268 250 214 214 226
Chemical fertilizers (Other than Urea/NCU)
1548 1110 1361 1340 1608 1047 1340 1332
Plant protection chemicals 1870 1526 1433 1610 2181 1630 1441 1751
Irrigation charges 17 12 20 16 17 13 20 16
Harvesting & threshing charges 1804 1337 1779 1640 1902 1399 1863 1721
Hired labour charges ( including ploughing charges till planting, sowing/ transplanting )
881 496 754 710 842 508 761 704
Imputed value of family labour 1536 1087 701 1108 1571 1138 831 1180
Hired labor (amount paid) 1027 609 921 852 1095 699 1024 939
Maintenance costs on assets used for the reference crop
235 176 279 230 220 132 220 191
Total paid-out costs including imputed value of own labor
13660 10141 8904 10902 14048 9982 8900 10977
Returns
Output Main product in quintals 2 2 2 2 3 3 3 3
By product in quintals 3 2 2 2 4 3 3 3
Gross returns 16959 18812 15309 17027 21122 17696 18729 19182
Net returns 3779 8670 6404 6285 7074 7714 9829 8206
Across categories of farmers, the variable/ paid-out cost incurred by marginal and small farmers was
highest (Rs. 13,660 per acre) followed by medium farmers (Rs.10,141 per acre) and large farmers (Rs.8,904
per acre) in kharif 2015. A similar trend was also observed for kharif 2014.
26
Impact of Neem Coated Urea on Production, Productivity and Soil Health in Karnataka

The output of both main and by-products shows a decline to two quintals/ acre in respect of tur during
kharif 2015 as compared to kharif 2014 (3 quintals/ acre). Consequently, there is decrease in gross returns
and net returns. However, the net returns during kharif 2015 amount to Rs. 6,285/- per acre in contrast to
Rs. 8,206/- per acre in kharif 2014. In view of drought conditions prevailing in the sample area, both main
product and byproduct yields were comparatively lower than the normal yield levels. Among categories
of farmers, the returns were in distinction to costs in the case of tur in that medium farmers account for
highest net returns (Rs. 8,670/- per acre) followed by large farmers (Rs. 6,404/- per acre), and marginal
and small farmers (Rs. 3,779/- per acre) in 2015.
A comparison of input use, output and returns realized by paddy and tur farmers in Karnataka state during
2015 and 2014 is presented in Table 3.10.
Table 3.10: Input use, output and returns per acre realized by paddy & tur-farmers
(Rs. per acre)
Particulars
Paddy Tur
2015 2014 2015 2014
Qty Value Qty Value Qty Value Qty Value
Input use and their costs
Ploughing and sowing charges (only machinery)
- 3366 - 3048 - 2054 - 1952
Seed cost/ purchase of seedlings (kgs) 43 818 43 779 4 406 4 343
Organic/FYM - 767 - 609 - 1051 - 1017
Urea & NCU (kgs) 114 699 130 625 34 262 32 220
Chemical fertilizers (Other than Urea/NCU) kgs
453 7073 433 6722 56 1344 63 1326
Plant protection chemicals - 4896 - 4895 - 1551 - 1619
Irrigation charges - 143 - 116 - 6 - 6
Harvesting & threshing charges - 3590 - 3470 - 1680 - 1758
Hired labour charges (including ploughing charges till planting, cost or sowing/ transplanting)
- 2205 - 2099 - 730 - 724
Imputed value of family labour - 1142 - 1083 - 913 - 1016
Hired labor (amount paid) - 2314 - 2196 - 881 - 979
Maintenance costs on assets used for the reference crop
- 1114 - 940 - 254 - 203
Total paid-out costs including imputed value of own labor
- 28127 - 26582 11131 11164
Returns
Output (Main product in quintal) 27 45246 26 38761 2 16059 3 18471
By product (in quintal) 60 4668 61 3206 2 304 3 421
Gross returns - 49914 - 41967 - 16363 18892
Net returns - 21787 - 15384.8 - 5232.43 - 7728
27
Impact of Neem Coated Urea on Production, Productivity and Soil Health in Karnataka

The total paid-out costs are to be almost 2.5 times more than for paddy (Rs.28,127/- per acre) as compared
to tur (Rs.11,131/- per acre) during 2015, whereas it was almost 2.4 times during 2014 (Rs.26,582/- per
acre in paddy and Rs.11,164/- per acre in case of tur). There has been a slight increase in costs during
2015 as compared to 2014 in the case of paddy crop. However, costs are almost the same in respect of tur
crop both in 2015 and 2014. Among different inputs and their costs, chemical fertilizer usage seems to be
very less in the case of tur crop, due to the fact that tur was grown mostly in rainfed areas during kharif
only, whereas, paddy was grown more than once during any of the seasons in a year, mostly in wetlands.
Therefore, the requirement of fertilizer was more in the case of paddy as a compare to Tur. Moreover,
tur crop has nitrogen fixation capacity on its own and hence, the application of NCU/ NU was also less
in the case of Tur. Similar was the situation with plant protection chemicals in respect of Tur. The plant
density and methods of harvesting were different for paddy and tur crops and hence, costs of harvesting
and threshing differ. The costs were high in the case of paddy during both the periods (Rs. 3590/- and Rs.
3470/- per acre during 2015 and 2014, respectively) than for tur crop. Like-wise, each and every costs
were high in the case of paddy.
Accordingly, both output (26 to 27 quintals of main product and 60- 61 quintals of by-product) and
returns (Rs. 21,787/- per acre during 2015 and Rs. 15,385/- in 2014) were positive in the case of paddy
in comparison to tur crop, in that output varies from two to three quintals each with regard to both main
and by-products, while the net returns were Rs. 5,232/- per acre during 2015 and Rs. 7,728 in 2014. The
prices of both paddy and tur crops were high in 2015 as compared to 2014, while the increase in net
returns in the case of tur during 2014 were attributed to (higher) yield levels. In general, prices of tur are
two times those of paddy.
3.6. Details of agricultural credit availed
Credit has been acting like a catalyst in the development of farm and non-farm sectors in the country
since independence. The agricultural credit has increased from Rs.46,268 crores in 1999-2000 to 6,07,375
crores in 2012-13, a more than thirteen times increase over in a decade. Out of that, short-term credit
has increased from Rs.28,965 crores to Rs.4,73,500 crores in the corresponding period. As a whole, the
short-term loan facility has increased sixteen times over the period. The share of medium-term loans in
the total credit has increased from Rs.17,311 crores to 1,33,875 crores, which accounts for an eightfold
increase during the same period. This shows that there has been a remarkable growth in short and
medium-term credit offered to farmers. Within a span of fourteen years, astonishing changes have taken
place in agricultural credit facility. (Department of Agricultural and Cooperation Credit Division, New
Delhi, 2013).
Various institutional and non-institutional credit sources identified in the study area are given in
Table 3.11. Overall, there was a good trend noticed in the study area in that Institutional sources
(55%) dominate over the non-institutional sources (45%) in terms of credit availed of by the sample
farmers of both paddy and tur crops. Among institutional sources, commercial banks, cooperative banks,
land development banks and other regional rural banks lend credit to farmers for the development of
agriculture in India. The non-institutional sources include private money lenders, friends and relatives,
traders/ commission agents and others such as fellow farmers, political leaders etc. However, across
crops, a major portion (53%) of the credit was availed of through non-institutional sources than the
institutional sources (47%) by paddy-farmers. In contrast, tur-farmers’ have availed of their major credit
28
Impact of Neem Coated Urea on Production, Productivity and Soil Health in Karnataka

(65%) from institutional sources with the remaining (35%) was contributed by non-institutional sources. It
was apparent that paddy farmers tend to avail more of credit than tur farmers, as the cost of cultivation
was more in the case of paddy. The relationship between the credit obtained and the purchase of NCU/
NU for the reference period (kharif 2015) revealed that they are positively correlated. The estimated
coefficients found to be 0.20 for paddy and 0.17 in the case of tur/ redgram.
Tables 3.11: Credit details of farmers for the reference period(Rs per household)
SourcesPaddy Tur Overall
Value (Rs/ hh)
% Amount availed
Value (Rs/ hh)
% Amount availed
Value (Rs/ hh)
% Amount availed
Institutional Sources
Commercial Banks 283376 13.16 187187 10.50 235282 11.95
Co-operative societies 152445 7.08 56414 3.16 104430 5.31
Regional Rural Bank 155535 7.22 111000 6.23 133268 6.77
Land development bank 425000 19.73 800000 44.87 612500 31.12
Non-Institutional Sources
Money lenders 293428 13.62 156500 8.78 224964 11.43
Friends & relatives 204714 9.50 161666 9.07 183190 9.31
Traders/commission agent 293461 13.62 35000 1.96 164231 8.34
Others 346000 16.06 275000 15.43 310500 15.77
Total 2153959 100.00 1782767 100.00 1968363 100.00
Note: hh - household
Across institutional sources, the contribution of land development bank was massive, with a contribution
of about 31 per cent to the overall credit lent by other sources. However, in the case tur crop, its
contribution was astonishing i.e., 45 per cent of the overall credit disbursed, while the share was 20 per
cent in the case of paddy farmers. The next important institutional source both in respect of paddy and
tur-farmers was the commercial banks, with a 12 per cent contribution to the overall credit availed of by
farmers, followed by regional rural banks (7%) and cooperatives (5%). Among non-institutional sources,
others such as fellow farmers, political leaders, school teachers etc., were the major sources with a 16
per cent contribution to the overall credit availed. The share was almost the same for both paddy and
tur farmers. Money lenders were found to be the next best source of credit to farmers, within their
contribution accounting for 11 per cent of the credit availed of by the overall farmers, whereas, the
share was a little higher (13%) in the case of paddy as compared to tur (9%) farmers. Similarly, friends and
relatives, account for an equal share in (9%) the total credit disbursed. However, about 14 per cent of
the credit lent was accounted for by traders/ commission agents in the case of paddy farmers, while the
share was only two per cent in the case of tur farmers. Generally large farmers prefer land development
banks for credit as they ask for securities for loans to be lent. Hence, marginal and small farmers tend to
avail loan from cooperative societies and commercial banks.
29
Impact of Neem Coated Urea on Production, Productivity and Soil Health in Karnataka

The purpose to behind borrowing loans by sample households is shown in Table 3.12. It is revealed from
the table that seasonal crop cultivation was the main purpose with about 75 per cent of the overall
farmers availing loans from different sources. The contribution was relatively the same both in the case
of paddy and tur crops. Purchase of tractor and its implements was the second important purpose for
paddy-farmers (9%), whereas in the case of tur farmers, credit was availed of more than one purpose
(8%). Both paddy and tur-farmers have borrowed loans for consumption expenditures (6% each). The other
purposes include marriage and social ceremonies (4%), purchase of livestock, and non-farm activities (1%
each). The other expenditures (2%) may include school fees, hospital expenditures, travel, etc.
Table 3.12: Purpose behind borrowing loans by farmers for the reference period
(% of farmers)
Purpose Paddy Tur Overall
Seasonal crop cultivation 74.05 75.13 74.52
Purchase of tractor and other implements 9.20 2.20 6.19
Purchase of livestock 1.25 1.10 1.19
Consumption expenditure 5.85 6.62 6.19
Marriage and social ceremonies 2.92 4.97 3.80
Non-farm activity 0.83 1.10 0.97
Other expenditure 3.39 1.10 2.38
More than One purposes 2.51 7.78 4.76
3.7. Training programmes attended on fertilizer application
Various institutions and organizations of both public and private have developed training models for
agricultural education and training for rural farming communities. Regarding these models and trainings,
an attempt was made in the study to understand the level of participation of sample farmers in soil
health/ fertilizer application related trainings. The details of the training attended are illustrated in
Table 3.13. A perusal of the table reveals that only nine per cent of paddy and six per cent of tur sample
farmers have attended training programs organized by various institutions. Out of which, 67 per cent
of the tur, and 33 per cent of the paddy farmers have attended trainings conducted by Department of
Agriculture/ Horticulture (Taluk/ District level). The proportion shows a reverse in the case of trainings
conducted by Raitha Sampraka Kendras (RSKs) at the local level, with 67 per cent of paddy farmers and
33 per cent of tur farmers have attending five days trainings/ workshops. In the case of paddy farmers,
about six per cent have also attended one day training programme organized by Krishi Vignan Kendra’s
(KVKs). To understand the relationship between the training obtained and the purchase of NCU/NU for
the reference period (kharif 2015), co-efficient of correlation are worked out. The results revealed that
the participation in training is positively correlated in the case of paddy, with an estimated coefficient
of 0.56, whereas, it is negatively correlated with respect to tur/ redgram, with an estimated coefficient
of -0.17. The negative correlation in the case of tur/ redgram cannot be generalized due to prevailing
unfavorable climatic situation (drought) in the areas of tur production in the State during Kharif 2015-16.
30
Impact of Neem Coated Urea on Production, Productivity and Soil Health in Karnataka

Table 3.13: Training/s attended by respondents with respect to the application of fertilizers
(% of farmers)
Name of the Organizer Average duration of training (No. of days)
Paddy Tur
% %
Department of Agriculture/ Horticulture 3 33.33 66.66
Raitha Sampark Kendra 5 61.11 33.33
Krishi Vignan Kendra 1 5.56 -
% of farmers attended training programmes - 9.00 3.00
31
Impact of Neem Coated Urea on Production, Productivity and Soil Health in Karnataka

Input shop owner interacting with a farmer for selling NCU
Photograph showing an Agriculture Officer with the farmers buying neem based products
32
Impact of Neem Coated Urea on Production, Productivity and Soil Health in Karnataka

CHAPTER IVSTATUS OF AWARENESS AND APPLICATION OF NEEM COATED UREA
Although both the state and centre governments have taken steps towards creating awareness among
farmers regarding NCU before distribution (kharif 2015) in the state, a majority of the farmers are not
able to identify and differentiate between NU and NCU. Therefore, to understand the level of awareness
among the farming community in the study area, the following information was sought and the results are
discussed in this chapter as follows:
4.1. Awareness and sources of information on NCU
4.2. Status of application of NU versus NCU
4.3. Perceptions of farmers about NCU and its benefits as compared to NU
4.4. Diversion of NU/ NCU to other than crop production
4.5. Constraints and suggestions regarding NCU and its adoption
4.1. Awareness & sources of information on NCU
The awareness and sources of information about NCU among farmers of paddy and tur crops in the study
area are presented in Table 4.1. It is revealed from the table that, overall, about 16 per cent of the
medium farmers followed by 13 per cent of the large farmers, and 12 per cent of the marginal and small
farmers were aware of NCU in the state. However, the awareness level was much higher among paddy
farmers (26% of medium, 22% of large, and 20% of marginal and small farmers) in Karnataka than among
tur (about six per cent of medium, and four per cent each of large, and medium & small farmers) farmers.
This also might be due to drought situation prevailed in the tur growing areas of Karnataka during the
reference period and hence, a majority of the farmers have not used urea/ NCU.
Table 4.1: Awareness status and sources of information on NCU among the respondents
((% of farmers)
Sources of Information
Paddy Tur Overall
Marginal & Small
Medium LargeMarginal & Small
Medium LargeMarginal &
SmallMedium Large
% of farmers Aware about NCU
20.00 26.00 21.50 3.50 5.50 4.00 11.75 15.75 12.75
Sources of awareness
Agricultural Officers and 22.50 28.84 37.20 28.57 54.56 62.45 25.54 41.69 49.83
Farmer Facilitators 5.00 11.53 - 28.57 - 12.50 16.79 5.77 6.25
Fellow Farmers 30.00 21.15 9.31 42.86 27.25 12.51 36.43 24.20 10.91
Print & Visual media 12.50 9.61 9.30 - - 12.50 6.25 4.81 10.90
Agricultural Universities - - 2.42 - - - - - 1.21
Input shops 2.50 19.23 6.97 - 9.09 - 1.25 14.16 3.49
Company (suppliers) 22.50 9.64 34.80 - 9.10 - 11.25 9.37 17.40
33
Impact of Neem Coated Urea on Production, Productivity and Soil Health in Karnataka

There are many other reasons associated with not using NU/ NCU in respect of tur crop. First and foremost,
a majority of the farmers do not use urea for tur as it has a nitrogen fixation property in the soil; second,
it is grown majorly under rainfed conditions. Third, Urea/ NCU was not available in the market because
drought conditions prevailing in those areas. However, a few farmers having irrigation facility use nitrogen
fertilizers for tur crop.
With regard to sources of awareness, the officials of State Department of Agriculture including both
agricultural officers and farmer facilitators acted as major sources of information to farmers of both
paddy and tur, followed by fellow farmers, and input suppliers (companies). Among the farmer categories,
overall, about 50 per cent of the large farmers, 42 per cent of the medium farmers, and 26 per cent of
the medium and small farmers had reported agriculture officers at Raitha Samparka Kendras (RSKs) as
the major source of awareness regarding NCU. As part of the State Department of Agriculture, farmer
facilitators at the village level also gave information on NCU to both paddy and tur producers in the state.
Overall, it constituted about 17 per cent of the marginal and small farmers, and about 6 per cent each of
the medium and large farmers. The second most important source of information happened to be fellow
farmers with about 36 per cent of the marginal and small, 24 per cent of the medium, and 11 per cent of
the large farmers overall, got the information on NCU. The proportion was more than nine per cent among
all categories of farmers both in respect of paddy and tur crops.
However, in the case of paddy growers, companies (suppliers of inputs) formed the third important source
of information with about 35 per cent of large, 23 per cent of marginal and small, and 10 per cent of
medium farmers got information on NCU. More than 10 per cent of farmers belonging to all categories
obtained information on NCU from print and visual media, as the fourth important source with respect
to paddy. The recent advertisement by our Prime Minister is one of the important sources among these
Media. The other sources of information as enlisted by paddy-farmers were input shops (dealers), and
State Agricultural Universities. In the case of tur-farmers, about nine per cent each of medium farmers
also stated that they got information on NCU from input shops, and company suppliers.
It is understood from the results that a large of number of farmers could not able to get information on
NCU in the study area for the reference period. Now, instead of discussing the proportion of farmers being
aware or not aware of NCU use, special efforts are required to create awareness regarding the potential
benefits of NCU usage vis-a-vis NU among the farming community, considering that the government has
made mandatory the production of NCU since May 2015.
The factors which differentiate between NCU and NU are presented in Table 4.2. It is found that the
color, leaf figure on the bag, and price were the major factors on the basis of which farmers differentiate
between NCU and NU. Overall, about 15 per cent of medium, 13 per cent of large, and 11 per cent of
marginal and small farmers were found not able to notice the difference between NCU and NU among
the total NCU users in the study area. Similar to the usage, a higher proportion of paddy farmers were
observed able to notice the difference between NCU and NU as compared to tur farmers. The proportion
ranged from 18 to 24 per cent in the case of paddy farmers, while it was just four to six per cent in
the case of tur-farmers. With both crops, leaf figure on the bag was the major indicator through which
farmers distinguished NCU from NU. More than 75 per cent of the paddy farmers from all categories, and
100 per cent medium, and 57 per cent of large farmers of tur, stated this as the factor that helps them
identify NCU from NU. Color was the second factor with which a majority (more than 71%) of marginal
34
Impact of Neem Coated Urea on Production, Productivity and Soil Health in Karnataka

and small tur farmers, and two to eight per cent of paddy farmers, were able to identify NCU from NU.
However, about 43 per cent large farmers of tur, and 11 per cent of marginal and small famers of paddy
also had reported the price of NCU and NU as one of the factors that helps them to differentiate between
these products. As per six to 17 per cent of the overall farmers, it was a combination of factors that helps
them indentify NCU. In addition to all these factors, some of the other differentiating factors expressed
by the respondents include smell of the urea, durability/keeping quality and size of granules.
Table 4.2: Factors with which farmers differentiated between NCU and NU(% of farmers)
Sources of Information
Paddy Tur Overall
Marginal & Small
Medium LargeMarginal & Small
Medium LargeMarginal & Small
Medium Large
% of farmers noticed difference in NCU
17.50 24.00 21.00 3.50 5.50 3.50 10.50 14.75 12.25
Factors
Colour difference 2.87 8.33 2.38 71.43 - - 37.15 4.17 1.19
Price difference 11.42 - - - - 42.85 5.71 - 21.43
Leaf figure on the bag 80.00 75.00 83.33 - 100.00 57.14 40.00 87.50 70.24
More than one factor 5.71 14.58 11.90 28.57 -- - 17.14 7.29 5.95
Any other (Specify) - 2.08 2.38 - - - - 1.04 1.20
4.2. Status of application of Urea in relation to NCU
The application of NCU by paddy and tur farmers in Karnataka is shown in Table 4.3. It is clear from the
table that a majority of paddy farmers have started applying NCU from 2015-16 onwards, whereas, in the
case of tur crop, more or less the same proportion (13 per cent) of the farmers has been using NCU before
2015-16. This is due to drought conditions prevailing in the tur growing areas and thus, the proportion
continues to remain the same post 2015-16. It was observed that seven per cent of the farmers also used
NCU for crops other than reference crops.
Table 4.3: Application of NCU across different seasons by respondents
Crop NameBefore 2015-16 After 2015-16
No. of farmers % of farmers No. of farmers % of farmers
Paddy 1 0.50 136 68.00
Tur 25 12.50 26 13.00
Other crops - - 14 7.00
Our observations during the survey, revealed that all the selected respondents applied NCU/ NU to
paddy crop by way of broadcasting, while none of the farmers sprayed, drilled and applied urea through
fertigation. Whereas in the case of tur, drilling was the common method employed in the application of
NCU/NU.
35
Impact of Neem Coated Urea on Production, Productivity and Soil Health in Karnataka
The split doses of NCU and NU application are shown in Table 4.4. It has been observed across the sample
farms that relatively the same quantity of NCU/ NU was applied during different stages of paddy growth.
A major quantity of NCU/ NU was applied during vegetative growth (38 - 41% of the total quantity) and
after weeding (38%), the basal application was around seven to 12 per cent of the quantity, while during
maturity about 12 - 13 per cent was applied in the case of paddy.
Table 4.4: Split doses of NCU / Normal Urea application by respondents(Kgs / Acre)
Crop StagesPaddy Tur
NCU Qty % to total Qty NU Qty % to total
Qty NCU Qty % to total Qty NU Qty % to total
Qty
Basal application 7.17 11.49 7.58 7.74 23.26 45.39 22.95 58.74
Vegetative growth 23.50 37.67 40.20 41.05 - - 4.69 12.00
After weeding 24.01 38.49 37.10 37.89 10.71 20.91 4.81 12.31
Maturity 7.69 12.35 13.03 13.32 17.27 33.70 6.62 16.94
Total 62.37 100.00 97.91 100.00 51.24 100.00 39.07 100.00
The situation was different in the case of tur crop, in that a major quantity (45-58% of the total quantity of
NCU/ NU) was applied in the basal stage itself followed by maturity stage, after weeding, and vegetative
growth. Only about two per cent of NCU was applied during vegetative growth, while it was 12 per cent
of the total quantity in respect of NU. In contrast, 21 per cent of NCU was applied after weeding, while
it was 12 per cent in the case of NU. Similarly, 33 per cent of NCU was applied during maturity stage,
whereas, it was almost half of it in the case of NU.
4.3. Perceptions of farmers regarding NCU and its benefits as compared to NU
Comparative benefits of NCU over NU in the case of paddy and tur crops are shown in Table 4.5. It can
be seen from the table that a majority (85%) of paddy farmers found an increase in yield to an extent of
12 per cent due to the application of NCU in place of NU, while 13 per cent found no change in yield. The
cost incurred on pest and disease control shown a declined trend to the tune of 18 per cent, as revealed
by 60 per cent of the paddy farmers, while no change was reported by 36 per cent of the farmers. With
regard to weed management, 21 per cent noticed a decrease in cost to an extent of 20 per cent, but a
majority (79%) found no change. About 26 per cent of paddy farmers had noticed an increase in the cost
of NCU as compared to NU to an extent of eight per cent, however, a majority (71%) haven’t experienced
the same due to the fact that both NCU and NU were sold at the same rate by the input dealers in the
market. In addition to these benefits, more than 59 per cent of the paddy farmers also had noticed that
there was an improvement in soil health, quality of grains, and market acceptability of grains because of
NCU application. However, 91 per cent of the farmers had found no change in the cost of other fertilizers
due to NCU application.
It is quite obvious that a majority (>80%) tur farmers have found no change in yield, cost of pest and
diseases control, weed management, cost of other NCU as compared to NU, cost of other fertilizers,
improvement in soil health, quality of grains, and its market acceptability because of NCU application.
However, about 17 per cent of farmers agreed that there was an increase in yield to an extent of 17 per
36
Impact of Neem Coated Urea on Production, Productivity and Soil Health in Karnataka
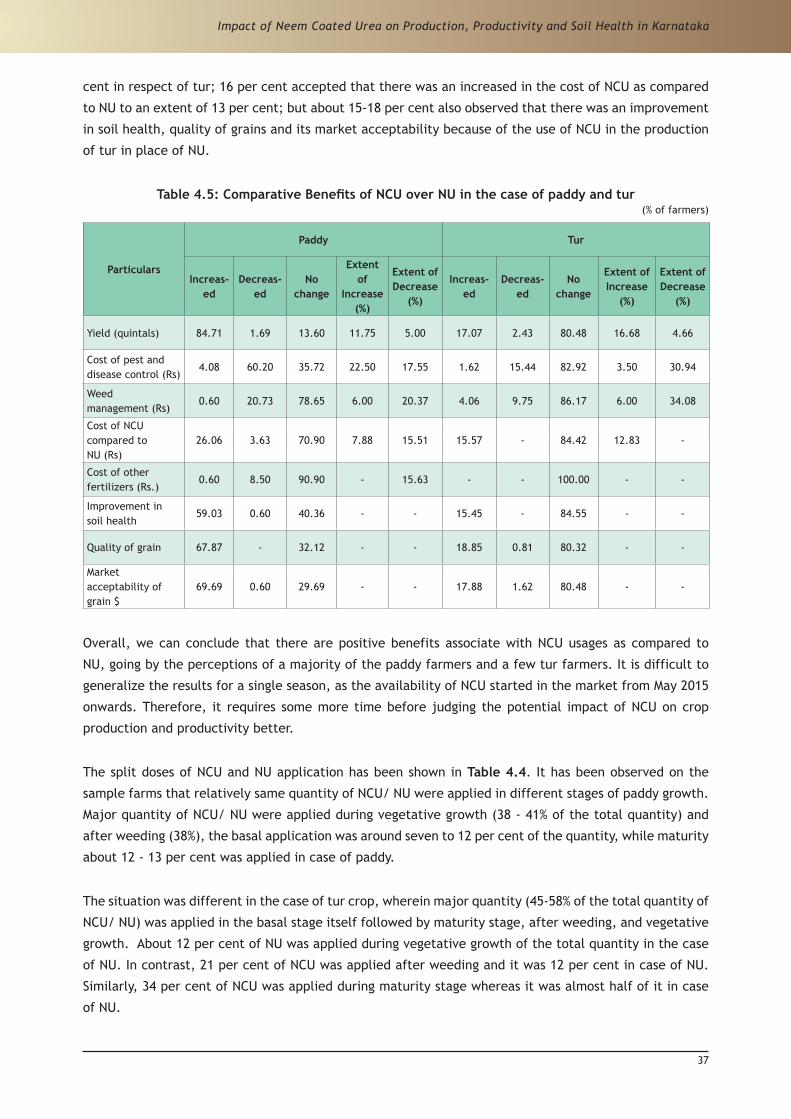
cent in respect of tur; 16 per cent accepted that there was an increased in the cost of NCU as compared
to NU to an extent of 13 per cent; but about 15-18 per cent also observed that there was an improvement
in soil health, quality of grains and its market acceptability because of the use of NCU in the production
of tur in place of NU.
Table 4.5: Comparative Benefits of NCU over NU in the case of paddy and tur(% of farmers)
Particulars
Paddy Tur
Increas-ed
Decreas-ed
No change
Extent of
Increase (%)
Extent of Decrease
(%)
Increas-ed
Decreas-ed
No change
Extent of Increase
(%)
Extent of Decrease
(%)
Yield (quintals) 84.71 1.69 13.60 11.75 5.00 17.07 2.43 80.48 16.68 4.66
Cost of pest and disease control (Rs)
4.08 60.20 35.72 22.50 17.55 1.62 15.44 82.92 3.50 30.94
Weed management (Rs)
0.60 20.73 78.65 6.00 20.37 4.06 9.75 86.17 6.00 34.08
Cost of NCU compared to NU (Rs)
26.06 3.63 70.90 7.88 15.51 15.57 - 84.42 12.83 -
Cost of other fertilizers (Rs.)
0.60 8.50 90.90 - 15.63 - - 100.00 - -
Improvement in soil health
59.03 0.60 40.36 - - 15.45 - 84.55 - -
Quality of grain 67.87 - 32.12 - - 18.85 0.81 80.32 - -
Market acceptability of grain $
69.69 0.60 29.69 - - 17.88 1.62 80.48 - -
Overall, we can conclude that there are positive benefits associate with NCU usages as compared to
NU, going by the perceptions of a majority of the paddy farmers and a few tur farmers. It is difficult to
generalize the results for a single season, as the availability of NCU started in the market from May 2015
onwards. Therefore, it requires some more time before judging the potential impact of NCU on crop
production and productivity better.
The split doses of NCU and NU application has been shown in Table 4.4. It has been observed on the
sample farms that relatively same quantity of NCU/ NU were applied in different stages of paddy growth.
Major quantity of NCU/ NU were applied during vegetative growth (38 - 41% of the total quantity) and
after weeding (38%), the basal application was around seven to 12 per cent of the quantity, while maturity
about 12 - 13 per cent was applied in case of paddy.
The situation was different in the case of tur crop, wherein major quantity (45-58% of the total quantity of
NCU/ NU) was applied in the basal stage itself followed by maturity stage, after weeding, and vegetative
growth. About 12 per cent of NU was applied during vegetative growth of the total quantity in the case
of NU. In contrast, 21 per cent of NCU was applied after weeding and it was 12 per cent in case of NU.
Similarly, 34 per cent of NCU was applied during maturity stage whereas it was almost half of it in case
of NU.
37
Impact of Neem Coated Urea on Production, Productivity and Soil Health in Karnataka

Although, it is very difficult to judge the relative/ qualitative aspects of soil systems and grains physically
without any scientific approach, the perceptions of farmers are based on their long-time experience, as
presented in Tables 4.7 and 4.8.
Table 4.6 presents the relative benefits of NCU in soil health improvements over NU in respect of paddy
and tur crops. It was noticed that more than 59 per cent of paddy farmers found an improvement in soil
health in terms of texture, moisture retention capacity, infiltration, and softness, while a decrease in
compaction post NCU use. In the case of tur crop, excepting soil texture and compaction, all other soil
characteristics such as soil health, soil moisture retention capacity, water infiltration, and soil softness
shown an improvement, as expressed by more than 40 per cent of the farmers. However, both texture
improvement and compact reduction were also observed by five per cent of tur-farmers. Overall, more
than 50 per cent of the farmers perceived an improvement in soil health post the application of NCU in
relation to NU.
Table 4.6: Relative benefits of NCU reflected in soil health improvements vis-a-vis NU
(% of farmers)
ParticularsPaddy Tur Overall
Nos % Nos % Nos %
Farmer improved soil health by applying NCU 106 76.81 20 71.42 126 75.90
Texture improved 63 59.43 1 5.00 64 50.79
Soil moisture retention increased 105 99.05 19 95.00 124 98.41
Improvement in water Infiltration 102 96.22 20 100.00 123 97.61
Improvement in soil softness 83 78.30 8 40.00 91 72.22
Compaction decreased 64 60.37 1 5.00 65 51.58
Similarly, the qualitative benefits of NCU use with respect to paddy and tur crops are shown in Table 4.7.
The qualitative benefits had been assessed based on attributes such as improvement in soil health, quality
of grains and their acceptability in the market. It can be noticed from the table that there had been an
improvement in soil health, quality of grains, and their market acceptability post the adoption of NCU
in place of NU, as reported by 59 per cent, 68 per cent, and 70 per cent of paddy farmers respectively.
Table 4.7: Qualitative benefits of NCU with respect to reference crops
(% of farmers)
ParticularsPaddy Tur
Increased Decreased No change Increased Decreased No change
Improvement in Soil health 59.03 0.60 40.36 15.45 - 84.55
Quality of grain 67.87 - 32.12 18.85 0.81 80.32
Market acceptability of grain color 69.69 - 29.69 17.88 1.62 80.48
38
Impact of Neem Coated Urea on Production, Productivity and Soil Health in Karnataka

Table 4.8: Perceptions regarding NCU in relation to NU
ParticularsPaddy Tur Overall
No. of farmers % farmers No. of
farmers % farmers No. of farmers % farmers
Neem Coated Urea quality
Very good 19 9.50 - - 10 4.75
Good 107 53.50 28 14.00 68 33.75
Bad 7 3.50 03 1.50 5 2.50
No change 67 33.50 169 84.50 117 59.00
Neem Coated Urea availability
Adequate 127 63.50 16 8.00 71 35.75
Inadequate 11 5.50 10 5.00 11 5.25
No change 62 31.00 174 87.00 118 59.00
Timely availability of Neem Coated Urea
Yes 124 62.00 18 9.00 71 35.5
No 76 38.00 182 91.00 129 64.5
Neem Coated Urea Price
Very high 2 1.00 7 3.50 5 2.25
High 59 29.50 15 7.50 37 18.50
Not very high 54 27.00 1 0.50 28 13.75
Same as urea 85 42.50 177 88.50 130 65.50
Benefits of NCU in terms of total fertilizer usage
Increased 3 1.50 8 4.00 11 5.50
Decreased 18 9.00 32 16.00 50 25.00
No Change 179 89.50 160 80.00 139 69.50
Benefits of NCU in terms of Urea usage
Increased 28 14.00 2 1.00 14 7.50
Decreased 19 9.50 60 30.00 40 19.75
No Change 153 76.50 138 69.00 146 72.75
Pest and disease attack
Increased 8 4.00 1 0.50 5 2.25
Decreased 88 44.00 42 21.00 64 32.50
No Change 104 52.00 157 78.50 131 65.25
NCU is more easily accessible in the market compared to normal Urea
Yes 37 18.50 7 3.50 22 11.00
No 163 81.50 193 96.50 178 89.00
39
Impact of Neem Coated Urea on Production, Productivity and Soil Health in Karnataka

On the contrary, more than 80 per cent of tur farmers had reported no change in soil health, quality of grains, and their market acceptability post the application of NCU. However, about 15 per cent had perceived an improvement in soil health, 19 per cent an increase in quality of grains, and 18 per cent an increase in the market acceptability of grains produced post NCU application.
Table 4.8 depicts the perceptions regarding NCU in relation to NU of paddy and tur farmers. A perusal of the table reveals that for about 53 per cent of the paddy farmers, the quality of NCU was good, while for 34 per cent there was no change in quality as compared to NU. A majority (64%) had expressed that the NCU availability had been adequate during the reference period as compared to NU earlier, whereas, 31 per cent had noticed no change. In terms of timely availability of NCU, 62 per cent reported that it was made available on time. However, in respect of NCU price, benefits in terms of total fertilizer usage, benefits of NCU in terms of NU usage, pest and disease attacks and accessibility of NCU as compared to NU, a majority of paddy farmers had noticed no change.
In the case of tur farmers, more than 69 per cent of the farmers perceived no change in quality, availability, price, total fertilizer usage, urea usage itself, pest and disease attacks and accessibility of NCU as compared to NU for the earlier days. However, a few of them also accepted that there was an improvement in terms of quality of NCU, a decrease in the total fertilizer usage, urea usage itself, and a decrease in pest and disease attacks post NCU application.
In summary, a majority of the irrigated/ paddy farmers perceived an improvement in the quality of urea and its availability as compared to NU. In addition, it had benefitted them in terms of total fertilizer usage and urea through a reduction in the quantity of fertilizers applied, and also there has been a decrease in pest and disease attacks and an improvement in accessibility. This might be true for the reason that the benefits of NCU are better under favorable climate conditions such as an adequate moisture availability and timely application. The situation was reverse in the case of tur farmers because of drought conditions prevailed in those areas.
4.4. Diversion of NU & NCU towards other than crop purposes
All the selected farmers were asked about the usage of NCU for other than crop production purposes. It has been found during the survey that except a farmer who used NCU in fishery feed preparation with 0.1gm/ kg of feed, none of the selected farmers had reported the use of NCU for other purposes such as silage making, mixing with weedicides and for any other purpose other than crop production. During the interaction it was also noticed that a negligible proportion of NU was used to feed animals, and mixing with milk to get a higher fat content earlier.
4.5. Constraints involved and suggestions regarding NCU and its adoption
The major problems faced in the adoption of NCU fertilizer are listed in Table 4.9. It has been observed from the table that 67 per cent of paddy and 64 per cent of tur farmers had faced problems while adopting NCU fertilizer. Lack of information, lack of awareness regarding NCU benefits as compared to NU, and a higher price of NCU were the major problems as reported by 45 per cent, 29 per cent, and 16 per cent of the paddy farmers, respectively. However, in the case of tur, a higher price of NCU was the major problem followed by non-availability of NCU, lack of information, and lack of awareness regarding the application of NCU, as revealed by 56 per cent, 17 per cent, and 11 per cent each of the respective farmers.
At the aggregate, higher prices of NCU, lack of information on NCU, and lack of awareness regarding NCU benefits as compared to NU happened to be the major problems faced by both paddy and tur farmers in
40
Impact of Neem Coated Urea on Production, Productivity and Soil Health in Karnataka

Karnataka. In addition to this, some of the problems such as non-availability of NCU, lack of awareness regarding the application of NCU, slow reaction of NCU as compared to NU, bad smell, problems in differentiating between NCU and NU, attack of new pest and diseases were the other problems expressed by a few sample farmers in the study area in respect of the adoption of NCU.
Table 4.9: Major problems faced in the adoption of NCU fertilizer(% of farmers)
Problems Paddy Tur Overall
% of farmers faced problems while adopting NCU application 66.66 64.28 66.26
Major problems faced
Bad smell 1.08 - 1.08
Attack new pest and disease 1.08 - 1.08
Lack of information 44.56 11.12 39.09
Higher Price 16.30 55.55 46.36
Lack of awareness regarding application of NCU 2.17 11.11 3.63
Non availability of NCU 2.17 16.66 4.54
Slow reaction of NCU 2.17 - 2.17
Problems in differentiating between NCU and NU 1.08 - 1.08
Lack of awareness regarding NCU benefits as compared to NU 29.39 5.55 25.62
Major suggestions for improving the NCU fertilizer usage are illustrated in Table 4.10. It can be seen from
the table that about 43 per cent of paddy farmers and 46 per cent of tur farmers were in favor of spreading
awareness regarding NCU usages and its benefits as compared to NU among farmers as there won’t be NU
production in view of the union government decision making the production of NCU mandatory since May
2015. Organization of training camps on fertilizer application was another important suggestion made
by 29 per cent of paddy farmers and 18 per cent of tur farmers. In addition to these suggestions, 10 per
cent of the aggregate farmers also had suggested that NCU prices be reduced and a timely supply of NCU
ensured before the start of the sowing season. Similarly, eight per cent of the overall farmers expressed
themselves in favor of increase in the subsidy amount given to NCU.
Table 4.10: Major suggestions for improving NCU fertilizer usage(% of farmers)
Suggestions Paddy Tur Overall
Bad smell 1.08 - 1.08
Spread the awareness about NCU 42.75 46.42 43.33
Increase the subsidy amount 7.97 10.71 8.43
Supply NCU before sowing season 10.14 14.28 10.84
Reduce NUC price 10.14 10.71 10.24
Provide trainings on fertilizer application 29.00 17.80 27.16
41
Impact of Neem Coated Urea on Production, Productivity and Soil Health in Karnataka

Farmers showing their Soil Heath Cards at the time of data collection in the sample areas
42
Impact of Neem Coated Urea on Production, Productivity and Soil Health in Karnataka

CHAPTER V AWARENESS STATUS AND ADOPTION LEVEL OF
SOIL TESTING TECHNOLOGY
A proper nutrition supply is essential for a satisfactory crop growth and production. Soil analysis is a
valuable tool for farm practice as it determines inputs required for an efficient and economic production.
The success of soil analysis depends on how scientifically soil samples are drawn because the results
are only as good as the sample you choose. A proper soil test will help ensure the application of enough
fertilizers to meet the crop requirements in addition taking advantage of the nutrients already present in
the soil systems. It is observed from various studies carried out across the country that an indiscriminate
or suboptimal use of chemical fertilizers by farmers with a view to increasing crop yield is a common
phenomenon, which, in turn, has led to a deterioration in the soil structure, wastage of nutrients,
destruction in the soil micro-organisms, and scorching of plants in the extreme cases.
In this regard, both the Union and State Governments have undertaken various initiatives as part of
ameliorating the situation and encouraging farmers towards a balanced use of fertilizers. One such
important initiative undertaken by the Union Government, under National Mission for Sustainable
Agriculture (NMSA), during the 12th Plan was the Soil Health Management (SHM), aimed at promoting
Integrated Nutrient management (INM) through a judicious use of chemical fertilizers based on soil testing
technology. This scheme was named as ‘Soil Health Card Scheme’ (SHC Scheme), effective from 19th
February 2015. Realizing the importance of soil health and its management, Government of Karnataka
also implemented the soil testing programme in the name of Soil Health Mission during 2014-15 with
the main objective of issuing Soil Health Cards to all farmers of the state within three years. Under this
mission, many Soil Health Centres (SHCs), Fertilizer Control Laboratories, and Micro Nutrient Laboratory
were established. The soil samples were analyzed for pH, EC, Major nutrients like N, P, K, secondary
nutrients like Sulphur and magnesium, and micro nutrients such as Zn, Fe, Mn, Cu and Boron. This field-
specific detailed report of soil health fertility status and other important soil parameters that affect crop
productivity were given in the form of a card called as ‘Soil Health Card’. These soil health cards provide
an advisory on soil test based use of fertilizers and amendments.
In this report, an effort was made to understand farmers’ awareness level about soil test technology,
their adoption level, and issues related to soil test technology in general and specific to Soil Health Card
Scheme introduced by the Central Government among farmers of paddy and tur crops in Karnataka. The
results of the details collected are discussed in this chapter under the following subheadings:
5.1. Details of soil testing
5.2. Awareness and sources of information on soil testing
5.3. Reasons for soil testing or not testing
5.4. Adoption of recommended doses of fertilizer application based on soil test report
5.5. Problems faced in soil testing and suggestions for improvement in Soil Health Card scheme.
43
Impact of Neem Coated Urea on Production, Productivity and Soil Health in Karnataka

5.1. Details of soil testing
The details of soil testing and related parameters of the respondent farmers are presented in Tables 5.1
and 5.2. A perusal of the tables reveals that within the last three years, about 28 per cent of paddy and
13 per cent of tur farmers have tested their soil systems. The proportion seems to be very less when
we look at the picture over the last three years, in that only six per cent of paddy, and two per cent of
tur farmers have got their soil systems tested in Karnataka. There were many government schemes such
as Bhoochetana, RKVY, National Project on Management of Soil Health and Fertility (NPMSHF) and Macro
Management of Agriculture (MMA) in operation in the state for testing of soil systems at free of cost.
However, farmers had spent, on an average, Rs.50/- per sample soil testing. The average distance from
field to soil test laboratories was 46 kms in the case of paddy farmers and 26 kms for tur farmers. About
five samples were drawn per plot of paddy and three per plot of tur in the last three years. Overall,
relatively seven to eight acres had been covered under soil test, as per the details provided by paddy and
tur farmers in the state. A majority (94% of paddy and 96% of tur) farmers had tested their soil systems at
Krishi Vignan Kendras (KVKs) and the rest through Raitha Samparka Kendras (RSK’s) or State Department
of Agriculture (Table 5.2). Surprisingly, no Agricultural Universities had been involved in the testing of
soil samples.
Table 5.1: Details of soil testing by the respondents
(% of farmers who tested their soil)
ParticularsWithin 3 yrs Before 3 yrs
Paddy Tur Paddy Tur
% of farmers done soil testing 28.00 12.50 5.50 1.50
Number of times soil testing done 1 1 1 1
Cost of soil testing (Rs/sample) 51 49 92 0
Distance from field to soil testing lab (Kms) 45.66 26.45 23.27 32
Samples taken for soil testing (No.s) 5 3 4 3
Area covered under soil test (all plots) (Acres) 7.85 7.31 5.83 4.66
Table 5.2: Places of soil testing of the sample farmers
(Overall farmers who tested their soil)
Particulars Paddy Tur Overall
% of farmers done soil testing (Both before & after three years) 34.00 14 24.00
Krishi Vignan Kendra (KVKs) 94.03 96.42 94.79
Raitha Samparka Kendra (RSK) / State Department of Agriculture 5.97 3.57 5.21
44
Impact of Neem Coated Urea on Production, Productivity and Soil Health in Karnataka

5.2. Awareness and sources of information on soil testing
Soil testing is one of the important technologies in agriculture and hence farmers were educated on its
importance and usefulness through various sources like State Agricultural Departments, State Agricultural
Universities (SAUs), KVKs, private companies, friends, neighbors etc. The details of different sources
of information on soil testing among sample farmers are illustrated in Table 5.3. It was noted from the
table that State Agriculture Department was the major source (76%) across overall farmers in the state
with respect to spreading of awareness on soil testing. However, its contribution had been much more in
the case of tur farmers (93%) than paddy farmers (69%). The KVKs and SAUs were the next best sources
of information on soil testing for the farming communities in the state as revealed by five and three per
cent of the overall farmers. In addition to these sources, other information sources for paddy farmers on
soil testing include friends (7%), neighbors (6%), private companies (4%) and more than one source (4%).
It is obvious that irrigated farmers are more enthusiastic about soil testing and had a better network, and
hence, they get information more easily as compared to dry-land farmers.
Table 5.3 also represents the sources of soil sampling and collection of soil samples. Similar to sources
of soil testing, State Department of Agriculture and its officials such as farmer facilitators were the
major source of soil sampling and who collect soil samples from farmers’ fields, as reported by 40 per
cent and 32 per cent of the overall farmers, respectively. In case of paddy, many other sources such as
input supplying companies, NGOs, other research organizations had been involved in demonstrations and
collection of soil samples for soil testing.
Table 5.3: Different sources of information about soil testing and soil sample collection
(% of farmers who tested their soil)
Sources of soil testing Paddy Tur Overall
State Agricultural Universities (SAUs) 2.94 3.57 3.12
Krishi Vignan Kendra (KVKs) 5.88 3.57 5.20
Private Companies 4.41 - -
Friends 7.35 - -
Neighbors 5.88 - -
Agriculture Department 69.13 92.85 76.04
More than one source 4.41 - -
Who collected the soil
Self 23.52 28.58 25.00
State Department of Agriculture Officers (RSKs in Karnataka) 36.76 46.42 39.58
Farmer Facilitator 35.29 25.00 32.29
More than one Organization 2.94 - -
Other (Specify) 1.47 - -
45
Impact of Neem Coated Urea on Production, Productivity and Soil Health in Karnataka

5.3. Reasons for soil testing or not testing
Reasons for soil testing by sample households are presented in Table 5.4. Out of the soil tested-farmers,
a majority got their soils tested for understanding the usefulness of soil test technology as they had
been unaware of anything related to this technology and its use earlier and also for understanding the
fertilizer requirements of paddy crop. In the order of ranking, 77 per cent of them had treated these
reasons as most important, 17 per cent as important and the rest as least important. About 65 per cent
had reported availing of benefits under the subsidy schemes as the most important reason for soil testing
and the rest 18 per cent each perceived it as important and least important. In addition to these reasons,
about 50 per cent of the farmers had reported poor yield as the important reason (with the remaining
25% each treated it as the most important and least important) for soil testing followed by motivation
gained through village demonstrations/ training/ exposure visits to different places (45% as important,
30% as most important and 25% as least important), peer farmers’ group pressure (38% treated it as
important, 34% as most important and 28% as least important) as the other important reasons for soil
testing in the case of paddy. Similarly, about 72 per cent and 68 per cent of the tur farmers had stated
lack of awareness about soil test technology and its use and the desire for understanding the fertilizer
requirements of crops as the most important reasons behind soil testing. However, about 18 per cent and
15 per cent of paddy farmers, and 16 per cent and 24 per cent tur farmers considered these reasons as
important in the order of ranking. Unlike paddy farmers, motivation gained from village demonstration/
training/ exposure visits to places with best farming practices and availing benefits under subsidy schemes
had been reported as the corresponding reasons for soil testing in the case of tur farmers in that 58 per
cent and 42 per cent of respective tur farmers treated these reasons as least important, 33 per cent and
42 per cent as important, and the rest as most important in the order of ranking. However, about 45 per
cent of tur farmers, had cited peer farmer group pressure as one of the most important reasons for soil
testing, while the remaining 27 per cent each treated this as important and least important.
Table 5.4: Reasons for soil testing by the respondents
(% of farmers who tested their soil)
Reasons
Paddy Tur Overall
Most imp
Important Least imp Most imp ImportantLeast imp
Most imp
ImportantLeast imp
Not aware of anything about Soil testing and its use
76.78 17.85 5.37 72.00 16.00 12.00 75.30 17.28 7.42
For availing benefit under subsidy schemes
64.70 17.64 17.66 16.66 41.66 41.68 44.82 27.60 27.58
Poor crop yield 25.00 50.00 25.00 57.14 21.42 21.42 34.00 42.00 24.00
Motivation from village level demonstration/training/exposure visits to places with best farming practices
29.54 45.46 25.00 8.33 33.34 58.33 25.00 42.85 32.14
Peer farmer group pressure 34.48 37.93 27.58 45.45 27.27 27.28 37.50 35.00 27.50
To understand fertilizer requirement of crops
76.59 14.89 8.52 68.00 24.00 8.00 73.61 18.05 8.33
Others 100.00 - - 50.00 33.33 16.67 57.14 28.57 14.28
46
Impact of Neem Coated Urea on Production, Productivity and Soil Health in Karnataka

Overall, ‘not aware of anything’ about soil testing and its use, followed by the desire to understand
fertilizer requirement of crops, availing of benefits under subsidy schemes and peer farmer group pressure
happened to be the most important reasons for soil testing, as revealed by 75 per cent, 74 per cent, 45
per cent, and 38 per cent of the respective sample farmers of both paddy and tur in Karnataka. The next
important reasons for soil testing as cited by these farmers include, motivation gained through village
demonstrations/ training/ exposure visits to places with best farming practices (43%) and poor crop yield
(42%). It is noteworthy to mention here that, about cent per cent of paddy farmers and half of tur farmers
pointed to sustainable output, balancing soil nutrients (both micro and macro), better soil health etc., as
the other most important reasons for soil testing.
On the other hand, reasons for not testing their soils by both paddy and tur farmers are listed in Table
5.5. A perusal of the table reveals that about 76 per cent of the overall farmers (66% of paddy and 86%
of tur farmers) have not tested their soils, and the related reasons are explained below. Do not know
whom to contact for details on soil testing was the most important reason, as expressed by 73 per cent of
paddy farmers and 76 per cent of tur farmers, of which 13 per cent of paddy farmers and 12 per cent of
tur farmers also treated this as an important variable in the order of importance, but 14 per cent and 12
per cent perceived it as least important. Soil testing not required for their filed as crop yield is good as
the other reason quoted by both paddy and tur farmers. However, about 38 per cent and 24 per cent of
farmers treated it as most important, 10 per cent and 12 per cent as important, and a majority (52% and
65%) as least important in terms of ranking in the case of paddy and tur, respectively. ‘Do not know how
to take soil samples’ was the other reason for not testing their soils. For this reason, about 37 per cent
of paddy and 39 per cent of tur farmers ranked it as the most important, and likewise, 36 per cent and
37 per cent considered as important, and 27 per cent and 24 per cent as least important. More than half
(58% of paddy and 47% of tur) of the sample farmers pointed to ‘soil testing laboratories are located far
away’ was the least important reason for not testing their soils in the study area.
Table 5.5: Reasons for not testing soil by the control farmers in the study area
(% of farmers who tested their soil)
Reasons Paddy Tur Overall
% of farmers not tested their soil
66.00 86.00 76.00
Most imp
ImportantLeast imp
Most imp
ImportantLeast imp
Most imp ImportantLeast imp
Do not know whom to contact for details on soil testing
73.48 12.87 13.65 76.18 12.20 11.62 75.00 12.50 12.50
Do not know how to draw soil samples
37.13 35.60 27.27 38.95 37.20 23.85 38.15 36.51 25.34
Soil testing laboratories are located far away
15.92 25.75 58.33 23.25 29.65 47.10 20.06 27.96 51.97
Soil testing not required for my field as crop yield is good
37.87 9.84 52.27 23.83 11.62 64.55 29.93 10.85 59.22
Overall, ‘do not know whom to contact for details on soil testing’ followed by ‘do not know how to take
soil samples’, ‘soil testing not required for my field as crop yield is good’ and ‘soil testing laboratories are
located far away’ were the most important reasons for not testing their soils as expressed by a majority
47
Impact of Neem Coated Urea on Production, Productivity and Soil Health in Karnataka
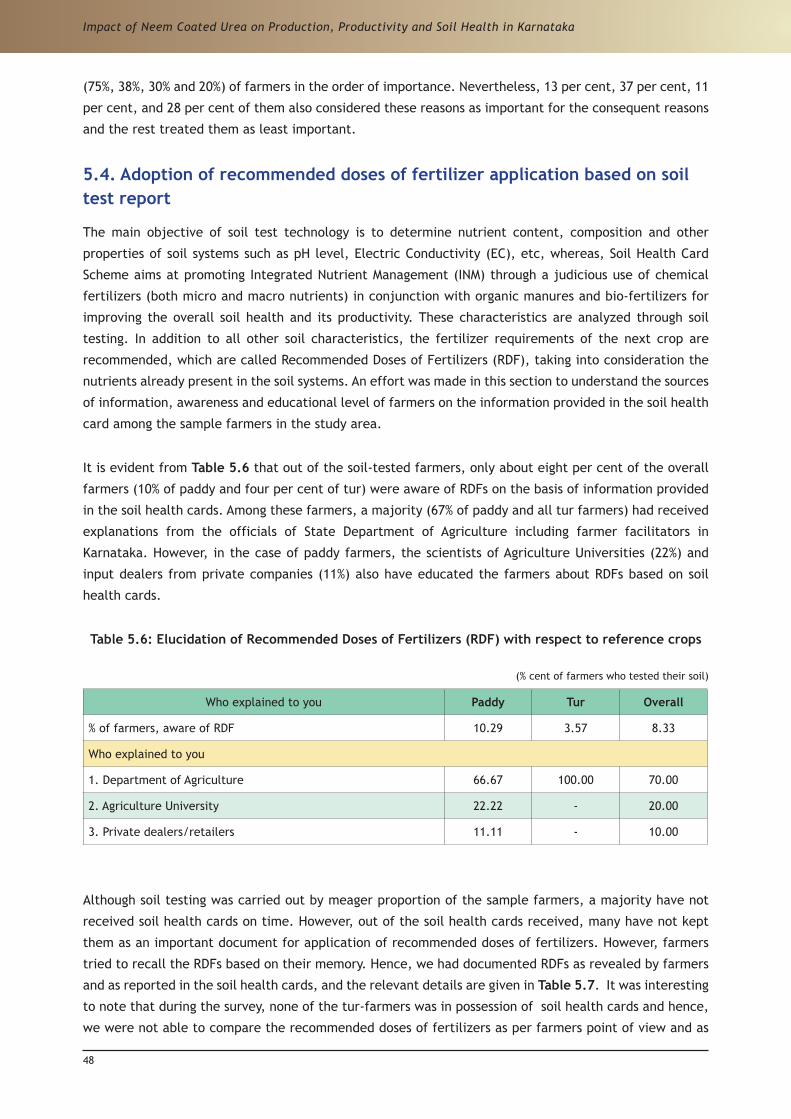
(75%, 38%, 30% and 20%) of farmers in the order of importance. Nevertheless, 13 per cent, 37 per cent, 11
per cent, and 28 per cent of them also considered these reasons as important for the consequent reasons
and the rest treated them as least important.
5.4. Adoption of recommended doses of fertilizer application based on soil test report
The main objective of soil test technology is to determine nutrient content, composition and other
properties of soil systems such as pH level, Electric Conductivity (EC), etc, whereas, Soil Health Card
Scheme aims at promoting Integrated Nutrient Management (INM) through a judicious use of chemical
fertilizers (both micro and macro nutrients) in conjunction with organic manures and bio-fertilizers for
improving the overall soil health and its productivity. These characteristics are analyzed through soil
testing. In addition to all other soil characteristics, the fertilizer requirements of the next crop are
recommended, which are called Recommended Doses of Fertilizers (RDF), taking into consideration the
nutrients already present in the soil systems. An effort was made in this section to understand the sources
of information, awareness and educational level of farmers on the information provided in the soil health
card among the sample farmers in the study area.
It is evident from Table 5.6 that out of the soil-tested farmers, only about eight per cent of the overall
farmers (10% of paddy and four per cent of tur) were aware of RDFs on the basis of information provided
in the soil health cards. Among these farmers, a majority (67% of paddy and all tur farmers) had received
explanations from the officials of State Department of Agriculture including farmer facilitators in
Karnataka. However, in the case of paddy farmers, the scientists of Agriculture Universities (22%) and
input dealers from private companies (11%) also have educated the farmers about RDFs based on soil
health cards.
Table 5.6: Elucidation of Recommended Doses of Fertilizers (RDF) with respect to reference crops
(% cent of farmers who tested their soil)
Who explained to you Paddy Tur Overall
% of farmers, aware of RDF 10.29 3.57 8.33
Who explained to you
1. Department of Agriculture 66.67 100.00 70.00
2. Agriculture University 22.22 - 20.00
3. Private dealers/retailers 11.11 - 10.00
Although soil testing was carried out by meager proportion of the sample farmers, a majority have not
received soil health cards on time. However, out of the soil health cards received, many have not kept
them as an important document for application of recommended doses of fertilizers. However, farmers
tried to recall the RDFs based on their memory. Hence, we had documented RDFs as revealed by farmers
and as reported in the soil health cards, and the relevant details are given in Table 5.7. It was interesting
to note that during the survey, none of the tur-farmers was in possession of soil health cards and hence,
we were not able to compare the recommended doses of fertilizers as per farmers point of view and as
48
Impact of Neem Coated Urea on Production, Productivity and Soil Health in Karnataka

per soil health cards. It was also true that fertilizer requirements of dry-land crops seem to be relatively
less in general and tur in particular. Moreover, NU/ NCU had not been recommended for tur crop in the
study area, as revealed by the agriculture officials.
In case of paddy farmers, a majority perceived that the fertilizers requirements were less as compared to
RDFs given in soil health cards. As per them, the average quantity of farm yard manure (FYM) recommended
was two tons per acre, whereas, it was 2.7 tons per acre in the report. In the case of macro nutrients,
RDFs as per soil health card were 75 kgs of urea, 78 kgs of DAP, and 31 kgs of MOP per acre instead of 66
kgs of urea, 40 kgs of DAP, and 38 kgs of MOP as per their opinion. Further, in place of 10 kgs/ acre of Zinc
sulpahte, they had sated as eight kgs. Similarly, in the case of other fertilizers such as micro nutrients
and bio-fertilizers, they recalled the quantity as 80 kgs instead of 73 kgs per acre. The results shown that
a majority farmers had not strictly followed the recommendations as given in soil health cards, in fact, a
majority had applied insufficient quantities. Hence, it was difficult to get the expected level of output as
reported by the scientists based on the results obtained from experimental plots. In the case of tur crop,
farmers could recall only major nutrients such as urea, and DAP as 50 kgs/ acre, and a micronutrient Zinc
sulphate as five kgs/ acre.
Table 5.7: Recommended doses of fertilizers adopted by the respondents
ParticularsPaddy Tur
As per Farmer Opinion
As per Soil Test Report
As per Farmer Opinion
As per Soil Test Report
FYM (ton/ac) 2.00 2.70 1.00 -
Urea (kg/ac) 66.00 75.45 50.00 -
DAP (Kg/ac) 40.00 77.80 50.00 -
MOP (Kg/ac) 38.00 31.15 - -
ZNSO4 (kg/ac) 8.00 10.00 4.80 -
Others (kg/ac) 80.00 73.40 - -
5.5. Problems faced in soil testing and suggestions for improvement in Soil Health Card scheme
Overall about 57 per cent of soil-tested farmers had expressed that they had faced problems in adopting
soil test technology. The proportion of tur farmers reported difficulties in soil test technology was highest
(93%) as compared to paddy farmers (49%). The various problems as stated by sample farmers are listed
in Table 5.8. Out of all the soil tested farmers, about 29 per cent of farmers had observed that SHCs
are not distributed in time and that they don’t know whom to contact for details on soil testing. A
corresponding proportion was 28 per cent and 26 per cent among paddy farmers while 31 per cent and
35 per cent in the case of tur farmers. The lack of knowledge about soil test technology was the third
important problem faced by 18 per cent of paddy farmers, whereas, it was lack of awareness regarding
soil sampling in the case of 23 per cent of tur farmers. About 12 per cent of tur farmers and nine per cent
of paddy farmers had reported soil testing laboratories being located far away as the problem in adopting
soil test technology. The other problems reported by paddy farmers include lack of information flow from
49
Impact of Neem Coated Urea on Production, Productivity and Soil Health in Karnataka

government Departments (10%), lack of awareness about soil health card scheme (four per cent), lack of
information on soil test technology, and no training facilities organized by the government (one per cent
each).
Table 5.8: Major problems faced by farmers in respect of soil testing
(% of soil tested farmers)
Problems Paddy Tur Overall
% of farmers faced problems in soil testing 49.27 92.85 56.62
Major Problems faced
1. Soil testing laboratories are far away 8.82 11.53 9.57
2. Lack of awareness regarding soil sampling 1.47 23.07 7.44
3. SHCs are not distributed on time 27.94 30.78 28.72
4. No training facilities organized by the government 1.47 - -
5. Lack of information on soil test technology 1.47 - -
6. Do n' t know whom to contact for details on soil testing 26.48 34.62 28.72
7. Lack of information flow from Govt. Departments 10.29 - -
8. Lack of awareness about SHC scheme 4.41 - -
9. Lack of knowledge about soil test technology 17.64 - -
At the same time, sample farmers were also requested to give suggestions for improving the SHC scheme
and the same are depicted in Table 5.9. In all, six suggestions had been provided by farmers based on the
problems faced in adopting soil test technology. Overall, spread of awareness regarding soil test technology
was the major suggestion given by a majority farmers (63%) with the proportion being relatively same in
the case of both paddy and tur farmers. The second major suggestion related to establishment of soil test
laboratories at the taluk level (12 per cent of the overall farmers), however, the proportion was higher
(20%) in the case of tur farmers as compared to paddy farmers (six per cent). Access to free and timely
SHC distribution (nine per cent), followed by providing of trainings in soil sampling (eight per cent),
access to free and timely soil test report (five per cent) and access to information through mobile phones
(three per cent) were the other major suggestions made by the sample farmers for further improvement
in the scheme.
Table 5.9: Major suggestions for improving the SHC scheme(% of farmers)
Problems Paddy Tur Overall
Provide trainings in soil sampling 11.79 3.14 7.71
Access to free and timely SHC distribution 11.23 7.54 9.49
Spread awareness regarding soil test technology 63.48 61.63 62.61
Access to free and timely soil test report 6.17 3.77 5.04
Access to information through mobile phones 1.68 4.40 2.96
Establish soil test laboratories at the taluk level 5.65 19.52 12.19
50
Impact of Neem Coated Urea on Production, Productivity and Soil Health in Karnataka

CHAPTER VIIMPACT OF NCU APPLICATION ON CROP PRODUCTION AND SOIL HEALTH
There is no doubt that any new technology can have an impact on the economy and society as a whole.
Similarly, the mandatory production and usage of Neem Coated Urea (NCU) is expected to have long-
term positive impacts on agronomic efficiency, reduction in chemical fertilizer and plant protection
chemical usage, increase in crop output and returns, and improvement in soil health. Most importantly,
a reduction in the financial constraints on the government budget, and a reduction in pollution levels
are the expected benefits across the economy. Although NCU has a long history in terms of production,
its’ use and spread has been relatively insignificant. Now, it has almost replaced NU in view of a better
application and advocacy of positive impacts on soil health by agricultural scientists. Further, it is also
believed that the diversion of subsidized urea by industries has stopped after the introduction of NCU.
This chapter analyses the impact of NCU application on crop production, input usage, quantitative, and
qualitative benefits in the production of paddy and tur crops in the state of Karnataka. The results are
discussed under the following sub-headings:
6.1. Impact on yield of reference crops among the sample households.
6.2. Impact on the cost of cultivation of reference crops.
6.3. Economic feasibility of NCU using a partial budgeting framework
6.4. Impact on soil heath and crop growth.
6.1. Impact on yield of reference crops among the sample households
During the reference period (kharif 2015-16), both NU and NCU were available in the market before
the implementation of the policy of mandatory production and distribution of NCU in the sample area.
Therefore, an effort had been made in the study to compare the impact of NU and NCU on the production
and productivity of paddy and tur crops in Karnataka (Tables 6.1 and 6.2). It can be seen from Table 6.1
that there had been a positive impact on both the main product and yield of paddy. The average yield of
paddy was high in the case of farmers who applied NCU (28.94 quintals/ acre) as compared to those used
NU (26.11 quintals/ acre). The per cent change in yield due to the application of NCU over NU worked out
at 10 per cent. This increase in yield was found statistically significant at five per cent level. Similarly,
the average by-product yield shown an increase from 60.29 quintals/ acre with the application of NU to
62.37 quintals per acre with the application of NCU. The per cent change in by-product yield due to the
application of NCU in place of NU amounts to three per cent. However, the price of the main product was
found relatively the same for paddy (Rs. 1804 to Rs. 1810 per quintal) for the reference period. In fact,
there had been a six rupee per quintal decline in the case of NCU, and hence, the percentage change
shown a negative sign, which might be due to a difference in the management practices adopted by
farmers and market imperfections. As far as the price of by-product was concerned, the per cent change
in respect of NCU as compared to NU amounts to 15 per cent. The increase in the price of by-product
from Rs. 71/ bundle (with NU) to Rs. 84/ bundle (with NCU), might be attributed to the application of
NCU also along with many other factors, considering that many farmers had expressed that there had
51
Impact of Neem Coated Urea on Production, Productivity and Soil Health in Karnataka

been an increase in the quality of both yield and by-products. Interestingly, both the prices were found
statistically non-significant. In contrast to prices, both the values of the main product and by-product
have jumped in the case of NCU appliers. The per cent change in respect of NCU vis-a-vis NU amounts
to nine per cent in the case of main product and to almost two times (18%) in the case of by-product.
Nevertheless, the value of main product was found statistically non-significant, while the value of by-
product was found statistically significant at five per cent level.
Table 6.1: Impact of NCU on production and marketing of paddy
(Quintals / Acre)
Particulars NCU NU t-Value % change in NCU over NU
Main product yield 28.94 26.11 2.65** 9.78
By-product Yield 62.37 60.29 2.38* 3.33
Price of main product 1804 1810 0.82 Ns -0.33
Price of by-product (Rs/ bundle) 84 71 1.11Ns 15.46
Value of main product 52,218 47268 1.14Ns 9.47
Value of by-product 5,248 4,289 2.46** 18.27
Note: ***, ** & * indicate 1, 5 and 10 per cent level of Significance respectively
Table 6.2 reveals the impact of NCU on the production and marketing of tur crop. In contrast to paddy,
the application of NU or NCU shown a negative impact on both the main product and by-products of tur
for the reference period, mainly due to drought conditions prevailing in the study area. There had been a
successive droughts in the northern part of Karnataka over the last two years (2014-15 to 2015-16). As a
result, the average yield of tur has remained relatively the same for farmers applying NCU (two quintals/
acre) and for those used NU (2.04 quintals/ acre). The per cent change in respect of yield due to the
application of NCU in place of NU was negative at two per cent. Further, this decrease in yield was found
statistically significant at five per cent level. Similarly, the average by-product yield was shown a slight
decrease from 2.47 quintals/ acre with the application of NU to 2.37 quintals/ acre post NCU use. The
per cent change in the by-product yield due to the application of NCU in lieu of NU was negative at four
per cent and was statistically non-significant. However, the price of main product was found relatively
the same for paddy produce (Rs. 1804 to Rs. 1810 per quintal) for the reference period. In fact, there
had been a six rupee per quintal decline in the case of NCU and hence, the percentage change shown a
negative sign which might be due to the differences in the management practices adopted by farmers and
market imperfections. As far as the price of by-product was concerned, the per cent change in NCU over
NU worked out to 15 per cent. The increase in the price of by-product from Rs. 71/- per bundle (with NU)
to Rs. 84/- per bundle (with NCU), might be attributed to the application of NCU also along with many
other factors. These results corresponds to the perceptions of farmers that there had been an increase
in the quality of both yield and by-products. Interestingly, both the prices were found statistically
non-significant. In contrast to prices, the values of both the main product and the by-product shown an
increase in the case of NCU appliers. The per cent change in NCU over NU amounts to nine per cent in the
case of main product, and to almost two times (18%) in the case of by-product. Nevertheless, the value
of the main product was found statistically non-significant, while the value of by-product statistically
significant at five per cent level.
52
Impact of Neem Coated Urea on Production, Productivity and Soil Health in Karnataka

Table 6.2: Impact of NCU on production and marketing of Tur(Quintals / Acre)
Particulars NCU NU t-Value % change in NCU over NU
Main product yield 2.00 2.04 2.47** -2.00
By-product yield 2.37 2.47 0.88Ns -4.22
Price of main product 7627.33 7790.17 2.33** -2.13
Price of by-product 156.55 115.99 2.56*** 25.91
Value of Main product 15254.66 15891.94 1.07Ns -4.17
Value of by-product 371.02 286.49 3.94* 22.78
Note: ***, ** & * indicate 1, 5 and 10 per cent level of Significance respectively
6.2. Impact on cost of cultivation of reference crops
The impact of NCU on the input costs of paddy and tur crops are presented in Tables 6.3 and 6.4. To
assess the impact of NCU on input costs, parameters such as the cost of pest and disease control, the cost
of weed management, the cost of NCU or NU, and the cost of other fertilizers were considered. Table 6.3
gives a comparison of input costs of paddy in respect of NCU and NU users. A perusal of the table reveals
that out of all the selected inputs, the cost of other fertilizers alone accounts for more than half of the
share (60% (Rs. 8080/- per acre)) in the case of NCU farmers and 55% (Rs. 6870/- per acre among NU
farmers), followed by the cost of pest and disease control (accounted for 32% (Rs. 4346/- per acre) in the
case of NCU farmers and 34% (Rs. 4512/- per acre) in the case of NU users. It was interesting to note that
excepting the cost of other fertilizers, all other selected input costs shown decrease in the case of paddy
crop. The extent of cost decrease was about four per cent each in the case of pest and disease control,
weed management, and NCU/ NU itself in respect of NCU users vis-a-vis NU users. But the cost of pest and
disease control values were found statistically significant at one per cent level, the cost of management
was found significant at five per cent level, while the cost of NCU/ NU was found non-significant. In the
case of cost of other fertilizers, the per cent change over in respect of NCU and NU users was as high as
15 per cent and was found statistically significant at one per cent level. Overall, the total cost of selected
inputs shown an increase with respect to NCU users by seven per cent as compared to NU users, and was
found statistically significant at five per cent level.
Table 6.3: Impact of NCU on input costs of paddy(Rs / Acre)
ParticularsNCU NU
t-Values% change in NCU over NUValue (Rs) % Value (Rs) %
Cost of pest and disease control 4346 32.00 4512 34.00 2.44* -3.84
Cost of weed management 491 4.00 509 4.00 2.76** -3.56
Cost of NCU / Normal Urea 627 5.00 650 5.00 1.16Ns -3.71
Cost of other fertilizers 8080 60.00 6879 55.00 2.93*** 14.86
Total Cost 13544 100.00 12550 100.00 2.67** 7.34
Note: ***, ** & * indicate 1, 5 and 10 per cent level of Significance respectively
53
Impact of Neem Coated Urea on Production, Productivity and Soil Health in Karnataka

A comparison of input costs of tur among NCU and NU users is presented in Table 6.4. Like paddy crop,
the cost of other fertilizers was the major cost among the selected inputs in tur cultivation, i.e., 53 per
cent (Rs. 2661/- per acre) in the case of NCU users, whereas, it was 48 per cent (Rs. 1297/- per acre)
for NU users. Accordingly, the increased cost in respect of NCU farmers was 51 per cent as compared to
NU farmers, yet, it was found statistically non-significant. The second most important cost was the cost
on pest and disease control, with NU users accounted for about 45 per cent (Rs. 1210/- per acre) of the
selected input costs, whereas, it was almost half of it (24%) in the case of NCU users. The decrease in
the cost of pest and disease control in the case of NCU farmers relative to NU farmers may be due to
pesticide/ neem content present in NCU. However, the figures were found statistically non-significant.
On the other hand, the cost of weed management was higher (17%) in the case of NCU farmers relative
to NU users (11%); the increase in cost amounts to 64 per cent and was significant at one per cent level.
Although the cost of NCU shown an increase to an extent of 31 per cent in disparity to NU, the per cent
contribution to the total cost shown a reduction from eight per cent to six per cent. Based on the table it
can be concluded that there has been an increase in the cost up to 45 per cent in respect of NCU users in
relation to NU users in the case of tur crop, but the results were statistically non-significant. It is difficult
to generalize these results, given the prevalence of drought in the study area during the reference period
and more importantly because of huge difference in the sample size of NCU (174 farmers) and NU users
(26 farmers).
Table 6.4: Impact of NCU on input costs of tur(Rs / Acre)
ParticularsNCU NU
t-Values% change in NCU over NUValue (Rs) % Value (Rs) %
Cost of pest and disease control 1208 24.22 1210 44.50 0.722Ns -0.23
Cost of weed management 838 16.80 302 11.10 2.22* 63.95
Cost of NCU/ Cost of Normal Urea 279 5.59 213 7.82 0.76Ns 30.97
Cost of other fertilizers 2661 53.38 1297 47.69 1.11Ns 51.26
Total cost 4986 100.00 2720 100 0.69Ns 45.44
Note: ***, ** & * indicate 1, 5 and 10 per cent level of Significance respectively
6.3. Economic feasibility of NCU: a partial budgeting framework
A partial budget method was used for assessing the incremental income based on a small change in farm
business due to NCU application. The partial budgeting technique gives alternatives, but it does not
determine the most desirable enterprises for farm business, as it requires a complete budgeting. In the
present study, a partial budgeting framework was estimated with the variables such as additional income,
reduced costs, reduced income and additional costs through a small change in NCU use vis-a-vis NU. The
budget indicates only whether the change has increased/ decreased/ no change in net income due to the
adoption of NCU. Also, the partial budget compares both the positive and negative effects of a change in
NCU use relative to NU on incremental income from reference crops.
The impact of NCU, based on a partial budgeting technique considering added and reduced costs due
to NCU application was estimated (Table 6.5). It can be seen from the table that there had been a
54
Impact of Neem Coated Urea on Production, Productivity and Soil Health in Karnataka
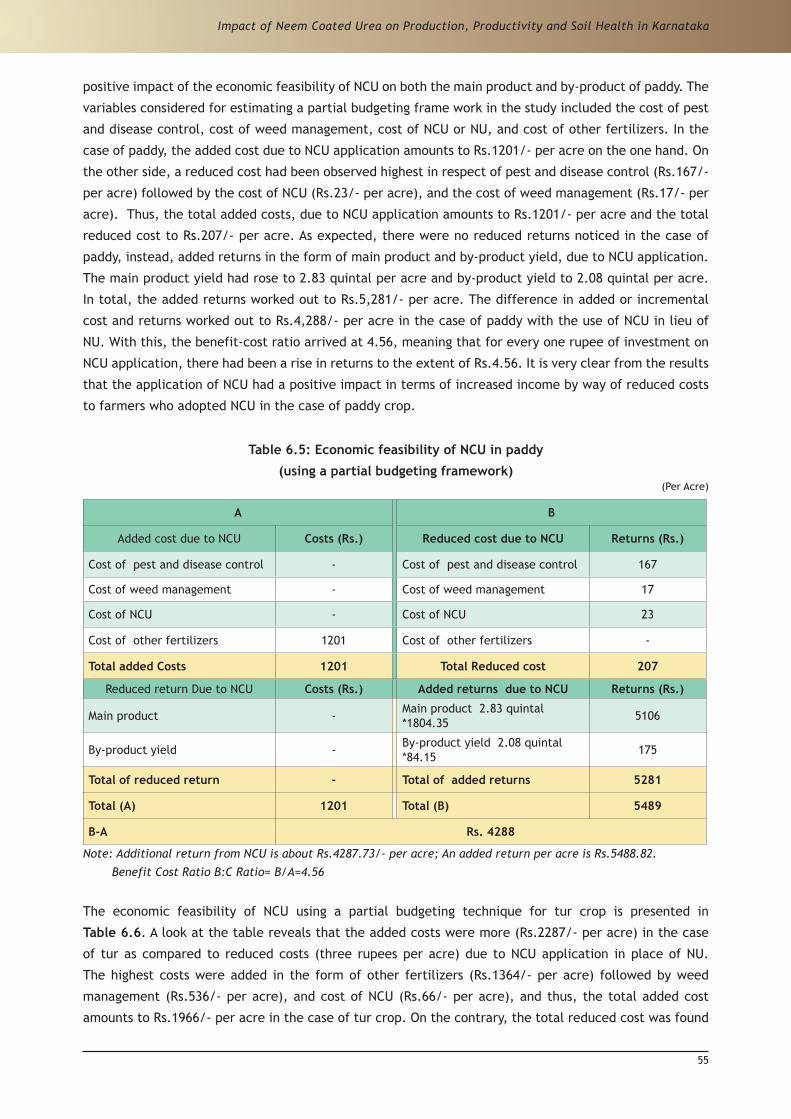
positive impact of the economic feasibility of NCU on both the main product and by-product of paddy. The
variables considered for estimating a partial budgeting frame work in the study included the cost of pest
and disease control, cost of weed management, cost of NCU or NU, and cost of other fertilizers. In the
case of paddy, the added cost due to NCU application amounts to Rs.1201/- per acre on the one hand. On
the other side, a reduced cost had been observed highest in respect of pest and disease control (Rs.167/-
per acre) followed by the cost of NCU (Rs.23/- per acre), and the cost of weed management (Rs.17/- per
acre). Thus, the total added costs, due to NCU application amounts to Rs.1201/- per acre and the total
reduced cost to Rs.207/- per acre. As expected, there were no reduced returns noticed in the case of
paddy, instead, added returns in the form of main product and by-product yield, due to NCU application.
The main product yield had rose to 2.83 quintal per acre and by-product yield to 2.08 quintal per acre.
In total, the added returns worked out to Rs.5,281/- per acre. The difference in added or incremental
cost and returns worked out to Rs.4,288/- per acre in the case of paddy with the use of NCU in lieu of
NU. With this, the benefit-cost ratio arrived at 4.56, meaning that for every one rupee of investment on
NCU application, there had been a rise in returns to the extent of Rs.4.56. It is very clear from the results
that the application of NCU had a positive impact in terms of increased income by way of reduced costs
to farmers who adopted NCU in the case of paddy crop.
Table 6.5: Economic feasibility of NCU in paddy
(using a partial budgeting framework)(Per Acre)
A B
Added cost due to NCU Costs (Rs.) Reduced cost due to NCU Returns (Rs.)
Cost of pest and disease control - Cost of pest and disease control 167
Cost of weed management - Cost of weed management 17
Cost of NCU - Cost of NCU 23
Cost of other fertilizers 1201 Cost of other fertilizers -
Total added Costs 1201 Total Reduced cost 207
Reduced return Due to NCU Costs (Rs.) Added returns due to NCU Returns (Rs.)
Main product - Main product 2.83 quintal *1804.35 5106
By-product yield - By-product yield 2.08 quintal *84.15 175
Total of reduced return - Total of added returns 5281
Total (A) 1201 Total (B) 5489
B-A Rs. 4288
Note: Additional return from NCU is about Rs.4287.73/- per acre; An added return per acre is Rs.5488.82.
Benefit Cost Ratio B:C Ratio= B/A=4.56
The economic feasibility of NCU using a partial budgeting technique for tur crop is presented in
Table 6.6. A look at the table reveals that the added costs were more (Rs.2287/- per acre) in the case
of tur as compared to reduced costs (three rupees per acre) due to NCU application in place of NU.
The highest costs were added in the form of other fertilizers (Rs.1364/- per acre) followed by weed
management (Rs.536/- per acre), and cost of NCU (Rs.66/- per acre), and thus, the total added cost
amounts to Rs.1966/- per acre in the case of tur crop. On the contrary, the total reduced cost was found
55
Impact of Neem Coated Urea on Production, Productivity and Soil Health in Karnataka

negligible (i.e. three rupees per acre). Similarly, reduced returns were noticed in the case of tur crop
both in terms of the main product and by-product yield in respect of farmers applied NCU in place of NU.
The declined quantity of main product amounts to 0.04 quintals/ acre (Rs.305/- per acre) and by-product
to 0.10 quintal per acre (Rs.16/- per acre), and thus, the total reduced returns work out to Rs.321/- per
acre. As both the added costs and reduced returns were noticed in the case of tur (Side A), the total loss
had been valued at Rs. 2,287/- per acre. On the other hand, reduced costs and added returns in Side
B were only three rupees per acre. Hence, the difference in additional returns (A-B) obtained by tur
farmers arrived to Rs -2,284/- per acre due to the adoption of NCU fertilizers in place of NU. Thus, it was
clear from the results that the application of NCU has had a negative impact on tur farmers in terms of
its cultivation.
Table 6.6: Economic feasibility of NCU in tur (using a partial budgeting framework)
(Per Acre)
A B
Added cost due to NCU Costs (Rs.) Reduced cost due to NCU Returns (Rs.)
Cost of pest and disease control - Cost of pest and disease control 3
Cost of weed management 536 Cost of weed management -
Cost of NCU 66 Cost of NCU -
Cost of other fertilizers 1364 Cost of other fertilizers -
Total added Costs 1966 Total Reduced cost 3
Reduced return Due to NCU Costs (Rs.) Added returns due to NCU Returns (Rs.)
Main product 0.04 quintal *7627.33 305 Main product -
By-product yield 0.10 quintal*156.55 16 By-product yield -
Total of reduced return 321 Total of added returns -
Total (A) 2287 Total (B) 3
B-A Rs. 2284
Note: Additional return from NCU is about Rs.- 2284/- per acre ; An added return per acre is Nil
Benefit Cost Ratio B:C Ratio= B/A= Nil
6.4. Impact on soil heath and crop growth
Soil texture, moisture retention, water infiltration, soil softness and compaction are the soil characteristics,
which determine suitable conditions for the uptake or intake of nutrients from soils for plant growth.
Although these characteristics are technical in nature, which requiring scientific tests to understand, we
have attempted to present the perceptions of farmers regarding these characteristics of soil in this section,
post the application of NCU? The results are presented in Table 6.7. It can be observed from the table
that, overall, 76 per cent of the farmers had noticed improvements in soil health post NCU use, while the
proportion was 77 per cent in the case of paddy farmers and 71 per cent in respect of tur farmers.
Out of these farmers, overall, about 98 per cent had noticed an improvement in soil moisture retention
and water infiltration capacity of the soil systems. About 72 per cent accepted that there had been
56
Impact of Neem Coated Urea on Production, Productivity and Soil Health in Karnataka

an improvement in soil softness. More than half of them also had observed that there was a decrease
in compaction of soil and an increase in texture. However, in the case of paddy farmers, a majority of
them (more than 59 %) had stated that there was an improvement in all these soil characteristics post
NCU application. Similarly, in the case of tur farmers, a majority (more than 95%) had observed an
increase in soil moisture retention capacity of the soil systems and an improvement in water infiltration
characteristics. About 40 per cent of tur farmers also had perceived an improvement in soil softness, but
only five per cent each had observed that the soil texture had improved with a decrease in compaction.
Table 6.7: Impact of NCU on soil health improvement(% of farmers)
Particulars Paddy Tur Overall
Texture improved 59.43 5.00 50.79
Soil moisture retention increased 99.05 95.00 98.41
Improvement in water Infiltration 96.22 100.00 97.61
Improvement in soil softness 78.30 40.00 72.22
Compaction decreased 60.37 5.00 51.58
% of farmers noticed improvements in soil health post NCU application 76.81 71.42 75.90
57
Impact of Neem Coated Urea on Production, Productivity and Soil Health in Karnataka

Professor seeing NCU on hand to distinguish it from NU
Field Investigators interacting with the Agriculture Officers
58
Impact of Neem Coated Urea on Production, Productivity and Soil Health in Karnataka

CHAPTER VISUMMARY, CONCLUSIONS AND POLICY SUGGESTIONS
7.1. Background
Out of 17 essential nutrients required for normal growth of crops and reproduction, nitrogen (N) accounts
for a substantial share. Urea is one of the most widely used sources of nitrogen fertilizers in India. It has
a high nitrogen content (46%), relative to many other popular nitrogen fertilizers. When urea is applied
to soil, it sets transformed to ammonical (NH4+) form first, and after its hydrolysis, it gets converted
in to nitrite (NO2-) followed nitrate (NO3-) forms through the process of nitrification. Most of the crop
plants use nitrate as a source of nitrogen except rice which prefers ammonical form to nitrate. Although
nitrification is a necessary phenomenon for making nitrogen available to crops, a rapid nitrification is one
of the key processes that encourages nitrogen losses from the soil. Also, nitrogen in nitrate form is highly
mobile and gets lost through the process of leaching, especially under irrigated conditions. Nitrogen
Use Efficiency (NUE) is found below 33 per cent at the global level, while the unaccounted 67 per cent
escapes through different routes during the process of de-nitrification, which may contribute to the
contamination of water bodies, and the atmosphere. Moreover, the supply of subsidized urea has been
going on for industrial use, creating scarcity during the sowing season in the process.
Coating neem on normal urea (NCU), has proved, based on the agronomical trials at research and farm
levels that crop yields increase with the application of NCU as compared to NU. The government has
made mandatory the production of NCU (notification dated 25.05.2015) recently. This policy intervention
is mainly aimed at controlling an excessive use of urea which is observed to be the soil health and
thereby negatively affecting the yield levels of crops. The major advantages of NCU use vis-a-vis Normal
Urea (NU) observed from the literature are: increased yield due to a sustained release of nitrogen;
improvement in soil health; increased nitrogen use efficiency; reduction in losses of nitrogen due to
leaching, ammonization and de-nitrification; reduction in pest attack; prevention of diversion of urea
for use in industries; and increased saving on subsidy (approximately Rs. 6500 crores/year). Thus, an
increased NUE and a decreased nitrogen fertilizer application to crops can contribute to the conservation
of air, water quality, soil fertility and soil health to a large extent.
On the other hand, both the state and central governments have been implemented several programmes
focused on soil health improvement and sustainability. A recent programme, Soil Health Card Scheme
(SHCS), launched on 19th February, 2015, by the Government of India, aims at improving the yield levels
of crops through a judicious use of fertilizers. Under the scheme, soil health cards have been issued to
individual farmers containing crop-wise recommendation of nutrients and fertilizers required for plant
growth. Thus, the Department of Fertilizers (DoF) and its own Integrated Nutrient Management (INM)
division of the Ministry of Agriculture and Farmers Welfare entrusted a study to Agricultural Development
and Rural Transformation Centre (ADRTC) of the Institute for Social and Economic Change (ISEC), Bengaluru,
to assessing the impact of NCU on production, productivity and soil health and to document the status and
implementation of soil health card scheme with a view to improving the efficiency of these significant
initiatives. It is to be noted that both these initiatives of the central government, mandatory production
and distribution of NCU and Soil Health Card Scheme, are aimed at improving productivity and soil health
through a prudent use of fertilizers.
59
Impact of Neem Coated Urea on Production, Productivity and Soil Health in Karnataka
The specific objectives of the study are as under:
Ø To analyze the trends in usage and prices of Urea vis-a-vis NCU in the state of Karnataka.
Ø To analyze the adoption behavior of NCU among the selected farmers across irrigated and un-
irrigated regions.
Ø To analyze the impact of adoption of NCU on crop productivity and farmers’ income.
Ø To document the status and implementation of soil health card scheme in the state.
Ø To suggest suitable policy measures for adoption of NCU and implementation of SHCs scheme in the
state.
To fulfil the objectives, both the primary and secondary data were collected from four districts of
Karnataka. Both paddy and tur (kharif) crops under irrigated and un-irrigated conditions were selected.
Two districts, namely, Davanagere and Raichur for paddy, Kalburgi and Vijayapura for tur were selected,
based on highest area, and urea consumption under selected crops. From each selected district, two
taluks were selected based on the same criterion. Thus, Davanagere and Harihara taluks from Davanagere
district, and Manvi and Sindhanur taluks from Raichur district were selected for the paddy. Similarly,
Chittapur and Kalburgi taluks from Kalburgi district, and Sindagi and Muddebihal taluks from Vijapura
district were selected for tur crop.
From the selected taluks, two clusters of villages comprising 3-4 villages per cluster were selected for the
primary survey. A sample of 50 farmers from each taluk, adding to 100 farmers in the case of each district,
ultimately totalling to 200 farmers for each crop was selected for the study. Households were selected
randomly for assessing the use of NCU fertilisers and advantages of SHC scheme, and their impact on crop
production and soil health. The post classification of households included two categories i.e., users of
NCU and non-users of NCU (those used Normal Urea) mainly to differentiate between the impact of NCU
and other mixtures. Further, an adequate care was taken to ensure that the selected crops were grown
under irrigated/un-irrigated conditions in the state. Thus, a total of 200 (NCU/ NU) farmers for each
crop were interviewed. The post-classification of the data revealed that a total of 138 NCU users and 62
NU users in the case of paddy crop, and 28 users of NCU and 178 NU users with respect to tur crop. An
adequate representation was given to different farm-size groups based on operational land holdings.
7.2. Summary of Findings
7.2.1. Trends in urea consumption in Karnataka state
The consumption of urea shows an increase from 933 thousand MT in 2012-13 to 1480 thousand MT during
2015-16 in the state of Karnataka, which is 59 per cent higher as compared to the previous period. Across
districts, excepting Bangalore (R), Chikmagalur and Kolar, all other districts have shown a positive trend
in terms of urea consumption. The decrease in demand for urea might be attributed to a higher land
conversion to real estate, successive droughts and depleting water resources, shift in the cropping pattern
from water-intensive crops to dry-land crops and, the farming community moving away from farm to non-
farm activities. The top five districts, in terms of an increased urea consumption over the period 2000-02
to 2012-15, include North Kannada (178%) followed by Gadag (113%), Haveri (109%), South Kannada (98%)
60
Impact of Neem Coated Urea on Production, Productivity and Soil Health in Karnataka

and Koppal (93%) districts. The main reason for an increase in urea consumption among other in the state
has been crop diversification (from food crops to commercial crops), increased awareness with respect to
a balanced use of fertilizers among the farming community, lower price (subsidized price) of urea among
other primary nutrients etc.
The share of urea consumption for the reference period in the state amounts to 38 per cent in the total
fertilizer consumption with an annual growth rate of 4.35 per cent, which could be attributed to a
rapid expansion of irrigation, spread of HYV seeds, introduction of Retention Price Scheme-2, distribution
of fertilizers to farmers at affordable prices, expansion of dealers’ network, improvement in fertilizer
availability. Across districts, highest urea consumption has been noticed in respect of Ramanagara (70%)
followed by Bagalkot (49%), Bijapur (45%), Mandya and Belgaum (43% each). Excepting Yadgir district, the
share of urea consumption shows a fluctuation of 28 per cent to 42 per cent in respect of the remaining
districts of the state. The annual growth rate in consumption of urea ranges from one to 12 per cent
across districts. As regards urea price, there was no change observed in the price line over the last decade
in that it shows a constant trend at Rs. 280 to 285 per 50 kgs till 2014-15 before climbing to Rs. 295 per
50 kgs during 2015-16 with the introduction of NCU in the market. The share of NCU/ NU distribution was
found highest in respect of Belgaum district (11%) followed by Bellary (nine per cent) and Raichur (eight
per cent) during 2015-16.
7.2.2. Socio-economic characteristics of the sample households
All farmers from the sample villages were males with an average age of 44 years; their average family
size was seven, of which three were engaged in farming both in the case of paddy and tur with a farming
experience of more than 24 years. With regard to education on the whole, farmers had completed primary
schooling (36%) followed by pre-university (28%). A majority of the sample farmers belong to general
category (45%) and Other Backward Classes (OBCs) (39%), followed by Schedule Caste (10%) and Schedule
Tribe (7%) at the aggregate. Out of the sample farmers, about 98 per cent were engaged in agriculture
and allied activities and the rest were depended on subsidiary activities.
The average net operational landholding in the study region came to 11.79 acres/ household, but it was
comparatively more in the case of paddy farmers (12.69 acres/ household) than in respect of tur-farmers
(10.88 acres/ household). Expectedly, large farmers occupied an average area of 23.53 acres (highest)
(26.61 acres in respect of paddy and 20.44 acres in respect of tur) followed by medium farmers with an
average area of 8.44 acres (8.34 acres in paddy and 8.44 acres in the case of tur), and marginal and small
farmers with an average area of 3.40 acres (3.13 acres in the case of paddy and 3.66 acres in respect of
tur). Paddy crop occupied a major area (90%) under irrigation while tur was mainly grown under rainfed
conditions in the state. The major sources of irrigation among the sample farmers were bore wells (33%
of the area) followed by canals (31% of the area), open/ dug wells (seven per cent of the area), with the
remaining area covered by tanks, ponds, streams etc. The crops grown by paddy-farmers include paddy,
maize, cotton and other crops such as vegetables, pulses and oilseeds; similarly, tur-farmers cultivated
tur, maize, bajra, onion, cotton and green gram (kharif 2015). As expected, cropped area under paddy
was highest across all categories of paddy farmers and vice-versa, in respect of tur. Overall, maize and
cotton were the second and third important crops grown under irrigated areas, while, bajra and green
gram under un-irrigated areas.
61
Impact of Neem Coated Urea on Production, Productivity and Soil Health in Karnataka
Overall, NCU users tend to purchase higher quantities (571 kgs/ household) of fertilizers as compared to
NU users (526 kgs/ household) in the study area. Similar was the situation in respect of both paddy and
tur-farmers. However, paddy farmers were observed buying slightly higher quantities of urea in total
as compared to tur-farmers, mainly due to the fact that irrigated crops (like paddy) require more of
fertilizers than un-irrigated crops (like tur). The price of NCU averages slightly higher (Rs. 362/- per 50
kg bag) vis-a-vis in contrast to NU (Rs. 347/- per 50 kg bag), mainly due to the additional cost of neem
coating of NU. A majority of the farmers purchased NCU/ NU fertilizers from nearby markets, despite the
fact that the distance was a little more for tur farmers and hence, the transport costs were comparatively
higher.
The total paid-out cost incurred by paddy farmers worked out to Rs. 29,712/- per acre for kharif 2015 as
compared to Rs.27,729/- for kharif 2014, whereas in the case of tur, the cost worked out to Rs. 10,902/-
per acre for kharif 2015 as against Rs. 10,977/- per acre for kharif 2014. The increased cost was found
distributed across all inputs used in the production of paddy, while the overall cost had remained relatively
the same in respect of tur, in view of consecutive droughts in the tur area. Among these inputs, the major
costs in the case of paddy include chemical fertilizers (both on urea and other fertilizers) followed by
plant protection chemicals, whereas, in the case of tur, major costs include ploughing and sowing charges
followed by harvesting and threshing charges. Of which, the cost on plant protection chemicals shown a
relative decrease for kharif 2015 as compared to kharif 2014 in respect of paddy, perhaps due to pesticide
effect of neem presence in NCU fertilizers. It is interesting to note that the usage of NCU/ NU in the case
of tur was negligible as compared to paddy crop.
The total paddy output (main and by product) in kharif 2015 was to the tune of 28 quintals per acre of
main product in place of 28 quintals per acre, and 67 quintals of byproduct in place of 62 quintals in
kharif 2014, this might be due to the application of NCU instead of NU. Accordingly, the net returns during
2015 was highest among marginal & small farmers followed by large farmers, and medium farmers. The
output of both main and byproduct were declined to two quintals/ acre in respect of tur during kharif
2015 as compared to kharif 2014 (3 quintals/ acre) due to drought. Consequently, both gross returns and
net returns were decreased.
Overall, there had been a good trend noticed in the study area in that institutional sources (55%) dominate
the non-institutional sources (45%) in terms of credit availed of by the sample farmers of both paddy
and tur crops. It was apparent that paddy-farmers had availed of more credit than tur-farmers, as the
cost of cultivation was high in the case of paddy. A substantial amount of credit was disbursed by Land
Development Banks followed by Commercial Banks, Regional Rural Banks, and Cooperative banks for the
purpose of seasonal crop production and purchase of inputs and agricultural implements/ machineries.
So far a very small proportion of farmers attended training programmes on fertilizer application organized
by various institutions. Of which, Department of Agriculture/ Horticulture at Taluk/ District level (one of
the major source of trainings/ workshops), conducted very short-period trainings - one to five days - for
these farmers.
7.2.3. Status of awareness and application of NCU
Although both the state and central governments have taken steps towards creating awareness among
62
Impact of Neem Coated Urea on Production, Productivity and Soil Health in Karnataka

farmers regarding NCU before distribution (kharif 2015) across the state, the awareness level among
overall farmers varies from only 16 per cent in the case of medium to 13 per cent in the case of large
to 12 per cent in the case of marginal and small categories of farmers. However, the level of awareness
was much higher among paddy (irrigated) farmers (26% of medium, 22% of large, and 20% of marginal and
small categories of farmers) in Karnataka as compared to tur (un-irrigated) (about six per cent of medium,
and four per cent each of large, and medium & small categories of farmers) farmers due to consecutive
drought situations in the tur growing areas of the state. With regard to sources of information on NCU,
the officials of State Department of Agriculture (Agricultural Officers and Farmer Facilitators) acted as
a major source of information for both paddy and tur farmers across all categories, followed by fellow
farmers, and input suppliers (companies). Similarly, a higher proportion of paddy farmers had noticed a
difference between NCU and NU use as compared to tur-farmers in that the proportion ranged from 18
to 24 per cent in case of paddy farmers, while it was just four to six per cent in the case of tur-farmers.
On-the-bag leaf was the major indicator for differentiating between NCU and NU followed by colour, and
price in respect of both paddy and tur-farmers.
A majority of paddy and tur-farmers started applying NCU after 2015-16 only. As usual, all the respondent
farmers were found to have applied NCU/ NU to paddy by way of broadcasting with none of them sprayed,
drilled and applied through fertigation, whereas, in the case of tur, drilling was the common method
employed. In respect of paddy, a major quantity of NCU/ NU was found applied during vegetative growth
(38-41% of the total quantity) followed by post weeding (38%), while in the case of tur, a major quantity
(45-58% of the total quantity) was found applied during the basal stage itself followed by maturity stage.
As regards the impact of NCU on yield, a majority of paddy (85%) farmers had expressed that there had
been an increase in yield to an extent of 12 per cent in contrast to tur farmers, in that a majority (>80%)
had noticed no change in yield, due to the application of NCU in place of NU. The costs incurred on
pest and disease control and weed management shown a decline to the tune of 18 per cent, and 20 per
cent, respectively, as revealed by 60 per cent and 21 per cent of paddy and tur farmers, respectively.
But a majority (>80%) of tur-farmers found no change in the cost of pest and diseases control, and weed
management. Conversely, a majority of both paddy and tur farmers haven’t observed a change in the
cost of NCU/ NU, due to the fact that both NCU and NU were sold at the same rate by input dealers
in the market. In addition, more than 59 per cent of paddy farmers also noticed that there had been
an improvement in soil health, quality of grains, and market acceptability of grains because of NCU
application, whereas, the proportion was 15-18 per cent in the case of tur. NCU use has not changed the
cost of other fertilizers, both in case of paddy and tur. Regarding the impact of NCU on soil characteristics,
according to more than 50 per cent of the overall farmers’ perceptions, there had been an improvement
in soil health post the NCU application as compared to NU. On the whole, it can be concluded that there
are positive benefits of NCU use as compared to NU, as observed by a majority of paddy farmers and a
small proportion of tur-farmers. However, it is difficult to generalize the results for a single season as the
availability of NCU in the market began from May 2015 onwards. Therefore, it requires some more time
before assessing the impact of NCU on the reference crops.
Further, there had been an improvement in the soil health, quality of grains, and their market acceptability
post the adoption of NCU in place of NU, as reported by 59 per cent, 68 per cent, and 70 per cent of
paddy-farmers respectively. On the other hand, more than 80 per cent tur farmers had observed no
change in soil health, quality of grains, and their market acceptability post the application of NCU.
63
Impact of Neem Coated Urea on Production, Productivity and Soil Health in Karnataka

Similarly, about 53 per cent of paddy farmers perceived the quality of NCU as being good, whereas, about
69 per cent of tur farmers recognized no change in quality. However, a majority (64%) had expressed
that the NCU availability had been adequate during the reference period as compared to NU earlier.
The contrasting results might be true for the reason that the benefits of NCU use are better reflected
under favorable climatic conditions such as an adequate moisture availability and timely application.
The situation appeared reverse in the case of tur farmers because of the prevailing drought conditions in
those areas.
Regarding the problems faced, about 67 per cent of paddy and 64 per cent of tur farmers had expressed
that they faced problems in the adoption of NCU fertilizer. At the aggregate, higher prices of NCU, lack of
information, and lack of awareness regarding NCU benefits as compared to NU were the major problems
being faced by both paddy and tur farmers in Karnataka. Hence, they suggested that there is a need for
spreading awareness regarding NCU and its potential benefits, considering that the union government as
a policy response, has made the production of NCU, mandatory.
7.2.4. Awareness and adoption level of soil testing technology
Although, there were many government schemes being implemented in the state for testing of their
soil systems free of cost, farmers had reported that they spent, on an average, Rs.50/- per soil sample
testing. The average distance from the field to soil test laboratories happened to be 46 kms in the case
of paddy farmers and 26 kms for tur farmers. Overall, relatively seven to eight acres had been covered
under soil test schemes as per the details provided by paddy and tur farmers in the state. However, a
majority (94% of paddy and 96% of tur) of farmers had got tested their soil at laboratories of KVKs and
State Department of Agriculture.
The State Department of Agriculture was the major source involved in spreading awareness regarding soil
testing followed by KVKs and SAUs in the state, as revealed by 76 per cent of the overall farmers. It is
obvious that irrigated farmers are more enthusiastic about soil testing with a better network, and hence,
they get information more easily as compared to dry-land farmers. Similarly, again the State Department
of Agriculture and its officials such as Agriculture Officers and Farmer Facilitators were the major actors
in the collection of soil samples for testing.
A greater proportion of farmers had tested soil for understanding the usefulness of soil test technology in
view of their being unaware of anything about this technology and its use earlier, and also for understanding
fertilizer requirements of crops in the case of paddy. Similarly, about 72 per cent and 68 per cent of tur
farmers had articulated that, they were not aware of anything about soil test technology and its use, and
also that for understanding the fertilizer requirements of crops, they got their soil tested. On the other
hand, ‘don’t not know whom to contact for details on soil testing’, followed by ‘do not know how to take
soil samples’, ‘soil testing not required for my field as crop yield is good’, and ‘soil testing laboratories
are located far away’ were the most important reasons for not testing their soil, as expressed by a
majority (75%, 38%, 30% and 20%) of farmers in the order of importance.
Out of the soil-tested farmers, only about eight per cent of the overall farmers (10% of paddy and four
per cent of tur) were aware of Recommended Doses of Fertilizers (RDFs) on the basis of information
provided in soil health cards (SHCs). Among these farmers, a majority (67% of paddy and all tur farmers)
64
Impact of Neem Coated Urea on Production, Productivity and Soil Health in Karnataka

received explanations from the officials of State Department of Agriculture including farmer facilitators
in Karnataka. Although soil testing was done by a meager proportion of the sample farmers, a majority
have not received soil health cards on time. It can be inferred from the results that a majority of farmers
have not followed the recommendations strictly as mentioned in the soil health cards, and in fact,
a majority of famers applied insufficient quantities of fertilizers. Out of all the soil-tested farmers,
about 29 per cent of farmers had reported that SHCs were not distributed on time. However, ‘create
awareness regarding soil test technology’ was the major suggestion given by a majority of farmers (63%)
with proportion being relatively the same in the case of both paddy and tur-farmers.
7.2.5. Impact of NCU application on crop production and soil health
There had been a positive impact on both the main product as well as yield of paddy. The average yield
of paddy was higher in the case of farmers used NCU (28.94 quintals/ acre) as compared to those used NU
(26.11 quintals/ acre). The per cent change in yield due to the application of NCU in place of NU worked
out to 10 per cent. Similarly, the per cent change in by-product yield due to the application of NCU in
place of NU amounts to three per cent. Both the values of main product and by-product have skipped
in the case of NCU appliers, due to an increase in quality of produce. These results corresponds to the
perceptions of farmers that there had been an increase in the quality of both yield and by-products. In
contrast to paddy, the application of NU or NCU shown a negative impact on both main product and by-
products of tur for the reference period, mainly due to successive droughts in the tur growing areas of
Karnataka for the last two years (2014-15 to 2015-16). As a result, the average yield of tur was relatively
the same for farmers used NCU (two quintals/ acre) and for those used NU (2.04 quintals/ acre).
It was interesting to note that excepting the cost of other fertilizers, all other selected input costs shown
a decrease in the case of paddy crop. The extent of decrease was about four per cent each in the case
of pest and disease control, cost of weed management, and the cost of NCU/ NU itself in respect of NCU
users vis-a-vis NU users. In the case of tur, excepting the cost of pest and disease control, all other costs
shown an increase due to scarcity of moisture content during crop growth.
In the case of paddy, there were no reduced returns noticed, instead added returns were observed in
the form of main product and by-product yield due to NCU application. The main product yield shown an
increase of 2.83 quintal per acre and by-product yield shown an increase of 2.08 quintal per acre. The
difference in added or incremental cost and returns worked out to Rs. 4,288/- per acre in the case of
paddy with the use of NCU instead of NU. In contrast, reduced returns were noticed in the case of tur
crop both in terms of main product as well as by-product yield for farmers applied NCU in place of NU.
Regarding the impact of NCU on soil characteristics, farmers’ perceptions correspond to equal proportion
of farmers in respect of an improvement in soil texture, water infiltration rate, moisture retention
capacity, soil compactness and softness in the case of both tur and paddy farmers.
7.3. Conclusions
Considering the various benefits of neem coating and its positive impact on environment, the Union
Government of India has made the production of NCU compulsory across the country. This policy is aimed
at to controlling an excess use of urea in agriculture besides preventing the diversion of subsidized urea
65
Impact of Neem Coated Urea on Production, Productivity and Soil Health in Karnataka

towards industrial purposes. To avoid an adverse impact of fertilizers on soil health and environment, Soil
Health Card Scheme was also introduced in February, 2015. With this backdrop, the study was delegated
to Agriculture Development and Rural Transformation Centre (ADRTC) of Institute for Social and Economic
Change, Bengaluru, for studying the impact of NCU, and SHC scheme on production, productivity and soil
health in India. Based on the findings, the following important conclusions have been drawn:
Ø The consumption of urea has risen from 933 thousand MT in 2012-13 to 1480 thousand MT during
2015-16 in the state of Karnataka which, in other words, is 59 per cent higher as compared to
the previous period. The reasons for an increase in urea consumption in the state include crop
diversification from food crops to commercial crops, increased awareness with respect to a balanced
use of fertilizers among the farming community, lower price (subsidized price) of urea among all
other primary nutrients etc.
Ø From the cropping pattern of the sample farmers, it is evident that paddy crop occupies a major
area (90%) under irrigation, and tur under rainfed conditions in the state. The crops grown by paddy
farmers include paddy, maize, cotton and other crops such as vegetables, pulses and oilseeds,
similarly, tur farmers cultivated tur, maize, bajra, onion, cotton and green gram (including the
reference period (kharif 2015)).
Ø Paddy farmers buy a little higher quantity of urea in total, as compared to tur farmers due to the
fact that irrigated crops (like paddy) require more of fertilizers than un-irrigated crops (like tur).
Ø The average price of NCU is slightly higher (Rs. 362/- per 50 kg bag) in contrast to NU (Rs. 347/- per
50 kg bag), mainly due to an additional cost of neem coating over NU.
Ø There is an increase in paid-out costs of paddy (7%) for kharif 2015 as compared to kharif 2014.
However, there is a reduction in the cost of pest and diseases with the use of NCU, for users of NCU
as compared to NU.
Ø A very meager proportion of farmers have attended training programmes on fertilizer application
organized by the Department of Agriculture/ Horticulture at Taluk/ District level.
Ø The level of awareness is much higher among paddy (irrigated) farmers in Karnataka as compared to
tur (un-irrigated) farmers, mainly due to consecutive droughts in tur areas of the state. Accordingly,
a higher proportion of paddy farmers are able to differentiate between NCU and NU as compared to
tur farmers. However, leaf figure on the bag is the major indicator with which both paddy and tur
farmers differentiate between NCU and NU, followed by colour, and price.
Ø A majority paddy (85%) farmers perceive an increase in yield to an extent of 12 per cent, whereas,
more than 80 per cent of tur farmers find no change in yield, with the application of NCU instead
of NU. With regard to costs on pest and disease control, and weed management, farmers observe a
decrease in the cost in the case of both paddy and tur farmers.
Ø A majority of paddy-farmers perceive an increase in the soil health improvement, quality of grains,
and their market acceptability post the adoption of NCU in place of NU. In contrast, tur farmers
find no change in soil health, quality of grains, and their market acceptability post the application
of NCU.
Ø Higher prices of NCU, lack of information, and lack of awareness regarding NCU benefits as compared
66
Impact of Neem Coated Urea on Production, Productivity and Soil Health in Karnataka

to NU are the major problems faced by both paddy and tur-farmers in Karnataka.
Ø Although, there exist several government programmes aimed at testing soils free of cost, farmers
are spending, on an average, Rs.50/- per sample testing. The State Department of Agriculture is
the major source (76%) of spreading awareness regarding soil testing and method of soil sampling
among the overall farmers, followed by KVKs and SAUs.
Ø To understanding the usefulness of the soil test technology, its use, and also understanding fertilizer
requirements of crops are the major reasons for soil testing in the study areas. Whereas, ‘don’t
not know whom to contact for details on soil testing’, followed by ‘do not know how to take soil
samples’, ‘soil testing not required for my field as crop yield is good’, ‘soil testing laboratories are
located far away’ are the most important reasons for not testing soil.
Ø Out of the soil-tested farmers, only about eight per cent of the overall farmers (10% of paddy
and four per cent of tur) are aware of Recommended Doses of Fertilizers (RDFs) on the basis
of information provided in the soil health cards. Nevertheless, a majority have not followed the
recommendations strictly as mentioned in the cards.
Ø There has been a positive impact on both the main product and yield of paddy. The per cent change
in the main product yield due to the application of NCU in place of NU works out to 10 per cent,
while it is three per cent in the case of by-product. In contrast to paddy, the application of NU or
NCU shows a negative impact on both the main product and by-products of tur for the reference
period, mainly due to successive droughts in the study areas of tur in the state. Further, the cost
of pest and disease control, weed management, and NCU/ NU itself shows decreasing in respect of
paddy farmers using NCU as compared to NU users.
7.4. Policy Suggestions
Ø Based on the above results and discussion, we have derived some policy suggestions, which may
help encourage a judicious use of NCU, and a proper implementation of Soil Health Card scheme.
The major policy suggestions are as follows:
Ø As a majority of farmers perceive NCU as being better than NU, it can be expected that there won’t
be any problem in continuing with the production of NCU across the country. However, special
efforts are required in respect of creating awareness among the farming community regarding
NCU and its associated benefits vis-a-vis NU across the state, as the new policy of the central
government has completely stopped the production of NU. An increase in the yield levels of both
the main product and by-product in the case of paddy crop also supports this statement.
Ø There has been a delay in the distribution of Soil Health Cards across the state under different
programmes related to soil testing, and as a result, farmers are likely to lose their confidence in
these programmes. Therefore, there is a need for promoting farmers’ confidence through a prompt
distribution of SHCs on time.
Ø It is noticed that out of the soil-tested farmers, a small proportion of the farmers possess SHCs with
a few of them following the recommended doses of fertilizers. Hence, there is a need for educating
67
Impact of Neem Coated Urea on Production, Productivity and Soil Health in Karnataka

the farming community regarding the importance of soil health, benefits of soil testing, cards/
report, and the information on SHCs, knowledge about SHC recommendations etc., as part of
encouraging farmers regarding a judicious/ balanced use of chemical fertilizers and optimizing the
crop yield levels. Special training programmes/ camps can be organized for various stakeholders in
the agricultural sector.
Ø For a successful implementation of the SHC scheme, there is a need for capacity building of the
field level staff along with the required facilities and equipments such as Soil Test Laboratories
(STLs), manpower, high quality GPS devices, etc., across the state.
68
Impact of Neem Coated Urea on Production, Productivity and Soil Health in Karnataka

REFERENCES
Agostini, F., Tei. F., Silgram, M., Farneselli, M., Benincasa, P., and Aller, M. F., 2010. Decreasing N
leaching in vegetable crops through improvements in N fertilizer management, Genetic engineering,
biofertilisation, soil quality and organic farming, ed Lichtfouse E. (Springer, Dordrecht, The
Netherlands) Sustainable Agr. Rev. Vol. 4, pp 147–200.
Akiyama, H., Yan, X. and Yagi, K., 2010. Evaluation of effectiveness of enhanced-efficiency fertilizers as
mitigation options for N2O and NO emissions from agricultural soils: meta-analysis. Global Change
Biology, 16(6), pp.1837-1846.
Aziz, E.E. and El-Ashry, S.M., 2009. Efficiency of slow release urea fertilizer on yield and essential oil
production of lemon balm (Melissa officinalis L.) plant. American-Eurasian Journal of Agricultural
and Environmental Science, 5(2), pp.141-147.
Bains, S. S., Prasad, R., Bhatia, P. C. (1971): Use of indigenous materials to enhance the
Biswas, A. K., and Subba Rao, A. (2015). ‘Status paper on Enhancing Nitrogen Use Efficiency - Challenges
and Options’. A paper submitted to Ministry Of Agriculture, Government of India by the Indian
Institute for Soil Science (IISS), Bhopal.
Brahmachari, G., 2004. Neem - an omnipotent plant: A retrospection. Chem. Biochem, 5:408-421.
Bremner, J. M., & Krogmeier, M. J. (1988). Elimination of the adverse effects of urea fertilizer on seed
germination, seedling growth, and early plant growth in soil. Proceedings of the National Academy
of Sciences, 85(13), 4601-4604.
Burns, I.G. (2006). Assessing N fertilizer requirements and the reliability of different recommendation
systems. Acta Hort. 700:35–48.
Dayan, F.E., Cantrell, C.L. and Duke, S.O., 2009. Natural products in crop protection. Bioorganic &
medicinal chemistry, 17(12), pp.4022-4034.
DoF, Ministry of Chemicals and Fertilizers (2014), Indian Fertilizer Scenario, 2013 (2014). Department of
Fertilizers, Ministry of Chemicals and Fertilizers, Government of India, extracted through http://
fert.nic.in/sites/default/files/Indian%20Fertilizer%20SCENARIO-2014.pdf
Economic Survey of Karnataka 2015-16. (2016). Govt. of Karnataka. Extracted from http://des.kar.nic.in/
docs/Economic%20Survey%202015-16_English%20Final.pdf
Esonu BOMN, Opara IC, Okoli HO, Obikaonu C, Udedibie, Iheshiulor OOM (2006). Physiological responses of
laying birds to neem (Azadirachta indica) leaf meal based diets, body weight, organ characteristics
a hematology. Online J. Health Allied Sci, 2: 4-4.
69
Impact of Neem Coated Urea on Production, Productivity and Soil Health in Karnataka

Fageria, N.K., and Baligar, V.C., 2003a. “Fertility management of tropical acid soils for sustainable crop
production. In Handbook of Soil Acidity” (Z. Rengel, Ed.), pp. 359-385. Marcel Dekker, New York.
FAI (2010), Fertilizer Statistics 2010-11. The Fertilizer Association of India, New Delhi.
FAO (2005). Food and Agriculture Organization (FAO). ‘Fertilizer Use by Crop in India’. Land and Plant
Nutrition Management Service, Land and Water Development Division. Food and Agriculture
Organization of the United Nations, Rome.
FAO (2006). ‘Greening Agriculture in India- An Overview of Opportunities’. Report, Food and Agriculture
Organisation of the United Nations, Rome.
FAO, 2015. “World fertilizer trends and outlook to 2018”. Food and Agriculture Organization of the United
Nations, Rome.
Gajalakshmi, S. and S. A. Abbasi, 2004. Neem leaves as a source of fertilizer-cum-pesticide vermicompost.
Bioresource. Technol., 92: 291-296.
Govindachari, T.R., 1992. Chemical and biological investigations on Azadirachta indica (the neem tree).
CURRENT SCIENCE-BANGALORE-, 63, pp.117-117.
GoK (Government of Karnataka), 2016. Department of Agriculture, GoK. ‘Year-wise & Nutrient-wise Use
of Fertilizers in Karnataka State’. Extracted from http://raitamitra.kar.nic.in/imp_agri_stat.html
Grant, I.F., A.C. Tirol. T. Aziz and I. Watanabe, 1983. Regulation of invertebra grazers to enhance biomass
and nitrogen fixation of cyanophceae in Wetland rice field. J. Soil Sci. Soc. Am., 47: 669-675.
Greenwood, D.J., Lemaire, G., Gosse, G., Cruz, P., Draycott, A., Neeteson, J.J. (1989). Decline in
percentage N of C3 and C4 crops with increasing plant mass. Ann. Bot. (Lond.) 66:425–436.
Isman, M.B., 2006. Botanical insecticides, deterrents, and repellents in modern agriculture and an
increasingly regulated world. Annu. Rev. Entomol., 51, pp.45-66.
Jalan, M. L. (1987). Marketing of Agricultural Inputs: A Study of Gorakhpur District. Himalaya Publishing
House.
Janssen, B.H. (1998). Efficient use of nutrients: An art of balancing. Field Crops Res. 56:197–201.
Kak, R.D., 2000. Biocontrol of plant diseases through neem. Proceedings of International Conference
on Integrated Plant Disease Management for Sustainable Agriculture, (ICIPDMSA’00), Indian
Phytopathological Society, IARI, New Delhi, India, pp: 368-369.
Ketkar, C.M., 1983. Crop experiments to increase the efficacy of urea fertilizer nitrogen by neem-by-
products. Proceedings of the 2nd International Neem Conference, (INC’83), Germany, pp: 507-518.
Kumar, R., Mishra, A. K., Dubey, N. K., & Tripathi, Y. B. (2007). Evaluation of Chenopodium ambrosioides
oil as a potential source of antifungal, antiaflatoxigenic and antioxidant activity. International
70
Impact of Neem Coated Urea on Production, Productivity and Soil Health in Karnataka

Journal of Food Microbiology, 115(2), 159-164.
Majumdar, D., & Gupta, N. (2000). Nitrate pollution of groundwater and associated human health
disorders. Indian Journal of Environmental Health, 42(1), 28-39.
MoA&FW, 2015. Demand and supply of chemical fertilizers. Parliament-questions in the Rajya sabha,
Ministry of Agriculture and Farmer’s Welfare, Government of India.
MOA&FW, 2016. Agricultural Statistics at a Glance 2015. (2016). Ministry of Agriculture and Farmers
Welfare (MOA&FW), Government of India. Extracted from http://eands.dacnet.nic.in/PDF/
Agricultural_Statistics_At_Glance-2015.pdf
MoCF, 2013. Indian Fertilizer Scenario, 2013, Department of Fertilizers, Ministry of Chemicals and
Fertilizers. Welfare, Government of India.
Nagalakshmi, D., V .R. B. Sastry, D. K. Agrarwal, R. C. Katigar, and S. V. S Verma, 1996. ‘Performance of
Broiler Chicks Fed alkali treated neem kernel cake. Br. Poultry Sci., 37: 809- 818.
Neeteson, J.J., Booij, R., Whitmore, A.P. (1999). A review on sustainable nitrogen management in
intensive vegetable production systems. Acta Hort.506:17–26.
Oforjindu O (2006). The Toxicity of Graded levels of neem (Azadirachta indica) leaf Meal. B. Agric. Tech.
Project Report, Federal University of Technology, Owerri, Pp.1–34.
Ogbuewu IP, (2008). Physiological responses of rabbits fed graded levels of neem (Azadirachta indica) leaf
meal. M.Sc. Thesis, Federal University of Technology, Owerri.
Rahn, C. (2002). Management strategies to reduce nutrient losses from vegetables crops. Acta Hort.
571:19–25.
Ramappa, K., Kannan, E., & Lavanya, B. (2015). Adoption of recommended doses of fertilisers on soil test
basis by farmers in Karnataka.
Roxburgh, W., 1874. Description of Indian Plants. Today and Tomorrow Printers and Publishers, New Delhi,
India.
Sateesh, M.K., 1998. Microbiological Investigations on die-back disease of neem (Azadirachta indica A.
Juss.). Ph.D. Thesis, University of Mysore. Mysore, India.
Schenk, M.K. (2006). Nutrient efficiency of vegetable crops. Acta Hort. 700:25–38.
Singh, Bijay (2016). Agronomic Benefits of Neem Coated Urea–A Review. International Fertilizer Association
(IFA).
Singh, S., & Shivay, Y. S. (2003). Coating of prilled urea with ecofriendly neem (Azadirachta indica A.
Juss.) formulations for efficient nitrogen use in hybrid rice. Acta agronomica hungarica, 51(1), 53-
59.
71
Impact of Neem Coated Urea on Production, Productivity and Soil Health in Karnataka

Suma, H. N. (2007). Demand for chemical fertilizers in Karnataka (Doctoral dissertation, UAS, Dharwad).
Townsend, A. R., Howarth, R. W., Bazzaz, F. A., Booth, M. S., Cleveland, C. C., Collinge, S. K., ... & Mallin,
M. A. (2003). Human health effects of a changing global nitrogen cycle. Frontiers in Ecology and the
Environment, 1(5), 240-246.
Verma, S.V.S., S.K. Gowda and A. V. Elangovan, 1998. ‘Responses of single comb white leghorn layers to
dietary inclusion of raw or alkali treated neem kernel meal. Anim. Feed Sci. Tech, 76:169-175.
72
Impact of Neem Coated Urea on Production, Productivity and Soil Health in Karnataka

ANNEXURESACTION TAKEN REPORT
Impact of Neem Coated Urea on Production, Productivity and Soil Health in Karnataka
Comments on Review of Literature:
The studies related to the development of NCU and its superiority over NU are discussed in the Review of
Literature (Sateesh, 1998; Govindachari, 1992; Nagalakshmi et.al., 1996).
Comments on the methodology:
Selection of study locations (districts) are supported with the secondary data. However, crops were selected
in consultation with DAC & FW. There was hardly any supply of NU across state as mandatory production
and distribution of NCU implemented from May, 2015. Only few farmers applied NU out of their old stock
or bought from the fertilizer shops, which was difficult to identify and select. Therefore, random sampling
method was applied using post classification among the users of NU and partial/ full users of NCU. Adequate
care was taken to represent different category of farmers while, selecting the respondents.
Comments on Need for the Study:
‘There is a notion that NCU has stopped the diversion of urea towards non-agricultural/ industrial purposes’
sentence has been removed, as it was not covered under this study. As suggested, the word ‘major crops’
has been replaced with ‘selected crops’ as it was found appropriate.
Comments on the Presentation, Get up etc.:
Chapter I:
Page 1: The figures related to NPK consumption and the related inferences are corrected based on the
relevant references. The fertilizer use is associated with availability of water for irrigation and obviously
found relatively higher with irrigated crops. Hence, the consumption of fertilizers might have increased
during 2014-15.
Page 2: The statement has been supported with references.
Chapter: II:
The prices of urea were reconsidered. The prices of 2003 were applicable till 2010 and hence, the prices
of 2003 were considered in the report.
In the sub-section 2.4, the results related to the share of urea consumption and its growth rate with
respect to the sample districts were contextualized, in detail, for the period 2006-07 to 2015-16.
Chapter III:
Tables are placed in the relevant places. The distribution of cultivated area under paddy and tur across
different farm size groups are discussed. Table 3.2 has been removed, and Figure 3.1 and 3.2 was retained.
73
Impact of Neem Coated Urea on Production, Productivity and Soil Health in Karnataka
Number of households under each size class of operational holding for both crops are given in Table 3.3.
Households cultivating both crops on different plots will not arise as can be know from the sampling criteria used for selected crop/s and district/s.
Mandatory production of NCU is implemented by the GoI since May 2015 and the reference period of the study is Kharif 2015. As, it is the beginning year of complete NCU, a majority of the farmers were not aware of the usage and benefits of NCU. Further, the slow releasing property of the NCU has created confusion among the farmers. Hence, the frequency of application might have increased (Section 3.4). Accordingly, the NCU quantity purchased and applied was more in the case of NCU as compared to NU. Over the period, farmers realized benefits and started applying in lesser quantity.
Table 3.9 shows the input use, output and returns per acre realized by paddy farmers across different farm size holdings. The average yield of main product during 2014 and 2015 remains same, whereas, it differed across categories of farmers. However, with respect to average yield of byproduct, the quantity has varied across two different periods and categories of farmers. Hence, it was concluded that the increase in quantity of both main and byproduct yield might be due to usage of NCU in 2015.
Sections related to the credit and training participation are included in the report, with an intention that they indirectly help the farmers, in urea fertilizer purchase and their application in the field. The relationship are worked out with the coefficient of correlation and the results are interpreted in the relevant sections.
Policy suggestions are drawn based on the results. However, a majority are suggestions on SHC are due to various issues noticed in the implementation of the scheme. It is difficult to generalize the results of NCU with a short period considered in the study (Kharif, 2015). Based on the positive impact observed in productivity and cost reduction among selected crops, it was suggested to continue the mandatory production of NCU. At the same time, it was also suggested that the government should spread awareness among farming community regarding NCU and its associated benefits vis-a-vis NU. The results can be considered as the baseline survey for further research in the future.
Editorial Comments
Missing units of data and source/s are verified and given in all the chapters.The language & grammatical errors are edited as per the suggestion. The title of the report is corrected as Karnataka.
Chapter VIII is corrected as Chapter VII
The information related to the NU/NCU are specific to crops, hence, it is not worth to see at overall level. Hence, the overall figures are not given in Chapter IV and V.
References are verified and included/ removed as per the Reference list mentioned at the end of the report.
Overall Acceptability of the Report:
As per the comments/ suggestions, the whole report is revised and submitted.
74
Impact of Neem Coated Urea on Production, Productivity and Soil Health in Karnataka


INSTITUTE FOR SOCIAL AND ECONOMIC CHANGEDr. V.K.R.V. Rao Road, Nagarabhavi, Bengaluru - 560 072
Phone: +91-80-23215468, 23215519; Fax: +91-80-23217008Email: [email protected]; website: http://www.isec.ac.in
Agricultural Development and Rural Transformation Centre