IMPACT OF GREEN BUILDING DESIGN ON HEALTHCARE …...IMPACT OF GREEN BUILDING DESIGN ON HEALTHCARE...
89
IMPACT OF GREEN BUILDING DESIGN ON HEALTHCARE OCCUPANTS ------WITH A FOCUS ON HEALTHCARE STAFF By Ying Huang A THESIS Submitted to Michigan State University in partial fulfillment of the requirements for the degree of MASTER of ARTS Interior Design & Facilities Management 2011
Transcript of IMPACT OF GREEN BUILDING DESIGN ON HEALTHCARE …...IMPACT OF GREEN BUILDING DESIGN ON HEALTHCARE...

IMPACT OF GREEN BUILDING DESIGN ON HEALTHCARE OCCUPANTS ------WITH A FOCUS ON HEALTHCARE STAFF
By
Ying Huang
A THESIS
Submitted to Michigan State University
in partial fulfillment of the requirements for the degree of
MASTER of ARTS
Interior Design & Facilities Management
2011

ABSTRACT
IMPACT OF GREEN BUILDING DESIGN ON HEALTHCARE OCCUPANTS
------WITH A FOCUS ON HEALTHCARE STAFF
By
Ying Huang
Previous studies have shown that indoor environmental factors such as ventilation,
lighting, noise and contact with nature can influence the occupant perception of the
working environments. But there is still hot debate over whether a green hospital is
more comfortable to work in. Since the green healthcare design is increasingly adopted
in practice, it’s important to assure this new healthcare design addresses the needs of the
staff, with the sustainability considered at the same time. There is evidence linking the
working environments to the turnover rate of nurses, medical errors of the doctors and
staff, and the overall care they deliver. Therefore it’s very important to study the impact
of built environment on healthcare staff and identify the factors that influence the
perception of comfort and satisfaction.
This research adopts quantitative study using surveys. The participants are the
healthcare staff including doctors and nurses from three hospitals, two of which are
LEED-certified hospitals and the other is not LEED-certified with conventional
designed. The results show significant difference between two types of hospitals studied.
Staff working in the LEED-certified hospital feel more comfortable and show a higher
satisfaction level towards their working environments. This study provides valuable
empirical results to reveal the relation between the building design and the comfort and
satisfaction of healthcare staffs, which will shed light on the future hospital design.

Copyright By
Ying Huang
2011

iv
ACKNOWLEDGEMENT
I would like to express my deepest gratitude to my advisor, Dr. Suk-kyung Kim,
for her excellent guidance, caring, patience, and providing me with an excellent
atmosphere for doing research.
I would like to thank Dr. Young S. Lee and Dr. Bill Corser sincerely for their
suggestions and help on the research design and thesis writing.
I would also like to thank my parents who were always supporting me and
encouraging me with their best wishes.
Finally, I would like to thank my husband. He was always there cheering me up
and stood by me through the good times and bad.

v
Table of Contents
List of Tables…………………………………………………………..…………..……vii
List of Figures………………………………………………………………………….viii
Chapter 1 Introduction ……………………………………………………………..1 1.1 Introduction ··········································································································· 1
1.2 Research Purpose and Objectives ·········································································· 3
1.3 Research Hypotheses ····························································································· 4
1.4 Importance of the Study ························································································ 4
1.5 Definition of Terms ······························································································· 5
1.6 Structure of the contents ························································································ 6
Chapter 2 Literature Review ……………………………………………………..7 2.1 Built environment and occupant comfort and satisfaction ····································· 7
2.2 Impact of built environment on healthcare staff ·················································· 11
2.3 Supportive Design Theory and its implications in healthcare design ··················· 12
2.4 LEED for Healthcare ··························································································· 15
2.5 Summary ············································································································· 19
Chapter 3 Methods ……………………………………………………………21 3.1 Conceptual Framework ······················································································· 21
3.2 Research Targets ································································································· 22
3.3 Survey Participants ······························································································ 34
3.4 Data collection ···································································································· 34
3.5 Instrumentation ··································································································· 35
3.6 Data analysis plan ································································································ 37
Chapter 4 Results ……………………………………………………………42
4.1 Demographic and socioeconomic characteristics of respondents ························ 42
4.2 A comparison of occupant comfort perception between building types ··············· 44
4.3 A comparison of occupant satisfaction between building types ··························· 47

vi
4.4 Correlation between perceived comfort and overall satisfaction ························· 50
4.5 The direct effect of perceived comfort categories on overall satisfaction ············ 55
Chapter 5 Discussion ……………………………………………………………57 5.1 Staff perception of comfort ·················································································· 57
5.2 Staff perception of overall satisfaction toward the workplace ····························· 61
Chapter 6 Conclusion and Suggestions ……………………………………………63 6.1 Limitations of the study and suggestions for future studies ································· 63
6.2 Implications for future hospital design ································································ 65
Reference ……………………………………………………………………………75
vii
List of Tables
Table 1 LEED 2009 for Healthcare Project Checklist ............................................... 16
Table 2 Items that were studied in this study ............................................................. 19
Table 3 Items in the previous studies to measure work satisfaction .......................... 36
Table 4 Contents of the Questionnaire ....................................................................... 37
Table 5 Gender distribution of the respondents ......................................................... 42
Table 6 Age distribution of the respondents .............................................................. 43
Table 7 Job type distribution of the respondents ....................................................... 43
Table 8 Means and p-values for each comfort categories between LEED and non-LEED-certified hospitals .................................................................................................. 45
Table 9 Means and p-values for each satisfaction question between LEED and non-LEED-certified hospitals .................................................................................................. 48
Table 10 Pearson correlation coefficients between overall satisfaction (Caver) and each comfort item for LEED-certified hospitals. .............................................................. 52
Table 11 Pearson correlation coefficients between overall satisfaction (Caver) and each comfort category for non-LEED-certified hospitals. ................................................ 54
Table 12 Simple linear regression between overall satisfaction (Caver) and each comfort categories. ............................................................................................................ 56

viii
List of Figures
Figure 3.1 Causal diagram showing the effect of building type on occupant comfort and productivity ................................................................................................................ 21
Figure 3.2 Water-saving flush in Metro Health Hospital ........................................... 23
Figure 3.3 The interior of Metro Health uses low emission materials and paints ...... 24
Figure 3.4 Eco-friendly plates in the cafeteria in Metro Health ................................. 24
Figure 3.5 Cafeteria in Metro Health showing the use of natural light ...................... 25
Figure 3.6 Metro Hospital rain garden ....................................................................... 26
Figure 3.7 Green roof on the main building of Metro Hospital. ................................ 27
Figure 3.8 Metro hospital outdoor lounge .................................................................. 28
Figure 3.9 Rain garden in Botsford Cancer Center .................................................... 29
Figure 3.10 Eco-friendly Building Materials are used in Botsford Cancer Center ...... 30
Figure 3.11 Natural lighting is maximized for interior spaces in Botsford Cancer Center 31
Figure 3.12 Healing garden in Botsford cancer center ................................................. 32
Figure 3.13 Botsford hospital-main campus ................................................................ 33
Figure 4.1 Profile plot of mean responses for 10 comfort questions for LEED (Black) and non-LEED-certified hospitals (Red). ......................................................................... 46
Figure 4.2 Profile plot of mean responses for 7 satisfaction questions for LEED (Black) and non-LEED-certified hospitals (Red). ............................................................ 49

viii
Chapter 1 Introduction
1.1 Introduction
Our world is facing serious problems including energy crisis and environmental
degradation. If the current energy consumption rate remains, oil and natural gas will be
used up in 42 and 61 years, respectively (Kisslinger, 2004). Since buildings consume
more than 70% of the electricity and a large part of materials, water, and generate 60%
of non-industrial waste (National Institute of Building Sciences, 2010), green buildings
become one of the mainstream practices. They are defined by some researchers as
buildings based upon resource efficient, ecological design aimed at creating healthy
indoor environment. In green buildings, the consumption of energy, water, and other
resources are greatly reduced by adopting various methods such as using solar cells and
collecting stormwater (U.S. Green Building Council, 2011). In addition, green buildings
are known to provide healthier indoor environment. Air quality is improved by using
low emission materials and better designed ventilation systems. Moreover, green
buildings are expected to reduce significantly waste production and pollution, which
impose much less pressure on the environment. Leadership in Energy and
Environmental Design (LEED), a rating system developed by U.S. Green Building
Council (USGBC), provided a third-party verification which assesses building projects
based on the green building and performance standards (USGBC, 2011).
Hospital buildings are one important type of buildings. The United States is
facing one of the largest hospital building booms in the U.S. history, as a result of the
graying of the baby boom generation and the need to replace aging 1970s hospitals

2
(Ulrich et al., 2008). Even as economy slows and construction is down nationwide,
healthcare-related construction projects continue to grow. According to statistics from
the U.S. Census Bureau (2008), $48.5 billion was spent on hospital construction in 2010,
up 1.2% from the previous year. However, the current hospital design doesn’t always
meet the need to create the most effective environment for the patients to recover and
for the staff to work in. As described by Institute of Medicine in 2001, “The frustration
levels of both patients and clinicians have probably never been higher. Yet the problems
remain. Health care today harms too frequently and routinely fails to deliver its potential
benefits”(Institute of Medcine, 2001).
In the healthcare industry, approximately 6600 tons of waste is generated daily in
the United States, 85% of which is nonhazardous solid waste such as paper, cardboard,
food, glass, and plastics that can be recovered or recycled. The amount of waste and
costs could also be reduced through efficiency. According to Environmental Protection
Agency (2010), about 30% of the health sector’s energy use could be reduced by
switching toward renewable and more efficient energy sources. As a result, the concept
of green hospital design is now increasingly adopted in practice in the healthcare
industry. It’s important to assure this new healthcare design indeed addresses the needs
of the patient and staff, with the environmental sustainability considered at the same
time.
Current studies on hospital design more often concentrates on the patient side.
Less attention has been given to healthcare staff. According to the report of Bureau of
Health Professions (BHP) (2004), the nurse shortage is growing from -6% in 2000 to -
17% in 2010 and will keep growing to -36% in 2020, which directly threatens the

3
patients’ safety. In addition, the existing nurse force is aging. Their age averaged more
than 43 years old in 2002 and will increase to 50 by 2010 (JCAHO, 2002). Jones (1990;
2002) and Steel (2002) found that the turnover rate among nurses is more than double
that for other professionals of comparable education and gender, which ranges from 17%
to 36%. One of the major reasons why nurses plan to leave the field is because of the
physical environments of workspaces (Steel, 2002). All of these call for more careful
studies on the impact of built environment on healthcare staff, with the goal to improve
the working conditions and ultimately the care they deliver.
1.2 Research Purpose and Objectives
The primary purpose of this study is to evaluate the impact of hospital design on
the perceived staffs’ comfort and satisfaction therein by comparing the data collected
from LEED-certified hospitals and non-LEED-certified hospitals. This study aims to
provide more insight about the post-occupancy evaluation and suggest better building
design considerations for improving comfort and satisfaction of healthcare occupants in
their working environments.
Based on the purpose, this study set the following objectives for the study:
1. To examine how the healthcare building design (LEED vs. non-LEED)
might influence the perception of the comfort toward the workplace
between the staffs from LEED-certified hospitals and non-LEED-certified
hospitals.
2. To evaluate how the healthcare building design (LEED vs. non-LEED)
might influence the satisfaction toward the workplace between the staffs
from LEED-certified hospitals and non-LEED-certified hospitals.

4
3. To determine how the perception of comfort might influence the
satisfaction toward the workplace among healthcare staffs.
4. If the answer is yes to objectives 3, identify the comfort categories which
are responsible for the difference in the perception of satisfaction toward
the workplace.
5. To suggest design considerations for the future green healthcare designs
1.3 Research Hypotheses
According to the purpose and objectives of this study, the following hypotheses
will be tested:
1. Healthcare staffs from LEED-certified hospitals perceive their workplace
more comfortable than those from non-LEED-certified hospitals.
2. Healthcare staffs from LEED-certified hospitals are more satisfied toward
their workplace than those from non-LEED-certified hospitals.
3. The perception of comfort significantly influences the satisfaction toward
the workplace among healthcare staffs.
4. Higher perception of comfort leads to higher degree of satisfaction among
healthcare staffs.
1.4 Importance of the Study
Although green building design is known to have a number of benefits, it remains
in question due to the lack of real data whether green building design really improves
the perception of comfort and satisfaction among the occupants. Especially for
healthcare facilities, even fewer studies have been done to answer this question. It is

5
necessary to generates valuable empirical results to reveal the relation between the
healthcare design and the perception of comfort and satisfaction among healthcare staff,
which provides invaluable implications in future healthcare design. Therefore, this study
aimed to investigate the perceived comfort and satisfaction of healthcare staffs in LEED
and non-LEED-certified hospitals and examine any significant differences. The entire
data and results will provide evidence-based design suggestions for future healthcare
designs.
1.5 Definition of Terms
For the purposes of this study, the following definitions will be used.
LEED refers to Leadership in Energy and Environmental Design. It is an
internationally recognized green building certification system developed by the U.S.
Green Building Council. It aims to provide a standard for evaluating whether a building
is environmentally responsive, profitable and a healthy place to work. According to the
U.S. Green Building Council, LEED promotes a holistic approach to sustainability by
recognizing performance in five key areas of human and environmental health including
sustainable site development, water savings, energy efficiency, materials selection and
indoor environmental quality. LEED (USGBC) buildings are expected to improve health
and safety for the occupants, reduce waste sent to landfills, save energy and water and
improve indoor air quality. Buildings are rated as “certified”, “silver”, “gold”, or
“platinum” depending on the number of credits received.
Post-occupancy evaluation is defined as the process of evaluating buildings in a
systematic and rigorous manner after they have been built and occupied for some time
(Preiser et al., 1998). It assesses how well buildings match users’ needs, and identifies

6
ways to improve building design, performance and fitness for the purpose.
Environmental Management System is a set of processes and practices that enable
an organization to reduce its environmental impacts and increase its operating efficiency
(U.S. Environmental Protection Agency, 2002). It brings together the people, policies,
plans, review mechanisms, and procedures used to manage environmental issues at a
facility or in an organization (U.S. Environmental Protection Agency, 2002).
HVAC refers to a Heating, Ventilation, and Air-Conditioning (HVAC) system (U.S.
Environmental Protection Agency, 2010). It’s designed to help maintain good indoor air
quality through adequate ventilation with filtration and provide thermal comfort. HVAC
systems are among the largest energy consumers in buildings. The choice and design of
the HVAC system can affect many other high performance goals such as water
consumption.
1.6 Structure of the contents
Chapter 2 of this thesis will review the literature related to the topic. Chapter 3
presents research methods adopted in this research including research subjects, data
collection procedure, instrumentation and analysis design. Chapter 4 presents the
research results based on statistical analyses and discusses the implications. Chapter 5
presents the summary, conclusion and the suggestions for future healthcare design and
related research.
7
Chapter 2 Literature Review
There has been an increasing number of research focusing on the impact of
building design on occupants’ comfort and satisfaction. This chapter aims to give an
overview of what kinds of studies have been conducted so far and provide a background
for the research. Articles reviewed are grouped into three categories, including (1) the
relation between built environment and comfort, (2) the relation between built
environment and satisfaction, and (3) the impact of building design on the healthcare
staff.
2.1 Built environment and occupant comfort and satisfaction
Increasing number of studies has been carried out focusing on evaluating the built
environment quality, which is usually measured in terms of occupant comfort. Because
there is evidence indicating that comfortable indoor environment can lead to
improvements in productivity in the workforce and hence greater competitiveness for
the company involved.
Studies on indoor air quality are far too vast to be covered fully in this thesis.
However, the message is very clear: indoor air quality is one of the key factors affecting
health, well being, perceptions of ambient conditions and work. For example, results
obtained by Hummelgaard et al. (2007) indicated a higher degree of satisfaction and a
lower prevalence of Sick Building Symptoms (SBS) among the occupants in the
naturally ventilated buildings comparing to mechanically ventilated buildings. Menzies
(2000) also found Sick Building Syndrome (SBS) symptoms were significantly

8
decreased in buildings with better ventilation system. These findings are consistent with
an early study of occupants in newly renovated office buildings which found high levels
of general symptoms and mucosal symptoms associated with odors and organic
compounds in dust (Valbjorn, 1995). In a most recent article, the occupant sensation and
satisfaction level towards their thermal and visual environment was found to be clearly
better in a contemporary environmentally-concerned building compared to those in a
conventional high-rise office block (Zhang et al., 2011). Humidity is another factor
showing a significant effect on the occupant comfort as well as the energy consumption
(Simonson et al., 2002). As described by Heerwagen et al. (2000), indoor air quality is
greatly improved due to material selection, construction techniques, enhanced
ventilation and inclusion of indoor nature settings in green buildings, which suggests
green design could possibly improve the occupant comfort as well as satisfaction level.
In addition, there is evidence showing that indoor lighting is also closely related
to the occupant comfort. Earlier studies also shown that people valued daylight and
preferred to be near windows (Collins, 1975; Heerwagen et al., 1986). Literature
regarding occupant preferences and satisfaction with the luminous environment and
control systems in daylit offices were reviewed by Galasiu et al. (2006) which showed a
consistent strong preference for daylight. In green building design, daylignt has been
used as the primary light source which reduces building energy demand and at the same
time enhances indoor environment quality. A recent study showed generally high
satisfaction was perceived with daylit work environment in a LEED Gold laboratory
building (Hua et al., 2010). On the other hand, as it’s still necessary to have artificial
lighting, energy efficient, high quality electric lighting not only reduces energy

9
consumption, but also reduces computer glare, increases visual comfort, and adds an
aesthetic element that is good for the mood of the occupants (Boyce, 1998). Incidence of
headaches was found to decrease significantly with the use of high frequency
fluorescent lamps (Collins, 1993). These features have been used commonly in green
buildings which are found to reduce headache, eyestrains, and can serve as a buffer to
discomfort or stresses.
Moreover, it’s found that being able to have visual contact with nature through
window views, sitting in the sun or shade, and to walk in interior streets with natural
settings enhances mood and promotes higher quality of life (Heerwagen, 2000). A study
examining the effects of window view on perception of spaciousness, brightness and
room satisfaction in a campus building revealed that rooms with open and natural
window views at higher levels were perceived larger and rated more satisfied by the
occupants (Ozdemir, 2010). A view of natural elements was also found to buffer the
negative impact of job stress on intention to quit and to have a similar elect on general
well-being (Leather et al., 1998). The recovery from stress was found to happen within
three to five minutes after encountering real or simulated nature settings (Parsons, 2000)
and this change was even quickly reflected in physiological changes such as blood
pressure and heart activity and producing a feeling of comfortable (Ulrich et al., 1991).
More specifically, indoor plant density was shown to bring psychological benefits which
results in better occupant attitudes and higher perceptions toward the indoor
(Bringslimark et al., 2009; Larsen et al., 1998).
Noise is another indoor environmental contributor that greatly affects occupant
comfort. It has been well established that noisy environments are stressful, frustrating

10
and prevent people from doing their job to the best of their abilities (Bordass, 2000).
Satisfaction was found to drop significantly with increasing noise, as revealed in a field
study assessing disturbance by office noise among 3391 employees at 58 sites
(Sundstrom et al., 1994). Noise is a substantial problem particularly in green building
design as a result of open plan configuration. Negative effects of acoustic environment
increased significantly, including increased distraction, reduced privacy, increased
concentration difficulties and increased use of coping strategies. Self-rated loss of work
performance because of noise doubled (Kaarlela-Tuomaala et al., 2009; Smith-Jackson
et al., 2009). It was also reported that office noise (with or without speech) affected the
memory and mental arithmetic which were independent of the meaning of the irrelevant
speech (Banbury et al., 1998). The physics of buoyancy utilized in natural ventilation
was found to aid the transmission of noise from one part of the building to another
(Edwards, 2006). The need for contact with nature together with the need for cross
ventilation opens the interior to exterior noise. Added to this, exposure of hard fabric
surfaces for night-time fabric cooling also adds to potential noise levels in the
workplace (Edwards, 2006). Strategies have been developed to reduce noise in green
building design (De Salis et al., 2002; Swift et al., 2008) and LEED standard for indoor
acoustical quality has been proposed (Jensen et al., 2008).
Thermal comfort was also found to correlate strongly with perceived comfort of
the workplace (Roulet et al., 2006; Xie et al., 2009). Higher temperature is found to
correlate with higher microbial presence in the air and thus result in higher level of
general symptoms such as nasal inflammation. A Swedish office study found the
incidence of headache and other symptoms increased steadily from 10% at 20°C to 60%
11
at 24.5°C (Krogstad, 1991). Thermal condition is found to be another potential problem
in green buildings. In order to reduce the energy consumption and construction cost,
natural cooling and heating are commonly adopted instead of air conditioning in these
buildings. The results of overheating in summer, under-heating in winder, and excessive
variability of temperature could be detrimental to the occupants’ comfort (Edwards,
2006). In fact, a study conducted in Australia (Paul, 2008) showed that people staying in
a green library in summer perceived the indoor environment as warmer and less
comfortable. This shows a potential issue of green buildings associated with thermal
comfort caused by saving energy for heating and cooling.
2.2 Impact of built environment on healthcare staff
As demonstrated in a number of studies, healthcare staff especially nurses
experience a high level of work stress, which were found to contribute to nurse burnout
and an intention to leave the job (Billeter-Koponen et al., 2005; Scully, 1980; Sharma et
al., 2008; Ulrich et al., 2008). However, there are only a few studies exploring how the
built environment contributes to staff stress and affects the comfort and satisfaction so
far.
Regarding to indoor air quality, Jiang et al. (2003) found that good ventilation
could significantly reduce the viral load of the ward and might be the key to prevent
outbreaks of severe acute respiratory syndrome (SARS) among healthcare workers. Two
other studies conducted by Smedbold et al. (2002) and Menzie et al. (2000) both found
significant decrease in illness infection among healthcare staff was related to less fungus
in the air with better ventilation supply. In addition, Cooper-Marcus et al. (1995) found

12
that many nurses and other healthcare workers used the gardens for achieving pleasant
escape and recuperation from stress. There is also evidence that healthcare staff perceive
higher sound levels generated by the equipments as stressful (Bayo, 1995; Norbeck,
1985). Noise-induced stress in nurses also correlates with reported emotional exhaustion
or burnout (Topf, 1988). A study conducted by Blomkvist et al. (2004) also found lower
noise levels were linked with a number of positive effects on staff such as improved
quality of care for patients. Finally, a large scale study conducted by Buchanan et al.
(1991) examined a correlation between the appropriate lighting level and reduction of
medication dispensing error rates. They found that medication dispensing error rates
were significantly lower at an illumination level of 1,500 lux (2.6%) than those of 450
lux (3.8%).
These previous studies emphasize the relationships between healthcare staffs’
satisfactions and stress, ventilation, garden, noise, and lighting level. This study thus
will include these physical elements and examine their relationships with healthcare
staffs’ perceptions of comfort and satisfaction in their working environments.
2.3 Supportive Design Theory and its implications in healthcare design
Traditional healthcare design mainly concentrates on creating buildings that
reduce infection and succeed as functionally efficient delivery platforms for new
medical technology. This emphasis on functional efficiency and the pathogenic
conception of disease and health often results in institutional and stressful environments
that are detrimental to care quality (Ulrich, 1992; Ulrich et al., 1991). Very little
attention is given to creating surroundings that address psychological and social needs

13
of the patients. Ulrich (1984) published his findings on the Science journal showing that
postsurgical patients whose hospital rooms offered an outdoor view tended to recover
more quickly. This pioneered a new perspective toward healthcare design, which is now
known as supportive design and evidence-based design became prevalent along with the
supportive design theory. A growing number of studies have been conducted which
provide more and more evidence suggesting that aspects of the built environment have
significant effects on clinical outcomes for patients, since then.
As an example, noise was found to produce widespread annoyance among
patients and stress in staff (Bayo, 1995) and was detrimental to at least some outcomes
such as producing sleeplessness and elevated heart rate (Hilton, 1985). Studies of
critical-care patients found strong correlation between the absence of windows and high
rates of anxiety and depression (Keep et al., 1980). Patient rooms with sunshine rather
than cloudy conditions were found to possibly foster more favorable outcomes
(Beauchemin et al., 1996, 1998).
The number of such studies on the links between environmental characteristics
and outcomes is growing but many healthcare design questions remain unanswered. The
Supportive Design Theory is brought up to provide guidelines for the design situations
where knowledge is not sound. The term supportive here refers to environmental
characteristics that support or facilitate coping and restoration with respect to the stress
that accompanies illness and hospitalization (Ulrich, 1999).
The Theory takes advantages of a large amount of indirectly relevant research in
health psychology, environmental psychology, behavioral medicine, and other health-
related fields (Ulrich, 1999; Ulrich et al., 1991). A lot of these studies examined how
14
humans respond to the environment. According to environmental psychologists, the
premise is the biophilia hypothesis, which asserts that humans have developed a trait to
be sensitive and responsive to the surroundings since the earliest evolutionary phases of
human life (Bilchik, 2002). Based on this hypothesis, three broad categories of research
have been developed to reduce environmental stress for patients and healthcare staffs: (1)
fostering control and privacy, (2) improving social support, (3) and connecting to nature
and providing positive distractions (Bilchik, 2002).
Results from these studies indicate that the capability of healthcare environments
to improve outcomes is linked to their effectiveness in promoting stress reduction,
buffering, and coping (Ulrich, 1999; Ulrich et al., 1991). For example, it was found that
in all settings (office, library, hospital, etc.) some extent of control over the environment
reduces stress (Bilchik, 2002). In hospitals, patients who have control over the
temperature and lighting in their rooms, the amount of privacy they have and the timing
and content of meals will experience less stress and will likely heal more quickly.
Similarly, positive distractions were found to reduce stress in measurable ways. The
inclusion of indoor natural settings, interactive works of art and aquariums is thus
becoming integral to healthcare design.
In practice, supportive healthcare design takes two steps. It begins by eliminating
environmental characteristics that are known to be stressful or have direct negative
impacts on outcomes such as noise. In addition to this, supportive design goes a major
step further by emphasizing the inclusion of characteristics in the environment that
could reduce stress and improve outcomes suggested by the research (Ulrich, 1999).
To summarize, as suggested by a number of studies, Supportive Design Theory

15
improves the patients’ health outcomes by reducing stress and anxiety for patients,
reducing pain, improving sleep quality, lowering infection occurrence, and improving
patient satisfaction. There was also evidence that supportive design is beneficial for
healthcare employees by reducing the workplace stress and improving satisfaction.
2.4 LEED for Healthcare
Healthcare facilities have their own characteristics such as all day long operating
schedule, need for infection control, and a large amount of medical wastes. Moreover,
sustainable healthcare facilities should be not only good for the environment, but also
good for physicians, staffs, and the patients. It’s not appropriate to apply the LEED
rating system for general buildings on healthcare facilities. Therefore U.S. Green
Building Council collaborated with the Green Guide for Health Care (GGHC) and
established LEED standards for healthcare facilities in 2009 (USGBC, 2009).
The LEED 2009 for Healthcare Green Building Rating System (USGBC, 2009)
is a set of performance standards for certifying healthcare facilities. The intent is to
promote healthy, durable, affordable, and environmentally sound practices in building
design and construction. The rating system addresses seven topics including sustainable
sites (SS), water efficiency (WE), energy and atmosphere (EA), materials and resources
(MR), indoor environmental quality (IEQ), innovation in design (ID) and regional
priority (RP). There are several prerequisites and credits under each topic. To earn
LEED certification, the healthcare facility must satisfy all the prerequisites and quality
for a minimum number of points. The LEED 2009 for Healthcare Project Checklist is
summarized in Table 1.

16
Table 1 LEED 2009 for Healthcare Project Checklist
Categories Items
Sustainable Sites Construction Activity Pollution Prevention
Environmental Site Assessment
Site Selection
Development Density and Community Connectivity
Brownfield Redevelopment
Alternative Transportation
Site Development
Stormwater Design
Heat Island Effect-Roof
Light Pollution Reduction
Connection to the Natural World
Water Efficiency Water Use Reduction
Minimize Potable Water Use for Cooling
Water Efficient Landscaping
Energy and Atmosphere Fundamental Commissioning of Building Energy Systems
Minimum Energy Performance
Fundamental Refrigerant Management
Optimize Energy Performance
On-site Renewable Energy
Green Power
Community Contaminant Prevention – Airborne Releases
Materials and Resources Storage and Collection of Recyclables
PBT Source Reduction – Mercury
Building Reuse
Construction Waste Management

17
Table 1 (Continued) Sustainably Sourced Materials and Products
Furniture and Medical Furnishings
Resource Use – Design for Flexibility
Indoor Environmental
Quality
Outdoor Air Delivery Monitoring
Acoustic Environment
Low-Emitting Materials
Indoor Chemical and Pollutant Source Control
Lighting
Thermal Comfort
Daylight and Views
Innovation in Design Integrated Project Planning and Design
Innovation in Design
LEED Accredited Professional

18
Because they are in use night and day, with a high need for frequent air changes
and a large amount of equipment, hospitals consume a lot of energy. Energy-saving
techniques therefore are key characteristics for LEED healthcare facilities, including
exterior sunshades to reduce heat loads, insulated glazing, highly reflective roofs,
energy-conserving light fixtures, and high-efficiency HVAC systems (Bristol, 2007).
Solar panels are becoming more popular to reduce the consumption of electricity.
LEED healthcare facilities are usually designed to maximize the use of daylight
for interior spaces. Exposure to natural light has been shown to reduce depression
among patients, minimize pain, shorten hospital stays, improve the ability to perform
visual tasks, and enhance sleep (Boyce, 1998; Collins, 1993; Hua et al., 2010). Glares
and solar heat gain are the issues need to be taken care of in the lighting design.
More efficient ventilation system is another feature commonly adopted in LEED
healthcare facilities. It allows the installation of a smaller HVAC system, keeping air
fresh while lowering energy use (Southerst, 2002). With the highly efficient ventilation
systems, air quality can still be compromised by the materials used for the interior
(Bristol, 2007). LEED healthcare facilities usually use low emission low toxic paints,
carpets, finishes, adhesives, and sealants to ensure a better indoor air quality.
As mentioned earlier, medical waste is one of the most significant pollutants
produced by healthcare facilities (Zajac, 2007). LEED healthcare facilities deal with this
issue by using green supplies and materials to reduce the amount of waste, and by
recycling non-hazardous solid waste such as paper and cardboard.
Other than the categories described above, LEED for Healthcare Rating System
also gives credits for any innovative design to reduce the consumption of energy and

19
other resources, and to reduce the negative impact of healthcare practices on the
environment.
This study focused on the impact of these green design features on the staff’s
perception of comfort and satisfaction toward their workplace. The items to be included
in the investigation are summarized in Table 2.
Table 2 Items that were studied in this study
Category Item
Building design Hospital Layout
Wayfinding and signing system
Materials Materials & colors of the carpet, wall, floor,
and furniture
Indoor Environmental Quality Lighting
Acoustics
Ventilation system
Temperature
Humidity
Connection with nature Indoor natural settings
Outdoor Lounge
2.5 Summary
Previous results show clear evidence that indoor environment quality influences
occupant comfort and satisfaction in the healthcare environment. In a survey conducted
by the American Society of Interior Designers, 90% of respondents believe that

20
improvements in building design can increase occupant satisfaction level (Wheeler,
1998). Comfort was identified to be one of the key factors related to worker satisfaction.
Compared to conventional buildings, green buildings address a number of critical indoor
environmental aspects such as air quality, noise, lighting, and contact with nature.
Proponents of green design such as Browning and Romm (1995) support that these
green technologies and design strategies will enhance interior environmental quality by
making green buildings more comfortable and productive than buildings that use
standard practices. A more recent study conducted in Europe observed clear difference
of perceived comfort in between low and high energy buildings, which suggested that
it’s possible to design buildings that are healthy, comfortable and at the same time
energy efficient (Roulet et al., 2006). However, there is still little empirical evidence to
support this belief. In the context of healthcare facilities, the empirical evidence is even
more sparse and weak.

21
Chapter 3 Methods
3.1 Conceptual Framework
Figure 3.1 Causal diagram showing the effect of building type on occupant comfort and productivity
The causal model adopted in this study can be summarized in the diagram shown
in Figure 3.1. This model is developed according to Edwin A. Locke’s Range of Affect
Theory (Locke, 1976). This theory considers satisfaction as determined by a discrepancy
between what one wants in a job and what one has in a job.
Based on this model, different types of building design (LEED vs. non-LEED )
give rise to differences in various working conditions such as hospital layout, lighting,
and noise (As shown in Figure 3.1) By comparing what one expects and what the
workplace offers, the occupants form perceptions of comfort toward their workplace.
This occupants’ perception of comfort then influences significantly their satisfaction
toward the workplace. There is no direct relation between building types and occupant
satisfaction, but there is a relationship expected between working environments and
occupant satisfaction. This study will thus verify these hypothetical relationships.
Hospitals(Metro Health, Bosford Hospital)
Working Environments(Layout, lighting, noise, etc.)
Building type(LEED, non-LEED)
Occupant Comfort Occupant Satisfaction

22
3.2 Research Targets
To explore the relationships between working environments, either LEED - or
non-LEED , and healthcare occupants’ satisfaction and comfort, two types of healthcare
facilities were targeted. Data were collected from the staffs from these two types. Due to
the response number, this study included three hospitals: two LEED-certified hospitals
(Metro Health and Botsford Cancer Center) and one non-LEED-certified hospital
(Botsford Hospital main campus).
3.2.1 LEED Hospitals
1) Metro Health Hospital
Metro Health hospital is located at 5900 Byron Center Avenue in Wyoming in
Michigan. The information on this hospital is based on the Metro Hospital website. It
can be dated back to 1942 when a small group of osteopathic physicians committed their
personal resources to build a 28-bed hospital dedicated to holistic and patient-centered
care. The current advanced 208-bed medical center was open in 2007, sitting in the
center of the 170-acre Metro Health Village. It’s certified by LEED (certified) from the
U.S. Green Building Council in 2009.
A number of green features are incorporated in the design of Metro Health
hospital.
1. Water-saving features. Water-conserving fixtures, including waterless urinals
and low-flow faucets are adopted to reduce the use of water. A microfiber mop
system is used which cuts annual water use by 43,000 gallons and leads to a
90 percent reduction in chemical use.

23
Figure 3.2 Water-saving flush in Metro Health Hospital. For interpretation of the references to color in this and all other figures, the reader is referred to the electronic version of this thesis.
2. Low emission materials & chemicals. Fabrics, furniture, paints, adhesives,
sealants and carpets with low volatile organic compounds (VOCs) and low
emissions are used to help maintain indoor air quality. Housekeeping
chemicals are switched to Green Seal cleaning agents. All medical equipment
containing mercury is eliminated. An Environmental Management System
(EMS) is developed to identify and eliminate the use of harmful chemicals.

24
Figure 3.3 The interior of Metro Health uses low emission materials and paints.
3. Eco-friendly materials. Environmental friendly cups, compostable plates and
glasses –known as bioware- are used in the cafeteria.
Figure 3.4 Eco-friendly plates in the cafeteria in Metro Health

25
4. Lighting. Motion-sensitive lights and the incorporation of natural light
conserve energy.
Figure 3.5 Cafeteria in Metro Health showing the use of natural light
5. Medical waste reduction. Recycling programs for a wide variety of products
including computers, paper, light bulbs, cardboard, X-ray film and batteries
are established. Reusable needle box containers are used which reduced the
annual medical waste by 7.8 tons.
6. Vegetation. A landscape plan that incorporates native and adaptive vegetation
to reduce chemical inputs and irrigation requirements.
7. Rain gardens. These gardens (See Figure 3.6) filter pollutants from storm
water runoff. Rain gardens are bio-retention systems that allow water to filter
into the ground on-site so that it doesn't contribute to storm water runoff.
Increased infiltration of water helps remove contaminates such as oil, grease,

26
and nutrients. It also reduces the volume of water flowing overland that will
eventually enter a nearby stream, ditch, or storm sewer system.
Figure 3.6 Metro Hospital rain garden
8. Green Roof. Instead of a traditional roof, the 48,000-square-foot roof of the
hospital’s main building is covered by living plants (see Figure 3.7), which
requires less maintenance, provides greater insulation and offers a more
therapeutic environment for patients.

27
Figure 3.7 Green roof on the main building of Metro Hospital.
Most of the patient rooms have a view of the roof and its vegetation,
which changes with season. The plants selected can grow in just four inches of
soil with no need for irrigation. They are drought resistant and also hold onto
and store water. It’s believed this green roof design could enhance human
healing, improve air quality, minimize storm water runoff and cool down
surrounding air.
9. Outdoor Lounge. An outdoor lounge that provides access to restorative and
calming nature views which helps reduce stress.

28
Figure 3.8 Metro hospital outdoor lounge
2) Botsford Cancer Center (Green hospital)
The 30,000 square-foot 80-bed botsford cancer center is located on the north side
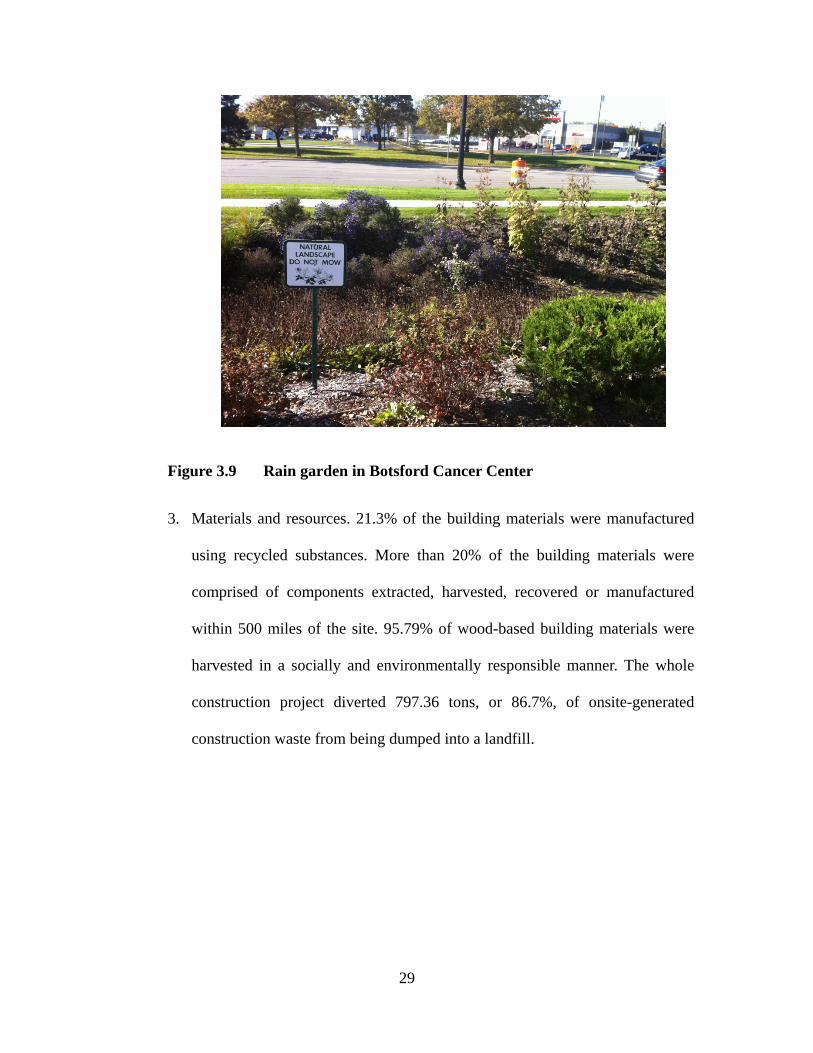
of Grand River in Farmington Hills, MI, opened in January 2009. It’s the first cancer
center in Michigan by LEED (silver) (see Figure 3.9). Sustainability is achieved in a
number of areas described below.
1. Open space. Landscaped open space consists more than 20% of the site.
2. Water management. Portable water use has been reduced by 28.7% by
installing low-flow lavatories, kitchen sinks and exam sinks as well as dual-
flush toilets. Stormwater management systems help to reduce stormwater
runoff by 25%. Parking lot rainwater runoff is filtered before it goes into the
sewer.
29
Figure 3.9 Rain garden in Botsford Cancer Center
3. Materials and resources. 21.3% of the building materials were manufactured
using recycled substances. More than 20% of the building materials were
comprised of components extracted, harvested, recovered or manufactured
within 500 miles of the site. 95.79% of wood-based building materials were
harvested in a socially and environmentally responsible manner. The whole
construction project diverted 797.36 tons, or 86.7%, of onsite-generated
construction waste from being dumped into a landfill.

30
Figure 3.10 Eco-friendly Building Materials are used in Botsford Cancer Center
4. Lighting. The lighting design in the entire site reduces light pollution
significantly. The exterior lights are aimed down, limiting light shining into
the sky. Natural light is maximized for interior spaces. Daylight is known to
positively impact mood and productivity as well as save energy.

31
Figure 3.11 Natural lighting is maximized for interior spaces in Botsford Cancer Center
5. Energy. The heating system design reduces energy use by 21.5%。
6. Indoor environmental quality. The minimum oxygenated air quantities
supplied to the site’s HVAC equipment exceeds LEED’s requirement. Prior to
building occupancy, an air filtration system was installed, capturing about 80%
of 1-micron particles at maximum dust loading. The products used in
constructing the site including indoor adhesives and sealants, indoor paint and
coating products, carpet systems, and indoor composite wood and fiber
materials contains a very limited amount of volatile organic compounds. The
cancer center is designed to maintain indoor comfort-temperature and
humidity-within established ranges.
7. Healing garden. The healing garden gives patients, staff and visitors an
outdoor space of respite to help them reconnect with the natural world.

32
Adjacent to the cancer center, the garden provides shaded seating areas that
are wheelchair accessible, and is part of Botsford hospital’s tobacco free
campus.
Figure 3.12 Healing garden in Botsford cancer center

33
3.2.2 Conventional Non‐LEED Hospital
1) Botsford Hospital
Botsford hospital main campus is located on Grand River Avenue in Farmington
Hills, founded in 1965. It’s a 330-bed health care facility serving communities in the
southeast Michigan area. In 2009, there were totally around 2,500 employees including
more than 600 medical staff.
Figure 3.13 Botsford hospital-main campus
In this hospital, no energy-saving or water-saving features are implemented.
Conventional HVAC systems are installed to provide ventilation and to regulate indoor
temperature and humidity. Artificial lighting is mainly used in all buildings with limited
introduction of natural lighting. There is no rain garden or outdoor lounge in this
campus. Additional information is not available because the hospital administration
prohibited the investigator from taking photographs of the interior of the facility.

34
3.2.3 Climate
All the three campuses are located in Michigan, with similar latitude and
elevation. All data were collected between November and February when it’s winter in
Michigan. According to the data from weather.com, the average maximum/minimum
temperatures are the same for Farmington, MI and Wyoming, MI in these months: 8°C/-
1°C (Nov); 1°C/-6°C (Dec); -1°C/-9°C (Jan); 1°C/-8°C (Feb). The average precipitation
levels in these months for the two locations are also very similar. These weather
similarities for the three hospitals studied rule out the possibility that the difference in
the staff perceptions toward the working environments is due to the difference in the
weather.
3.3 Survey Participants
The target population is the employees in three hospitals. Subjects were assigned
to a building type (LEED or non-LEED) according to the type of hospital they were
associated with at the time of study.
3.4 Data collection
This research is designed to be a quantitative study using surveys collected by
purposive sampling according to the related hospitals. The IRB application was
approved in September from Michigan State University. Data collection started in
October. For the Botsford cancer center, questionnaires were distributed and collected at
the end of the weekly staff meetings. For the Metro Health Hospital, a booth was set up
with signs and introductions for the research. Responsess were collected from the staffs
stopping by the booth. For Botsford Hospital main campus, questionnaires were

35
distributed and collected with the help of the human resource departments.
The questionnaire was accompanied with a cover letter explaining the purpose of
the study and the need for honest responses. A consent form for participation was also
attached. Responses to the questionnaire were voluntary and anonymous. There is no
way to link a questionnaire to a specific respondent. All information collected will be
kept private in locked file cabinets for five years after use.
This study adopted purposive sampling. A total of 20 responses were collected
from Botsford Cancer Center, 34 responses were collected from Metro Health Hospital
and 25 responses were collected from Botsford Hospital (main campus). Responses
from the first two hospitals are grouped together to result in a total of 54 responses for
green hospitals. The respondents and nonrespondents are assumed to be similar in the
way they perceive comfort and satisfaction, so that the respondents fairly represent the
entire population of the employees.
3.5 Instrumentation
The questionnaire was developed based on the previous research related to the
occupant comfort and satisfaction in the work environment (Heerwagen, 2000; Lee et
al., 2008; Paul, 2008; Veitch et al., 1998) and employee satisfaction questionnaire
developed by Gastle (2006). In these previous studies on occupant work satisfaction,
indoor air quality, lighting, thermal comfort, noise, connection with nature were used as
primary items as presented in Table 3.

36
Table 3 Items in the previous studies to measure work satisfaction
Authors/Year Items to measure work satisfaction
Heerwagen, J. H.
2000
Connection with nature; Lighting; Ventilation; Indoor air
quality; Thermal comfort;
Lee, Y. S. &
Kim, S. K.
2008
Layout; Furnishing quality; Thermal comfort; Indoor air
quality; Lighting; Acoustics; Cleanliness & maintenance.
Paul, W. L. &
Taylor, P. A.
Aesthetics; Lighting; Ventilation; Temperature; Noise;
Humidity.
Veitch, J. A. &
Newsham, G. R.
Aesthetic; Color; Lighting; Stress
Based on those studies, this study developed a questionnaire to measure perceived
comfort and satisfaction of healthcare staffs which consists of four sections. Please see
Appendix for the full questionnaire. Part 1 asks questions about the general information
of the participants including age, gender, type of work and years worked. Part 2 asks the
participants to rate their perception of the working conditions with regard to comfort on
a 7-point scale, including hospital layout, wayfinding and signing system, materials and
color, lighting, noise, ventilation, indoor natural settings, temperature, humidity, and
outdoor lounge. Part 3 asks the participants seven questions about their perceived
satisfaction. Part 4 asks a series of open questions which may reveal some important
facts.

37
Table 4 Contents of the Questionnaire
Section Items Scale
Demographic
Characteristics
Gender Categorical
Age
Type of Work
Years worked
Perceptions of
Working
Environments
Hospital Layout Nominal
From very comfortable (+7) to
very uncomfortable (+1)
Wayfinding
Materials & Colors
Lighting
Noise
Ventilation
Indoor Natural Settings
Temperature
Humidity
Outdoor Lounge
Satisfaction
toward the
workplace
Happy to Work Nominal
From very comfortable (+7) to
very uncomfortable (+1)
Like the Job
Department is well organized
Adequate Safety & Health
Standard
Adequate Balance between
Work and Personal Life
Overall satisfaction
3.6 Data analysis plan
Data analysis is performed using SPSS 16.0. Questionnaire data is first coded into
the format SPSS could recognize and analyze.

38
First, descriptive analysis was performed for the demographic and socioeconomic
characteristics of the respondents including gender, age, type of work, years worked.
Counts and frequencies for each categories and total numbers were calculated and
summarized.
1) A comparison of occupant comfort perception between building types
There were 10 categories on Part 2 of the questionnaire designed to measure
various aspects of perceived comfort. The mean for each category was calculated for
LEED and non-LEED-certified hospitals and was compared using one-way ANOVA test.
The purpose of this test was to see if there is indeed significant difference in each of the
perceived comfort category between different building types. In other words, this test
examined if the perceived comfort was associated with building types.
ANOVA, standing for analysis of variance, is used for a categorical independent
variable (with two or more categories) and a normally distributed interval dependent
variable. It assumes that the sampled populations are normally distributed. For one-way
ANOVA tests, this study has hypotheses below.
Null hypothesis: The means among the respondents in two types of healthcare
facilities are equal.
Alternative hypothesis: The means among the respondents in two types of
healthcare facilities are not equal.
One-way ANOVA test calculates the p-value, and compares it with a significance
level (usually choose 0.05 for 2-tailed test). If the p-value is smaller than the
significance level, the null hypothesis is rejected which indicates a significant different
between the means among the groups (NIST). Here in this study, the categorical
39
independent variable is the building type and the interval dependent variables are each
of the 10 comfort categories.
2) A comparison of occupant satisfaction between building types
There were 7 questions on Part 3 of the questionnaire evaluating the occupant
satisfaction from different perspectives instead of one general question (see Table 4).
The mean for each question was calculated and compared for different building types
using ANOVA test. Because the staff satisfaction toward the working environment could
be influenced by factors other than the building types such as workload, type of work,
and interpersonal relationship, these questions could help identify the satisfaction
related to building types from those which are not. Then the responses for those
satisfaction questions showing clear difference between green and non-green hospitals
were summed and averaged to result in a new overall satisfaction parameter labeled as
‘Caver’. The purpose of this test is to see if the overall perceived satisfaction was
associated with building types.
3) Correlation between perceived comfort and overall satisfaction
Statistical relationship between overall satisfaction (Caver) and 10 comfort
categories (B1-B10) were calculated for both green and conventional hospitals using
Pearson Correlation Coefficients. The comfort categories that influence perceived
satisfaction were identified.
Correlation refers to any departure of two or more random variables from
independence, but most commonly refers to a more specialized type of relationship
between mean values. It’s useful for identifying the relationship between two or more

40
normally distributed interval variables. Pearson correlation is one of the most commonly
used correlations, which is sensitive to a linear relationship between two variables
(Howell, 2002). It’s obtained by dividing the covariance of the two variables by the
product of their standard deviations. It assumes that data is on a continuous scale and the
values are normally distributed.
For Pearson correlation test, this study tested a null hypothesis below.
Null hypothesis: There is no correlation between each comfort category and
overall satisfaction.
Alternative hypothesis: There is correlation between each comfort category and
overall satisfaction.
When the p-value is less than 0.05, the null hypothesis is rejected which means
there is significant correlation between perceived comfort categories and overall
satisfaction.
4) The direct effect of perceived comfort categories on overall satisfaction
From the analysis described in 3), comfort categories correlated with overall
satisfaction were identified. A simple linear regression was then performed to determine
the degree of the effect for each comfort category on overall satisfaction. Simple linear
regression fits a straight line through the set of n points in such a way that makes the
sum of squared residuals of the model. The analysis in SPSS calculates a linear
regression coefficient. A more positive coefficient indicates a stronger positive
(increasing) linear relationship while a more negative coefficient indicates a stronger
negative (decreasing) linear relationship. A coefficient of 0 indicates absolutely no
relationship (Draper, 1998). The linear regression test also provided a significance test

41
which indicates whether the calculated coefficient significantly differ from zero. For
example, although a linear regression test gives a positive coefficient, the 2-tailed p-
value could be higher than 0.05 which means the error of the coefficient is comparable
or larger than the coefficient itself so the coefficient is not significantly different from
zero. This means there is no significant correlation between two variables.

42
Chapter 4 Results
4.1 Demographic and socioeconomic characteristics of respondents
4.1.1 Gender
The gender distribution of the respondents for two building types is shown in
Table 5 below. In LEED-certified hospitals, 31.5% of the respondents were male. In
non-LEED-certified hospitals, the number of male responses was smaller (= 8.0%).
Table 5 Gender distribution of the respondents
Hospital/type Gender Total
Female Male
Freq % Freq % Freq %
LEED 37 68.5% 17 31.5% 54 100%
Non-LEED 23 92.0% 2 8.0% 25 100%
Total 60 100% 19 100% 79 100%
4.1.2 Age
The age distribution of the participants is shown in Table 6 below. As can be seen
from the data, all of the participants from the non-LEED-certified hospital were older
than 40. In contrast, significantly more young staffs worked in the green hospitals.

43
Table 6 Age distribution of the respondents
Hospital
/type
Age Total
Under 40 41-60 Over 60
LEED 27 23 4 54
Non-LEED 0 23 2 25
Total 27 46 6 79
4.1.3 Job type
The summary of the job type distribution is shown in Table 7 below. The job type
of “others” includes the healthcare staffs other than doctors, nurses or administrators,
including surgical support staff, nutritionist, physical therapist and so on.
Table 7 Job type distribution of the respondents
Hospital
/type
Job type Total
Doctor Nurse Nutritionist,
Therapist, etc.
Administrator
LEED 3 9 36 6 54
Non-LEED 0 20 2 3 25
Total 3 29 38 9 79

44
4.2 A comparison of occupant comfort perception between building types
Part 2 of the survey posted 10 questions to the participants concerning their
perceptions of the comfort within their workplace. The respondents assess each of the
categories on a 7-point scale, from least comfortable (score=1) to most comfortable
(score=7). All the respondents completed this section so the sample sizes were 54 for
LEED-certified hospitals and 25 for non-LEED-certified hospitals.
The means and the standard deviations for each comfort categories are shown in
Table 8 for LEED and non-LEED-certified hospitals. The comparison can be
demonstrated more clearly with the profile plot shown in Figure 4.1. All the means for
LEED-certified hospitals are higher than neutral (score=4) while most of the means for
non-LEED-certified hospitals are equal to or less than neutral. Only lighting and indoor
natural settings were rated higher than neutral among non-LEED occupants. Noise and
temperature were the categories rated lowest by the occupants from both hospital types
comparing to other categories. However, occupants from LEED-certified hospitals rated
these two categories higher than those from non-LEED-certified hospitals.
Considering the variations of the responses, the difference in the means doesn’t
necessarily indicate the statistical difference. ANOVA tests were conducted to confirm
whether there is significant statistical difference between the responses from two
hospital types. The computed p-values for each question were shown in the last column
of Table 8. As can be seen from the data, p-values for all 10 categories were less than
0.001, which means the null hypothesis that the means among two or more groups are
equal was rejected. In other words, occupants from LEED and non-LEED-certified
hospitals differed principally for all the examined comfort categories.

45
Table 8 Means and p-values for each comfort categories between LEED and non-LEED-certified hospitals
Comfort category
Items LEED Non‐LEED F‐Value P‐value
Layout Mean 5.72 3.92 33.739 < 0.001
Std. deviation
1.204 1.441
Wayfinding Mean 5.61 3.88 31.426 < 0.001
Std. deviation
0.979 1.764
Materials, colors
Mean 6.24 3.92 91.195 < 0.001
Std. deviation
0.845 1.288
Lighting Mean 6.31 4.36 74.593 < 0.001
Std. deviation
0.722 1.287
Noise Mean 5.54 3.16 55.991 < 0.001
Std. deviation
1.145 1.625
Ventilation Mean 5.72 3.44 47.929 < 0.001
Std. deviation
1.188 1.685
Indoor natural settings
Mean 6.07 4.76 16.675 < 0.001
Std. deviation
0.988 1.877
Temperature Mean 4.94 2.84 33.842 < 0.001
Std. deviation
1.472 1.546
Humidity Mean 5.81 3.60 46.723 < 0.001
Std. deviation
1.117 1.732
Outdoor Lounge
Mean 6.20 2.92 95.479 < 0.001
Std. deviation
1.188 1.754

46
Figure 4.1 Profile plot of mean responses for 10 comfort questions for LEED (Black) and non-LEED-certified hospitals (Red).
47
4.3 A comparison of occupant satisfaction between building types
This research investigated the occupants’ satisfaction toward their workplace with
seven questions. The means as well as the standard deviation for each of the questions
were presented in Table 9. A profile plot was also presented in Figure 4.2 to show the
difference in the means more clearly.
To test the statistical difference in the responses from two hospital types, ANOVA
test was performed and the computed p-values for each question were shown in the last
column in Table 9. As can be seen from the results, three questions including “Happy to
work”, “Adequate personal space”, and “Excellent to work compared to other hospitals”
have p-values less than 0.05 and two questions including “Adequate safety and health
standards” and “Balance between work and personal life” have p-values less than
0.001. All these five questions showed statistical difference among the respondents from
two hospital types. The other two questions including “like the job” and “department is
well organized” have p-values higher than 0.005, which indicates there was no
significant difference for these two questions between respondents from two hospital
types thus they were irrelevant for the topic we are interested in this study.
According to this analysis, a new variable-overall satisfaction or “Caver”-was
computed by averaging the scores of the five relevant questions. Caver was then used as
satisfaction perception for all the discussions beyond this point.

48
Table 9 Means and p-values for each satisfaction question between LEED and non-LEED-certified hospitals
Satisfaction questions
Item LEED Non-LEED
F-Value P-value
Happy to work
Mean 6.43 6.00 4.032 0.048
Std. deviation 0.71 1.15
Like the job Mean
6.56 6.24 2.051 0.156 Std. deviation 0.71 1.23
Department is well organized
Mean 5.96 5.92 0.028 0.868
Std. deviation 0.93 1.32
Adequate safety & health standards
Mean 6.30 5.36 14.977 0.000
Std. deviation 0.79 1.35
Adequate personal space
Mean 5.76 4.96 4.548 0.036
Std. deviation 1.41 1.81
Balance between work and personal life
Mean 6.11 4.72 20.808 0.000
Std. deviation 0.83 1.88
Excellent to work
Mean 6.39 5.80 6.828 0.011
Std. deviation 0.85 1.08

49
Figure 4.2 Profile plot of mean responses for 7 satisfaction questions for LEED (Black) and non-LEED-certified hospitals (Red).

50
4.4 Correlation between perceived comfort and overall satisfaction
Once it’s confirmed there was statistical difference in the perception of comfort
and satisfaction among the staffs between two hospital types, it was identified which
comfort categories influenced the overall satisfaction toward their workplace and which
didn’t. Pearson Correlation analysis was then performed to test the correlation between
each comfort category and the overall satisfaction. The computed p-values were shown
in Table 10 for LEED-certified hospitals and Table 11 for non-LEED-certified hospitals.
Table 10 shows the correlation between each comfort category and the
satisfaction as well as that between every two comfort categories for LEED-certified
hospitals. The first line shows the correlation between each comfort category and overall
satisfaction. As can be seen here, 7 comfort categories including “hospital layout”,
“wayfinding”, “materials and colors”, “lighting”, “ventilation”, “indoor natural
settings”, and “humidity” showed higher correlation coefficient with p-values less than
0.05 which indicated positive strong correlation with overall satisfaction. On the other
hand, “noise”, “temperature”, and “outdoor lounge” gave p-values higher than 0.05
which indicated no significant correlation between them and overall satisfaction. In
other words, in LEED-certified hospitals, the perception toward the seven comfort
categories influenced their satisfaction toward their workplace significantly.
Table 11 shows the similar results as Table 10 but for non-LEED-certified
hospitals. Interestingly, all 10 comfort categories showed p-values higher than 0.05 with
satisfaction which means all the comfort categories were not significantly correlated
with satisfaction. In other words, in non-LEED-certified hospitals, the perception of all
ten investigated comfort categories didn’t influence the perceived satisfaction toward

51
their workplace. From Table 8 we learned that all the comfort categories were rated
mostly neutral by the staffs in non-LEED-certified hospitals. This might suggest the
satisfaction in non-LEED-certified hospitals were more likely influenced by other
factors other than comfort perception toward their workplace.

52
Table 10 Pearson correlation coefficients between overall satisfaction (Caver) and each comfort item for LEED-certified hospitals.
Item Sat (Caver)
Hospital Layout
Way- finding
Material & color
Lighting
Noise Ventilation
Indoor Natural Settings
Temperature
Humidity
Outdoor Lounge
Sat (Caver)
1.000 .532****
.344* .276* .354** .109 .531**** .376** .251 .340* .257
Hospital Layout
.532****
1.000 .483****
.141 .189 .097 .262 .319* .215 .368** .054
Way- finding
.344* .483****
1.000 .275* .363** .291* .068 .381*** .024 .157 .151
Materials & colors
.276* .141 .275* 1.000 .461****
.117 .256 .588**** -.050 .148 .345*
Lighting .354** .189 .363** .461**** 1.000 .385***
.434*** .337* .336* .378*** .254
Noise .109 .097 .291* .117 .385*** 1.000 .375** .114 .052 .242 .154
Ventilation .531****
.262 .068 .256 .434*** .375** 1.000 .243 .315* .273* .228
Indoor Natural Settings
.376** .319* .381*** .588**** .337* .114 .243 1.000 .159 .269* .437****
Temp .251 .215 .024 -.050 .336* .052 .315* .159 1.000 .567**** .309*

53
Table 10 (continued) Humidity .340* .368** .157 .148 .378*** .242 .273* .269* .567**
** 1.000 .427***
Outdoor Lounge
.257 .054 .151 .345* .254 .154 .228 .437**** .309* .427*** 1.000
The number of “*” following the correlation coefficients indicates the p-value and is defined as follows: *: 0.01< p < 0.05 **: 0.005 < p < 0.01 ***: 0.001 < p < 0.005 ****: p < 0.001

54
Table 11 Pearson correlation coefficients between overall satisfaction (Caver) and each comfort category for non-LEED-certified hospitals.
Item Sat (Caver)
Hospital Layout
Way- finding
Material & color
Lighting
Noise Ventilation
Indoor Natural Settings
Temperature
Humidity Outdoor Lounge
Sat (Caver)
1 0.112 -0.171 -0.13 0.033 -0.281 0.12 0.321 0.118 0.246 0.213
Hospital Layout
0.112 1 0.357 0.176 -0.051 0.273 0.29 0.07 0.443* 0.404 0.278
Way- finding
-0.171 0.357 1 0.454* 0.479* 0.516**
0.425* 0.381 0.497* 0.284 0.078
Materials & colors
-0.13 0.176 0.454* 1 0.32 0.484* 0.17 -0.112 0.37 0.321 0.2
Lighting 0.033 -0.051 0.479* 0.32 1 0.469* 0.577*** 0.21 0.386 0.46* 0.087
Noise -0.281 0.273 0.516** 0.484 0.469* 1 0.323 0.013 0.475* 0.32 0.034
Ventilation 0.12 0.29 0.425* 0.17 0.577***
0.323 1 0.153 0.556***
0.677**** 0.308
Indoor Natural Settings
0.321 0.07 0.381 -0.112 0.21 0.013 0.153 1 -0.043 -0.044 0.133
Temperature
0.118 0.443 0.497* 0.37 0.386 0.475* 0.556*** -0.043 1 0.784**** 0.164
Humidity 0.246 0.404* 0.284 0.321 0.46* 0.32 0.677**** -0.044 0.784****
1 0.318
Outdoor Lounge
0.213 0.278 0.078 0.2 0.087 0.034 0.308 0.133 0.164 0.318 1

55
4.5 The direct effect of perceived comfort categories on overall satisfaction
As can be seen from section 4.4, seven out of ten comfort categories were found
to be significantly correlated with satisfaction among the respondents from LEED-
certified hospitals. It would be also useful to rank these seven comfort categories in
order to identify which categories influence the perception of satisfaction more than the
others. In order to do this, simple linear regression was carried out between each
comfort category and satisfaction. The regression coefficient A indicates the degree and
the direction (positive or negative) of the correlation. C is the constant created by the
regression. P-values were also computed which indicated whether the coefficient was
significantly differ from zero.
The results are shown in Table 12. As can be seen, the p-values for noise,
temperature, and outdoor lounge were larger than 0.05 indicating the coefficient for
these categories did not differ from zero. This is consistent with the results shown in
Table 10. These results combined all the responses from all the buildings due to the
small sample size.

56
Table 12 Simple linear regression between overall satisfaction (Caver) and each comfort categories.
Independent
Variable
Coefficient Constant P‐value
Indoor Natural Settings
0.2274 4.838 0.005
Outdoor Lounge
0.129 5.414 0.060
Lighting 0.2921 4.371 0.009
Materials & colors
0.1946 5.002 0.044
Noise 0.057 5.901 0.434
Ventilation 0.2662 4.690 0.000
Temperature 0.101 5.713 0.068
Humidity 0.1817 5.159 0.012
Hospital Layout
0.2633 4.709 0.000
Way‐ finding
0.2095 5.040 0.011
Note: Dependent Variable = Overall Satisfaction

57
Chapter 5 Discussion
5.1 Staff perception of comfort
We measured ten aspects of comfort in this study and found that for all of the
questions, the healthcare staffs from the LEED-certified hospitals rated higher or feel
more comfortable than those from non-LEED-certified hospitals. Given very similar
climate in all of the hospitals during the study, this evidence does support the hypothesis
that green hospitals outperform conventional buildings in terms of aesthetics, serenity,
lighting, ventilation, acoustics and humidity.
In LEED-certified hospitals, hospital layout was scored 5.72 in average. As
suggested by a few studies (Shepley, 2002; Trites et al., 1970), the type of unit layout
(radial, single corridor, double corridor) influences amount of walking among nursing
staff, and time saved from walking was translated into reduced stress and fatigue. Radial
layout was found to reduce walking up to 50%, and was preferred by a majority of the
staffs (Trites et al., 1970). Well designed layout improves work flow and reduces
medical errors, which again reduces stress (Pierce et al., 1990). From Table 10, we
could see that the perception towards hospital layout was correlated with wayfinding
and indoor natural settings. This may suggest that in the LEED-certified hospitals
studied, hospital layout design is such that it facilitates the wayfinding system and
increases the chances of encountering an indoor natural setting. In the non-LEED-
certified hospital, hospital layout had an average score of 3.92, almost neutral. The
difference indicates a significant improvement on the layout design in the LEED-
certified hospitals which was appreciated by the staffs.

58
In LEED-certified hospitals, wayfinding had an average score of 5.61. The
problems of wayfinding system in hospitals were found to be costly and stressful and
have particular impacts on outpatients and visitors, who are more unfamiliar with the
hospital. The stress to the staffs comes from the direction for the visitors giving by them
other than information staff, which occupied a significant amount of time (Zimring,
1990). Other than the layout design discussed previously, the perception of wayfinding
by the staffs also correlated strongly with materials & colors, lighting, noise, and indoor
natural settings as shown in Table 10. Materials & colors and indoor natural settings
could add some coordinated elements in addition to the signage for wayfinding. For
example, change in flooring material could convey the message that the individual is
moving from one area into another. Better lighting should improve the visibility of the
signage to the visitors and patients. And lower noise level should reduce the stress for
the visitors and patients, which increases their chances of finding the correct way to
their destinations using the wayfinding system rather than asking a staff. All of these
could reduce the load for the staffs to answering wayfinding questions raised from
visitors and patients which helps to reduce the stress for them. The average score for
wayfinding in non-LEED-certified hospitals was 3.88, a little worse than neutral (=4.0),
indicating a slightly negative perception toward wayfinding system in the non-LEED-
certified hospital.
In LEED-certified hospitals, materials & colors had an average score of 6.20. The
use of low toxic & low emission materials significantly reduces indoor pollutant loads
thus improves indoor air quality. The color schemes used for interior design and the
colors introduced by natural plants help the staffs to recover from stress. This could be

59
the reason of strong correlation between the perception of materials & colors and
outdoor lounge. The average score of materials & colors was 3.92 for non-LEED-
certified hospitals indicating a nearly neutral perception.
In LEED-certified hospitals, lighting was scored 6.31 in average, which is the
highest among ten comfort categories under study. The introduction of more natural
light and the green features of the artificial lighting design not only reduce the energy
consumption but also are favored by the staff because they increase visual comfort and
reduce glare, which could have positive effect on the mood of the staffs. The comfort
lighting levels also improve staff effectiveness while performing critical tasks such as
dispensing medical prescriptions. It’s interesting to see from Table 10 that the perception
toward lighting was also correlated to noise, ventilation, temperature and humidity. This
is probably due to “spirit lifting”, as suggested by Boyce (Boyce, 1998). High quality
lighting eliminates distractions and discomforts, provides appropriate conditions for the
context, and adds an aesthetic element which may promote emotional functioning and
serve as a buffer to discomforts or stresses. The lifted spirit may then be reflected in the
higher perception of the overall indoor environment. The average score of lighting for
the non-LEED-certified hospital was 4.36, one of the highest among the ten categories;
although it’s significant lower than that for LEED-certified hospitals. Lighting in the
non-LEED-certified hospital may not offend or distract the staffs, but apparently fails to
lift the human spirit.
In LEED-certified hospitals, noise had an average score of 5.54, one of the lowest
rated categories. However, it was still rated significantly higher than neutral. As
discussed in numerous studies in literature, higher sound levels were perceived as
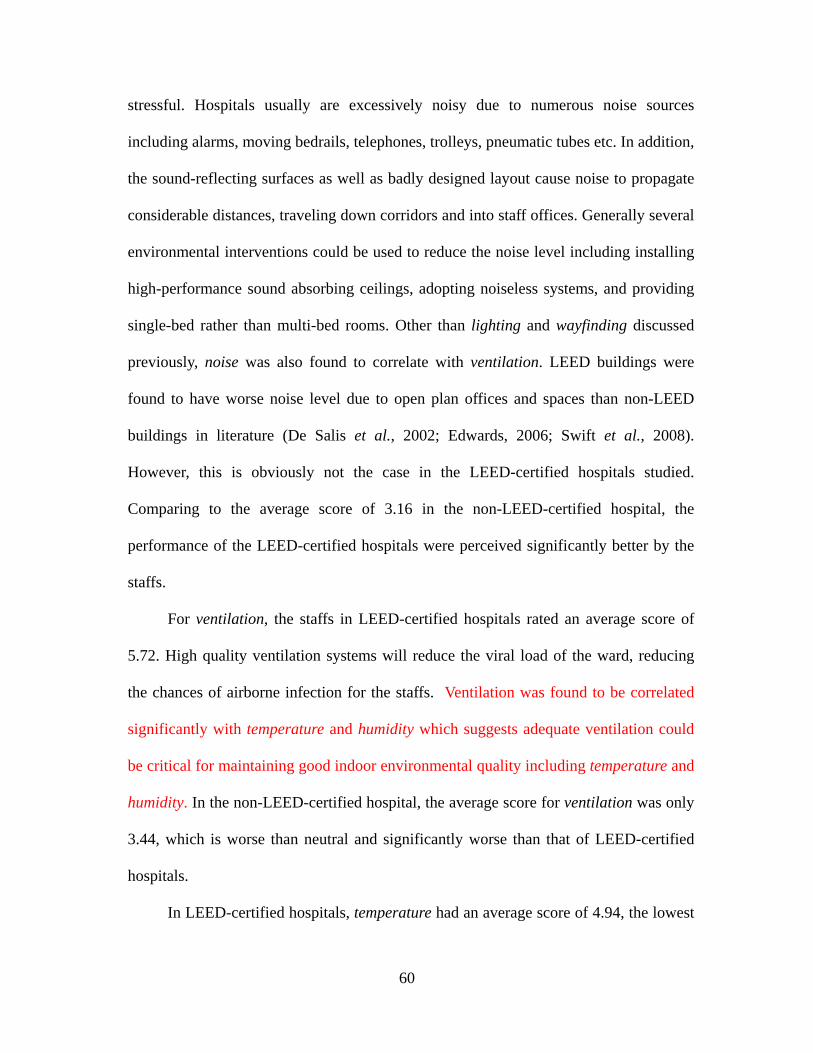
60
stressful. Hospitals usually are excessively noisy due to numerous noise sources
including alarms, moving bedrails, telephones, trolleys, pneumatic tubes etc. In addition,
the sound-reflecting surfaces as well as badly designed layout cause noise to propagate
considerable distances, traveling down corridors and into staff offices. Generally several
environmental interventions could be used to reduce the noise level including installing
high-performance sound absorbing ceilings, adopting noiseless systems, and providing
single-bed rather than multi-bed rooms. Other than lighting and wayfinding discussed
previously, noise was also found to correlate with ventilation. LEED buildings were
found to have worse noise level due to open plan offices and spaces than non-LEED
buildings in literature (De Salis et al., 2002; Edwards, 2006; Swift et al., 2008).
However, this is obviously not the case in the LEED-certified hospitals studied.
Comparing to the average score of 3.16 in the non-LEED-certified hospital, the
performance of the LEED-certified hospitals were perceived significantly better by the
staffs.
For ventilation, the staffs in LEED-certified hospitals rated an average score of
5.72. High quality ventilation systems will reduce the viral load of the ward, reducing
the chances of airborne infection for the staffs. Ventilation was found to be correlated
significantly with temperature and humidity which suggests adequate ventilation could
be critical for maintaining good indoor environmental quality including temperature and
humidity. In the non-LEED-certified hospital, the average score for ventilation was only
3.44, which is worse than neutral and significantly worse than that of LEED-certified
hospitals.
In LEED-certified hospitals, temperature had an average score of 4.94, the lowest

61
among the ten categories, indicating the staffs felt least comfortable in temperature
comparing to other categories. However, the score was still higher than neutral and
significantly higher than that from the non-LEED-certified hospital, which was 2.84 in
this case. Temperature was also found to strongly correlate with humidity. This is not
surprising because it was found that the perception of temperature is affected by the
relative humidity (Balaras et al., 2007; Wolkoff et al., 2007).
Humidity was scored 5.81 in average in LEED-certified hospitals. It was rated
significantly higher than that from the non-LEED-certified hospital. In the non-LEED-
certified hospital, humidity had an average of 3.60, which was worse than neutral.
The indoor natural settings was rated 6.07 in average in LEED-certified hospitals.
Many studies of populations other than hospital staffs showed strong evidence that even
fairly brief encounters with real or simulated nature settings can elicit significant
recovery from stress (Parsons, 2000). The result obtained in this study confirmed the
same observation for the healthcare staffs. The correlation between indoor natural
settings and outdoor lounge could be easily understood since they are very similar in
nature. In the non-LEED-certified hospital, indoor natural settings had an average score
of 4.76, which is the highest among the ten categories for the non-LEED-certified
hospital. However, the score from the LEED-certified hospitals studied is significantly
higher.
5.2 Staff perception of overall satisfaction toward the workplace
As shown in Table 9 and Figure 4.2, the staff perception of overall satisfaction
was statistically higher in the LEED-certified hospitals studied than that in the non-
LEED-certified hospital studied. This suggests that building type is related to the

62
satisfaction among healthcare staffs and green hospital design may have positive effects
resulting in higher level of satisfaction.
Although the perceptions of all the ten comfort categories under study were found
to show significant difference between two groups of staffs in LEED - or non-LEED-
certified hospitals, according to Table 12, only seven of them (hospital layout,
wayfinding, materials and colors, lighting, ventilation, indoor natural settings, and
humidity) showed significant correlation with satisfaction among the staffs from LEED-
certified hospitals. Noise, temperature and outdoor lounge were the three categories that
showed no correlation with satisfaction which means they didn’t influence the staffs’
satisfaction toward their workplace. The perception of the other seven categories were
found to directly influence the staff satisfaction and they were sorted by the degree of
influence from higher to lower as: lighting > ventilation > hospital layout > indoor
natural settings > wayfinding > materials & colors > humidity.

63
Chapter 6 Conclusion and Suggestions
This study measured perception of ten comfort categories and satisfaction of the
staffs from two LEED-certified hospitals and one non-LEED-certified hospital and
compared between the two hospital types, in order to answer the questions that whether
the building design of the hospitals influences the occupant perception of comfort and
satisfaction, and if yes, which comfort categories were responsible for the difference.
The results from this study showed that for all the ten comfort categories
examined, staff from the LEED-certified hospitals studied rated higher than those from
the non-LEED-certified hospital studied. Seven of the ten comfort categories were
found to correlate with the satisfaction level. Noise, temperature and outdoor lounge
were found to be irrelevant to the satisfaction level, although they perform significantly
better in the LEED-certified hospitals than the non-LEED-certified hospitals examined.
Direct effect was also identified between the building design of the hospitals and the
occupants’ satisfaction level.
6.1 Limitations of the study and suggestions for future studies
One limitation of this study, as described earlier, is the relatively small sample
size. For future studies, it would be more convincing to have a larger sample size
including the number of staffs participated and the number of hospitals studied.
Moreover, given that the two LEED-certified hospitals examined were built after
2000 while the non-LEED-certified hospital examined was built in 1960s, it’s possible
that some difference is due to the incorporation of new building design features which
may be also adopted in newly built non-LEED-certified hospitals. To reach a more

64
convincing conclusion that LEED-certified hospital design does improve the staff
perception of comfort and satisfaction, results from comparing newly built LEED-
certified hospitals and newly built LEED-certified hospitals will be needed.
In addition, the research presented in this thesis did not study the impact of built
environment on staff productivity which is critical for the quality of care delivered.
Actually the direct relation between built environment and occupant productivity has
been studied by a few researchers. For example, a research conducted in Denmark
assessed the impact of a 20-year old carpet on work performance (Wargocki, 1999).
Results shown that worker performed 6.5% better on a text entry task when the carpet
was absent. This study is significant for showing a direct effect of air quality on
performance. Menzies et al. (1997) also observed the workers’ productivity was
increased by 11% when the air velocity was tripled. Other than air quality and thermal
factors, lighting is found to be an important contributor to work performance. Hedge et
al. (Hedge, 1995) reported increased self productivity ratings with indirect lighting,
while Veitch show increased objective productivity with a parabolic louver system
(Veitch et al., 1998). It was estimated by Fisk et al. (1997) that productivity gains from
improvements of lighting can be as high as $125 billion annually. In addition, noise is
found to be particularly detrimental to high level cognitive work that requires logical
thinking, continuous access to working memory, and concentration (Heerwagen, 1990;
Sims, 1998). There are relatively few studies conducted for healthcare staffs. It would
be very valuable to provide solid data supporting the hypothesis that green design of the
healthcare facilities does improve the productivity of the staffs and the quality of care
they deliver.

65
6.2 Implications for future hospital design
The results obtained from this study suggested that the green features
implemented in LEED healthcare facilities may have positive effect on the staff
perception of comfort and satisfaction. For all the categories studied, staffs from the
LEED-certified hospitals examined rated “comfortable” while those from the non-
LEED-certified hospital examined rated mainly neutral.
In Metro Hospital, radial layout design is adopted which is known to reduce the
amount of walking by the staffs. In addition, the radial design also helps to maximize
the introduction of natural light into most patient rooms and offices. The better
perception of the layout design by the staffs from the LEED-certified hospitals suggests
that the radial layout design is beneficial and should be recommended in the future
design.
Better wayfinding and signing system could reduce stress possibly because of
fewer questions from the patients and visitors about the route. In the LEED-certified
hospitals studied, the floor materials or the color of the carpets are different in different
areas. This adds some coordinated elements in addition to the signage for wayfinding.
The carpet patterns are the same throughout the entire hospital in the non-LEED
hospital studied. The difference in the perception of the wayfinding system suggests the
future hospital design should consider using different floor materials and/or floor colors
to aid wayfinding.
Indoor environment in the LEED-certified hospitals studied is significantly better
and is reflected by the higher perception of the comfort. The lighting design in the
LEED-certified hospitals maximizes the introduction of natural light. This not only
66
saves energy, but also helps to reduce stress. In contrast, in the non-LEED-certified
hospital studied, very limited natural lighting is available in the building. In Botsford
Cancer Center (LEED-certified), a filtration system is installed in the ventilation system
to filter 80% the particles smaller than 1 µm. And in both LEED-certified hospitals,
materials and chemicals with very low emission are used. All these features significantly
improve the indoor air quality and are greatly appreciated by the staffs working in the
environment. In future hospital design, it would be beneficial to incorporate these
features which help to provide healthier indoor environments.
Both the LEED-certified hospitals studied have a healing garden which is not
found in the non-LEED-certified hospital. Healing garden not only helps the recovery of
the patients but also provide an outdoor for the staffs to relax and to connect with the
nature, which significantly reduces the stress and fatigue of the staffs. As indicated by
the results from this study, healing gardens should definitely be incorporated in future
hospital design.

67
Appendix

68
Appendix A. Questionnaire
Impact of green building design on healthcare occupants
------with a focus on healthcare staff
Previous studies have shown that indoor environmental factors such as
ventilation, lighting, noise and contact with nature can influence the occupant
perception of the working conditions. But it remains unclear till now that whether a
green hospital is more comfortable to work in. Since the green healthcare design
is increasingly adopted in practice, it is important to ensure the staff needs are
being addressed and the claims of performance are warranted. This questionnaire
aims to research the impact of built environment on the comfort and satisfaction
among healthcare staffs. Your response will be used only for this research and will
be coded. Your information will never be exposed.
There is no correct or wrong answers. If you honestly answer these questions
based on your usual thoughts and perceptions, it will be helpful in collecting
accurate data. You can voluntarily participate and answer any questions or not. You
may stop at any point without any penalty.
Thank you so much for your cooperation.
Contact: 1565 Spartan Village Apt F, Lansing, MI
Ying Huang
Tel: 5175802199

69
CONSENT FOR PARTICIPATION IN A RESEARCH PROJECT MICHIGAN STATE UNIVERSITY
PI Name: Suk-Kyung Kim, Ph.D. Co-PIs: Ying Huang Study Title: Impact of built environment on healthcare occupants------with a
focus on healthcare staff You are invited to participate in a survey research study that will take approximately 15 minutes and will ask your perceptions of your building environment
This survey is for a research study entitled “Impact of built environment on healthcare occupants------with a focus on healthcare staff.” The purpose of this survey is to investigate the impact of built environment on the comfort and satisfaction among healthcare staffs. The survey will ask you about your personal information, perceptions to your working environments, and perceptions of your satisfaction. The respondents of this survey should be healthcare staffs working in a hospital. This study will take approximately 15 minutes. 1. Risks and Benefits
There will be only minimal risk associated with the participation in this study. There is no monetary compensation for participating in this survey. But, your response is scholarly valuable because the analysis of the responses from participants including you will be analyzed for building place attachment theories. 2. Confidentiality
All information about you and your participation in this study will be confidential and your file will be kept private in locked file cabinets for the next 5 years, after which time the files will be destroyed. Published results from this study will not mention any names of participants and all associated information will be treated confidentially to the extent allowed by law. The records of this study will be kept private. No identifiers linking you to the study will be included in any sort of report that might be published. Research records will be stored securely and only Dr. Suk-Kyung Kim, and Ying Huang will have access to the records. 3. Voluntary Participation
Participation in the study is voluntary. If you agree to be in the study, but later change your mind, you may drop out at any time. Your decision whether or not to participate will not affect your current or future relations with Michigan State University. If you decide to participate, you are free to refuse to answer any of the questions that may make you uncomfortable. You are free to withdraw at any time without any penalty. Questions
If you have any questions about this survey, please contact Dr. Suk-Kyung Kim at [email protected] or 517-353-9367, or Ying Huang at [email protected] or 517-282-2468. If you have questions or concerns about your role and rights as a research participant, would like to obtain information or offer input, or would like to register a complaint about this study, you may contact, anonymously if you wish, the Michigan State University's Human Research Protection Program at 517-355-2180, Fax 517-432-4503, or e-mail [email protected] or regular mail at 202 Olds Hall, MSU, East Lansing, MI 48824.
By completing and returning this survey you are agreeing to participate in this research. Thank you so much for your time.

70
Part 1: Background information 1. What is your gender?
a) Female b) Male
2. What is your age?
a) 20 years or under b) 21-30 years c) 31-40 years d) 41-50 years e) 51-60 years f) over 60 years
3. What is the type of your work?
a) Doctor b) Nurse c) Administrator d) Other
4. Please specify the department you are working for (surgical, internal
medicine, e.g.)
5. Are you working independently or with patients?
6. How long have you worked in the building? years months
Part 2: Perception of the working conditions Please rate your working condition on each of the following scales
1 means strongly disagree and 7 means strongly agree. 1. Hospital layout is well designed:
2. Wayfinding and signing system is effective:
3. The painting material, color and
the pattern of the wall, floor and
furniture are pleasant:
1 2 3 4 5 6 7
1 2 3 4 5 6 7

71
1 2 3 4 5 6 7
4. The color and brightness of lighting are comfortable:
5. The noise level is low: 6. The ventilation system is effective: 7. Indoor natural settings and
gardens help reduce stress: 8. I never feel too hot during the
summer nor too cold during the winter in the building:
9. The humidity is comfortable all the time through the year:
10. Outdoor lounge is available and
comfortable:
1 2 3 4 5 6 7
1 2 3 4 5 6 7
1 2 3 4 5 6 7
1 2 3 4 5 6 7
1 2 3 4 5 6 7
1 2 3 4 5 6 7
1 2 3 4 5 6 7
Part 3: Perception of your satisfaction towards your working conditions (1 means strongly disagree, 7 means strongly agree)
1. I am happy to work in this hospital.
2. I like my job and the work I do. 3. My department is well organized
for the work it does.
1 2 3 4 5 6 7
1 2 3 4 5 6 7
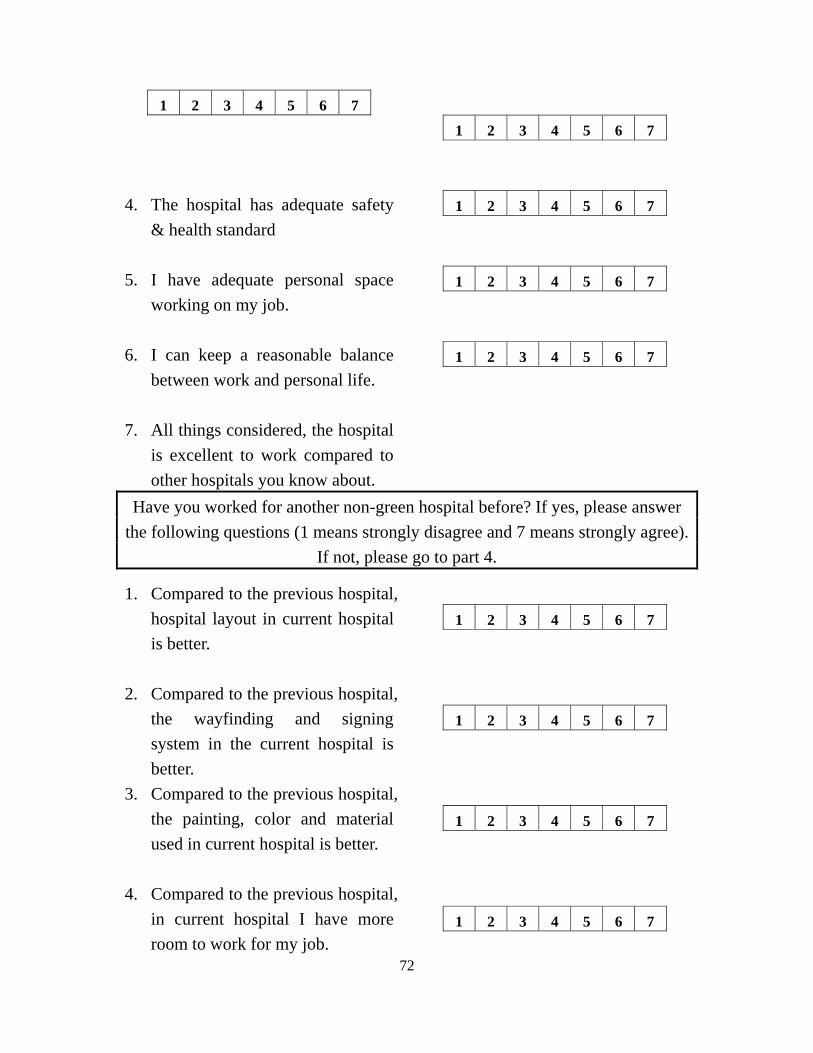
72
1 2 3 4 5 6 7
4. The hospital has adequate safety
& health standard 5. I have adequate personal space
working on my job. 6. I can keep a reasonable balance
between work and personal life.
7. All things considered, the hospital is excellent to work compared to other hospitals you know about.
1 2 3 4 5 6 7
1 2 3 4 5 6 7
1 2 3 4 5 6 7
1 2 3 4 5 6 7
Have you worked for another non-green hospital before? If yes, please answer the following questions (1 means strongly disagree and 7 means strongly agree).
If not, please go to part 4.
1. Compared to the previous hospital, hospital layout in current hospital is better.
2. Compared to the previous hospital,
the wayfinding and signing system in the current hospital is better.
3. Compared to the previous hospital, the painting, color and material used in current hospital is better.
4. Compared to the previous hospital,
in current hospital I have more room to work for my job.
1 2 3 4 5 6 7
1 2 3 4 5 6 7
1 2 3 4 5 6 7
1 2 3 4 5 6 7

73
5. Compared to the previous hospital, I can keep a better balance between work and personal life.
6. Compared to the previous hospital,
the color and brightness of lighting in current hospital are better.
7. Compared to the previous hospital, noise in current hospital is lower.
8. Compared to the previous hospital,
ventilation in current hospital is more effective.
9. Compared to the previous hospital,
temperature in current hospital is more comfortable throughout the year.
10. Compared to the previous hospital, humidity in current hospital is more comfortable.
1 2 3 4 5 6 7
1 2 3 4 5 6 7
1 2 3 4 5 6 7
1 2 3 4 5 6 7
1 2 3 4 5 6 7
1 2 3 4 5 6 7

74
Part 4: Open questions
11. Describe any changes to your workplace that would make you feel more comfortable.
________________________________________________________________________________________________________________________________________________________________________________________________ 12. Describe any suggestions to improve the work environment in your hospital. ________________________________________________________________________________________________________________________________________________________________________________________________ 13. What is it that you are not comfortable with in you job right now?
_____________________________________________________________________
__________________________________________________________________________
__________________________________________________________________

75
Reference

76
References
Balaras, C. A., Dascalaki, E., & Gaglia, A. (2007). HVAC and indoor thermal conditions in hospital operating rooms. Energy And Buildings, 39(4), 454‐470.
Banbury, S., & Berry, D. C. (1998). Disruption of office‐related tasks by speech and office noise. British Journal Of Psychology, 89, 499‐517.
Bayo, M. V., Garcia, A. M. (1995). Noise levels in an urban hospital and workers' subjective responses. Archives of Environmental Health, 50(3), 247‐251.
Beauchemin, K. M., & Hays, P. (1996). Sunny hospital rooms expedite recovery from severe and refractory depressions. Journal Of Affective Disorders, 40(1‐2), 49‐51.
Beauchemin, K. M., & Hays, P. (1998). Dying in the myocardial in the dark: sunshine, gender and outcomes in infarction. Journal Of The Royal Society Of Medicine, 91(7), 352‐354.
BHP. (2004). What is Behind HRSA's Projected Supply, Demand, and Shortage of Registered Nurses. ftp://ftp.hrsa.gov/bhpr/workforce/behindshortage.pdf
Bilchik, G. S. (2002). A better place to heal. Health Forum Journal, 45(4), 10.
Billeter‐Koponen, S., & Freden, L. (2005). Long‐term stress, burnout and patient‐nurse relations: qualitative interview study about nurses' experiences. Scandinavian Journal Of Caring Sciences, 19(1), 20‐27.
Blomkvist, V., Eriksen, C. A., Theorell, T., Ulrich, R. S., & Rasmanis, G. (2004). Acoustics and psychosocial environment in coronary intensive care. Occupational and Environmental Medicine.
Bordass, W. (2000). Performance Spaces. The Architects' Journal, 56‐57.
Boyce, P. (1998, May 9‐10). Lighting Quality: The Unanswered Questions. Paper presented at the CIE Symposium on Lighting Quality, Ottawa, Canada.
Bringslimark, T., Hartig, T., & Patil, G. G. (2009). The psychological benefits of indoor plants: A critical review of the experimental literature. Journal Of Environmental Psychology, 29(4), 422‐433.
Bristol, N. (2007). US health‐care providers go “green”. The Lancet, 369(9560), 453‐454.
Browning, W. a. R., J. (1995). Greening and the bottom line: increasing productivity through energy efficient design. Paper presented at the Proceedings of the second international green buildings conference and exposition, Gaithersburg, MD.
Buchanan, T. L., Barker, K. N., Gibson, J. T., Jiang, B. C., & Pearson, R. E. (1991). Illumination and errors in dispensing. American Journal of Hospital Pharmacy, 48(10), 2137‐2145.
Collins, B. L. (1975). Windows and People (Vol. 70). Washington, DC: NBS BSS.

77
Collins, B. L. (1993). Evaluation of Subjective Response to Lighting Distributions: A literature Review. Washington, DC: United States Department of Commerce, National Institute of Standards and Technology, NISTIR 5119.
Cooper Marcus, C., Barnes, M. (1995). Gardens in healthcare facilities: Uses, therapeutic benefits, and design recommendations.
De Salis, M. H. F., Oldham, D. J., & Sharples, S. (2002). Noise control strategies for naturally ventilated buildings. Building And Environment, 37(5), 471‐484.
Draper, N. (1998). Applied regression analysis.
Edwards, B. (2006). Benefits of Green Offices in the UK. Sustainable Development, 14, 190‐204.
Fisk, W. J. A. H. R. (1997). Estimates of Improved Productivity and Health from Better Indoor Environments. Indoor Air, 7, 158‐172.
Galasiu, A. D., & Veitch, J. A. (2006). Occupant preferences and satisfaction with the luminous environment and control systems in daylit offices: a literature review. Energy And Buildings, 38(7), 728‐742.
Gastle, N. (2006). An instrument to measure job satisfaction of nursing home administrators. BMC Medical Research Methodology, 6(47).
Hedge, A. F. D. B. (1995). Effects of lensed indirect and parabolic lighting on the satisfaction, visual health, and productivity of office workers. Ergonomics, 38, 260‐280.
Heerwagen, J. H. (1990). Affective Functioning, Light Hunger, and Room Brightness Preferences. Environment and Behavior, 22(5), 608‐635.
Heerwagen, J. H. (2000). Green Buildings, Organizational Success, and Occupant Productivity. Building Research and Information, 28(5), 353‐367.
Heerwagen, J. H., & Orians, G. H. (1986). Adaptations to windowlessness: a study of the use of visual decor in windowed and windowless offices. Environment and Behavior, 18(5), 623‐630.
Hilton, B. A. (1985). Noise In Acute Patient‐Care Areas. Research In Nursing & Health, 8(3), 283‐291.
Howell, D. (2002). Statistical methods for psychology.
Hua, Y., Oswald, A., & Yang, X. D. (2010). Effectiveness of daylighting design and occupant visual satisfaction in a LEED Gold laboratory building. Building And Environment, 46(1), 54‐64.
Hummelgaard, J., Juhl, P., Saebjornsson, K. O., Clausen, G., Toftum, J., & Langkilde, G. (2007). Indoor air quality and occupant satisfaction in five mechanically and four

78
naturally ventilated open‐plan office buildings. Building And Environment, 42(12), 4051‐4058.
Institute of Medcine. (2001). Crossing the Quality Chasm: A new health system for the 21st century (pp. 1). Washington, DC: National Academy Press.
JCAHO. (2002). Health care at the crossroad: Strategies for addressing the evolving nursing crisis. Joint Commission on Accreditation of Healthcare Organizations.
Jensen, W., Fischer, B., Wentz, T., & Camara, G. (2008). A Proposed Leed Standard For Indoor Acoustical Quality. Journal Of Green Building, 3(1), 93‐101.
Jiang, S., Huang, L., Chen, X., Wang, J., Wu, W., Yin, S., et al. (2003). Ventilation of wards and nosocomial outbreak of severe acute respiratory syndrome among healthcare workers. Chinese Medical Journal, 116(9), 1293‐1297.
Jones, C. B. (1990). Staff Nurse Turnover Costs.2. Measurements And Results. Journal Of Nursing Administration, 20(5), 27‐32.
Kaarlela‐Tuomaala, A., Helenius, R., Keskinen, E., & Hongisto, V. (2009). Effects of acoustic environment on work in private office rooms and open‐plan offices ‐ longitudinal study during relocation. Ergonomics, 52(11), 1423‐1444.
Keep, P., James, J., & Inman, M. (1980). Windows In The Intensive Therapy Unit. Anaesthesia, 35(3), 257‐262.
Kisslinger, J. (Producer). (2004, www.planetforlife.com). The global energy crisis.
Krogstad, A. L., and L. Jorulf. (1991). A prospective study of indoor climate problems at different temperatures in offices. Goteborg, Sweden: Volvo Truck Corp.
Larsen, L., Adams, J., Deal, B., Kweon, B. S., & Tyler, E. (1998). Plants in the workplace ‐ The effects of plant density on productivity, attitudes, and perceptions. Environment And Behavior, 30(3), 261‐281.
Leather, P., Pyrgas, M., Beale, D., & Lawrence, C. (1998). Windows in the workplace ‐ Sunlight, view, and occupational stress. Environment And Behavior, 30(6), 739‐762.
Lee, Y. S., & Kim, S. K. (2008). Indoor Environmental Quality in LEED‐Certified Buildings in the US. Journal Of Asian Architecture And Building Engineering, 7(2), 293‐300.
Locke, E. A. (1976). The nature and causes of jobsatisfaction (1st ed.). Chicago: Rand‐McNally.
Menzies, D., & Chan, C.‐H. (1997). Effect of a new ventilation system on health and well‐being of office workers. Archives of Environmental Health, 52(5), 360‐368.
Menzies, D., Fanning, A., Yuan, L., & FitzGerald, J. M. (2000). Hospital ventilation and risk for tuberculosis infection in Canadian health care workers. Annals of Internal Medicine, 133(10), 779‐789.

79
National Institute of Building Sciences (Producer). (2010, Dec 2010). Sustainable. Retrieved from http://www.wbdg.org/design/sustainable.php
Norbeck, J. S. (1985). Perceived job stress, job satisfaction, and psychological symptoms in critical care nursing. Research in Nursing & Health, 8(3), 253‐259.
Ozdemir, A. (2010). The effect of window views' openness and naturalness on the perception of rooms' spaciousness and brightness: A visual preference study. Scientific Research And Essays, 5(16), 2275‐2287.
Parsons, R., & Hartig, T. (2000). Environmental psychophysiology Handbook of psychophysiology (pp. 815‐846). New York: Cambridge University Press.
Paul, W. L., Taylor, P.A. (2008). A comparison of occupant comfort and satisfaction between a green building and a conventional building. Building and Environment, 43, 1858‐1870.
Pierce, R. A., Rogers, E. M., Sharp, M. H., & Musulin, M. (1990). Outpatient Pharmacy Redesign To Improve Work Flow, Waiting Time, And Patient Satisfaction. American Journal Of Hospital Pharmacy, 47(2), 351‐356.
Preiser, W. F. E., Rabinowitz, H. Z., & White, E. T. (1998). Post occupancy evaluation: Van Nostrand Reinhold.
Roulet, C. A., Johner, N., Foradini, F., Bluyssen, P., Cox, C., Fernandes, E. D., et al. (2006). Perceived health and comfort in relation to energy use and building characteristics. Building Research And Information, 34(5), 467‐474.
Scully, R. (1980). Stress In The Nurse. American Journal Of Nursing, 80(5), 911‐915.
Sharma, A., Sharp, D. M., Walker, L. G., & Monson, J. R. T. (2008). Stress and burnout among colorectal surgeons and colorectal nurse specialists working in the National Health Service. Colorectal Disease, 10(4), 397‐406.
Shepley, M. M. (2002). Predesign and postoccupancy analysis of staff behavior in a neonatal intensive care unit. Childrens Health Care, 31(3), 237‐253.
Simonson, C. J., Salonvaara, M., & Ojanen, T. (2002). The effect of structures on indoor humidity ‐ possibility to improve comfort and perceived air quality. Indoor Air, 12(4), 243‐251.
Sims, W. R. F. D. B. (1998). Teamspace Strategies. Atlanta, GA: IDRC Foundation.
Smedbold, H., Catrine, A., Unimed, S., Nilsen, A., Norback, D., & Hilt. (2002). Relationships between indoor environments and nasal inflammation in nursing personnel. Archives of Environmental Health, 57(2), 155‐161.
Smith‐Jackson, T. L., & Klein, K. W. (2009). Open‐plan offices: Task performance and mental workload. Journal Of Environmental Psychology, 29(2), 279‐289.
80
The greening of Healthcare, Steelcase (2002).
Steel, R. P. (2002). Turnover theory at the empirical interface: Problems of fit and function. Academy Of Management Review, 27(3), 346‐360.
Sundstrom, E., Town, J. P., Rice, R. W., Osborn, D. P., & Brill, M. (1994). Office Noise, Satisfaction, And Performance. Environment And Behavior, 26(2), 195‐222.
Swift, P. B., & Stead, M. J. (2008). Tall Building Acoustics And The Challenges Of Sustainability. Structural Design Of Tall And Special Buildings, 17(5), 977‐987.
Topf, M., & Dillon, E. (1988). Noise‐induced stress as a predictor of burnout in critical care nurses. Heart Lung, 17(5), 567‐574.
Trites, D. K., Galbraith, F. D., Sturdavant, M., & Leckwart, J. F. (1970). Influence Of Nursing‐Unit Design On Activities And Subjective Feelings Of Nursing Personnel. Environment And Behavior, 2(3), 303‐334.
Ulrich, R. S. (1984). View Through A Window May Influence Recovery From Surgery. Science, 224(4647), 420‐421.
Ulrich, R. S. (1992). How Design Impacts Wellness. Health Forum Journal, 35(5), 20.
Ulrich, R. S. (1999). Effects of gardens on health outcomes: theory and research Healing Gardens: Therapeutic Benefits and Design Recommendations (pp. 27‐86). New York: John Wiley.
Ulrich, R. S., Simons, R. F., & Zelson, M. (1991). Stress recovery during exposure to natural and urban environments. Journal of Environmental Psychology, 11, 201‐230.
Ulrich, R. S., Zimring, C., Zhu, X. M., DuBose, J., Seo, H. B., Choi, Y. S., et al. (2008). A Review of the Research Literature on Evidence‐Based Healthcare Design. Herd‐Health Environments Research & Design Journal, 1(3), 61‐125.
USGBC. (2009). LEED 2009 for healthcare. Retrieved on March 1st, 2010 from http://www.usgbc.org/
Valbjorn, O. L., B.V. Pedersen, & P.Skov. (1995, September 1995). A multi disciplinary study of working conditions in 3 European office buildings, Healthy Buildings.
Veitch, J. A., & Newsham, G. R. (1998). Lighting quality and energy‐efficiency effects on task performance, mood, health, satisfaction, and comfort. Journal of the Illuminating Engineering Society, 27(1), 107.
Wargocki, P., D.P. Wyon, Y.K. Baik, G. Clausen, P.O. Fanger. (1999). Perceived air quality, SBS symptoms, and productivity in an office at two polution loads. Indoor Air'99, 2, 131‐136.
Wheeler, G. (1998, March 12‐14). Presentation of ASID survey findings. Paper presented at the AIA Conference on Highly Effective Buildings, Cincinnati, OH.

81
Wolkoff, P., & Kjaergaard, S. K. (2007). The dichotomy of relative humidity on indoor air quality. Environment International, 33(6), 850‐857.
Xie, H., Gan, X. A., & Ma, F. (2009). Field study of thermal comfort and indoor air quality in gymnasium. Journal Of Central South University Of Technology, 16, 48‐54.
Zajac, L. (2007). Greening Healthcare: Ideas for Your Campus, from http://action.psr.org/site/DocServer/GreeningHealthcare.pdf?docID=2643
Zhang, Y. F., & Altan, H. (2011). A comparison of the occupant comfort in a conventional high‐rise office block and a contemporary environmentally‐concerned building. Building And Environment, 46(2), 535‐545.
Zimring, C. (1990). The costs of confusion: Non‐monetary and monetary costs of the Emory University hospital wayfinding system.