Impact of FSC-certified logging on bird communities in...
49
Impact of FSC-certified logging on bird communities in Berau District, East Kalimantan, Indonesia Andreas Bundsen Arbetsgruppen för Tropisk Ekologi Minor Field Study 191 Committee of Tropical Ecology ISSN 1653-5634 Uppsala University, Sweden November 2014 Uppsala
Transcript of Impact of FSC-certified logging on bird communities in...
Impact of FSC-certified logging on bird communities in Berau District, East Kalimantan, Indonesia
Andreas Bundsen
Arbetsgruppen för Tropisk Ekologi Minor Field Study 191 Committee of Tropical Ecology ISSN 1653-5634 Uppsala University, Sweden
November 2014 Uppsala

Impact of FSC-certified logging on bird communities in Berau District, East Kalimantan, Indonesia
Andreas Bundsen
Supervisors: Prof. Mats Björklund, Department of Ecology and Genetics, Animal Ecology, Uppsala University, Sweden. Prof. Hans de Iongh, Institute of Environmental Sciences, Leiden University, The Netherlands. MSc. Arbainsyah, Institute of Environmental Sciences, Leiden University, The Netherlands.

Abstract Tropical forests hold a major part of the worlds’ biodiversity and play important roles when it comes
to ecosystem functions and services. However, these forests continue to be degraded worldwide and
establishing protected areas does not seem to be enough to slow this process down. Hence,
conservation efforts outside protected areas, in areas such as production forest, are of great
importance. Nowadays there is an increase in the use of various certifications schemes such as the
FSC (Forest Stewardship Council), which aims at preserving biodiversity, but to date there has been
little quantitative evidence to support this. This study was aimed at investigating the impact of FSC-
certified logging on bird communities in Berau district, East Kalimantan, Indonesia. Birds have been
shown to be one of the best and most valuable indicators for biodiversity monitoring. I conducted
bird surveys in four sites; one primary site and three FSC-certified logged sites. Bird community
composition differed between the sites, but when investigating difference between the sites in
different diet- and feeding layer guilds, few differences were found. No differences in Shannon
diversity index, overall species richness, abundance, number of genera and families were found
either. However, due to illegal logging in the primary (control) site and only one replicate of this kind
of site no conclusion on the impact of FSC-certified logging on bird communities can be drawn.
Future studies should include several proper control sites in order to truly investigate the impact of
FSC-certified logging on bird communities and biodiversity.
Key words: Birds, Sustainable forest management, FSC-certification, Selective logging, Tropical rain
forest

Table of Contents 1. Introduction ............................................................................................................................. 1
1.1 General .......................................................................................................................................... 1
1.2 Sustainable forest management and forest certifications ............................................................ 1
1.3 Birds and logging ........................................................................................................................... 2
2. Materials and Methods ............................................................................................................. 4
2.1 Research area ................................................................................................................................ 4
2.2 Data collection ............................................................................................................................... 6
2.3 Guilds ............................................................................................................................................. 7
2.4 Data analysis and statistics ............................................................................................................ 8
3. Results ................................................................................................................................... 11
3.1 Shannon diversity index and species uniqueness ....................................................................... 12
3.2 Species richness, abundance and number of genera and families ............................................. 13
3.3 Bird community composition ...................................................................................................... 13
3.4 Diet guilds .................................................................................................................................... 14
3.4.1 Frugivores ............................................................................................................................. 14
3.4.2 Frugiovores/carnivores ......................................................................................................... 15
3.4.3 Frugivores/Insectivores......................................................................................................... 15
3.4.4 Insectivores ........................................................................................................................... 15
3.4.5 Insectivores/Carnivores ........................................................................................................ 15
3.4.6 Nectarivores.......................................................................................................................... 15
3.5 Feeding layer guilds ..................................................................................................................... 16
3.5.1 Arboreal frugivores ............................................................................................................... 16
3.5.2 Arboreal frugivores/carnivores ............................................................................................. 16
3.5.3 Arboreal frugivores/insectivores .......................................................................................... 16
3.5.4 Arboreal insectivores ............................................................................................................ 17
3.5.5 Arboreal insectivores/carnivores .......................................................................................... 17
3.5.6 Arboreal nectarivores ........................................................................................................... 17
3.5.7 Understorey frugivores /insectivores ................................................................................... 17
3.5.8 Understorey insectivores ...................................................................................................... 18
3.5.9 Understorey nectarivores ..................................................................................................... 18
3.5.10 Terrestrial frugivores/insectivores ...................................................................................... 18
3.5.11 Terrestrial insectivores ....................................................................................................... 18
3.5.12 Terrestrial insectivores/carnivores ..................................................................................... 19

4. Discussion .............................................................................................................................. 20
4.1 Shannon diversity index and species uniqueness ....................................................................... 20
4.2 Species richness, total abundance and number of genera and families ..................................... 21
4.3 Bird community composition ...................................................................................................... 21
4.4 Diet guilds .................................................................................................................................... 22
4.4 Feeding layer guilds ..................................................................................................................... 23
4.4.1 Arboreal guilds...................................................................................................................... 23
4.4.1 Understorey guilds ................................................................................................................ 24
4.4.1 Terrestrial guilds ................................................................................................................... 25
5. Conclusion .............................................................................................................................. 26
6. Acknowledgements ................................................................................................................ 26
7. References ............................................................................................................................. 27
Appendix ................................................................................................................................... 34

1
1. Introduction
1.1 General Tropical forest ecosystems are known for their rich biodiversity (Jennings et al., 2001; Sheil and van
Heist, 2000). They also play important roles when it comes to ecosystem services such as regional
hydrology, carbon storage and global climate (Laurance, 1999). However, tropical forests continue to
be destroyed worldwide and the pace does not seem to be slowing down (FAO, 2012; Laurance,
2007). Agricultural expansion is the main driving force of deforestation (Boucher et al., 2011; Geist
and Lambin, 2002; Kissinger et al., 2012), industrial logging is a secondary driver (Fimbel et al., 2001).
All logging has negative effects on the function, structure and composition of the forest and it leads
to fragmentation and degradation (Fimbel et al., 2001). Logging also leads to increased accessibility
for local human populations through logging roads (Kartawinata and Vayda, 1984). This may in turn
lead to changes in biodiversity in the remaining forests due to increased illegal logging and hunting
(Curran et al., 2004; Hartshorn and Bynum, 2001; Laurance, 1998).
1.2 Sustainable forest management and forest certifications In order to conserve biodiversity, as well as sustain important ecosystem functions and services,
protected areas are established worldwide. Even though most authorities consider such areas to be
the best strategy for conservation (Bruner et al., 2001; Chape et al., 2005), it is also recognized that
the economic demands, social pressure on land and the high costs lead to limited size, number,
distribution and protection of such areas, especially in lowland tropical forests (Joppa et al., 2009;
Rodrigues et al., 2004). Hence, conservation efforts outside protected areas, in areas such as
production forest, are of great importance.
In terms of conserving biodiversity, sustainable forest management (SFM) is preferable to all other
forest use practices apart from complete protection (Putz et al., 2000). SFM can more specifically be
defined as `the stewardship and use of forests and forest lands in a way and at a rate that maintains
their biodiversity, productivity, regeneration capacity, vitality and their potential to fulfil, now and in
the future, a role of ecological, economic and social functions, at local, national and global levels, and
that does not cause (long term) damage to the ecosystem.’ (The Ministerial Conference on the
Protection of Forests in Europe 1993, as quoted in Myers 1996). Growing environmental awareness
and consumer demand for more responsible and sustainable practices have also led to an increase in

2
the development of voluntary timber certifications such as the FSC (Forest Stewardship Council)
(Upton and Bass, 1996; Viana et al., 1996; Vogt et al., 2000).
SFM and forest certifications usually involve some sort of selective logging (or low impact logging)
where stems above a certain diameter in breast height (d.b.h) of specific economically valuable tree
species are logged in specific areas (Fimbel et al., 2001). However, it is important to note that the
standards and the outcome of these practices are not fixed. They often reflect compromises between
different incompatible interests, and trade-offs between what is practically feasible and what is
desired (Gullison, 2003; Rametsteiner and Simula, 2003).
Apart from tree species diversity, biodiversity is rarely determined directly during certifications audits
in certification systems such as FSC. The reason for this is that monitoring biodiversity most often is
costly and time-consuming (van Kuijk et al., 2009). Instead, attempts to retain biodiversity are done
through measurements of management processes and protected habitats (Lindenmayer et al., 2000).
Hence, whether it can be assumed that logging through FSC-certification actually is sustainable in
terms of maintaining biodiversity is still a question. In fact, there is little quantitative evidence
showing this to date (Van Kuijk et al., 2009).
1.3 Birds and logging Bird community composition is strongly influenced by vegetation structure through insect diversity
and preservation of fruiting and seeding trees. Hence, birds are one of the best and most valuable
taxa to use when monitoring impacts of logging on biodiversity (Barlow and Peres, 2004; Mason and
Thiollay, 2001; Meijaard et al., 2005). In addition, birds also have important ecological roles as
pollinators, seed disperses and seed predators (Fimbel et al., 2001; Furness and Greenwood, 1993;
Ghazoul and Hellier, 2000; Gray et al., 2007; Meijaard et al., 2005).
Studies have reported a decrease in the widely used Shannon diversity index for birds following
disturbance such as logging and forest fires (Posa, 2011; Slik and van Balen, 2006; Thiollay 1992). One
broad explanation for such a decrease is that disturbed areas generally are considered to have less
spatial variation than undisturbed areas. Hence, disturbed areas do not allow for the same amount of
niches to be occupied by different bird species. However, the Shannon diversity index takes both
species richness and relative abundance of species into account, and is therefore difficult to interpret
(Ghazoul and Hellier, 2000). Nevertheless, it is widely used and might provide some rough
information about disturbance levels.

3
Bird species richness has been shown to both decline (Marsden, 1998) and increase following logging
(Johns, 1997). Studies have also shown that the majority of species inhabiting primary forest actually
survive in logged forests as well (Danielsen and Heegaard, 1995; Johns A.D., 1986, 1989; Johns A.G,
1996, Lambert, 1992; Round and Brockelman, 1998).This is likely due to nearby intact forests which
serve as sources for rapid reinvasion (Lambert and Collar, 2002). Further, even if such forests exist
many studies suggest that abundances of certain species in logged areas are so low so the species
can no longer fulfil their ecological roles in the forest, which cause changes in the ecosystem as a
whole. This kind of pattern has been shown to often occur for specific species of birds belonging to
particular feeding guilds (Gray et al., 2007; Johns A.D., 1986, 1989; Johns A.G, 1997; Lambert, 1992).
Terrestrial and understorey insectivores have, for example, been found to decrease in both
abundance and species richness after logging (Johns A.D., 1986, 1989, Johns A.G, 1997; Lambert,
1992). Frugivores and nectariovers, on the other hand, have been found to increase in abundance
after logging (Lambert, 1992).This can be due to an increased availability of nectar and fruit arising
from a decrease in canopy cover (Mason 1996; Wunderle et al., 2006). However, Gray et al. (2007)
found that the abundance of frugivores, nectarivores and insectivores decrease following logging. In
addition they found a decrease in species richness for insectivores, but not for frugivores.
My study aimed at investigating if sustainable forest management through FSC-certification had an
effect on bird communities in Berau District, East Kalimantan. To asses this I used the Bray-Curtis
distance to compare possible differences in overall bird community composition between a primary
forest site and three FSC-certified logged sites logged in the year of 2003, 2007 and 2011. I also
compared sites in terms of Shannon diversity index, species richness, abundance and number of
genera and families, as well as species richness and abundance of specific guilds.
Since all types of logging change the structure and composition of the forest (Fimbel et al., 2001), I
expected the sites to differ in community composition. I also expected to find differences between
sites in abundance and species richness of certain guilds, e.g. a lower abundance and species richness
of insectivores in logged areas. Further, I expected the logged areas to have a lower Shannon
diversity index due to a lower spatial variation than a primary forest.

4
2. Materials and Methods
2.1 Research area The research area is located in the in the lowland tropical forest of Berau district in East Kalimantan
within the forest concession of PT. Hutansanggam Labanan Lestari (HLL) Labanan (Figure 1). Within
this area, a state-owned logging company called PT Inhutani operates. This company owns the
largest share of the total PT Hutansanggam area, 830 km2 (Purbawiyatna, 2002), and has an FSC-
certification. Within this area approximately 20 km2 is transmigration forest, 70 km2 community
forest 160 km2 protected forest while the rest of the area is used for production (Arbainsyah,
personal communication). The area’s topography consists of a rolling hilly landscape with shallow
valleys and gullies which ranges from 25 to 140 m above sea level. Most of the soil consists of loamy
clay and sand and the top soil layer is approximately 5-10 cm (Mantel et al., 2002).
Within the research area four sites were established for data collection; one primary forest site and
three FSC-certified selectively logged forest sites logged in 2011, 2007 and 2003 (Figure 1). These
sites are hereafter referred to as: Primary, L2003, L2007 and L2011. The overall area of logged sites is
between 15 and 20 km2 respectively, while the area of Primary is unknown (Arbainsyah, personal
communication).
There is a lot of charcoal mining and logging occurring in the area of Berau district (personal
observation; Arbainsyah, personal communication). Around the forest concession of PT.
Hutansanggam Labanan Lestari (HLL) Labanan there is not much continuous primary forest left apart
from in the east where the forest becomes more inaccessible due to the increase in elevation.
The primary site is dominated by the plant families Dipterocarpaceae, Euphorbiaceae,
Caesalpiniaceae, Burseraceae and Sapotaceae while abundant species in the logged sites belong to
the families of Myrtaceae, Dipterocarpaceae, Ulmaceae, Sapotaceae, Euphorbiaceae (Arbainsyah et
al., 2014). The primary site and L2003 have a higher overall tree and sapling density than the other
logged sites. The primary forest is also characterised by a higher abundance of palm lianas compared
to the logged sites. However, the logged sites have a higher abundance of fern lianas and fern herbs
than the primary forest site. Compared to the primary forest the logged sites have a higher
abundance of species belonging to the family Euphorbiaceae, which include fast-growing pioneer
species with little economic interest.

5
Figure 1. Map of East Kalimantan with the four study sites; primary forest (N 02°01` E 117°06`) and FSC-certified logged forest sites logged in 2003 (N 02°03` E 117°09`), 2007(N 02°02` E 117°09`)and 2011 (N 01°55` E 116°59`). The different shades of grey indicate within which areas PT. Hutansanggam Labanan Lestari (HLL) Labanan operates. Figure modified from Arbainsyah et al., 2014.
Within each of these sites, five points were established and used for point counts (Bibby et al., 2000).
These points were spaced 200 meters apart (Figure 2).
The use of point counts is more often preferred in non-open terrain in opposite to line transects
(Bibby et al., 2000). This because it is hard to focus on counts and follow transects at the same time.
In addition, unnecessary noise may disturb and scare birds which may produce a bias towards more
conspicuous birds.

6
Figure 2. The five points (P1-P5) established in a site.
2.2 Data collection Most Bornean birds breed once a year between January and July (Philipps and Phillipps, 2011). I
collected data during late February and beginning of May 2014 which are part of the breeding
months and hence many birds were singing at this time. In order to familiarize with songs and
appearance of the birds I, pre departure, studied literature, photographs and sound recordings (e.g.
MacKinnon and Phillipps, 1993; Philipps and Phillipps, 2011; the Xeno-canto database,
http://www.xeno-canto.org).
Each site was visited four mornings and four afternoons rendering a total of eight visits. During all
visits I was accompanied by a bird expert from the University of Mulawarman, Samarinda (Agus
Prastiono). Morning visits usually started around 06:00 and afternoon visits around 16:00, each visit
lasting in total approximately two hours. During a visit all five points were visited 15 minutes each
(Pieterse and Wielstra, 2005). Notes of all birds seen and heard during this time were taken. No
distance limitation was used and hence exact abundances were not obtained, but rather a measure
which only allowed for comparison between the sites since the same method was used in all the
sites. However, at each point I did take some notes of approximate distances and directions to the
birds heard and observed. This allowed me to exclude loud birds that could be heard over great
distance and hence heard at more than one point. In addition, some birds do move around a a lot
and could hence be encountered in more than one point. But since they are moving they are also
likely to be missed and hence the problem with double counting an individuals is somewhat
compensated. At each point I also used a microphone placed on a tripod to record all the bird songs
and calls for later identification using reference sounds and help from a Dutch expert (Bas van Balen)

7
and an Indonesian bird expert (Agus Prastiono). In order to allow birds to return to a point that might
have been scared away when approaching, counts started after two minutes of silence after reaching
each point. Moreover, to minimize a possibly bias occurring from visiting the points at the same time
each visit, the points were visited in a reversed order half of the morning and half of the afternoon
visits. Counts were not conducted during heavy rain because of the decrease in bird activity during
such weather conditions (Bibby et al., 2000).
2.3 Guilds Previous studies have suggested that changes in vegetation structure caused by logging affect birds
in different ways. The effect varies depending on the guild under consideration. Root, 1967 defines a
guild as “a group of species that exploit the same class of environmental resources in the same way”.
A common way to group birds into guilds is simply based on diet. Another way is to group the birds
based on diet and foraging layer. These guilds represent a functional relationship with the ecosystem
as a whole.
Based on literature (Myers, 2009; Phillipps and Phillipps, 2011) I determined diet (Table 1) for each
bird species. Based on this I grouped the bird species into different diet guilds (Appendix I Table A1).
Combining diet and foraging layer (which was also obtained from the literature) also generated a
specific feeding layer guild for each species (Table 1 and Appendix I Table A1).
Nocturnal species were excluded from the analysis due to that separate systematic surveys are
needed during night when these species are active. Aerial feeders and birds of prey were also
excluded due to that observations are highly dependent on visibility. In addition, individuals of aerial
feeders are difficult to separate from one another.

8
Table 1. The different guilds determined for each bird species
based on literature (Myers, 2009; Phillipps and Phillipps, 2011).
Guilds
Diet guilds
Frugivore
Frugivore/carnivore
Frugivore/insectivore
Insectivore
Insectivore/carnivore
Nectarivore
Feeding layer guilds
Arboreal frugivore
Arboreal frugivore/carnivore
Arboreal frugivore/insectivore
Arboreal insectivore
Arboreal insectivore/carnivore
Arboreal nectarivore
Understorey frugivore/insectivore
Understorey insectivore
Understorey nectarivore
Terrestrial frugivore/insectivore
Terrestrial insectivore
Terrestrial insectivore/carnivore
2.4 Data analysis and statistics All statistical analyses were done using R version 3.1.0 (R Core Team, 2014). The significance level
was set to 0.05.
In order to investigate the impact of FSC-certified logging on bird communities I compared the four
sites in terms of biodiversity, uniqueness, species composition, species richness, number of families,
genera and abundance, as well as number of species and abundance in each guild.
Biodiversity for each site was obtained by calculating the average Shannon diversity index for each
site (Equation 1). This was done using the BiodiversityR package in R (Kindt and Coe, 2005). Since
assumptions for a parametric test was not met, I then used a Kruskal–Wallis one-way analysis of

9
variance to test for differences between sites. Species uniqueness (i.e. the number of species found
in one site only) was manually calculated for each site, but not analysed statistically.
i
S
Si ppH ln
1∑=
−= Equation 1
Where:
H = Shannon diversity index.
S = total number of species in the site.
pi = proportional abundance of the ith species calculated by dividing abundance of species i by the
total abundance.
In order to investigate differences in overall bird community composition I used the adonis routine in
the vegan package (Oksanen et al., 2011). Adonis is a non-parametric multivariate analysis of
variance based on a distance matrix (Anderson, 2001). I used the Bray-Curtis distance (Equation 2),
which is calculated from differences in abundance of each species present in each site. However, the
final distance obtained from this is influenced more by species with larger differences in abundances
and therefore I chose to transform my abundance data by a square root prior to the analysis (Kindt
and Coe, 2005). Adonis tests for differences in mean compositions, so called centroids, between
groups much like an Analysis of variance (ANOVA). It assumes that the data have the same
multivariate homogeneity of group dispersions (variances). If this is not the case, a significant
difference in an adonis analysis may be caused by differences in within group dispersion rather than
mean values of composition of groups. Therefore I also tested for a dispersion effect using the
betadisper function in the vegan package (Oksanen et al., 2011) when a significant effect was found
in the adonis analysis. Βetadisper is basically a multivariate analogue of Levene’s test for
homogeneity of variances. To analyse the significance of the betadisper model, I used an ANOVA
followed by a Tukey Post Hoc test.
In order to visualize the results from the adonis I used a Principal Coordinate Analysis (PCoA), which
is a type of unconstrained ordination method. Sites that are close to each other in an ordination
graph can be interpreted as being more similar in community composition than sites further away
from each other. PCoA first creates a distance matrix based on the species matrix and then creates a
new matrix which includes principle coordinates for each site and species. These coordinates can

10
then be plotted in a graph. However, graphs can only be plotted in two dimensions (sometimes also
three). The creation of the new matrix in PCoA (and other ordination methods) allows for more
variance to be shown in only two dimensions rather than several dimensions without losing any of
the total variance
∑
∑
=
=
+−= S
iii
S
iii
ba
baD
1
1
)(
),min(21 Equation 2
Where:
D = the Bray Curtis distance between two sites.
a and b = Two different sites that are compared.
i = abundance of the ith species.
S = total number of species in the site.
min (ai,bi) = the lower value of the abundance of the ith species that is shared between the two sites
(a and b).
In order to investigate the effect of site (Primary, L2003, L2007 and L2011), and differences in species
richness, abundance, and number of genera and families, I used a Kruskal–Wallis one-way analysis of
variance. If a significant difference was found I used a pairwise Wilcox test with a Bonnferoni
correction. These tests were also done for species richness and abundance in all the guilds. The
reason for choosing a Kruskal–Wallis one-way analysis of variance, which is a non-parametric test,
was that my data rarely met the assumptions of a parametric test such as an ANOVA. Further, a non-
parametric test is also less powerful than a parametric test and hence if a true significant effect of
site was to be found it would show in a non-parametric test as well.

11
3. Results A complete list of all the birds encountered during the field work, which sites they were encountered in and which guilds they belong to can be found in Appendix Table A1.
3.1 Overview Table 2 provides a general overview of the analyses made and the outcome of them. The results shown in the table can also be found in more detail in each part of the result section. Table 2. Overview of the analyses made and the outcome of them.
Variable tested Test p-value
Shannon diversity index
Kruskal-wallis NS
Species richness Kruskal-wallis NS
Abundance Kruskal-wallis NS
Number of genera Kruskal-wallis NS
Number of families
Kruskal-wallis NS
Bird community composition
Adonis 0.001
Guilds species richness
Frugivores Kruskal-wallis 0.023
Frugivores/carnivores Insufficient data
Frugivores/insectivores Kruskal-wallis NS
Insectivores Kruskal-wallis NS
Insectivores/carnivores Insufficient data
Nectarivores Kruskal-wallis 0.020
Arboreal frugivores Kruskal-wallis 0.023
Arboreal frugivores/carnivores Insufficient data
Arboreal frugivores/insectivores Insufficient data
Arboreal insectivores Kruskal-wallis NS
Arboreal insectivores/carnivores Insufficient data
Arboreal nectarivores Insufficient data
Understorey frugivores/insectivores Kruskal-wallis NS
Understorey insectivores Kruskal-wallis NS
Understorey nectarivores Insufficient data
Terrestrial frugivores/insectivores Insufficient data

12
Table 2, continued
Variable tested Test p-value
Terrestrial insectivores Insufficient data
Terrestrial insectivores/carnivores
Insufficient data
Guilds abundance
Frugivores Kruskal-wallis NS
Frugivores/carnivores Insufficient data
Frugivores/insectivores Kruskal-wallis NS
Insectivores Kruskal-wallis NS
Insectivores/carnivores Insufficient data
Nectarivores Kruskal-wallis NS
Arboreal frugivores Kruskal-wallis NS
Arboreal frugivores/carnivores Insufficient data
Arboreal frugivores/insectivores Kruskal-wallis NS
Arboreal insectivores Kruskal-wallis NS
Terrestrial frugivores/insectivores Insufficient data
Arboreal insectivores/carnivores Insufficient data
Arboreal nectarivores Insufficient data
Understorey frugivores/insectivores Kruskal-wallis NS
Understorey insectivores Kruskal-wallis NS
Understorey nectarivores Kruskal-wallis NS
Terrestrial frugivores/insectivores Insufficient data
Terrestrial insectivores Kruskal-wallis 0.004
Terrestrial insectivores Insufficient data
3.2 Shannon diversity index and species uniqueness There was no significant difference between sites in average Shannon diversity index (Kruskal-wallis,
X2(3) = 1.776, p = 0.620). The lowest species uniqueness was found in L2007 and the highest in
Primary (Table 3).
Table 3. Average Shannon diversity index (± se) and species uniqueness and for each site.
Site Shannon diversity index Species uniqueness
Primary 3.27 ± 0.18 13
L2003 3.21 ± 0.37 10
L2007 3.16 ± 0.16 5
L2011 3.14 ± 0.23 9

13
3.3 Species richness, abundance and number of genera and families In total I found 1832 individuals from 127 species, comprising 78 genera and 35 families (Table 4). No
significant effect of site was found for species richness (Kruskal-wallis, X2(3) = 1.913, p = 0.591),
abundance (Kruskal-wallis, X2(3) = 5.051, p = 0.168), number of genera (Kruskal-wallis, X2(3) = 2.251,
p = 0.529) or number of families (Kruskal-wallis, X2(3) = 2.806, p = 0.423)
3.4 Bird community composition Overall bird community composition differed between sites (adonis, R2 = 0.231, p = 0.001) and there
were no differences in within site dispersion (ANOVA, F (3, 28) = 2.333, p = 0.096) (Figure 3). An adonis
performed pairwise between all sites showed that all sites differed from one another (Table 5).
Figure 3. Centroids (centre of spiders) and within site dispersion for each site. Axis 1 and 2
are the two first principal coordinate axes, based on the Bray-Curtis distance matrix, that
explain most of the variation in the dataset.
Table 4. Mean species richness, abundance and number of species, genera and families in each site (± se).
Site Species richness # Individuals # Genera # Families
Primary 31.25 ± 2.04 66.63 ± 4.80 24.25 ± 1.49 17.25 ± 0.80
L2003 31.38 ± 3.72 58.38 ± 8.43 26.63 ± 2.80 18.25 ± 1.26
L2007 23.38 ± 1.38 47.63 ± 3.63 22.38 ± 1.53 15.75 ± 1.06
L2011 29.00 ± 2.87 56.38 ± 7.36 23.00 ± 2.03 16.75 ± 1.28
Total 127 1832 78 35

14
3.5 Diet guilds
3.5.1 Frugivores There was a significant effect of site on frugivorous species richness (Kruskal-wallis, X2(3) = 9.533, p =
0.023) (Figure 4). No significant differences between site were however found when pairwise
comparisons were made, but the difference between L2003 and L2007 was close to significant (p =
0.067). No significant effect of site was found on the abundance of frugivores (Kruskal-wallis, X2(3) =
7.244, p = 0.065).
Figure 4. Number of frugivorous species (species richness) in the different sites. Wilcox test showed no significant pairwise differences.
Table 5. R2- and p-values for all pairwise adonis comparisons between sites.
Sites p-value R2-value
Primary – L2003 0.001 0.187
Primary – L2007 0.002 0.189
Primary – L2011 0.002 0.171
L2003 – L2007 0.004 0.149
L2003 – L2011 0.001 0.181
L2007 – L2011 0.002 0.127

15
3.5.2 Frugiovores/carnivores Only 6 species and 44 individuals belonging to the frugivorous/carnivorous guilds were encountered
throughout the research (Table 6 and Appendix Table A1). These low numbers did not allow for any
proper statistical analysis to be made.
3.5.3 Frugivores/Insectivores There were no significant differences between sites in frugivorous/insectivorous species richness
(Kruskal-wallis, X2(3) = 2.312, p = 0.510) or in abundance (Kruskal-wallis, X2(3) = 7.358, p = 0.061).
3.5.4 Insectivores No significant differences between sites in insectivorous species richness (Kruskal-wallis, X2(3) =
0.844, p = 0.839) or in abundance was found (Kruskal-wallis, X2(3) = 1.299, p = 0.729).
3.5.5 Insectivores/Carnivores Only 7 species and 20 individuals belonging to the Insectivorous/carnivorous guild were found (Table
7 and Appendix Table A1). These numbers were too low to allow a proper statistical analysis.
3.5.6 Nectarivores A significant effect of site was found for nectarivorous species richness (Kruskal-wallis, X2(3) = 9.888,
p = 0.020) (Figure 5). The richness was lower in L2011 compared to L2007 (p = 0.024). No significant
effect of site was found on abundance of nectarivores (Kruskal-wallis, X2(3) = 5.218, p = 0.157).
Table 6. Total frugivorous/carnivorous species richness and abundance in each site and in total.
Site Total species richness Total abundance
Primary 4 14
L2003 3 14
L2007 3 10
L2011 3 6
Total 6 44
Table 7. Total insectivorous/carnivorous species richness and abundance in each site and in total.
Site Total species richness Total abundance
Primary 3 6
L2003 3 5
L2007 3 2
L2011 3 7
Total 7 20

16
Figure 5. Number of nectarivorous species (species richness) in the different sites. The asterisk indicates
significant pairwise differences when a Wilcox test was performed.
3.6 Feeding layer guilds
3.6.1 Arboreal frugivores The results for the arboreal frugivorous guild are identical to those for the frugivorous guild since
these two guilds consist of the exact same species and individuals.
3.6.2 Arboreal frugivores/carnivores The arboreal frugivorous/carnivorous guild was identical to the frugivorous/carnivorous guild, which
contained too few individuals and species to conduct a proper analysis. Hence, a proper statistical
analysis could not be done for the arboreal frugivorous/carnivorous either.
3.6.3 Arboreal frugivores/insectivores Only 8 species belonging to arboreal frugivorous/insectivorous were found throughout the research
(Appendix table A1). This number was too low to allow for a proper statistical analysis to be made.
Arboreal frugivorous/insectivorous abundance did however allow for a statistical analysis but it not
differ significantly between sites (Kruskal-wallis, X2(3) = 7.678, p = 0.053).

17
3.6.4 Arboreal insectivores The species richness of arboreal insectivores did not differ between sites (Kruskal-wallis, X2(3) =
1.025, p = 0.795) and neither did the abundance (Kruskal-wallis, X2(3) = 2.068, p = 0.558).
3.6.5 Arboreal insectivores/carnivores Only 2 species (Phaenicophaeus curvirostris and Corvus enca) and 5 individuals belonging to the
guilds arboreal insectivores/carnivores were found throughout the research (Table 8 and Appendix
Table A1). These numbers were too low to allow a proper statistical analysis.
3.6.6 Arboreal nectarivores Overall, 4 species and 31 individuals belonging to arboreal nectarivores were found (Table 9 and
Appendix Table A1). These numbers were too low to allow for a proper statistical analysis.
3.6.7 Understorey frugivores /insectivores There was no significant effect of site on frugivorous/insectivorous species richness (Kruskal-wallis,
X2(3) = 1.927, p = 0.588). Abundance did not differed significantly between sites either (Kruskal-
wallis, X2(3) = 7.121, p = 0.068).
Table 8. Total arboreal insectivorous/carnivorous species richness and abundance in each site and in total.
Site Total species richness Total abundance
Primary 0 0
L2003 1 2
L2007 0 0
L2011 1 3
Total 2 5
Table 9. Total arboreal nectarivorous species richness and abundance in each site and in total.
Site Total species richness Total abundance
Primary 3 9
L2003 2 8
L2007 3 8
L2011 2 6
Total 4 31

18
3.6.8 Understorey insectivores Understorey insectivorous species richness did not differ significantly between sites (Kruskal-wallis,
X2(3) = 1.388, p = 0.708) and neither did abundance (Kruskal-wallis, X2(3) = 2.011, p = 0.570).
3.6.9 Understorey nectarivores Only 7 species of understorey nectarivores were found throughout the research (Appendix Table A1).
This number was too low for a proper statistical analysis. Site had no effect on abundance (Kruskal-
wallis, X2(3) = 4.427, p = 0.219).
3.6.10 Terrestrial frugivores/insectivores Only 2 species and 4 individuals of terrestrial frugivores/insectivores were found (Table 10 and
Appendix Table A1). These numbers did not allow for a proper statistical analysis to be made. Great
Argus which is one of the two terrestrial frugivores/insectivores found was only encountered once
during my research and that was in L2011 (Appendix table A1).
3.6.11 Terrestrial insectivores Only 7 species of terrestrial insectivores were found (Appendix Table A1). This number was too low
to allow for a proper statistical analysis to be made. Abundance of terrestrial insectivores did
however allow for a statistical analysis and differed significantly between sites (Kruskal-wallis, X2(3) =
13.276, p = 0.004) (Figure 6). Primary had a higher abundance than L2011 (p = 0.044). The difference
between Primary and L2003 was close to significant (p = 0.064).
Typical terrestrial insectivores such as Black-capped babbler was only encountered once in each site
except for L2003 were it was encountered twice. Garnet Pitta was encountered most times in the
primary site (Table 11).
Table 10. Total terrestrial frugivorous/insectivorous species richness and abundance in each site and in total.
Site Total species richness Total abundance
Primary 0 0
L2003 0 0
L2007 1 2
L2011 2 2
Total 2 4

19
Figure 6. Abundance of terrestrial insectivores in each site. The asterisk indicates significant pairwise
differences when a Wilcox test was performed.
3.6.12 Terrestrial insectivores/carnivores Overall, 5 species and 15 individuals of terrestrial insectivores/carnivores were found (Table 12 and
Appendix Table A1). These numbers did not allow a proper statistical analysis.
Table 11.Abundance of Garnet Pitta encountered in each site.
Site Total abundance
Primary 17
L2003 5
L2007 11
L2011 6
Total 39
Table 12. Total terrestrial insectivorous/carnivorous species richness and abundance in each site and in total.
Site Total species richness Total abundance
Primary 3 6
L2003 2 3
L2007 2 2
L2011 3 4
Total 4 15
20
4. Discussion
Species richness, abundance, number of genera, number of families and Shannon diversity index did
not differ significantly between sites. Bird community composition differed between the sites and
this was also the case when species richness and abundance in some of the guilds were analysed.
However, these significant differences were few. Further, some guilds did not have enough data to
allow for statistical analyses to be done. One such example is the frugivores/carnivores which consist
only of hornbills (Appendix Table A1).
Upon data collection, the primary site showed to be heavily disturbed by illegal logging (personal
observation). The site was also located close to a small palm oil plantation and other logged sites.
The degree of this disturbance is however not clear. Nevertheless, it means that conclusions drawn
from comparing the FSC-logged sites with the primary site to investigate the impact on FSC-certified
logging simply cannot be made. This also highlights the importance of having several replicates,
which unfortunately was not possible in this study due to logistical problems. In order to truly
measure the impact of FSC-certified logging several non-disturbed primary sites would have been
needed as a control. In addition, several conventionally logged sites would have been preferable to
add. That would have allowed for a proper study on the impact of FSC-certified logging in relation to
conventionally logged forest and primary forest. However, some of the results can still be discussed
in terms of recovery of the FSC-logged sites and speculations of the area as a whole can be done
based on some of the data and personal observations.
4.1 Shannon diversity index and species uniqueness Other studies have found a higher Shannon diversity index in primary and undisturbed sites
compared to logged and disturbed sites (Posa, 2011; Slik and van Balen, 2006; Thiollay 1992). Slik and
van Balen (2006) argues that such a pattern could be due to that disturbed areas provide less spatial
variation than primary, undisturbed areas, which in turn do not allow for the same amount of
different niches to be occupied by different bird species. I found no such pattern in my study and
that would indicate that the FSC-certified logged sites do resemble that of a primary site in terms of
bird diversity. However, considering that the primary site was disturbed by illegal logging it might
also be an indication that the primary site is disturbed to such a degree that it resembles the
disturbance of FSC-certified logged sites.

21
The highest uniqueness was found in the primary site. This has also shown to be the case in other
studies (Danielsen and Heegaard, 1995). In that study the highest species richness was found in
heavily logged forest sites, which, according to Lambert and Collar (2002), mask the important effect
of uniqueness. They further argue that one reason for the higher species richness found in logged
sites is a large number of so called trash species, which prefer secondary, disturbed and more open
areas than primary forest species do. Even if the uniqueness was not analysed statistically in my
study one might argue, based on species uniqueness, that the FSC-logged sites are more disturbed
than the primary site.
4.2 Species richness, total abundance and number of genera and families That overall species richness, total abundance and number of genera and families did not differ
between the sites could be explained by the fact that all sites resemble each other in terms of level
of disturbance. However, previous studies, which used proper primary sites as controls, have found
similar results for species richness (Edwards et al., 2011; Lambert, 1992; Slik and Van Balen, 2006).
The lack of such differences might be explained by nearby intact forest sites that serve as sources
which allow for fast reinvasion after logging (Lambert and Collar, 2002). In the case of SFM through
FSC-certified logging it is exactly what one wants to achieve through the logging regime where
primary forest sites are kept within the logging concession, as well as that different sites are logged
different years and in e.g. 30 year cycles. In addition, the intermediate disturbance hypothesis (IDH)
(Connell, 1978) suggests that the highest species richness is found in areas where disturbance is
neither too rare nor too frequent. This means that if the FSC-certified logged sites in this study are
managed in a sustainable way the disturbance there could resemble some sort of intermediate
disturbance also seen in the primary forest. But since the disturbance level of the primary site is
unknown this might not be the case. Further, it is also important to bear in mind that species
richness does not provide information on which species that are present/absent from the different
sites and the abundance within those specific species.
4.3 Bird community composition Bird community composition differed between all the sites. This is however not surprising
considering the big data set consisting of 127 species. With large samples, small differences tend to
generate significant p-values (Lin et al., 2013). Hence, it is also important to interpret the R2-value,
which could be considered to be quite low in all instances where an adonis was performed in this
study. I only used site as an explanatory variable in my analysis and it is likely that there are several
other factors within each site that can explain my data. Further, the within site variation is quite high

22
(Figure 3), but it does not differ significantly between sites. In order to lower the variation more
replicates might be preferable. In addition, one might expect the primary site to be most similar to
the L2003 and least similar to L2011, but in fact the opposite can be seen. However, since all sites
differ significantly from each other it could be considered to be a minor issue.
4.4 Diet guilds Gray et al. (2007) found that abundance of frugivores decreases in logged areas. Findings resembling
these were also reported by Felton et al. (2008). Gray et al. (2007) did not find an effect of site on
frugivorous species richness, but they did highlight that such a difference was approaching
significance. Lambert (1992), on the other hand reported an increase in abundance of frugivores, as
well as nectarivores, in logged areas, while Gray et al. (2007) found a lower abundance of
necatrivores in logged areas in Asia.
An increase in abundance of frugivores and nectarivores after logging could be linked to availability
of nectar and fruit arising from a decrease in canopy cover (Mason, 1996; Wunderle et al., 2006).
Costa and Magnusson (2003) show, for example, that species richness of flowering and fruiting
plants, as well as abundance of flowering plants, increase shortly after logging. This then would be
more in line with the pattern observed by Lambert (1992) and not in this study and by Gray et al.
(2007). However, Costa and Magnusson (2003) also report that the intensity of logging affects
neither the richness nor abundance of fruiting and flowering plants. Therefore, it has been argued
that there are several factors in play that determines vegetation structure and hence also responses
of frugivorous and nectarivorous species to logging (Gray et al., 2007).
I found a higher nectarivore species richness in L2007 than in L2011. L2011 is more recently logged
than L2007 and hence L2007 might have had some time to recover and gain more nectarivorous
species again. If this was the case, one would assume a similar difference to be found when L2003
and Primary was compared to L2011. But, no such difference is found and hence that conclusion
cannot be drawn. Further, frugivorous species richness also differed between sites, but no difference
was found when a pairwise comparison was done. L2003 did however come close to differing from
L2007, but more data would be needed before any conclusions can be drawn from this. Altogether it
seems like the sites do not differ that much from one another in terms of abundance and richness of
these guilds. This is not in line with previous findings and the reason for that might be linked to the
illegal logging in the primary forest as well as the many factors that play a role in the response of
these guilds to logging.

23
Insectivorous bird species have been reported to be sensitive to logging (Canaday, 1996; Kattan et
al., 1994; Renjifo, 1999). In my study I found no differences in species richness or abundance
between different sites. This would indicate that the more recently FSC-certified logged site(s)
already had recovered to resemble those that were logged longer ago. I cannot state that the FSC-
certified logged sites resemble the primary forest since the primary site suffers from illegal logging.
Based on the personal observation that the primary site was illegally logged one could however
argue that the primary site resembles the FSC-logged sites, but based on the data no such conclusion
can be made since the level of disturbance of the primary site is not known. Moreover, Cleary et al.
(2007) state that solely relying on data of insectivorous species may not be a good idea when
investigating impact of disturbance.
Some guilds, such as the frugivorous/carnivorous, could not be analysed statistically due to the low
number of species and individuals observed. The frugivorous/carnivorous species consisted only of
hornbills, which previously have been reported to be negatively affected by logging (Cleary et al.,
2007). However, many hornbills are able to persist in selectively logged forest (Johns, 1987), which
likely is due to the fact that they are highly mobile. Moreover, the major factor influencing breeding
in hornbills is food supply (Johns, 1981) and during selective logging, cavity-bearing trees, which
hornbills nest in, may only be damaged but not actively logged and removed due to their low timber
value. Hence, the argument that hornbills lose breeding sites due to logging may not be valid (Johns,
1987). However, local people might illegally log and set fire to forests in order to clear land for
plantations and this most likely influence the number of cavity bearing trees and hence also breeding
possibilities for hornbills (personal observations, Appendix Figure A1). One might speculate on
whether the number of hornbills found across all sites in this study was low and if this somehow
could be related to the results obtained by Cleary et al. (2007). Is the whole research area disturbed?
In order to answer that question a comparison of the area before and after FSC-certified logging took
place would be needed.
4.4 Feeding layer guilds
4.4.1 Arboreal guilds Danielsen and Heegaard (1995) found that heavily logged forest contained more arboreal frugivores
than lightly logged and primary forest. I only found an effect of site on arboreal frugivorous species
richness, but the pairwise comparison revealed no significant differences between sites. However,

24
L2003 was close to having a significantly higher species richness than L2007, but more data would be
needed to investigate the significance of that possible difference. This is also the case for the
abundance of arboreal frugivores, which also was close to differ significantly between sites. Zurita
and Zuleta (2009) found the opposite result to that of Danielsen and Heegaard (1995). They found
that arboreal frugivores were rare in more recently logged forest gaps compared to older logged
forest gaps. The reason for such a pattern is believed to be linked to a scarcity in tree generation in
more recently logged gaps. Further, they argue that the rarity of arboreal frugivores in more recently
logged gaps will contribute to an even slower regeneration of trees since they disperse most of the
seeds in tropical and subtropical areas. In my study, L2003 was logged longer ago than L2007 and
they were close to differ significantly from one another in terms of species richness. Therefore, my
results might be an indication of a pattern pointing towards the same findings reported by Zurita and
Zuleta (2009). But, since the difference between L2003 and L2007 is non-significant and no other
differences were found such a conclusion cannot be made and more data is needed to investigate
this further.
Zurita and Zuleta (2009) also report that establishment of arboreal species in general in logging gaps
was very slow, and they argue that this could be due to a high grass vegetation cover. In many of my
arboreal guilds I do not have enough data to perform proper statistical analyses. One could therefore
speculate that the whole research area consists of such logging gaps comparable to those described
by Zurita and Zuleta (2009) and hence giving rise to the low overall number of species and individuals
in the different arboreal guilds. However, data before and after FSC-certified logging took place is
needed in order to draw any conclusions regarding this. In addition, it should be highlighted that
caution in comparisons should be taken since my study was carried out in Southeast Asia whereas
the study of Zurita and Zuleta (2009) was carried out in South America.
4.4.1 Understorey guilds Understorey insectivores have been found to be negatively affected by logging (Johns A.D., 1986,
1989, Johns A.G, 1997; Lambert, 1992; Mejiaard 2005; Thiollay, 1992). Based on studies like these it
has been argued that the use of understorey insectivores are one of the best indicators to use when
monitoring impact of disturbance such as logging (de Iongh and van Weerd, 2008). However, it has
also been shown that understorey insectivores actually use many resources in gaps created by
logging, since logging causes rapid colonization of short herbs which are consumed by arthropods
which in turn are consumed by the understorey insectivorous birds (Cleary et al., 2007; Fredericksen
et al., 1999). The negative effect on understorey insectivores is most likely linked to an increased
predation and nest parasitism rather than changes in arthropod abundances (Burke et al., 2004).

25
In my study I did not have enough data to perform a proper statistical analysis for the understorey
nectarivore species richness. As for all the other understorey analyses, no significant differences
were found. The lack of such differences indicates that all the sites resemble each other. But due to
the unknown level of disturbance of the primary site one cannot conclude that the logged sites
resemble that of a primary forest or vice versa.
4.4.1 Terrestrial guilds All terrestrial feeding layer guilds except one had insufficient data. I only found that the primary site
had a significantly higher abundance of terrestrial insectivores than L2011. This could partly be
interpreted to be in line with what have been reported earlier; that terrestrial insectivores, just as
understorey insectivores, are vulnerable to logging (Cleary et al., 2007; Johns A.D., 1986, 1989; Johns
A.G, 1997; Lambert, 1992; Mejiaard 2005; Thiollay, 1992). However, no difference between the
primary site and L2007 was found. This was also the case for primary and L2003 even though that
difference was close to being significant. A reason for the vulnerability of terrestrial guilds in general
is argued to be that understorey and forest-floor microclimates are lost, which are important as e.g. a
food resources for the species within these guilds. Terrestrial guilds, as well as understorey guilds,
may also be physiologically intolerant to changes in heat, cold or rain levels rising from changes in
vegetation structure due to logging (Lambert and Collar, 2002; Thiollay, 1997). This may contribute to
poor dispersing abilities across open area gaps. Johns (1989) found a complete absence of terrestrial
bird species in forest that were logged 12 years ago. In recently logged forest, terrestrial insectivores,
such as Great Argus and Black-capped babbler, have been found to be absent while another
terrestrial insectivore, the Garnet pitta, was present but rare (Cleary et al. 2007). The Great Argus has
previously been reported to be more common in primary forests than secondary forests (Nijman,
1998). I only encountered the Great Argus once during my research and that was in L2011 (Appendix
table A1). Further, I only encountered the Black-capped babbler once in each site except for L2003
where it was encountered twice. The Garnet pitta, however, was encountered more times and most
of the times in the primary forest. Taking these numbers into consideration together with the low
species richness and low abundances of birds in terrestrial guilds one might once again speculate
around whether the whole research area is disturbed to such a degree that it has lowered the
presence of terrestrial birds. But data before the FSC-certified logging took place is needed in order
to make a comparison and analyse this.

26
5. Conclusion
Few significant differences were found between the sites. However, sites did differ in bird
community composition. Whether or not FSC-certified logging has an impact on bird communities
cannot be concluded due to a lack of replicates of primary sites and especially since the one replicate
I had was disturbed by illegal logging. For some of the guilds a lack of data did not allow for any
proper statistical analyses to be made. In order to argue that this lack of data is because the whole
area is degraded, data from before the logging took place would have been needed. Future studies
should include several non-disturbed primary forest sites, as well as conventionally logged sites in
order to truly investigate the impact of FSC-certified logging on bird communities. Further, it might
also be of interest to investigate how further precautions can be taken to stop secondary impacts
such as illegal logging, which counteracts what FSC-certified logging want to achieve.
6. Acknowledgements
First of all, I would like to thank the committee of Tropical Ecology at Uppsala University and SIDA
(Swedish International Development Cooperation Agency) for funding my study. Further, I would like
to thank my field supervisor, Arbainsyah, for all his help during my stay in Indonesia, and also my
supervisor Prof. Mats Björklund in Sweden for all his support, guidance and feedback. I also want to
thank Prof. Hans de Iongh for giving me the opportunity to go to Borneo and do this study. Special
thanks to Pujiansyah, Supri, Dendy and Anto for all their help with logistics and cooking during the
field period, as well as PT Inhutani for letting me do research in their area and use their camp. Last, I
owe great many thanks to Bas van Balen and Agus Prastiono for all their help with identifications of
birds. Without them many of the birds would have remained unidentified.

27
7. References Anderson, M.J., 2001. A new method for non-parametric multivariate analysis of variance. Austral
Ecology 26, 32–46.
Arbainsyah, de Iongh,H.H., Kustiawan, W., de Snoo, G., 2014. Structure, composition and diversity of
plant communities in FSC-certified, selectively logged forests of different ages compared to
primary rain forest. Biodiversity and Conservation, doi 10.1007/s10531-014-0732-4.
Barlow, J., Peres, C.A., 2004. Avifaunal responses to single and recurrent wildfires in Amazonian
forests. Ecological Applications 14, 1358–1373.
Bibby, C.J., Burgess, N.D., Hill, D.A., 2000. Bird census techniques, second edition. British trust for
Ornithology and Royal Society for Protection of birds. Academic Press, London.
Boucher, D.H., Elias, P., Lininger, K., May-Tobin, C., Roquemore, S., Saxon, E., 2011. The Root of the
Problem: What’s Driving Tropical Deforestation Today? Cambridge, Massachusetts: Union of
Concerned Scientists.
Bruner, A.G. et al., 2001. Effectiveness of parks in protecting tropical biodiversity. Science 291, 125-
128.
Burke, D.M., Elliott, K., Moore, L., Dunford, W., Nol, E., Phillips, J., Holmes, S., Freemark, K., 2004.
Patterns of nest predation on artificial and natural nests in forests. Conservation Biology 18, 382-
388.
Canaday, C., 1996. Loss of insectivorous birds along a gradient of human impact in Amazonia.
Biological Conservation 77, 63-77.
Chape, S., Harrison, J., Spalding, M., Lysenko I., 2005. Measuring the extent and effectiveness of
protected areas as an indicator for meeting global biodiversity targets. Philosophical Transactions
of the Royal Society B: Biological Sciences 360, 443-455.
Cleary D.F.R., Boyles, T.J.B., Setyawati, T., Anggraeni, C.D., Van Loon, E.E., Menken, S.B.J., 2007. Bird
species and traits associated with logged and unlogged forest in Borneo. Ecological Applications
17, 1184-1197.
Connell, J.H. 1978. Diversity in Tropical Rain Forests and Coral Reefs. Science 199, 1302-1310.

28
Costa, F.R.C., Magnusson, W.E., 2003. Effects of Selective Logging on the Diversity and Abundance of
Flowering and Fruiting Understorey Plants in a Central Amazonian Forest. Biotropica 35, 103-114.
Curran, L.M., Trigg, S.N., McDonald, A.K., Astiania, D., Hardiono, Y.M, Siregar, P., Caniago, I.,
Kasischke, E., 2004. Lowland forest loss in protected areas of Indonesian Borneo. Science 303,
1000-1003.
Danielsen, F., Heegaard, M., 1995. Impact of logging and plantation development on species
diversity: a case study from Sumatra. In Ø. Sandbukt, ed. Management of tropical forests: towards
an integrated perspective, pp. 73-92. Oslo: Center for Development and the Environment,
University of Oslo.
Edwards, D.P., Larsen, T.H., Docherty, T.D.S., Ansell, F.A., Hsu, W.W., Derhé, M.A., Hamer, K.C.,
Wilcove, D.S., 2011. Degraded lands worth protecting: the biological importance of Southeast
Asia’s repeatedly logged forests. Proceedings of the Royal Society B 278, 82-90.
FAO (Food and Agriculture Organization of the United Nations). 2012. State of the world’s forests.
Rome, Italy.
Felton, A., Wood, J., Felton, A.M., Hennessey, B., Lindenmayer, D.B., 2008. Bird community responses
to reduced-impact logging in a certified forestry concession in lowland Bolivia. Biological
Conservation 141, 545-555.
Fimbel, R.A., Grajal, A., Robinson J.G., John G., 2001. The cutting edge: conserving wildlife in logged
tropical forest. Columbia University Press, New York.
Fredericksen, N.J., Fredericksen, T.D., Betty, F., Rumiz, D., 1999. Wildlife use of different-sized logging
gaps in a tropical dry forest. Tropical Ecology 40, 167-175.
Furness, R.W., Greenwood, J.J .D., 1993. Birds as monitors of environmental change. Chapman and
Hall, London.
Geist, H.J., Lambin, E.F., 2002. Proximate Causes and Underlying Driving Forces of Tropical
Deforestation. Bioscience 52, 143-150.
Ghazoul, J., Hellier A., 2000. Setting limits to ecological indicators of sustainable tropical forestry.
International Forestry Review 2, 243-253.
Gray, M.A., Baldauf, S.L., Mayhew, P.J., Hill, J.K., 2007. The response of avian feeding guilds to
tropical forest disturbance. Conservation Biology 21, 133-141.

29
Gullison, R., 2003. Does forest certification conserve biodiversity? Oryx 37, 153-165.
Hartshorn, G., Bynum, N., 2001. Tropical forest synergies. Nature 404, 493-495.
de Iongh, H.H., van Weerd, M., 2008. The use of avian guilds for monitoring Borneo lowland forests:
methodology development for rapid assessment of avian communities. In Persoon G.A.,
Osseweijer, M. (Eds.), Reflections on the Heart of Borneo. Tropenbos Series 24, 49-68.
Wageningen: Tropenbos International. The Netherlands
Jennings, S.B., Brown, N.D., Bshier, D.H., Whitmore, T.C., Loves, do C.A., 2001. Ecology provides a
pragmatic solution to the maintenance of genetic diversity in sustainably managed tropical rain
forests. Forest Ecology and Management 154, 1-10.
Johns, A.D.,1981. Observations on nesting behaviour in the rhinoceros hornbill, Buceros rhinoceros.
Malay. Nat. J, 35, 173-177.
Johns, A.D., 1986. Effects of selective logging on the ecological organisation of a peninsular Malaysian
rain forest avifauna. Forktail 1, 65-79.
Johns, A.D., 1987. The Use of Primary and Selectively Logged Rainforest by Malaysian Hornbills
(Bucerotidae) and Implications for their Conservation. Biological Conservation 40, 179-190.
Johns, A.D., 1989. Recovery of a peninsular Malaysian rainforest avifauna following selective timber
logging: the first twelve years. Forktail 4, 89-105.
Johns, A.G., 1996. Bird population persistence in Sabahan logging concessions. Biol. Conserv 75, 3-10.
Johns, A.G., 1997. Timber production and biodiversity conservation in tropical rainforests. Cambridge
University Press, Cambridge, UK.
Joppa, L.N., Loarie, S.R., Pimm, S.L., 2009. On population growth near protected areas. PLoS One,
e4279.
Kartawinata, K., Vayda, A.P., 1984. Forest conversion in East Kalimantan, Indonesia: the activities and
impact of timber companies, shifting cultivators, migrant pepper-farmers, and others. In: Castri
FD, Baker FWG and Hadley M (eds.), Ecology in practice, part 1: Ecosystem management: 99-126.
Ticooly International Publications, Dublin and Unesco, Paris.
Kattan, G.H., Alvarez-Lopez, H., Giraldo, M., 1994. Forest fragmentation and bird extinctions: San
Antonio eighty years later. Conservation Biology 8, 138–146.

30
Kindt, R., Coe, R., 2005. Tree diversity analysis. A manual and software for common statistical
methods for ecological and biodiversity studies. World Agroforestry Centre (ICRAF), Nairobi,
Kenya.
Kissinger, G., Herold, M., De Sy, V., 2012. Drivers of Deforestation and Forest Degradation. A
synthesis report for REDD+ Policymakers, UK and Norway.
van Kuijk, M., Putz, F.E., Zagt. R., 2009. Effects of forest certification on biodiversity. Tropenbos
International. Wageningen, The Netherlands.
Lambert, F.R., 1992. The consequences of selective logging for Bornean lowland forest birds. Phil.
Trans. Roy. Soc. London B 335, 443-457.
Lambert, F.R., Collar, N.J., 2002. The future for Sundaic lowland forest birds: long-term effects of
commercial logging and fragmentation. Forktail 18, 127-146.
Laurance, W.F., 1998. A crisis in the making: responses of Amazonian forests to land use and climate
change. Trends in Ecology and Evolution 13, 411-415.
Laurance, W.F., 1999. Reflections on the tropical deforestation crisis. Biological Conservation 91, 109-
117.
Laurance, W.F., 2007. Forest destruction in tropical Asia. Current Science 93, 1544-1550.
Lin, M., Lucas, H. C., Shmueli, G., 2013. Research Commentary: Too big to fail: Large samples and the
p-value problem. Information Systems Research 24, 904-917.
Lindenmayer, D.B., Margules, C.R., Botkin, D. B., 2000. Indicators of biodiversity for ecologically
sustainable forest management. Conservation Biology 14, 941-950.
Mantel, S., Tyrie, G.R., Oosterman A., 2002. Exploring sustainable land use options for district
planning in the Berau regency, Indonesia. International soil refernce and information center,
Wageningen, The Netherlands.
Marsden, S.J., 1998. Changes in bird abundance following selective logging on Seram, Indonesia.
Conservation Biology 12, 605-611.
Mason, D., 1996. Responses of venezuelan understorey birds to selective logging, enrichment strips,
and vine cutting. Biotropica 28, 296-309.

31
Mason, D., Thiollay, J., 2001. Tropical forestry and the conservation of Neotropical birds. In: Fimbel,
R.A., Grajal, A., Robinson, J.G., The Cutting Edge: Conserving Wildlife in Logged Tropical Forests,
167-191.
MacKinnon, J., Phillipps, K., 1993, Summatra, Java and Bali. Oxford University Press, New York.
Meijaard, E., Sheil, D., Nasi, R., Augeri, D., Rosenbaum, B., Iskandar, D., Setyawati, T., Lammertink,
M., Rachmatika, I., Wong, A., Soehartono, T., Stanley, S., O’Brien, T., 2005. Life after logging.
Reconciling wildlife conservation and production forestry in Indonesian Borneo. CIFOR and
UNESCO, Jakarta.
Myers, N., 1996. The world’s forests: problems and potentials. Environmental Conservation 23, 156-168.
Myers, S., 2009. Birds of Borneo – Brunei, Sabah, Sarawak and Kalimantan. Princeton University
Press, Princeton.
Nijman, V. 1998. Habitat preference of Great Argus pheasant (Argusianus argus) in Kayan Mentarang
National Park, east Kalimantan, Indonesia. Journal fur Ornithologie 139, 313-323.
Oksanen, J., Blanchet, F.G., Kindt, R., Legendre, P., Minchin, P.R., O’Hara, R.B., Simpson, G.L.,
Solymos, P., Stevens, M.H.H., Wagner, H., 2011. Vegan: Community Ecology Package. R package
version 2.0-2. http://CRAN.R-project.org/package=vegan
Phillipps, Q., Phillipps, K., 2011. Phillipps' Field Guide to the Birds of Borneo – Sabah, Sarawak, Brunei
and Kalimantan. Second edition. John Beaufoy Publishing Ltd, Oxford.
Pieterse, S., Wielstra, B., 2005. The effects of small-scale forest disturbance by indigenous people on
species diversity and community structure of birds in the Gunung Lumut protection forest East
Kalimantan, Indonesia. Environment and Development Student Report no. 197.
Posa, M.R.C., 2011. Peat swamp forest avifauna of Central Kalimantan, Indonesia: Effects of habitat
loss and degradation. Biological Conservation 144, 2548-2556.
Purbawiyatna, A., 2002. Forest Certification as an Evaluation Process: The case study of Labanan
forest management unit, East Kalimantan – Indonesia. MSc Thesis, International Institute For Geo-
information Science and Earth Observation ITC). Enschede, The Netherlands.
Putz, F.E., Redford, K.H., Robinson, J.G., Fimbel, R., Blate, G.M., 2000. Biodiversity conservation in the
context of tropical forest management. The World Bank, Environment Department Papers 75.

32
R Core Team, 2014. R: A Language and environment for statistical computing. Vienna, Austria.
http://www.R-project.org/.
Rametsteiner, E., Simula, M., 2003. Forest certification - an instrument to promote sustainable forest
management? Journal of Environmental Management 67, 87-98.
Renjifo, L.M., 1999. Composition changes in a subandean avifauna after long-term forest
fragmentation. Conservation Biology 13, 1124-1139.
Rodrigues, A.S.L., Akçakaya, H.R., Andelman, S.J., Bakarr, M.I., Boitani, L., Brooks, T.M., Chanson, J.S.,
Fishpool, L.D.C., Da Fonseca, G.A.B., Gaston, K.J., Hoffman, M., Marquet, P.A., Pilgrim, J.D.,
Pressey, R.L., Shipper, J., Sechrest, W., Stuart, S.N., Underhill, L.G., Waller, R.W., Watts, M.E.J, Xie
Yan, 2004. Global gap analysis: priority regions for expanding the global protected-area network.
BioScience 54, 1092-1100.
Round, P.D., Brockelman, W.Y., 1998. Bird communities of disturbed lowland forest habitats of
southern Thailand. Nat. Hist. Bull. Siam Soc. 46, 171-196.
Sheil, D., van Heist, M., 2000. Ecology for tropical forest management. International Forestry Review
2, 261-270.
Slik, J.W.F, van Balen, S., 2006. Bird community changes in response to single and repeated fires in a
lowland tropical rainforest of eastern Borneo. Biodiversity and Conservation 15, 4425-4451.
Thiollay, J-M., 1992. Influence of Selective Logging on Bird Species Diversity in a Guianan Rain Forest.
Conservation Biology 6, 47-63.
Thiollay, J-M., 1997. Disturbance, selective logging and bird diversity: a Neotropical forest study.
Biodiversity and Conservation 6, 1155-1173.
Upton, C., Bass, S., 1996. The forest certification handbook. In: Press SL (ed), Delray Beach, Florida,
USA.
Viana, V.M., Erwin, J., Donovan, R.Z., Ellioitt, C., Gholz, H., 1996. Certification of forest products. In:
Press I (ed), Covelo, CA.
Vogt, K.A., Larson, B.C., Gordon, J.C., Vogt, K.J., Fanzeres, A., 2000 Forest certification: Roots, issues,
challenges, and benefits. In: CRC Press, Boca Raton, Florida.

33
Wunderle, J.M., Henriques, L.M.P., Willig, M.R., 2006. Short-term responses of birds to forest gaps
and understorey: an assessment of reduced-impact logging in a Lowland Amazon Forest.
Biotropica 38, 235-255.
Zurita, G.A., Zuleta, G.A., 2009. Bird use of logging gaps in a subtropical mountain forest: The
influence of habitat structure and resource abundance in the Yungas of Argentina. Forest Ecology
and Management 257, 271-279.

34
Appendix Table A1. List of all species encountered during the research including the guilds they belong to and total abundance in each site. (Diet guilds: F = Frugivore, FC =
Frugivore/Carnivore, FI = Frugivore/Insectivore, I = Insectivore, IC = Insectivore/Carnivore, N = Nectarivore; Feeding layer guilds: AF = Arboreal Frugivore, AFC = Arboreal
Frugivore/Carnivore, AFI = Arboreal Frugivore/Insectivore, AI = Arboreal Insectivore, AIC = Arboreal Insectivore/Carnivore, AN = Arboreal Nectarivore, UFI = Understorey
Frugivore/Insectivore, UI = Understorey Insectivore, UN = Understorey Nectarivore, TFI = Terrestrial Frugivore/Insectivore, TI = Terrestrial Insectivore, TIC = Terrestrial
Insectivore/Carnivore).
Species Scientific name Diet guild Feeding layer guild Site
Primary L2003 L2007 L2011
Aegithinidae
Green Iora Aegithina viridissima I AI 0 1 0 0
Alcedinidae
Banded kingfisher Lacedo pulchella IC TIC 0 0 1 2
Blue-eared kingfisher Alcedo meninting IC TIC 0 0 1 1
Chestnut-collared kingfisher Actenoides concretus IC TIC 1 1 0 0
Rufous-backed kingfisher Ceyx rufidorsa rufidorsa I UI 1 1 2 2
Bucerotidae
Asian black hornbill Anthracocceros malayanus FC AFC 4 5 3 1
Bushy-crested hornbill Anorrhinus galeritus FC AFC 0 2 0 0
Helmeted Hornbill Buceros vigil FC AFC 6 0 0 0
Rhinoceros hornbill Buceros rhinoceros FC AFC 3 7 4 4
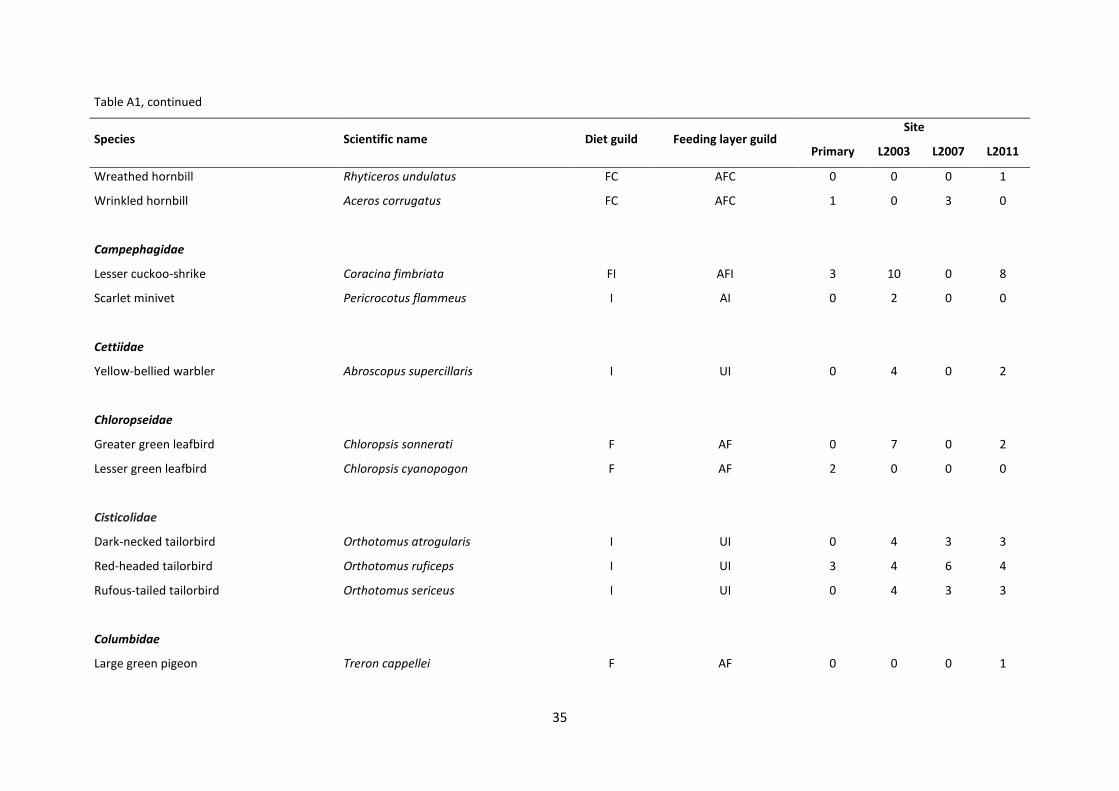
35
Table A1, continued
Species Scientific name Diet guild Feeding layer guild Site
Primary L2003 L2007 L2011
Wreathed hornbill Rhyticeros undulatus FC AFC 0 0 0 1
Wrinkled hornbill Aceros corrugatus FC AFC 1 0 3 0
Campephagidae
Lesser cuckoo-shrike Coracina fimbriata FI AFI 3 10 0 8
Scarlet minivet Pericrocotus flammeus I AI 0 2 0 0
Cettiidae
Yellow-bellied warbler Abroscopus supercillaris I UI 0 4 0 2
Chloropseidae
Greater green leafbird Chloropsis sonnerati F AF 0 7 0 2
Lesser green leafbird Chloropsis cyanopogon F AF 2 0 0 0
Cisticolidae
Dark-necked tailorbird Orthotomus atrogularis I UI 0 4 3 3
Red-headed tailorbird Orthotomus ruficeps I UI 3 4 6 4
Rufous-tailed tailorbird Orthotomus sericeus I UI 0 4 3 3
Columbidae
Large green pigeon Treron cappellei F AF 0 0 0 1

36
Table A1, continued
Species Scientific name Diet guild Feeding layer guild Site
Primary L2003 L2007 L2011
Little green pigeon Treron olax F AF 9 7 1 0
Thick-billed green pigeon Treron curvirostris F AF 6 5 1 3
Corvidae
Bornean black magpie Platysmurus atterimus I AI 2 2 6 9
Crested jay Platylophus galeritus I UI 4 1 1 1
Slender-billed crow Corvus enca IC AIC 0 0 0 3
Cuculidae
Banded bay cuckoo Cacomantis sonneratii I UI 7 4 0 2
Chestnut-breasted malkoha Phaenicophaeus curvirostris IC AIC 0 2 0 0
Greater Coucal Centropus sinensis IC TIC 4 2 0 1
Indian cuckoo Cuculus micropterus I AI 9 11 7 3
Little bronze cuckoo Chrysococcyx minutillus I AI 0 1 0 0
Moustached Hawk-cuckoo Hierococcyx vagans I UI 1 0 0 0
Plaintive cuckoo Cacomantis merulinus I AI 0 2 4 2
Raffles's malkoha Phaenicophaeus chlorophaeus I AI 0 2 0 2
Short-toed coucal Centropus rectunguis IC TIC 1 0 0 0
Square-tailed drongo-cuckoo Curniculus lugubris I AI 1 2 0 5
Violet cuckoo Chrysococcyx xanthorhynchus I UI 1 3 0 0

37
Table A1, continued
Species Scientific name Diet guild Feeding layer guild Site
Primary L2003 L2007 L2011
Culicicapa
Grey-headed canary flycatcher Culicicapa ceylonensis I UI 0 0 1 0
Dicaeidae
Orange-bellied flowerpecker Dicaeum trigonostigma N UN 4 11 2 0
Scarlet-breasted flowerpecker Prinochilus thoracicus FI UFI 1 0 0 0
Yellow-breasted flowerpecker Prionochilus maculatus N UN 3 1 4 3
Yellow-rumped flowerpecker Prinochilus xanthopygius N UN 2 4 2 0
Dicruridae
Bronzed drongo Dicrurus aeneus I AI 17 2 7 7
Greater racquet-tailed drongo Dicrurus paradiseus I AI 7 5 11 20
Estrildidae
Dusky munia Lonchura fuscans FI TFI 0 0 2 1
Eurylaimidae
Banded broadbill Eurylaimus javanicus I AI 0 2 0 3
Black-and-yellow Broadbill Eurylaimus ochromalus I AI 24 22 18 27
Green broadbill Calyptomena viridis F AF 5 10 11 3

38
Table A1, continued
Species Scientific name Diet guild Feeding layer guild Site
Primary L2003 L2007 L2011
Irenidae
Asian fairy-bluebird Irena puella F AF 18 9 1 9
Meropidae
Red-bearded bee-eater Nyctyornis amictus I AI 1 0 0 0
Monarchidae
Asian-paradise flycatcher Terpsiphone paradisi I UI 11 8 3 2
Black-naped monarch Hypothymis azurea I UI 5 11 8 7
Muscicapidae
Grey-chested jungle flycatcher Rhinomyias umbratilis I UI 0 1 2 8
Malaysian blue flycatcher Cyornis turcosus I UI 1 0 0 0
Pale blue flycatcher Cyornis unicolor I AI 0 1 0 0
Rufous-tailed shama Trichixos pyrropygus I UI 17 14 3 5
White-crowned forktail Enicurus leschenaulti I UI 1 2 0 2
White-rumped shama Copsychus malabaricus I UI 1 1 0 6
Nectariniidae
Eastern crimson sunbird Nectarinia jugularis N UN 0 0 1 1
Grey-breasted spiderhunter Arachnothera modesta N UN 1 0 1 0

39
Table A1, continued
Species Scientific name Diet guild Feeding layer guild Site
Primary L2003 L2007 L2011
Little spiderhunter Arachnothera longirostra N UN 30 23 16 10
Long-billed spiderhunter Arachnothera robusta N AN 1 0 0 0
Plain Sunbird Anthreptes simplex I UI 0 0 2 0
Purple-naped sunbird Hypogramma hypogrammicum N UN 8 5 9 5
Ruby-cheeked sunbird Chalcoparia singalensis I AI 0 0 1 1
Spectacled spiderhunter Arachnothera flavigaster N AN 4 0 1 1
Yellow-eared spiderhunter Arachnothera chrysogenys N AN 0 0 1 0
Orilidae
Dark-throated oriole Oriolus xanthonotus FI AFI 0 1 0 0
Pellorneidae
Black-capped babbler Pellorneum capistratum I TI 1 2 1 1
Bornean wren-babbler Ptilocichla leucogrammica I TI 1 0 1 1
Ferruginous babbler Trichastoma bicolor I UI 1 0 2 5
Horsfield's babbler Trichastoma sepiarium I UI 4 1 0 0
Short-tailed babbler Trichastoma malaccense I TI 9 9 16 8
Phasianidae
Great argus Argusianus argus FI TFI 0 0 0 1

40
Table A1, continued
Species Scientific name Diet guild Feeding layer guild Site
Primary L2003 L2007 L2011
Picidae
Banded woodpecker Picus miniaceus I AI 1 0 0 0
Buff-necked woodpecker Meiglyptes tukki I UI 1 0 0 0
Buff-rumped woodpecker Meiglyptes tristis I AI 1 1 1 0
Crimson-winged woodpecker Picus puniceus I AI 0 0 1 0
Great slaty woodpecker Mulleripicus pulverulentus I AI 0 3 1 0
Maroon woodpecker Blythipicus rubiginosus I UI 0 0 0 4
Olive-backed woodpecker Dinopium rafflesii I UI 0 1 0 1
Rufous woodpecker Celeus brachyurus I UI 2 5 2 0
White-bellied woodpecker Dryocopus javensis I AI 0 2 1 0
Pittidae
Blue-headed pitta Pitta baudii I TI 8 0 0 1
Garnet pitta Pitta granatina I TI 17 5 11 6
Hooded pitta Pitta sordida muelleri I TI 1 0 0 0
Prinopidae
Large wood shrike Tephrodoris gularis I AI 2 1 1 0
Rufous-winged philentoma Philentoma pyrrhopterum I UI 0 3 0 0

41
Table A1, continued
Species Scientific name Diet guild Feeding layer guild Site
Primary L2003 L2007 L2011
Psittacidae
Blue-crowned hanging parrot Loriculus galgulus N AN 4 8 6 5
Psittaculidae
Long-tailed parakeet Psittacula longicauda F AF 0 1 0 0
Pycnonotidae
Black-headed bulbul Pycnonotus atriceps atriceps FI AFI 14 6 8 3
Buff-vented bulbul Iole olivacea FI UFI 8 3 6 2
Cream-vented bulbul Pycnonotus simplex FI AFI 16 9 17 9
Grey-bellied bulbul Pycnonotus cyaniventris FI UFI 2 1 1 0
Grey-cheeked bulbul Criniger bres FI UFI 3 5 0 2
Hairy-backed bulbul Tricholestes criniger FI UFI 24 10 5 4
Olive-winged bulbul Pycnonotus plumosus FI UFI 2 0 0 0
Puff-backed bulbul Pycnonotus eutilotus FI UFI 0 0 0 2
Red-eyed bulbul Pycnonotus brunneus FI UFI 42 37 26 41
Spectacled bulbul Pycnonotus erythrophthalmos FI UFI 0 0 0 2
Straw-headed bulbul Pycnonotus zeylanicus FI UFI 1 0 0 0
Streaked bulbul Ixos malaccensis FI AFI 3 0 8 5
Yellow-bellied bulbul Criniger phaeocephalus I UI 5 8 1 3
Yellow-vented bulbul Pycnonotus goavier FI UFI 1 2 1 0

42
Table A1, continued
Species Scientific name Diet guild Feeding layer guild Site
Primary L2003 L2007 L2011
Ramphastidae
Blue-eared barbet Megalaima australis F AF 9 16 11 12
Golden-whiskered barbet Megalaima chrysopogon FI AFI 8 0 3 16
Red-crowned barbet Megalaima rafflesii F AF 4 13 6 0
Red-throated barbet Megalaima mystacophanos FI AFI 24 1 0 2
Yellow-crowned barbet Megalaima henricii F AF 7 3 9 11
Rhipiduridae
Pied fantail Rhipidura javanica I UI 0 1 1 0
Spotted Fantail Rhipidura perlata I AI 0 0 1 2
Sittidae
Velvet-fronted nuthatch Sitta frontalis I AI 0 1 0 0
Sturnidae
Hill Myna Gracula religiosa FI AFI 4 20 15 6
Timaliidae
Black-throated babbler Stachyris nigricollis I UI 7 0 2 6
Bold-striped tit-babbler Macronous bornensis bornensis I UI 2 2 2 5
Brown fulvetta Alcippe brunneicauda FI UFI 2 9 3 14

43
Table A1, continued
Species Scientific name Diet guild Feeding layer guild Site
Primary L2003 L2007 L2011
Chestnut-backed scimitar-babbler Pomatorhinus mantanus I AI 1 1 0 0
Chestnut-rumped babbler Stachyris maculata I UI 17 13 14 20
Chestnut-winged babbler Stachyris erythroptera I UI 20 15 13 24
Fluffy-backed tit-babbler Macronous ptilosus I UI 0 1 3 8
Rufous-crowned babbler Malacopteron magnum I UI 12 6 20 22
Scaly-crowned babbler Malcopteron cinereum I UI 3 10 5 1
Sooty-capped babbler Malacopteron affine I UI 0 0 0 4
White-chested babbler Trichastoma rostratum I TI 0 0 0 1
Trogonidae
Cinnamon-rumped trogon Harpactes orrophaeus I AI 0 0 1 0
Diard's trogon Harpactes diardii I AI 1 1 0 2
Red-naped trogon Harpactes kasumba I AI 1 2 1 0
Scarlet-rumped trogon Harpactes duvaucelii I UI 6 0 1 3

44
Figure A1. A cavity-bearing tree illegally logged near the primary forest site in order to give room for a plantation.


![PHOTO ALBUM - Microsoft · The menu is printed on FSC certified paper [sustainable logging] 2017.06#4 PHOTO ALBUM sticksnsushiUK sticksnsushiUK sticksnsushi sticksnsushi. LOOK HOW](https://static.fdocuments.in/doc/165x107/5f0647bb7e708231d417335b/photo-album-microsoft-the-menu-is-printed-on-fsc-certified-paper-sustainable.jpg)