Impact of four‐dimensional data assimilation (FDDA) on ...
15
RESEARCH ARTICLE 10.1002/2015MS000487 Impact of four-dimensional data assimilation (FDDA) on urban climate analysis Linlin Pan 1 , Yubao Liu 1 , Yuewei Liu 1 , Lei Li 2 , Yin Jiang 2 , Will Cheng 1 , and Gregory Roux 1 1 National Center for Atmospheric Research, Boulder, Colorado, USA, 2 Meteorology Bureau of Shenzhen Municipality, Shenzhen, China Abstract This study investigates the impact of four-dimensional data assimilation (FDDA) on urban cli- mate analysis, which employs the NCAR (National Center for Atmospheric Research) WRF (the weather research and forecasting model) based on climate FDDA (CFDDA) technology to develop an urban-scale microclimatology database for the Shenzhen area, a rapidly developing metropolitan located along the southern coast of China, where uniquely high-density observations, including ultrahigh-resolution surface AWS (automatic weather station) network, radio sounding, wind profilers, radiometers, and other weather observation platforms, have been installed. CFDDA is an innovative dynamical downscaling regional climate analysis system that assimilates diverse regional observations; and has been employed to produce a 5 year multiscale high-resolution microclimate analysis by assimilating high-density observations at Shenzhen area. The CFDDA system was configured with four nested-grid domains at grid sizes of 27, 9, 3, and 1 km, respectively. This research evaluates the impact of assimilating high-resolution observation data on repro- ducing the refining features of urban-scale circulations. Two experiments were conducted with a 5 year run using CFSR (climate forecast system reanalysis) as boundary and initial conditions: one with CFDDA and the other without. The comparisons of these two experiments with observations indicate that CFDDA greatly reduces the model analysis error and is able to realistically analyze the microscale features such as urban- rural-coastal circulation, land/sea breezes, and local-hilly terrain thermal circulations. It is demonstrated that the urbanization can produce 2.5 k differences in 2 m temperatures, delays/speeds up the land/sea breeze development, and interacts with local mountain-valley circulations. 1. Introduction The climate four-dimensional data assimilation (CFDDA) is a recently developed dynamical downscaling tool [Rife et al., 2010; Hahmann et al ., 2010; Rostkier-Edelstein et al., 2014] by the National Center for Atmospheric Research (NCAR) for high-resolution regional and global climate analysis. CFDDA is an extended version of the real-time four-dimensional data assimilation (RTFDDA) technology [Liu et al., 2008a,b], which was developed for high-resolution and multiple-scale real-time data assimilation and forecasting based upon mesoscale models, using MM5 (the Penn State (PSU)/NCAR Mesoscale Model version 5 [Grell et al ., 1994]) or the Weather Research and Forecasting model (WRF) [Skamarock et al., 2005]. RTFDDA continuously assimilates observations into the mesoscale models through a nudging/Newtonian relaxation approach and tracks the model state toward the observational state by adding artificial error correction terms to model equations. There are two types of nudg- ing [Anthes, 1974; Hoke and Anthes, 1976; Stauffer and Seaman, 1990, 1994; Liu et al., 2006]: one is analysis/grid nudging; and the other is observational nudging, which nudges the model-to-grid analysis and point observa- tions, respectively. The two nudging methods can be used simultaneously or individually. RTFDDA is an obser- vational nudging-based data assimilation system, which assimilates all kinds of observations, such as surface observations, sounding, profiler data, aircraft data, satellite wind, radar data, etc., by spreading the observation information from the observation points to the neighboring space and time (four dimensions: x, y, z, and t). The time differential equation for observational nudging to a model variable X m can be expressed as: @X m @t 5f ðX m ; tÞ1GWðHY o 2X m Þ; (1) where the first part of the right-hand side of the equation defines the model’s original terms and the second part shows the observational nudging term, which depends the reciprocal of relaxation time scale (G), Key Points: Impact of FDDA on urban climate dynamical downscaling is investigated The data assimilation significantly reduces the model bias of dynamical downscaling High-resolution modeling is essential for urban climate analysis and simulation of the urban land/sea breeze interaction Correspondence to: L. Pan, [email protected] Citation: Pan, L., Y. Liu, Y. Liu, L. Li, Y. Jiang, W. Cheng, and G. Roux (2015), Impact of four-dimensional data assimilation (FDDA) on urban climate analysis, J. Adv. Model. Earth Syst., 7, 1997–2011, doi:10.1002/ 2015MS000487. Received 28 MAY 2015 Accepted 14 NOV 2015 Accepted article online 18 NOV 2015 Published online 17 DEC 2015 V C 2015. The Authors. This is an open access article under the terms of the Creative Commons Attribution-NonCommercial-NoDerivs License, which permits use and distribution in any medium, provided the original work is properly cited, the use is non-commercial and no modifications or adaptations are made. PAN ET AL. IMPACT OF FDDA ON URBAN CLIMATE ANALYSIS 1997 Journal of Advances in Modeling Earth Systems PUBLICATIONS
Transcript of Impact of four‐dimensional data assimilation (FDDA) on ...

RESEARCH ARTICLE10.1002/2015MS000487
Impact of four-dimensional data assimilation (FDDA) on urbanclimate analysisLinlin Pan1, Yubao Liu1, Yuewei Liu1, Lei Li2, Yin Jiang2, Will Cheng1, and Gregory Roux1
1National Center for Atmospheric Research, Boulder, Colorado, USA, 2Meteorology Bureau of Shenzhen Municipality,Shenzhen, China
Abstract This study investigates the impact of four-dimensional data assimilation (FDDA) on urban cli-mate analysis, which employs the NCAR (National Center for Atmospheric Research) WRF (the weatherresearch and forecasting model) based on climate FDDA (CFDDA) technology to develop an urban-scalemicroclimatology database for the Shenzhen area, a rapidly developing metropolitan located along thesouthern coast of China, where uniquely high-density observations, including ultrahigh-resolution surfaceAWS (automatic weather station) network, radio sounding, wind profilers, radiometers, and other weatherobservation platforms, have been installed. CFDDA is an innovative dynamical downscaling regional climateanalysis system that assimilates diverse regional observations; and has been employed to produce a 5 yearmultiscale high-resolution microclimate analysis by assimilating high-density observations at Shenzhenarea. The CFDDA system was configured with four nested-grid domains at grid sizes of 27, 9, 3, and 1 km,respectively. This research evaluates the impact of assimilating high-resolution observation data on repro-ducing the refining features of urban-scale circulations. Two experiments were conducted with a 5 year runusing CFSR (climate forecast system reanalysis) as boundary and initial conditions: one with CFDDA and theother without. The comparisons of these two experiments with observations indicate that CFDDA greatlyreduces the model analysis error and is able to realistically analyze the microscale features such as urban-rural-coastal circulation, land/sea breezes, and local-hilly terrain thermal circulations. It is demonstrated thatthe urbanization can produce 2.5 k differences in 2 m temperatures, delays/speeds up the land/sea breezedevelopment, and interacts with local mountain-valley circulations.
1. Introduction
The climate four-dimensional data assimilation (CFDDA) is a recently developed dynamical downscaling tool[Rife et al., 2010; Hahmann et al., 2010; Rostkier-Edelstein et al., 2014] by the National Center for AtmosphericResearch (NCAR) for high-resolution regional and global climate analysis. CFDDA is an extended version of thereal-time four-dimensional data assimilation (RTFDDA) technology [Liu et al., 2008a,b], which was developed forhigh-resolution and multiple-scale real-time data assimilation and forecasting based upon mesoscale models,using MM5 (the Penn State (PSU)/NCAR Mesoscale Model version 5 [Grell et al., 1994]) or the Weather Researchand Forecasting model (WRF) [Skamarock et al., 2005]. RTFDDA continuously assimilates observations into themesoscale models through a nudging/Newtonian relaxation approach and tracks the model state toward theobservational state by adding artificial error correction terms to model equations. There are two types of nudg-ing [Anthes, 1974; Hoke and Anthes, 1976; Stauffer and Seaman, 1990, 1994; Liu et al., 2006]: one is analysis/gridnudging; and the other is observational nudging, which nudges the model-to-grid analysis and point observa-tions, respectively. The two nudging methods can be used simultaneously or individually. RTFDDA is an obser-vational nudging-based data assimilation system, which assimilates all kinds of observations, such as surfaceobservations, sounding, profiler data, aircraft data, satellite wind, radar data, etc., by spreading the observationinformation from the observation points to the neighboring space and time (four dimensions: x, y, z, and t).
The time differential equation for observational nudging to a model variable Xm can be expressed as:
@Xm
@t5f ðXm; tÞ1GWðHYo2XmÞ; (1)
where the first part of the right-hand side of the equation defines the model’s original terms and the secondpart shows the observational nudging term, which depends the reciprocal of relaxation time scale (G),
Key Points:� Impact of FDDA on urban climate
dynamical downscaling isinvestigated� The data assimilation significantly
reduces the model bias of dynamicaldownscaling� High-resolution modeling is essential
for urban climate analysis andsimulation of the urban land/seabreeze interaction
Correspondence to:L. Pan,[email protected]
Citation:Pan, L., Y. Liu, Y. Liu, L. Li, Y. Jiang,W. Cheng, and G. Roux (2015),Impact of four-dimensional dataassimilation (FDDA) on urban climateanalysis, J. Adv. Model. Earth Syst., 7,1997–2011, doi:10.1002/2015MS000487.
Received 28 MAY 2015
Accepted 14 NOV 2015
Accepted article online 18 NOV 2015
Published online 17 DEC 2015
VC 2015. The Authors.
This is an open access article under the
terms of the Creative Commons
Attribution-NonCommercial-NoDerivs
License, which permits use and
distribution in any medium, provided
the original work is properly cited,
the use is non-commercial and no
modifications or adaptations are
made.
PAN ET AL. IMPACT OF FDDA ON URBAN CLIMATE ANALYSIS 1997
Journal of Advances in Modeling Earth Systems
PUBLICATIONS

weighting function (W, a function ofspatial distance and data quality), andthe difference between model andobservation (Yo) at model grid (HYo). His the observation operator that proj-ects the observations on the modelgrid.
The CFDDA extends RTFDDA for cli-mate analysis. In this study, weemploy CFDDA for the climate down-scaling in the Shenzhen area, locatedalong the southeast coast of China.Climate dynamical downscaling oftenrefers to using the output of GCM(global circulation model) to drive aregional numerical weather predic-tion model running at higher spatialresolution to simulate local/regionalweather conditions in greater detailfor periods of a few of years to deca-des. There are many historical reanal-yses, such as the National Centers forEnvironmental Prediction (NCEP) Cli-mate Forecast System Reanalysis(CFSR), National Centers for Environ-mental Prediction (NCEP)/NCAR rean-alysis, European Centre for Medium-Range Weather Forecasts’ (ECMWF)40 years of reanalysis, each used fordynamical downscaling to study cur-rent and past weather conditions,
which differ from the GCM outputs that can be used to study both past and future weather and climate.Historical reanalysis by assimilating more observations on higher-resolution grid models can achieveimproved regional weather/climate features [e.g., Bollmeyer et al., 2015]. However, data assimilation wasnot employed in most of the previous dynamical downscaling studies [e.g., Leung et al., 2003; Castroet al., 2005; Lo et al., 2008; Pan et al., 2011a,b]. For this paper, dynamical downscaling using the CFDDAtechnology was performed to improve the quality of microscale regional climate analysis for the Shenz-hen metropolitan and surrounding areas where complex terrain and land/sea interaction exist [Wai,1993; Miao and Tang, 1998; Lin et al., 2001; Wen et al., 2009; Lu et al., 2010; Zhang et al., 2014] and richlocal observations are available from recent years. This paper is organized as following: model configu-ration and observation data sources are given in section 2, followed by evaluation of the impact of dataassimilation on seasonal mean climate, the climate features of the diurnal cycle, and their statisticalerrors (section 3). In section 4, we discuss the effect of urban-rural and land/sea contrasts on regionalclimate as revealed in the high-resolution downscaling modeling, and section 5 is the summary of themain results.
2. Model Setting and Observations
The CFDDA version employed in this study was based on the WRF Version 3.5.1, and the modeldomain configuration is shown in Figure 1. The system was configured with four nested-grid domainswith grid sizes of 27 km, 9 km, 3 km, and 1 km, respectively. The finest grid domain (Domain 4) cov-ers the Shenzhen municipality, Hong Kong, Macau, and neighboring areas. The model physics packageincludes Kain-Fritsch cumulus scheme [Kain and Fritsch, 1990], Lin microphysics [Lin et al., 1983], rapidradiative transfer model (RRTM) [Mlawer et al., 1997] longwave radiation, Dudhia shortwave radiation
Figure 1. Model domain configuration: (a) Terrain height in Domain 1 (D1) andlocation of the nested-grid Domains 2, 3, and 4 (D2, D3, D4), and (b) topographyof domain 4. The unit of height is meter.
Journal of Advances in Modeling Earth Systems 10.1002/2015MS000487
PAN ET AL. IMPACT OF FDDA ON URBAN CLIMATE ANALYSIS 1998

[Dudhia, 1989], Yonsei University (YSU) [Hong et al., 2006], planetary boundary layer (PBL), and Noahland-surface model. The model has adaptive time step with one-way nesting and nonhydrostatic set-ting. The topographic shading/slope effect and surface wind correction option (topo_wind) are turnedon. The same nudging coefficients 6.E-4 are used for temperature, moisture, and wind. The influenceradiuses for data assimilation are 150, 80, 30, 10 km for domains 1, 2, 3, and 4, respectively. Theobservations are assimilated to the model with a time window of 30 min. The NCEP CFSR global rean-alysis is used as boundary and initial conditions. The model system runs continuous data assimilation
Figure 2. Observation samples showing availability of different types of observations: (a) counts of each type observations at differenttime, and the locations of the observations in (b) Domain 1 (D1) and (c) Domain 4 (D4). Blue dots are automatic weather stations (AWS),green triangles represent radio sounding (RAOB), and red dots denote the wind profilers.
Journal of Advances in Modeling Earth Systems 10.1002/2015MS000487
PAN ET AL. IMPACT OF FDDA ON URBAN CLIMATE ANALYSIS 1999

to generate weather analysis withtwo cold-starts per week. Each runintegrates 96 h (4 day) FDDA analy-sis, and the outputs of first 12 hthat containing ‘‘spin-up’’ effect arediscarded, with the rest of modeloutputs making up of continuoushourly analyses for 5 years of analy-sis period. The regional/mesoscalemodel uses global model simulation(e.g., CFSR) as boundary and initialcondition, and it will drift away fromthat of the driving global modelover a long term. Normally, there aretwo ways to prevent that problem,one is to use spectral nudging tokeep the large-scale feature in meso-scale model to be consistent withthat of the global model, and thesecond method is to use frequentreinitiation (cold start). In Shenzhenarea, according to our sensitivitytests, two cold starts per week givebetter analysis and forecasts. InUnited States of America (USA), onlyone cold start per week in the real-time operational system is neededdue to more observations are avail-able. To assess the impact of dataassimilation on the climate analysis,two 5 year parallel runs are per-formed for comparison: one uses theFDDA data assimilation; and theother is run without data assimila-tion. Meanwhile, partial-data-withholding experiments were alsoconducted to study the impact ofdata assimilation.
The observations can be used inthe FDDA data assimilation includeultrahigh-resolution surface automaticweather station (AWS) networks, radiosounding, wind profilers, ground-basedupward looking microwave radio-
meters, aircraft data, satellite cloud-drifting wind, Doppler weather radars, and observations from other plat-forms (e.g., buoy over ocean). Microwave radiometers have temperature observations that can be used inthe model directly. Radar reflectivity data can be used through hydrometer latent heat nudging [Pan et al.,2015]. Basically, the radar reflectivity can be transferred to rainwater or snow based on model temperatureand nudging these variables into model. Figure 2a is a sample of the observation counts of the data sour-ces, which include China-nationwide AWS (ALLAWS), Hong Kong/Guangdong local AWS (AWSMAIN), Shenz-hen local AWS (localAWS), meteorological information comprehensive analysis and process system,(MICAPS) [China Meteorological Bureau (CMA), 2015] radio sounding (RAOB), MICAPS surface observations(Surface), Shenzhen wind profilers (Profiler), and Shenzhen radiometer. AWS data are hourly observations,the MICAPS surface data interval is every 3 h, and the sounding data are available at every 12 h. The surface
Figure 3. (a, c) Mean BIAS and (b, d) RMSE of the model (a, b) 2 m temperature(T2) and (c, d) 10 m wind speed (WSP10) for experiments without data assimila-tion (dashed lines) and with data assimilation (solid lines) changing with analysistime (hour) in July 2010. Independent observations from four stations (withheldobservations) were used in computing the verification statistics. The units are Cel-sius and m/s for temperature and wind speed, respectively.
Journal of Advances in Modeling Earth Systems 10.1002/2015MS000487
PAN ET AL. IMPACT OF FDDA ON URBAN CLIMATE ANALYSIS 2000
data are very dense at the Shenzhenarea, which provide an excellent datasource for regional/local climate analy-sis (Figure 2b). The observations arequality controlled through the NCARRTFDDA data quality control system[Wu et al., 2012; Pan et al., 2012]. TheCFDDA system weights the impact ofindividual observations based on theirdata quality.
3. Impact of DataAssimilation on SeasonalMean, Diurnal Cycle, andTheir Statistical Errors
The role of data assimilation is firstinvestigated with a data-withholdingexperiment where observations fromfour stations in Domain four (D4) werewithheld from the data assimilation.The observations from these fourreserved stations were used to assessthe data assimilation impact on themodel bias and root-mean-squareerror (RMSE) for a 1 month run in July2010. Figure 3 shows 2 m temperaturebias (Figure 3a) and RMSE (Figure 3b)of the model with FDDA and withoutFDDA in D4, verified against the with-held observations. It is evident that theFDDA runs have less bias and RMSE for2 m temperatures at the four stations.Similar results are also obtained forwind speed (Figures 3c and 3d), winddirection, and relative humidity (notshown here).
The impact of data assimilation is fur-ther investigated with two 5 yearruns, one with data assimilation usingthe FDDA technology, and the otherwithout data assimilation. The mean
field of 2 m temperature, 2 m specific humidity, and 10 m wind is calculated for both winter and summer.Figure 4 shows the 5 year average 2 m temperature on D4 from the dynamical downscaling experimentwith FDDA (EXP FDDA, hereafter) and experiment without FDDA (EXP NODA, hereafter). The 2 m tempera-ture is plotted in the shaded colors, overlapped with the 10 m wind vectors. The observations at surfacestations are plotted in circles, and the colors in the circles represent the same scales of the value as thebackground. In other words, if the color in a circle is the same as that is in the background shows that themodel result is the same as the observation at that station and the model has a perfect simulation. It canbe seen from the figures that the impact of FDDA on the downscaling analysis is significant. The 2 m tem-peratures of the model outputs from the EXP FDDA are closer to observations than those from the EXPNODA. It is interesting to point out that there are also obvious differences between the standard devia-tion fields (STD) of the EXP FDDA and EXP NODA. Hourly WRF outputs are used here to calculate the STD.Figure 5 compares the STD of 2 m temperatures for experiments without and with DA at 00 UTC
Figure 4. 2 m temperature of the simulation (a) EXP FDDA and (b) EXP NODA dur-ing summertime. The results are 5 year average. The shaded color is 2 m modeltemperature, the circle is the observed 2 m temperature at that station, and thevector is the model 10 m wind. The unit for 2 m temperature is Celsius.
Journal of Advances in Modeling Earth Systems 10.1002/2015MS000487
PAN ET AL. IMPACT OF FDDA ON URBAN CLIMATE ANALYSIS 2001

(Coordinated Universal Time) (08 LST,local sidereal time), 06 UTC (14LST), 12 UTC (20 LST), and 18 UTC(02 LST) during summer time (June,July, and August), for the 5 year simu-lation period. The STD is increasedwhen observations are assimilated;that is, the climate spread of the sys-tem increases with the data assimila-tion. Since the mesoscale model oftenunderestimates the spread whencomparing with observations [e.g.,Houtekamer et al., 1996], for example,the surface temperature of WRF tendsto have cold bias during daytime andwarm bias during the night time [e.g.,Pan et al., 2011a,b; Wyszogrodzki et al.,2013], the increase of the spread indi-cates an improvement of the dynami-cal downscaling capability usingFDDA.
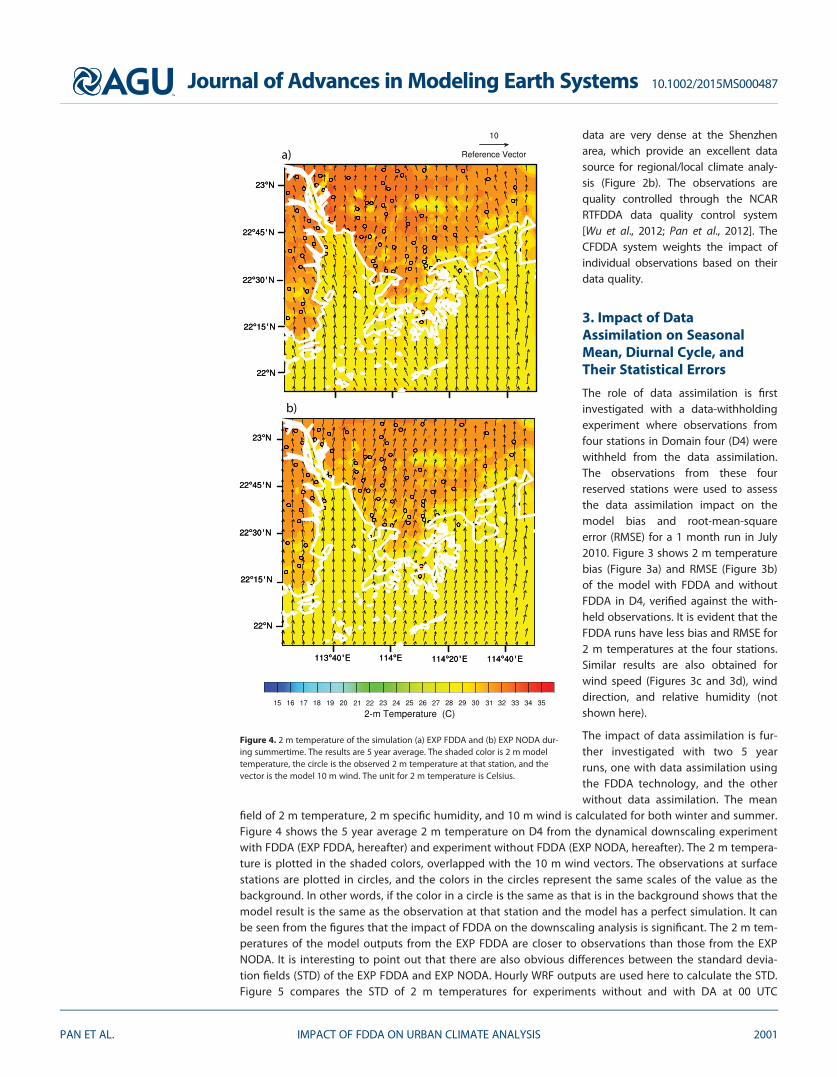
Data assimilation also improvesthe analysis of diurnal cycles of theregional climate. Figure 6 shows theresults of the maximum and minimumtemperature of the experiments with-out data assimilation and with dataassimilation averaged over 5 years.Analysis of EXP FDDA raises the maxi-mum temperatures from that of EXPNODA for most of the locations,whereas the minimum temperaturesare lowered at some locations butraised at others.
The comparison is also performed forthe wintertime (December, January,and February). Similar to Figure 4, theimpact of FDDA on 2 m temperatureduring wintertime is investigatedthrough the comparison of EXP FDDAand NODA experiments (not shown),
and the results with data assimilation are more accurate than those without data assimilation. The STD dur-ing wintertime shows some similar diurnal variations to those during summer, when maximum differenceswere the results between EXP FDDA and EXP NODA at 14 LST (not shown). However, the magnitude ismuch greater than that in summer, which may be related to more cold-air activities (e.g., cold surge) fromnorthern China and Siberian due to winter monsoon activity, in contrast to the dominant warm air from theSouth China Sea due to summer monsoon season.
Maximum and minimum temperatures at 2 m above ground level (AGL) during wintertime are also affectedby data assimilation (not shown). Maximum temperature is increased, but minimum temperature isdecreased. This indicates FDDA is able to correct the known issue that WRF generally underestimates the2 m temperature during daytime and overestimates the 2 m temperature during nighttime.
The model-downscaled relative humidity and winds are also compared with the observations. The 2 mrelative humidity of the EXP FDDA is slightly drier than that without data assimilation in the northern
Figure 5. (a–d) Diurnal cycle of 2 m temperature standard deviation duringsummertime of EXP NODA and (e–h) EXP FDDA experiments at (a, e) 00Z, (b, f)06Z, (c, g) 12Z, and (d, h) 18Z. The results are 5 year average, and the unit for 2 mtemperature is Celsius.
Journal of Advances in Modeling Earth Systems 10.1002/2015MS000487
PAN ET AL. IMPACT OF FDDA ON URBAN CLIMATE ANALYSIS 2002
part of D4 during summertime, which is more consistent with the observations (not shown). Also themodel simulation with FDDA is slightly moister at the northeast side of the domain and drier at thecoastal area than the model simulation without FDDA during wintertime, and this is consistent withthe observations. The impact of FDDA on the wind field is very evident (Figure 7). WRF tends to overesti-mate surface wind speed [e.g., Jimenez and Dudhia, 2012], which is reduced greatly when observationsare assimilated in the current case. The impact of FDDA can be further investigated through precipita-tion fields. Figure 8 gives the accumulated rainfall in March 2014 from EXP FDDA, EXP NODA, and radarquantitative precipitation estimation (QPE). The rain gauge observations are overlapped on them. Therainfall from FDDA has better spatial pattern and magnitude than that from NODA runs comparing withradar QPE and rain gauge data.
In general, significant differences are found between the mean field of the experiments with andwithout data assimilation. The analysis of the WRF CFDDA system is more accurate than that ofthe WRF system without data assimilation. The impact of DA on the analysis is further confirmedby comparing the model domain-average bias of the experiments with and without dataassimilation.
We compared the model simulation at each observation station, acquired the model and observation pairs ateach point for each hour, and then compute the domain-average verification statistics. We first verified themodel outputs with radiosonde observations. In D4, there is one WMO (World Meteorological Organization)sounding site and four wind profilers. Figures 9 and 10 show the domain-average model bias and RMSE verti-cal profiles for July and December. The bias is calculated from the difference between model and observa-tion, and the RMSE is obtained from the root mean square of the difference between model andobservation. The red line shows the error for the EXP FDDA and the blue line represents the model outputs
Figure 6. (a, b) Maximum and (c, d) minimum 2 m temperatures of (a, c) EXP NODA and (b, d) EXP FDDA experiments, and their differences (e, f) during summertime. The results are 5year average, and the unit for 2 m temperature is Celsius.
Journal of Advances in Modeling Earth Systems 10.1002/2015MS000487
PAN ET AL. IMPACT OF FDDA ON URBAN CLIMATE ANALYSIS 2003

of EXP NODA. In general, the modeloutputs with data assimilation presentsmaller bias and smaller RMSE in tem-perature, specific humidity, and windspeed and direction. The improve-ment with FDDA to the downscalingresults is evident in both winter andsummer.
Similar comparisons for the surfacevariables are also obtained. Thedomain-average bias, RMSE, and meanabsolute error (MAE) for the modeloutputs of the EXP FDDA and EXPNODA were computed (not shown).The model run with FDDA has smallerbias, RMSE, and MAE in 2 m tempera-ture, 2 m specific humidity, 10 m windspeed, and wind direction during bothJuly (Figure 11) and December (notshown).
During July, the bias of 2 m tempera-ture for EXP FDDA is around 0.2 K,and the bias of 2 m temperature forEXP NODA is around 1 K. The RMSEsfor 2 m temperature are around 1.0 kand 2.0 k for the results of EXP FDDAand EXP NODA, respectively. The biasfor 2 m specific humidity is below0.5 g/kg for with FDDA, but it reaches1 g/kg in the NODA case. The RMSEsare around 0.9 g/kg and 1.5 g/kg forthe model specific humidity withFDDA and without FDDA, respec-tively. The wind bias is below 1 m/sfor the downscaling EXP FDDA atmost of the levels except at the sur-face, whereas the wind bias canreach 3.5 m/s for the EXP NODA, and
it has positive bias at most of the levels. Both have maximum RMSEs in the layer nearest the sur-face, which are around 1.5 m/s and 3.5 m/s, respectively. The wind direction bias is less than 10degrees at most levels for the EXP FDDA (not shown), but it can reach 308 for the EXP NODA. TheRMSEs of the simulated wind directions are around 158 and 308 for the EXP FDDA and EXP NODA,respectively. The results for December are similar to that of July. The EXP FDDA gives a smaller biasand RMSE than that of EXP NODA. The verification results clearly show that the WRF CFDDA is effec-tive in reducing the downscaling bias, MAE, and RMSE in all fields. The high-quality analysis withdata assimilation provides a more useful data set for study the impact of urban forcing and theland/sea contrasts.
4. Impact of Urbanization Revealed in the High-Resolution Model
As one of the fastest developing metropolitan areas in China, Shenzhen locates along the southern coastof China, close to Hong Kong, Macau, and Guangzhou. The city experienced dramatic urbanization duringthe past 30 years. Herein the impact of the urbanization on fine-scale weather and microclimate in the
Figure 7. (a) 10 m wind of EXP NODA and (b) EXP FDDA experiments duringsummer time. The unit for 10 m wind is m/s.
Journal of Advances in Modeling Earth Systems 10.1002/2015MS000487
PAN ET AL. IMPACT OF FDDA ON URBAN CLIMATE ANALYSIS 2004

region is investigated through sensitivity modeling experiments. We did two WRF runs, one using a landuse setting from USGS (United States geographical survey) 1980s’ products from 30 years ago (before theurbanization) (Figure 15a) and the other one used the current land use setting from the combination ofUSGS and MODIS (the moderate resolution imaging spectroradiometer) 2014 satellite products (Figure12b). In the historic land use setting, the majority of the current city does not yet exist in the region. Oneof the most obvious consequences of urbanization is the urban heat-island effect. Figure 12c gives thedifferences in 2 m temperatures between new and old land use experiments at 20 LST (12 UTC) duringsummertime (June, July, August). The difference of 2 m temperatures is at its maximum at night and mini-mum in the late morning after sunrise, the maximum reaching 2.5 k in some areas. The maximum differ-ence is only 2 k in the model with 3 km horizontal resolution (Figure 13) and 1.5 k in the model with 9 kmhorizontal resolution (not shown here). The high-resolution domain 4 provides more reliable and detailedstructures of the urbanization impacts because that the RMSEs of 2 m temperature and 10 m wind speedof domain 4 are all smaller than that for domain 3. The difference exhibits the strongest signal around 20local LST during summertime and several hours later during wintertime (December, January, andFebruary).
The impact of the urbanization on land/sea breezes in the region is investigated by removing the diurnalaverage of the wind field with current and previous land use and deriving the diurnal variation anomaliesof the wind fields. Figures 14 and 15 present the land breezes (at 02 and 08 LST) and sea breezes (at 14, 20
Figure 8. Accumulated precipitation for March 2014 for (a) EXP FDDA, (b) EXP NODA, and (c) radar quantitative precipitation estimation.The filled circles represent the rain gauge observations. The unit for precipitation is mm.
Journal of Advances in Modeling Earth Systems 10.1002/2015MS000487
PAN ET AL. IMPACT OF FDDA ON URBAN CLIMATE ANALYSIS 2005

Figure 10. Same as the Figure 9 but for December.
Figure 9. (a–d) Bias and (e–h) RMSE of temperature, specific humidity, wind speed, and wind direction for EXP NODA (blue solid line) and EXP FDDA (red dashed line) runs in July. Theunits for temperature, specific humidity, wind speed, and direction are K, g/kg, m/s, and 8, respectively.
Journal of Advances in Modeling Earth Systems 10.1002/2015MS000487
PAN ET AL. IMPACT OF FDDA ON URBAN CLIMATE ANALYSIS 2006

LST), respectively. The impacts of urbaniza-tion on the early development of landbreezes at 02 LST (Figures 14a and 14b) andthat of sea breezes at 14 LST (Figures 15aand 15b) are most obvious. The north wind(negative meridional wind: red vectors in Fig-ures 14 and 15) is well developed in themodel runs with previous land use beforethe urbanization at 02 LST (Figure 13a); how-ever, the north wind is much weaker in themodel runs with current land use/citiesexcept for the east side of the domain (Fig-ure 13b) where there is little change in landuse (no city), and a strong south wind (posi-tive meridional wind, blue vectors in Figures14 and 15) still exists at the southwest of thedomain (Figure 13b). The increased surfacefriction and the reduced land/sea tempera-ture contrast retard the land breeze develop-ment. In contrast, the urban heat islandtends to speed up the sea breeze develop-ment despite the reduced wind speed in thecity. With current cities (current land use),southerly flow prevails at most parts of thedomain at 14 LST (Figure 15b), which differssignificantly from the model runs withoutcurrent cities (Figure 15a).
Urbanization also influences mountain-valleycirculations. The impacts are directly relatedto the distances from mountain to city andcoast. Three mountain areas, M1, M2, andM3 are chosen for comparisons. MountainM1 is far from the coast but close to the city,and mountain M2 is close to both coast andcity. Mountain M3 is neither close to the citynor close to the coast. Without current city,
mountain M1 can have obvious upslope flow and downslope flow start developing at 08 LST (Figure 13c)and 20 LST (Figure 15c), respectively. Mountain M2 has no obvious upslope or downslope flow develop-ment because it is located along the coast and is strongly impacted by land/sea breeze. Mountain M3 hasdownslope flow development during the nighttime (Figure 15c), but no upslope flow development, whichmay due to the oceanic influence. With current city, Mountain M1 only shows very weak upslope flow dur-ing the daytime (Figure 14d) and downslope flow during the nighttime (Figure 15d). However, MountainM3 downslope flow is not significantly influenced because it is far from the city.
The above analysis shows that massive urbanization delays the land breezes and accelerates sea breezes,and interacts with local upslope/downslope mountain flow in the Shenzhen region. Similar to the 2 m tem-peratures, when the low-resolution model (e.g., 3 km) is used, the land/sea breeze signal is reduced, andthe interaction with local upslope/downslope circulation becomes unclear (not shown here).
5. Summary and Main Results
The impact of four-dimensional data assimilation on the urban-scale microclimate analysis is investi-gated using two 5 year runs, one with data assimilation (EXP FDDA) and the other without data assimi-lation (EXP NODA). The WRF 3.5.1-based NCAR CFDDA is employed in this study. It assimilated data
Figure 11. (a, b) Domain average of the bias and RMSE for 2 m tempera-ture, (c, d) 2 m specific humidity, and (e, f) 10 m wind speed in July forEXP FDDA (green line) and EXP NODA (red line) runs.
Journal of Advances in Modeling Earth Systems 10.1002/2015MS000487
PAN ET AL. IMPACT OF FDDA ON URBAN CLIMATE ANALYSIS 2007

continuously through observational nudging. The modeling system has four nested domains, whichhave grid sizes of 27 km, 9 km, 3 km, and 1 km, respectively, with Shenzhen at the center of thedomain. The finest domain (1 km) covers Shenzhen, Hong Kong, and the neighboring areas. The high-resolution observational data used here include ultrahigh-resolution surface AWS (automatic weatherstation) network, radio sounding, wind profilers, radiometers, aircraft data, satellite wind, Dopplerweather radars, and other weather observation platforms (e.g., buoy over ocean). The NCEP CFSR isused as initial and boundary conditions.
Significant differences are found between the regional climate downscaling with and without FDDA. Thesurface analysis of WRF CFDDA system outperforms WRF downscaling without FDDA for all the cycles exam-ined. The standard deviation of 2 m temperature is increased after the data assimilation of a whole summerand sometimes in winter. WRF is known to overestimate the surface wind speed and CFDDA is highly valua-ble in reducing the error. The surface domain mean biases for ‘‘with’’ and ‘‘without’’ data assimilation arearound 0.2 k and 1 k, 0.5 g/kg and 1.0 g/kg, 1 m/s and 3.5 m/s, for 2 m temperature, 2 m specific humidity,and 10 m wind speed, respectively.
The high-quality WRF CFDDA dynamical downscaling climate analysis provides a useful data set toinvestigate the effect of urbanization and land/sea contrast on shaping the local weather and microcli-mate in the region. The influence of urbanization was examined by performing simulation experiments
Figure 12. (a) Land uses of previous city, (b) current city conditions, and (c) 2 m temperature difference between model simulations withcurrent land use and previous land use at 20 LST.
Journal of Advances in Modeling Earth Systems 10.1002/2015MS000487
PAN ET AL. IMPACT OF FDDA ON URBAN CLIMATE ANALYSIS 2008

with the preurbanization and the new (cur-rent) land use settings. The impact of thenewly developed city on urban heat island,land/sea breezes, and mountain-valley cir-culation can be seen clearly in the high-resolution CFDDA simulations. The temper-ature is increased by 2.5 k in the city centerdue to the urbanization in the last 30 years.The results from higher resolution havesmaller RMSE for both 2 m temperatureand 10 m wind speed. Thus the high-resolution domain 4 provides more reliableresults. The urbanization-induced tempera-ture changes are around 2 k in the modelwith 3 km horizontal resolution and 1.5 kin the model with 9 km horizontal resolu-tion. The urbanization reduces the wind inthe city, delays/accelerates the landbreeze/sea breeze development, and inter-acts with local upslope/downslope moun-tain flows.
Figure 14. Land breezes at (a, b) 02 and (c, d) 08 local time for land uses of the (a, c) preurbanization and the (b, d) current city conditions.Wind with negative meridional component is in red, and wind with positive meridional component is in blue. M1, M2, and M3 in Figure14a denote the locations of three mountains. The unit for wind is m/s.
Figure 13. Same as Figure 12c except for 3 km horizontal resolution.
Journal of Advances in Modeling Earth Systems 10.1002/2015MS000487
PAN ET AL. IMPACT OF FDDA ON URBAN CLIMATE ANALYSIS 2009

ReferencesAnthes, R. A. (1974), Data assimilation and initialization of hurricane prediction models, J. Atmos. Sci., 31, 702–719.Bollmeyer, C., et al. (2015), Towards a high-resolution regional reanalysis for the European CORDEX domain, Q. J. R. Meteorol. Soc., 141,
1–15, doi:10.1002/qj.2486.Castro, C. L., R. A. Pielke Sr., and G. Leoncini (2005), Dynamical downscaling: Assessment of value retained and added using the Regional
Atmospheric Modeling System (RAMS), J. Geophys. Res., 110, D05108, doi:10.1029/2004JD004721.China Meteorological Bureau (CMA) (2015), Weather information analysis and forecasting system, CMA, Beijing [Available at http://www.
cma.gov.cn/en2014/meteorologicalinstruments/News/201501/t20150107_271396.html.]Dudhia, J. (1989), Numerical study of convection observed during the Winter Monsoon Experiment using a mesoscale two-dimensional
model, J. Atmos. Sci., 46, 3077–3107.Grell, G., J. Dudhia, and D. Stauffer (1994), A description of the Fifth-Generation Penn State/NCAR Mesoscale Model (MM5), NCAR Tech.
Note NCAR/TN-3981STR., NCAR, Boulder, Colo.Hahmann, A. N., D. Rostkier-Edelstein, T. T. Warner, F. Vandenberghe, Y. Liu, R. Babarsky, and S. P. Swerdlin (2010), A reanalysis system for
the generation of mesoscale climatographies, J. Appl. Meteorol. Climatol., 49, 954–972.Hoke, J. E., and R. A. Anthes (1976), The initialization of numerical models by a dynamic initialization technique, Mon. Weather Rev., 104,
1551–1556.Hong, S.-Y., Y. Noh, and J. Dudhia (2006), A new vertical diffusion package with an explicit treatment of entrainment processes, Mon.
Weather Rev., 134, 2318–2341.Houtekamer, P. L., L. Lefaivre, J. Derome, H. Ritchie, and H. L. Mitchell (1996), A system simulation approach to ensemble prediction, Mon.
Weather Rev., 124, 1225–1242.Jimenez, P. A., and J. Dudhia (2012), Improving the representation of resolved and unresolved topographic effects on surface wind in the
WRF model, J. Appl. Meterol. Climatol., 51, 300–315.Kain, J. S., and J. M. Fritsch (1990), A one-dimensional entraining detraining plume model and its application in convective parameteriza-
tion, J. Atmos. Sci., 47, 2784–2802.Leung, L. R., L. O. Mearns, F. Giorgi, and R. L. Wilby (2003), Workshop on regional climate research: Needs and opportunities, Bull. Am. Mete-
orol. Soc., 84, 89–95.Lin, W., A. Wang, and C. Wu (2001), A case modeling of sea-land breeze in Macao and Its Neighborhood, Adv. Atmos. Sci., 18, 1231–1240.Lin, Y.-L., R. D. Farley, and H. D. Orville (1983), Bulk parameterization of the snow field in a cloud model, J. Clim. Appl. Meteorol., 22,
1065–1092.
Figure 15. Same as Figure 14 except for sea breezes at (a, b) 14 and (c, d) 20 LST.
AcknowledgmentsCFSR data are available at: http://cfs.ncep.noaa.gov/cfsr/, MADIS is availableat: http://madis.noaa.gov, WMO datawebsite is http://www.wmo.int/datastat/wmodata_en.html,and Shenzhen data can be found athttp://www.szmb.gov.cn/article/QiXiangJianCe/LeiDaTuXiang/. NCAR issponsored by the National ScienceFoundation of the United States.
Journal of Advances in Modeling Earth Systems 10.1002/2015MS000487
PAN ET AL. IMPACT OF FDDA ON URBAN CLIMATE ANALYSIS 2010

Liu, Y., F. Chen, T. Warner, and J. Basara (2006), Verification of a mesoscale data-assimilation and forecasting system for the Oklahoma Cityarea during the Joint Urban 2003 Field Project, J. Appl. Meteorol. Climatol., 45, 912–929.
Liu, Y., et al. (2008a), The operational mesogamma-scale analysis and forecast system of the U.S. Army Test and Evaluation Command. Part1: Overview of the modeling system, the forecast products, J. Appl. Meteorol. Climatol., 47, 1077–1093.
Liu, Y., T.-T. Warner, E. G. Astling, J. F. Bowers, C. A. Davis, S. F. Halvorson, D. L. Rife, R.-S. Sheu, S. P. Swerdlin, and M. Xu (2008b), The opera-tional mesogamma-scale analysis and forecast system of the U.S. Army Test and Evaluation Command. Part 2: Inter-range comparisonof the accuracy of model analyses and forecasts, J. Appl. Meteorol. Climatol., 47, 1093–1104.
Lo, J. C.-F., Z.-L. Yang, and R. A. Pielke Sr. (2008), Assessment of three dynamical climate downscaling methods using the Weather Researchand Forecasting (WRF) Model, J. Geophys. Res., 113, D09112, doi:10.1029/2007JD009216.
Lu, X., K.-C. Chow, T. Yao, A. K. H. Lau, and J. C. H. Fung (2010), Effects of urbanization on the land sea breeze circulation over the Pearl RiverDelta region in winter, Int. J. Climatol., 30, 1089–1104.
Miao, M.-Q., and Y.-H. Tang (1998), Interaction between sea and land breeze and heat island circulation during the summer over the deltaregion of the Yangtze river and urbanization effect on climate, Plateau Meteorol., 17, 280–289.
Mlawer, E. J., S. J. Taubman, P. D. Brown, M. J. Iacono, and S. A. Clough (1997), Radiative transfer for inhomogeneous atmospheres: RRTM, avalidated correlated-k model for the longwave, J. Geophys. Res., 102, 16,663–16,682.
Pan, L., S.-H. Chen, D. Cayan, M.-Y. Lin, Q. Hart, M.-H. Zhang, Y. Liu, and J. Wang (2011a), Influences of climate change on California andNevada regions revealed by a high-resolution dynamical downscaling study, Clim. Dyn., 37, 2005–2020, doi:10.1007/s00382-010-0961-5.
Pan, L., Y. Liu, D. Rostkier-Edelstein, G. Roux, Y. Zhang, Y. Liu, W. Yu, and R.-S. Sheu (2011b), Verification of the operational WRF-RTFDDAsimulated surface variables over the Eastern Mediterranean, paper presented the 12th WRF workshop, NCAR, Boulder, Colo., 20–24 Jun.
Pan, L., Y. Liu, Y. Wu, D. Rostkier-Edelstein, Ness-Ziona, and R.-S. Sheu (2012), Evaluation of AMDAR and AMV data quality and their impacton RTFDDA analysis and forecasting control at Eastern Mediterranean region, paper presented the 13th WRF workshop, NCAR, Boulder,Colo., 26–29 Jun.
Pan, L., Y. Liu, Y. Liu, M. Xu, P. Child, and N. Jacobs (2015), Development of a CONUS radar data assimilation WRF-RTFDDA system forconvection-resolvable analysis and prediction, paper presented the 16th WRF annual user’s workshop, NCAR, Boulder, Colo., 15–19 Jun.
Rife, D. L., J. O. Pinto, A. J. Monaghan, C. A. Davis, and J. R. Hannan (2010), Global distribution and characteristics of diurnally varying low-level jets, J. Clim., 23, 5041–5064.
Rostkier-Edelstein, D., Y. Liu, W. Wu, P. Kunin, A. Givati, and M. Ge (2014), Towards a high-resolution climatography of seasonal precipitationover Israel, Int. J. Climatol., 34, 1964–1979, doi:10.1002/joc.3814.
Skamarock W., J. B. Klemp, J. Dudhia, D. O. Gill, D. M. Barker, W. Wang, and J. G. Powers (2005), A description of the Advanced ResearchWRF version 2, NCAR Tech. Note NCAR/TN-4681STR., NCAR, Boulder, Colo.
Stauffer, D. R., and N. L. Seaman (1990), Use of four-dimensional data assimilation in a limited-area mesoscale model. Part I: Experimentswith synoptic-measosacale data, Mon. Weather Rev., 118, 1250–1277.
Stauffer, D. R., and N. L. Seaman (1994), Multiscale four-dimensional data assimilation, J. Appl. Meteorol., 33, 416–434.Wai, M. M.-K. (1993), Diurnal atmospheric secondary circulation over Hong Kong, HK MetS. Bull., 3, 9–20.Wen, W., T. Shen, Z. Ding, and J. Song (2009), Effects of urbanization on land-sea urbanization on land-sea breeze of Guanxi in summer:
WRF simulation study, J. Trop. Meteorol., 25, 350–356.Wu, Y.-H., Y. Liu, N. Jacobs, P. Childs, F. Vandenberghe, L. Pan, and J. C. Knievel (2012), An online data quality control procedure with the
NCAR RTFDDA system, paper presented at AMS 92nd Annual Meeting, NCAR, New Orleans, La., 22–26 Jan.Wyszogrodzki, A., Y. Liu, N. Jacobs, P. Childs, Y. Zhang, G. Roux, and T. T. Warner (2013), Analysis of the surface temperature and wind fore-
cast errors of the NCAR-AirDat operational CONUS 4-km WRF forecasting system, Meteorol. Atmos. Phys., 122, 125–143, doi:10.1007/s00703-013-0281-5.
Zhang, Z., C. Cao, Y. Song, L. Kang, and X. Cai (2014), Statistical characteristics and numerical simulation of sea land breezes in Hainanisland, J. Trop. Meteorol., 20, 267–278.
Journal of Advances in Modeling Earth Systems 10.1002/2015MS000487
PAN ET AL. IMPACT OF FDDA ON URBAN CLIMATE ANALYSIS 2011