Impact of Fertilization on a Salt Marsh Food Web in Georgia
127
IMPACT OF FERTILIZATION ON A SALT MARSH FOOD WEB IN GEORGIA by CAROLINE ROCHESTER MCFARLIN (Under the Direction of Steven C. Pennings) ABSTRACT I examined the response of a salt marsh food web to nutrients, and spatial variation in this response, at 19 sites on the Georgia coast. In fertilized treatments, Spartina alterniflora increased at the expense of Juncus roemerianus. Spartina dominance was reduced at sites with greater upland influence, regardless of fertilization. Because fertilization changes plant quantity and quality, it could also affect consumers of plants. Fertilization positively influenced herbivores (grasshoppers), had little effect on decomposers (fungi), and no effect on detritivores (snails). The two snail species Littoraria irrorata and Melampus bidentatus were negatively correlated with each other and likely compete. Natural variation among sites was typically similar or greater than impacts of fertilization. These results suggest that eutrophication of salt marshes is likely to have stronger impacts on plants and herbivores than on decomposers and detritivores, and that impacts are not likely to be much greater than variation among sites. INDEX WORDS: fertilization, salt marsh, Spartina, Juncus, fungi, snail, grasshopper, competition
Transcript of Impact of Fertilization on a Salt Marsh Food Web in Georgia

IMPACT OF FERTILIZATION ON A SALT MARSH FOOD WEB IN GEORGIA
by
CAROLINE ROCHESTER MCFARLIN
(Under the Direction of Steven C. Pennings)
ABSTRACT
I examined the response of a salt marsh food web to nutrients, and spatial variation in
this response, at 19 sites on the Georgia coast. In fertilized treatments, Spartina alterniflora
increased at the expense of Juncus roemerianus. Spartina dominance was reduced at sites
with greater upland influence, regardless of fertilization. Because fertilization changes plant
quantity and quality, it could also affect consumers of plants. Fertilization positively influenced
herbivores (grasshoppers), had little effect on decomposers (fungi), and no effect on detritivores
(snails). The two snail species Littoraria irrorata and Melampus bidentatus were negatively
correlated with each other and likely compete. Natural variation among sites was typically
similar or greater than impacts of fertilization. These results suggest that eutrophication of salt
marshes is likely to have stronger impacts on plants and herbivores than on decomposers and
detritivores, and that impacts are not likely to be much greater than variation among sites.
INDEX WORDS: fertilization, salt marsh, Spartina, Juncus, fungi, snail, grasshopper,
competition

IMPACT OF FERTILIZATION ON A SALT MARSH FOOD WEB IN GEORGIA
by
CAROLINE ROCHESTER MCFARLIN
B.S.A., The University of Georgia, 2000
A Thesis Submitted to the Graduate Faculty of The University of Georgia in Partial Fulfillment of
the Requirements for the Degree
MASTER OF MARINE SCIENCE
ATHENS, GEORGIA
2004

© 2004
Caroline Rochester McFarlin
All Rights Reserved

IMPACT OF FERTILIZATION ON A SALT MARSH FOOD WEB IN GEORGIA
by
CAROLINE ROCHESTER MCFARLIN
Major Professor: Steven C. Pennings
Committee: Merryl Alber Steve Newell
Electronic Version Approved: Maureen Grasso Dean of the Graduate School The University of Georgia May 2004

ACKNOWLEDGEMENTS
I would like to thank Dr. Steven Pennings for providing me with wonderful opportunities
to learn and gain experience within and outside of my master’s work, for his dedication to
helping me with every aspect of this study, from the research to the writing, and most of all, for
being caring and patient throughout my master’s career. Thanks also go to Tracy Buck, whom
this study could not have been completed without, and Monica Palta, Sarah Weilgus, Earl
Rochester, Paige Rochester, and Chip McFarlin for their lab and field help. Lastly, I would like
to thank my husband Chip and my family for love and encouragement. This work was funded
by Georgia Sea Grant and Georgia Coastal Ecosystems – Long Term Ecological Research
project.
iv

TABLE OF CONTENTS
Page
ACKNOWLEDGEMENTS ............................................................................................................ iv
LIST OF TABLES.........................................................................................................................vii
LIST OF FIGURES .....................................................................................................................viii
CHAPTER
I INTRODUCTION .................................................................................................... 1
Global Changes in the Nitrogen Cycle.................................................................... 1
Salt Marsh Ecology ................................................................................................. 3
Bottom-Up Controls on Salt Marsh Production and the Nitrogen Paradox ............. 4
Biotic Controls on Salt Marsh Plants: Plant-Plant Interactions .............................. 7
Biotic Controls on Salt Marsh Plants: Animal-Plant Interactions.......................... 10
The Detrital Food Web.......................................................................................... 13
Bottom-Up Effects on Competition Among Marsh Plants ..................................... 14
Competition and Trophic Dynamics Across Environmental Gradients ................. 16
II METHODS............................................................................................................ 18
Experimental Setup............................................................................................... 18
Plant Growth and Nutritive Quality........................................................................ 22
Consumer Abundance .......................................................................................... 23
Consumer Food Selection .................................................................................... 25
Consumer Growth................................................................................................. 27
Statistical Analysis ................................................................................................ 29
III RESULTS ............................................................................................................. 32
General Effects of Fertilization.............................................................................. 32
v

Variation in Responses Among Sites.................................................................... 34
IV DISCUSSION........................................................................................................ 66
Plant Growth ......................................................................................................... 66
Plant Nitrogen Content.......................................................................................... 70
Herbivore Density and Food Selection ................................................................. 73
Decomposer Biomass........................................................................................... 76
Detritivore Density, Food Selection, and Growth Rate ......................................... 78
Natural Variation vs. Treatment Variation ............................................................. 83
V CONCLUSIONS.................................................................................................... 85
Overall Significance of Results ............................................................................. 85
Anthropogenic Impacts on Interspecific Competition Among Plants .................... 85
Herbivore Responses to Altered Marsh Composition ........................................... 87
Detritivore Responses to Altered Marsh Composition .......................................... 88
Competition and Impacts to Melampus................................................................. 89
Relative Importance of Anthropogenic Nutrients to the Salt Marsh Food Web..... 90
REFERENCES ........................................................................................................................... 92
vi

LIST OF TABLES
Page
Table 2.1: Criteria for scoring grasshopper damage................................................................... 30
Table 3.1: Physical characterization of study sites ..................................................................... 40
Table 3.2: Cross site characterization of study area................................................................... 41
Table 3.3: Summary of results of multiple regression models predicting plant growth of live and
litter portions of Spartina and Juncus within control and fertilized plots...................................... 42
Table 3.4: Summary of results of multiple regression models predicting nitrogen-content of live
and litter portions of Spartina and Juncus in control and fertilized treatments............................ 43
Table 3.5: Summary of results of multiple regression models predicting consumer density and
biomass and grazing damage to Spartina and Juncus plants within plots of control and fertilized
treatments ................................................................................................................................... 44
Table 3.6: Summary of coefficients of variation (CV) of natural variation across sites and of
treatments ................................................................................................................................... 45
vii

LIST OF FIGURES
Page
Figure 2.1: Map of study sites..................................................................................................... 31
Figure 3.1: Above-ground biomass of live and standing dead Spartina and Juncus leaves in
control and fertilized plots. .......................................................................................................... 46
Figure 3.2: Percent cover of live Spartina and Juncus in control and fertilized plots .................. 47
Figure 3.3: Height of live Spartina and Juncus in control and fertilized plots.............................. 48
Figure 3.4: Nitrogen content of live and standing dead Spartina and Juncus leaves in control
and fertilized plots ....................................................................................................................... 49
Figure 3.5: Density of Melampus, Orchelimum, and Paroxya in control and fertilized
plots ........................................................................................................................................... 50
Figure 3.6: Density of Littoraria in control and fertilized plots ..................................................... 51
Figure 3.7: Ratio of Orchelimum density to Spartina biomass and Paroxya density to Juncus
biomass in control and fertilized plots ......................................................................................... 52
Figure 3.8: Fungal biomass in leaves of standing-dead Spartina reported as ergosterol on a per
leaf (LOM) and per plot basis...................................................................................................... 53
Figure 3.9: Grazing damage by grasshoppers to leaves of live Spartina and Juncus in control
and fertilized plots ....................................................................................................................... 54
Figure 3.10: Consumption of Spartina leaves by Orchelimum and Juncus leaves by Paroxya
during two-choice feeding assays...............................................................................................55
Figure 3.11: Consumption of Spartina litter by Littoraria and Armases during two-choice feeding
assays......................................................................................................................................... 56
Figure 3.12: Growth of Littoraria and Melampus fed either a control or fertilized stem of Spartina
or leaf of Juncus litter.................................................................................................................. 57
viii
Figure 3.13: Relationship of salinity to height of live Spartina and Juncus in control and fertilized
plots ............................................................................................................................................ 58
Figure 3.14: Relationship of live Juncus N-content to live Spartina N-content in control plots ... 59
Figure 3.15: Relationship of live Juncus N-content to live Spartina N-content in fertilized plots.60
Figure 3.16: Relationship of Orchelimum density to the natural log of Littoraria density in control
and fertilized plots ....................................................................................................................... 61
Figure 3.17: Relationship of fungal biomass on a per plot basis to redox in control and fertilized
plots ............................................................................................................................................ 62
Figure 3.18: Relationship between the natural log of Littoraria and Melampus densities in control
and fertilized plots ....................................................................................................................... 63
Figure 3.19: Relationship of grazing damage to Juncus and Spartina to Paroxya and
Orchelimum density in fertilized plots ......................................................................................... 64
Figure 3.20: Relationship of site salinity to the consumption effect (difference in consumption
between control (C) and fertilized (F) litter, F-C) of Spartina litter by Armases in laboratory
paired feeding trials..................................................................................................................... 65
Figure 5.1: Relationship between the total number of snails (Melampus + Littoraria) at sites
within control and fertilized plots ............................................................................................... 91
ix

CHAPTER I
INTRODUCTION
GLOBAL CHANGES IN THE NITROGEN CYCLE
One of the most important issues facing conservation biologists and ecologists today is
the rapidly-increasing rate of nutrient-loading to all environments, terrestrial and aquatic
(Vitousek 1994, Soulé and Orions 2001, United Nations 2001). As the human population has
soared to over 6 billion in the early 21st century (nearly tripling in the last 50 years, United
Nations 2003, U.S. Census Bureau 2003), dramatic landscape alterations and increased wastes
have begun to alter ecological relationships (Nichols et al. 1986, NRC 1999, Micheli et al. 2001,
Valdés and Lavin 2002, Turner 2002). The nitrogen cycle has experienced particularly dramatic
changes because fertilizers, legume crops, and fossil fuels have permitted the rate of
anthropogenic nitrogen fixation and inorganic nitrogen application to exceed that of natural
processes (Peierls et al. 1991, Vitousek 1994, United Nations 2001, Howarth et al. 2002).
Moreover, fertilizer usage will likely increase as the demand for food intensifies with the growing
population (Schlesinger et al. 2001, Seitzinger et al. 2002).
In addition, humans have released nitrogen from long-term storage pools by clearing
land and draining wetlands (Vitousek 1994, Mitsch and Gosselink 2000). Although the effects of
nitrogen additions are still largely unknown because it is a fairly recent phenomenon (natural N-
fixation was surpassed by human N-inputs in the early 1980's, United Nations 2001), they
include alterations to atmospheric chemistry (nitrous oxides in the troposphere, Schlesinger et
al. 2001, Paerl et al. 2002, Seitzinger et al. 2002), reduced water quality in aquatic systems
(Kumm 1976, Burkholder 1998, Paerl et al. 1998, Rabalais et al. 2002), and changes to
ecological processes at the population and community level (Vitousek 1994, Heip 1995, Micheli
et al. 2001). Because nitrogen is a limiting nutrient in many environments (e.g., coastal marine,
1
Valiela and Teal 1974, Paerl et al. 1998, Howarth et al. 2002, Feller et al. 2003, open water
marine, Redfield 1958, terrestrial grasslands, Huenneke et al. 1990, upland forests, Howarth et
al. 2002, Nilsen and Abrahamsen 2003), consequences to community structure and diversity
could be substantial. Impacts of nitrogen additions might not only affect primary producers, but
might also flow through the food web to affect other trophic levels, positively (Tober et al. 1996,
Nixon and Buckley 2002) or negatively (Deegan 2002).
Salt marshes may be one of the more susceptible environments to increased nutrients,
because they receive runoff from surrounding watersheds (Peierls et al. 1991, McClelland et al.
1997, Bowen and Valiela 2001, Valiela and Bowen 2002, Bertness et al. 2002), and filter water
from tidally-influenced rivers and channels (Bertness 1999, Pennings and Bertness 2001,
Valiela and Cole 2002). It is vital to understand how salt marshes are affected by eutrophication
because they provide many valuable ecosystem services to society. They protect the coastline
from erosion by sediment accretion (Redfield 1972, Niering and Warren 1980) and buffer the
effects of flooding by soil absorption (Beatley et al. 2002). They are critical to numerous
commercially- and recreationally-important fisheries as nursery grounds, refuges, or food
sources (Daiber 1982, Williams 1984, Kneib 1997, Minton 1999), and similarly provide feeding
and nesting habitats for many birds and mammals (Daiber 1982, Bertness 1999, Boyer and
Zedler 1999). Natural processes of sedimentation and denitrification in salt marshes protect
coastal waters from excess nutrients that contribute to habitat loss, reduced water clarity,
harmful algal blooms, and fish kills (NRC 1999, Bertness 1999, Rabalais et al. 2002, Valiela and
Cole 2002, Anderson et al. 2002, Breitburg 2002). Despite their important ecological
contributions, the value of salt marshes has only recently been discovered (mid-20th century,
Teal 1962, Odum and de la Cruz 1967, Mitsch and Gosselink 2000) and conservation efforts
are still inadequate (Beatley et al. 2002).
2

SALT MARSH ECOLOGY
For scientists, one of the most important aspects of salt marshes is their simplicity: they
provide a useful model for community ecologists to study, and suggest theories that might also
be applied to other ecosystems. Strong physical gradients occur over a short distance within
salt marshes due to bidirectional flooding of the tides over an elevational gradient (Niering and
Warren 1980, Wiegert and Freeman 1990, Bertness 1999). Thus, marsh plants must have the
ability to cope with high soil salinity due to seawater evaporation, soil erosion due to ocean
currents and tidal movement, partial to complete submersion during flooding tides, soil anoxia
due to waterlogged sediments, and toxic sulfides that build up as a metabolic by-product of
sulfate-reducing bacteria in the soil (Niering and Warren 1980, Wiegert and Freeman 1990,
Pennings and Bertness 2001). Whereas most plants would not survive in such a harsh habitat,
marsh plants have specialized physiological, metabolic, and structural adaptations that allow
them to colonize this unusual niche. Physiological adaptations of plants to salt marshes include
well-developed aerenchyma tissues, which are a series of air-passageways to transport oxygen
from the leaves of the plant to the roots (oxygen is required for roots to take up nutrients), and
salt glands in the leaves that excrete salt (Bertness 1999). Metabolic adaptations include a
highly evolved anaerobic metabolic pathway (Koch et al. 1990), and the capacity to produce
high concentrations of organic solutes to maintain a high osmotic potential (Cavalieri and Huang
1981, Bertness 1999, Mulholland and Otte 2001). Structural adaptations include stomatal
openings that close when flooded, and an extensive root and rhizome network near the soil
surface to facilitate root oxygenation (Wiegert and Freeman 1990, Bertness 1999). Because
relatively few plants can inhabit salt marshes (Pennings and Bertness 2001) and because
physical gradients lead to conspicuous zonation of the plants (Niering and Warren 1980),
marshes are invaluable to the study of community diversity (Hacker and Gaines 1997, Hacker
and Bertness 1999) and pattern (Bertness and Ellison 1987, Bertness 1991a,b, Pennings and
Callaway 1992, Pennings and Moore 2001).
3

Salt marshes have also received attention for being among the most productive
environments in the world. Net primary production in marshes dominated by Spartina
alterniflora has been estimated to be about 3,000 g/m2/yr, rivaling that of coral reefs and
rainforests (Valiela 1995). Salt marshes are abundant along the east coast of the United States,
especially where barrier islands slow water movement to allow fine sediments to accumulate on
the leeward side (Bertness 1999). They occur at most latitudes, except where freezing
temperatures do not allow their development or mangroves replace them in the tropics (Wiegert
and Freeman 1990, Pennings and Bertness 2001). Despite a short coastline (160 km), Georgia
has the most marsh area along the East Coast (almost 200,000 hectares, 33% of the total East
Coast acreage) (Wiegert and Freeman 1990, Bertness 1999), and Georgia marshes may be the
most productive of the entire coast (Turner 1976). The most conspicuous primary producers
are the macrophytes, especially Spartina alterniflora (hereafter referred to as Spartina) and
Juncus roemerianus (hereafter referred to as Juncus) which are present in expansive monotypic
stands (Wiegert and Freeman 1990), although filamentous green algae, diatoms, cyanobacteria,
and chemosynthetic bacteria also contribute to the carbon cycle to a variable extent (Zimba
1991, Valiela 1995, Goni and Thomas 2000).
BOTTOM-UP CONTROLS ON SALT MARSH PRODUCTION AND THE NITROGEN PARADOX
Early studies sought to determine controls on salt marsh primary production, as marsh
plants were long suspected to contribute to secondary productivity both within and outside of the
marsh (Teal 1962, Odum and de la Cruz 1967). Teal estimated that as much as 40% of
production in Georgia marshes was exported to surrounding marine environments (1962),
although subsequent studies found that marshes vary in exportation (Odum 1980, Nixon 1981).
Most studies have focused on bottom-up controls on primary productivity, that is, the supply of
resources such as nutrients that regulate growth performance of producers at the base of the
food web (Bertness 1999). Numerous studies have confirmed nitrogen to be the most limiting
nutrient to marsh plant production (Valiela and Teal 1974, Gallagher 1975, Valiela et al. 1975,
4

Haines and Dunn 1976, Jeffries 1977, Mendelssohn 1979), as it is for other marine primary
producers (Ryther and Dunstan 1971, Valiela 1995, Weiss et al. 2002), but its effects are
masked. For example, many plant species (most notably, Spartina, but also Iva frutescens,
Juncus roemerianus, and Borrichia frutescens) exhibit marked differences in height forms
across the elevational gradient (Valiela et al. 1978, Mendelssohn 1979, Howes et al. 1986,
Seliskar 1985, Pennings and Richards 1998, Bertness 1999). Spartina is tallest at the
creekbank (up to 2 meters) and shortest in the mid- to high-marsh (less than 30 cm) (Valiela et
al. 1978, Mendelssohn 1979, Bertness 1999), despite lower soil nitrogen (ammonium) in the low
marsh than in higher marsh areas (Mendelssohn 1979). If nitrogen were the most limiting
nutrient, production would be expected to be greatest where the nitrogen concentration is
highest, yet this is not so. At the same time, nitrogen fertilization boosted high-marsh Spartina
production (height) to levels of that near the creekbank, but did not further increase creekbank
production (Gallagher 1975, Valiela et al. 1978, Mendelssohn 1979). Why, then, did added
nitrogen increase production where it did not appear to be limiting?
The answer to this paradox lies in the fact that adaptations to the physical conditions in
the high marsh are energetically costly. Most evidence suggests that lowered production of
Spartina at high elevations is in response to unfavorable edaphic conditions (Haines and Dunn
1976, Anderson and Treshow 1980, Howes et al. 1986, Mendelssohn and Morris 2000), rather
than being due to genetic differences within plant species (Shea et al. 1975, but see Mooring et
al. 1971, and Gallagher et al. 1988). Creekbank soils are well drained and less saline due to
frequent tidal flushing and coarser sediments of the elevated levees, whereas sediments further
inland are finer, poorly drained, and increasingly more saline due to increased evaporative time
between flooding tides (Pennings and Bertness 2001). At the border with terrestrial vegetation,
where tides are infrequent and freshwater runoff from surrounding upland becomes more
important, salinity drops again (Pennings and Bertness 1999). Salinity limits production of
marsh plants due to water stress, salt toxicity, and competitive inhibition by sodium for the
5

uptake of important cations, namely ammonium and potassium (Phleger 1971, Levitt 1972,
Haines and Dunn 1976, Mendelssohn and Morris 2000). Moreover, increasing salinity causes
some plants to use available nitrogen for the production of osmoregulatory compounds, such as
proline and glycinebetaine, rather than for growth (Cavalieri and Huang 1981, Mulholland and
Otte 2001).
In addition, where soil is poorly drained (anaerobic), sulfides build up due to microbial
sulfate reduction and suppress plant growth (Howes et al. 1981, 1986, King et al. 1982, but see
Hines et al. 1989). Plant biomass (height, leaves, stems, and root system) has been shown to
decrease with increasing sulfides above 0.5 mM, and no growth occurs at all at concentrations
above 2.0 mM in solution for Spartina and Borrichia (DeLaune et al. 1983, Bradley and Dunn
1989). Mechanisms by which sulfides lead to decreased plant biomass include sulfide toxicity
(Allam and Hollis 1972) and inhibitory effects to root metabolism (Mendelssohn and Morris
2000). Sulfides negatively affect root metabolism at concentrations as low as 0.5 mM by
reducing activity of alcohol dehydrogenase (ADH), the enzyme responsible for alcoholic
fermentation in highly reduced anaerobic soils, thus reducing carbon production by the plant
(Koch et al. 1990). Additionally, sulfides and low oxygen concurrently reduce uptake of
important nutrients, especially nitrogen (Howes et al. 1986). Bradley and Morris showed that
reduced oxygen alone lowered the Vmax and increased the Km of nitrogen uptake (Michaelis-
Menton parameters), but that in the presence of a low concentration of sulfide, Vmax decreased
and Km increased subsequently (1990). Furthermore, ammonium uptake was almost
completely inhibited at a concentration of 2.0 mM sulfide and anoxia (Bradley and Morris 1990).
Changes in the nitrogen-uptake efficiency imply that there will be changes in growth following
nitrogen additions (Bradley and Morris 1990). Thus the nitrogen paradox can be explained by
physical gradients that complicate plant nitrogen metabolism. Although nitrogen is more
abundant in the soil in the high marsh than in the low marsh, bioavailability is lower in the high
6

marsh and plant requirements are higher. Thus, Spartina alterniflora plants are actually more
nitrogen-limited in high versus low marsh habitats.
BIOTIC CONTROLS ON SALT MARSH PLANTS: PLANT-PLANT INTERACTIONS
Although physical gradients may explain growth performance of a species in
monoculture, they alone cannot explain community patterns (Callaway and Walker 1997, Huckle
et al. 2000, Greiner La Peyre 2001, Pennings and Bertness 2001). Biotic controls, particularly
plant-plant and animal-plant interactions, also facilitate or inhibit production, influencing success
and diversity of plants in the community (Pennings and Bertness 2001). Important plant-plant
interactions in the marsh include parasitism, facilitation, and competition. Epiphytic parasitism
has received more attention in terrestrial environments than in salt marshes (Press and Graves
1995), but one study in a California marsh showed that plant diversity increased in the presence
of the parasite Cuscuta salina because non-preferred plants had greater success when the
typically-dominant plant Salicornia virginica was heavily parasitized (Pennings and Callaway
1996). Parasitic plants, however, are rare in salt marshes on the East Coast of the U.S., and do
not occur in Georgia salt marshes (Pennings, pers. comm.).
Facilitation occurs when fugitive plants colonize stressful bare patches in the marsh
following disturbance events that kill dominant vegetation (such as ice scours, wrack deposits,
consumer eat-outs, fires, and sedimentation) and facilitate regrowth of zonal dominants by
ameliorating high soil salinity through shading, or by stabilizing or oxygenating sediments
(Bertness and Callaway 1994, Bertness 1999, Pennings and Bertness 2001). Similar positive
interactions also occur between established zonal neighbors (Bertness and Hacker 1994).
Although facilitation and positive associations between plants may be important to northern
Atlantic coast marshes (Bertness and Ellison 1987, Bertness 1991a, Bertness and Hacker 1994,
Bertness 1999), they appear to be less prevalent in southern Atlantic marshes where species
have greater salt tolerances, and thus are unlikely to benefit from neighboring plants (Pennings
et al. 2003). Further, although parasitism and facilitation may be restricted to certain marshes
7

and latitudinal locations, respectively, competition appears to be universal to all marshes and
may be most important in structuring communities.
Competition is a major factor determining productivity and distribution patterns of marine
invertebrates (Connell 1961, Paine 1974, Menge 1976), and plants (Harper 1977, Grime 1979,
Tilman 1982, Keddy 2001). Demand for limiting resources such as nutrients, light, water, and
space leads to competition within and between plant species (Grime 1979). Both intra- and
interspecific competition decrease seed germination, survival, and growth (Bertness and Ellison
1987, Bertness 1991b, Bertness and Yeh 1994), and plants that survive through germination
may have lowered biomass, reduced leaf production, and thinner stems (Harley and Bertness
1996). Intraspecific competition is easily seen in productive monocultures: as plant density
increases, the amount of resources available per individual decreases, and the size of the
individual plants becomes smaller (Keddy 2001). Interspecific competition restricts some plant
species to metabolically-costly, suboptimal habitats (Keddy 2001), despite better growth in
nearby less stressful habitats (Grime 1979, Grace and Wetzel 1981, Tilman 1982, 1988, Wilson
and Keddy 1985, Bertness and Ellison 1987).
Marsh plant zonation patterns cannot be fully explained by differential adaptations to
abiotic factors between species, since some plants often perform better outside their natural
zonation range. Spartina patens and Distichlis spicata, for example, grow equally well or better
higher in the marsh (the Juncus zone) if transplanted without neighbors in experimental plots
(Bertness 1991a), or if they naturally colonize a bare patch in the upper marsh following
disturbance (Bertness and Ellison 1987), but do not perform well with neighboring Juncus,
suggesting that they are excluded from this zone by competition (Bertness 1991a). On the
other hand, Juncus died with or without neighbors when transplanted into the Spartina patens
zone, suggesting that it is excluded from this zone by physical stress (Bertness 1991a). These
studies have generally found that abiotic factors control lower limits of marsh plants, while
competition sets upper limits (Bertness and Ellison 1987, Bertness 1992, Pennings and Moore
8

2001), although zonation is more complicated in the mid-marsh at lower latitudes since along
with frequent flooding, soils are hypersaline due to greater solar radiation (Pennings and
Bertness 2001). Because the mid-marsh is more stressful than higher or lower marsh zones in
low-latitude sites, zonation is likely mediated by a combination of competition and physical
restraints for both lower and upper growth limits (Pennings and Callaway 1992).
Competition can form competitive hierarchies within plant communities, creating patterns
where competitive-dominants, that suppress all other species in their community, occupy
optimal habitats, and competitive-subordinates, that are suppressed by all other species in their
community, occupy sub-optimal habitats (Keddy 2001). In the salt marsh, competitive
dominance may largely be a function of a plant’s growth morphology (Bertness 1999), though
other factors such as growth rate, phenology, storage organs, and the ability to overcome
stressors and disturbances also affect the fitness of the species (Grime 1979). For example,
Juncus grows as a dense turf with extensive roots, rhizomes, and tillers, whereas Distichlis
grows diffusely along rhizomes, and invests less into root biomass (Bertness 1999). The two
growth forms, termed Phalanx and Guerilla, respectively, (Harper 1977), vary in their abilities to
access belowground nutrients and space. In particular, Juncus is successful in competing for
nutrients and space under ambient conditions due to its complex root system and dense clonal
morphology, but Distichlis can rapidly expand along runners and colonize extensive areas of the
marsh under disturbed or unusually-stressful conditions (Bertness 1999). Other studies have
suggested that clonal plants have an advantage over solitary plants, especially in colonizing
disturbed marsh habitats (Shumway 1995), though this does not necessarily infer a competitive
advantage over plants that are already established (Pennings and Callaway 2000, but see
Hartnett and Bazzaz 1985). Because competition is such an important determinant in plant
growth, it is important to understand the competitive hierarchy of the plant community of interest
and its dynamics under variable environmental conditions (Goldberg and Barton 1992, and
sources therein, Bart and Hartman 2000, Huckle et al. 2000, Greiner La Peyre et al. 2001).
9

Several studies have pointed to an inverse relationship between abiotic factors and
competition (Bertness and Ellison 1987, Bertness and Hacker 1994, Bertness and Callaway
1994, Callaway and Walker 1997, Greiner La Peyre 2001): as physical environments become
more harsh, competition is less important in regulating the abundance of species (Grime 1979,
Keddy 2001). Understanding this relationship is important in order to predict competitive
outcomes (i.e. “winners” and ”losers”) among vegetation in various habitats. Grime described
three strategies plants have for dealing with environmental conditions: “competitors (C), which
exploit conditions of low stress and low disturbance, stress-tolerators (S) (high stress-low
disturbance), and ruderals (R) (low stress-high disturbance)”, and argued that no plant life can
exist in high stress and high disturbance areas (Grime 1979). The C-S-R model depicts each
strategy at its extreme at the apices of an equilateral triangle, such that for any one strategy, the
relative importance of competition, stress, or disturbance is 100%, respectively (Grime 1974,
1977, 1979). Secondary plant strategies are located within the triangle for habitats experiencing
intermediate competition, stress, and disturbance intensities, but a plant cannot be both a
dominant competitor and strong stress-tolerator in the C-S-R model, supporting the inverse
relationship between abiotic stress and importance of competition (Grime 1979, Hodgson et al.
1999). In sum, theories of plant competition predict that altering nutrient cycles may change
plant dominance patterns. In particular, adding nitrogen will tend to reduce “stress” at a site,
which should favor different plant species better adapted to the new conditions (Tilman 1988,
Wisheu et al. 1991). A wide variety of experimental studies have in fact demonstrated that
increasing nutrient supplies produce changes in plant community composition in a wide variety
of community types (Austin and Austin 1980, Tilman 1987, Huenneke et al. 1990, Bobbink
1991, Goldberg and Barton 1992, Emery et al. 2001).
BIOTIC CONTROLS ON SALT MARSH PLANTS: ANIMAL-PLANT INTERACTIONS
Animals can also control plant growth and vice versa, both positively and negatively.
Some of the most conspicuous marsh residents are bivalve filter feeders, burrowing crabs,
10

snails, and insects (Daiber 1982). Many of the animal-plant interactions in the marsh are
important facultative symbioses (Long and Mason 1983, Adam 1990, Bertness 1999).
Burrowing crabs, such as Uca and Sesarma, facilitate plant growth by aerating the soil, aid
belowground decomposition and mineralization by reworking the soil, and add nutrients (i.e.
nitrogen) to soil in their wastes (Montague 1980, Bertness 1985); however, the level of
facilitation to plants may change across abiotic environments (Nomann and Pennings 1998).
Similarly, bivalves like Geukensia demissa (ribbed mussel) and Crassostraea virginica (eastern
oyster) stabilize soil against erosion and move nutrients from the water column to the soil
(Jordan and Valiela 1982, Bertness and Grosholz 1985, Dame 1996, Pennings and Bertness
2001). Reciprocally, plants provide invertebrates with stable substrate through their extensive
root systems (Bertness 1984b), food (mainly as detritus, Newell and Porter 2000), habitat and
refuge from predators (Diaber 1982, Kneib 1997, Nomann and Pennnings 1998, Lewis and Eby
2002).
Although it has been estimated that herbivores only remove approximately 10% or less
of living marsh biomass (Smalley 1960, Teal 1962, Nixon and Oviatt 1973, Pfeiffer and Wiegert
1981, Montague and Wiegert 1990), they may be important in mediating plant community
structure (Gough and Grace 1998), especially in the case of rarer plant species (Rand 1999).
Larger mammals and birds may be capable of removing larger portions of biomass (Furbish and
Albano 1994, van der Wal et al. 1998, Smith and Odum 1981, Kerbes et al. 1990, Ford and
Grace 1998), but insects such as grasshoppers and beetles may also be more important than
once thought. Because herbivores tend to focus on particular, preferred plant species, and
particular plant qualities, they promote the success of less-preferred plants (Ellison 1987, Foster
1984, Rand 2000, 2002). Herbivore preferences are mediated by plant chemistry, toughness,
and nitrogen concentration (Pennings et al 1998, Pennings et al. 2001, Goranson and
Pennings, unpublished manuscript). Many plants produce a variety of compounds that deter
herbivory, such as ferulic and coumaric acid, which are found in Spartina (Buchsbaum et al.
11

1984). Additionally plants may deter feeding by being tough or salty, or by containing silica
(Pennings et al. 1998). Although foliar nitrogen content usually does not predict herbivore
preference rankings among plant species (Buchsbaum et al. 1984, Pennings et al. 1998), many
studies have reported that it does affect herbivore choices within a plant species (Vince et al.
1981, Denno et al. 1986, Bowdish and Stiling 1998, Gratton and Denno 2003). Thus,
eutrophication is likely to alter relationships between a plant and its herbivores by making the
plant more palatable to consumers.
An extensive study by Vince et al. (1981) found that 5 families of salt marsh herbivores
from 2 distinct feeding types (piercing and sucking, and chewing) increased in fertilized plots of
3 plant species (Spartina alterniflora, Spartina patens, and Distichlis spicata) in both the low and
high marsh, especially where both foliar nitrogen and biomass were greatest. They suggest that
herbivore responses were due to increased survivorship and fecundity, but were limited by
predation and annual generations (Vince et al. 1981). In other cases, increased herbivory on
fertilized plants was not directly limited by predation (Moon and Stiling 2002, Bowdish and
Stiling 1998), but was limited by the presence of other insects, possibly through egg-predation,
reductions to host-plant palatability, or decreased host plant biomass (Moon and Stiling 2002).
Densities of the delphacid planthopper, Prokelisia, were shown to decrease in fertilized plots at
sites with high grasshopper density, but continued to increase at sites with low grasshopper
density, likely due to asymmetrical competition for resources (Stiling et al. 1991). Competition
for food resources has also been documented between geese and hares in salt marshes in The
Netherlands (van der Wal et al. 1998). Nevertheless, fertilization appears to have an overall
positive effect on herbivore biomass, by increasing both the quality (nitrogen content) and
quantity of plants (Onuf et al. 1977, Lightfoot and Whitford 1987, Levine et al. 1998b, Gratton
and Denno 2003).
The salt marsh grasshoppers Orchelimum fidicinum and Paroxya clavuliger (hereafter
referred to generically) are known to correlate their greatest seasonal abundance with the
12

maximum development of host plant biomass (Davis and Gray 1966). Grasshoppers can locate
food visually, possibly by responding to larger clumps of vegetation, vertical stripes (i.e. taller
plants), or color (Chapman and Joern 1990), all of which are influenced by fertilization. Further,
of 71 studies compiled by Waring and Cobb (1992), 60% of chewing insects such as
grasshoppers responded positively to nitrogen fertilization, over 20% had no response or a
nonlinear response, and less than 10% responded negatively. However, it is not clear which
mechanism of fertilization grasshoppers respond to, increased biomass or plant quality, since
both increase with fertilization (Vince et al. 1981, Waring and Cobb 1992). Grasshoppers are
likely to be nitrogen-limited, as indicated by stoichiometric analyses (Vince et al. 1981), yet the
highest biomass of salt marsh grasshoppers occurs at a time of high plant biomass but
seasonally low protein levels (i.e. when grasses are more mature, Bernays and Barbehenn
1987, Davis and Gray 1966). Thus, life histories of Orchelimum and Paroxya suggest that they
may be most influenced by biomass.
THE DETRITAL FOOD WEB
In salt marshes, the majority of higher plant material enters the detrital food web (Teal
1962, Odum and de la Cruz 1967), following senescence and colonization by microbes (Newell
et al. 1989, Newell 1993). In southeast marshes, the dominant plants Spartina and Juncus
decay in a standing position (Newell et al. 1989, Newell 2001a), which creates a unique micro-
ecosystem for specialized fungal colonizers (Newell 1996). Environmental conditions such as
access to light, water (dew and tides), and organic and inorganic nutrients, the influence of
consumer activity, and exposure to toxic fermentation products and/or anaerobic zones, vary
between plants decaying in the canopy versus the soil surface (Newell et al. 1989, 1991, 1998,
Newell 1993, 1996, Newell and Porter 1999, Graca et al. 2000), thus influencing the
composition of the dominant decomposers in the system.
Ascomycetous fungi are the major decomposers of standing dead Spartina, making up
98 percent of the microbial standing crop on leaves (Newell 1989). They are able to rapidly
13

scavenge plant nitrogen and break down plant organic matter within plant cells (Bergbauer and
Newell 1992, Newell 1993, 1996, Newell et al. 1996a, Newell and Porter 1999). Further, these
fungi appear to be nitrogen-limited, as fertilization increases their biomass significantly (Newell
1996b). Specialized consumers of standing dead material and fungi are the periwinkle and
coffee bean snails, Littoraria irrorata Say and Melampus bidentatus Say, and the amphipod
Ulorchestia spartinophila (Newell 1993, Graca et al. 2000, Kneib et al. 1997). Though several
laboratory studies have pointed to increased detritivore growth, reproduction, and/or food
palatability with increased fungal biomass of detrital food (Rietsma et al. 1988, Bärlocher et al.
1989b, Newell and Bärlocher 1993, Bärlocher and Newell 1994, Kneib et al. 1997,Graca et al.
2000,), no studies have investigated how increases in nutrients available to plants might
ultimately affect these detritivores in the field.
BOTTOM-UP EFFECTS ON COMPETITION AMONG MARSH PLANTS
Though most studies of nutrient effects in salt marshes have focused on the
performance of single species in monoculture (Valiela and Teal 1974, Gallagher 1975, Haines
and Dunn 1976, Mendelssohn 1979), a few studies have examined how nitrogen causes plant
community dynamics to change. Levine et al. (1988) assessed fertilization effects along four
natural zonal borders in New England made up of Distichlis spicata, Spartina (alterniflora and
patens), and Juncus gerardi, and found a complete reversal in the competitive hierarchy in
fertilized plots; that is, the inferior plants increased in abundance (especially Spartina
alterniflora), while the zonal dominants decreased in abundance, with the degree of
displacement mirrored by the amount of height increase of the inferior competitor following
fertilization (i.e. the taller the inferior, the more it displaced the zonal dominant). Moreover,
Emery et al. (2001) showed that, when nutrient stress was alleviated with fertilization,
competitive interactions switched from belowground to aboveground, allowing inferior plants to
increase in height and creating light-limitation for plants dominant under ambient conditions. In
these studies, the typical stress-tolerators became the dominant competitors under fertilized
14
conditions, regardless of their location along the tidal gradient. That is, stress-tolerators were
able to not only outcompete neighbors at naturally occurring borders, but also unnatural
neighbors adjacent to them when transplanted and fertilized in new zones, indicating that
species shifts under eutrophied conditions can be quite substantial (Emery 2001).
To test whether results from the New England studies could be generalized to other
regions with different abiotic conditions, Pennings et al. (2002) conducted a similar study along
the southeast and gulf coasts, and also found that adding nutrients shifted species composition
to the advantage of the inferior competitor, the low-marsh species Spartina alterniflora,
regardless of the physical characteristics of the marsh (2002). Their conclusions, however,
came with the caveat that the extent of Spartina dominance might be influenced by soil salinity,
with its advantage over other zonal dominants decreasing at more saline sites, in accordance
with Greiner La Peyre’s study (2002) that showed reduced competition (at the individual species
level) in higher salinities. Not enough different salinity conditions were examined, however, to
rigorously test this hypothesis.
Generalizations from fertilization studies on community composition are essential to
coastal management decisions because nutrient enhancement is now a common phenomenon,
as more and more people live near the coast and contribute to eutrophication of local
watersheds (Osmond et al. 1995, McClelland and Valiela 1998, Bowen and Valiela 2000,).
Bertness et al. (2002) compared pristine marshes to those abutting developed areas in New
England (i.e. farms, roads, lawns, golf courses, or other human developments), and found that
the developed marshes had more available nitrogen leading to Spartina encroachment into
higher elevations, and invasion of the reed Phragmites from the terrestrial border into lower
marsh habitats. Their results show that anthropogenic inputs to the marsh may ultimately lead
to a loss of diversity, as Spartina and Phragmites outcompete other marsh plants (Bertness et
al. 2002). Similarly, as marsh mitigation and restoration are becoming common practice due to
Clinton’s “No Net Loss Policy” (Dionne et al. 1999, Beatley et al. 2002), understanding nutrient
15

impacts will be critical to evaluating marsh function at restoration sites (Langis 1991, Minton
1999). For example, in California where marshes have been restored for nesting habitat of the
endangered light-footed clapper rail, fertilization compromises this function by leading to
competitive dominance of plants other than Spartina foliosa, the rail’s preferred nesting habitat
(Boyer and Zedler 1999). Finally, because marshes are ultimately linked to productivity of
commercially important species (Teal 1962, Kneib 1997, Silliman and Bertness 2002),
understanding outcomes of trophic interactions under high-nutrient scenarios may ultimately be
essential to sustaining fisheries.
COMPETITION AND TROPHIC DYNAMICS ACROSS ENVIRONMENTAL GRADIENTS
Despite the major consensus that competition and abiotic stress are inversely related
(Grime 1979, Bertness and Ellison 1987, Bertness and Hacker 1994, Bertness and Callaway
1997, Huckle et al. 2000, Greiner La Peyre 2001), it is unclear whether resource availability (i.e.
nutrients) can alter this relationship (but see Brewer 2003). To explore the relationship between
competition and stress-tolerance, I examined the responses of marsh plants to nutrient
additions at sites across a range of abiotic conditions. To avoid complications arising from
studying different plant species I focused on the interactions of two plant species, Spartina
alterniflora and Juncus roemerianus. These two species abut each other in an abrupt border
across a wide range of edaphic conditions. I tested the hypothesis that Spartina would
outcompete Juncus regardless of site edaphics (as nutrients reversed the normal competitive
hierarchy to favor Spartina more than Juncus in previous studies), but that the extent of Spartina
dominance would depend on edaphic conditions, i.e. Juncus would be a better competitor at
lower abiotic stress.
Only a handful of studies have examined numerical responses of salt marsh herbivores
to nutrient changes (Vince et al. 1981, Levine et al. 1998b, Gratton and Denno 2003), only one
has looked at the response of salt marsh fungi (Newell 1996) and none have examined
numerical responses by detritivores. In my experiments, I examined the numerical response of
16
all three guilds to nutrient enhancements across a range of edaphic conditions in the field. In
order to examine whether the responses in the field were due to plant quality (i.e. greater tissue
N-content with fertilization) alone, I examined the laboratory feeding choices of herbivores and
detritivores between control and fertilized plants. I hypothesized that shifts in plant community
composition would also shift the abundance and/or composition of all three guilds of consumers.
I expected that herbivore (grasshopper) abundances would decrease or increase with
decreases or increases in their plant food source (rather than due to plant quality alone), but
that detritivores would be less responsive because the common salt marsh detritivores are less
mobile and more generalized in feeding habitats than the herbivores (plant quantity and quality
would not strongly affect their responses).
Lastly, although it has been shown that additional nitrogen influences herbivore growth
by increasing plant quality (Bernays and Barbehenn 1987), few studies have examined whether
detritivores also grow better on detritus from plants grown under high-nitrogen conditions.
Rietsma et al. found no effect of nitrogen fertilization on the growth of the salt marsh snail
Melampus (1988); but two studies in freshwater habitats found positive detritivore growth results
under high nitrogen conditions (Friberg and Jacobsen 2001) and under high phosphorus
conditions (Rosemond et al. 2001). To assess detritivore response to litter quality, I examined
growth of salt marsh detritivores on plant litter from fertilized versus natural conditions. Because
plants resorb nutrients from senescing stems and leaves, litter quality may not change as much
as living biomass following nutrient increases, and thus I expected there to be little difference in
detritivore growth on the different litter types.
17

CHAPTER II
METHODS
EXPERIMENTAL SETUP
Site Selection
Nineteen sites were selected on the GA coast that contained stands of monospecific
Spartina alterniflora bordering stands of monospecific Juncus roemerianus (hereafter referred to
generically). Sites were chosen to span as wide a range of salinity as possible, while still
containing these two plant species. Ten sites were located on Sapelo Island, and nine on the
mainland in McIntosh County, Georgia (Fig. 2.1).
Plot Set-up
Plots were established at the sites in July 2000. Plots were initially set up and
maintained by Tracy Buck (Pennings laboratory technician) until I began my field work in May
2001. Ten 1m2 plots were established at each site. A 1m2 PVC quadrat was laid over the
border between Juncus and Spartina to delineate a plot with a 1:1 mixture of the two species.
Areas where the border was poorly defined (mixing of species) were avoided if possible. A
wooden stake was placed at each corner to designate the plot boundaries. Areas of sparse
vegetation, obvious physical disturbance (wrack, pigs, cows, etc.), or species other than Juncus
and Spartina were avoided if possible. Five plots were designated as fertilized plots while the
remaining five were designated as control plots. The two treatments were assigned to alternate
plots so that treatments were fully interspersed. Plots were placed at least 2 m apart to ensure
fertilizer would not affect neighboring control plots.
Fertilization
Plots were fertilized 3 times over a period of 1 year (July 2000, September 2000, May
2001). On each occasion, each plot was fertilized with 11 planting tablets (Forestry Suppliers,
18

Inc., Remke Nitroform Tablets, 20-10-5 (N-P-K), 21g per tablet, total=140 g N/plot/year, similar
to the yearly “low dosage” fertilization rate applied by Vince et al. 1981). To fertilize plots, a
metal corer was used to remove 11 soil plugs to a depth of 10 cm. A tablet was placed in each
hole and the soil plugs were replaced. Control plots were disturbed in the same manner as the
fertilized plots without the addition of the fertilizer tablet.
Salinity
Porewater salinity was measured monthly at each of the 19 sites during July –
September 2000 and May and July-August 2001. On each occasion, five soil cores were
collected per site between experimental plots along the Spartina/Juncus border using a metal
corer (approximately 2 cm diameter) to a depth of 7-10 cm. A 2-3 cm soil sample from the
deepest portion of each of the five cores was pooled to yield a single composite sample/site.
Samples were placed in plastic cups of known weights, capped tightly to minimize water loss,
and returned to the laboratory. Soil samples were weighed wet, dried at 60OC for 3 days, and
weighed dry. A measured volume of deionized water (typically 40 ml, enough to saturate the
sample) was then added to rehydrate the soil, mixed well with the soil, and the salinity of the
supernatant was measured with a refractometer after 36 hours. Original soil salinity was
calculated as (supernatant salinity in psu)(ml deionized water added)/(soil wet weight (g) – soil
dry weight (g)). The six monthly measurements were averaged to yield a single overall
porewater salinity value for each site.
Redox Conditions
Soil redox measurements were taken monthly at each of the 19 sites during August-
September 2000 and June-September 2001. Soil redox was measured at a depth of 7cm using
a handheld probe Orion® platinum electrode at three points along the Spartina/Juncus border
between experimental plots. Areas with dense crab burrows were avoided. The triplicate
readings for each site were averaged to yield a single monthly mean. The six monthly means
were averaged to yield a single overall redox value for each site and recorded as millivolts (mV).
19
Organic Matter
Soil organic matter content was analyzed in July and August 2001 for each of the 19
marsh sites using the “Loss on Ignition” method (Craft et al. 1991). Three soil subsamples per
site were collected between plots along the Spartina/Juncus border using a metal corer (2 cm
diameter) to a depth of 5 cm. The three subsamples were pooled by site, dried, and ground in a
mortar and pestle. A known weight of soil was added to three replicate crucibles per site, burned
at 250ºC for 2 hours, then at 500ºC for 8 hours, and reweighed. The proportion of organic
matter in the soil was calculated as (mass lost after ignition (g))/ (initial dry mass(g)). The
triplicate values for each site were averaged to yield a single monthly mean. The two monthly
means were averaged to yield a single overall percent organic matter value for each site.
Because these data were proportions, they were arcsine (square root) transformed before
analysis.
Bulk Density
Bulk density of the soil was measured on June 2001 for each of the 19 marsh sites
(using a similar method to Craft and Casey 2000). Two replicate soil samples were collected at
each site along the Spartina/Juncus border. A metal corer of known volume (216.62 cm3) with a
beveled edge was pushed into the soil to a depth of 10.2 cm (the height of the corer). The soil
was leveled off on either end of the corer to ensure that only the volume of the core was
collected. Soil samples were dried, then weighed. Bulk density of each sample was calculated
as (dry weight of soil sample (g)/volume of soil in the corer (cm3)). The two replicates were
averaged to yield a single overall bulk density value for each site.
Soil Texture Composition
Soil texture composition was measured on June 2002 for each of the 19 marsh sites to
determine the percent sand, silt, and clay content using the hydrometer method (Gee and
Bauder, 1986). Soil collected for the bulk density analysis was used to analyze soil texture.
Because soil had already been oven-dried, we did not use the moisture correction factor (MCF).
20
Soil was pulverized using a mortar and pestle to obtain a sample of 100 or 50 grams, depending
on whether the soil was medium-textured, sandy, and low in organic matter, or clayey and
organic-rich, respectively. If the bulk density was greater than 0.75 g/cm3 and the organic
matter content was low compared to other sites (typically <7%, with one exception, North
Cabretta, having 16% organic matter content, but a high bulk density), the soil was categorized
as sandy (7/19 sites were categorized as having sandy soil).
Two replicates for each site were run (one from each replicate bulk density sample), and
four blank replicates were run every 10 and 9 samples. Blank replicates contained no soil and
were used correct hydrometer readings. The percent sand, clay, and silt were determined using
the following equations:
1) % Sand (2 to 0.05 mm) = [oven dry weight – CO40 secs]/oven dry weight * 100,
where CO40 secs = hydrometer reading of sample at 40 seconds minus blank reading
at 40 seconds.
2) % Clay (< 0.002 mm) = CO2 hours/oven dry weight * 100,
where CO2 hours= hydrometer reading of sample at 2 hours minus blank reading at 2
hours.
3) % Silt (0.002 to 0.05 mm) = 100% - % Sand - % Clay.
The duplicate replicates were averaged to yield a single overall percent sand, silt, and clay
content value for each site. The sum of percent silt and clay values was used as a single
variable for statistical analysis (since these comprised the two smallest fractions of total soil
composition). Because these data were proportions, they were arcsine (square root)
transformed before analysis.
Site Landscape Location
To characterize the position of the sites within the landscape, we assigned each site two
scores for 1) upland influence and 2) whether the site was on an island or mainland. First, sites
were scored for upland influence using an index ranging from 1 to 5, with 5 being a marsh site
21

with the most upland influence (i.e. the marsh almost completely surrounded by upland, a
peninsular marsh shape), 3 being a straight marsh to upland border, and 1 being a site least
influenced by upland (i.e. the marsh almost completely surrounded the upland, a peninsular
upland shape). Second, to see if differences existed based on whether the site was located on
Sapelo Island or on the mainland in McIntosh County, a score of 0 was given to island sites and
1 to mainland sites.
PLANT GROWTH AND NUTRITIVE QUALITY
Percent Cover and Height
To determine whether fertilization affected plant growth and dominance, percent cover of
Juncus and Spartina (n=17 sites, all but Sapelo Golf Course and I-95) and the height of tallest
plant of each species (n=19 sites) were recorded for each plot in August 2001. Percent cover
was measured using a 0.25 m2 quadrat, separated by fishing line into 100-5x5 cm squares. The
quadrat was placed in the center of the plot, and the number of individual squares in which each
species was present and the height of the tallest plant within the quadrat was recorded. The
percent cover and height measurements taken at each plot were averaged to yield an overall
site mean for each treatment.
Biomass
To determine whether fertilization affected plant biomass and dominance, plants were
harvested from each plot in October 2001. A 0.5-m x 0.25-m quadrat was placed through the
center of each plot with the longest side perpendicular to the vegetation border, and all
vegetation within the quadrat was clipped at the base. The vegetation was sorted by species
and Juncus and Spartina were further divided into living and dead plant material. For Juncus, a
leaf was considered dead if it was >75% brown. For Spartina, shoots with both live and dead
leaves were stripped of their dead leaves. Dead leaves were placed with the dead plant
material while the remaining green stem and leaves were placed with the living plant material.
Plant material was dried at 60oC for 4 days and then weighed to the nearest hundredth of a
22

gram. The sorted vegetation collected from each plot was multiplied by 8 to estimate total plot
biomass for each plant type (live or litter) and species, then were averaged to yield an overall
site mean for each treatment.
Plant Quality
To determine whether fertilization affected plant quality, leaves of living and litter
portions of Spartina and Juncus were analyzed for nitrogen content (% dry mass). Leaves were
collected in June (litter) and July (living) 2001, as subsamples from material used in feeding
experiments described below (n=15 sites, denoted by asterisks in Table 3.1), then freeze dried.
Samples were ground to a powder by Tracy Buck, weighed to approximately 35 mg on a
microbalance and placed in tin foil cups by me, and analyzed using a CHN autoanalyzer
operated by Monica Palta. An amino acid standard was run every 13 samples, and a blank
daily.
CONSUMER ABUNDANCE
Fungal Biomass
To determine whether fertilization affected fungal biomass in Spartina litter, standing
dead leaves of Spartina were collected from each site in October 2001 (n=19 sites). The lower-
most intact fully-brown leaf was collected from each control and fertilized plot (n=10 leaves per
site) and preparation of leaves for fungal biomass analyses was performed by Steve Newell
(following protocol from Newell 2001). Briefly, leaves were rinsed in running, cold tapwater for
15 seconds, and a 1-cm length was cut from the ligule end of each leaf and discarded. Another
1-cm portion was cut from the ligule end of each leaf, and the five pieces per site x treatment
were pooled and submerged in 5 ml ethanol in a screw-cap vial. The vials were placed in
darkness at 4ºC for storage prior to processing. Another 1-cm length was cut from the ligule
end of each leaf, and the five pieces per site x treatment were pooled in small glass drying
pans, dried in a microwave (1000W, as in Newell 2001) and weighed. Samples were then
placed in a muffle furnace in aluminum tares for 4 hours at 450ºC and reweighed for
23
determination of leaf organic mass through loss on ignition. Fungal biomass was estimated
using the ergosterol method following the methods described by Newell (2000). Fungal
biomass was calculated on a per leaf basis (as µg ergosterol/g leaf organic mass (LOM)) for
each treatment. To also estimate fungal biomass on a per plot basis (as mg ergosterol/m2), I
multiplied fungal biomass per leaf (mg) x average Spartina litter biomass (g) to obtain a single
site value for each treatment.
Snail Density
Densities of the salt marsh snails Melampus bidentatus and Littoraria irrorata (hereafter
referred to generically) were recorded in July and August 2001 in each of the 10 plots within the
19 sites. A 0.5-m x 0.5-m quadrat was laid in the center of each plot, and the total number of
each snail species was counted. Care was taken to look within leaf furls for small snails and
near the bases of plants along the marsh surface where snails often reside during low tide. The
density of each species within the 0.5-m x 0.5-m quadrat was multiplied by 4 to estimate the
density in the 1-m x 1-m plot. Snail densities were averaged across plots within each treatment
and site to yield single monthly means per site, and monthly means were averaged for an
overall site mean for each treatment. Snail densities were natural log transformed to improve
normality before statistical analysis.
Grasshopper Density
Densities of the salt marsh grasshoppers, Orchelimum fidicinum and Paroxya clavuliger
(hereafter referred to generically), were recorded in July and August 2001 in each of the 10
plots within the 19 sites. A pvc pipe was used to carefully brush through vegetation within the
entire plot, and the number of each grasshopper species was counted as they jumped from the
plot. Care was taken to ensure that grasshoppers were not counted twice if they jumped from
and landed within plots again. Grasshopper densities were averaged to yield single monthly
means per site, and monthly means were averaged for an overall site mean for each treatment.
Further, the ratio of each grasshopper species to their food plant (Orchelimum eats Spartina,
24
Paroxya eats Juncus, Davis and Gray 1966) in control and fertilized plots at each site was
calculated to test whether this ratio varied among treatments.
CONSUMER FOOD SELECTION
Detritivore Choice Experiment
To determine whether fertilization affected palatability of plant litter to detritivores, I
conducted paired feeding assays with the snail Littoraria irrorata and the crab Armases
cinereum (hereafter referred to generically). A single standing-dead Spartina shoot was
collected during the last week of May 2001 from each fertilized and control plot at 15 sites (9
island and 6 mainland sites, denoted by asterisks in Table 3.1). Attached leaf blades were
removed to correct for variability in blade occurrence among shoots, and thus potential
consumer choice bias among food (as detritivores often prefer softer blade material over
tougher stem and sheath material, Graca et al. 2000). The collected plant samples were then
pooled across plots within each treatment and site. Thirty Littoraria (approximately 20 mm in
spire height) and 30 Armases (carapace width≥20mm) were collected from Dean Creek and
Cabretta Island, respectively.
In the lab, one inch of each stem and surrounding sheath was cut, pooled within site and
treatment, and frozen for Carbon:Nitrogen (C:N) analysis. Then stems and surrounding sheaths
were cut to 1 and 2 cm in length, weighed, and used as food for snails and crabs, respectively,
in the detritivore choice experiments. The remaining portion of each stem and surrounding
sheath was also weighed, dried at 60ºC for 3 days, and reweighed to calculate initial percent
water content (calculated as 100 – [(dry weight (g) of stem / wet weight (g) of stem) x 100].
Snails and crabs were offered a choice between litter from fertilized and control plots
from the same site. Each comparison (n=15 sites) was replicated twice, for a total of 30
replicates. One snail or one crab was placed into a pint jar or plastic bucket respectively, with
two plant pieces, one control and one fertilized. Plant pieces were labeled with colored
25

pushpins to denote treatment. A small amount of brackish water (15 ppt) was added to maintain
humidity. Jars were capped with mesh and buckets had mesh windows to allow air circulation.
Assays were checked once daily. Individual replicates of snails and crabs were allowed
to feed until > 25% of either plant piece was eaten, or for a maximum of 40 and 30 days,
respectively. Then plants were removed, rinsed free of feces, dried at 60ºC for 3 days, and
weighed. The final dry weight was subtracted from the initial estimated dry weight (calculated
as [initial weight of stem and surrounding sheath – (percent water x initial weight of stem and
surrounding sheath)]) to give the amount eaten. The duplicate replicates per site were
averaged for an overall mean for each site. For multiple regression analysis, effects of
fertilization on preference were calculated as (fertilized plant consumption (mg) – control plant
consumption (mg)).
Herbivore Choice Experiment
To determine whether fertilization affected palatability of leaves to herbivores, we
conducted paired feeding assays with grasshoppers Orchelimum fidicinum and Paroxya
clavuliger (hereafter referred to generically). Fresh, undamaged leaves of Spartina and Juncus
were collected from 15 sites (9 island and 6 mainland sites, denoted by asterisks in Table 3.1)
from 3 randomly chosen fertilized and control plots each (total n=90/species). Leaves were
pooled within treatments at each site. Grasshoppers (Orchelimum and Paroxya, n=30 each)
were collected from a site that was not one of the experimental sites.
In the lab, one inch of each leaf per plant species per site was cut, pooled within sites
and treatments, and frozen for Carbon:Nitrogen (C:N) analysis as described earlier. The
remaining leaves were trimmed to 150 mm in length, marked at the base to indicate treatment,
and used in the herbivore choice experiments.
Grasshoppers were offered a choice between a control and fertilized leaf from the same
site (n=15 sites). Each comparison was replicated twice, for a total of 30 replicates. A single
grasshopper (Orchelimum for Spartina assays and Paroxya for Juncus assays) was placed
26

inside a mesh cage with the two plant pieces oriented upright in a 5-ml vial filled with distilled
water.
Assays were checked twice daily. Individual replicates of grasshoppers were allowed to
feed until > 25% of either plant piece was eaten, or for a maximum of 3 days. The leaf area
eaten was estimated using a 1-mm x 1-mm mesh grid laid over the leaves. The duplicate
replicates per site were averaged for an overall mean for each site. For multiple regression
analysis, effects of fertilization were calculated as (fertilized plant consumption (mm2) – control
plant consumption (mm2)).
Grazing Damage
To determine if fertilization affected the amount of damage that plants received from
grasshoppers, I estimated damage to plants in the field during the first week of August 2001
(n=19 sites). At this time, grasshoppers were large and actively feeding. A 1 m-long pvc pipe
was marked at 10, 30, 50, 70, and 90 centimeters. At each plot, the pvc pipe was placed
parallel to the vegetation border, first through the center of the Juncus stand and then through
the center of the Spartina stand. In each stand, the plant closest to each mark on the pvc pipe
was scored for damage by grasshoppers using standardized scores that ranged from 0-50%
damage in 5% increments (Table 2.1). Damage to individual plants was averaged for each plot,
and plot means were averaged to yield an overall site mean for each treatment.
CONSUMER GROWTH
To determine if fertilization affected snail growth, we conducted a laboratory growth
experiment. Two species of snails, Melampus and Littoraria, were collected from the Chocolate
and Meridian, and Dean Creek, sites respectively. The spire height of all snails (n=120/species)
was measured to the nearest hundreth of a millimeter. To allow potential for rapid growth, only
small snails (< 5 mm in length) were used (Bingham 1972).
Snails were fed standing dead Juncus or Spartina collected from control or fertilized
plots. Standing dead leaves (Juncus) or stems (Spartina) were cut (approx. 7cm length) as
27

close as possible to the base of the stem from each of the five fertilized and five control plots (1
stem/plot) at each of fifteen of the experimental sites (9 island and 6 mainland sites, denoted by
asterisks in Table 2). The 5 stem pieces of each species from each treatment were pooled
within a site. A total of 300 (5 plots * 2 treatments * 2 plant species* 15 sites) dead stem pieces
were collected.
Because the Spartina stems were in varying states of decay, loose leaf and sheath
material was removed from some stems to create standardized stem pieces lacking leaf
material. Four of the five collected plant pieces for each treatment and species were
haphazardly selected and cut to 5 cm in length. The fifth plant piece was stored in the freezer
as a replacement for samples if needed during the experiment. The 5 cm pieces of stem were
weighed on an analytical balance to determine wet mass. The excised 2 cm of each stem was
also weighed, dried at 60° C for 3 days, and reweighed to calculate initial percent water content
(calculated as in the Detritivore Choice Experiment).
Snails were housed individually in Nalgene vials (125 mL), kept at room temperature,
and placed in indirect light in a location that experienced a natural light and dark cycle, but was
out of direct sunlight. Five mL of brackish (15 ppt) water (a mixture of seawater collected from a
tidal creek and deionized water) was added to each of the vials. The 5 cm dead plant shoots
were added to each vial in an upright position.
The growth experiment ran for 3 months and food was not replaced. Vials were opened
2 times/week for ventilation, and distilled water was added if needed to replace evaporation.
Snails that died during the first 3 weeks were replaced (these replicates ran to a later date than
the others to allow a total of 3 months of growth). Snails that died subsequently were dropped
from the analysis.
To determine snail growth, snails were re-measured. The duplicate replicates per snail
species x plant species x treatment combination were averaged to yield a single replicate value
for each treatment at each site.
28
STATISTICAL ANALYSIS
For all analyses, sites were the unit of replication. Whenever multiple data points were
obtained for a treatment within a site, these were averaged to yield a single value for each
treatment at each site.
Because soil organic matter, bulk density, and silt + clay content were all correlated to
one another, I used a composite soil variable obtained from the first principle component axis of
a PC ordination of these variables for regression analyses. PCA1, hereafter called “soil”,
explained 88.4 percent of the variance in the data, and was positively correlated with bulk
density, and negatively with organic content and silt + clay.
I used 4 general approaches to analyze results. First, effects of fertilization were
compared between treatments using paired t-tests (Ha: difference <>0). In one case, the non-
parametric Wilcoxon Signed Rank test was used because it was more powerful given the
distribution of the data. Second, I explored variation among site responses to fertilization using
multiple regression analyses. For each site response, results of backward elimination and
forward regression (variables were included in the model at individual P<0.15 level) were
compared with best subsets regression analyses, and the best model was chosen by evaluating
Mallow’s Cp statistic (Mallows 1973), model adjusted R2, and the overall model P-value.
Because some data were not collected at all sites, sample sizes for selected regressions range
from 15 to 19. Collinearity between variables was avoided by dropping potential predictor
variables with VIF scores>5 that made the least sense biologically. When the N-content of litter
of either plant species was the dependent variable, the N-content of the live portions of that
species was initially forced into the model, and later removed only if it had P<0.15 in the best
resulting model. Third, I used ANOVA to examine the effects of fertilization and plant species
on snail growth. Finally, for each field measurement, I compared natural site variation to
treatment variation by analyzing the ratio of the coefficients of variation in control plots at 19
sites versus the coefficient of variation among treatments.
29
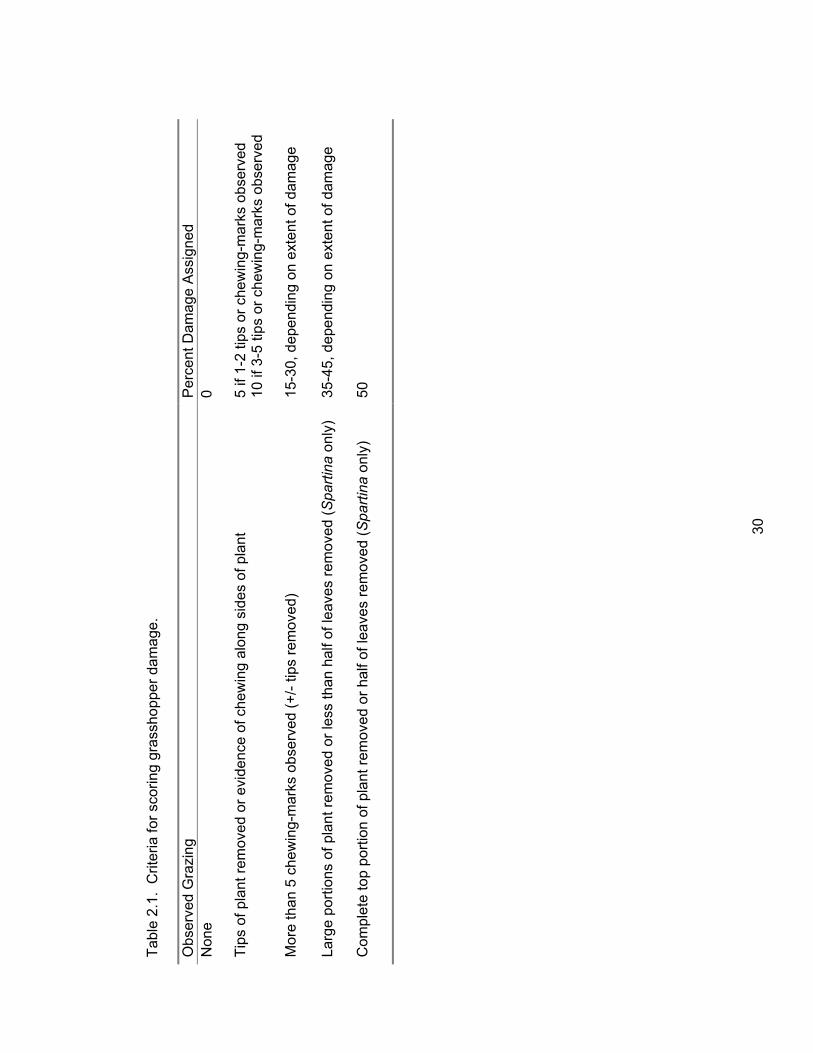
Tabl
e 2.
1. C
riter
ia fo
r sco
ring
gras
shop
per d
amag
e.
Obs
erve
d G
razi
ng
Per
cent
Dam
age
Ass
igne
d N
one
0
Tips
of p
lant
rem
oved
or e
vide
nce
of c
hew
ing
alon
g si
des
of p
lant
5 if
1-2
tips
or c
hew
ing-
mar
ks o
bser
ved
10 if
3-5
tips
or c
hew
ing-
mar
ks o
bser
ved
Mor
e th
an 5
che
win
g-m
arks
obs
erve
d (+
/- tip
s re
mov
ed)
15-3
0, d
epen
ding
on
exte
nt o
f dam
age
Larg
e po
rtion
s of
pla
nt re
mov
ed o
r les
s th
an h
alf o
f lea
ves
rem
oved
(Spa
rtina
onl
y)
35-4
5, d
epen
ding
on
exte
nt o
f dam
age
Com
plet
e to
p po
rtion
of p
lant
rem
oved
or h
alf o
f lea
ves
rem
oved
(Spa
rtina
onl
y)
50
30
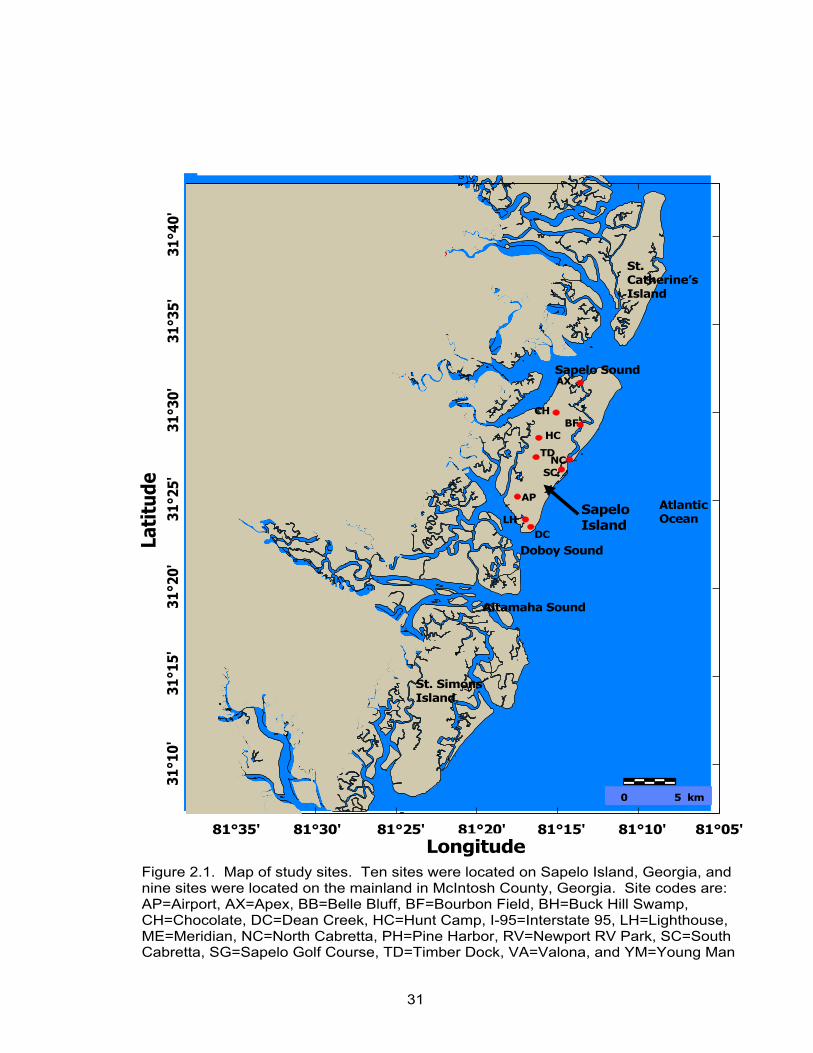
0
Sampling Sites
Longitude
Lat
itu
de
31°
40’
31°
35’
31°
30’
31°
25’
31°
20’
31°
15’
31°
10’
0 5 km
81° 35’ 81° 30’ 81° 25’ 81° 20’ 81° 15’ 81° 10’ 81° 5’
St. Catherine’s Island
Sapelo Sound
Doboy Sound
Altamaha Sound
St. Simons Island
Atlantic Ocean
81o05’81o10’81o15’81o20’81o25’81o30’Longitude
31o 4
0’31
o 30’
31o 3
5’31
o 25’
31o 2
0’31
o 10’
31o 1
5’La
titu
de
Sampling Sites
Longitude
Lat
itu
de
31°
40’
31°
35’
31°
30’
31°
25’
31°
20’
31°
15’
31°
10’
0 5 km
81° 35’ 81° 30’ 81° 25’ 81° 20’ 81° 15’ 81° 10’ 81° 5’
St. Catherine’s Island
Sapelo Sound
Doboy Sound
Altamaha Sound
St. Simons Island
Atlantic Ocean
Sampling Sites
Longitude
Lat
itu
de
31°
40’
31°
35’
31°
30’
31°
25’
31°
20’
31°
15’
31°
10’
0 5 km
81° 35’ 81° 30’ 81° 25’ 81° 20’ 81° 15’ 81° 10’ 81° 5’
Sampling Sites
Longitude
Latit
ude
31°
40’
31°
35’
31°
30’
31°
25’
31°
20’
31°
15’
31°
10’
0 5 km
81° 35’ 81° 30’ 81° 25’ 81° 20’ 81° 15’ 81° 10’ 81° 5’
St. Catherine’s Island
Sapelo Sound
Doboy Sound
Altamaha Sound
St. Simons Island
Atlantic Ocean
81o05’81o10’81o15’81o20’81o25’81o30’Longitude
81o05’81o10’81o15’81o20’81o25’81o30’Longitude
31o 4
0’31
o 30’
31o 3
5’31
o 25’
31o 2
0’31
o 10’
31o 1
5’La
titu
de
31o 4
0’31
o 30’
31o 3
5’31
o 25’
31o 2
0’31
o 10’
31o 1
5’La
titu
de
Fertilization Study Sampling Sites
81°35' 81°30' 81°25' 81°20' 81°15' 81°10' 81°05' Longitude
31°1
0'31
°15'
31
°20'
31
°25'
3 1
°30'
31
°35'
3
1°40
' La
titu
de
0 5 km
PHBB
SG
YMI95
RV
DCLH
AP
TD
CH
AX
BF
NCSCME
VA
BH
HC
Sapelo Island
McIntosh County, Georgia
Figure 2.1. Map of study sites. Ten sites were located on Sapelo Island, Georgia, and nine sites were located on the mainland in McIntosh County, Georgia. Site codes are: AP=Airport, AX=Apex, BB=Belle Bluff, BF=Bourbon Field, BH=Buck Hill Swamp, CH=Chocolate, DC=Dean Creek, HC=Hunt Camp, I-95=Interstate 95, LH=Lighthouse, ME=Meridian, NC=North Cabretta, PH=Pine Harbor, RV=Newport RV Park, SC=South Cabretta, SG=Sapelo Golf Course, TD=Timber Dock, VA=Valona, and YM=Young Man
31
CHAPTER III
RESULTS
GENERAL EFFECTS OF FERTILIZATION
Plant Growth and Dominance
Fertilization altered the border between Spartina and Juncus at a majority of the 19
sites, typically increasing Spartina dominance within plots. Averaged across all sites, the
biomass of living Spartina was 197% greater in fertilized than control plots, while biomass of
living Juncus was 33% less in fertilized than control plots (Fig. 3.1). Similarly, the biomass
of standing dead (litter) Spartina was 174% greater in fertilized than control plots, while the
biomass of standing dead (litter) Juncus was 31% less in fertilized than control plots (Fig.
3.1). The pattern of increasing living and standing dead (litter) Spartina biomass occurred at
18 of 19 sites each, while the pattern of decreasing living and standing dead (litter) Juncus
occurred at 17 and 16 of 19 sites, respectively. Changes in biomass of live plant species
can be caused by changes in either percent cover and/or height. Percent cover estimates
for each species mirrored live biomass results, with living Spartina covering 58% more
ground in fertilized than control plots, and living Juncus covering 19% less in fertilized than
control plots (Fig. 3.2). The pattern of increasing ground cover by Spartina in fertilized plots
held at 15 of 17 sites, and the pattern of decreasing ground cover by Juncus in fertilized
plots held at 13 of 17 sites. Fertilization significantly boosted heights of both plant species,
although Spartina experienced the greatest benefit with fertilized plants 38% taller than
control plants, compared to fertilized Juncus plants which were only 4% taller than controls
(Fig. 3.3). The trend towards taller plants in fertilized plots held at 18 of 19 sites for Spartina
and 16 of 19 for Juncus.
32

Plant Nutritive Quality
Averaged across all sites, the nitrogen content of living Spartina and Juncus leaves
was 25% and 15% greater in fertilized than control plots, respectively (Fig. 3.4). This pattern
held at 12 of 15 sites for Spartina and 13 of 15 sites for Juncus. In contrast, there were no
significant differencea in the nitrogen content of standing dead leaves of either species,
although the trend was toward greater nitrogen content in fertilized plots (Fig. 3.4).
Herbivore and Detritivore Density
Although the trend for all herbivores (Orchelimum and Paroxya) and detritivores
(Littoraria and Melampus) was toward greater abundance in fertilized than control plots, only
Orchelimum increased significantly, with 178% more individuals in fertilized than control
plots (Fig. 3.5, 3.6), suggesting that herbivores may be more responsive than detritivores to
increased plant-nutrient status and biomass. The ratio of grasshopper abundance:host
plant biomass was significantly greater in fertilized plots for Paroxya, suggesting that they
responded to plant quality because Juncus biomass actually decreased in fertilized plots.
Although the ratio of Orchelimum to Spartina was not significantly greater, there was a trend
toward higher values in fertilized plots, hinting that they may also be responding to changes
in plant quality in addition to plant quantity (Fig. 3.7).
Decomposer Biomass
When fungal biomass was estimated on a per gram of LOM basis, the trend was
toward greater fungal biomass in standing dead Spartina leaves in fertilized plots, but the
difference was not significant (Fig. 3.8). However, when the fungal biomass was normalized
to fungal biomass m-2 by multiplying by dead Spartina biomass m-2 (per plot basis),
treatments differed significantly, with 210% more fungal biomass in fertilized than control
plots, and 14 of 19 sites exhibiting this pattern (Fig. 3.8). Thus, fertilization did not affect
fungal biomass on a per leaf basis, though it could be that fungal activity and sexual output
were higher with fertilization (Newell et al. 1996b), this was not examined, but significantly
33

affected fungal biomass when it was considered on a per plot basis to include increases in
biomass of dead Spartina. Ergosterol values per leaf reported in this study were similar to
those formerly reported by Newell et al. (2000).
Consumer Food Selection
Feeding damage by grasshoppers on fertilized plants of Juncus and Spartina was
61% and 132% greater, respectively, than control values (Fig. 3.9). This trend held at 18 of
19 sites for Spartina and 15 of 19 sites for Juncus. Although these data suggest that
grasshoppers were preferentially consuming fertilized plants, consumption of Spartina
and/or Juncus by detritivores and herbivores during paired feeding assays in the lab did not
indicate that fertilization influenced feeding choices. Consumption of fresh plant material by
Orchelimum and Paroxya did not significantly differ between treatments (Fig. 3.10), nor did
consumption of dead Spartina by Littoraria and Armases, although Armases exhibited a
trend toward greater consumption of the fertilized treatment at 11 of 15 sites (Fig. 3.11).
Consumer Growth
Growth of Littoraria and Melampus feeding on dead Spartina and Juncus did not
differ among fertilization treatments (Fig. 3.12). Growth of Melampus, however, differed
between the plant species, with 267% better growth on Spartina versus Juncus. Littoraria
growth did not differ between plant species.
VARIATION IN RESPONSES AMONG SITES
Site Characteristics
Sites varied in salinity, redox potential, sediment organic matter content, sediment
silt and clay content, sediment bulk density, and upland influence (Table 3.1). Comparisons
of coefficients of variation (CV) indicates that organic matter content varied most, followed
by bulk density, silt and clay content, redox potential, and salinity (Table 3.2). However, all
site edaphics were quite variable (i.e. all CVs > 15).
34
Plant Growth Responses
Plant growth, as determined by percent cover, height, and biomass, was correlated
with both physical characteristics and biological factors at each site (Table 3.3). Three of 4
models for percent cover were significant, with the most common predictors being mainland
score, grazing damage, N-content, and herbivore densities, each significant at P<0.05 in the
models, except for Orchelimum density. Mainland score was negatively correlated to control
Spartina and positively correlated to control Juncus (i.e. more Juncus and less Spartina on
mainland versus island sites), grazing damage was negatively correlated with plant cover in
control plots, N-content of fertilized Spartina was negatively correlated to its percent cover
while the N-content of control Juncus was positively correlated to its percent cover, and
densities of the herbivores Orchelimum and Paroxya were positively correlated to fertilized
Spartina and control Juncus, respectively. Salinity was only an important predictor in the
control Spartina model, but it had a strong inverse relationship to Spartina cover (P<0.01).
Salinity was the most important correlate of height for Spartina and Juncus,
negatively predicting height in each case, with a significant relationship in 3 of 4 full models
(P<0.01, Table 3.3). In a univariate regression, it significantly explained over 40% of the
variation in height for both species in both treatments (P<0.01 each, Fig. 3.13). Soil,
sitescore, and either grazing damage or herbivore density each occurred as predictor
variables in 3 of 4 models, with soil and grazing damage negatively related and sitescore
positively related to height.
Sitescore, a measure of upland influence, was the dominant variable in 4 of 6
significant models for biomass of each species and treatment. Sitescore was negatively
correlated with fertilized Spartina and control Spartina litter (indicating reduced Spartina
where there was greater upland influence), and positively correlated with live and litter
portions of control Juncus (indicating increased Juncus where there was greater upland
influence). Thus, sitescore was the most important determinant of biomass, especially in
35

control plots (occurring in 3 of 4 significant control models), and having opposite correlations
to each plant species. In 3 of the 4 significant models for Spartina biomass, redox was also
an important predictor, with control live and litter portions having a negative and fertilized
live Spartina a positive relationship to redox potential. Live biomass of Spartina was further
explained by its own N-content, with a positive relationship in the control model and a
negative relationship in the fertilized model. In addition to sitescore, the only other common
predictor of Juncus biomass was soil, which was negatively correlated with live and dead
Juncus biomass in the control treatment.
Over all 3 plant size variables (percent cover, height, and biomass), the most
common predator variable was sitescore, which occurred in over half of the significant
models (8/13), with a majority of those relationships being significant. Sitescore was in
every significant model predicting Juncus growth parameters (5/5) and in 3 of 8 of the
models predicting Spartina growth parameters, with a positive relationship in all but one
Juncus model (percent cover) and a negative relationship in all but one Spartina model
(height).
Plant Quality Responses
The most common variable predicting the N-content of living plants was the N-
content of the other plant species (Table 3.4). This result occurred in a majority (3/4) of the
models predicting live N-content, with a negative relationship in both control models and a
positive relationship in the Juncus fertilized model. Furthermore, in a univariate regression,
N-content of the other plant significantly explained over 30% of the variation in N-content of
control plants (P=0.03 each, Figs. 3.14, 3.15). Live Spartina N-content was correlated with
different factors in the two treatments, but a majority of the factors (4/5, mainland, redox,
sitescore, and grazing damage) that were correlated with N-content in the fertilized
treatment were also important in fertilized Spartina biomass models, with the same
relationships. Additionally, there was a correlation between the N-content of each species
36

and biomass in 3 of 4 models, with Spartina biomass always negatively related to live N-
content and Juncus biomass always positively related to live N-content, regardless of
species or treatment.
Although mainland, salinity, and Juncus N-content occurred in a majority of the
significant models (2/3) predicting litter N-content for each species, only salinity had both a
consistent relationship (negative) and a high significance level (P<0.01). N-content of
Juncus litter was best predicted by live Juncus N-content, but the relationship was positive
in the control model and negative in the fertilized model.
Herbivore Densities
The density of Orchelimum was negatively correlated with Littoraria density, whereas
the density of Paroxya was positively correlated with Littoraria density in all 4 models,
regardless of treatment (P≤0.05 each, Table 3.5). However, in a univariate regression, only
Orchelimum density in the fertilized treatment was significantly (P=0.003) and tightly
correlated with Littoraria density, which explained 42% of Orchelimum density variation in
fertilized plots, but only 18% in control plots (Fig. 3.16). Paroxya density, on the other hand,
was not significantly explained by Littoraria density in either treatment in univariate
regressions and had weak R2 values of 0.10 and 0.15, respectively, for control and fertilized
treatments (not shown). Grasshopper densities in control plots were further predicted by
sitescore in the full models, which was positively related to Orchelimum density and
negatively related to Paroxya density. Paroxya density was positively related to Melampus
density in the control plot model, whereas Orchelimum density was negatively related to
Melampus density in the fertilized plot model.
Decomposer Biomass Responses
Fungal abundance on a per plot and per leaf basis was consistently negatively
correlated with redox in the 3 significant models, but the strength of the relationship was
strongest on a per plot basis (P<0.01), likely due to the strong negative relationship between
37
redox and dead Spartina biomass (Tables 3.5 and 3.3). In a univariate regression, redox
significantly explained 39% and 22% of the variation in fungal biomass per plot in control
and fertilized plots, respectively (P≤0.05 each, Fig. 3.17). Sitescore also consistently
occurred in models of fungi per plot with a negative relationship, regardless of treatment.
When examined on a per leaf basis, variation in fungal density was predictable only in
fertilized plot models, in which it was negatively correlated with redox and positively with
dead Spartina biomass.
Detritivore Density Responses
Littoraria and Melampus densities were best predicted by a strong negative
relationship between the two species in all 4 models (P<0.001 each, Table 3.5). In a
univariate regression, the inverse relationship between the two snails significantly explains
47% and 37% of the variation in their densities in control and fertilized plots, respectively
(P<0.01 each, Fig. 3.18). Other variables were also included in the models, but were not
consistently significant or as common throughout. Most notable, herbivore densities were
important in 3 of 4 models, with Littoraria density negatively correlated with Orchelimum in
each treatment and Melampus density positively correlated with Paroxya in the control
treatment. Further, densities of both snails were negatively related to N-content of live
Juncus in control plots, although the relationship was strong (P<0.01) only in the Melampus
model.
Consumer Food Selection Responses
Damage to plants in fertilized plots was significantly predicted by herbivore densities,
with Orchelimum and Paroxya densities positively related to and explaining 21% and 32% of
the variation in grazing damage to Spartina and Juncus in a univariate regression,
respectively (P≤0.05 each, Table 3.5, Fig. 3.19). I found no significant model predicting
damage to plants in control plots.
38

I found no regression models that predicted site-to-site variation in feeding
preferences of herbivores in the laboratory (results not shown). Similarly, I found no model
predicting feeding preferences of one detritivore, Littoraria (results not shown). In contrast,
feeding preferences of the other detritivore, Armases, were correlated with site salinity in a
univariate regression (P=0.04, Fig. 3.20). At low-salinity sites, fertilized plants were
preferred over control plants. At high-salinity sites, control plants were preferred. These
results should be interpreted with caution, however, because there was a strong outlier in
the dataset, and the regression was not significant when this outlier was removed.
Natural Variation vs. Treatment
Fertilization had a relatively large effect on Spartina factors as indicated by CV (site)
to CV (treatment) ratios similar to or less than 1, including live and standing dead biomass,
live N-content, and grazing damage (Table 3.6). In contrast, Juncus factors, including live
and standing dead biomass, and live N-content, were less influenced by treatment and more
influenced by natural variation across space than Spartina, as indicated by ratios less than
2. Intermediate ratio values (2.71-6.74) exhibited by grazing damage to Juncus, standing
dead Juncus N-content, Paroxya density, and fungal biomass, showed that treatment had a
relatively small effect on their responses. Lastly, natural variation overwhelmed treatment
effects on Littoraria and Melampus densities, as indicated by large ratio values (>20).
39
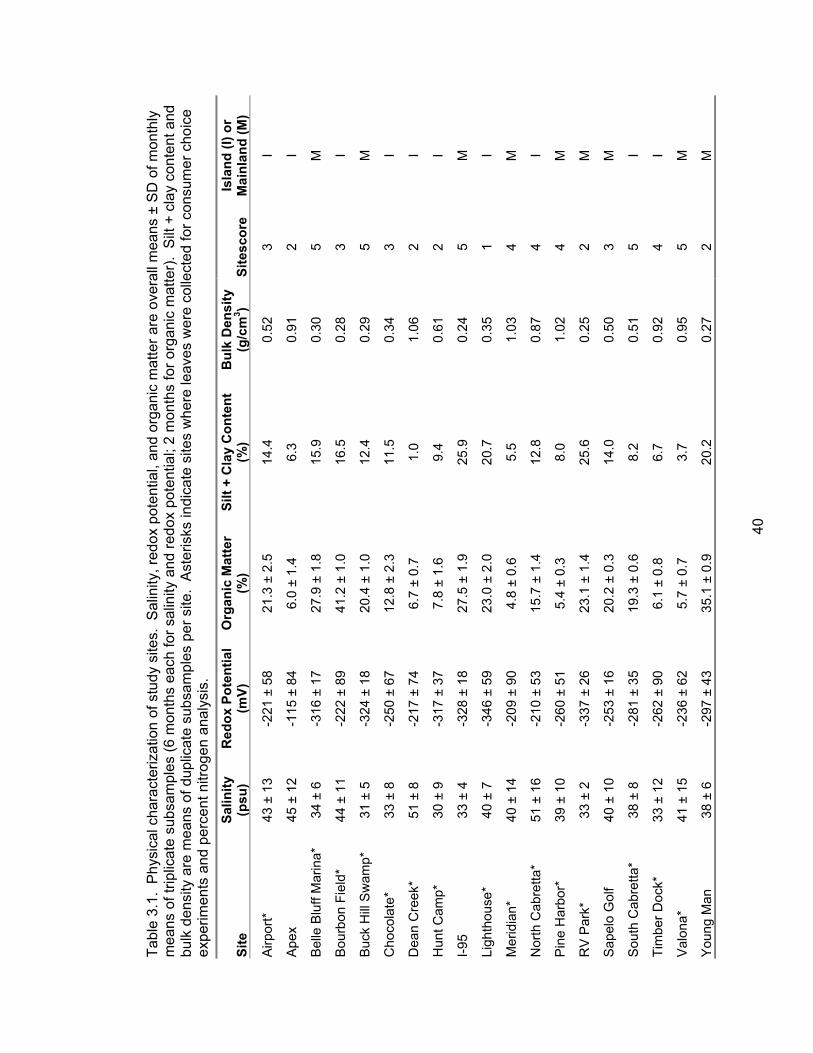
Tabl
e 3.
1. P
hysi
cal c
hara
cter
izat
ion
of s
tudy
site
s. S
alin
ity, r
edox
pot
entia
l, an
d or
gani
c m
atte
r are
ove
rall
mea
ns ±
SD
of m
onth
ly
mea
ns o
f trip
licat
e su
bsam
ples
(6 m
onth
s ea
ch fo
r sal
inity
and
redo
x po
tent
ial;
2 m
onth
s fo
r org
anic
mat
ter)
. S
ilt +
cla
y co
nten
t and
bu
lk d
ensi
ty a
re m
eans
of d
uplic
ate
subs
ampl
es p
er s
ite.
Ast
eris
ks in
dica
te s
ites
whe
re le
aves
wer
e co
llect
ed fo
r con
sum
er c
hoic
e ex
perim
ents
and
per
cent
nitr
ogen
ana
lysi
s.
Site
Sa
linity
(p
su)
Red
ox P
oten
tial
(mV)
O
rgan
ic M
atte
r (%
) Si
lt +
Cla
y C
onte
nt
(%)
Bul
k D
ensi
ty
(g/c
m3 )
Site
scor
eIs
land
(I) o
r M
ainl
and
(M)
Airp
ort*
43
± 1
3 -2
21 ±
58
21.3
± 2
.5
14.4
0.
52
3 I
Ape
x 45
± 1
2 -1
15 ±
84
6.0
± 1.
4 6.
3 0.
91
2 I
Bel
le B
luff
Mar
ina*
34
± 6
-3
16 ±
17
27.9
± 1
.8
15.9
0.
30
5 M
Bou
rbon
Fie
ld*
44 ±
11
-222
± 8
9 41
.2 ±
1.0
16
.5
0.28
3
I
Buc
k H
ill S
wam
p*
31 ±
5
-324
± 1
8 20
.4 ±
1.0
12
.4
0.29
5
M
Cho
cola
te*
33 ±
8
-250
± 6
7 12
.8 ±
2.3
11
.5
0.34
3
I
Dea
n C
reek
* 51
± 8
-2
17 ±
74
6.7
± 0.
7 1.
0 1.
06
2 I
Hun
t Cam
p*
30 ±
9
-317
± 3
7 7.
8 ±
1.6
9.4
0.61
2
I
I-95
33 ±
4
-328
± 1
8 27
.5 ±
1.9
25
.9
0.24
5
M
Ligh
thou
se*
40 ±
7
-346
± 5
9 23
.0 ±
2.0
20
.7
0.35
1
I
Mer
idia
n*
40 ±
14
-209
± 9
0 4.
8 ±
0.6
5.5
1.03
4
M
Nor
th C
abre
tta*
51 ±
16
-210
± 5
3 15
.7 ±
1.4
12
.8
0.87
4
I
Pin
e H
arbo
r*
39 ±
10
-260
± 5
1 5.
4 ±
0.3
8.0
1.02
4
M
RV
Par
k*
33 ±
2
-337
± 2
6 23
.1 ±
1.4
25
.6
0.25
2
M
Sap
elo
Gol
f 40
± 1
0 -2
53 ±
16
20.2
± 0
.3
14.0
0.
50
3 M
Sou
th C
abre
tta*
38 ±
8
-281
± 3
5 19
.3 ±
0.6
8.
2 0.
51
5 I
Tim
ber D
ock*
33
± 1
2 -2
62 ±
90
6.1
± 0.
8 6.
7 0.
92
4 I
Val
ona*
41
± 1
5 -2
36 ±
62
5.7
± 0.
7 3.
7 0.
95
5 M
You
ng M
an
38 ±
6
-297
± 4
3 35
.1 ±
0.9
20
.2
0.27
2
M
40

Tabl
e 3.
2.
Cro
ss-s
ite c
hara
cter
izat
ion
of s
tudy
are
a. O
vera
ll si
te m
eans
± S
D, l
ower
and
upp
er 9
5% c
onfid
ence
inte
rval
s, a
nd
coef
ficie
nts
of v
aria
tion
(CV
) are
repo
rted
for s
alin
ity, r
edox
pot
entia
l, or
gani
c m
atte
r, si
lt +
clay
con
tent
, and
bul
k de
nsity
(n=1
9 si
tes)
.
Salin
ity
(psu
) R
edox
Pot
entia
l (m
V)
Org
anic
Mat
ter (
%)
Silt
+ C
lay
Con
tent
(%)
Bul
k D
ensi
ty
(g/c
m3 )
Mea
n ±
SD
39 ±
6
-291
± 5
9 17
.4 ±
10.
9 13
.0 ±
6.5
0.
59 ±
0.3
1 Lo
wer
95%
CI
36
-291
12.1
9.9
0.44
Upp
er 9
5% C
I 42
-235
22.6
16.2
0.74
CV
16%
22%
63%
50%
53%
41

Tabl
e 3.
3. S
umm
ary
of re
sults
of m
ultip
le re
gres
sion
mod
els
pred
ictin
g pl
ant g
row
th o
f liv
e an
d lit
ter p
ortio
ns o
f Spa
rtina
and
Jun
cus
with
in c
ontro
l and
ferti
lized
plo
ts.
Sym
bols
(*, *
* an
d **
* in
dica
te P
<0.0
5, <
0.01
, <0.
001
resp
ectiv
ely,
and
no
aste
risks
for
0.15
>P>0
.05)
indi
cate
sig
nific
ance
of i
ndiv
idua
l ter
ms
in th
e m
odel
. O
vera
ll m
odel
adj
uste
d R
2 , P-v
alue
s, a
nd s
ampl
e si
ze (n
) are
gi
ven
bene
ath
the
list o
f ter
ms.
All
mod
els
had
Mal
low
’s C
p<p
(the
num
ber o
f par
amet
ers)
, exc
ept f
or p
erce
nt c
over
of c
ontro
l Ju
ncus
, and
bio
mas
s of
ferti
lized
Spa
rtina
. V
aria
ble
Abb
revi
atio
ns:
S=s
oil,
R=r
edox
, SA
L=sa
linity
, SS
=site
scor
e, M
L=is
land
or m
ainl
and,
SLN
=nitr
ogen
con
tent
of l
ive
Spa
rtina
, JL
N=n
itrog
en c
onte
nt o
f liv
e Ju
ncus
, SD
N=n
itrog
en c
onte
nt o
f sta
ndin
g de
ad S
parti
na, J
DN
=nitr
ogen
con
tent
of s
tand
ing
dead
Ju
ncus
, SLB
=liv
e S
parti
na b
iom
ass,
JLB
=liv
e Ju
ncus
bio
mas
s, S
DB
=sta
ndin
g de
ad b
iom
ass
of S
parti
na, J
DB
=sta
ndin
g de
ad
biom
ass
of J
uncu
s, G
S=g
razi
ng d
amag
e to
Spa
rtina
, GJ=
graz
ing
dam
age
to J
uncu
s, O
=Orc
helim
um d
ensi
ty, P
=Par
oxya
den
sity
, L=
Litto
raria
den
sity
, M=M
elam
pus
dens
ity, F
=fun
gal b
iom
ass,
NS
=not
sig
nific
ant.
C
ontr
ol
Fert
ilize
d
Spa
rtina
-S
*, -M
L*, -
SA
L**,
-GS
**
mod
el a
djus
ted
R2 =0
.72,
P=0
.000
4, n
=17
+O, -
SLN
**
mod
el a
djus
ted
R2 =0
.59,
P=0
.002
, n=1
5 Pe
rcen
t C
over
Ju
ncus
+M
L*, +
R**
, -S
S*,
-GJ*
, +JL
N*,
+P
* m
odel
adj
uste
d R
2 =0.7
2, P
=0.0
08, n
=15
NS
, n=1
7 S
parti
na
-S**
*, -M
L, -S
AL*
*, +
SS
*, -G
S**
*, -S
LN
mod
el a
djus
ted
R2 =0
.91,
P=0
.000
1, n
=15
-SA
L**
mod
el a
djus
ted
R2 =0
.37,
P=0
.003
, n=1
9 H
eigh
t
Junc
us
-S**
*, -S
AL,
+S
S**
, -P
m
odel
adj
uste
d R
2 =0.8
3, P
<0.0
001,
n=1
9 -S
**, -
SA
L**,
+S
S**
, -G
J*
mod
el a
djus
ted
R2 =0
.72,
P=0
.000
2, n
=19
Spa
rtina
-R
**, +
SLN
* m
odel
adj
uste
d R
2 =0.6
1, P
=0.0
01, n
=15
+ML*
**, +
R*,
-SA
L, -S
S**
, -G
S**
, +L*
**, -
SLN
***
mod
el a
djus
ted
R2 =0
.92,
P=0
.000
2, n
=15
Junc
us
-S, -
ML,
+S
S**
, +JL
N*
mod
el a
djus
ted
R2 =0
.52,
P=0
.02,
n=1
5 N
S, n
=19
Spa
rtina
Litt
er
-R**
, -S
S*
mod
el a
djus
ted
R2 =0
.40,
P=0
.006
, n=1
9 +F
**
mod
el a
djus
ted
R2 =0
.37,
P=0
.003
, n=1
9
Bio
mas
s
Junc
us L
itter
-S
**, +
SS
* m
odel
adj
uste
d R
2 =0.4
3, P
=0.0
05, n
=19
NS
, n=1
9
42

Tabl
e 3.
4. S
umm
ary
of re
sults
of m
ultip
le re
gres
sion
mod
els
pred
ictin
g ni
troge
n-co
nten
t of l
ive
and
litte
r por
tions
of S
parti
na a
nd
Junc
us in
con
trol a
nd fe
rtiliz
ed tr
eatm
ents
. S
ymbo
ls (*
, **
and
***
indi
cate
P<0
.05,
<0.
01, <
0.00
1 re
spec
tivel
y, a
nd n
o as
teris
ks fo
r 0.
15>P
>0.0
5) in
dica
te s
igni
fican
ce o
f ind
ivid
ual t
erm
s in
the
mod
el.
Ove
rall
mod
el a
djus
ted
R2 , P
-val
ues,
and
sam
ple
size
(n) a
re
give
n be
neat
h th
e lis
t of t
erm
s. A
ll m
odel
s ha
d M
allo
w’s
Cp<
p (th
e nu
mbe
r of p
aram
eter
s), e
xcep
t for
con
trol J
uncu
s lit
ter.
See
Ta
ble
3.3.
for a
bbre
viat
ions
.
C
ontr
ol
Fert
ilize
d
Spa
rtina
-S
*, +
JLB
*, -J
LN**
* m
odel
adj
uste
d R
2 =0.6
2, P
=0.0
03, n
=15
+ML*
*, +
R**
, -S
S**
, -S
LB**
, -G
S*
mod
el a
djus
ted
R2 =0
.77,
P=0
.002
, n=1
5
Junc
us
-R*,
-SLB
, +JL
B**
, -S
LN*
mod
el a
djus
ted
R2 =0
.75,
P=0
.000
9, n
=15
+SLN
* m
odel
adj
uste
d R
2 =0.2
5, P
=0.0
3, n
=15
Spa
rtina
Litt
er
-ML,
-SA
L**
mod
el a
djus
ted
R2 =0
.46,
P=0
.01,
n=1
5 N
S, n
=15
Junc
us L
itter
+J
LN**
m
odel
adj
uste
d R
2 =0.3
9, P
=0.0
08, n
=15
-S**
, +M
L, -S
AL*
*, +
SS
**, -
M*,
-JLN
*, -S
LN
mod
el a
djus
ted
R2 =0
.93,
P=0
.000
2, n
=15
43

Tabl
e 3.
5. S
umm
ary
of re
sults
of m
ultip
le re
gres
sion
mod
els
pred
ictin
g co
nsum
er d
ensi
ty a
nd b
iom
ass
and
graz
ing
dam
age
to
Spa
rtina
and
Jun
cus
plan
ts w
ithin
plo
ts o
f con
trol a
nd fe
rtiliz
ed tr
eatm
ents
. S
ymbo
ls (*
, **
and
***
indi
cate
P<0
.05,
<0.
01, <
0.00
1 re
spec
tivel
y, a
nd n
o as
teris
ks fo
r 0.1
5>P
>0.0
5) in
dica
te s
igni
fican
ce o
f ind
ivid
ual t
erm
s in
the
mod
el.
Ove
rall
mod
el a
djus
ted
R2 , P
-va
lues
, and
sam
ple
size
(n) a
re g
iven
ben
eath
the
list o
f ter
ms.
All
mod
els
had
Mal
low
’s C
p<p
(the
num
ber o
f par
amet
ers)
, exc
ept f
or
Litto
raria
den
sity
in fe
rtiliz
ed p
lots
and
Mel
ampu
s de
nsity
in c
ontro
l plo
ts. S
ee T
able
3.3
. for
abb
revi
atio
ns.
C
ontr
olFe
rtili
zed
Orc
helim
um
-L**
*, +
SS
* m
odel
adj
uste
d R
2 =0.4
8, P
=0.0
02, n
=19
-L**
, -M
* m
odel
adj
uste
d R
2 =0.3
2, P
=0.0
2, n
=19
Her
bivo
res
Par
oxya
+J
LN**
, +L*
**, +
M**
*, -S
S
mod
el a
djus
ted
R2 =0
.79,
P=0
.000
4, n
=15
+L*,
+G
J**
mod
el a
djus
ted
R2 =0
.40,
P=0
.006
, n=1
9
Fung
i (m
g/pl
ot)
-R**
*, -S
S*
mod
el a
djus
ted
R2 =0
.53,
P=0
.000
9, n
=19
+S*,
-R**
, -S
S
mod
el a
djus
ted
R2 =0
.38,
P=0
.02,
n=1
9 D
ecom
pose
rs
Fung
i (µg
/leaf
) N
S, n
=19
-R, +
SD
B*
mod
el a
djus
ted
R2 =0
.43,
P=0
.005
, n=1
9
Litto
raria
-J
LN, -
M**
*, -O
*, +
GS
**
mod
el a
djus
ted
R2 =0
.89,
P<0
.000
1, n
=15
-M**
*, -O
**
mod
el a
djus
ted
R2 =0
.63,
P=0
.001
, n=1
9 D
etrit
ivor
es
Mel
ampu
s -J
LN**
, - L
***,
+P
***
mod
el a
djus
ted
R2 =0
.90,
P<0
.000
1, n
=15
+JD
B**
, -S
DB
*, -L
***
mod
el a
djus
ted
R2 =0
.61,
P=0
.000
5, n
=19
Spa
rtina
N
S, n
=19
+O*
mod
el a
djus
ted
R2 =0
.16,
P=0
.05,
n=1
9 G
razi
ng
Dam
age
Junc
us
NS
, n=1
9 +P
* m
odel
adj
uste
d R
2 =0.2
8, P
=0.0
1, n
=19
44

Tabl
e 3.
6. S
umm
ary
of c
oeffi
cien
ts o
f var
iatio
n (C
V) o
f nat
ural
var
iatio
n ac
ross
site
s (c
ontro
l plo
ts, n
=19
site
s) a
nd o
f tre
atm
ents
(m
ean
of fe
rtiliz
ed p
lots
and
con
trol p
lots
acr
oss
site
s, n
=2 tr
eatm
ents
).
Nat
ural
Site
Var
iatio
n Tr
eatm
ent V
aria
tion
Rat
io o
f Site
:Tre
atm
ent
Varia
tion
Spa
rtina
Bio
mas
s 46
.6
70.3
0.
66
Junc
us B
iom
ass
38.5
27
.3
1.41
Sta
ndin
g D
ead
Spa
rtina
Bio
mas
s 73
.7
65.8
1.
12
Sta
ndin
g D
ead
Junc
us B
iom
ass
44.5
25
.5
1.75
Spa
rtina
N-C
onte
nt
22.3
20
.1
1.11
Junc
us N
-Con
tent
16
.2
9.8
1.65
Sta
ndin
g D
ead
Spa
rtina
N-C
onte
nt
26.8
15
.4
1.74
Sta
ndin
g D
ead
Junc
us N
-Con
tent
25
.7
6.7
3.84
Orc
helim
um D
ensi
ty
124.
1 68
.1
1.82
Par
oxya
Den
sity
15
4.2
28.1
5.
49
Fung
al B
iom
ass
(µg/
LOM
) 41
.1
6.1
6.74
Litto
raria
Den
sity
11
0.4
5.2
21.2
3
Mel
ampu
s D
ensi
ty
228.
9 9.
5 24
.09
Gra
zing
Dam
age
to S
parti
na
68.5
57.5
1.19
Gra
zing
Dam
age
to J
uncu
s88
.232
.62.
71
45
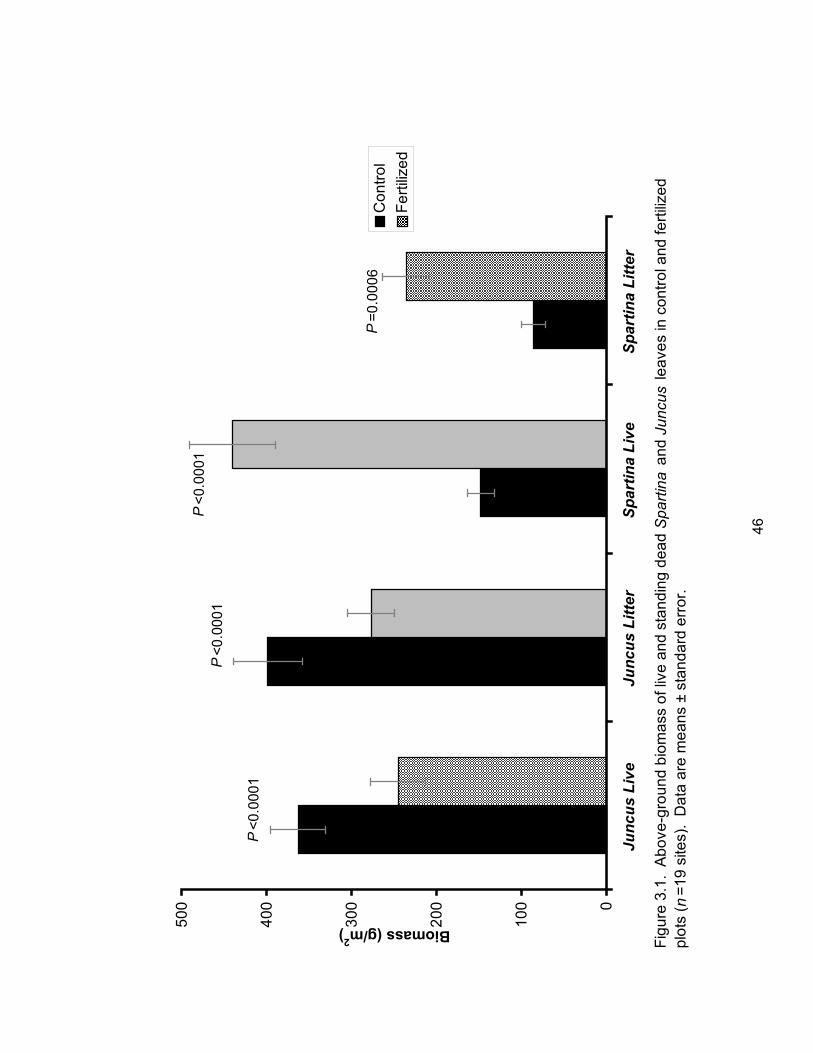
0
100
200
300
400
500
Junc
us L
ive
Junc
us L
itter
Spar
tina
Live
Spar
tina
Litte
r
Biomass (g/m2)
Con
trol
Figu
re 3
.1.
Abo
ve-g
roun
d bi
omas
s of
live
and
sta
ndin
g de
ad S
parti
na a
nd J
uncu
s le
aves
in c
ontro
l and
ferti
lized
pl
ots
( n=1
9 si
tes)
. D
ata
are
mea
ns ±
sta
ndar
d er
ror.
P<0
.000
1
P<0
.000
1P
<0.0
001
P=0
.000
6
Ferti
lized
46

010203040506070
Spar
tina
Junc
us
Percent Cover (%)
Con
trol
Figu
re 3
.2.
Per
cent
cov
er o
f liv
e S
parti
na a
nd J
uncu
s in
con
trol a
nd fe
rtiliz
ed p
lots
(n=1
7 si
tes)
. D
ata
are
mea
ns ±
st
anda
rd e
rror.
P<0
.000
1P
=0.0
008
Ferti
lized
47

020406080100
120
Spar
tina
Junc
us
Height (cm)
Con
trol
Figu
re 3
.3.
Hei
ght o
f liv
e S
parti
na a
nd J
uncu
s in
con
trol a
nd fe
rtiliz
ed p
lots
(n=1
9 si
tes)
. D
ata
are
mea
ns ±
sta
ndar
d er
ror.
P=0
.02
P<0
.000
1
Ferti
lized
48
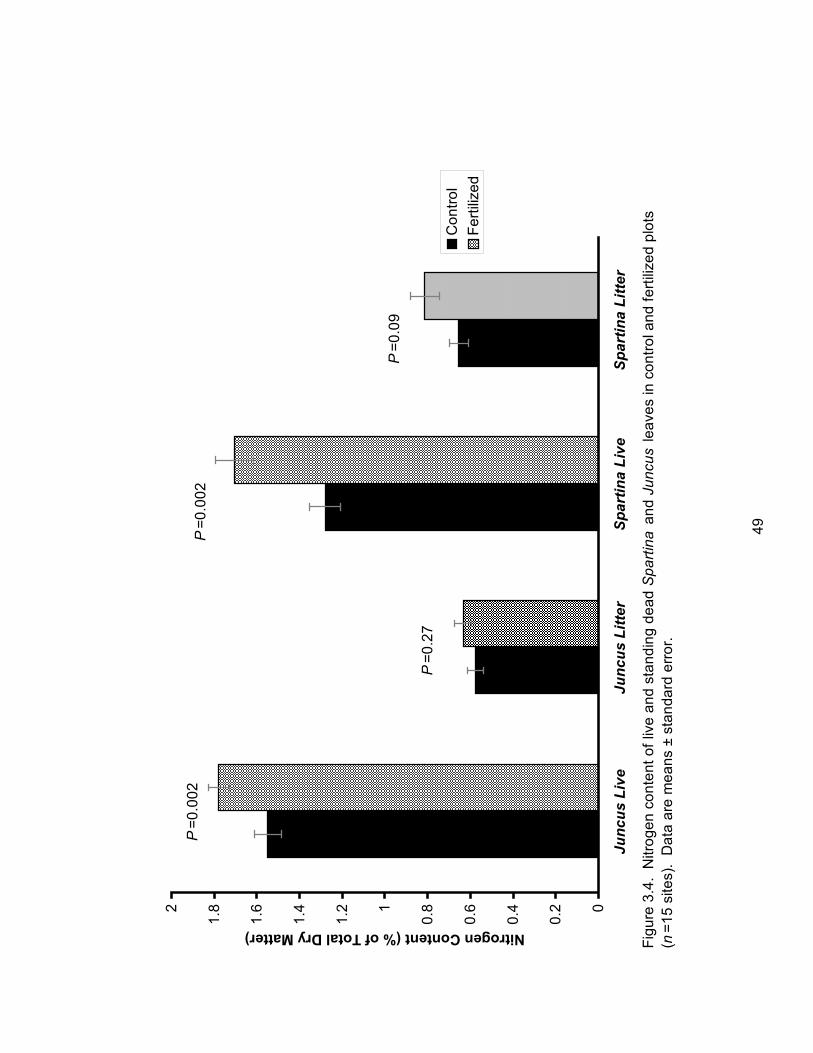
0
0.2
0.4
0.6
0.81
1.2
1.4
1.6
1.82
Junc
us L
ive
Junc
us L
itter
Spar
tina
Live
Spar
tina
Litte
r
Nitrogen Content (% of Total Dry Matter)
Con
trol
Figu
re 3
.4.
Nitr
ogen
con
tent
of l
ive
and
stan
ding
dea
d S
parti
na a
nd J
uncu
s le
aves
in c
ontro
l and
ferti
lized
plo
ts
(n=1
5 si
tes)
. D
ata
are
mea
ns ±
sta
ndar
d er
ror.
P=0
.002
P=0
.27
P=0
.002
P=0
.09
Ferti
lized
49

012345
Mel
ampu
sO
rche
limum
Paro
xya
Density (individuals/m2)
Con
trol P
lots
Figu
re 3
.5.
Den
sity
of M
elam
pus,
Orc
helim
um,a
nd P
arox
ya in
con
trol a
nd fe
rtiliz
ed p
lots
( n=1
9 si
tes)
. D
ata
are
mea
ns ±
sta
ndar
d er
ror.
P=0
.51
P=0
.000
9
P=0
.27
Ferti
lized
Plo
ts
50
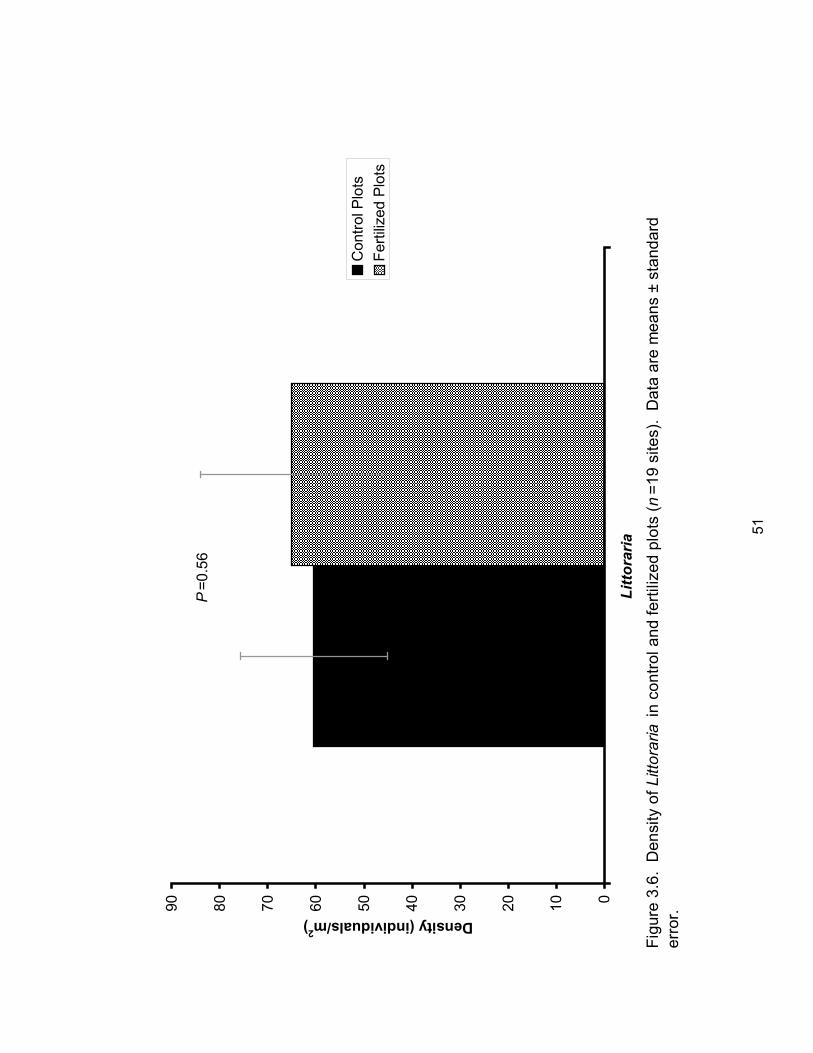
0102030405060708090
Litto
raria
Density (individuals/m2)
Con
trol P
lots
P=0
.56
Figu
re 3
.6.
Den
sity
of L
ittor
aria
in c
ontro
l and
ferti
lized
plo
ts (n
=19
site
s).
Dat
a ar
e m
eans
± s
tand
ard
erro
r.
Ferti
lized
Plo
ts
51

0123456
Orc
helim
um/S
part
ina
Paro
xya/
Junc
us
Ratio of Grasshopper Denstiy:Host Plant Biomass
Con
trol
Ferti
lized
P=0
.52
P=0
.04
Figu
re 3
.7.
Rat
io o
f Orc
helim
um d
ensi
ty to
Spa
rtina
bio
mas
s an
d P
arox
ya d
ensi
ty to
Jun
cus
bio
mas
s in
con
trol a
nd
ferti
lized
plo
ts (n
=19
site
s).
Dat
a ar
e m
eans
± s
tand
ard
erro
r.
52

050100
150
200
250
300
350
400
450
Fung
al B
iom
ass
(leaf
, µg/
g)Fu
ngal
Bio
mas
s (p
lot)
Ergosterol (µg/g or mg/m2)
Con
trol
Figu
re 3
.8.
Fung
al b
iom
ass
in le
aves
of s
tand
ing-
dead
Spa
rtina
rep
orte
d as
erg
oste
rol o
n a
per l
eaf (
LOM
) and
per
pl
ot b
asis
(n=1
9 si
tes)
. D
ata
are
mea
ns ±
sta
ndar
d er
ror.
P=0
.28
P<0
.000
1
Fung
al B
iom
ass
(plo
t, m
g/m
2 )
Ferti
lized
53

024681012
Gra
zing
Dam
age
to J
uncu
sG
razi
ng D
amag
e to
Spa
rtin
a
Percent of Plant Damaged
Con
trol P
lots
Figu
re 3
.9.
Gra
zing
dam
age
by g
rass
hopp
ers
to le
aves
of l
ive
Spa
rtina
and
Jun
cus
in c
ontro
l and
ferti
lized
plo
ts
( n=1
9 si
tes)
. D
ata
are
mea
ns ±
sta
ndar
d er
ror.
P<0
.000
1
P=0
.000
1
Gra
zing
Dam
age
to S
part
ina
G
razi
ng D
amag
e to
Jun
cus
Ferti
lized
Plo
ts
54

010203040506070
Orc
helim
umPa
roxy
a
Plant Consumption (mm2)
Con
trol
Figu
re 3
.10.
Con
sum
ptio
n of
Spa
rtina
lea
ves
by O
rche
limum
and
Junc
us l
eave
s by
Par
oxya
dur
ing
two-
choi
ce
feed
ing
assa
ys (n
=15
repl
icat
es).
Dat
a ar
e m
eans
± s
tand
ard
erro
r.
P=0
.68
P=0
.94
Ferti
lized
55

05101520253035404550
Litto
raria
Arm
ases
Spartina litter Consumption (mg)
Con
trol
Figu
re 3
.11.
Con
sum
ptio
n of
Spa
rtina
litt
er b
y Li
ttora
ria a
nd A
rmas
es d
urin
g tw
o-ch
oice
feed
ing
assa
ys (n
=15
repl
icat
es).
Dat
a ar
e m
eans
± s
tand
ard
erro
r.
P=0
.46
P=0
.47
Ferti
lized
56

0
0.1
0.2
0.3
0.4
0.5
0.6
0.7
0.8
0.9
Litto
raria
Mel
ampu
s
Growth (mm)
Spar
tina
Con
trol
Spar
tina
Ferti
lized
Junc
us F
ertil
ized
Figu
re 3
.12.
Gro
wth
of L
ittor
aria
and
Mel
ampu
s fe
d ei
ther
a c
ontro
l or f
ertil
ized
ste
m o
f Spa
rtina
or l
eaf o
f Jun
cus
litte
r (n
=15
repl
icat
es,
N=2
40).
Dat
a ar
e m
eans
± s
tand
ard
erro
r.
Pla
nt S
peci
es, P
=0.1
1Tr
eatm
ent,
P=0
.44
Pla
nt S
peci
es x
Tre
atm
ent,
P=0
.63
Pla
nt S
peci
es, P
<0.0
001
Trea
tmen
t, P
=0.8
6P
lant
Spe
cies
x T
reat
men
t, P
=0.7
5
Junc
us C
ontro
l
57

y =
-1.4
959x
+ 1
10.2
4R
2=
0.56
, P =
0.0
02
y =
-1.8
414x
+ 1
43.8
7R
2=
0.40
, P =
0.0
04
y =
-1.6
724x
+ 1
68.6
4R
2=
0.43
, P =
0.0
02
y =
-1.7
385x
+ 1
75.0
2R
2=
0.42
, P =
0.0
03
20406080100
120
140
2530
3540
4550
55
Salin
ity (p
pt)
Height (cm)
Con
trol S
parti
naFe
rtiliz
ed S
parti
naC
ontro
l Jun
cus
Ferti
lized
Jun
cus
Figu
re 3
.13.
Rel
atio
nshi
p of
sal
inity
to h
eigh
t of l
ive
Spa
rtina
and
Jun
cus
in c
ontro
l and
ferti
lized
plo
ts (n
=19
site
s).
Dat
a ar
e si
te m
eans
for e
ach
spec
ies.
58

y =
-0.6
506x
+ 2
.289
R2=
0.33
, P =
0.0
3
0.81
1.2
1.4
1.6
1.82
11.
21.
41.
61.
82
2.2
Junc
us N
-Con
tent
(% o
f Dry
Wt)
Spartina N-Content (% of Dry Wt)
Figu
re 3
.14.
Rel
atio
nshi
p of
live
Jun
cus
N-c
onte
nt to
live
Spa
rtina
N-c
onte
nt in
con
trol p
lots
(n=1
9 si
tes)
. D
ata
are
site
mea
ns fo
r eac
h sp
ecie
s.
59

y =
0.99
3x -
0.06
23R
2=
0.31
, P =
0.0
3
1
1.2
1.4
1.6
1.82
2.2
2.4 1.
21.
41.
61.
82
2.2
Junc
us N
-con
tent
(% o
f Dry
Wt)
Spartina N-content (% of Dry Wt)
Figu
re 3
.15.
Rel
atio
nshi
p of
live
Jun
cus
N-c
onte
nt to
live
Spa
rtina
N-c
onte
nt in
ferti
lized
plo
ts (n
=19
site
s).
Dat
a ar
e si
te m
eans
for e
ach
spec
ies.
60

y =
-0.2
343x
+ 1
.888
R2=
0.18
, NS
y =
-0.1
783x
+ 0
.960
3R
2=
0.42
, P =
0.0
03
0
0.51
1.52
2.53
01
23
45
6
Ln L
ittor
aria
Den
sity
(per
m2 )
Orchelimum Density (per m2)
Ferti
lized
C
ontro
l
Figu
re 3
.16.
Rel
atio
nshi
p of
Orc
helim
um d
ensi
ty to
the
natu
ral l
og o
f Litt
orar
ia d
ensi
ty in
con
trol a
nd fe
rtiliz
ed p
lots
(n
=19
site
s).
Dat
a ar
e si
te m
eans
for e
ach
spec
ies.
61

y =
-0.4
936x
- 37
.113
R2=
0.22
, P =
0.0
5
y =
-0.2
851x
- 45
.079
R2=
0.39
, P =
0.0
05
050100
150
200
250 -4
00-3
50-3
00-2
50-2
00-1
50-1
00
Red
ox (m
V)
Ergosterol (mg/m2 Spartina litter)
Ferti
lized
C
ontro
l
Figu
re 3
.17.
Rel
atio
nshi
p of
fung
al b
iom
ass
on a
per
plo
t bas
is to
redo
x in
con
trol a
nd fe
rtiliz
ed p
lots
(n=1
9 si
tes)
. D
ata
are
site
mea
ns .
62

y =
-1.2
775x
+ 3
.802
6R
2=0
.47,
P =
0.0
01
y =
-1.0
701x
+ 3
.748
7R
2=0
.37 ,
P =
0.0
06
0123456
00.
51
1.5
22.
53
3.5
Ln M
elam
pus
Den
sity
(per
m2 )
Ln Littoraria Density (per m2)
Con
trol P
lots
Ferti
lized
Plo
ts
Figu
re 3
.18.
Rel
atio
nshi
p be
twee
n th
e na
tura
l log
of L
ittor
aria
and
Mel
ampu
s d
ensi
ties
in c
ontro
l and
ferti
lized
plo
ts
( n=1
9 si
tes)
. D
ata
are
site
mea
ns fo
r eac
h sn
ail.
63

y =
0.95
77x
+ 2.
9599
R2=
0.32
, P =
0.0
1
y =
2.13
31x
+ 8.
4628
R2=
0.21
, P =
0.0
5
02468101214161820
01
23
45
67
8
Gra
ssho
pper
Den
sity
(per
m2 )
Grazing Damage (%)
Junc
us /
Par
oxya
Spa
rtina
/ O
rche
limum
Figu
re 3
.19.
Rel
atio
nshi
p of
gra
zing
dam
age
to J
uncu
s a
nd S
parti
na to
Par
oxya
and
Orc
helim
um d
ensi
ty in
fe
rtiliz
ed p
lots
(n=1
9 si
tes)
. D
ata
are
site
mea
ns fo
r eac
h sp
ecie
s . 64

With
Out
llier
y =
-3.6
123x
+ 1
49.3
3R
2=0
.28
P=0
.04
With
out O
utlie
ry
= -0
.940
9x +
54.
289
R2=0
.05
P=0
.45
-130
-110-9
0
-70
-50
-30
-101030
2530
3540
4550
55
Salin
ity (p
su)
Consumption Effect (mg)
Figu
re 3
.20.
Rel
atio
nshi
p of
site
sal
inity
to th
e co
nsum
ptio
n e
ffect
(diff
eren
ce in
con
sum
ptio
n be
twee
n co
ntro
l (C
)and
fe
rtiliz
ed (F
) litt
er, F
-C) o
f Spa
rtina
litte
r by
Arm
ases
in la
bora
tory
pai
red
feed
ing
trial
s ( n
=15
site
s).
Dat
a ar
e si
te
mea
ns .
65

CHAPTER IV
DISCUSSION
The fertilization treatment had broad impacts on the marsh food web. The major
findings of this study were: 1) with fertilization, the normally-subordinate plant Spartina
outcompeted the normally-dominant plant Juncus over a broad range of environmental
conditions, although abiotic conditions attributed to “sitescore” (upland influence) limited the
extent of this effect, because greater upland influence benefited Juncus at Spartina’s expense;
2) the major salt-marsh herbivores were more responsive than the detritivores to fertilization, but
were primarily affected by plant quantity rather than quality, 3) populations of marsh detritivores
differed strongly among sites, perhaps reflecting differences in larval settlement and post-larval
survivorship, but did not differ among treatments (perhaps because litter quality did not change
much) and lastly, 4) detritivore growth was not influenced by litter quality, but was influenced by
plant species. Below I discuss each of these results, and then compare, for all variables, the
overall effect of fertilization versus natural spatial variation.
PLANT GROWTH
Under normal conditions in the high marsh, Spartina alterniflora is competitively
subordinate to Juncus roemerianus (Pennings et al. 2002, 2003). Yet under fertilized
conditions, Pennings et al. (2002) found that Spartina biomass increased and Juncus biomass
decreased at a site in Georgia, suggesting that the competitive hierarchy was reversed. In AL
and MS, however, where tidal regimes and soil properties differed from those in GA, they found
no changes or slight increases in Juncus biomass, despite large increases in Spartina biomass
(Pennings et al. 2002). These results suggest that caution should be taken when extrapolating
results across larger environmental gradients. The difference between the New England
fertilization studies (Levine et al. 1998, Emery et al. 2002), which consistently found that
66

fertilization led to a decrease in the normally-dominant high-marsh species, and the
southeastern study (Pennings et al. 2002), which did not always find decreases of high-marsh
species, suggested the hypothesis that the extent of displacement of Juncus by Spartina is
controlled by environmental factors. The current study, which utilized sites that varied widely in
environmental conditions, was designed to test this hypothesis.
Consistent with the GA results of the Pennings et al. (2002) study, I found that in
fertilized plots, Spartina biomass increased strongly, and Juncus biomass decreased. Spartina
is nitrogen limited (Valiela and Teal 1974, Gallagher 1975, Smart and Barko 1980), and all
previous fertilization studies have found that biomass increases strongly when nitrogen is
experimentally added (Levine et al. 1998, Emery et al. 2002, Pennings et al. 2002). In this
study, the increase in Spartina biomass was driven by increases in both percent cover and
height. In contrast, although Juncus decreased in biomass, this was due to a reduction in
percent cover; Juncus height actually increased slightly in fertilized treatments, suggesting that
the fertilizer was not directly toxic. Although this study did not explicitly measure competitive
effects, the most reasonable explanation for the decrease in Juncus biomass is that it declined
in the face of increasing competition from Spartina. This explanation is consistent with previous
studies in New England, which have suggested that the competitive hierarchy between Spartina
alterniflora and Spartina patens is reversed (to favor S. alterniflora) when nitrogen is added
(Levine et al. 1998, Emery et al. 2002).
Salinity is one environmental factor that is known to negatively influence marsh plant
productivity in monoculture (Smart and Barko 1980, Haines and Dunn 1985, Howes et al. 1986).
Salinity also interacts with competition to control many aspects of marsh plant community
structure (Bertness and Ellison 1987, Bertness 1991a, Pennings and Callaway 1992, Bertness
and Hacker 1994, Greiner La Peyre et al. 2001, Pennings and Moore 2001). Pennings et al.
(2002) speculated that the impact of nutrient additions on plant community structure might vary
across a gradient of salinity. Although I found that salinity was negatively correlated with
67

Spartina biomass in fertilized plots, it was not a highly-significant predictor, nor was it included in
any of the other 7 biomass models (live and standing-dead). In contrast salinity was the most
important predictive variable in models of plant height. The effect of salinity on height, however,
did not differ between fertilization treatments (the lines in Fig. 3.13 are nearly parallel), which
lead me to reject the hypothesis that salinity would mediate fertilization effects.
The most consistent predictor of plant growth factors (occurring in 8/13 significant
models) was not salinity but rather “sitescore”, a variable that reflected the nature of the border
between the marsh and the upland. Spartina biomass decreased and Juncus biomass
increased at sites that were increasingly surrounded by upland. A similar result was found in a
more extensive survey of 55 sites within the same geographic region (Buck and Pennings, pers.
comm.). The mechanism by which adjacent upland habitats benefit Juncus at the expense of
Spartina was not investigated here, but could be driven by impacts on the water table or delivery
of dissolved materials in groundwater. Though high sitescore affected overall biomass
differentially between species, both species were taller at sites with high sitescores. Because a
high sitescore was not bad for Spartina per se (i.e. Spartina grew taller), this suggests that
Juncus outcompeted Spartina at sites with greater upland influence. The mechanism of this
competition was not investigated here, but likely involves some combination of shading and
belowground preemption of the rooting zone (Brewer 2003).
Models predicting plant cover, height, and biomass included a number of additional
predictor variables. The nature of some of these relationships is obscure, and all must be
interpreted with caution given the potential pitfalls of multiple regression (Graham 2003), but in
several cases the relationships accord with our understanding of the ecology and physiology of
Spartina and Juncus. “Soil” and grazing damage were included in at least 50% of the significant
multiple regression models predicting live plant growth (percent cover, height, biomass), and
made the most sense biologically. The consistent negative relationship to “soil” across growth
parameters, treatment, and species indicates a reduction in growth where bulk density was
68

high, and organic matter content and proportion silt + clay content were low. This finding is in
accordance with the finding of Pennings et al. (2002) that fertilization responses were weak in
plant community mixtures where bulk densities were higher and organic contents lower (i.e. the
Borrichia-Juncus -Batis mixture). Greater organic matter in the soil likely benefits plants through
offering a suite of nutrients including nitrogen and phosphorous, thereby increasing the soil
quality to the plant (Padget and Brown 1999, McLaughlin et al. 2000). Morphologic features of
salt marsh plants related to growth (i.e. greater height, leaf size, and leaf number) are often
associated with higher soil organic content (Richards et al. in revision). Similarly, silt and clay
hold nutrients better than sand in salt marshes (Eleuterius and Caldwell 1985). On the other
hand, a positive relationship between plant growth variables and organic matter and silt + clay
content could also be due to greater decomposing plant biomass on the soil surface at sites
where inundation is less frequent (Hackney and de la Cruz 1980, Craft et al. 1988). Because
the “soil” variable was more important in control models, it suggests that either N-mineralization
of plant material was more important when there was a nitrogen deficiency, because fertilization
actually inhibits N-mineralization rates of organic matter in some wetland soils due to a
subsequent carbon-deficiency of soil microorganisms (McLaughlin et al. 2000), or simply that
soil nitrogen does not matter when nitrogen is added in excess.
Grazing damage was negatively correlated with live plant growth variables, suggesting
that top-down influences are important determinants in the success of both species (Parson and
de la Cruz 1980, Bertness et al. 1987, Gough and Grace 1998, Silliman and Zieman 2001).
Conversely, detritivores did not enter into biomass models of dead plants, suggesting that they
do not strongly affect standing crops of dead biomass, at least across the range of conditions
studied. Instead, dead biomass models had similar environmental variables to models for live
biomass, suggesting a reflection (i.e. more live biomass = more litter biomass). My original
models for dead biomass did not consider live biomass as a possible predictor variable;
however, if live biomass is included, it is usually the most important predictor, and the fit of the
69

models improve sharply (Control Spartina: R2=0.22, P=0.04; Control Juncus: R2=0.63,
P<0.0001; Fertilized Spartina: R2=0.16, P=0.09; Fertilized Juncus: R2=0.51, P=0.0006).
PLANT NITROGEN CONTENT
As expected (Vince et al. 1981, Gratton and Denno 2003), both plant species increased
in tissue N-content when fertilized. On the other hand, dead plant material did not differ in N-
content between treatments, although there was a trend towards higher nitrogen content in
fertilized plots, as found in other studies (Valiela et al. 1984, 1985). In contrast, Valiela et al.
(1984) found much greater increases in N-content of fertilized litter than in this study (approx.
3% tissue N-content in their study vs. 1.7% in this study in fertilized plots). This difference was
likely due to geographical and methodological differences: First, their study took place in a New
England salt marsh, and northern Spartina has a higher N-content than southern Spartina
(Siska et al. 2002). Second, I studied standing dead litter, but Valiela et al. (1984) used litter
bags on the soil surface, an approach which does not mimic natural marshgrass decay and thus
would differ from standing dead litter due to differential access to soil nutrients, light, wetness,
detritivore activity, and microbial flora (Newell 1993). The lack of a treatment effect on nitrogen
content of standing dead material may have occurred because nutrients were resorbed to living
portions before leaves and stems senesced (Hopkinson and Schubauer 1984, Kemp et al.
1990), leached into the water during tidal submergence (Valiela et al 1985) or periods of high
rainfall (Newell 2001c), and/or were scavenged by ascomycetous decomposers (Valiela et al.
1985 (high marsh results), Newell 1993, Newell et al. 1996b) with subsequent removal of fungal
mass by mycophagous invertebrates (Graca et al. 2000). It is also likely that, despite attempts
to standardize the collection protocol, the dead plant material was in a range of different decay
stages, which would have influenced detrital chemistry and nutrient dynamics (Rice and Tenore
1981, Rice 1982, Valiela et al. 1984, 1985, Newell et al. 1996b).
Comparing across sites, the best predictor of N-content of living plants was the N-
content of the opposite species, but the nature of this relationship differed between treatments.
70

These relationships shed insight into competitive interactions between Spartina and Juncus that
agree with previous fertilization studies that have suggested that there is reduced belowground
competition in fertilized plots (Levine et al. 1988, Emery et al. 2001, but see Brewer 2003). In
control plots, there was an inverse relationship between the N-contents of Spartina and Juncus,
suggesting belowground competition for nitrogen was taking place, as indicated by several
previous studies (Levine et al. 1988, Brewer et al. 1988, Emery et al. 2001). Conversely, in
fertilized plots, there was a positive relationship, suggesting a lack of belowground competition
when nutrient stress was alleviated (i.e. both plants receive excess nitrogen in fertilized plots),
possibly leading to a shift to greater aboveground competition, as suggested by New England
studies (Emery et al. 2001, Levine et al. 1998). Spartina growth is strongly limited by nitrogen
and responds to fertilization with greater aboveground biomass, whereas Juncus growth is not
nitrogen-limited, likely because it is already at the asymptote of the nitrogen response curve
(Gallagher 1975, Gallagher et al. 1980). In New England, Spartina alterniflora grew taller under
nutrified conditions, shading the usually-dominant plant Spartina patens; likewise, in other
pairwise mixtures, the usually-subordinate species overtopped usually-dominant species
(Levine et al.1998, Emery et al. 2001). In contrast, this study did not suggest that light limitation
of the usual-dominant Juncus occurred (at least not to the extent that northern studies found)
because although Spartina did experience a more substantial height increase than Juncus in
fertilized plots, it was never taller than Juncus. Furthermore, the major predictor of plant growth,
sitescore, did not have differing effects on the 2 species heights, but did have differing effects
on their biomass, indicating that aboveground competition in this study might be more lateral
than vertical.
Because Spartina did not grow as tall as Juncus in this study, I suggest that
aboveground competition was mediated by their different growth forms. The relationships of
plant biomass to N-content of each species in multiple regression models may derive from
morphological differences and fertilization responses of each species. The N-content of
71

Spartina and Juncus in control plots was positively related to live Juncus biomass, but the N-
content of Spartina in fertilized plots was negatively related to its own biomass. In other words,
increases in Spartina biomass in fertilized plots diluted its N-content, whereas N-content of
Juncus did not decrease where its biomass was greater (indicated by the positive relationship
between live Juncus N-content and biomass in the control model). Similarly, other studies have
indicated that C:N ratios of Juncus remain approximately equal under fertilized conditions
despite increases in biomass (Gallagher 1975) and that % tissue N remains relatively constant
throughout the growing season despite seasonal spikes in biomass (Gallagher et al. 1980).
Conversely, these studies found the opposite for Spartina following peaks in aboveground
growth, i.e. C:N ratios were higher a year after fertilization, and nitrogen content decreased
during the growing season (Gallagher 1975, 1980). These findings may derive from differences
in guerilla and turf morphologies, respectively (Harper 1977, Bertness 1999). In particular,
Spartina expands rapidly along runners when fertilized, with a disproportionately lower
investment into underground biomass (Gallagher 1975, Valiela et al. 1976, Smart and Barko
1980), but Juncus typically invests more into underground than aboveground biomass (Brewer
et al. 1998) Thus, in control plots where Spartina biomass was inhibited by competition from
Juncus, its N-content was high, whereas in fertilized plots the increase in aboveground growth
diluted its N-content. The expected concomitant reduction in belowground growth of Spartina
(Gallagher 1975, Valiela et al. 1976, Smart and Barko 1980) likely contributed to the diluted N-
content through reduced nutrient acquisition. On the other hand, Juncus N-content was not
diluted by its own biomass, evident by the positive association of N-content to biomass in
control plots (where Juncus biomass was not reduced). Because underground biomass was
increased along with aboveground biomass (Brewer et al. 1998), nutrient acquisition was not
likely limited when there was greater aboveground growth. Additionally, the lack of abscission
in leaves for long periods of time and a nearly constant production:biomass ratio contribute to
nutrient conservation by Juncus (Kruczynski et al. 1978, Christian et al. 1990).
72

The best overall predictor of N-content of standing-dead litter was a negative relationship
with salinity in a majority of the significant models (control standing-dead Spartina litter and
fertilized standing-dead Juncus litter). Because live plants use nitrogen-based compounds in
osmoregulation (Cavalieri and Huang 1981), it may have been that more nitrogen was resorbed
from standing-dead litter when salinity was high than when it was low. Salinity, however, was
not correlated with live plant nitrogen as one might expect based on the role of nitrogen in
osmoregulation. Thus, other factors may be more important than salinity in mediating live plant
nitrogen content, at least when comparing among sites.
HERBIVORE DENSITY AND FOOD SELECTION
Most studies that have examined fertilization effects on herbivores have found that
herbivore densities are elevated in plots with increased plant biomass and N-content (Vince et
al. 1981, Bernays and Barbehenn 1987, Denno et al. 2002, Gratton and Denno 2003). Because
herbivores face a general problem of inadequate nitrogen in their food plants (White1978,
1993), plants with higher nitrogen content should, in theory, be better foods. Vince et al. (1981)
argued that the C:N ratios of marsh plants were barely sufficient to meet the nutritional needs of
herbivores, and thus that food quality could set their growth rate (also see Fox and Maccauley
1977). In many studies, however, impacts of fertilization on plant quantity and quality are
confounded. I examined effects on quality separately from quantity, to determine which was
most important.
In this study, the univoltine grasshoppers Orchelimum and Paroxya responded
differently to fertilization. Orchelimum increased significantly in fertilized plots, corroborating
results of an earlier experiment with the same species (Stiling et al. 1991), but Paroxya did not
increase. Because biomass of Spartina increased, but Juncus biomass decreased, I examined
the ratio of herbivore density: plant biomass (I expected it to increase if herbivores responded to
plant quality, stay the same if herbivores responded to biomass, or decrease if they did not
respond to either). There was a significant effect of treatment on this ratio for Paroxya,
73

suggesting that it responded to plant quality in the field, but there was no significant effect of
treatment on the ratio for Orchelimum suggesting that its density was roughly proportional to
plant biomass regardless of treatment. In other words, Orchelimum densities increased in
fertilized plots because of changes in plant biomass, not plant quality.
On the other hand, grazing damage was significantly greater to both species of plants in
the fertilized versus control plots, suggesting that grasshoppers were feeding on fertilized plants
at higher rates than would be expected based on biomass. This likely is incorrect, because
laboratory studies indicated that grasshoppers did not preferentially feed on fertilized plants (see
below). An alternate explanation for the fact that grasshopper damage to Spartina was greater
(per unit plant biomass) in fertilized plots than would be expected by the ratio of Orchelimum to
Spartina (which did not change between treatments) would be that I under-counted
grasshoppers in the lusher fertilized plots, where it would have been more difficult to see every
grasshopper. If this is correct, it would mean that both grasshoppers could have been more
abundant than I realized in fertilized plots, which would mean that ratios of grasshoppers to
host-plant biomass would have actually been greater in fertilized than control plots for both
species. Alternatively, grasshoppers feeding on fertilized plants may have been able to satisfy
their nutritional requirements in a shorter time (Valentine and Heck 2001), and thus may have
spent more time outside of plots where they would not have been counted.
Although grasshoppers did more damage to fertilized than control plants in the field,
feeding choice experiments in the laboratory suggested that they did not select food based on
quality. Other studies have had mixed success in predicting food selection solely on nitrogen,
and have suggested that choice of food is controlled by multiple factors including the herbivore’s
current developmental phase, nutritional needs, and a variety of plant physical properties
(Chapman and Joern 1990, Pennings et al. 1998, Buck et al. 2003). Neither species of
grasshopper significantly preferred to eat the fertilized plant over the control plant when given a
leaf of each, in side-by-side comparisons. Moreover, multiple regression analyses suggested
74

that neither salinity nor nitrogen content (two of the factors most likely to influence herbivory in
estuarine systems, Vince et al. 1981, Lightfoot and Whitford 1987, Waring and Cobb 1992,
Bowdish and Stiling 1998, Pennings et al. 1998, Moon and Stiling 2002) was correlated across
sites with grasshopper grazing damage. Some studies have suggested that leaf-chewing
insects, such as the grasshoppers I studied, may not be as responsive as sap-sucking insects
are to increased foliar nitrogen (Vince et al. 1981, Lightfoot and Whitford 1987), so it is possible
that the grasshoppers responded primarily to plant quantity (or some component of biomass, i.e.
percent cover, height), rather than to quality. It is likely that biomass provides a positive visual
cue for grasshopper feeding (Chapman and Joern 1990), through color (Bernays and Wrubel
1985) or shape (Mulkern 1967), with a secondarily evolutionary significance, i.e. it invites
grasshoppers to feed on healthier, higher quality plants. Arguably, the strong increase in
Spartina biomass was sufficient to cause an increase in Orchelimum densities, whereas the
decrease in Juncus biomass was too modest to signficantly affect Paroxya densities.
Alternatively, grasshoppers may have been cued by plant height, rather than biomass per se,
but again the modest changes in Juncus height may not have been enough to affect Paroxya
densities. Regardless, grasshopper damage was likely greater to plants in fertilized plots
because more grasshoppers were attracted to the plots by high plant biomass, rather than
because grasshoppers were attracted to the plots by higher palatability of plants.
Regression models exploring site-to-site variation in grasshopper densities were similar
for the two species. Within treatments, neither grasshopper was strongly correlated to N-
content or biomass of the species of plant that they consumed. Thus, factors other than plant
quantity or quality appear to explain site-to-site variation in grasshopper densities. Densities of
both grasshoppers were correlated with Littoraria density, but in different ways and likely for
different reasons. Orchelimum density was negatively correlated with Littoraria density, likely
because the snails wound plants and promote invasion by ascomycete decomposers, hastening
plant death (Silliman and Zieman 2001, Silliman and Bertness 2002, Silliman and Newell 2003).
75

Thus, it is possible that Orchelimum and Littoraria compete for Spartina. In contrast, Paroxya
density was positively correlated with Littoraria density, but the association was not strong and
Littoraria was not a significant predictor unless Juncus N-content and Melampus density were
also included in the model. Thus, it is likely that some other factor associated with Littoraria that
was not measured (perhaps some aspect of landscape position) was influencing Paroxya
density. Because the two species of grasshopper feed on different plants, it is not likely that
they would directly compete with each other, and in fact, neither species was a significant
predictor of the others’ density.
DECOMPOSER BIOMASS
Previous work has suggested that, in Spartina, fungal biomass per gram of standing-
dead leaf material is positively associated with leaf nitrogen content and sufficient water
availability (Newell et al.1996b, 1998), but that excessive tidal submergence and persistent
wetting is inversely related to fungal biomass (Newell et al. 1996b, Newell 2001c). I found no
effect of fertilization on fungal biomass (µg ergosterol/g LOM), likely because the fertilization
treatment did not significantly increase the nitrogen content of standing-dead leaves. The trend,
however, was toward greater in leaves in fertilized plots, as would be expected. In contrast, if
fungal biomass is examined on the scale of the plot (taking into account the increase in
standing-dead Spartina biomass with fertilization), fungal biomass (mg ergosterol/m2 of Spartina
litter) was much greater in fertilized plots.
Multiple regression analyses suggested that the variation in fungal biomass per plot
between sites was due to a negative relationship with redox and sitescore. These relationships
held in both treatments. Because low redox values in the soil would directly affect Spartina
rather than leaf fungi, it is likely that the increased fungal biomass in plots with highly-reduced
soils was driven primarily by the increase in standing-dead biomass in these plots. The
relationship between redox and standing-dead biomass, however, was only significant in control
plots. Similarly, because standing-dead Spartina biomass was greater where sitescore was low
76

(reduced upland influence), increased fungal biomass in plots with low sitescore values is a
likely a product of increased standing-dead biomass in these plots, rather than a direct effect of
sitescore on fungi.
Although only the fertilized model was significant for fungal biomass per leaf, it
reaffirmed the importance of low redox values and more importantly established a direct
association between increased fungal biomass per leaf and increased Spartina litter biomass
(as indirectly indicated in the fungal biomass per plot models), possibly because of greater
success of spores reaching new substrate. Spore expulsion rates for salt marsh fungi exhibit
extreme spatial patchiness (Newell and Zakel 2000, Newell 2001b), and this may be an
adaptation to maximize colonization on newly dead plant material as it becomes available
(Newell and Zakel 2000). Therefore, areas with greater standing dead Spartina might be
expected to allow more successful colonization of spores. Most importantly, consumers
examined in this study did not enter any of the fungal biomass models, suggesting that they did
not impact fungal accumulation across the range of environmental conditions in this study,
though previous findings in the lab have indicated that Littoraria can suppress and Melampus
can enhance fungal growth rates (Graca et al. 2000). It is possible that this laboratory result
does not predict patterns in the field (this study, Newell 2001c) where litter biomass: snail ratios
are typically higher than those used by Graca et al. (2000) (which could prevent the snails from
depressing fungal standing crops), or that I inadvertently chose leaves for fungal samples that
were less damaged by snail grazing. Further, snails are not the only grazers on marshgrass
fungi; marsh squareback crabs (Armases sp.), amphipods, and likely mites, collembolans, and
other meiofauna also ingest fungal material (Newell 1996, Newell, pers. comm.), and might
positively influence microbial production (as amphipods do, Graca et al. 2000), offsetting any
negative impacts I might have seen by snail grazers on fungal accumulation.
77

DETRITIVORE DENSITY, FOOD SELECTION, AND GROWTH RATE
In the absence of predation, Littoraria recruitment, growth, and consumption is greater in
the nitrogen-rich, tall-form Spartina than in the nitrogen-poor, short-form zone (Silliman and
Zieman 2001, Silliman and Bertness 2002). Under natural conditions, however, snails are
seldom located along tidal creeks where tall-form Spartina grows (pers. obs., Smalley 1958,
Bishop and Hackney 1987, Fierstien and Rollins 1987, Burnham and Fell 1989, Spelke et al.
1995). A number of factors differ between the creekbank and mid-marsh zones, including tidal
submergence, predation pressure, plant height, plant nitrogen content and plant phenolic
content (Bushsbaum 1984, Howes et al. 1986, Kneib 1997, Bowdish and Stiling 1998,
Mendelssohn and Morris 2000, Pennings and Bertness 2001), and no studies have determined
whether snail densities are directly affected by plant nitrogen content per se. In contrast,
predators (particularly blue crabs and mummichogs) are known to have strong impacts on the
abundance and distribution of both Littoraria and Melampus (Hamilton 1976, Vince et al. 1976,
Williams 1984, Joyce and Weisberg 1986, Silliman and Bertness 2002). Predation pressure
from crabs and fish tends to be least in higher tidal reaches (Kneib 1984, Kneib 1997). For
example, Silliman and Bertness (2002) found that Littoraria density was strongly regulated by
predation in the low marsh (i.e. 98% loss of snails/day to predators), but not in the high marsh
(only 0.4% loss of snails/day). There is also evidence that snail densities are affected by live
and standing-dead Spartina biomass (Stiven and Kuenzler 1979, Fierstien and Rollins 1987,
Silliman and Bertness 2002) and by physiologically-limiting conditions in the marsh such as
salinity or tidal inundation (Teal 1962, Russell-Hunter et al. 1972, Bishop and Hackney 1987).
Thus, it would have been reasonable to expect that the increase in Spartina biomass (both live
and standing-dead) that I observed in fertilized plots would have been followed by an increase
in snail densities. There were, however, no significant treatment effects on the density of either
snail, despite slight trends toward greater numbers in fertilized plots for both species. Thus, it
appears that within-site plant biomass alone did not influence snail density. It is possible that I
78

did not see a fertilization response because the snails respond primarily to litter quality, which is
likely a function of its N-content and fungal biomass, neither of which differed significantly
between treatments.
Laboratory feeding experiments indicated that the fertilization treatment did not change
the quality of standing-dead stems enough to influence consumption by Littoraria or the
omnivorous crab Armases. Past studies have shown that detritivores selectively remove fungal-
rich portions of Spartina litter that have greater nutritive quality and are more palatable due to
increased protein, reduced phenolic compounds such as vanillic and coumaric acids, and
reduced structural compounds such as lignocellulose (that comprise about 75% of Spartina’s
organic mass, Hodson et al. 1984), all of which affect leaf toughness and digestibility (Rietsma
et al. 1988, Bärlocher et al. 1989a,b, Bergbauer and Newell 1992, Newell and Bärlocher 1993,
Kneib et al. 1997, Newell and Porter 1999, Graca et al. 2000). However, Bärlocher and Newell
(1994) added 200 mg fungal mycelium per gram of ground leaf dry mass to artificial diets in their
study of palatability of Spartina litter to Littoraria, whereas leaves in this study had
approximately ≤2x less fungal mycelium than was used in their study (this study: 108-624 µg
ergosterol/g LOM, equivalent to 22-125 mg mycelium/g LOM; Gessner and Newell 2002).
Although both studies are within the range of fungal biomass found in previous studies along the
east coast (Newell et al. 2000), the Bärlocher and Newell (1994) study represents fungal
biomass loads found on the high end of the natural range (≈1000 µg ergosterol/g LOM), rather
than average fungal biomass loads. This study more closely coincided with average fungal
biomass loads (Newell et al. 2000), and in particular those previously found within high marsh-
short Spartina zones in Georgia (Newell et al. 1998), where this study took place.
Consequently, discrepancies between this study and previous studies on marsh detritivore food
selection could be partly due to past studies using greater amounts of fungal biomass
(Bärlocher et al. 1989b, Bärlocher and Newell 1994) than were studied here or typically occur in
nature (Newell et al. 1998, Newell et al. 2000, Newell 2001a, c).
79

Another possibility that might have influenced the outcome of my results was that I fed
stem and sheath material to the snails, rather than the softer leaf blades that are usually
preferred (Graca et al. 2000) and were used as food in previous studies (Newell and Bärlocher
1993, Bärlocher and Newell 1994). Not only do leaves, stems, and sheaths differ in toughness
and hence structural palatability to the snails (Graca et al. 2000), but they also differ in dominant
fungal inhabitants (Newell and Porter 2000), and hence chemical palatability. At least one past
study showed Littoraria preferred to eat Spartina that was colonized by the fungus
Phaeosphaeria spartinicola, which is the dominant ascomycete on leaf blades (Bergbauer and
Newell 1992, Bärlocher and Newell 1994). In contrast, snails avoided sheath material colonized
by Phaeosphaeria spartinae, likely due to fungal lipids that are unpalatable to Littoraria
(Bärlocher and Newell 1994). Thus, it is possible that snails in this study did not choose to eat
fertilized Spartina litter more than control Spartina litter because the chemical palatability was
poor for both plant treatments due to the presence of Phaeosphaeria spartinae (although the
fungal species on litter was not identified in this study).
Laboratory growth studies similarly indicated that fertilization treatments did not change
the quality of Juncus and Spartina standing-dead material enough to alter growth rates of
juvenile Littoraria or Melampus. Again, this likely occurred because N-content and fungal loads
did not differ significantly between treatments. Although fungal biomass in standing-dead
leaves of Juncus was not analyzed in this study, there is almost as much fungal biomass in
Juncus litter as there is on Spartina litter, although the ascomycetous species differ (Newell
2001a). Although there was no effect of fertilization treatment on growth, I did find a striking
difference in the growth of Melampus between plant species. Melampus grew overwhelmingly
better on a diet of Spartina than Juncus, supporting a previous study that also found >200%
better growth on a diet of Spartina (Lee and Silliman 2003 in press), indicating that Spartina
should be its preferred food source in nature. One possible reason for better Melampus growth
on Spartina litter could be that it had a higher N-content in both treatments than Juncus litter,
80

although previous studies with Spartina litter have not shown a positive relationship between
Melampus’ growth rate and N-content of Spartina per se (Rietsma et al. 1988, but see Valiela
and Rietsma 1984). Further, another study has shown that although Melampus prefers dead
litter, it is capable of eating a wide variety of graminoids and algae, but higher N-contents do not
influence Melampus’ preference among them (Rietsma et al. 1982). Many factors other than N-
content might influence the value of different types of litter as food to detritivores, and I did not
explore other litter traits in detail. It is known, however, that chemical composition can influence
digestiblity and palatability to detritivores (Rietsma et al. 1988, Zimmer et al. 2002) and that
plant toughness may determine feeding preferences (Rietsma et al. 1982, Pennings et al. 1998,
Graca et al. 2000). Though Pennings et al. (1988) only evaluated toughness of live plants in
Georgia, Juncus was almost 2x as tough as Spartina, and Graca et al. (2000) showed that 3
species of detritivores preferred to feed on softer blade tissues versus tougher sheath tissues of
Spartina. Even though snails were not fed the blade tissues in this study, the Spartina litter
appeared (sheath and stem only) softer than the Juncus litter (pers. obs.) and this may have
contributed to it being a better food for Melampus. I did not see differences in Littoraria growth
between plant species, perhaps because Littoraria has well-developed enzymes capable of
digesting structural compounds known to occur in marsh plants (Bärlocher et al. 1989a), and
thus may be capable of digesting and growing on a wider range of litter types.
Examining variation in snail densities between sites provided insight into controls on
snail distributions in the field, namely why Melampus is often observed on Juncus despite lush
Spartina growth in nearby non-physiologically compromising habitats (pers. obs., McMahon and
Russell-Hunter et al. 1981). Because only larval recruitment or post-settlement mortality could
account for snail density differences between sites, food quality and quantity, or physiological
and biological factors could all be possible influences on settlement. According to multiple
regression analyses, food quality and quantity may be important in some cases, but salinity was
never a significant predictor of snail densities. The dominant predictor in all four snail density
81

models was the inverse relationship exhibited between the 2 snails, supporting previous work
indicating that the two snail species compete (Lee and Silliman in press). In northeastern
states, where Littoraria does not occur, Melampus is more widely distributed across the marsh,
and densities are higher, than in southeastern states (Price 1980, Fell et al. 1982, Burnham and
Fell 1989, Spelke et al. 1995). In southeastern states, where Littoraria is present, Melampus is
either confined to the high marsh (Juncus zone) or is segregated to sites where Littoraria
density is low (this study, Lee and Silliman in press). Similar negative abundance relationships
between the two snails are evident in GCE-LTER monitoring data (2000: n=28 plots, R2=0.38,
P=0.0007; 2001: n=31plots, R2=0.30, P= 0.001, mid-marsh sites). Experimental studies
suggest that Littoraria is the competitive dominant, exerting control over Melampus density
through habitat alteration (increasing solar radiation and/or predation on Melampus by reducing
vegetation cover), egg removal, and reductions to food availability or quality (Lee and Silliman in
press).
Other variables included in models of snail density were the N-content of live Juncus,
abundances of grasshoppers Paroxya and Orchelimum, grazing damage to Spartina, and the
biomass of standing dead Juncus and Spartina. It is unclear how live Juncus N-content plays a
role in controlling snail density, but consistency between models suggests that it is important.
On the other hand, the remaining variables fit within what has previously been found and are
more readily explained. The negative correlation between Orchelimum and Littoraria has been
previously documented along the east coast (Kunza and Pennings unpublished data) and also
occurred in Orchelimum density models (this study). It is most likely due to Littoraria having
negative effects on Orchelimum rather than the reverse, because Littoraria induces senescence
and increases fungal biomass (Kemp et al. 1990, Silliman and Zieman 2001, Silliman and
Bertness 2002), which would not be advantageous to an herbivore. In contrast, Orchelimum
grazing, if it had any effect on Littoraria, would likely be positive because it would increase the
flow of material into the detrital food web (grazing on Juncus also increases litter production,
82

Parson and de la Cruz 1980). This relationship is suggested by the positive relationship
between Littoraria and grasshopper grazing damage to Spartina. Further, Melampus density
was positively associated with Paroxya density and vice-versa in the control models, likely
because Melampus densities were highest in the Juncus zone (pers. obs., Lee and Silliman in
press) where Paroxya was primarily located (Davis and Gray 1966, Parson and de la Cruz
1980), as indicated by the positive association between Melampus and Juncus biomass and the
negative association between Melampus and Spartina biomass in fertilized models.
NATURAL VARIATION VS. TREATMENT VARIATION
To this point, I have focused on statistical significance of results. One way to assess
biological significance is to compare variation among treatments to variation among sites. The
results of this exercise are in strong support of the previous discussion. For Spartina,
fertilization had a very large effect on live and standing-dead biomass and live N-content
(variation among treatments was as great as, or greater than, variation across space). In
comparison, fertilization had less of an effect on Juncus parameters, supporting previous work
that Spartina is more limited by nitrogen than is Juncus (Gallagher 1975). Although fertilization
did not have as large effects on standing-dead litter N-contents of either species as it did on live
N-contents, standing-dead Spartina was more responsive to fertilization than was standing-dead
Juncus.
The strong effects of fertilization on live Spartina quantity and quality were transmitted to
the next trophic level (as in Vince et al. 1981, Gratton and Denno 2003), inducing greater
grazing damage, which almost equaled variation in grazing over space. In contrast, fertilization
had a relatively smaller effect on grazing damage to Juncus. These findings were paralleled by
herbivore ratios, where Orchelimum density was much more influenced by fertilization than was
Paroxya.
For fungal biomass, treatment variation was smaller than variation across space, likely
because litter quality was not strongly enhanced by fertilization. Lastly, for snail densities,
83

treatment variation was much smaller than variation across space, again likely because
treatment did not alter litter quality. This result is consistent with my previous argument that
competition and other biological factors not tested, such as predation and larval recruitment and
mortality, are more important determinants of Littoraria and Melampus densities than is food
quality.
84

CHAPTER V
CONCLUSIONS
OVERALL SIGNIFICANCE OF RESULTS
In summary, I found that, 1) with added fertilizer, Spartina outcompeted Juncus for
space, regardless of site edaphic conditions, although the extent of dominance varied, 2)
density responses of grasshoppers Orchelimum and Paroxya were controlled more by food
quantity than quality, 3) decomposers and detritivores did not respond to treatment effects on
litter quality, 4) densities of detritivorous snails, Littoraria and Melampus, are likely mediated by
interspecific competition with each other, and may depend more upon predation or larval
recruitment than on plant biomass, and 5) compared with natural variation among sites,
fertilization strongly affected plant traits of both species (though its impact on Spartina was
larger than on Juncus), and grazing damage to Spartina (grazing damage to Juncus was much
less influenced by fertilization), likely because Orchelimum density was also much more
affected by fertilization than Paroxya density; fertilization had weak effects on fungal biomass,
and fertilization had virtually no effect on detritivorous snail densities. Below, I discuss the
significance of each of these results in an ecological context.
ANTHROPOGENIC IMPACTS ON INTERSPECIFIC COMPETITION AMONG PLANTS
Coastal urbanization and development have been explicitly linked to increased nitrogen
availability in salt marshes (Bertness et al. 2002), likely through increasing wastewater
contributions to marine watersheds (Bowen and Valiela 2001, Valiela and Bowen 2002).
Recent studies have indicated that anthropogenic nitrogen can have strong impacts on marsh
plant communities, inverting natural competitive hierarchies and changing diversity (Levine et al.
1998, Emery et al 2001, Pennings et al. 2002, Bertness et al. 2002, but see Rogers et al. 1998).
For example, with increased nutrient supplies in New England, Phragmites australis expanded
85

seaward and Spartina expanded landward, outcompeting other plant species, and potentially
disrupting the entire marsh food web (Bertness et al. 2002, but see Weis and Weis 2003).
In this study, fertilization allowed Spartina to invade the Juncus zone, with a subsequent
dominance of Spartina litter, at a majority of sites, despite variable edaphic conditions across
these sites. At most sites, this invasion was paralleled by a concurrent decrease in Juncus
biomass, but edaphic conditions controlled the extent of dominance by Spartina. The results of
this study, in combination with previous work in New England (Levine et al. 1998, Emery et al.
2001, Pennings et al. 2002, Bertness and Silliman 2002) indicate that nitrogen should have
impacts to marsh community composition along the entire coast if inputs are continually added
at their present rate (Vitousek 1994). However, because edaphic conditions do play a role in
the dominance by Spartina, modifications to marsh composition will likely proceed at different
rates at different sites. Several factors were important predictors of Spartina and Juncus
biomass, but salinity and sitescore were the most consistent and important. Salinity had
negative effects on both species, as would be expected from a variety of laboratory and field
studies (Adams 1963, Phleger 1971, Smart and Barko 1980, Haines and Dunn 1985, Howes et
al. 1986, Bradley and Morris 1991). Sitescore had opposite effects on the two species. The
extent of Spartina dominance was least where upland influence (i.e. sitescore) was greater.
Upland influence in this case was not a function of development (this would be represented
better by the mainland variable, but in any case few sites had heavy development), rather it
reflected the amount of forest surrounding and bordering the marsh. Thus, a high sitescore
likely represented a greater input of freshwater, or associated materials in the freshwater, which
benefited Juncus more than Spartina. If this pattern was driven by freshwater input, the
freshwater may have entered the marsh as groundwater, below the level of the salinity cores, or
may have entered the marsh as runoff during brief periods of high rainfall. Either of these
possibilities would explain why this freshwater input was not simply described by the salinity
data. Buck and Pennings (pers. comm.) found a similar relationship between sitescore and the
86

dominance of Juncus and Spartina at the landscape level at 54 sites that partially overlapped
with mine and were within the same region of the coast. Thus, these results indicate that
eutrophication will likely increase Spartina dominance, but the magnitude of dominance will vary
at different sites depending on upland influence.
HERBIVORE RESPONSES TO ALTERED MARSH COMPOSITION
Collective results of field densities and grazing damage to plants, and lab food selection
of grasshoppers Orchelimum and Paroxya, suggest that these grasshoppers respond to
changes in biomass of their host plants, Spartina and Juncus respectively, through visual
attraction to color, vertical shapes or clumps of vegetation (Mulkern 1967, Bernays and Wrubel
1985). Orchelimum density likely increased significantly in fertilized plots due to increasing
Spartina dominance, whereas Paroxya did not increase with fertilization due to decreased
Juncus dominance. Discrepancies between grazing damage data (i.e. each grasshopper
grazed significantly more of their host plants in fertilized plots) and food selection in the lab (i.e.
fertilized plants were not consumed more than control plants by either grasshopper) suggest
that grasshoppers were visually attracted to the taller, greener, lusher biomass in fertilized plots
(pers. obs.), rather than responding to plant quality within plots. Although the density of each
grasshopper was correlated with the densities of one or both snails, the mechanisms driving
these associations were likely different. The negative association between Orchelimum and
Littoraria was likely due to Littoraria exerting strong top-down control on Spartina biomass
(Silliman and Zieman 2001, Silliman and Bertness 2002, Silliman and Newell 2003, though snail
density in this study was typically much lower than the snail density in their studies). The
positive association between Paroxya and Littoraria is difficult to explain and was not strong, but
likely reflects that both were associated with Juncus.
Because increasing nitrogen favors Spartina over Juncus, as discussed above, the
Juncus zone could eventually be taken over by Spartina in eutrophied areas (but see Brewer
2003). The loss of Juncus from marsh sites would modify the food webs dependent upon its
87

consumers (detritivores and herbivores). Most likely to be lost would be specialized herbivore
species that feed on one host plant. Although grasshoppers tend to be oligophagous, feeding
on multiple hosts within a family or genera, they do favor certain species, often obtaining 90% or
more of their diet from one species (Joern 1979, Bernays and Barbehenn 1987, Chapman and
Joern 1990). In salt marshes, the grasshoppers Orchelimum and Paroxya primarily eat Spartina
and Juncus, respectively (Smalley 1960, Davis and Gray 1966, Parsons and de la Cruz 1980,
Diaber 1982). Thus, losses of Juncus biomass would be expected to have strong negative
effects on Paroxya densities. Therefore with greater anthropogenic nitrogen, Paroxya densities
will likely decrease, Orchelimum densities will likely increase, and these changes may have
impacts on their bird consumers, although this has not been tested. Additionally, losses of
consumers, such as Paroxya, could have extended impacts on other parts of the food web or on
marsh function (Parsons and de la Cruz 1980).
DETRITIVORE RESPONSES TO ALTERED MARSH COMPOSITION
Past studies have suggested that feeding choices and growth of salt marsh
decomposers are positively influenced by the microbial biomass and quality of detritus (Newell
and Bärlocher 1993, Bärlocher and Newell 1994, Bärlocher et al. 1989b, Valiela and Rietsma
1984, but see Rietsma et al. 1988), but this study was the first to examine the impacts of
changes in community composition and plant quality on densities of marsh detritivores. Quality
of litter did not significantly increase in fertilized plots of this study despite a trend towards
greater N-content, although quantity (i.e. biomass) did; however, the lack of response of
detritivores to fertilization indicated that neither litter quality nor quantity had a major role in
mediating the densities of marsh snails. Although live plants within the same plots did
experience substantial increases in N-content, N-content of litter quality rapidly decreases as
leaves senesce, due to tidal leaching and nitrogen reallocation to living parts of plants (Christian
et al. 1990, Newell 2001c), and thus may not be strongly affected by fertilization. At least one
previous study reported increases in fungal densities following fertilization (Newell et al. 1996b),
88

but this effect did not occur here. Although I found no effect of fertilization on snail densities,
densities varied strongly among sites regardless of fertilization treatment (Fig. 5.1), suggesting
that snail densities are strongly influenced by factors that vary at larger spatial scales, such as
larval recruitment, predation, and competition.
COMPETITION AND IMPACTS TO MELAMPUS
The major consensus of previous work has been that Melampus and Littoraria are
physiologically separated spatially, between sites (i.e. along the salinity gradient, Henry et al.
1993, Burnham and Fell 1989, Bishop and Hackney 1987) and within sites (i.e. along the tidal
gradient, Melampus is a pulmonate snail, Russell-Hunter et al. 1972, and Littoraria is a
prosobranch snail, Meinkoth 1981, Diaber 1982, Ruppert and Fox 1988). However, recent work
by Lee and Silliman (2003) and the results of this study indicate that the snails may be
structured by competition, specifically in the high marsh, where predation is lower (Kneib 1984,
Kneib 1997, Hamilton 1976) and they have a shared food source, Spartina, which can become
limiting (Stiven and Kuenzler 1979). Because Melampus grew substantially better on a diet of
Spartina than Juncus litter (Spelke et al. 1995, Lee and Silliman 2003 in press, this study),
Spartina should be its preferred diet. Therefore, it seems likely that Melampus is excluded from
the Spartina zone by Littoraria, and there is experimental evidence to support this hypothesis
(Lee and Silliman 2003 in press).
If Spartina continues to encroach landward, it is likely that competition could become
stronger between these two snails because 1) their habitats will overlap further as Spartina
further invades the Juncus zone where Melampus is most common (Diaber 1982, pers. obs.), 2)
Melampus cannot move higher into the marsh since they require minimum levels of moisture to
keep their gills wet and their reproduction is tidally obligate, i.e. eggs hatch as planktonic
veligers during spring tides (Russel-Hunter et al. 1972, Ruppert and Fox 1988) and 3) higher
marsh Spartina will be optimal habitat for both due to less predation (Hamilton 1976, Kneib
1984). It is likely that the outcome of a shift towards dominance by Spartina would be
89

competitive displacement of Melampus, as suggested by the competitive dominance of Littoraria
over Melampus in the mid-Spartina zone (Lee and Silliman 2003 in press). Competitive
displacement of one gastropod by another has been observed a number of times (Brenchley
and Carlton 1983, Bertness 1984a, Byers 2000, Lee and Silliman 2003 in press), and can
involve a variety of mechanisms including exploitation competition for food (Stiven and Kuenzler
1979, Cross and Benke 2001, Lee and Silliman 2003 in press), habitat modifications (Brenchley
and Carlton 1983, Bertness 1984a, Lee and Silliman 2003 in press), and greater conversion
efficiency of limited resources to growth (Byers 2000).
RELATIVE IMPORTANCE OF ANTHROPOGENIC NUTRIENTS TO THE SALT MARSH FOOD WEB
So far I have discussed the statistical significance of fertilization on various trophic levels
of the food web, but how do treatment effects compare to natural variation among sites? I used
the ratio of natural variation within a site to mean treatment variation within the study area to
determine this for each trophic level in this study. Results varied for different variables, and
supported the general conclusion that fertilization had stronger impacts on Spartina primary
production and quality than on Juncus, which subsequently led to greater fertilization impacts on
grazing damage by Orchelimum than by Paroxya. On the other hand, fertilization had weak
impacts on the fungal loads on standing-dead Spartina litter, which subsequently led to
practically no impact of fertilization on the detritivorous snails. These findings support my
general conclusions that impacts of fertilization to the live-plant food web can be strong given
that quantity and quality of live host plants are altered, but that the detrital food web is not
strongly altered by fertilization because the quality of standing-dead litter does not increase
significantly. As argued above, however, it is possible that the detrital food web would be
indirectly affected by eutrophication through changes in the plant community that would lead to
the exclusion of Melampus by Littoraria. These findings support the idea that snail density is
mediated through biological factors such as competition, predation, and larval recruitment or
post-larval mortality, rather than eutrophication per se.
90

y =
1.13
12x
- 3.2
518
R2=
0.83
050100
150
200
250
300
020
4060
8010
012
014
016
018
020
0
Tota
l Sna
il D
ensi
ty in
Con
trol
Plo
ts (#
sna
ils p
er m
2 )
Total Snail Density in Fertilized Plots(# snails per m
2)
Figu
re 5
.1.
Rel
atio
nshi
p be
twee
n th
e to
tal n
umbe
r of s
nails
(Mel
ampu
s +
Litt
orar
ia) a
t site
s w
ithin
con
trol a
nd
ferti
lized
plo
ts (
n=1
9 si
tes)
. D
ata
are
site
mea
ns.
91
REFERENCES
Adam, P.1990. Salt Marsh Ecology. Cambridge University Press, New York, NY.
Adams, D.A. 1963. Factors influencing vascular plant zonation in North Carolina salt marshes.
Ecology 44(3): 445-456.
Allam, A.I. and J.P. Hollis. 1972. Sulfide inhibition of oxidases in rice roots. Phytopathology
62: 634-639.
Anderson, C.M., and M. Treshow. 1980. A review of environmental and genetic factors that
affect Spartina alterniflora height forms. Estuaries 3: 168-176.
Anderson, D.A., P.M. Glibert, and J.M. Burkholder. 2002. Harmful algal blooms and
eutrophication: Nutrient sources, composition, and consequences. Estuaries 25(4B):
704-726.
Austin, M.P., and B.O. Austin. 1980. Behaviour of experimental plant communities along a
nutrient gradient. Journal of Ecology, 68: 891-918.
Bärlocher, F., and S.Y. Newell. 1994. Phenolics and proteins affecting palatability of Spartina
leaves to the gastropod Littoraria irrorata. Marine Ecology 15: 66-75.
Bärlocher, F., S.Y. Newell, and T.L. Arsuffi. 1989b. Digestion of Spartina alterniflora Loisel
material with and without fungal constituents by the periwinkle Littorina irrorata Say
(Mollusca: Gastropoda). Journal of Experimental Marine Biology and Ecology 130: 45-
53.
Bärlocher, F., T. L. Arsuffi, and S.Y. Newell. 1989a. Digestive enzymes of the saltmarsh
periwinkle Littoraria irrorata (Mollusca: Gastropoda). Oecologia 80: 39-43.
Bart, D., and J.M. Hartman. 2000. Environmental determinants of Phragmites australis
expansion in a New Jersey salt marsh: An experimental approach. Oikos 89: 59-69.
92

Beatley, T., D.J. Brower, and A.K. Schwab. 2002. An Introduction to Coastal Zone
Management. Second edition. Island Press, Washington.
Bergbauer, M. and S.Y. Newell. 1992. Contribution to lignocellulose degradation and DOC
formation from a salt marsh macrophyte by the ascomycete Phaeosphaeria spartinicola.
FEMS Microbiology Ecology 86: 341-348.
Bernays, E.A., and R. Barbehenn. 1987. Nutritional ecology of grass foliage-chewing insects,
Chapter 4. In: F. Slansky, Jr., and J.G. Rodriguez (eds.), Nutritional Ecology of Insects,
Mites, and Spiders. John Wiley and Sons, New York.
Bernays, E.A., and R. Wrubel. 1985. Learning by grasshoppers: Association of colour/light
intensity with food. Physiological Entomology 10: 359-369.
Bernays, E.A., and R.F. Chapman. 1970. Food selection by Chorthippus parallelus
(Zetterstedt) (Orthoptera: Acrididae) in the field. Journal of Animal Ecology 39: 383-
394.
Bertness, M.D, and E. Grosholz. 1985. Population dynamics of the ribbed mussel, Geukensia
demissa: The costs and benefits of an aggregated distribution. Oecologia 67: 192-204.
Bertness, M.D. 1984a. Habitat and community modification by an introduced herbivorous snail.
Ecology 65(2): 370-381.
Bertness, M.D. 1984b. Ribbed mussels and the productivity of Spartina alterniflora in a New
England salt marsh. Ecology 65: 1794-1807.
Bertness, M.D. 1985. Fiddler crab regulation of Spartina alterniflora production on a New
England salt marsh. Ecology 66(3): 1042-1055.
Bertness, M.D. 1991a. Interspecific interactions among high marsh perennials in a New
England salt marsh. Ecology 72(1): 125-137.
Bertness, M.D. 1991b. Zonation of Spartina patens and Spartina alterniflora in a New England
salt marsh. Ecology 72(1): 138-148.
93

Bertness, M.D. 1992. The ecology of New England salt marsh plant communities. American
Scientist 80: 260-268.
Bertness, M.D. 1994. Habitat and community modification by an introduced herbivorous snail.
Ecology 65(2): 370-381.
Bertness, M.D. 1999. The Ecology of Atlantic Shorelines. Sinauer Associates Inc., Sunderland,
MA.
Bertness, M.D. and A.M. Ellison. 1987. Determinants of pattern in a New England salt marsh
plant community. Ecological Monographs 57(2): 129-147.
Bertness, M.D., and R.M. Callaway. 1994. Positive interactions in communities. Trends in
Ecology and Evolution 9: 191-193.
Bertness, M.D., and S.D. Hacker. 1994. Physical stress and positive associations among
marsh plants. The American Naturalist 144(3): 363-372.
Bertness, M.D., and S.M. Yeh. 1994. Cooperative and competitive interactions in the
recruitment of marsh elders. Ecology 75: 2416-2429.
Bertness, M.D., P.J. Ewanchuk, and B.R. Silliman. 2002. Anthropogenic modification of New
England salt marsh landscapes. Proceedings of the National Academy of Science
99(3): 1395-1398.
Bingham, F.O. 1972. Shell growth in the gastropod, Littorina irrorata. Nautilus 85: 136-141.
Bishop, T.D., and C.T. Hackney. 1987. A comparative stud of the mollusc communities of two
oligohaline intertidal marshes: spatial and temporal distribution of abundance and
biomass. Estuaries 10(2): 141-152.
Bobbink, R. 1991. Effects of nutrient enrichment in Dutch chalk grassland. Journal of Applied
Ecology 28:28-41.
Bowdish, T.I. and P. Stiling. 1998. The influence of salt and nitrogen on herbivore abundance:
direct and indirect effects. Oecologia 113: 400-405.
94

Bowen, J.L., and I. Valiela. 2001. The ecological effects of urbanization of coastal watersheds:
historical increases in nitrogen loads and eutrophications of Waquoit Bay estuaries.
Canadian Journal of Fisheries and Aquatic Sciences 58: 1489-1500.
Boyer, K.E., and J.B. Zedler. 1999. Nitrogen addition could shift plant community composition
in a restored California salt marsh. Restoration Ecology 7(1): 74-85.
Bradley, P.M., and E.L. Dunn. 1989. Effects of sulfide on the growth of three salt marsh
halophytes of the southeastern United States. American Journal of Botany 76(12):
1707-1713.
Bradley, P.M., and J.T. Morris. 1990. Influence of oxygen and sulfide concentration on nitrogen
uptake kinetics in Spartina alterniflora. Ecology 71(1): 282-287.
Breitburg, D. 2002. Effects of hypoxia, and the balance between hypoxia and enrichment, on
coastal fishes and fisheries. Estuaries 25(4B): 767-781.
Brenchley, G.A. and J.T. Carlton. 1983. Competitive displacement of native mud snails by
introduced periwinkles in the New England intertidal zone. Biological Bulletin 165: 543-
558.
Brewer, J.S. 2003. Nitrogen addition does not reduce belowground competition in a salt marsh
clonal plant community in Mississippi (USA). Plant Ecology 168: 93-106.
Brewer, J.S., T. Rand, J.M. Levine, and M.D. Bertness. 1998. Biomass allocation, clonal
dispersal, and competitive success in three salt marsh plants. Oikos 82: 347-353.
Buchsbaum, R., I.Valiela, and T. Swain. 1984. The role of phenolic compounds and other plant
constituents in feeding by Canada geese in a coastal salt marsh. Oecologia 63: 343-
349.
Buck, T.L., G.A. Breed, S.C. Pennings, M.E. Chase, M. Zimmer, and T.H. Carefoot. 2003. Diet
choice in an omnivorous salt-marsh crab: Different food types, body size, and habitat
complexity. Journal of Experimental Marine Biology and Ecology 292: 103-116.
95

Burkholder, J.M. 1998. Implications of harmful marine microalgae and heterotrophic
dinoflagellates in management of sustainable fisheries. Ecological Applications
(Supplement) 8: 37-62.
Burnham, B.H., and P.E. Fell. 1989. Distribution of Melampus bidentatus (Say) and Succinea
wilsoni (Lea) within a tidal marsh in eastern Connecticut.
Byers, J.E. 2000. Competition between two estuarine snails: Implications for invasions of
exotic species. Ecology 81(5): 1225-1239.
Callaway, R.M., and L.R. Walker. 1997. Competition and facilitation: A synthetic approach to
interactions in plant communities. Ecology 78(7): 1958-1965.
Cavalieri, A.J., and A.H.C. Huang. 1981. Evaluation of proline accumulation in the adaptation
of diverse species of marsh halophytes to the saline environment. American Journal of
Botany 66(3): 307-312.
Chandra, S. and G. Williams. 1983. Frequency-dependent selection in the grazing behaviour
of the desert locust Schistocerca gregaria. Ecological Entomology. 8: 13-21.
Chapman, R.F., and A. Joern. 1990. Biology of Grasshoppers. John Wiley and Sons, New
York.
Christian, R.R., W.L Bryant Jr., and M.M. Brinson. 1990. Juncus roemerianus production and
decomposition along gradients of salinity and hydroperiod. Marine Ecology Progress
Series 68: 137-145.
Connell, J.H. 1961. The influence of interspecific competition and other factors on the
distribution of the barnacle Chthamalus stellatus. Ecology 42: 710-723.
Craft, C.B., and W.P. Casey. 2000. Sediment and nutrient accumulation in floodplain and
depressional freshwater wetlands of Georgia, USA. Wetlands 20(2): 323-332.
Craft, C.B., E.D. Seneca, and S.W. Broome. 1991. Loss on ignition and kjeldahl digestion for
estimating organic carbon in estuarine marsh soils: Calibration with dry combustion.
Estuaries 14(2): 175-179.
96

Craft, C.B., S.W. Broome, and E.D. Seneca. 1988. Nitrogen, phosphorus and organic carbon
pools in natural and transplanted marsh soils. Estuaries 11(4): 272-280.
Cross, W.F., and A.C. Benke. 2001. Intra- and interspecific competition among coexisting lotic
snails. Oikos 96: 251-264.
Daiber, F.C. 1982. Animals of the Tidal Marsh. Van Nostrand Reinhold Co., New York.
Dame, R.F. 1996. Ecology of Marine Bivalves: An Ecosystem Approach. CRC Press, Boca
Raton, FL.
Davis, L.V., and I.E. Gray. 1966. Zonal and seasonal distribution of insects in North Carolina
salt marshes. Ecological Monographs 36: 275-295.
Deegan, L.A. 2002. Lessons learned: The effects of nutrient enrichment on the support of
nekton by seagrass and salt marsh ecosystems. Estuaries 25(4B): 727-742.
DeLaune, R.D., C.J. Smith, and W.H. Patrick, Jr. 1983. Relationship of marsh elevation, redox
potential and sulfide to Spartina alterniflora productivity. Soil Science Society of America
Journal 47: 930-935.
Denno, R.F., C. Gratton, M.A. Peterson, G.A. Langellotto, D.L. Finke, and A.F. Huberty. 2002.
Bottom-up forces mediate natural-enemy impact in a phytophagous insect community.
Ecology 83: 1443-1458.
Denno, R.F., L.W. Douglass, and D. Jacobs. 1986. Effects of crowding and host plant nutrition
on a wing-dimorphic planthopper. Ecology 67: 116-123.
Dionne, M., F.T. Short, and D.M. Burdick. 1999. Fish utilization of restored, created and
reference salt-marsh habitat in the Gulf of Maine. American Fisheries Society
Symposium 22: 384-404.
Eleuterius, L.N., and J.D. Caldwell. 1985. Soil characteristics of four Juncus roemerianus
populations in Mississippi. Gulf Research Reports 8(1): 9-13.
Ellison, A.M. 1987. Effects of competition, disturbance, and herbivory on Salicornia europea.
Ecology 68: 576-586.
97

Emery, N., P. Ewanchuk, and M.D. Bertness. 2001. Competition and salt-marsh plant
zonation: stress tolerators may be dominant competitors. Ecology 82(9): 2471-2485.
Fell, P.E., N.C. Olmstead, E. Carlson, W. Jacob, D. Hitchcock and G. Silber. 1982. Distribution
and abundance of macroinvertebrates on certain Connecticut tidal marshes, with an
emphasis on dominant mollusks. Estuaries 5: 234-239.
Feller, I.C.; D.F. Whigham, K.L. McKee, C.E. Lovelock. 2003. Nitrogen limitation of growth and
nutrient dynamics in a disturbed mangrove forest, Indian River Lagoon, Florida.
Oecologia 134(3): 405-414.
Fierstien IV, J.F. and H.B. Rollins. 1987. Observations on intertidal organism associations of
St. Catherines Island, Georgia. II. Morphology and Distribution of Littorina irrorata
(Say). American Museum Noviates 2873: 1-31.
Ford, M.A., and J.B. Grace. 1998. Effects of vertebrate herbivores on soil processes, plant
biomass, litter accumulation and soil elevational changes in a coastal marsh. Journal of
Ecology 86: 974-982.
Foster, W.A. 1984. The distribution of the sealavender aphid Staticobium staticis on a marine
saltmarsh and its effect on host plant fitness. Oikos 42: 97-104.
Fox, L.R., and B.J. Macauley. 1977. Insect grazing on Eucalyptus in response to variation in
leaf tannins and nitrogen. Oecologia 29: 145-162.
Friberg, N and D. Jacobsen. 1999. Variation in growth of the detritivore-shredder Sericostoma
personatum (Trichoptera). Freshwater Biology 42(4): 625-635.
Furbish, C.E., and M. Albano. 1994. Selective herbivory and plant community structure in a
Mid-Atlantic salt marsh. Ecology 75(4): 1015-1022.
Gallagher, J.L. 1975. Effect of an ammonium nitrate pulse on the growth and elemental
composition of natural stands of Spartina alterniflora and Juncus roemerianus.
American Journal of Botany 62(6): 644-648.
98
Gallagher, J.L., G.F. Somers, D.M. Grant, D.M. Seliskar. 1988. Persistent differences on
Spartina alterniflora growth forms. Ecology 69: 1005-1008.
Gallagher, J.L., R.J. Reimold, R.A. Linthurst, and W.J. Pfeiffer. 1980. Aerial production,
mortality, and mineral accumulation-export dynamics in Spartina alterniflora and Juncus
roemerianus plant stands in a Georgia salt marsh. Ecology 61(2): 303-312.
Gee, G.W., and J.W. Bauder. 1986. Particle-size Analysis. In: Klute (ed.), Methods of Soil
Analysis, Part 1, A, pp. 383-411. Amer. Soc. Argon., Madison, WI.
Gessner, M.O., and S.Y. Newell. 2002. Biomass, growth rate, and production of filamentous
fungi in plant litter, pp. 390-408. In: C.J. Hurst et al. (eds.), Manual of Environmental
Microbiology. Second edition. ASM Press, Washington DC.
Goldberg, D.E., and A.M. Barton. 1992. Patterns and consequences of interspecific
competition in natural communities: A review of field experiments with plants. The
American Naturalist 139(4): 771-801.
Goni, M.A.; and K.A. Thomas. 2000. Sources and Transformations of Organic Matter in
Surface Soils and Sediments from a Tidal Estuary (North Inlet, South Carolina, USA).
Estuaries 4: 548-564
Goranson, C., and S.C. Pennings. Effects of physical gradients on palatability of salt marsh
plants to herbivores. Unpublished manuscript.
Gough, L., and J.B. Grace. 1998. Herbivore effects on plant species density at varying
productivity levels. Ecology 79(5): 1586-1594.
Graca, M.A., S.Y. Newell, and R.T. Kneib. 2000. Grazing rates of organic matter and living
fungal biomass of decaying Spartina alterniflora by three species of salt-marsh
invertebrates. Marine Biology 136: 281-289.
Grace, J.B., and R.G. Wetzel. 1981. Habitat partitioning and competitive displacement in
cattails (Typha): experimental field studies. The American Naturalist 118; 463-474.
99
Graham, M.H. 2003. Confronting multicollinearity in ecological multiple regression. Ecology
84(11): 2809-2815.
Gratton, C. and R.F. Denno. 2003. Inter-year carryover effects of a nutrient pulse on Spartina
plants, herbivores, and natural enemies. Ecology 84(10): 2692-2707.
Greiner La Peyre, M.K., J.B. Grace, E. Hahn, and I.A. Mendelssohn. 2001. The importance of
competition in regulating plant species abundance along a salinity gradient. Ecology
82(1): 62-69.
Grime, J.P. 1974. Vegetation classification by reference to strategies. Nature 250: 26-31.
Grime, J.P. 1977. Evidence for the existence of three primary strategies in plants and its
relevance to ecological and evolutionary theory. American Naturalist 111: 1169-1194.
Grime, J.P. 1979. Plant Strategies and Vegetation Processes. John Wiley & Sons, New York.
Hacker, S.D., and M.D. Bertness. 1999. Experimental evidence for factors maintaining plant
species diversity in a New England salt marsh. Ecology 80: 2064-2073.
Hacker, S.D., and S.D. Gaines. 1997. Some implications of direct positive interactions in the
plant species diversity of salt marsh plant communities. Ecology 78: 1990-2003.
Hackney, C.T., and A.A. de la Cruz. 1980. In situ decomposition of roots and rhizomes of two
tidal marsh plants. Ecology 61(2): 226-231.
Haines, B.L., and E.L. Dunn. 1976. Growth and resource allocation responses of Spartina
Alterniflora Loisel to three levels of NH4-N, Fe, and NaCl in solution culture. Botanical
Gazette 137(3): 224-230.
Haines, B.L., and E.L. Dunn. 1985. Coastal marshes, pp 323-347. In: Chabot, B.F., and H.A.
Mooney (Eds.), Physiological Ecology of North American plant communities. Chapman
and Hall, New York, NY.
Hamilton, P.V. 1976. Predation on Littorina irrorata (Mollusca: Gastropoda) by Callinectes
sapidus (Crustacea: Portunidae). Bulletin of Marine Science 26:403-409.
100

Hamilton, P.V. 1977. Daily movements and visual location of the plant stems by Littorina
irrorata (Mollusca: Gastropoda). Marine Behavior and Physiology 4: 293-304.
Harley, C.D.G., and M.D. Bertness. 1996. Structural interdependence: An ecological
consequence of morphological responses to crowding in marsh plants. Functional
Ecology 10: 654-661.
Harper, J.L. 1977. Population Biology of Plants. Adademic Press, New York, NY.
Hartnett, D.C., and F.A. Bazzazz. 1985. The integration of neighbourhood effects by clonal
genets in Solidago canadensis. Journal of Ecology 73: 415-427.
Heip, C. 1995. Eutrophication and zoobenthos dynamics. Ophelia 41: 113-136.
Henry, R.P., C.J. McBride, and A.H. Williams. 1993. Responses of the marsh periwinkle,
Littoraria (Littorina) irrorata to temperature, salinity and desiccation, and the potential
physiological relationship to climbing behavior. Marine Behavior and Physiology 24: 45-
54.
Hines, M.E., S.L. Knollmeyer, and J.B. Tugel. 1989. Sulfate reduction and other sedimentary
biogeochemistry in a northern New England salt marsh. Limnology and Oceanography
34(3): 578-590.
Hodgson, J.G., P.J. Wilson, R. Hunt, J.P. Grime, and K. Thompson. 1999. Allocating C-S-R
plant functional types: A soft approach to a hard problem. Oikos 85: 282-294.
Hodson, R.E., R.R. Christian, and A.E. Maccubbin. 1984. Lignocellulose and lignin in the salt
marsh grass Spartina alterniflora : Initial concentrations and short-term, post-
depositional changes in detrital matter. Marine Biology 81: 1-7.
Hopkinson, C.S., and J.P. Schubauer. 1984. Static and dynamic aspects of nitrogen cycling in
the salt marsh gramminoid, Spartina alterniflora Loisel. Ecology 65; 961-969.
Howarth, R.W., A. Sharpley, and D. Walker. 2002. Sources of nutrient pollution to coastal
waters in the United States: Implications for achieving coastal water quality goals.
Estuaries 25(4B): 656-676.
101
Howes, B.L., J.W.H. Dacey, and D.D. Goehringer. 1986. Factors controlling the growth form of
Spartina alterniflora: Feedbacks between above-ground production, sediment oxidation,
nitrogen, and salinity. Journal of Ecology 74z93): 881-898.
Howes, B.L., R.W. Howarth, I. Valiela, and J.M. Teal. 1981. Oxidation-reduction potentials in a
salt marsh; spatial patterns and interactions with primary production. Limnology and
Oceanography 26: 350-360.
Huckle, J.M., J.A. Potter, and R.H.Marrs. 2000. Influence of environmental factors on the
growth and interaction between salt marsh plants: effects of salinity, sediment and
waterlogging. Journal of Ecology 88: 492-505.
Huenneke, L.F., S.P. Hamburg, R. Koide, H.A. Mooney, and P.M. Vitousek. 1990. Effects of
soil resources on plant invasion and community structure in Californian serpentine
grassland. Ecology 71(2): 478-491.
Jeffries, R.L. 1977. Growth responses of coastal halophytes to inorganic nitrogen. Journal of
Ecology 65(3): 847-865.
Joern, A. 1979. Feeding patterns in grasshoppers (Orthoptera: Acrididae): Factors influencing
diet specialization. Oecologia 38: 325-247.
Jordan, T.E., and I. Valiela. 1982. The nitrogen budget of the ribbed mussel, Geukensia
demissa, and its significance in nitrogen flow in a New England salt marsh. Limnology
and Oceanography 27: 75-90.
Joyce, A.A. and S.B. Weisberg. 1986. The effects of predation by the mummichog, Fundulus
heteroclitus (L.), on the abundance and distribution of the salt marsh snail, Melampus
bidentatus (Say). Journal of Experimental Marine Biology and Ecology 100: 295-306.
Keddy, P.A. 2001. Competition. Second edition. Kluwer Academic Publishers, Boston, MA.
Kemp, P.F., S.Y. Newell, and C.S. Hopkinson. 1990. Importance of grazing on the salt-marsh
grass Spartina alterniflora to nitrogen turnover in a macrofaunal consumer, Littorina
102

irrorata, and to decomposition on standing-dead Spartina. Marine Biology 104: 311-
319.
Kerbes, R.H., P.M. Kotanen, and R.L. Jeffries. 1990. Destruction of wetland habitats by lesser
snow geese: A keystone species on the west coast of Hudson Bay. Journal of Applied
Ecology 27: 242-258.
King, G.M., M.J. Klug, R.G. Wiegert, and A.G. Chalmers. 1982. Relation of soil water
movement and sulfide concentration to Spartina alterniflora production in a Georgia salt
marsh. Science 218: 61-63.
Kneib, R.T. 1984. Patterns of invertebrate distribution and abundance in the intertidal salt
marsh: causes and questions. Estuaries 7: 392-412.
Kneib, R.T. 1997. The Role of Tidal Marshes in the Ecology of Estuarine Nekton. In: A.D.
Ansell, R.N. Gibson, and M. Barnes (eds), Oceanography and Marine Biology: an
Annual Review 35: 163-220. UCL Press.
Kneib, R.T., S.Y. Newell, and E.T. Hermeno. 1997. Survival, growth and reproduction of the
salt-marsh amphipod Uhlorchestia spartinophila reared on natural diets of senescent
and dead Spartina alterniflora leaves. Marine Biology 128: 423-431.
Koch, M. S., I. A. Mendelssohn, and K. L. McKee. 1990. Mechanism for the hydrogen sulfide-
induced growth limitation in wetland macrophytes. Limnology and Oceanography 35:
399-408.
Kruczynski, W.L., C.B. Subrahmanyam, and S.H. Drake. 1978. Studies on the plant
communityof a North Florida salt marsh. Bulletin of Marine Science 28(2): 316-334.
Kumm, K.I. 1976. An economic analysis of nitrogen leaching caused by agricultural activities.
In: B.H. Svensson and and R. Söderland (eds.) Nitrogen, Phosphorus and Sulphur –
Global Cycles. SCOPE Report 7. Ecological Bulletins (Stockholm) 22: 169-183.
Langis, R, A. Malgorzata, and J.B. Zedler. 1991. Nitrogen assessments in a constructed and a
natural salt marsh of San Diego Bay. Ecological Applications 1(1): 40-51.
103
Lee, S.C., and B.R. Silliman. 2003. Interspecific interactions determine gastropod zonation in a
Southeastern U.S. salt marsh. In press.
Levine, J.M., J. S. Brewer, and M.D. Bertness. 1998. Nutrients, competition and plant zonation
in a New England salt marsh. Journal of Ecology 86: 285-292.
Levitt, J. 1972. Responses of Plants to Environmental Stresses. Academic Press, New York.
Lewis, D.B. and L.A. Eby. 2002. Spatially heterogenous refugia and predation risk in intertidal
salt marshes. Oikos 96: 119-129.
Lightfoot, D.C. and W.G. Whitford. 1987. Variation in insect densities on desert creosotebush:
Is nitrogen a factor? Ecology: 68(3): 547-557.
Long, S.P., and C.F. Mason. 1983. Saltmarsh Ecology. Blackie, London.
Mallows, C. 1973. Some comments on Cp. Technometrics 15: 661-675.
McClelland, J.W., and I.Valiela. 1998. Linking nitrogen in estuarine producers to land-derived
sources. Limnology and Oceanography 43(4): 577-585.
McClelland, J.W., I.Valiela, and Robert H Michener. 1997. Nitrogen-stable isotope signatures
in estuarine food webs: A record of increasing urbanization in coastal watersheds.
Limnology and Oceanography 42(5): 930-937.
McLaughlin, J.W., R.G. Margaret, M.F. Jurgensen, C.C. Trettin. 2000. Soil organic matter and
nitrogen cycling in response to harvesting, mechanical site preparation, and fertilization
in a wetland with a mineral substrate. Forest Ecology and Management 129: 7-23.
McMahon, R.F. and W.D. Russell-Hunter. 1981. The effects of physical variables and
acclimation on survival and oxygen consumption in the high littoral salt-marsh snail,
Melampus bidentatus Say. Biological Bulletin 161 : 246-269.
Meinkoth, N.A. 1981. The Audubon Society Field Guide to North American Seashore
Creatures. Alfred A. Knopf, Inc., New York.
Mendelssohn, I.A. 1979. Nitrogen metabolism in the height forms of Spartina alterniflora in
North Carolina. Ecology 60(3): 574-584.
104

Mendelssohn, I.A., and J.T. Morris. 2000. Eco-physiological controls on the productivity of
Spartina alterniflora Loisel. In: M.P. Weinstein and D.A. Kreeger, Concepts and
Controversies in Tidal Marsh Ecology. Kluwer Academic Publishers, Boston.
Menge, B.A. 1976. Organization of the New England rocky intertidal community: role of
predation, competition, and environmental heterogeneity. Ecological Monographs 46:
355-393.
Micheli, F., G.A. Polis, P.D. Boersma, M.A. Hixon, E.A. Norse, P.V.R. Snelgrove, and M.E.
Soulé. 2001. Human Alteration of Food Webs, Chapter 3. In: M.E. Soulé and G.H.
Orians (eds), Conservation Biology: Research Priorities for the Next Decade, pp. 31-51.
Island Press, Washington.
Minton, M.D. 1999. Coastal wetland restoration and its potential impact on fishery resources in
the Northeastern United States. American Fisheries Society Symposium 22: 405-420.
Mitsch, W.J., and J.G. Gosselink. 2000. Wetlands. Third edition. John Wiley and Sons, Inc.,
New York.
Montague, C.L. 1980. A natural history of temperate western Atlantic fiddler crabs with
reference to their impact on salt marshes. Contributions in Marine Science 23: 25-55.
Montague, C.L., and R.G. Wiegert. 1990. Salt marshes. In: R.L. Myers and J.J. Ewel (eds.),
Ecosystems of Florida, pp. 481-516. University of Central Florida Press, Orlando.
Moon, D.C., and P. Stiling. 2002. Top-down, bottom-up, or side to side? Within-trophic-level
interactions modify trophic dynamics of a salt marsh herbivore. Oikos 98: 480-490.
Mooring, MT, A.W. Cooper, and E.D. Seneca. 1971. Seed germination response and evidence
for height ecophenes in Spartina alterniflora from North Carolina. American Journal of
Botany 58: 48-55.
Mulholland, M.M., and M.L. Otte. 2001. The effects of nitrogen supply and salinity on [DMSP],
[glycine betaine], and [proline] concentrations in leaves of Spartina anglica. Aquatic
Botany 71: 63-70.
105

Mulkern, G.B. 1967. Food selection by grasshoppers. Annual Review of Entomology 12: 59-
78.
National Research Council (NRC). 1999. Sustaining Marine Fisheries. National Academy
Press, Washington D.C.
Newell, S.Y. 1993. Decomposition of Shoots of a Salt-Marsh Grass: Methodology and
Dynamics of Microbial Assemblages. In: J.G. Jones (ed), Advances in Microbial
Ecology 13: 301-326. Plenum Press, New York.
Newell, S.Y. 1996. Established and potential impacts of eukaryotic mycelial decomposers in
marine/terrestrial ecotones. Journal of Experimental Marine Biology and Ecology 200:
187-206.
Newell, S.Y. 2001a. Fungal biomass and productivity in standing-decaying leaves of black
needlerush (Juncus roemerianus). Marine and Freshwater Research 52: 249-255.
Newell, S.Y. 2001b. Spore-expulsion rates and extents of blade occupation by ascomycetes of
the smooth-cordgrass standing-decay system. Botanica Marina 44: 277-285.
Newell, S.Y. 2001c. Multiyear patterns of fungal biomass dynamics and productivity within
naturally decaying smooth cordgrass shoots. Limnology and Oceanography 46(3): 573-
583.
Newell, S.Y. 2000. Determining biomass and productivity of mycelial marine fungi. In: K. D.
Hyde and S. B. Pointing (eds), Marine Mycology – A Practical Approach. Fungal
Diversity Research Series 1, Fungal Diversity Press, Hong Kong.
Newell, S.Y. and D. Porter. 2000. Microbial secondary production from saltmarsh-grass
shoots, and its known and potential fates, pp. 159-185. In: M. P. Weinstein and D. A.
Kreeger (eds), Concepts and Controversies in Tidal Marsh Ecology. Kluwer Academic,
Dordrecht, The Netherlands.
Newell, S.Y. and K.L. Zakel. 2000. Measuring summer patterns of ascospore release by
saltmarsh fungi. Mycoscience 41: 211-215.
106

Newell, S.Y. and R.D. Fallon. 1991. Toward a method for measuring instantaneous fungal
growth rates in field samples. Ecology 72 (5): 1547-1559.
Newell, S.Y., and F. Bärlocher. 1993. Removal of fungal and total organic matter from
decaying cordgrass leaves by shredder snails. Journal of Experimental Marine Biology
and Ecology 171: 39-49.
Newell, S.Y., D. Porter, and W. L. Lingle. 1996a. Lignocellulolysis by Ascomycetes (Fungi) of a
Saltmarsh Grass (Smooth Cordgrass). Microscopy Research and Technique 33: 32-46.
Newell, S.Y., L.K. Blum, R.E. Crawford, T. Dai, and M. Dionne. 2000. Autumnal Biomass and
Potential Productivity of Salt Marsh Fungi from 29˚ to 43˚ North Latitude along the United
States Atlantic Coast. Applied and Environmental Microbiology 66: 180-185.
Newell, S.Y., R.D. Fallon, and J.D. Miller. 1989. Decomposition and microbial dynamics for
standing, naturally positioned leaves of the salt-marsh grass Spartina alterniflora.
Marine Biology 101: 471-481.
Newell, S.Y., T.L. Arsuffi, and L.A. Palm. 1996b. Misting and nitrogen fertilization of shoots of a
saltmarsh grass: effects upon fungal decay of leaf blades. Oecologia 108: 495-502.
Newell, S.Y., T.L. Arsuffi, and L.A. Palm. 1998. Seasonal and vertical demography of dead
portions of shoots of smooth cordgrass in a south-temperate saltmarsh. Aquatic Botany
60: 325-335.
Newell, S.Y., T.L. Arsuffi, P.F. Kemp, and L.A. Scott. 1991. Water potential of standing-dead
shoots of an intertidal grass. Oecologia 85: 321-326.
Nichols, F.H., J.E. Cloern, S.N. Luoma, and D.H. Peterson. 1986. The modification of an
estuary. Science 231: 567-573.
Niering, W.A., and R.S. Warren. 1980. Vegetation patterns and processes in New Enlgand salt
marshes. BioScience 30(5): 301-307.
Nilson, P., and G. Abrahamsen. 2003. Scots pine and Norway spruce stands responses to
annual N, P and Mg fertilization. Forest Ecology and Management 174: 221-232.
107

Nixon, S.W. 1981. Between coastal marshes and waters: A review of twenty years of marshes
in estuarine productivity and water chemistry. In: P. Hamilton and K.B. MacDonald
(eds.), Estuarine and Coastal Processes, pp 437-525. Plenum Press, New York.
Nixon, S.W., and B.A. Buckley. 2002. “A Strikingly Rich Zone” – Nutrient enrichment and
secondary production in coastal marine ecosystems. Estuaries 25(4B): 782-796.
Nixon, S.W., and C.A. Oviatt. 1973. Ecology of a New England salt marsh. Ecological
Monographs 43: 463-498.
Nomann, B.E., and S.C.Pennings. 1998. Fiddler crab-vegetation interactions in hypersaline
habitats. Journal of Experimental Marine Biology and Ecology 225: 53-68.
Odum, E.P. 1980. The status of three ecosystem level hypotheses regarding salt marshes:
tidal subsidy, outwelling, and the detritus based food chain. In: V.S. Kennedy (ed),
Estuarine Perspectives, Academic Press, NY.
Odum, E.P., and A. de la Cruz. 1967. Particulate organic detritus in a Georgia salt marsh-
estuarine system. In: G.H. Lauff (ed.), Estuaries, pp. 383-385. AAAS Publication 83,
Wahington.
Onuf, C.P., J.M. Teal, and I. Valiela. 1977. Interactions of nutrients, plant growth and herbivory
in a mangrove ecosystem. Ecology 58(3): 517-526.
Osmond, D.L., D. E. Line, J. A. Gale, R.W. Gannon, C. B. Knott, K.A. Bartenhagen, M.H.
Turner, S. W. Coffey, J. Spooner, J. Wells, J. C. Walker, L. L. Hargrove, M.A. Foster, P.
D. Robillard, and D. W. Lehning. 1995. WATERSHEDSS: Water, Soil and Hydro-
Environmental Decision Support System, http://h2osparc.wq.ncsu.edu.
Padgett, D.E., and J.L. Brown. 1999. Effects of drainage and soil organic content on growth of
Spartina alterniflora (Poaceae) in an artificial salt marsh mesocosm. American Journal
of Botany 86(5): 697-702.
108

Paerl, H.W., J.L. Pinckney, J.M. Fear, B.L. Peierls. 1998. Ecosystem responses to internal and
watershed organic matter loading: consequences for hypoxia in the eutrophying Neuse
River Estuary, North Carolina, USA. Marine Ecology Progress Series 166: 17-25.
Paerl, H.W., R.L. Dennis, and D.R. Whitall. 2002. Atmospheric deposition of nitrogen:
Implications for nutrient over-enrichment of coastal waters. Estuaries 25(4B): 677-693.
Paine, R.T. 1974. Intertidal community structure: experimental studies on the relationship
between a dominant competitor and its principle predator. Oecologia 15: 93-120.
Parson, K.A., and A.A, de la Cruz. 1980. Energy flow and grazing behavior of conocephaline
grasshoppers in a Juncus roemerianus marsh. Ecology 61(5): 1045-1050.
Peierls, B.L., N.F. Caraco, M.L. Pace, J.J. Cole. 1991. Human influence on river nitrogen.
Nature 350: 386-387.
Pennings, S.C. and D.J. Moore. 2001. Zonation of shrubs in western Atlantic salt marshes.
Oecologia 126: 587-594.
Pennings, S.C., and C.L. Richards. 1998. Effects of wrack burial in salt-stressed habitats:
Batis maritima in a southwest Atlantic salt marsh. Ecography 21: 630-638.
Pennings, S.C., and M.D. Bertness. 1999. Using latitudinal variation to examine effects of
climate on coastal salt marsh pattern and process. Current topics in Wetland
Biogeochemistry 3: 100-111.
Pennings, S.C., and M.D. Bertness. 2001. Salt Marsh Communities, Chapter 11, pp. 289-316.
In: M.D. Bertness, S.D. Gaines, and M.D. Hay (eds.), Marine Community Ecology.
Sinauer Associates Inc., Sunderland, MA.
Pennings, S.C., and R.M. Callaway. 1992. Salt marsh plant zonation: The relative importance
of competition and physical factors. Ecology 73(2): 681-690.
Pennings, S.C., and R.M. Callaway. 1996. Impact of a parasitic plant on the structure and
dynamics of salt marsh vegetation. Ecology 77(5): 1410-1419.
109

Pennings, S.C., and R.M. Callaway. 2000. The advantages of clonal integration under different
ecological conditions: A community-wide test. Ecology 81(3): 709-716.
Pennings, S.C., E.L Siska, and M.D. Bertness. 2001. Latitudinal differences in plant palatability
in Atlantic Coast salt marshes. Ecology 82(5): 1344-1359.
Pennings, S.C., E.R. Selig, L.T. Houser, and M.D. Bertness. 2003. Geographic variation in
positive and negative interactions among salt marsh plants. Ecology 84(6): 1527-1538.
Pennings, S.C., L.E. Stanton, and J.S.Brewer. 2002. Nutrient effects on the composisiton of
salt marsh plant communities along the Southern Atlantic and Gulf Coasts of the United
States. Estuaries 25(6A): 1164-1173.
Pennings, S.C., T.H. Carefoot, E.L Siska, M.E. Chase, and T.A. Page. 1998. Feeding
Preferences of a generalist salt-marsh crab: relative importance of multiple plant traits.
Ecology 79(6): 1968-1979.
Pfeiffer, W.J., and R.G. Wiegert. 1981. Grazers on Spartina and their predators. In: L.R.
Pomeroy and R.G. Wiegert (eds.), The Ecology of a Salt Marsh, pp.87-112. Springer-
Verlag, New York.
Phleger, C.F. 1971. Effect of salinity on growth of a salt marsh grass. Ecology 52: 908-911.
Press, M.C., and J.D. Graves (eds). 1995. Parasitic Plants. Chapman and Hall, London.
Price, C.H. 1980. Water relations and physiological ecology of the salt marsh snail Melampus
bidentatus Say. Journal of Experimental Marine Biology and Ecology 45: 51-67.
Rabalais, N.N., R.E. Turner, and W.J. Wiseman, Jr. 2002. The Gulf of Mexico Hypoxia, a.k.a.
“The Dead Zone”. The Annual Review of Ecology and Systematics 33: 235-263.
Rand, T.A. 1999. The effects of environmental context on the susceptibility of Atriplex patula to
attack by herbivorous beetles. Oecologia 121: 39-46.
Rand, T.A. 2000. Seed dispersal, habitat suitability and the distribution of halophytes across a
salt marsh tidal gradient. Journal of Ecology 88: 608-621.
110

Rand, T.A. 2002. Variation in insect herbivory across a salt marsh tidal gradient influences
plant survival and distribution. Oecologia 132: 549-558.
Redfield, A.C. 1958. The biological control of chemical factors in the environment. American
Scientist 46(3): 205-221.
Redfield, A.C. 1972. Development of a New England salt marsh. Ecological Monographs 42:
201-237.
Rice, D.L. 1982. The detritus nitrogen problem: new observations and perspectives from
organic geochemistry. Marine Ecology Progress Series 9: 153-162,
Rice, D.L., and K.R. Tenore. 1981. Dynamics of carbon and nitrogen during the decomposition
of detritus derived from estuarine macrophytes. Estuarine Coastal Shelf Science 13:
681-690.
Richards, C.L., S.C. Pennings, and L.A. Donovan. Habitat range and phenotypic variation in
salt marsh plants. In revision.
Rietsma, C.S., I. Valiela, and A. Sylvester-Serianni. 1982. Food preferences of dominant salt
marsh herbivores and detritivores. Marine Ecology 3: 179-189.
Rietsma, Carol, I. Valiela, and R. Buchsbaum. 1988. Detrital Chemistry, Growth, and Food
Choice in the Salt-Marsh Snail (Melampus bidentatus). Ecology 69: 261-266.
Rogers, J., J. Harris, and I. Valiela. 1998. Interaction of nitrogen supply, sea level rise, and
elevation on species form and composition of salt marsh plants. Biological Bulletin 195:
235-237.
Rosemond, AD, CM Pringle, A. Ramirez. 2001. A test of top-down and bottom-up control in a
detritus-based food web. Ecology 82(8): 2279-2293.
Ruppert, E.E., and R. Fox. 1988. Seashore Animals of the Southeast: A Guide to Common
Shallow-Water Invertebrates of the Southeastern Atlantic Coast. University of South
Carolina Press, Columbia, SC.
111

Russell-Hunter, W.D., M.L. Apley, and R.D. Hunter. 1972. Early life history of Melampus and
the significance of semilunar synchrony. Biological Bulletin 143: 623-656.
Ryther, J.H., and W.M. Dunstan. 1971. Nitrogen, phosphorus and eutrophication in the coastal
marine environment. Science 171: 1008- 1013.
Schlesinger, W.H., J.S. Clark, Mohan, C.D. Reid. 2001. Global Environmental Change,
Chapter 9. In: M.E. Soulé and G.H. Orians (eds), Conservtion Biology: Research
Priorities for the Next Decade. Island Press, Washington.
Schmitten, Rolland A. 1999. Essential Fish Habitat: Opportunities and Challenges for the Next
Millennium. American Fisheries Society Symposium 22: 3-10.
Seitzinger, S.P., C. Kroeze, A.F. Bouwman, N. Caraco, F. Dentener, and R.V. Styles. 2002.
Global patterns of dissolved inorganic and particulate nitrogen inputs to coastal systems:
Recent conditions and future projections. Estuaries 25(4B): 640-655.
Seliskar, D.M. 1985. Morphometric variations of five tidal marsh halophytes along
environmental gradients. American Journal of Botany 72: 1340-1352,
Shea, M.L., R.S. Warren, W.A. Niering. 1975. Biochemical and transplantation studies of the
growth form of Spartina alterniflora on Connecticut salt marshes. Ecology 56: 461-466.
Shumway, S.W. 1995. Physiological integration among clonal ramets during invasion of
disturbance patches in a New England salt marsh. Annals of Botany 76: 225-233.
Silliman, B.R., and J.C. Zieman. 2001. Top-down control of Spartina alterniflora production by
periwinkle grazing in a Virginia salt marsh. Ecology 82(10): 2830-2845.
Silliman, B.R., and M.D. Bertness. 2002. A trophic cascade regulates salt marsh primary
production. Proceedings of the National Academy of Science 99: 10500-10505.
Silliman, B.R., and S.Y. Newell. 2003. Fungal farming in a snail. Proceedings of the National
Academy of Science 100(26): 15643-15648.
Siska, E.L., S.C. Pennings, T.L. Buck, M.D. Hanisak. 2002. Latitudinal variation in palatability
of salt-marsh plants: Which traits are responsible? Ecology 83(12): 3369-3381.
112

Smalley, A. 1958. The role of two invertebrate populations, Littorina irrorata and Orchelimum
fidicinum, in the energy flow of a salt marsh ecosysytem. Dissertation. The University of
Georgia, Athens, USA. 126pp.
Smalley, A.E. 1960. Energy flow of a salt marsh grasshopper population. Ecology 41; 785-
790.
Smart, R.M., and J.W. Barko. 1980. Nitrogen nutrition and salinity tolerance of Distichilis
spicata and Spartina alterniflora.
Smith, T.J. III, and W.E. Odum. 1981. The effects of grazing by snow geese on coastal salt
marshes. Ecology 62: 98-106.
Soulé, M.E., and G.H Orians. 2001. Introduction, Chapter 1. In: M.E. Soulé and G.H. Orians
(eds), Conservation Biology: Research Priorities for the Next Decade, pp. 1-9. Island
Press, Washington.
Spelke, J.A., P.E. Fell, and L.L.Helvenston. 1995. Population structure, growth, and fecundity
of Melampus bidentatus (Say) from two regions of a tidal marsh complex in Connecticut.
The Nautilus 108(2): 42-47.
Stiling, P., B.V. Brodbeck, and D.R. Strong. 1991. Population increases of planthoppers on
fertilized salt-marsh cord grass may be prevented by grasshopper feeding. Florida
Entomologist 74(1): 88-97.
Stiven, A.E., and E.J. Kuenzler. 1979. The response of two salt marsh molluscs Littorina
irrorata and Geukensia demissa, to field manipulations of density and Spartina litter.
Ecological Monographs 49(2): 151-171.
Teal, J.M. 1962. Energy flow in the salt marsh ecosystem of Georgia. Ecology 43: 614-624.
Tilman, D. 1982. Resource Competition and Community Structure. Princeton University Press,
Princeton, NJ.
Tilman, D. 1987. Secondary succession and the pattern of plant dominance along
experimental nitrogen gradients. Ecological Monographs 57: 189-214.
113

Tilman,D. 1988. Plant Strategies and the Structure and Dynamics of Plant Communities.
Princeton University Press, Princeton, NJ.
Tober, J., C. Fritz, E. LaBrecque, P.J. Behr, and I.Valiela. 1996. Abundance, biomass, and
species richness of fish communities in relation to nitrogen-loading rates of Waquoit Bay
Estuaries. Biological Bulletin 191: 321-322.
Turner, R.E. 2002. Element ratios and aquatic food webs. Estuaries 25(4B): 694-703.
Turner,R.E. 1976. Geographic variations in salt marsh production: A review. Contributions in
Marine Science 20: 47-68.
Ueckert, D.N., R.M. Hansen, and K.C. Terwilliger. 1972. Influence of plant frequency and
certain morphological variations on diets of rangeland grasshoppers. Journal of Range
Management 25: 61-65.
United Nations. 2001. World Population Monitoring, 2001: Populations, Environment and
Development. Sales No. E.01.XIII.17.
Valdés, L., and A. Lavin. 2002. Dynamics and human impact in the Bay of Biscay: an
ecological perspective. In: K. Sherman and H.R. Skjoldal (eds.), Large Marine
Ecosystems of the North Atlantic. Elsevier, Boston.
Valentine, J.F. and K.L. Heck, Jr. 2001. The role of leaf nitrogen content in determining
turtlegrass (Thalassia testudinum) grazing by a generalized herbivore in the
northeastern Gulf of Mexico. Journal of Experimental Marine Biology and Ecology 258:
65-86.
Valiela, I. 1995. Marine Ecological Processes. Second edition. Springer, New York.
Valiela, I. J.M. Teal, and W.J. Sass. 1975. Production and dynamics of salt marsh vegetation
and the effects of experimental treatment with sewage sludge. Biomass, production and
species composition. Journal of Applied Ecology 12(3): 973-981.
Valiela, I., and J.L. Bowen. 2002. Nitrogen sources to watersheds and estuaries: role of land
cover mosaics and losses within watersheds. Environmental Pollution 118: 239-248.
114

Valiela, I., and J.M. Teal. 1974. Nutrient limitation in salt marsh vegetation. In: R.J. Reimold
and W.H. Queen (eds.), Ecology of Halophytes, pp. 547-563. Academic Press, New
York.
Valiela, I., and M.L. Cole. 2002. Comparitive evidence that salt marshes may protect seagrass
meadows from land-derived nitrogen loads. Ecosystems 5: 92-102.
Valiela, I., J. Wilson, R. Buchsbaum, C. Rietsma, D. Bryant, K. Foreman, and J. Teal. 1984.
Importance of chemical composition of salt marsh litter on decay rates and feeding by
detritivores. Bulletin of Marine Science 35(3): 261-269.
Valiela, I., J.M. Teal, and N.Y. Persson. 1976. Production dynamics of experimentally enriched
salt marsh vegetation: belowground biomass. Limnology and Oceanography 21(2):
245-252.
Valiela, I., J.M. Teal, and W.G. Deuser. 1978. The nature of growth forms in the salt marsh
grass Spartina alterniflora. American Naturalist 112: 461-470.
Valiela, I., J.M. Teal, S.D. Allen, R. van Etten, D. Goehringer, and S. Volkman. 1985.
Decomposition in salt marsh ecosystems: the phases and major factors affecting
disappearance of above ground organic matter. Journal of Experimental Marine Biology
and Ecology 89: 29-54.
Valiela, I; and C.S. Rietsma. 1984. Nitrogen, phenolic acids, and other feeding cues for salt
marsh detritivores. Oecologia 63(3): 350-356.
van der Wal, R., P. Kunst, and R. Drent. 1998. Interactions between hare and brent goose in a
salt marsh system: evidence for food competition? Oecologia 117: 227-234.
Vince, S., I. Valiela, N. Backus, and J.M. Teal. 1976. Predation by the salt marsh killifish
Fundulus heteroclitus (L.) in relation to prey size and habitat structure: consequences
for prey distribution and abundance. Journal of Experimental Marine Biology and
Ecology 123: 255-266.
115

Vince, S.W., I. Valiela, and J.M. Teal. 1981. An experimental study of the structure of
herbivorous insect communities in a salt marsh. Ecology 62: 1662-1678.
Vitousek, P.M. 1994. Beyond global warming: Ecology and global change. Ecology 75(7):
1861-1876.
Waring, G.L., and Cobb, N.S. 1992. The impact of plant stress on herbivore population
dynamics. In: E. Bernays (ed), Insect-Plant Interactions. Volume IV. CRS Press, Boca
Raton.
Weis, J.S., and P. Weis. 2003. Is the invasion of the common reed, Phragmites australis, into
tidal marshes of the eastern US and ecological disaster? Marine Pollution Bulletin 46:
816-820.
Weiss, E.T., R.H. Carmichael, and I. Valiela. 2002. The effect of nitrogen loading on the growth
rates of quahogs (Mercenaria mercenaria) and soft-shell clams through changes in food
supply. Aquaculture 211: 275-289.
White, T.C.R. 1978. The importance of a relative shortage of food in animal ecology.
Oecologia 33: 71-86.
White, T.C.R. 1993. The Inadequate Environment: Nitrogen and the Abundance of Animals.
Springer-Verlag, Berlin.
Wiegert, R.G., and B.J. Freeman. 1990. Tidal Salt Marshes of the Southeast Atlantic Coast: A
Community Profile. U.S. Fish and Wildlife Service Biological Report 85 (7.29).
Wiegert, R.G., L.R. Pomeroy., and W.J. Wiebe. 1981. Ecology of Salt Marshes: An
Introduction, pp. 3-19. In: L.R. Pomeroy & R.G. Wiegert (Eds.), The Ecology of a Salt
Marsh. Springer-Verlag, New York, NY.
Williams, Austin B. 1984. Shrimps, Lobsters, and Crabs of the Atlantic Coast of the Eastern
United States, Maine to Florida. Smithsonian Institution Press, Washington, D.C.
Wilson, S.D. and P.A. Keddy. 1985. Plant zonation on a shoreline gradient: physiological
response curves of component species. Journal of Ecology 73; 851-860.
116
Wisheu, I.C., P.A. Keddy, D.R.J. Moore, S.J. McCanny, and C.L. Gaudet. 1991. Effects of
eutrophication on wetland vegetation. In: J. Kusler and R. Smardon (eds.), Welands of
the Great Lakes: Protection and Restoration Policies: Status of the Science.
Proceedings of an International Symposium, Niagra Falls, New York, May 16-18, 1990.
Managers Inc., New York.
Zimba, P.V. 1991. Production dynamics, community structure, and carbon metabolism of
phytoplankton and subtidal microalgae in a Mississippi salt marsh. Dissertation.
Mississippi State University, Starkville, USA. 174 pp.
Zimmer, M., S.C. Pennings, T.L. Buck, and T.H. Carefoot. 2002. Species-specific patterns of
litter processing by terrestrial isopods (Isopoda: Oniscidea) in high intertidal salt
marshes and coastal forests. Functional Ecology 16: 596-607.
117