
Impact of extra virgin olive oil and EDTA on the oxidative ...
51
1 Impact of extra virgin olive oil and EDTA on the oxidative stability of fish oil 1 microcapsules based on sugar beet pectin 2 3 Sudheera Polovarapu 1 , Christine M. Oliver 2* , Said Ajlouni 1 , Mary Ann Augustin 2 4 5 1 Department of Agriculture and Food Systems, Melbourne School of Land and 6 Environment, University of Melbourne, Victoria 3010, Australia 7 2 Preventative Health National Research Flagship, CSIRO Food and Nutritional 8 Sciences, 671 Sneydes Rd, Werribee, Victoria 3030, Australia 9 10 *corresponding author 11 Christine Maree Oliver, PhD 12 CSIRO Food and Nutritional Sciences, 671 Sneydes Rd, Werribee, Victoria 3030, 13 Australia 14 Tel.: +61 3 9731 3458; fax: +61 3 9731 3250 15 email: [email protected] 16 17 Running title: impact of EDTA on oxidation of ϖ-3 stabilized by beet pectin 18 19 20 ABSTRACT 21 22 The impact of extra virgin olive oil (EVOO) (50% total oil), and ethylene- 23 diaminetetraacetic acid (EDTA) (1.3 mmol L -1 ) on the oxidative stability of omega-3 24 fatty acids in sugar beet pectin-stabilized FO-in-water emulsions (pH 6, 50% w/w oil 25
Transcript of Impact of extra virgin olive oil and EDTA on the oxidative ...

1
Impact of extra virgin olive oil and EDTA on the oxidative stability of fish oil 1
microcapsules based on sugar beet pectin 2
3
Sudheera Polovarapu1, Christine M. Oliver2*, Said Ajlouni1, Mary Ann Augustin2 4
5
1Department of Agriculture and Food Systems, Melbourne School of Land and 6
Environment, University of Melbourne, Victoria 3010, Australia 7
2Preventative Health National Research Flagship, CSIRO Food and Nutritional 8
Sciences, 671 Sneydes Rd, Werribee, Victoria 3030, Australia 9
10
*corresponding author 11
Christine Maree Oliver, PhD 12
CSIRO Food and Nutritional Sciences, 671 Sneydes Rd, Werribee, Victoria 3030, 13
Australia 14
Tel.: +61 3 9731 3458; fax: +61 3 9731 3250 15
email: [email protected] 16
17
Running title: impact of EDTA on oxidation of ωωωω-3 stabilized by beet pectin 18
19
20
ABSTRACT 21
22
The impact of extra virgin olive oil (EVOO) (50% total oil), and ethylene-23
diaminetetraacetic acid (EDTA) (1.3 mmol L-1) on the oxidative stability of omega-3 24
fatty acids in sugar beet pectin-stabilized FO-in-water emulsions (pH 6, 50% w/w oil 25

2
load, dry basis) was investigated after spray drying. Oxidative stability was evaluated 1
by i) fatty acid composition, and formation of propanal and hexanal, during storage at 2
ambient temperature (~25°C) for up to 3 months, and ii) oxygen consumption at 3
80°C, 5 bar oxygen pressure using an Oxipres. Oxidative stability of the omega-3 4
fatty acids was significantly (P < 0.05) higher for FO and FO-EVOO microcapsules 5
formulated with EDTA, in comparison to corresponding microcapsules formulated 6
without EDTA, after 3 months at ambient temperature. A similar trend was obtained 7
by Oxipres measurements. These results demonstrate that the addition of EDTA is 8
an effective strategy to maximise the long-term oxidative stability of 9
microencapsulated FO, using sugar beet pectin as the encapsulant material. 10
11
Keywords: EDTA; extra virgin olive oil; microcapsule; omega-3; oxidation; spray 12
drying; sugar beet pectin 13
14
1. Introduction 15
16
A plethora of epidemiological and clinical evidence exists for the varied and 17
important health benefits of dietary omega-3 (ω-3) polyunsaturated fatty acids 18
(PUFA’s). The health benefits include a decrease in the risk of cardiovascular 19
diseases, inflammatory diseases, mental illnesses and certain cancers, as well as 20
benefits for infants and pregnant women (Das, 2008; Riediger et al., 2009; Roynette et 21
al., 2004). Fish oil (FO) is an important dietary source of the ω-3’s, eicosapentaenoic 22
acid (EPA, 20:5w-3) and docosahexaenoic acid (DHA, 22:6w-3). FO can be 23
incorporated directly into foods to increase the consumption of DHA and EPA. 24
However, due to their high degree of unsaturation, ω-3 FA’s are extremely susceptible 25

3
to oxidation, resulting in a rapid decrease in palatability, nutritional quality and shelf-1
life of foods into which they are incorporated (Garg et al., 2006; Kolanowski & 2
Laufenberg, 2006). Microencapsulation of FO prior to its incorporation into food 3
offers the possibility to improve its oxidative stability (Garg et al., 2006). 4
5
Microencapsulation of lipophillic food ingredients typically involves spray drying an 6
oil-in-water emulsion containing the wall material (i.e. emulsifier, filler) in the 7
aqueous phase (Gharsallaoui et al., 2007). One drawback of microencapsulation by 8
spray drying, however, is the limited number of wall materials suitable to prepare 9
microcapsules intended for food applications (Desai & Park, 2005). Sugar beet (Beta 10
vulgaris L.) pectin (SBP) is a by-product of the sugar processing industry. SBP shows 11
promise as a potential wall material for microencapsulation of oil and oil-soluble 12
bioactives due to its established food ingredient status (Thibault et al., 2001), and 13
excellent emulsifying activity (Castellani et al., 2010; Nakauma et al., 2008; Thibault 14
et al., 2001). However, SBP is reported to have a low emulsifying stability compared 15
to other food hydrocolloids (Funami et al., 2008; Nakauma et al., 2008), and 16
commercial SBP extracts contain relatively high concentrations of metal ions, which 17
catalyze lipid oxidation (Drusch et al., 2007; Katsuda et al., 2008). The effect of 18
adding metal chelating agents to potentially overcome the pro-oxidant behaviour of 19
SBP has not yet been investigated. 20
21
Although encapsulation itself can decrease lipid oxidation, the use of antioxidants in 22
combination with microencapsulation is considered necessary to ensure maximum 23
stability during emulsification, microencapsulation and subsequent storage of 24
microencapsulated bioactive ingredients (Drusch & Mannino, 2009; Jacobsen et al., 25

4
2008; Serfert et al., 2009). Ethylene-diaminetetraacetic acid (EDTA), a multidentate 1
ligand, has been shown to be an effective inhibitor of metal-catalyzed lipid oxidation 2
in oil-in-water emulsions (Coupland & McClements, 1996; Frankel et al., 2002). High 3
concentrations of EDTA (i.e. EDTA:metal ion >1) act as an antioxidant by 4
sequestering the metal ions and preventing their interaction with lipid hydroperoxides 5
(Mahoney & Graf, 1986). 6
7
Extra virgin olive oil (EVOO) obtained by mechanical cold-pressing of ripe olive 8
fruits (Olea europea L) is a fundamental component of the Mediterranean diet and 9
recognized for its health benefits, particularly in relation to lowering the incidence of 10
diseases associated with oxidative stress (e.g. certain cancers, cardiovascular diseases, 11
and atherosclerosis) (Wahrburg et al., 2002). Further, some studies suggest that 12
dietary supplementation of FO and EVOO is more effective in the management of 13
specific diseases than either oil alone (Berbert et al., 2005; Camuesco et al., 2005). 14
15
The importance of EVOO is mainly attributed to a high proportion of 16
monounsaturated FA’s, namely oleic acid (C18:1n-9), and an abundance of natural 17
antioxidants, including tocopherols, carotenoids, flavonoids and phenolic compounds 18
(Cicerale et al., 2009; Frankel, 2010; Servili & Montedoro, 2002). Several classes of 19
phenolic compounds have been identified in EVOO, including secoiridoids (aglyconic 20
derivatives of oleuropein), phenylethyl alcohols (tyrosol and hydroxytyrosol), 21
phenolic acids (hydroxycinnamic and hydroxybenzoic acid derivatives) and lignans 22
(Bendini et al., 2007; Cicerale et al., 2009). These phenolics have a strong natural 23
antioxidant activity, attributed to both their radical-scavenging and metal-chelating 24
properties (Visioli et al., 2001). The excellent oxidative stability and antioxidant 25

5
properties of VOO have been thoroughly investigated (Bendini et al., 2007; Frankel, 1
2010; Kirchene et al., 2010; Lavelli, 2002; Silva et al., 2010a, b). 2
3
Antioxidant activity in emulsions is influenced by many factors, such as their physical 4
location (e.g. water, oil, interface), their physical and chemical properties, emulsifiers, 5
presence of metal ions, and pH (Mancuso et al., 1999; Paiva-Martins & Gordon, 2002; 6
Sørensen et al., 2008). Interactions between emulsifiers, metal ions, pH and 7
antioxidants in an emulsion may also occur and this may influence the pro-8
oxidant/anti-oxidant balance. For example, investigations into the antioxidant 9
behaviour of phenolic compounds in cod liver oil emulsions, found that when iron 10
was present, the pH was crucial for the progress of lipid oxidation. At pH 3 a strong 11
pro-oxidant effect (with or without iron) was observed but at pH 6 its effect depended 12
on the emulsifier type and on the presence of iron (Sørensen et al., 2008). In a recent 13
study, we found that partial substitution of FO by EVOO in spray-dried powders 14
prepared from SBP-stabilized FO and FO-EVOO emulsions (pH 3) did not impede 15
omega-3 oxidation (manuscript submitted). Therefore, the aim of this study was to 16
investigate the impact of EDTA and EVOO on the physicochemical properties and 17
oxidative stability of the omega-3 fatty acids in SBP-stabilized FO-in-water emulsions 18
(pH 6) microencapsulated by spray drying. 19
20
2. Materials and Methods 21
22
2.1 Materials 23
24

6
FO (Hi-DHA 25N) with a peroxide value of 1.4 meq O2 kg-1 and a total ω-3 content 1
of 35%, comprised of 26% DHA and 6% EPA, according to manufacturer’s 2
specifications, was obtained from Nu-Mega Ingredients, Melbourne, Australia). 3
EVOO (Premium Harvest) having a peroxide value of <15 meq O2 kg-1 according to 4
manufacturer’s specifications, was procured from Boundary Bend Marketing Pty Ltd, 5
Lara, Australia. SBP (GENU® pectin type BETA, of ≥60 kDa and degree of 6
acetylation of 23.8% according to manufacturer’s specifications) was kindly donated 7
by CPKelco, Melbourne, Australia. The iron (310 ppm) and copper (10 ppm) contents 8
in SBP were determined by DTS Laboratories (South Kensington, Melbourne, 9
Australia). Dried glucose syrup (DGS) (with dextrose equivalent of 26−30 according 10
to manufacturer’s specifications) was obtained from Manildra, NSW, Australia. FO 11
and EVOO were stored under nitrogen in dark bottles at 4°C (up to 6 mo) or at -20°C 12
(6–24 mo). Folin-Ciocalteau reagent and caffeic acid were obtained from Sigma 13
Chemical Co., St Louis, MO, USA. EDTA was purchased from Ajax Chemicals 14
(NSW, Australia). All other chemicals were of analytical grade. 15
16
2.2 Characterization of the raw materials 17
18
2.2.1 Protein content in sugar beet pectin 19
20
The protein content (N x 6.25) of SBP (0.5 g) was determined using LECO (FP-2000 21
LECO Corp., Michigan, USA) analysis. 22
23
2.2.2 Total phenolic content of extra virgin olive oil 24
25
7
The total phenolic content of EVOO was determined according to the method of 1
Gutfinger (1981). Briefly, an aliquot of oil (2.5 g) was dissolved in hexane (5 ml), and 2
the phenolics extracted with methanol/water (5 ml, 60:40 v/v) for 2 min using a 3
mechanical shaker. After centrifugation (3500 rpm, 10 min) an aliquot (0.2 ml) of the 4
methanol phase was diluted with water to a total volume of 5 ml followed by the 5
addition of Folin-Ciocalteau reagent (0.5 ml). After 3 min, sodium carbonate solution 6
(1 ml, 35% w/v) was added to the reaction mixture, which was then mixed and diluted 7
with water to 10 ml. The absorbance of the solution was measured after 2 h against a 8
reagent blank using a Shimadzu UV-1700 visible spectrophotometer (Kyoto, Japan), 9
at 725 nm. Calibration was performed using standard solutions of caffeic acid (0.05–10
0.5 mg/ml). 11
12
2.3 Preparation and characterization of oil-in-water emulsions 13
14
Emulsions containing FO and FO-EVOO were prepared at 15% total oil, with and 15
without addition of EDTA, yielding 4 different emulsions. To prepare the emulsions, 16
SBP (2% w/v) was dispersed in distilled water at 70°C and held at 70°C for a further 17
15 min before the addition of EDTA (0 or 0.05% w/v) followed by DGS (13 or 18
12.95% w/v). The solution was subsequently cooled to 60°C. FO and EVOO were 19
removed from 4°C storage and heated to 60°C. The FO and FO-EVOO blend (1:1 20
w/w) were dispersed into the aqueous carbohydrate encapsulant mixture (SBP, EDTA 21
(where formulated) and DGS) using a high shear mixer (Silverson, London, UK) for 22
1−2 min (on maximum speed) to obtain the pre-emulsions (30% total solids; 7.5% and 23
15% oil). These pre-emulsions were adjusted to pH 6 (1M NaOH), then the emulsions 24
made up to 2000 g by addition of water. The pH-adjusted pre-emulsions were 25

8
subsequently homogenized at 60°C and 350+100 bar using a high pressure 1
homogenizer (APV Rannie AS Homogenizer, Denmark). The emulsions were 2
prepared on 2 different occasions, yielding a total of 8 emulsions. 3
4
2.3.1 Particle size 5
6
The particle size distributions of the emulsions were determined by laser light 7
scattering (Mastersizer 2000G, Malvern Instruments, Worcestershire, UK) using 8
standard optical parameters. Approximately 0.25 ml of the oil-in-water emulsion was 9
dispersed in recirculating water within the measuring cell (Hydro SM, Worcestershire, 10
UK) until an obscuration rate of 10–20% was reached. The refractive indices of fish 11
oil (1.456) and water (1.330) were used as particle and dispersant, respectively. 12
Results are given in surface mean diameter, d3,2 = (Σnidi3/Σnidi
2). 13
14
2.3.2 Zeta potential 15
16
The electrical charge (ξ) on the oil droplets of the emulsions was determined by 17
measuring the direction and velocity of droplet movement in the applied electric field 18
at 22°C using a Nano Zetasizer (Malvern Instruments Ltd, UK). Prior to 19
measurement, each emulsion (7 µl) was diluted in water (20 ml, pH 6), mixed 20
thoroughly and then injected into the measurement chamber of the instrument. The ξ-21
potential on the oil droplets as a function of pH were performed by adjustment of the 22
pH of the water medium using 0.5 M HCl, 0.2 M HCl and 0.5 M NaOH (Autotitrator-23
MPT-2, Malvern Instruments Ltd, UK). The ξ-potential measurements were taken at 24
100 points over pH 1–6. 25

9
1
2.3.3 Viscosity 2
3
The viscosities of the emulsions were determined at 25°C within 2 h of their 4
preparation using a Paar Physica Rheometer (MCR 300, Anton Paar, Austria) with 5
cup and bob geometry. The flow curves were generated as a function of shear rate in 6
30 steps from 0.2−291 s−1, and 10 s duration at each shear rate. 7
8
2.4 Preparation of spray-dried microcapsules 9
10
The homogenized oil-in-water emulsions were converted into spray-dried powders 11
(i.e. microcapsules) using a Drytec laboratory spray dryer (Tonbridge, UK) with a 12
twin fluid nozzle at 2.5 bar atomizing pressure. The oil-in-water emulsions were 13
heated to 60°C prior to atomization. The inlet and the outlet air temperatures of the 14
spray dryer were 180°C and 80°C, respectively. Two independent microcapsule 15
manufacturing trials were carried out, yielding a total of 8 spray-dried powders (i.e. 16
microcapsules). 17
18
2.4.1 Storage under ambient conditions 19
20
Microcapsule formulations (20 g) were stored in duplicate in transparent, stoppered, 21
oxygen-permeable plastic containers (100 ml volume, 10.8 cm length x 4 cm width) 22
under ambient conditions (~25°C) for 0, 1, 2 and 3 mo. At the end of each storage 23
time the plastic containers were covered with aluminium foil and transferred to frozen 24

10
storage (-18°C), prior to further analysis. The feed emulsions were stored under 1
equivalent conditions for 1 mo then particle size analysis performed immediately. 2
3
2.5 Characterization of the microcapsules 4
5
2.5.1 Moisture content 6
7
The moisture contents of the microcapsules (4 g) were determined (MA30, Sartorius 8
Mechatronics, Gottingen, Germany) at 80°C. 9
10
2.5.2 Water activity (aw) 11
12
The aw of the microcapsules was determined (Aqua-Lab Water Activity Meter, Series 13
3, Decagon Devices Inc, USA) at 25°C. 14
15
2.5.3 Scanning electron microscopy (SEM) 16
17
The surface morphology of the microcapsules was visualized by SEM (Philips 18
XL30FEG scanning electron microscope, Eindhoven, Netherlands) at The University 19
of Melbourne. 20
21
2.5.4 Particle size of the reconstituted microcapsules 22
23
The microcapsules were reconstituted in water (10% w/v) at 70°C for 3 h under 24
constant stirring, and then rested for 1 h at room temperature (~25°C). The particle 25

11
sizes of the reconstituted microcapsules were determined in the same manner as the 1
emulsions. 2
3
2.5.5 Estimation of total oil 4
5
The total oil contents of the microcapsules were determined according to the Schmid-6
Bondzyndki-Ratzlaff method (1988). 7
8
2.5.6 Solvent-extractable oil 9
10
The solvent-extractable fat contents of the microcapsules were used as an indicator of 11
the microencapsulation efficiency (ME). The method was based on Pisecky (1997) 12
except that petroleum ether replaced carbon tetrachloride. Briefly, petroleum ether (50 13
ml) was added to 10 g powder and the mixture agitated in a stoppered flask for 15 14
min. The mixture was filtered (Whatman No.541) and the solvent evaporated at 60°C 15
using a rotary evaporator. The remaining fat residue was then oven-dried at 105°C for 16
1 h. 17
ME (%) = 100- (% solvent-extractable oil / % total oil) × 100 [Eq. 1] 18
19
2.6 Fatty acid composition 20
21
2.6.1 Lipid extraction 22
23
To extract the total lipid, water (2 ml) was added to the microcapsule (100 mg) and 24
vortexed in the presence of argon to prevent lipid oxidation. After heating at 50°C for 25
12
15 min the slurry was cooled to room temperature (~ 25°C), then isopropanal (4 ml) 1
was added and the suspension re-vortexed. Hexane (4 ml) was added and the 2
suspension mixed by inversion and then centrifuged (1000 x g, 10 min). The solvent 3
layer was removed. Another 4 ml hexane was added to the remaining slurry and re-4
centrifuged (1000 x g, 10 min). The solvent layer was combined with that obtained 5
from the first extraction and the solvent then evaporated by flushing with N2, prior to 6
FA methylation 7
8
2.6.2 Fatty acid methylation 9
10
FA methyl esters (FAME) were prepared by transmethylesterification according to 11
Christie (2003) with some modification (Zhiping Shen, personal communication). 12
Toluene (2 ml) and methanolic sulphuric acid (1–2%) were added to the extract. The 13
solution was mixed and blanketed with argon before leaving overnight at 50°C. 14
Sodium chloride solution (5%, 4 ml) and hexane (4 ml) were added the following day, 15
and the solution mixed by inversion. The solvent layer was removed and vortexed (20 16
s) in the presence of potassium bicarbonate (2%, 4 ml). The solvent layer of this 17
solution was transferred to vials containing anhydrous sodium sulphate. After ~30 18
min the methyl ester-hexane solution was analyzed by gas chromatography (GC). 19
20
2.6.3 Gas chromatography 21
22
The FA composition of the oils prior to encapsulation, and of the oil extracted from 23
each microcapsule, was determined by GC using a 17A gas chromatograph 24
(Shimadzu corp., Japan) equipped with a BPX-70 fused silica capillary column (30 m, 25
13
0.25 mm i.d., 0.5 µm film thickness) and a FID (flame ionization detector). The oven 1
temperature was set at 60°C and then increased to 170°C at 20°C min-1. The 2
temperature was then increased further to 210°C at 2°C min-1, and finally from 210 to 3
230°C at 10°C min-1. The injector and detector were maintained at 220°C and 250°C, 4
respectively. The injection volume was 1 µl, and each oil sample was analyzed in 5
duplicate. The FA composition was calculated using GC peak area responses. The % 6
loss of DHA, EPA and oleic acid was quantified on the basis of the ratio between the 7
peak areas of each FA and the peak areas of palmitic acid (C16:0), since saturated FA 8
are not altered by autoxidation (Dobarganes & Pérez-Camino, 1988). 9
10
2.7 Headspace analysis 11
12
Propanal and hexanal analysis were performed on 2 g of the microcapsules that were 13
placed in 10 ml headspace vials, sealed and equilibrated at 60°C for 10 min in a water 14
bath. Headspace propanal and hexanal concentrations were measured in 1 ml of the 15
headspace using a Varian 3400 GC (Varian Associates Inc., USA) equipped with a 16
BPX-70 fused silica capillary column (30 m, 0.25 mm i.d., 0.25 µm film thickness). 17
The injector and detector temperatures were 250°C and 275°C, respectively. The oven 18
temperature was set at 60°C and held for 5 min, then increased to 175ºC at 10ºC min-19
1, and finally increased to 220ºC at 4ºC min-1. Quantification of propanal and hexanal 20
was determined from peak areas using propanal (R2 = 0.9724) and hexanal (R2 = 21
0.9580) standard curves covering the range of the respective volatile contents found in 22
the headspace of the microcapsules, and were respectively prepared from propanal 23
and hexanal in water. 24
25
14
2.8 Oxidative stability under accelerated storage conditions 1
2
The oxidative stability of the bulk oils, emulsions and microcapsules (equivalent to 4 3
g total oil) was assessed electronically at 80°C under oxygen pressure (5 bar) in an 4
ML Oxipres® apparatus (DK-8270, Mikrolab Aarhus A/S, Højbjerg, Denmark) 5
installed with Paralog software. The induction period (IP), which is defined as the 6
time (h) required for oxidation to initiate, was determined graphically as the cross-7
section of the line during the IP and the second line along the pressure decline. The 8
slope (-mbar h-1) describes the oxidation rate, and was calculated by drawing a line at 9
the IP point parallel to the part of the curve recording the change in pressure. 10
11
2.9 Brightfield microscopy 12
13
The emulsions and reconstituted powders (10% w/v) were visualized by brightfield 14
microscopy (Olympus BH-2, Anax Pty. Ltd, Japan) equipped with an attached 15
camera. Oil-Red-Oil dye (1 drop) was added to each emulsion (~1 ml) and visualized 16
using a 10x objective magnification. The images were processed by image acquisition 17
software, anaLYSIS getIT. 18
19
2.10 Statistics 20
21
All analytical determinations were carried out in duplicate with at least 2 22
measurements within each run. The results were reported as the mean ± standard 23
deviation (SD) of these measurements. Analysis of variance (ANOVA) and LSD 24

15
comparison between sample means were performed using SPSS 18 (SPSS Inc., 1
Chicago, USA). 2
3
3. Results and Discussion 4
5
3.1 Characteristics of the raw materials 6
7
3.1.1 Protein content of sugar beet pectin 8
9
The emulsifying activity of SBP is attributed mainly to its proteinaceous moiety, 10
which acts as a hydrophobic anchor for the emulsified oil droplet surface (Funami et 11
al., 2010). Conversely, emulsion stability is supported by the carbohydrate fraction. In 12
particular, it is envisaged that the carbohydrate chains protrude out into the aqueous 13
phase and provide emulsion stability via viscosity effects, and steric and electrostatic 14
mechanisms. The protein content of SBP has been variously reported over the range 15
2−10% (Leroux et al., 2003; Thibault, 1988; Williams et al., 2005). It could therefore 16
be expected that its emulsification performance may vary depending on the 17
production batch and natural diversity. The commercial SBP extract used in the 18
current study contained 4.9% ± 0.05 w/w protein, and is similar to that reported in 19
several recent studies (Castellani et al., 2010; Drusch, 2007; Nakauma et al., 2008). 20
21
3.1.2 Polyphenol content of extra virgin olive oil 22
23
It is widely accepted that the phenolic compounds in EVOO contribute to its excellent 24
oxidative stability (Bendini et al., 2007; Gutfinger, 1981; Servili & Montedoro, 2002; 25
16
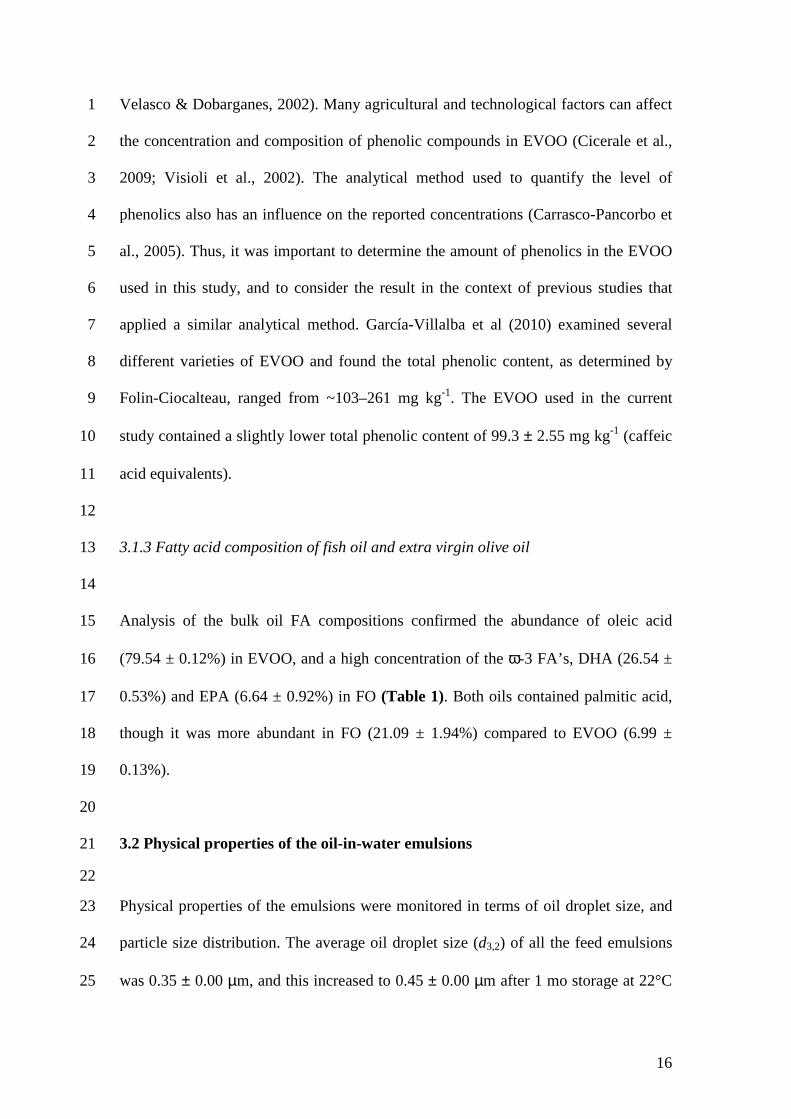
Velasco & Dobarganes, 2002). Many agricultural and technological factors can affect 1
the concentration and composition of phenolic compounds in EVOO (Cicerale et al., 2
2009; Visioli et al., 2002). The analytical method used to quantify the level of 3
phenolics also has an influence on the reported concentrations (Carrasco-Pancorbo et 4
al., 2005). Thus, it was important to determine the amount of phenolics in the EVOO 5
used in this study, and to consider the result in the context of previous studies that 6
applied a similar analytical method. García-Villalba et al (2010) examined several 7
different varieties of EVOO and found the total phenolic content, as determined by 8
Folin-Ciocalteau, ranged from ~103–261 mg kg-1. The EVOO used in the current 9
study contained a slightly lower total phenolic content of 99.3 ± 2.55 mg kg-1 (caffeic 10
acid equivalents). 11
12
3.1.3 Fatty acid composition of fish oil and extra virgin olive oil 13
14
Analysis of the bulk oil FA compositions confirmed the abundance of oleic acid 15
(79.54 ± 0.12%) in EVOO, and a high concentration of the ω-3 FA’s, DHA (26.54 ± 16
0.53%) and EPA (6.64 ± 0.92%) in FO (Table 1). Both oils contained palmitic acid, 17
though it was more abundant in FO (21.09 ± 1.94%) compared to EVOO (6.99 ± 18
0.13%). 19
20
3.2 Physical properties of the oil-in-water emulsions 21
22
Physical properties of the emulsions were monitored in terms of oil droplet size, and 23
particle size distribution. The average oil droplet size (d3,2) of all the feed emulsions 24
was 0.35 ± 0.00 µm, and this increased to 0.45 ± 0.00 µm after 1 mo storage at 22°C 25

17
(results not shown). No visible particle aggregation or non-encapsulated (‘free’) oil 1
was evident in the fresh emulsions (results not shown), as evident by brightfield 2
microscopy, and no visual creaming or phase separation was observed after storage at 3
25°C (1 mo). Thus, 2% SBP was sufficient to produce fine and physically stable oil-4
in-water emulsions containing at least 15% w/w oil phase (wet basis). This result 5
concurred with the published literature (Drusch, 2007; Drusch et al., 2007; Funami et 6
al., 2010; Leroux et al., 2003; Nakauma et al., 2008; Siew & Williams, 2008; 7
Williams et al., 2005). 8
9
Slight differences in the particle size distributions were observed for FO and FO-10
EVOO-EDTA compared to FO-EVOO and FO-EDTA. Thus, the minor components 11
in the emulsion formulations affected their particle size distribution. As shown in Fig. 12
1-A, FO and FO-EVOO-EDTA had primarily a monomodal particle size distribution 13
with a major peak at 0.35 µm. In the case of FO-EVOO and FO-EDTA, the particle 14
size distribution was bimodal with a major peak at 0.35 µm and a second broader 15
minor peak at 3−7 µm. SBP dissolved in water alone had a d3,2 of 2.38 ± 0.31 µm, and 16
thus contributed to the particle size distribution of all the feed emulsions. 17
18
The shear-thinning property of all the feed emulsions (Fig. 1-B) is a common feature 19
of oil-in-water emulsions (McClements, 1999). Interestingly, FO and FO-EVOO-20
EDTA had slightly lower viscosity than FO-EVOO and FO-EDTA over the shear rate 21
range measured, especially at low shear rate (0−120 s-1). Overall, the slight 22
differences in the physical properties of the FO emulsions containing both EVOO and 23
EDTA compared to those containing either EVOO or EDTA, suggested that the 24
presence of metal ions and minor compounds (e.g. peptides, phenols, mono- and di-25
18
glycerides and free FA’s) present in EVOO (Sotiroudis et al., 2005) contributed to the 1
interfacial properties of the SBP-stabilized FO-in-water emulsions and/or bulk 2
aqueous phase of the emulsions. 3
4
3.3 Microcapsule characteristics 5
6
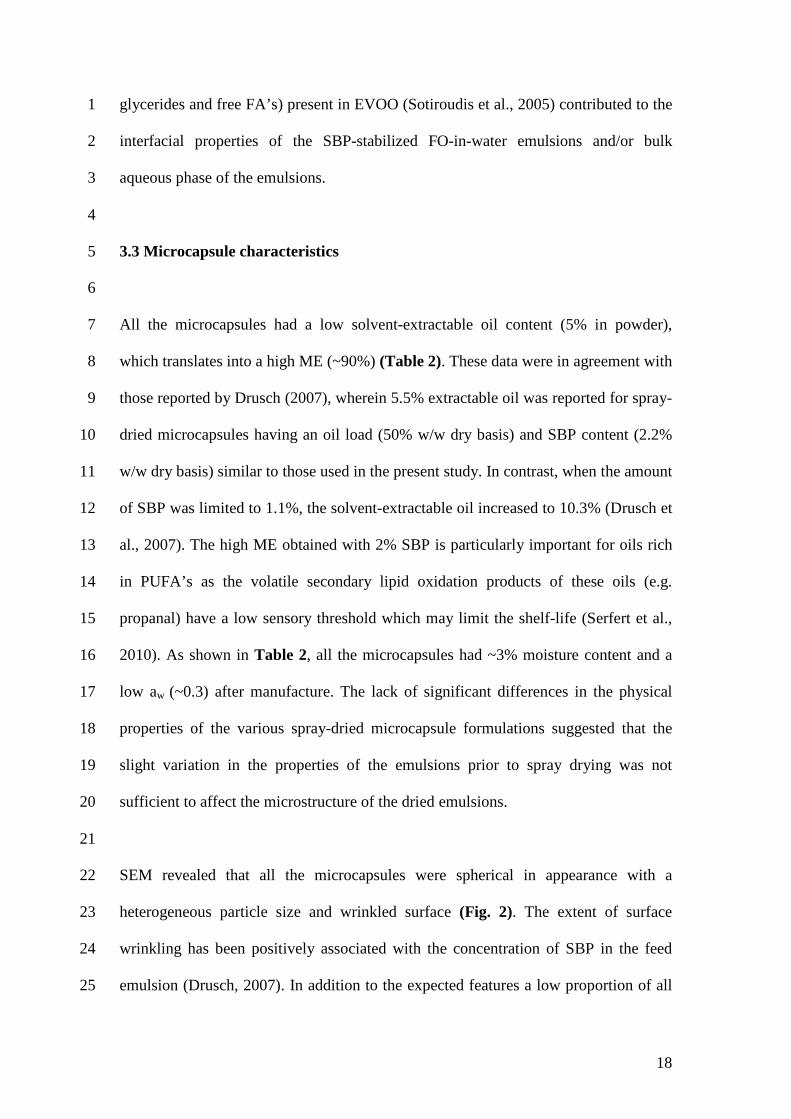
All the microcapsules had a low solvent-extractable oil content (5% in powder), 7
which translates into a high ME (~90%) (Table 2). These data were in agreement with 8
those reported by Drusch (2007), wherein 5.5% extractable oil was reported for spray-9
dried microcapsules having an oil load (50% w/w dry basis) and SBP content (2.2% 10
w/w dry basis) similar to those used in the present study. In contrast, when the amount 11
of SBP was limited to 1.1%, the solvent-extractable oil increased to 10.3% (Drusch et 12
al., 2007). The high ME obtained with 2% SBP is particularly important for oils rich 13
in PUFA’s as the volatile secondary lipid oxidation products of these oils (e.g. 14
propanal) have a low sensory threshold which may limit the shelf-life (Serfert et al., 15
2010). As shown in Table 2, all the microcapsules had ~3% moisture content and a 16
low aw (~0.3) after manufacture. The lack of significant differences in the physical 17
properties of the various spray-dried microcapsule formulations suggested that the 18
slight variation in the properties of the emulsions prior to spray drying was not 19
sufficient to affect the microstructure of the dried emulsions. 20
21
SEM revealed that all the microcapsules were spherical in appearance with a 22
heterogeneous particle size and wrinkled surface (Fig. 2). The extent of surface 23
wrinkling has been positively associated with the concentration of SBP in the feed 24
emulsion (Drusch, 2007). In addition to the expected features a low proportion of all 25
19
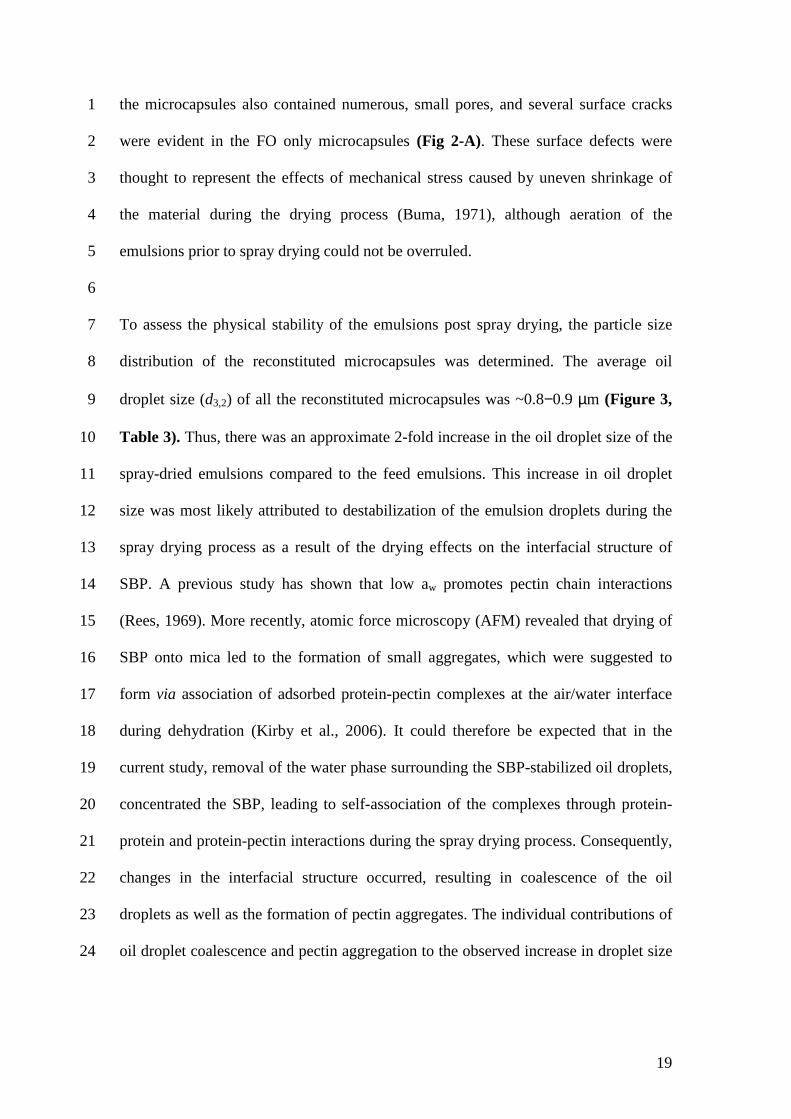
the microcapsules also contained numerous, small pores, and several surface cracks 1
were evident in the FO only microcapsules (Fig 2-A). These surface defects were 2
thought to represent the effects of mechanical stress caused by uneven shrinkage of 3
the material during the drying process (Buma, 1971), although aeration of the 4
emulsions prior to spray drying could not be overruled. 5
6
To assess the physical stability of the emulsions post spray drying, the particle size 7
distribution of the reconstituted microcapsules was determined. The average oil 8
droplet size (d3,2) of all the reconstituted microcapsules was ~0.8−0.9 µm (Figure 3, 9
Table 3). Thus, there was an approximate 2-fold increase in the oil droplet size of the 10
spray-dried emulsions compared to the feed emulsions. This increase in oil droplet 11
size was most likely attributed to destabilization of the emulsion droplets during the 12
spray drying process as a result of the drying effects on the interfacial structure of 13
SBP. A previous study has shown that low aw promotes pectin chain interactions 14
(Rees, 1969). More recently, atomic force microscopy (AFM) revealed that drying of 15
SBP onto mica led to the formation of small aggregates, which were suggested to 16
form via association of adsorbed protein-pectin complexes at the air/water interface 17
during dehydration (Kirby et al., 2006). It could therefore be expected that in the 18
current study, removal of the water phase surrounding the SBP-stabilized oil droplets, 19
concentrated the SBP, leading to self-association of the complexes through protein-20
protein and protein-pectin interactions during the spray drying process. Consequently, 21
changes in the interfacial structure occurred, resulting in coalescence of the oil 22
droplets as well as the formation of pectin aggregates. The individual contributions of 23
oil droplet coalescence and pectin aggregation to the observed increase in droplet size 24

20
of the reconstituted microcapsules could not be ascertained from the methodology 1
used. 2
3
3.4 Physical stability of the microcapsules during storage under ambient 4
conditions 5
6
The effect of storage on the physical properties of the microcapsules was studied in 7
relation to their powder morphology and particle size distribution on reconstitution, at 8
monthly intervals throughout the entire storage duration (3 mo). Results obtained by 9
SEM did not indicate any gross changes in the morphology of the microcapsules at 3 10
mo (Fig. 2, images E−−−−H). However, surface defects were less apparent, possibly due 11
to occlusion of the defects by partial release of the microencapsulated oil on storage. 12
Indeed, the spray-dried powders became increasing difficult to reconstitute, especially 13
at 2 and 3 mo storage, and visual caking of these powders was observed. Particle size 14
analysis showed that oil coalescence and particle aggregation are likely to have 15
occurred on storage. After 1 mo a bimodal particle size distribution was evident, with 16
a major peak at 0.1–20 µm, and a second, minor peak corresponding to particles 17
between 30–100 µm (Fig. 3). With further storage the emulsions displayed a 18
multimodal particle size distribution with predilection toward increased particle size. 19
The average oil droplet size range (d3,2) increased from 0.84–0.90 ± 0.01 µm for 20
microcapsules stored for 1 mo, to 1.27–1.35 ± 0.04 µm at 2 mo, and 1.44–1.46 ± 0.04 21
µm at 3 mo (Table 3). Moisture content increased slightly. The maximum moisture 22
content (3.5%) was recorded for the FO microcapsules stored 3 mo. Water activity at 23
3 mo was similar for all the microcapsules, and had increased to 0.49 ± 0.01 due to 24
equilibration with the ambient humidity (0.5 aw). This is higher than the ideal range of 25
21
0.2−0.4 aw for lipid oxidation storage stability reported elsewhere (Rockland & 1
Beuchat, 1987; Rückold et al., 2001). 2
3
3.5 Oxidative stability of the microcapsules during storage under ambient 4
conditions 5
6
3.5.1 Headspace analysis 7
8
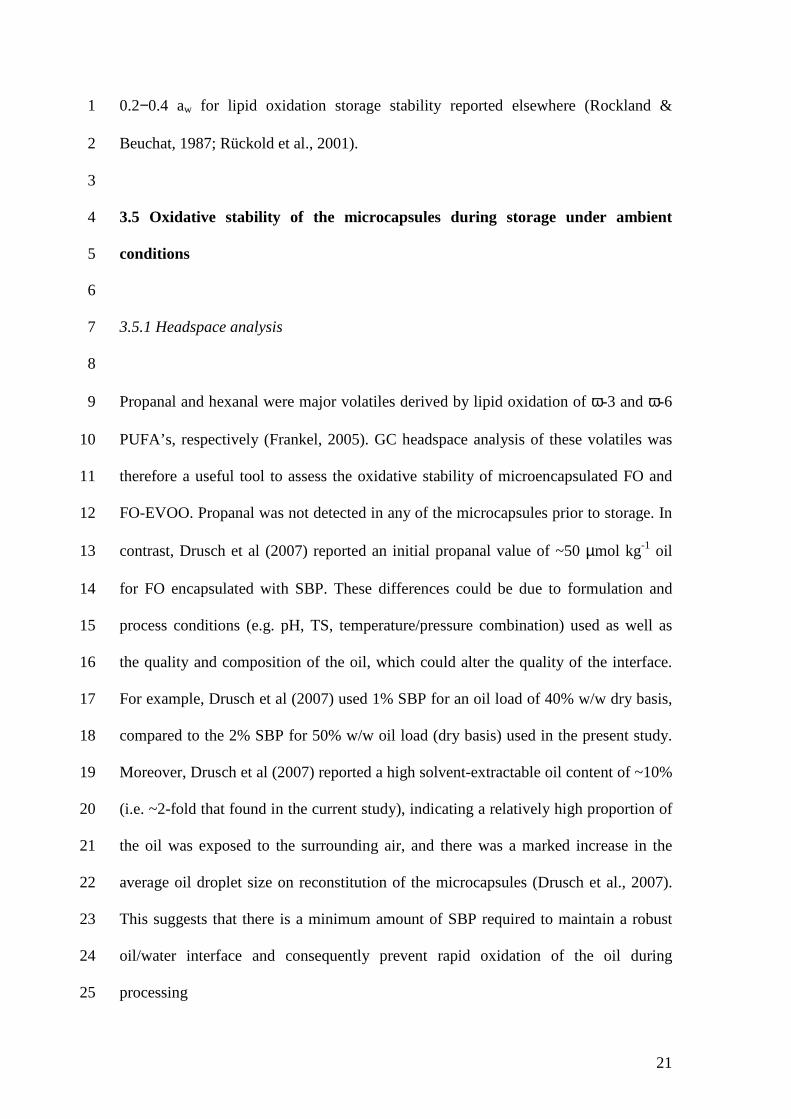
Propanal and hexanal were major volatiles derived by lipid oxidation of ω-3 and ω-6 9
PUFA’s, respectively (Frankel, 2005). GC headspace analysis of these volatiles was 10
therefore a useful tool to assess the oxidative stability of microencapsulated FO and 11
FO-EVOO. Propanal was not detected in any of the microcapsules prior to storage. In 12
contrast, Drusch et al (2007) reported an initial propanal value of ~50 µmol kg-1 oil 13
for FO encapsulated with SBP. These differences could be due to formulation and 14
process conditions (e.g. pH, TS, temperature/pressure combination) used as well as 15
the quality and composition of the oil, which could alter the quality of the interface. 16
For example, Drusch et al (2007) used 1% SBP for an oil load of 40% w/w dry basis, 17
compared to the 2% SBP for 50% w/w oil load (dry basis) used in the present study. 18
Moreover, Drusch et al (2007) reported a high solvent-extractable oil content of ~10% 19
(i.e. ~2-fold that found in the current study), indicating a relatively high proportion of 20
the oil was exposed to the surrounding air, and there was a marked increase in the 21
average oil droplet size on reconstitution of the microcapsules (Drusch et al., 2007). 22
This suggests that there is a minimum amount of SBP required to maintain a robust 23
oil/water interface and consequently prevent rapid oxidation of the oil during 24
processing 25
22
1
It is noteworthy, that, in the present study, the pH of the emulsions was pre-adjusted 2
from the initial pH range of 2.98−3.29 to pH 6, prior to spray drying. The relatively 3
high pH could have obviated a rapid, metal ion-induced catalytic decomposition of the 4
ω-3 FA’s. Several other studies have shown a pro-oxidative effect in oil-in-water 5
emulsions at low pH (Haahr & Jacobsen, 2008; Sørensen et al., 2008). The increased 6
solubility of iron was suggested to be partly responsible for the rapid oxidation at low 7
pH. SBP is known to contain metal ions (Drusch et al., 2007; Kamnev et al., 1997; 8
Katsuda et al., 2008). The commercial SBP extract used in the current study contained 9
relatively high concentrations of the transition metal ions, Cu (equivalent to 0.002 10
ppm Cu per 100 ml emulsion) and Fe (equivalent to 0.6 ppm Fe per 100 ml emulsion), 11
which would rapidly promote lipid oxidation. In preliminary studies (manuscript 12
submitted), we found that under equivalent formulation and processing conditions to 13
those used herein, with the single exception that no pH adjustment of the emulsions 14
was performed prior to spray drying, oxidation, as determined by headspace propanal, 15
occurred even during the emulsion preparation and/or spray drying process. The fact 16
that higher pH alone improved the oxidative stability of the microcapsules suggests 17
that the solubility of iron was an important factor affecting lipid oxidation in oil-in-18
water emulsions at low pH (manuscript submitted). The results also showed that a 19
high pH is recommended to prolong the oxidative stability of SBP-stabilized oil-in-20
water emulsions, due to the endogenous metal ions present in SBP. 21
22
The charge of the emulsifier has also been considered to be an important factor in 23
lipid oxidation due to electrostatic interactions with the positively charged metal ions 24
(Mei et al., 1998). The SBP-stabilized oil droplets had an isoelectric point of 1.55. 25

23
Thus the droplets were more negatively charged at pH 6 (ξ-potential = -41.5 ± 2.12 1
mV) than pH 3 (ξ-potential = -14.0 ± 1.41 mV). Considering this factor alone would 2
suggest that at pH 6 the metal ions would be more concentrated at the droplet surface 3
and therefore facilitate oxidation. However, as mentioned, emulsions prepared at pH 6 4
had a greater oxidative stability than those prepared at pH ~3, despite the fact that the 5
oil droplets were more negatively charged at the higher pH. Hence, in this study, the 6
metal chelation property of SBP was more important than its charge. 7
8
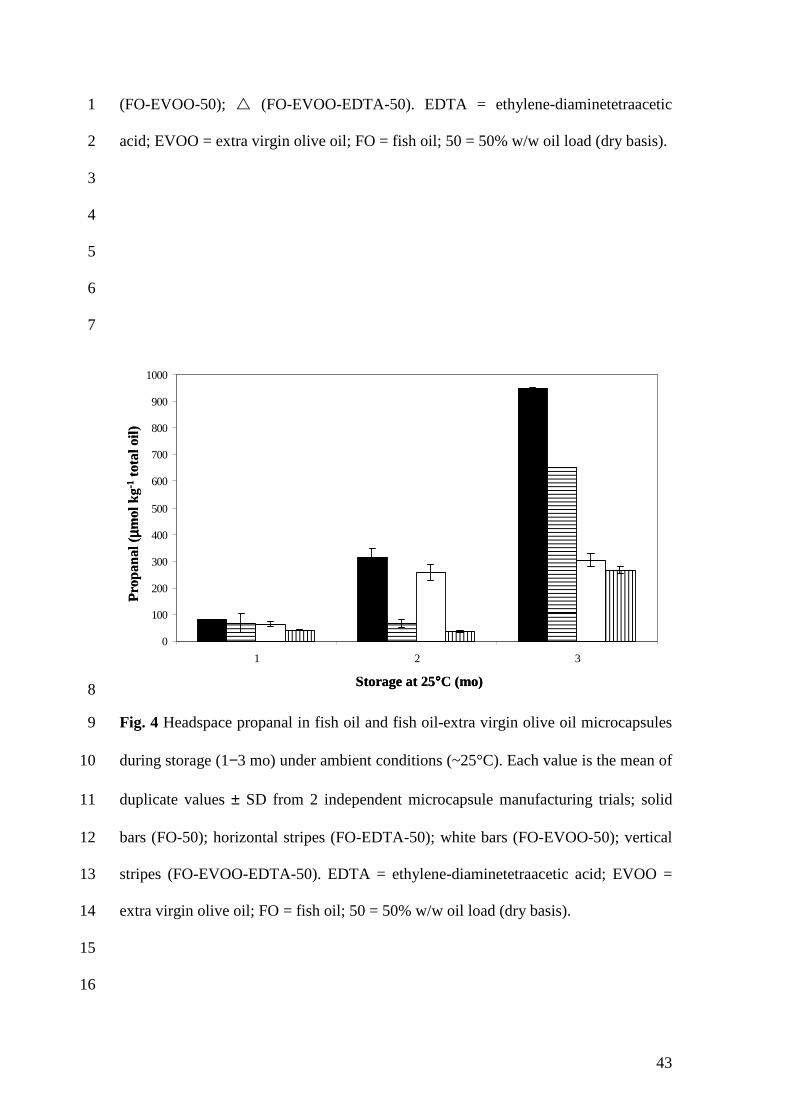
In the typical course of oxidation, the concentration of secondary oxidation products 9
increases to a maximum before declining. Furthermore, the triglycerides most 10
susceptible to oxidation are generally the first to reach the concentration maxima for 11
secondary oxidation products. During storage at ambient conditions the concentration 12
of propanal generally increased with increased storage duration (Fig. 4). However, the 13
extent of oxidation was less in microcapsules that had been formulated with EDTA. 14
After storage for 3 mo, lipid oxidation was significantly (P < 0.05) higher for FO-15
EDTA (651.72 ± 0.00 µmol propanal kg-1 oil) and FO-EVOO-EDTA (264.83 ± 16
13.65 µmol propanal kg-1 oil) compared to FO (950.00 ± 2.44 µmol propanal kg-1 oil) 17
and FO-EVOO (303.45 ± 24.38 µmol propanal kg-1 oil), respectively. 18
19
Hexanal was detected at low concentration after 2 mo storage, and was limited to 20
microencapsulated FO (3.36 ± 0.31 µmol kg-1 oil) and FO-EVOO (11.39 ± 7.86 µmol 21
kg-1 oil). After 3 mo the hexanal concentration had increased slightly, with 22
microencapsulated FO containing 14.17 ± 0.39 µmol kg-1 oil, and FO-EVOO 23
containing 12.22 ± 1.57 µmol kg-1 oil. FO-EVOO-EDTA (4.86 ± 0.98 µmol kg-1 oil) 24
and FO-EDTA (34.86 ± 0.59 µmol kg-1 oil) also contained low concentrations of 25
24
hexanal at the end of the storage duration. The relatively late evolution and low 1
concentrations of hexanal, in comparison to propanal, could be expected as 2
monounsaturated FA’s are approximately 10−40 fold less susceptible to oxidation 3
than PUFA’s (Frankel, 2005), and this was confirmed in the FA composition analysis 4
(Table 4). Interestingly, FO-EDTA produced the highest amount of hexanal on 5
storage. Peroxides derived from ω-3 FA’s are particularly susceptible to metal ion-6
catalyzed degradation due to their high degree of unsaturation (Frankel, 2005). For 7
this reason EDTA should be more effective in retarding volatiles formed from ω-3 8
PUFA than from n-6 peroxides. However, EDTA has also been found to have a pro-9
oxidant effect on production of particular volatiles, including hexanal, in ω-3 enriched 10
oil-in-water emulsions stabilized by lecithin and caseinate at pH 7 (Haahr & Jacobsen, 11
2008). The authors suggested that the EDTA-metal ion complex could act 12
catalytically in the presence of these emulsifiers due to the availability of a free co-13
ordination site that is available for redox reactions (Mahoney & Graf, 1986). This 14
could explain the increased amount of headspace hexanal found in the FO-EDTA 15
formulation in comparison to the other formulations. 16
17
3.5.2 Fatty acid composition of the microencapsulated oil 18
19
The DHA (21.33 ± 0.16%) and EPA (5.34 ± 0.05%) composition of the 20
microencapsulated FO (Table 4-A) was slightly lower than that of the bulk FO, which 21
amounted to 26.54 ± 0.53% DHA and 6.64 ± 0.92% EPA (Table 1), indicating initial 22
oxidation of these PUFA’s had occurred during the preparation of the emulsions 23
and/or spray drying process. The extreme sensitivity of these PUFA’s to oxygen, 24
light, heat and metal ions is well-known (Garg et al., 2006; Kolanowski & 25
25
Laufenberg, 2006). Therefore the lack of headspace propanal detected in the 1
microcapsules may have been due to vaporisation of the volatile during spray drying. 2
The presence of EDTA improved the initial oxidative status (Table 4-B). Thus, metal 3
ions were partially responsible for rapid PUFA oxidation. During storage, the rate of 4
PUFA oxidation in the microcapsules was affected by the composition of the oil and 5
the presence of EDTA (Table 4). The course of lipid oxidation measured as FA 6
composition was lower in the microcapsules containing EDTA compared to their 7
corresponding microcapsules formulated in the absence of EDTA. As could be 8
expected based on the FA composition of EVOO, microcapsules containing the 9
EVOO-FO oil blend were less oxidized after prolonged storage (> 2 mo) than the FO 10
only microcapsules. In all samples, DHA was generally more sensitive to oxidation 11
than EPA throughout the storage duration. A similar trend has been reported by 12
previous authors (Cho et al., 1987; Lee et al., 2003). The higher rate of DHA 13
autoxidation in comparison to EPA may be due to the greater number of double bonds 14
in DHA. Holman and Elmer (1947) monitored the oxygen uptake of oleic, linoleic and 15
α-linolenic acids, and showed an exponential increase in the rate of autoxidation as 16
the number of double bonds in the FA increased. It could also be expected that DHA 17
will out-compete EPA for any available oxygen as the initial content of DHA in the 18
FO is higher than that of EPA (Table 1). 19
20
The high proportion (final/initial x 100%) of DHA and EPA remaining in the 21
microcapsules formulated with EDTA, in comparison to corresponding microcapsules 22
formulated without EDTA, corroborated the results found by headspace propanal 23
analysis. Since EDTA improved the oxidative stability of microencapsulated FO, 24
metal ion-catalyzed oxidation was an important factor responsible for FO oxidation. 25

26
EDTA also improved the oxidative stability of omega-3 fatty acids in the FO-EVOO 1
blend during long-term storage. In the absence of EDTA, metal ions have been shown 2
to decrease the antioxidant effectiveness of EVOO phenolics in oil-in-water 3
emulsions (Keceli & Gordon, 2002; Paiva-Martins & Gordon, 2002, 2005; Paiva-4
Martins et al., 2006). These authors showed that in specific circumstances (e.g. pH < 5
6), the ability of the phenolic compounds to act as antioxidants by chelating metal 6
ions was less effective due to their ability to reduce metal ions back to their most pro-7
oxidant state. In the current study, the oxidative stability of the omega-3 FA’s in FO-8
EVOO microcapsules were significantly improved by incorporation of EDTA. 9
However, in comparison to the difference in oxidative stability of the omega-3 FA’s 10
in these formulations compared to FO vs FO-EDTA, the difference was not so 11
remarkable. This suggests that the pro-oxidant behaviour of EVOO phenolics in the 12
presence of Fe3+ and Cu2+ was effectively controlled under the conditions used in this 13
study (i.e. pH 6, low aw). 14
15
3.6 Oxidative stability of the microcapsules under accelerated storage conditions 16
17
Oxidative stability tests carried out under accelerated storage conditions can provide 18
meaningful information on the oxidative stability of lipids within a much shorter 19
period of time than storage tests performed at ambient conditions. The oxidative 20
stability, with respect to IP and rate of oxygen uptake, of the emulsions and 21
microcapsules were evaluated at 80°C and 5 bar oxygen pressure by Oxipres. FO 22
(3.2 ± 0.28 h) and FO-EVOO (3.9 ± 0.28 h) emulsions had a similar, low IP. Hence, 23
under these conditions the oil composition was not an important determinant of 24
oxidative stability. EDTA increased (P < 0.05) the oxidative stability of FO and FO-25
27
EVOO emulsions compared to their corresponding emulsions formulated without 1
EDTA (Table 5). The emulsions with highest oxidative stability were observed in the 2
FO-EVOO-EDTA formulation with an IP value of 23.65 ± 0.49 h and oxygen uptake 3
rate of 11.5 ± 4.95 mbar h-1 4
5
Incorporation of EDTA improved the oxidative stability of the FO and FO-EVOO 6
microcapsules during accelerated storage, corroborating the results obtained by 7
headspace propanal and FA composition analysis (Table 5). Interestingly, the spray-8
dried FO and FO-EVOO microcapsules had superior oxidative stability compared to 9
their respective emulsions, whereas those of FO-EDTA and FO-EVOO-EDTA were 10
decreased by spray drying, under the conditions tested. The transition metal ions 11
associated with SBP would be located in the aqueous phase of the oil-in-water 12
emulsions and oriented in the oil/water interface (Frankel et al., 1994; Jacobsen et al., 13
2008). EDTA, ω-3 hydroperoxides and the polar EVOO phenolics would also be 14
present in the aqueous phase. Therefore it is likely that, in the case of FO-EDTA and 15
FO-EVOO-EDTA, the shared location and high level of contact between the pro- and 16
anti-oxidants in the aqueous phase of the liquid emulsions was more effective at 17
preventing lipid oxidation than in the dried state, due to the restricted water 18
environment of the later. Lipid oxidation and antioxidant mechanisms in multi-phasic 19
systems are complex phenomenon. Numerous variables (e.g. pH, aw, type of 20
emulsifier, oxygen availability, and structure, thickness and composition of the 21
interface) can influence the rate and extent of lipid oxidation, and the efficacy of 22
different antioxidants, in emulsion-based systems (Coupland & McClements, 1996; 23
McClements & Decker, 2000; Velasco et al., 2003, 2006). It has also become evident 24
that the effectiveness of antioxidants in oil-in-water emulsions depends on several 25

28
parameters, such as their structure (i.e. number and position of hydroxyl groups), 1
polarity, location (i.e. water, oil, interface), radical scavenging and metal-chelating 2
attributes, as well as electron/hydrogen donating capacity (Mattia et al., 2010a, b; 3
Paiva-Martins & Gordon, 2002; Paiva-Martins et al., 2006). More research is required 4
to understand the interplay between oxidation reactions and antioxidant reactivities in 5
heterophasic systems. 6
7
In conclusion, we have demonstrated that the oxidative stability of SBP-based 8
microcapsules formulated with FO and a FO-EVOO blend (1:1 w/w) are improved by 9
the addition of EDTA. The fatty acid composition of the oil was also an important 10
determinant of oxidative stability. 11
12
Acknowledgement 13
14
Sudheera Polovarapu thanks The University of Melbourne for her Master’s of Science 15
Scholarship, and CSIRO Preventative Health National Research Flagship for 16
supporting this research. The authors gratefully acknowledge Luz Sanguansri for her 17
technical advice, Zhiping Shen for sharing her expertise in GC, and Li Jiang Cheng 18
and Rangika Weerakody for their technical assistance. The authors also express their 19
gratitude to the CFNS staff in the Food Processing Centre (Werribee) for their 20
assistance in the manufacture of the spray-dried microcapsules. 21
22
Literature cited 23
24

29
Bendini, A.; Cerretani, L.; Carrasco-Pancorbo, A.; Gómez-Caravaca, A.; Segura-1
Carretero, A.; Fernández-Gutiérrez, A.; Lercker, G. Phenolic molecules in virgin olive 2
oils: a survey of their sensory properties, health effects, antioxidant activity and 3
analytical methods. An overview of the last decade. Biomolecules 2007, 12, 4
1679−1719. 5
6
Berbert, A. A.; Kondo, C. R.; Almendra, C. L.; Matsuo, T.; Dichi, I. Supplementation 7
of fish oil and olive oil in patients with rheumatoid arthritis. Nutrition 2005, 21(2), 8
131−136. 9
10
Buma, T. J. Free fat in spray-dried whole milk. 8. The relation between free-fat 11
content and particle porosity of spray-dried whole milk. Netherlands Milk and Dairy 12
J. 1971, 25, 123−140. 13
14
Camuesco, D.; Gálvez, J.; Nieto, A.; Comalada, M.; Rodríguez-Cabezas, M. E.; 15
Concha, A.; Xaus, J.; Zarzuelo, A. Dietary olive oil supplemented with fish oil, rich in 16
EPA and DHA (n-3) polyunsaturated fatty acids, attenuates colonic inflammation in 17
rats with DSS-induced colitis. J. Nutr. 2005, 135(4), 687−694. 18
19
Carrasco-Pancorbo, A.; Cerretani, L.; Bendini, A.; Segura-Carretero, A.; del Carlo, 20
M.; Gallina-Toschi, T.; Lercker, G.; Compagnone, D.; Fernández-Gutiérrez, A. 21
Evaluation of the antioxidant capacity of individual phenolic compounds in virgin 22
olive oil. J. Agric. Food Chem. 2005, 53, 8918−8925. 23
24
30
Castellani, O.; Al-Assaf, S.; Axelos, M.; Phillips, G. O.; Anton, M. Hydrocolloids 1
with emulsifying capacity. Part 2 – Adsorption properties at the n-hexadecane−Water 2
interface. Food Hydrocolloids 2010, 24, 121–130. 3
4
Cho, S-Y.; Miyashita, K.; Miyazawa, T.; Fujimoto, K.; Kaneda, T. Autoxidation of 5
ethyl eicosapentaenoate and docosahexaenoate. JOACS 1987, 64(6), 876−879. 6
7
Christie, W. W. Lipid Analysis: Separation, Identification, and Structural Analysis of 8
Lipids, 3rd ed.; The Oily Press: Bridgwater, UK, 2003. 9
10
Cicerale, S.; Conlan, X. A.; Sinclair, A. J.; Keast, R. S. J. Chemistry and health of 11
olive oil phenolics. Crit Rev Food Sci Nutr. 2009, 49, 218−236. 12
13
Coupland, J. N.; McClements, D. J. Lipid oxidation in food emulsions. Trends Food 14
Sci. Technol. 1996, 7, 83−91. 15
16
Das, U. N. Can essential fatty acids reduce the burden of disease(s)? Lipids in Health 17
and Disease 2008, 7, 9−13. 18
19
Desai, K, G, H.; Park, H.J. Recent developments in microencapsulation of 20
food ingredients. Drying Technol. 2005, 23, 1361−1394. 21
22
Dobarganes, M. C.; Pérez-Camino, M. C. Fatty acid composition: a useful tool for the 23
determination of alteration level in heated fats. Revue Français Corps Gras 1988, 75, 24
67–70. 25

31
1
Drusch, S. Sugar beet pectin: a novel emulsifying wall component for 2
microencapsulation of lipophilic food ingredients by spray-drying. Food 3
Hydrocolloids 2007, 21, 1223−1228. 4
5
Drusch, S.; Mannino, S. Patent-based review on industrial approaches for the 6
microencapsulation of oils rich in polyunsaturated fatty acids. Trends Food Sci. 7
Technol. 2009, 20, 237−244. 8
9
Drusch, S.; Serfert, Y.; Scampicchio, M.; Schmidt-Hansberg, B.; Schwarz, K. Impact 10
of physicochemical characteristics on the oxidative stability of fish oil 11
microencapsulated by spray-drying. J. Agric. Food Chem. 2007, 55, 11044−11051. 12
13
Frankel, E. Lipid Oxidation, 2nd ed.; The Oily Press: Bridgwater, U.K, 2005. 14
15
Frankel, E. N. Chemistry of extra virgin olive oil: adulteration, oxidative stability, and 16
antioxidants. J. Agric. Food Chem. 2010, 58, 5991−6006. 17
18
Frankel, E.; Huang, S. W.; Kanner, J.; German, J. B. Interfacial phenomena in the 19
evaluation of antioxidants: bulk oils vs emulsions. J. Agric. Food Chem. 1994, 42, 20
1054–1059. 21
22
Frankel, E.N.; Satué-Gracia, T.; Meyer, A.S.; German, J.B. Oxidative stability of fish 23
and algae oils containing long-chain polyunsaturated fatty acids in bulk and in oil-in-24
water emulsions. J. Agric. Food Chem. 2002, 27, 2094–2099. 25

32
1
Funami, T.; Nakauma, M.; Noda, S.; Ishihara, S.; Al-Assaf, S.; Phillips, G. O. 2
Enhancement of the performance of sugar beet pectin as an emulsifier. Foods & Food 3
Ingredients Journal of Japan 2008, 213, 347–356. 4
5
Funami, T.; Nakauma, M.; Ishihara, S.; Tanaka, R.; Inoue, T.; Phillips, G. O. 6
Structural modifications of sugar beet pectin and the relationship of structure to 7
functionality. Food Hydrocolloids 2010 (in press). 8
9
García-Villalba, R.; Carrasco-Pancorbo, A.; Oliveras-Ferraros, C.; Vázquez-Martín, 10
A.; Menéndez, J. A.; Segura-Carretero, A.; Fernández-Gutiérrez, A. Characterization 11
and quantification of phenolic compounds of extra-virgin olive oils with anticancer 12
properties by a rapid and resolutive LC-ESI-TOF MS method. J. Pharmaceutical 13
Biomedical Analysis 2010, 51, 416–429. 14
15
Garg, M. L.; Wood, L. G.; Singh, H.; Moughan, P. J. Means of delivering 16
recommended levels of long chain n-3 polyunsaturated fatty acids in human diets. J. 17
Food Sci. 2006, 71(5), R66–R71. 18
19
Gharsallaoui, A.; Roudaut, G.; Chambin, O.; Voilley, A.; Saurel, R. Applications of 20
spray-drying in microencapsulation of food ingredients: an overview. Food Res. Int. 21
2007, 40, 1107−1121. 22
23
Gutfinger, T. Polyphenols in olive oils. J. Am. Oil Chem. Soc. 1981, 58, 966−968. 24
25

33
Haahr, A-M.; Jacobsen, C. Emulsifier type, metal chelation and pH affect oxidation 1
stability of n-3 enriched emulsions. Eur. J. Lipid Sci. Technol. 2008, 110, 949−961. 2
3
Holman, R.T.; Elmer, O.C. The rates of oxidation of unsaturated fatty acids and 4
esters. J. Am. Oil Chem. Soc. 1947, 24, 127−129. 5
6
Jacobsen, C.; Let, M. B.; Nielsen, N. S.; Meyer, A. S. Antioxidant strategies for 7
preventing oxidative flavour deterioration of foods enriched with n-3 polyunsaturated 8
lipids: a comparative evaluation. Trends Food Sci. Technol. 2008, 19, 76−93. 9
10
Kamnev, A. A.; Colina, M.; Renou-Gonnord, M.-E.; Frolov, I.; Ptitchkina, N. M.; 11
Ignatov, V. V. Atomic absorption spectroscopic investigation of the mineral fraction 12
of pectins obtained from pumpkin and sugar beet. Monatshefte fiir Chemie 1997, 128, 13
211–216. 14
15
Katsuda, M. S.; McClements, D. J.; Miglioranza, L. H. S.; Decker, E. A. Physical and 16
oxidative stability of fish oil-in-water emulsions stabilized with β-lactoglobulin and 17
pectin. J. Agric. Food Chem. 2008, 56, 5926−5931. 18
19
Keceli, T.; Gordon, M. H. Ferric ions reduce the antioxidant activity of the phenolic 20
fraction of virgin olive oil. J. Food Sci. 2002, 67, 943−947. 21
22
Kirby, A. R.; MacDougall, A. J.; Morris, V. J. Sugar beet pectin−protein complexes. 23
FOBI 2006, 1, 51−56. 24
25
34
Kirchene, D.; Allalout, A.; Mancebo-Campos, V.; Salvador, M. D.; Zarrouk, M.; 1
Fregapane, G. Stability of virgin olive oil and behaviour of its natural antioxidants 2
under medium temperature accelerated storage conditions. Food Chem. 2010, 121, 3
171–177. 4
5
Kolanowski, W.; Laufenberg, G. Enrichment of food products with polyunsaturated 6
fatty acids by fish oil addition. Eur. Food Res. Technol. 2006, 222, 472–477. 7
8
Lavelli, V. Comparison of the antioxidant activities of extra virgin olive oils. J. Agric. 9
Food Chem. 2002, 50, 7704−7708. 10
11
Lee, H.; Kizito, S.A.; Weese, S.J.; Craig-Schmidt, M.C.; Lee, Y.; Wei, C.-I.; An, H. 12
Analysis of headspace volatile and oxidized volatile compounds in DHA-enriched 13
fish oil on accelerated oxidative storage. J. Food Sci. 2003, 68, 2169−2177. 14
15
Leroux, J.; Langendorff, V.; Schick, G.; Vaishnav, V.; Mazoyer, J. Emulsion 16
stabilizing properties of pectin. Food Hydrocolloids 2003, 17, 455−462. 17
18
Mahoney, J.; Graf, E. Role of alpha-tocopherol, ascorbic-acid, citric-acid and EDTA 19
as oxidants in model systems. J. Food Sci. 1986, 51, 1293−1296. 20
21
Mancuso, J. R.; McClements, D. J.; Decker, E. A. The effects of surfactant type, pH, 22
and chelators on the oxidation of salmon oil-in-water emulsions. J. Agric. Food 23
Chem. 1999, 47(10), 4112−4116. 24
25
35
Mattia, C. D. di.; Sacchetti, G.; Mastrocola, D.; Pittia, P. effect of phenolic 1
antioxidants on the dispersion state and the chemical stability of olive oil O/W 2
emulsions. Food Res. Int. 2010a, 42, 1163−1170. 3
4
Mattia, C. D. di.; Sacchetti, G.; Mastrocola, D.; Sarker, D. K.; Pittia, P. Surface 5
properties of phenolic compounds and their influence on the dispersion degree and 6
oxidative stability of olive oil O/W emulsions. Food Hydrocolloids, 2010b, 24(6−7), 7
652−658. 8
9
McClements, D. J. Food Emulsions: Principles, Practice and Techniques; CRC Press: 10
Boca Raton, FL, 1999. 11
12
McClements, D. J.; Decker, E. A. Lipid oxidation in oil-in-water emulsions: impact of 13
molecular environment on chemical reactions in heterogeneous food systems. J. Food 14
Sci. 2000, 65, 1270−1282. 15
16
Mei, L.; Decker, E. A.; McClements, D. J. Evidence of iron association with emulsion 17
droplets and its impact on lipid oxidation. J. Agric. Food Chem. 1998, 46(12), 18
5072−5077. 19
20
Nakauma, M.; Funami, T.; Noda, S.; Ishihara, S.; Al-Assaf, S.; Nishinari, K.; Phillips, 21
G. O. Comparison of sugar beet pectin, soybean soluble polysaccharide, and gum 22
arabic as food emulsifiers. 1. Effect of concentration, pH, and salts on the emulsifying 23
properties. Food Hydrocolloids 2008, 22, 1254−1267. 24
25

36
Paiva-Martins, F.; Gordon, M. H. Effects of pH and ferric ions on the antioxidant 1
activity of olive polyphenols in oil-in-water emulsions. J. Am. Oil Chem. Soc. 2002, 2
79, 571−576. 3
4
Paiva-Martins, F.; Gordon, M. H. Interactions of ferric ions with olive oil phenolic 5
compounds. J. Agric. Food. Chem. 2005, 53, 2704−2709. 6
7
Paiva-Martins, F.; Santos, V.; Mangericāo, H.; Gordon, M. H. Effects of copper on 8
the antioxidant activity of olive polyphenols in bulk oil and oil-in-water emulsions. J. 9
Agric. Food Chem. 2006, 54, 3738−3743. 10
11
Pisecky, J. Handbook of Milk Powder Manufacture. Niro A/S: Copenhagen, 12
Denmark, 1997, pp 206. 13
14
Rees, D. A. Structure, conformation, and mechanism in the formation of 15
polysaccharide gels and networks. Adv. Carbohydr. Chem Biochem. 1969, 24, 16
267−332. 17
18
Riediger, N. D.; Othman, R. A.; Suh, M.; Moghadasian, M. H. A systemic review of 19
the roles of n-3 fatty acids in health and disease. J Am Diet Assoc. 2009, 109(4), 668–20
679. 21
22
Rockland, L. B.; Beuchat, L. R. Introduction of Water Activity, Theory and 23
Application in Foods. Marcel Decker: New York, USA, 1987. 24
25
37
Roynette, C. E.; Calder, P. C.; Dupertuis, Y. M.; Pichard, C. n-3 Polyunsaturated fatty 1
acids and colon cancer prevention. Clinical Nutrition 2004, 23, 139−151. 2
3
Rückold, S.; Grobecker, K. H.; Isengard, H. D. Determinations of the contents of 4
water and moisture in milk powder. Fresenius J. Anal. Chem. 2001, 368, 522−527. 5
6
Schmid-Bondzyndki-Ratzlaff method (AS 2300.1.3). Methods of chemical and 7
physical testing for the dairying industry. General methods and principles —8
Determination of fat—Gravimetric method. 1988. 9
10
Serfert, Y.; Drusch, S.; Schwarz, K. Chemical stabilisation of oils rich in long-chain 11
polyunsaturated fatty acids during homogenisation, microencapsulation and storage. 12
Food Chem. 2009, 113, 1106−1112. 13
14
Serfert, Y.; Drusch, S.; Schwarz, K. Sensory odour profiling and lipid oxidation status 15
of fish oil and microencapsulated fish oil. Food Chem. 2010, 123, 968−975. 16
17
Servili, M.; Montedoro, G. Contribution of phenolic compounds to virgin olive oil 18
quality. Eur. J. Lipid Sci. Technol. 2002, 104, 602−613. 19
20
Siew, C. K.; Williams, P. A. Characterization of the surface-active components of 21
sugar beet pectin and the hydrodynamic thickness of the adsorbed pectin layer. J. 22
Agric. Food Chem. 2008, 56, 4164−4171. 23
24

38
Silva, L.; Garcia, B.; Paiva-Martins, F. Oxidative stability of olive oil and its 1
polyphenolic compounds after boiling vegetable process. LWT – Food Sci. Technol. 2
2010a, 43, 1336–1344. 3
4
Silva, L.; Pinto, J.; Carrola, J.; Paiva-Martins, F. Oxidative stability of olive oil after 5
food processing and comparison with other oils. Food Chem. 2010b, 121, 1177–1187. 6
7
Sørensen, A.-D. M.; Haahr, A.-M.; Becker, E. M.; Skibsted, L. H.; Bergenståhl, B.; 8
Nilsson, L.; Jacobsen, C. Interactions between iron, phenolic compounds, emulsifiers, 9
and pH in omega-3-enriched oil-in-water emulsions. J. Agric. Food Chem. 2008, 56, 10
1740−1750. 11
12
Sotiroudis, T. G.; Sotiroudis, G. T.; Varkas, N.; Xenakis, A. The role of endogenous 13
amphiphiles on the stability of virgin olive oil-in-water emulsions. J. Am. Oil Chem. 14
Soc. 2005, 82(6), 415–420. 15
16
Thibault, J.-F. Characterization and oxidative-crosslinking sugar-beet pectins 17
extracted from cossetes and pulps under different conditions. Carbohydr. Polymers 18
1988, 8, 209−223. 19
20
Thibault, J. F.; Renard, C. M. G. C., Guillon, F. Sugar beet fiber – production, 21
composition, physicochemical properties, physiological effects, safety, and food 22
applications. In Handbook of Dietary Fiber; Cho, S. S., Dreher, M. L., Eds.; Marcel 23
Dekker: New York, USA, 2001; Vol. 113, pp 553–582. 24
25
39
Velasco, J.; Dobarganes, C. Oxidative stability of virgin olive oil. Eur. J. Lipid Sci. 1
Technol. 2002, 104, 661−676. 2
3
Velasco, J.; Dobarganes, C.; Márquez-Ruiz. Variables affecting lipid oxidation in 4
dried microencapsulated oils. Grasas y Aceites 2003, 54, 304−314. 5
6
Velasco, J.; Marmesat, S.; Dobarganes, C.; Márquez-Ruiz. Heterogeneous aspects of 7
lipid oxidation in dried microencapsulated oils. J. Agric. Food Chem. 2006, 54, 8
1722−1729. 9
10
Visioli, F.; Poli, A.; Galli, C. Antioxidant and other biological activities of phenols 11
from olives and olive oil. Med. Res. Rev. 2001, 22, 65−75. 12
13
Visioli, F.; Galli, C.; Galli, C.; Caruso, D. Biological activities and metabolic fate of 14
phenols. Eur. J. Lipid Sci. Technol. 2002, 104, 677−684. 15
16
Wahrburg, U.; Kratz, M.; Cullen, P. Mediterranean diet, olive oil and health. Eur. J. 17
Lipid Sci. Technol. 2002, 104, 698−705. 18
19
Williams, P. A.; Sayers, C.; Viebke, C.; Senan, C. Elucidation of the emulsification 20
properties of sugar beet pectin. J. Agric. Food Chem. 2005, 53, 3592–3597. 21
22
23
24
25
26

40
1
2
3
4
5
0
100
200
300
400
500
600
700
800
900
1000
0 50 100 150 200 250 300
Shear rate (s )
Vis
cosi
ty (
mP
a s
)
0
1
2
3
4
5
6
7
8
9
10
0.01 0.1 1 10 100 1000
Particle size (µm)
Vol
ume
(%)
Shear rate (s-1)
0
100
200
300
400
500
600
700
800
900
1000
0 50 100 150 200 250 300
Shear rate (s )
Vis
cosi
ty (
mP
a s
)
0
1
2
3
4
5
6
7
8
9
10
0.01 0.1 1 10 100 1000
Particle size (µm)
Vol
ume
(%)
Shear rate (s-1) 6

41
Fig. 1 (A) Particle size distribution and (B) flow curve of fish oil and fish oil-extra 1
virgin olive oil emulsions prior to spray drying. Each value is the mean of triplicate 2
measurements ± SD from 2 independent processing trials; (�) FO-50; (�) FO-3
EDTA-50; (�) FO-EVOO-50; (�) FO-EVOO-EDTA-50. EDTA = ethylene-4
diaminetetraacetic acid; EVOO = extra virgin olive oil; FO = fish oil; 50 = 50% w/w 5
oil load (dry basis). 6
7
8

42
Fig. 2 Scanning electron micrographs of fresh (0 mo) (A−D) and stored (25°C, 3 mo) 1
(E−H) fish oil and fish oil-extra virgin olive oil microcapsules. (A, E) FO-50; (B, F) 2
FO-EDTA-50; (C, G) FO-EVOO-50; (D, H) FO-EVOO-EDTA-50. EDTA = 3
ethylene-diaminetetraacetic acid; EVOO = extra virgin olive oil; FO = fish oil; 50 = 4
50% w/w oil load (dry basis). Arrows indicate surface defects (pores, cracks). 5
6
0
1
2
3
4
5
6
7
0.01 0.1 1 10 100 1000
Particle size (µm)
Vol
ume
(%)
0
1
2
3
4
5
6
7
0.01 0.1 1 10 100 1000
Particle size (µm)
Vol
ume
(%)
0
1
2
3
4
5
6
7
0.01 0.1 1 10 100 1000
Particle size (µm)
Vol
ume
(%)
0
1
2
3
4
5
6
7
0.01 0.1 1 10 100 1000
Particle size (µm)
Vo
lum
e (%
)
A B
C D
0
1
2
3
4
5
6
7
0.01 0.1 1 10 100 1000
Particle size (µm)
Vol
ume
(%)
0
1
2
3
4
5
6
7
0.01 0.1 1 10 100 1000
Particle size (µm)
Vol
ume
(%)
0
1
2
3
4
5
6
7
0.01 0.1 1 10 100 1000
Particle size (µm)
Vol
ume
(%)
0
1
2
3
4
5
6
7
0.01 0.1 1 10 100 1000
Particle size (µm)
Vo
lum
e (%
)
A B
C D
7
Fig. 3 Particle size distributions of reconstituted fish oil and fish oil-extra virgin olive 8
oil microcapsules at (A) 0, (B) 1, (C) 2, and (D) 3 mo storage under ambient 9
conditions (~25ºC). Each value is the mean of triplicate measurements ± SD from 2 10
independent microcapsule manufacturing trials; � (FO-50); � (FO-EDTA-50); � 11
43
(FO-EVOO-50); � (FO-EVOO-EDTA-50). EDTA = ethylene-diaminetetraacetic 1
acid; EVOO = extra virgin olive oil; FO = fish oil; 50 = 50% w/w oil load (dry basis). 2
3
4
5
6
7
0
100
200
300
400
500
600
700
800
900
1000
1 2 3
Storage at 25°°°°C (mo)
Pro
pana
l(µµ µµm
ol k
g-1to
tal o
il)
0
100
200
300
400
500
600
700
800
900
1000
1 2 3
Storage at 25°°°°C (mo)
Pro
pana
l(µµ µµm
ol k
g-1to
tal o
il)
8
Fig. 4 Headspace propanal in fish oil and fish oil-extra virgin olive oil microcapsules 9
during storage (1−3 mo) under ambient conditions (~25°C). Each value is the mean of 10
duplicate values ± SD from 2 independent microcapsule manufacturing trials; solid 11
bars (FO-50); horizontal stripes (FO-EDTA-50); white bars (FO-EVOO-50); vertical 12
stripes (FO-EVOO-EDTA-50). EDTA = ethylene-diaminetetraacetic acid; EVOO = 13
extra virgin olive oil; FO = fish oil; 50 = 50% w/w oil load (dry basis). 14
15
16

44
1
2
3
4
5
6
7
Table 1 Fatty acid composition (%) of the bulk oils. 8
9
Fatty acid (%) 1Fatty acid
FO EVOO
C16:0 21.09 ± 1.94 6.99 ± 0.13
C18:1n-9 13.51 ± 1.79 79.54 ± 0.12
C20:5ω-3 6.64 ± 0.92 ND
EPA:C16:0 0.315 N/A
C22:6ω-3 26.54 ± 0.53 ND
DHA:C16:0 1.26 N/A
DHA:EPA 4.00 N/A
Other 32.21 ± 4.12 13.47 ± 0.01
1Each value is the mean of duplicate measurements ± SD. DHA = docosahexaenoic acid; EPA = 10
eicosapentaenoic acid; EVOO = extra virgin olive oil; FO = fish oil; N/A = not applicable; ND = not 11
detected. 12
13
14
15
16

45
1
2
3
4
5
6
7
Table 2 Physicochemical properties of fish oil and fish oil-extra virgin olive oil 8
microcapsules. 9
10
Microcapsule 1Property
FO-50 FO-EDTA-50 FO-EVOO-50 FO-EVOO-
EDTA-50
Total oil (%) 49.29 ± 0.17 49.27 ± 0.12 49.29 ± 0.03 49.22 ± 0.13
Solvent-
extractable oil
(%)
4.72 ± 0.00 4.73 ± 0.00 4.72 ± 0.00 4.73 ± 0.00
ME (%) 90.41 ± 0.12 90.41 ± 0.08 90.42 ± 0.02 90.40 ± 0.09
Moisture content 2.98 ± 0.03 2.83 ± 0.01 2.96 ± 0.04 2.89 ± 0.02
aw 0.29 ± 0.00 0.30 ± 0.01 0.29 ± 0.00 0.30 ± 0.00
1Each value is the mean of triplicate measurements ± SD from 2 independent microcapsule 11
manufacturing trials. EDTA = ethylene-diaminetetraacetic acid; EVOO = extra virgin olive oil; FO = 12
fish oil; ME = microencapsulation efficiency (see equation 1, Section 2.5.6) 50 = 50% w/w oil load 13
(dry basis). 14
15

46
1
2
3
4
5
6
7
8
Table 3 Particle size (d3,2) of reconstituted fish oil and fish oil-extra virgin olive oil 9
microcapsules prior to, and during storage (1−3 mo) under ambient conditions 10
(~25ºC). 11
12
Particle size (d3,2) (µm) during storage (mo) 1Microcapsule
0 1 2 3
FO-50 0.89 ± 0.00b 0.89 ± 0.00a 1.28 ± 0.06a 1.44 ± 0.04a
FO-EDTA-50 0.87 ± 0.01b 0.88 ± 0.01a 1.31 ± 0.03ab 1.46 ± 0.03a
FO-EVOO-50 0.87 ± 0.01b 0.90 ± 0.02a 1.27 ± 0.04a 1.46 ± 0.03a
FO-EVOO-EDTA-50 0.84 ± 0.00a 0.89 ± 0.00a 1.35 ± 0.04b 1.45 ± 0.03a
1Each value is the mean of duplicate analysis ± SD from 2 independent microcapsule manufacturing 13
trials. Means within columns followed by different superscript letters are significantly different (P < 0.05). 14
EDTA = ethylene-diaminetetraacetic acid; EVOO = extra virgin olive oil; FO = fish oil; 50 = 50% w/w 15
oil load (dry basis). 16
17
18

47
Table 4-A Fatty acid composition %) of fish oil and fish oil-extra virgin olive oil microcapsules prior to, and during storage under ambient 1
conditions (~25°C). 2
3
Microcapsule
FO-50 during storage (mo) FO-EVOO-50 during storage (mo)
1Fatty Acid
0 1 2 3 0 1 2 3
C16:0 19.10 ± 0.57 19.30 ± 0.65 20.37 ± 0.11 20.16 ± 0.38 19.80 ± 0.66 19.66 ± 0.35 20.13 ± 0.50 19.71 ± 0.44
C18:1 17.38 ± 2.29 17.77 ± 2.88 18.16 ± 2.70 18.74 ± 2.29 14.50 ± 0.72 13.56 ± 0.28 14.81 ± 0.85 15.36 ± 1.93
C20:5ωωωω-3 5.34 ± 0.05a
5.17 ± 0.05a
(3%)
4.87 ± 0.05a
(9%)
4.54 ± 0.03a
(15%)
5.91 ± 0.02ab
5.85 ± 0.03b
(1%)
5.32 ± 0.13b
(5%)
4.90 ± 0.26b
(13%)
EPA:C16:0 0.28 0.27 0.24 0.23 0.28 0.30 0.26 0.25
C22:6ωωωω-3 21.33 ± 0.16a
20.44 ± 0.49a
(4%)
18.45 ± 0.20a
(14%)
16.82 ± 0.14a
(21%)
22.34 ± 0.63ab
22.78 ± 0.33bc
(-2%)
20.32 ± 0.36c
(9%)
18.39 ± 0.96b
(18%)
DHA:C16:0 1.12 1.06 0.91 0.83 1.13 1.16 1.01 0.93
DHA:EPA 3.99 3.95 3.79 3.70 3.98 3.89 3.82 3.75
48
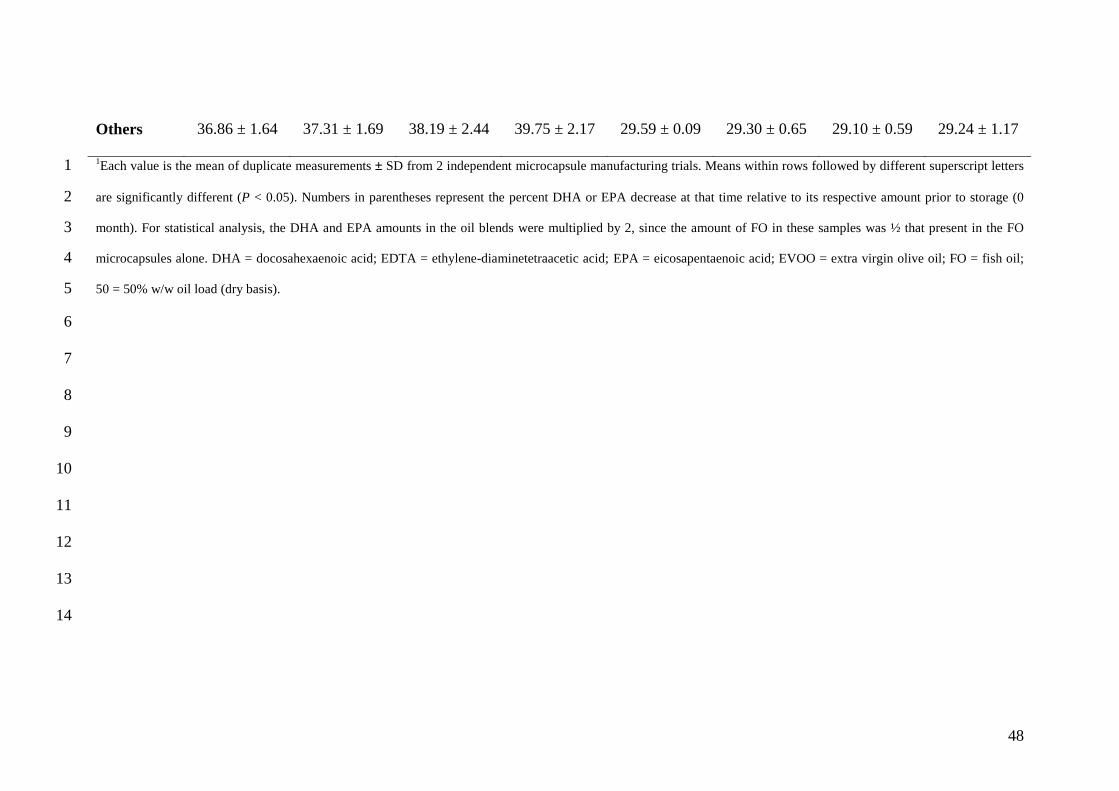
Others 36.86 ± 1.64 37.31 ± 1.69 38.19 ± 2.44 39.75 ± 2.17 29.59 ± 0.09 29.30 ± 0.65 29.10 ± 0.59 29.24 ± 1.17
1Each value is the mean of duplicate measurements ± SD from 2 independent microcapsule manufacturing trials. Means within rows followed by different superscript letters 1
are significantly different (P < 0.05). Numbers in parentheses represent the percent DHA or EPA decrease at that time relative to its respective amount prior to storage (0 2
month). For statistical analysis, the DHA and EPA amounts in the oil blends were multiplied by 2, since the amount of FO in these samples was ½ that present in the FO 3
microcapsules alone. DHA = docosahexaenoic acid; EDTA = ethylene-diaminetetraacetic acid; EPA = eicosapentaenoic acid; EVOO = extra virgin olive oil; FO = fish oil; 4
50 = 50% w/w oil load (dry basis). 5
6
7
8
9
10
11
12
13
14
49
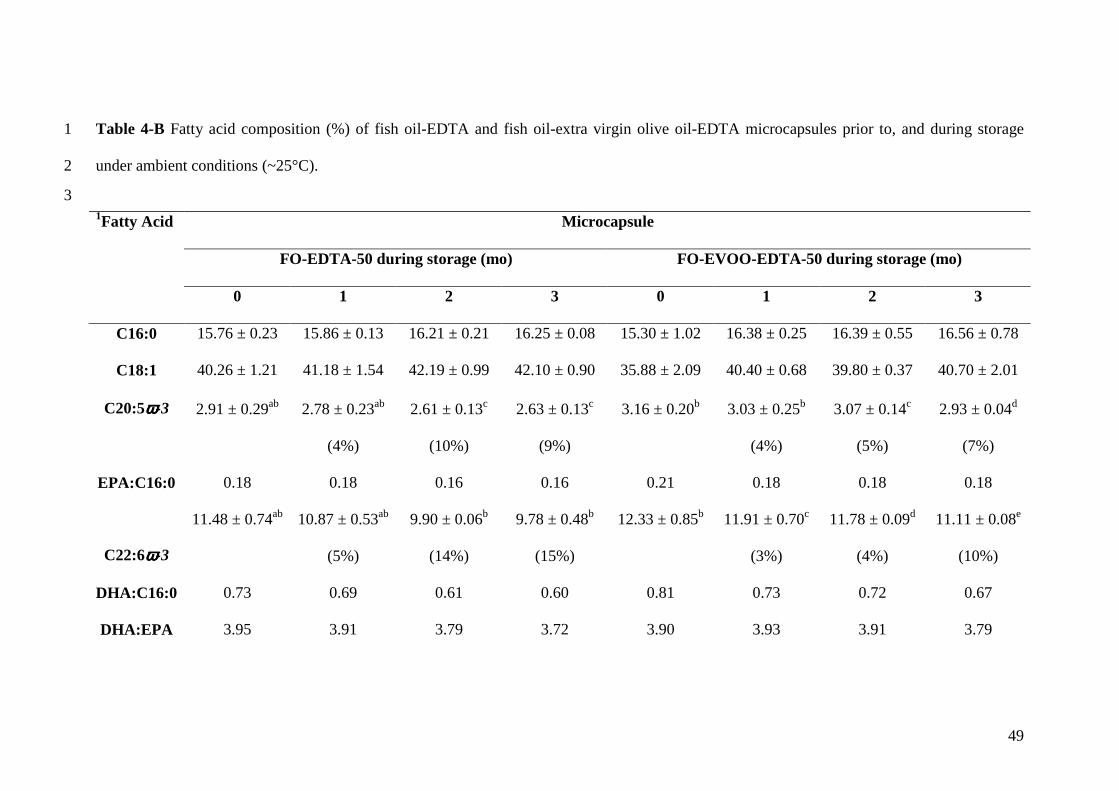
Table 4-B Fatty acid composition (%) of fish oil-EDTA and fish oil-extra virgin olive oil-EDTA microcapsules prior to, and during storage 1
under ambient conditions (~25°C). 2
3
Microcapsule
FO-EDTA-50 during storage (mo) FO-EVOO-EDTA-50 during storage (mo)
1Fatty Acid
0 1 2 3 0 1 2 3
C16:0 15.76 ± 0.23 15.86 ± 0.13 16.21 ± 0.21 16.25 ± 0.08 15.30 ± 1.02 16.38 ± 0.25 16.39 ± 0.55 16.56 ± 0.78
C18:1 40.26 ± 1.21 41.18 ± 1.54 42.19 ± 0.99 42.10 ± 0.90 35.88 ± 2.09 40.40 ± 0.68 39.80 ± 0.37 40.70 ± 2.01
C20:5ωωωω-3
2.91 ± 0.29ab
2.78 ± 0.23ab
(4%)
2.61 ± 0.13c
(10%)
2.63 ± 0.13c
(9%)
3.16 ± 0.20b
3.03 ± 0.25b
(4%)
3.07 ± 0.14c
(5%)
2.93 ± 0.04d
(7%)
EPA:C16:0 0.18 0.18 0.16 0.16 0.21 0.18 0.18 0.18
C22:6ωωωω-3
11.48 ± 0.74ab
10.87 ± 0.53ab
(5%)
9.90 ± 0.06b
(14%)
9.78 ± 0.48b
(15%)
12.33 ± 0.85b
11.91 ± 0.70c
(3%)
11.78 ± 0.09d
(4%)
11.11 ± 0.08e
(10%)
DHA:C16:0 0.73 0.69 0.61 0.60 0.81 0.73 0.72 0.67
DHA:EPA 3.95 3.91 3.79 3.72 3.90 3.93 3.91 3.79

50
Others 37.74 ± 0.91 38.16 ± 0.28 39.42 ± 0.58 41.64 ± 1.63 33.34 ± 4.16 28.29 ± 0.54 29.02 ± 0.46 28.70 ± 2.82
1Each value is the mean of duplicate measurements ± SD from 2 independent microcapsule manufacturing trials. Means within rows followed by different superscript letters 1
are significantly different (P < 0.05). Numbers in parentheses represent the percent DHA or EPA decrease at that time relative to its respective amount prior to storage (0 2
month). For statistical analysis, the DHA and EPA amounts in the oil blends were multiplied by 2, since the amount of FO in these samples was ½ that present in the FO 3
microcapsules alone. DHA = docosahexaenoic acid; EDTA = ethylene-diaminetetraacetic acid; EPA = eicosapentaenoic acid; EVOO = extra virgin olive oil; FO = fish oil; 4
50 = 50% w/w oil load (dry basis). 5

51
Table 5 Oxidative stability of fish oil and fish oil-extra virgin olive oil emulsions and
microcapsules during accelerated storage (80°C, oxygen pressure of 5 bar).
1Sample Induction period (h) Slope (mbar h-1)
Emulsion
FO-50 3.2 ± 0.28a -24.0 ± 7.07ab
FO-EDTA-50 13.9 ± 0.14b -16.5 ± 2.12ab
FO-EVOO-50 3.9 ± 0.28a -31.5 ± 3.54a
FO-EVOO-EDTA-50 23.7 ± 0.49 c -11.5 ± 4.95c
Microcapsule
FO-50 7.4 ± 0.21a -480.5 ± 4.95a
FO-EDTA-50 10.0 ± 0.28b -421.5 ± 6.36b
FO-EVOO-50 12.7 ± 0.14c -97.0 ± 16.97c
FO-EVOO-EDTA-50 19.7 ± 1.06d -131.5 ± 3.54d
1Each value is the mean of duplicate measurements ± SD from 2 independent microcapsule
manufacturing trials. Means within columns followed by different superscript letters are significantly
different (P < 0.05). NB: The data is obtained for samples based on the same amount of oil (i.e. 8 g of
25% oil powders or 4 g of 50% oil powders. EDTA = ethylene-diaminetetraacetic acid; EVOO = extra
virgin olive oil; FO = fish oil; 50 = 50% w/w oil load (dry basis).


![Edta cleaning procedurefor_150mw[1]](https://static.fdocuments.in/doc/165x107/54bd26aa4a7959c93c8b4571/edta-cleaning-procedurefor150mw1.jpg)


