
Impact of energy efficiency measures on the economic value of buildings
10
Impact of energy efficiency measures on the economic value of buildings Daniela Popescu a,⇑ , Sven Bienert b , Christian Schützenhofer c , Rodica Boazu d a Technical University ‘‘Gheorghe Asachi’’ Iasi, Bd. D. Mangeron nr. 59A, 700050 Iasi, Romania b International Real Estate Business School, Competence Center of Sustainable Real Estate, University Regensburg, Gebaeude PT 50-03, D-93040 Regensburg, Germany c KPMG Financial Advisory Services GmbH, Kudlichstraße 41-43, 4020 Linz, Austria d Technical University ‘‘Gheorghe Asachi’’ Iasi, Bd. D. Mangeron nr. 43, 700050 Iasi, Romania article info Article history: Received 16 February 2011 Received in revised form 22 July 2011 Accepted 9 August 2011 Available online 6 September 2011 Keywords: Energy policy Energy efficiency measures Sustainable buildings Energy costs Financial analysis Property value abstract A main objective of energy policies is to make all levels of the society, from governments to citizen, inter- ested in increasing the energy efficiency of buildings. One of the most important barriers in implemen- tation of energy policies is that the cost of potential energy savings, typically considered being the only financial benefit, does not sufficiently motivate investments. The target is therefore to identify further possible drivers pushing positive reaction according to energy saving action. The paper discusses whether a market-based instrument, capturing the increase of the economic value of energy efficient buildings, can be also used. Methods that quantify the added value due to energy per- formance, including recommendations on how they can be incorporated in the financial analysis of investments in weatherization, are developed. By applying the proposed methods, the payback period of investments in energy efficiency measures depends on two factors: potential energy savings and the added value to the property. Case studies on some existing condominiums from Romania are analyzed and provide evidence to the research question. The market sensitivity to energy efficiency measures, the possibility of an intangible added value as well as the impact to financial investment decisions is subsequently in the focus. Ó 2011 Elsevier Ltd. All rights reserved. 1. Introduction Buildings represent the largest sector of primary energy con- sumption and the biggest contributor to world greenhouse gas emissions (GHG). High performing energy buildings have a starring role in energy saving policies. Key parts of EU energy legislation are the Energy Performance of Buildings Directive 2002/91/EC (EPBD) [1] and the Directive 2006/32/CE on energy end-use efficiency and energy services (EEESP) [2]. Energy policy involves the plan- ning and the design of efficient solutions from a multidisciplinary perspective to determine optimal solutions [3]. The energy saving potential of existing buildings and energy efficiency measures are top research subjects all over the world, focusing on a wide range of topics: energy conservation regulations [4], Life Cycle Assess- ment [5], benchmarking methodologies for building energy-use performance [6], best energy saving measures for different cli- mates and locations [7–9], influence of the envelope characteristics on the cooling/heating system [10,11], etc. Even in countries that had implemented the EPBD directive years ago, many questions regarding its impact, extent and enforcement are still being raised [12–14]. For instance, in [15] several assessments of the energy performance of buildings meth- odologies scheduled in the Italian Law were tested and compared. A study on how owners have interpreted and used the knowl- edge from energy audits for the renovation of their house reveals that aesthetics, identity and convenience may be viewed some- times as relevant as energy savings [16]. Even when the owners are likely to invest more in energy efficiency measures that provide faster returns, visibility of investments is important, therefore new windows are preferred comparing to attic insulation, which has higher energy saving potential [17]. Improvements to the energy efficiency of buildings are slowed when energy expenses are a very small fraction of the resident/ owner’s income. According to Lior [18], energy policies would be ‘‘much more effective if the tangible benefits would become signif- icant, using market forces rather than just legislation’’. A solution is suggested by Kragh and Rose who analyzed the possibilities of uti- lizing the relatively cheap long-term mortgage loans to finance en- ergy renovation investment using equity [19]. Another solution to motivate residents and owners could be using a market driven rea- son, such as higher prices for buildings that have undergone energy efficiency measures. Since every real estate market is different, many studies are needed to find out if investments in energy performance really translate into economic value. If the answer is yes, developing 0306-2619/$ - see front matter Ó 2011 Elsevier Ltd. All rights reserved. doi:10.1016/j.apenergy.2011.08.015 ⇑ Corresponding author. E-mail addresses: [email protected] (D. Popescu), [email protected] (S. Bienert), [email protected] (C. Schützenhofer), [email protected] (R. Boazu). Applied Energy 89 (2012) 454–463 Contents lists available at SciVerse ScienceDirect Applied Energy journal homepage: www.elsevier.com/locate/apenergy
-
Upload
daniela-popescu -
Category
Documents
-
view
213 -
download
1
Transcript of Impact of energy efficiency measures on the economic value of buildings

Applied Energy 89 (2012) 454–463
Contents lists available at SciVerse ScienceDirect
Applied Energy
journal homepage: www.elsevier .com/ locate/apenergy
Impact of energy efficiency measures on the economic value of buildings
Daniela Popescu a,⇑, Sven Bienert b, Christian Schützenhofer c, Rodica Boazu d
a Technical University ‘‘Gheorghe Asachi’’ Iasi, Bd. D. Mangeron nr. 59A, 700050 Iasi, Romaniab International Real Estate Business School, Competence Center of Sustainable Real Estate, University Regensburg, Gebaeude PT 50-03, D-93040 Regensburg, Germanyc KPMG Financial Advisory Services GmbH, Kudlichstraße 41-43, 4020 Linz, Austriad Technical University ‘‘Gheorghe Asachi’’ Iasi, Bd. D. Mangeron nr. 43, 700050 Iasi, Romania
a r t i c l e i n f o
Article history:Received 16 February 2011Received in revised form 22 July 2011Accepted 9 August 2011Available online 6 September 2011
Keywords:Energy policyEnergy efficiency measuresSustainable buildingsEnergy costsFinancial analysisProperty value
0306-2619/$ - see front matter � 2011 Elsevier Ltd. Adoi:10.1016/j.apenergy.2011.08.015
⇑ Corresponding author.E-mail addresses: [email protected] (D. Po
(S. Bienert), [email protected] (C. Schütze(R. Boazu).
a b s t r a c t
A main objective of energy policies is to make all levels of the society, from governments to citizen, inter-ested in increasing the energy efficiency of buildings. One of the most important barriers in implemen-tation of energy policies is that the cost of potential energy savings, typically considered being the onlyfinancial benefit, does not sufficiently motivate investments. The target is therefore to identify furtherpossible drivers pushing positive reaction according to energy saving action.
The paper discusses whether a market-based instrument, capturing the increase of the economic valueof energy efficient buildings, can be also used. Methods that quantify the added value due to energy per-formance, including recommendations on how they can be incorporated in the financial analysis ofinvestments in weatherization, are developed. By applying the proposed methods, the payback periodof investments in energy efficiency measures depends on two factors: potential energy savings and theadded value to the property. Case studies on some existing condominiums from Romania are analyzedand provide evidence to the research question.
The market sensitivity to energy efficiency measures, the possibility of an intangible added value aswell as the impact to financial investment decisions is subsequently in the focus.
� 2011 Elsevier Ltd. All rights reserved.
1. Introduction
Buildings represent the largest sector of primary energy con-sumption and the biggest contributor to world greenhouse gasemissions (GHG). High performing energy buildings have a starringrole in energy saving policies. Key parts of EU energy legislation arethe Energy Performance of Buildings Directive 2002/91/EC (EPBD)[1] and the Directive 2006/32/CE on energy end-use efficiencyand energy services (EEESP) [2]. Energy policy involves the plan-ning and the design of efficient solutions from a multidisciplinaryperspective to determine optimal solutions [3]. The energy savingpotential of existing buildings and energy efficiency measures aretop research subjects all over the world, focusing on a wide rangeof topics: energy conservation regulations [4], Life Cycle Assess-ment [5], benchmarking methodologies for building energy-useperformance [6], best energy saving measures for different cli-mates and locations [7–9], influence of the envelope characteristicson the cooling/heating system [10,11], etc.
Even in countries that had implemented the EPBD directiveyears ago, many questions regarding its impact, extent and
ll rights reserved.
pescu), [email protected]), [email protected]
enforcement are still being raised [12–14]. For instance, in [15]several assessments of the energy performance of buildings meth-odologies scheduled in the Italian Law were tested and compared.
A study on how owners have interpreted and used the knowl-edge from energy audits for the renovation of their house revealsthat aesthetics, identity and convenience may be viewed some-times as relevant as energy savings [16]. Even when the ownersare likely to invest more in energy efficiency measures that providefaster returns, visibility of investments is important, therefore newwindows are preferred comparing to attic insulation, which hashigher energy saving potential [17].
Improvements to the energy efficiency of buildings are slowedwhen energy expenses are a very small fraction of the resident/owner’s income. According to Lior [18], energy policies would be‘‘much more effective if the tangible benefits would become signif-icant, using market forces rather than just legislation’’. A solution issuggested by Kragh and Rose who analyzed the possibilities of uti-lizing the relatively cheap long-term mortgage loans to finance en-ergy renovation investment using equity [19]. Another solution tomotivate residents and owners could be using a market driven rea-son, such as higher prices for buildings that have undergone energyefficiency measures.
Since every real estate market is different, many studies areneeded to find out if investments in energy performance reallytranslate into economic value. If the answer is yes, developing

Nomenclature
CE actual cost of the unit of energy (€/kW h)d annual depreciation of the currency (–)ED annual energy demand (kW h/m2 year)ES annual energy savings (kW h/m2 year)f annual increase rate of energy price (–)i discount rate (%)I investments costs for energy efficiency measures
(€/m2)NPV net present value of costs of energy savings (€/m2)P price of the property (€/m2)S floor area (m2)t payback period (years)tR lifetime of the retrofitting (years)V adjusted value of the property (€/m2)DV added value due to energy performance (€/m2)
Greek lettera transaction coefficient (%)b market coefficient (–)
Superscript– averagea; b calculated by using coefficient a; b
Subscript1 before retrofitting2 after retrofittingj type of energy (e.g. j = 1 for gas, j = 2 for electricity, j = 3
for district heating, etc.)N non-retrofitted buildingR retrofitted building
D. Popescu et al. / Applied Energy 89 (2012) 454–463 455
methods of the quantification of the added value due to energyperformance would be helpful in improving energy audit method-ologies. An energy audit is a detailed report on the energy charac-teristics and on the recommended measures to increase energyefficiency, including economic analysis of profitability, monitoringthe impact of energy policies, developing appraisal methodologiesthat take energy efficiency into consideration, etc. Cost is not nec-essarily value, therefore supposing that investments in retrofittingfor better energy efficiency payback totally, when the building issold is not possible.
The financial analysis of benefits due to applying energy policiesin buildings is usually treated from unilateral points of view. En-ergy auditors answer to questions of whether investments in en-ergy efficiency pay off by analyzing only the costs of potentialenergy savings [20,21], while real-estate appraisers analyze onlythe extend to which such investments increase the value of thebuilding [22,23].
Identifying and quantifying multiple benefits of energy effi-ciency is a new trend in the energy field. The International EnergyAgency’s Energy Efficiency Unit has recently begun research workon innovative energy efficiency policies to increase the interest onweatherization programs for low-income households [24]. Weath-erization is the practice of modifying a building to reduce energyconsumption and optimize energy efficiency and protecting abuilding and its interior from the elements, particularly from sun-light, precipitation, and wind. The interest on the topic is argued bythe fact that low-income energy efficiency programs just compareactual/ projected energy bill reductions with spending to deter-mine whether the program is cost-effective, while important co-benefits such as direct and indirect socio-economic benefits inthe form of increased property value and economic activity andother co-benefits to households (e.g. improved health and comfort)are neglected. The scope of the project is inclusion of co-benefits inprogram evaluation protocols, which is expected to lead to a higherpriority for low-income household energy efficiency investmentsassisted by governments.
Entrop et al. developed a method that incorporates the annualincrease/decrease of the value of the building according to fluctu-ations of transaction prices in the financial analysis of the cost ofenergy savings [25]. By applying their method, the payback perioddecreases when prices of properties increase and it increases whentransaction prices decrease.
The methods presented here analyze financial benefits in adifferent way, by considering that the increased value of buildingsdepends on the willingness to pay more for energy performance.
We appreciated that if the buyer is not interested in the energyefficiency of a property, the only reasonable benefit of applying en-ergy efficiency measures is lower operating costs and there are nogains of value to be considered in the financial analysis. On theother hand, if the buyer agrees to payback, let us say 90% of theinvestments in energy efficiency measures which ever way the realestate market fluctuates, costs of further energy savings are not soimportant.
The main purpose of the present study is to develop methodsthat can quantify the increase in the value of the building gener-ated by applying energy efficiency methods. The proposed originalmethod considers both the net present value of the costs of energysavings, and the added value due to energy performance in thefinancial analysis. Financial analysis of energy efficiency measuresfor any purpose, such as conducting an energy audit of an existingbuilding (an energy audit is a detailed report on the energy charac-teristics and on the recommended measures to increase energyefficiency, including economic analysis of profitability), monitoringthe impact of energy policies, making an appraisal of a property,should not neglect either of them.
Other scope of the present paper is to get a better understand-ing of how energy performance is seen by owners/tenants in theirdouble role, as energy consumers and as real-estate customers. Be-sides, short term motivations, like saving on energy costs orincreasing the transaction price, the owners might be interestedin energy performance by other reasons. One of them is that theproperty market tenants focus more and more on energy efficiencydue to rising energy prices, therefore the owner has to follow thedemand of the market to stay competitive and not to have anobsolete property. On the other hand, there are shareholders, espe-cially in listed companies, that have to act in line with the so-called‘‘Corporate Social Responsibility’’ (CSR), which includes sustainableand environmental aspects. Energy efficiency is a necessity in thiscase, not just an option.
The first part presents arguments for why studies are needed toidentify more links between the energy performance of buildingsand their economic value. In order to analyze whether energy effi-ciency can really translate into added value of real-estate asset, thesecond part of the paper contains information about the sensitivityof some non-European and European countries to sustainable,green or just energy efficient buildings. The third section presentsoriginal methods for analyzing the financial benefits of applyingenergy efficiency measures, by including the added value due toenergy performance within the financial analysis of investments.A survey on some existing condominiums from Romania, a

456 D. Popescu et al. / Applied Energy 89 (2012) 454–463
middle-low income country, which has to comply with Europeanenergy regulations, is developed in the fourth section. Theconclusions underline that by applying the proposed methods,the payback period of investments is calculated in a more realisticway.
2. Impact of energy efficiency features on the value of thebuilding
Costs of investments in energy efficiency measures might bemuch more than the supplementary amount of money that canbe achieved in case of transaction. According to the InternationalValuation Standards, the market value is the ‘‘estimated amountfor which a property should exchange on the date of valuation be-tween a willing buyer and a willing seller in an arm’s length trans-action after a proper marketing where parties had each actedknowledgeably, prudently, and without compulsion’’ [26]. In otherwords, the added value due to energy performance depends on thewillingness to pay more for having an energy efficient building.
The building stock renews slowly, by only 1–2% per year. For in-stance, in Austria 3,858,245 dwellings (2.05 million buildings)were counted according to the last Population Census (15 May2001). This signified an average increase of 1.37% per year, in thenumber of dwellings compared with the Census in 1991 when3,393,271 dwellings (1.81 million buildings) were counted [27].
New buildings are constructed according to high energy effi-ciency standards, therefore the highest energy saving potential isoffered by existing buildings. The case studies presented in this pa-per focuses on existing buildings built before EPBD implementa-tion. According to our knowledge, evidence on the added valuegenerated by retrofitting such properties is very limited so far.Studies had been focusing on the impact of energy certificationon the real-estate market.
2.1. Studies from US
The ASHRAE Standard 189.1 describes the high performancegreen building as a building designed, constructed and capable ofbeing operated in a manner that increases environmental perfor-mance and economic value over time [28]. The statement that suchbuildings have increased economic value is perfectly logical, butright now, it can be considered only as supposition, until moreproofs are available. Studies on the links between energy perfor-mance and the prices of properties started to be developed. Inthe US, where energy assessment methodologies such as the En-ergy Star program and LEED certification are used, different resultswere published.
Pivo and Fisher, conducted a study on 336 green and 1114 non-green buildings and found that the former have 5.9% higher net in-come, 9.8% fewer utility expenses, 4.8% higher rents and 13.5%higher market values [29]. McGraw-Hill Construction’s report for2008 concludes that during 2007, commercial Energy Star ratedbuildings were sold for approximately 15% higher prices, had 8%more in rental income, and saved 10–20% in operating expenses[30]. Miller et al. compared data on Energy Star and LEED-certifiedbuildings versus non-Energy Star or non-LEED-certified officeproperty. Their study reveals that Energy Star certification pro-duced an increase of 5.76% on selling prices, while LEED certifica-tion produced an increase of 9.94% [31]. Fuerst and McAllisteranalyzed 3600 commercial buildings by using a hedonic pricemodel controlled by location and found out that there was a rentalpremium for green buildings and an 11.8% selling premium for En-ergy Star certified properties [32]. A recent study conducted on10,000 properties by Eichholtz et al. emphasizes that there wasan effective rental premium of 6% and a selling premium of 16%
for green office buildings, during 2008 [33]. The diversity of resultscan be explained by the use of different databases from various realestate markets and different methods of analysis. The way in whichcontrol variables such as location, size and age are used in the he-donic regression model is important.
2.2. European studies
The quantitative results mentioned above prove that owners ofcommercial buildings from the US consider their property valuehigher if it is energy certified. In the EU, the Energy Performanceof Buildings Directive (EPBD) came into force nine years after theEnergy Star program started. More results on the link betweenthe impact of European policies and the sales/rental prices are ex-pected in the near future.
European research was firstly focusing on detailed sets ofrequirements and measures for improvements of energy efficiencyin buildings [34,35]. In the same way as energy assessment meth-odologies, most of them analyze the profitability of energy effi-ciency measures based on costs of energy savings and on thepayback period of the investment. An analysis of the profitabilityof energy saving architectural measures for the achievement ofthe EPBD standard in Belgium [36], points out that the best mea-sures to ensure the maximum profitability of investment in insula-tion of semi-detached dwellings are retrofit of the roof and of thefloor, while in the case of detached buildings they are retrofit ofthe facade and of the floor. Hens [37] compared predicted annualenergy for space heating with monitored results from 1978 until2009 and found out that in terms of net present value, the benefitsof the solar boiler and PV panels are minimal compared to betterinsulation, energy efficient windows, upgraded ventilation andcentral heating. Difs et al. studied the impact of energy efficiencymeasures both on consumers and on the production of the districtheating system [38].
Studies on the willingness to pay more for energy efficiency ofEuropean citizens are sparse. Banfi et al. [39] analyzed the willing-ness to pay for different energy saving measures in residentialbuildings, in the context of the Swiss housing sector. In this case,the willingness to pay for energy efficiency attributes was 3% ofthe standard price for having an enhanced insulated façade, 13%more for energy-efficient windows and 8% of the standard pricefor having a ventilation system. A recent study done by the Centerfor Corporate Responsibility and Sustainability (CCRS) from theUniversity of Zurich shows that the property market in Switzerlandhas paid an average premium of 7% on the purchase price for en-ergy-efficient single family houses and a premium of 3.5% for con-dominiums during the last ten years [40]. Brounen et al. analyzedmore than 100,000 transactions from the Netherlands and revealthat the transaction price of a dwelling with an A, B or C label inthe energy performance certificate is higher by 3.4–6.6% than ofa dwelling with a D label or less [41].
The Royal Institution of Chartered Surveyors, a top professionalorganization of real estate appraisers, recently started research onthe way that appraisal should include the energy performance ofbuildings [42]. Guidance notes about how sustainability can beembedded into the RICS property lifecycle [43] and analysis abouthow sustainability is reflected in commercial property prices weredelivered.
The common ideas are that energy efficient buildings haveimportant benefits for the developer/owner, the tenants, the soci-ety and the environment. They have reduced operation costs, im-age and reputation gains, low impact on the environment andlow use of primary resources. All these qualities should determineincrease in value and worth, advantages in tendering processes andincreased marketability. To strengthen the link between energyperformance of buildings and property valuation, valuation
D. Popescu et al. / Applied Energy 89 (2012) 454–463 457
methodologies of the green value and guidance notes, which servesas a framework for the integration of environmental mattersaffecting the valuation profession, have been developed [44].
3. Methods
According to the Directive 2010/31/EU of the European Parlia-ment and of the council of 19 May 2010 on the energy performanceof buildings, the energy efficiency recommendations included inthe energy performance certificate may provide an estimate forthe range of payback periods or cost-benefits over its economiclifecycle [45]. Article 5 points out that a new comparative method-ology framework for calculating cost-optimal levels of minimumenergy performance requirements for buildings and building ele-ments is needed. To accomplish the task, experts had to answerto several questions, one of them being: ‘‘Question 13. Should a fu-ture higher sale or rent value for a more energy efficient buildingbe taken into account already in the global cost calculation and ifso, what should that value be?’’ [46]. The present paper studiesthe opportunity of including a future higher sale value due to en-ergy performance into economic calculations, issue analyzed byEuropean energy policies makers. Moreover, it provides informa-tion on how and when it is appropriate to take the added valuedue to energy performance into consideration in such methodolo-gies. Energy efficiency measures usually mean: thermal insulationof the walls floor and attic, the replacement of old windows withenergy efficient ones, natural lighting, better HVAC equipments,the integration of renewable energy systems, demand driven con-trol, passive design, etc. Classic energy audit methodologies arebased on the calculation of the net present value of the costs of en-ergy savings compared to the price of investments for energy effi-ciency measures.
The solution presented here considers that the application ofenergy efficiency measures produces two financial benefits: loweroperation expenses and an increase in value of the building. In thiscase, part of investments in energy efficiency measures pay offimmediately, given the increased value of the property and onlythe rest has to be recovered by savings on energy expenses. As aconsequence, the investments for energy efficiency measures (I)are considered profitable if they are lower than the net present va-lue of the cost of energy savings (NPV) plus the added value of thebuilding due to energy performance (DV),
I < NPV þ DV : ð1Þ
The added value due to energy performance (DV) represents thenet additional value obtainable on the real-estate market afterapplying energy efficiency measures,
DV ¼ P2 � P1; ð2Þ
where P1 represents the transaction price of the property before ret-rofitting, while P2 is the transaction price after retrofitting.
To include it in the energy audit methodology, the quantifica-tion of the added value due to energy performance (DV) is needed.So far, few markets have been studied from this point of view andgeneralizing their results is not possible since real estate marketsare different and evaluated in different ways. Three proceduresfor calculating the added value due to energy performance are dis-cussed in the following: the hedonic pricing model, the methodbased on the direct comparison between transaction prices, themethod based on the willingness to payback investments in energyefficiency measures.
Although it seems logical that consumers should be willing topay a higher price for energy efficient buildings compared withbuildings much behind current energy performance standards,
reality is more complicated and evidence is necessary on eachstudied market.
3.1. Quantification of the added value due to energy performance
In Europe, buildings use 40% of the total energy consumptionand generate 1/3 of GHG and the existing buildings offer the high-est potential for energy savings [47]. In some regions, energy effi-ciency/sustainability is recognized as a feature that affects rentalprice. For example, by using ‘‘Ecological Rent Tables’’ [48], thethermal characteristics of residential buildings are taken intoconsideration when calculating rents in Berlin and Darmstadt. InSwitzerland, the Centre for Corporate Responsibility and Sustain-ability from the University of Zurich has recently proposed the cal-culation of an ‘‘Economic Sustainability Indicator’’ (ESI) to measurethe property risk by taking into consideration an increase/decreaseof value based on long-term future developments. Calculation ofESI is based on the quantification of five groups of sustainabilityfeatures [49,50]: polyvalence of use and flexibility, energy andwater dependency, accessibility and mobility, safety and security,healthiness and comfort. Due to the complexity of the task, initia-tives in quantifying the added value due to energy performance areso rare that they can be considered unique cases.
3.1.1. The hedonic pricing methodIn the real-estate economic theory, the building is considered a
composite good valued for its characteristics. A hedonic price func-tion describes how the quantity and quality of these characteristicsdetermine the building’s price in a particular market. Such methodcan derive the quantitative impact of the energy performance onthe value of the property.
Lorentz et al. used hedonic analysis to explore the relationshipbetween the sustainability features and the market value of resi-dential properties from Stuttgart [51]. The hedonic pricing modelwas also used by Jim and Chen [52] to study the impact of keyenvironmental elements on real estate transaction prices. Brounenet al. [41] investigated the economic value of the European energyperformance certificates by using the energy labels, as inputs.Some European studies [23,53] had quantified the added valuedue to energy performance of a wide range of numerous buildings.
A regression model can estimate the relationship between adependent variable and one or more independent variables. Thedependent variable can be the rent or the value per square meter,while the independent variables can be the energy costs per squaremeter, the age of the building, the quality of the building, location,existence/non existence of an elevator, full air-conditioner, etc. Theregression coefficients indicate how the dependent variablechanges when one of the independent variables varies. One caninterpret the regression coefficient corresponding to energy costs,as the elasticity of rent/value per square meter with respect to en-ergy costs per square meter.
In practice, use of hedonic pricing methods is complicated.Large databases containing detailed characteristics of buildingsand corresponding information on realistic prices are needed,which limits analysis to developed, totally transparent propertymarkets. Others problems are that transaction data expires fastdue to the volatility of prices and results of the hedonic pricingmodel applied to data collected from specific real estate markets,can not be extrapolate for other markets or other period.
Due to the increased interest on ‘‘green value’’, ‘‘sustainability’’or just ‘‘energy efficiency’’, real estate experts and national prop-erty valuation bodies are supposed to provide information ob-tained by the hedonic pricing model in the near future. Whensuch information will be available, based on the known value ofthe building, the added value due to energy performance can becalculated and then used in Eq. (1).

458 D. Popescu et al. / Applied Energy 89 (2012) 454–463
3.1.2. The method based on the direct comparison between transactionprices
The procedure based on the direct comparison between trans-action prices needs collaboration work between the energy auditorand an appraiser, because it includes valuation techniquesspecific to the sales comparison approach, which is an appraisalmethodology.
The sales comparison approach is based on the idea that identi-cal properties should have identical prices. It uses transactionprices of highly comparable and recently sold or currently for saleoffered properties. The price of a property is affected by complexfeatures and the effect of each feature on the value, must be ana-lyzed separately. National valuation organizations have specificpossibilities on how to take into consideration the main character-istics of the building, for adjusting the value accordingly.
To isolate the effects of energy performance on old buildings,the following several steps are recommended. Firstly, the research-er must focus on a certain type of property to be analyzed, the so-called subject property. Then, data on recent transaction prices andon the features of the comparable properties must be collectedfrom the real estate market. The so-called comparable propertiesare buildings as close as possible to the subject property in termsof specific features.
Two databases must be done; one that contains information onbuildings that had undergone energy efficiency measures and theother one that contains information on non-retrofitted buildings.The impact of location on transaction prices is significant andtherefore data must be grouped by location, in each one. Besidestransaction prices, for each building, the databases must containa description in terms of age, location, size, floor area, neighbor-hoods, view, facilities, existence of an elevator, etc.
Next, adjustments of value in accordance with specific differ-ences (age, floor area, etc.), except location, are applied to the saleprice of each comparable property. The meaning of the final ad-justed value of each, is that this would be the transaction priceof the subject property if it were sold in the same district, wherethe comparable property is built.
According to Eq. (2), the added value of a retrofitted property isthe difference between its value after retrofitting (V2R) and the va-lue before retrofitting (V1R). For some retrofitted property denotedk, Eq. (2) becomes,
DVak ¼ V2Rk � V1Rk: ð3Þ
After making adjustments of value according to all classic fea-tures, the adjusted values of non-retrofitted properties (V1N) andthe adjusted values of retrofitted properties ðV2RÞ are available inthe databases. For calculating the added value of each retrofittedproperty, by using the procedure based on comparison betweentransaction prices, information about the adjusted value of the ret-rofitted properties before applying energy efficiency measureðV1RÞ, is theoretically necessary. Since, there are no data about it,the average of adjusted values for all non-retrofitted propertiesfrom same location V1N , will be considered instead; V1Rk ¼ V1N .For the retrofitted property denoted k, the added value due to en-ergy performance, calculated by this procedure is,
DVak ¼ V2Rk � V1N: ð4Þ
The added value due to energy performance can also be calcu-lated as a percent for each retrofitted property,
ak ¼V2Rk � V1N
V1N: ð5Þ
To extrapolate results, an average added value for energy per-formance must be calculated in each location. The result, named
the transaction coefficient a, is the average rate for all the m retro-fitted properties located in the specific location,
a ¼Xm
k¼1
1m
ak: ð6Þ
When, the financial analysis of investments in energy efficiencymeasures has to be done for a property denoted X, which has to beretrofitted, only the value of the property before retrofitting (V1NX)is known. By applying the transaction coefficient a on the value ofthe property before retrofitting, the added value due to energy per-formance can be calculated,
DVaX ¼ a � V1NX : ð7Þ
An example of how the procedure based on comparison be-tween transaction prices should be used to calculate the added va-lue due to energy performance and a detailed analysis of severalcase studies are presented in the Section 4.1.
3.1.3. Method based on the willingness to payback investments inenergy efficiency measures
The proposed procedure uses a scoring model to quantify thewillingness to payback investments in energy efficiency measures.It is very simple and once the main criteria of the scoring model aresettled, the energy auditor can apply it for different cases.
A technique that could be considered to be a scoring modelbased on the sustainable characteristics and their future develop-ment, was used in the calculation of the Swiss Economic Sustain-ability Indicator (ESI) [49,50]. In this paper a scoring model basedon how the energy efficiency affects the buyer’s willingness topay back investments in energy efficiency measures is presented.
In the proposed scoring model, the main political, social andpsychological factors that can affect the willingness to pay morefor energy efficiency are as follows: energy efficiency is promotedby mass media, energy expenses represent an important part ofhousehold income; the market reflects higher prices for energyefficient buildings, sellers/buyers/tenants focus on energy effi-ciency aspects during transactions, operating expenses and energycosts are high compared to the rent/price for the property, energyprice increase fast and significantly, energy efficient buildings arerare and represents unique selling propositions, monetary penal-ties/restrictions are applied for non-energy-efficient properties,the studied building achieves passive houses standards, etc. Detailsare presented in Table 1. It may be noticed that if in the studiedcountry/region such conditions are met and well-known, the mar-ket coefficient (b) might be significant, b = [0.75, 1]. If not, the im-pact of energy efficiency on transaction prices is low b = [0, 0.25].Whether investments in energy efficiency measures are com-pletely neglected if the property is sold, b ¼ 0. Once the analysisby the scoring method is done, the market coefficient (b) is settledand the added value due to energy performance can be calculatedby the Equation
DVb ¼ b � I; ð8Þ
where I represents the cost of investments in energy efficiency mea-sures. The way the scoring model is established may vary fromcountry to country and from period to period.
As it can be noticed, the proposed procedure needs only data onhand for the energy auditor, therefore is quite simple.
3.2. Calculation of the net present value of costs of energy savings
Calculation of the potential costs of energy savings is typicallythe only parameter taken into consideration in the analysis ofinvestments in energy efficiency measures. Most energy auditmethodologies use a simple formula, similar to the following:

Table 1Calculation of the market coefficient b, using the scoring method.
D. Popescu et al. / Applied Energy 89 (2012) 454–463 459
NPV ¼XJ
j¼1
ðESÞj � ðCEÞj �XtR
n¼0
11þ i
� �n" #
; ð9Þ
where ES represent the annual energy savings, j represents the typeof energy (e.g. j = 1 for gas, j = 2 for electricity, j = 3 for district heat-ing, etc.), CE is the actual cost of the unit of energy, i is the discountrate, tR is the lifetime of the retrofitting. The annual energy savingsES represents the difference between the energy demand of thebuilding before ED1 and the energy demand after retrofitting ED2,
ES ¼ ED1 � ED2: ð10Þ
Calculation of the net present value of costs of energy savingsshould theoretically include the prognosis of energy prices. In prac-tice the problem is that energy prices increase or decrease at unex-pected rates. The best way to study the impact of the volatility ofenergy prices is to use the real option approach, based on data fromreliable sources, such as well-known energy agencies. For researchstudies this is the recommended procedure, but energy auditorswill not necessarily do the same.
Methods for calculating the net present value of costs of energysavings (NPV) depend on national energy assessment proceduresthat might include fluctuations of energy prices. For example, theRomanian methodology for energy audits [54] calculates the netpresent value of costs of energy savings with the equation,
NPV ¼XJ
j¼1
ðESÞj � ðCEÞj �XtR
n¼1
1þ fj
1þ d
� �n" #" #
; ð11Þ
where fj is the annual increase rate of energy price, d is the annualdepreciation of the currency.
4. Case studies
The diversity of cultural, financial, social and political views af-fects the mentality regarding energy efficiency across Europe. In-formed consumers from low income countries should be verysensitive to energy efficiency since energy bills represent animportant share of their household. The case studies presented inthis work are from Romania, a middle-low income country, whichrecently joined the EU and has to comply with European energyregulations.
Romania has reserves of natural gas, lignite and crude oil. Dur-ing 2009, the primary production from natural gas was 415,816 TJ,from lignite 33,950 kt and 4498 kt from crude oil. Other importantsources of energy were the nuclear heat 126,922 TJ, and the hydroenergy 15,534 GW h. The total primary energy production was28,508 ktoe, while the gross inland energy consumption was35,427 ktoe [55]. Thermal power plants accounts for 63% of
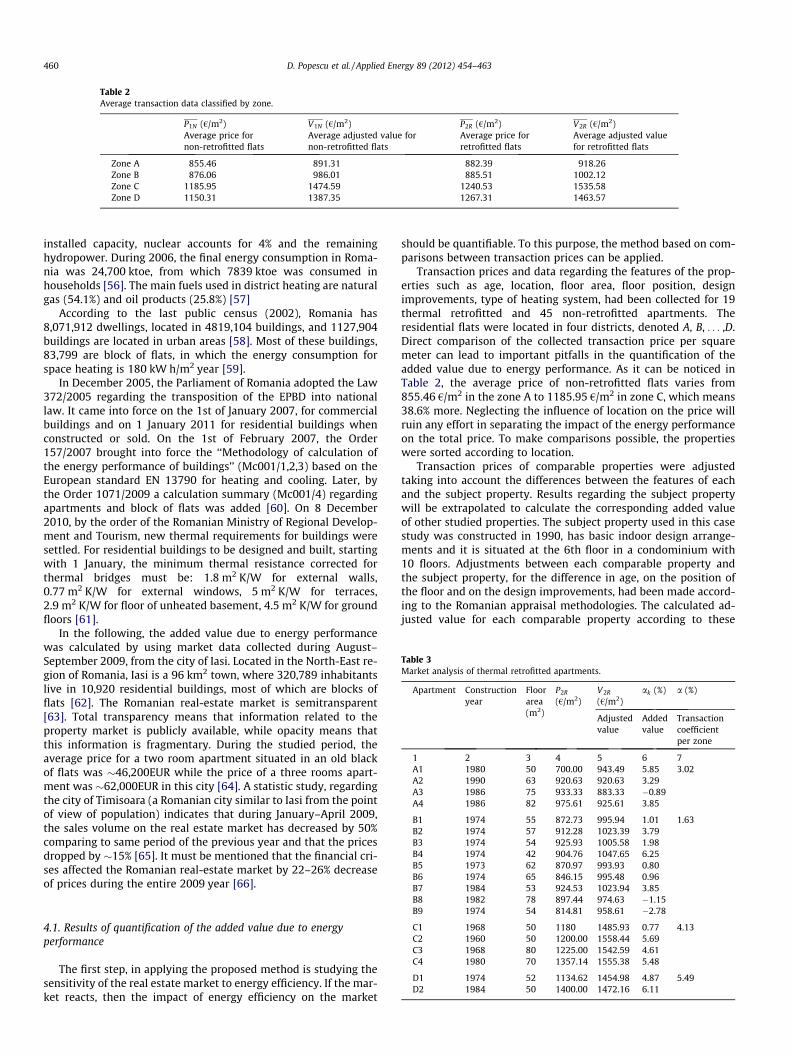
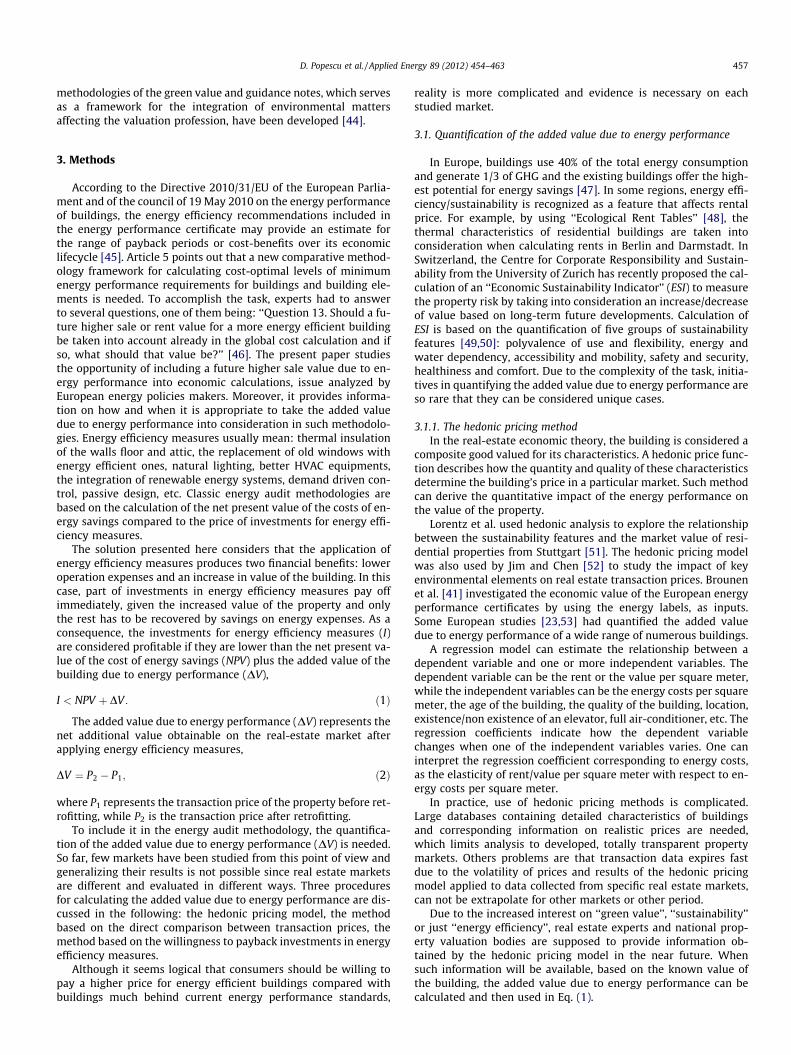
Table 2Average transaction data classified by zone.
P1N (€/m2) V1N (€/m2) P2R (€/m2) V2R (€/m2)Average price fornon-retrofitted flats
Average adjusted value fornon-retrofitted flats
Average price forretrofitted flats
Average adjusted valuefor retrofitted flats
Zone A 855.46 891.31 882.39 918.26Zone B 876.06 986.01 885.51 1002.12Zone C 1185.95 1474.59 1240.53 1535.58Zone D 1150.31 1387.35 1267.31 1463.57
Table 3Market analysis of thermal retrofitted apartments.
Apartment Constructionyear
Floorarea(m2)
P2R
(€/m2)V2R
(€/m2)ak (%) a (%)
Adjustedvalue
Addedvalue
Transactioncoefficientper zone
1 2 3 4 5 6 7A1 1980 50 700.00 943.49 5.85 3.02A2 1990 63 920.63 920.63 3.29A3 1986 75 933.33 883.33 �0.89A4 1986 82 975.61 925.61 3.85
B1 1974 55 872.73 995.94 1.01 1.63B2 1974 57 912.28 1023.39 3.79B3 1974 54 925.93 1005.58 1.98B4 1974 42 904.76 1047.65 6.25B5 1973 62 870.97 993.93 0.80B6 1974 65 846.15 995.48 0.96B7 1984 53 924.53 1023.94 3.85
460 D. Popescu et al. / Applied Energy 89 (2012) 454–463
installed capacity, nuclear accounts for 4% and the remaininghydropower. During 2006, the final energy consumption in Roma-nia was 24,700 ktoe, from which 7839 ktoe was consumed inhouseholds [56]. The main fuels used in district heating are naturalgas (54.1%) and oil products (25.8%) [57]
According to the last public census (2002), Romania has8,071,912 dwellings, located in 4819,104 buildings, and 1127,904buildings are located in urban areas [58]. Most of these buildings,83,799 are block of flats, in which the energy consumption forspace heating is 180 kW h/m2 year [59].
In December 2005, the Parliament of Romania adopted the Law372/2005 regarding the transposition of the EPBD into nationallaw. It came into force on the 1st of January 2007, for commercialbuildings and on 1 January 2011 for residential buildings whenconstructed or sold. On the 1st of February 2007, the Order157/2007 brought into force the ‘‘Methodology of calculation ofthe energy performance of buildings’’ (Mc001/1,2,3) based on theEuropean standard EN 13790 for heating and cooling. Later, bythe Order 1071/2009 a calculation summary (Mc001/4) regardingapartments and block of flats was added [60]. On 8 December2010, by the order of the Romanian Ministry of Regional Develop-ment and Tourism, new thermal requirements for buildings weresettled. For residential buildings to be designed and built, startingwith 1 January, the minimum thermal resistance corrected forthermal bridges must be: 1.8 m2 K/W for external walls,0.77 m2 K/W for external windows, 5 m2 K/W for terraces,2.9 m2 K/W for floor of unheated basement, 4.5 m2 K/W for groundfloors [61].
In the following, the added value due to energy performancewas calculated by using market data collected during August–September 2009, from the city of Iasi. Located in the North-East re-gion of Romania, Iasi is a 96 km2 town, where 320,789 inhabitantslive in 10,920 residential buildings, most of which are blocks offlats [62]. The Romanian real-estate market is semitransparent[63]. Total transparency means that information related to theproperty market is publicly available, while opacity means thatthis information is fragmentary. During the studied period, theaverage price for a two room apartment situated in an old blackof flats was �46,200EUR while the price of a three rooms apart-ment was �62,000EUR in this city [64]. A statistic study, regardingthe city of Timisoara (a Romanian city similar to Iasi from the pointof view of population) indicates that during January–April 2009,the sales volume on the real estate market has decreased by 50%comparing to same period of the previous year and that the pricesdropped by �15% [65]. It must be mentioned that the financial cri-ses affected the Romanian real-estate market by 22–26% decreaseof prices during the entire 2009 year [66].
B8 1982 78 897.44 974.63 �1.15B9 1974 54 814.81 958.61 �2.78
C1 1968 50 1180 1485.93 0.77 4.13C2 1960 50 1200.00 1558.44 5.69C3 1968 80 1225.00 1542.59 4.61C4 1980 70 1357.14 1555.38 5.48
D1 1974 52 1134.62 1454.98 4.87 5.49D2 1984 50 1400.00 1472.16 6.11
4.1. Results of quantification of the added value due to energyperformance
The first step, in applying the proposed method is studying thesensitivity of the real estate market to energy efficiency. If the mar-ket reacts, then the impact of energy efficiency on the market
should be quantifiable. To this purpose, the method based on com-parisons between transaction prices can be applied.
Transaction prices and data regarding the features of the prop-erties such as age, location, floor area, floor position, designimprovements, type of heating system, had been collected for 19thermal retrofitted and 45 non-retrofitted apartments. Theresidential flats were located in four districts, denoted A, B, . . . ,D.Direct comparison of the collected transaction price per squaremeter can lead to important pitfalls in the quantification of theadded value due to energy performance. As it can be noticed inTable 2, the average price of non-retrofitted flats varies from855.46 €/m2 in the zone A to 1185.95 €/m2 in zone C, which means38.6% more. Neglecting the influence of location on the price willruin any effort in separating the impact of the energy performanceon the total price. To make comparisons possible, the propertieswere sorted according to location.
Transaction prices of comparable properties were adjustedtaking into account the differences between the features of eachand the subject property. Results regarding the subject propertywill be extrapolated to calculate the corresponding added valueof other studied properties. The subject property used in this casestudy was constructed in 1990, has basic indoor design arrange-ments and it is situated at the 6th floor in a condominium with10 floors. Adjustments between each comparable property andthe subject property, for the difference in age, on the position ofthe floor and on the design improvements, had been made accord-ing to the Romanian appraisal methodologies. The calculated ad-justed value for each comparable property according to these

Table 4Statistical analysis.
P1N (€/m2) V1N (€/m2) P2R (€/m2) V2R (€/m2) ak (%)Price of nonretrofitted flats
Adjusted value ofnon retrofitted flats
Price ofretrofitted flats
Adjusted value ofretrofitted flats
Added value
1 Mean 1006.16 1176.62 999.78 1145.35 2.862 Standard error 27.75 40.35 43.90 59.57 0.623 Median 960 1094.75 924.53 1005.58 3.794 Standard deviation 186.20 270.69 191.38 259.68 2.735 Sample variance 34671.30 73273.53 36628.48 67436.09 7.466 Kurtosis 0.69 �1.52 �0.20 �1.31 �0.797 Skewness 0.80 0.24 0.81 0.81 �0.528 Range 858.62 797.06 700 675.11 9.039 Minimum 741.38 815.41 700 883.33 �2.7810 Maximum 1600 1612.47 1400 1558.44 6.2511 Count 45 45 19 19 1912 Confidence level (95.0%) 55.94 81.32 92.24 125.16 1.31
Table 5Results of case studies.
Case 1 Case 2 Case 3 Case 4 Case 5 Case 6
1 V1 (€/m2) 712.16 860.42 757.14 1166.67 1387.50 1198.112 S (m2) 74 48 56 90 48 533 ED1 (kW h/m2 year) 266.83 281.13 275.51 260.77 237.97 199.244 ED2 kW h/m2 year) 136.03 131.13 150.46 143.06 139.49 148.115 ES (kW h/m2 year) 130.80 150.00 125.05 117.71 98.48 51.136 I (€/m2) 56 61 55 47 60 487 DVa ¼ a � V1 (€/m2) 20.37 24.61 21.65 33.37 39.68 34.278 DVb ¼ b � I (€/m2) 33.6 36.6 33 28.2 36 25.8
9 t (years) Calculated by the classic method 11.90 11.32 12.21 11.12 16.53 21.9210 t (years) Calculated by DVa 7.56 6.69 7.39 2.81 5.61 4.5311 t (years) Calculated by DVb 4.54 4.28 4.68 4.18 6.72 9.39
D. Popescu et al. / Applied Energy 89 (2012) 454–463 461
features is presented in Table 3-column 5 for thermally retrofittedflats.
The added value due to energy performance (ak) for each retro-fitted property is presented as a percentage, in Table 3-column 6.For the 19 thermal retrofitted flats, results vary from �2.78% to+6.25%. By zone, according to Table 3-colomn 7, the highest impactof energy performance on the price may be noticed in zone D(5.49%), while the lowest can be noticed in zone B (1.63%). Theaverage added value for energy performance in the city of Iasi,during the studied period is 2.68%, representing the average oftransaction coefficients calculated per district.
Table 4, containing statistical analysis reveals how important itis to use for comparisons the adjusted values for each location,instead of just comparing average prices for retrofitted and non-retrofitted properties. The average price for non-retrofitted proper-ties is 1000.16 €/m2, which is 0.64% higher compared with theaverage price of 999.78 €/m2 for retrofitted properties (Table 4-line1). At first sight, it seems that investments in energy efficiencymeasures do not influence the transaction prices. In reality, com-parisons were wrongly made and application of the proposed pro-cedure for each location is necessary for comparing ‘‘apples withapples’’.
To conclude, the studied market is sensitive to energy efficiencymeasures and the average added value for energy performance is2.86%.
4.2. Results of the method based on comparisons between transactionprices
Once the transaction coefficient a ¼ 2:86 is calculated, theadded value of an other property from the same location can be
calculated by the method based on comparison between transac-tion prices,
DVa ¼ 2:86 � V1=100: ð12Þ
Results of the added values calculated by the procedure basedon comparisons between transaction prices are presented inTable 5-line 7 for several case studies.
4.3. Results of the method based on the willingness to paybackinvestments in energy efficiency measures
The scoring model presented in Table 1 analyzes the influenceof the main social, political and psychological factors on the will-ingness to pay higher prices on energy efficient buildings in thecity of Iasi. The scoring model indicates that b � 0:6; which meansthat 60% of the costs of investments in energy efficiency measuresare recovered when the property is sold. Results of the addedvalues calculated by the scoring method (DVb) are presented inTable 5-line 8.
4.4. Calculation of the payback period
Financial analysis of investments in energy efficiency measuresmust contain a calculation of the payback period. Classic audit en-ergy methods are based on the idea that the payback period isreached when the net present value of the costs of potential energysavings calculated for the payback period (t), are equal to the actualcosts of investments in energy efficiency measures. In Table 5-line9, the payback periods for the case studies were calculated by theclassic Romanian energy audit methodology, which uses Eq. (11)
462 D. Popescu et al. / Applied Energy 89 (2012) 454–463
where, the lifetime of the retrofitting, denoted (tR) must be re-placed by the payback period (t).
The following inputs were used: the current price of natural gasCE = 0.0296 €/kW h; the annual increase rate of energy price f = 7%,the annual depreciation of the currency d = 5%.
According to the proposed methodology, the payback period isreached if
I ¼ NPV þ DV : ð13Þ
The payback periods for costs of investments in energy effi-ciency measures calculated by the procedure based on compari-sons between transaction prices, denoted DVa, are presented inTable 5-line 10. Results calculated by the procedure based on thewillingness to payback investments in energy efficiency measures,denoted DVb, are presented in Table 5-line 11. In the studied cases,the payback period might decrease by 36–79% when the proposedprocedures are applied.
5. Conclusions
Recent studies indicate that energy efficiency and energy certi-fication produce tangible benefits recognized by the real estatemarket. US and EU studies disapprove the null hypothesis thatthere is no relationship between the market value of a real estateasset and its energy efficiency. The paper argues that since reliableproofs exist, market driven reasons, such as higher prices for en-ergy performing buildings, can be included in energy policies.
Traditionally, potential energy savings represent the onlyparameter taken into consideration in energy audits. In the presentwork, the added value due to energy performance is taken intoconsideration additionally to potential costs of energy savings.Methods that quantify the added value due to energy performanceto be used in the financial analysis of energy efficiency measuresare developed. The payback periods of investments in energy effi-ciency measures decrease when both parameters are included.
A survey on some existing condominiums in Romania demon-strates that the transaction prices of the apartments that hadundergone thermal retrofitting are higher compared to those thathave not been retrofitted. The method based on comparisons be-tween transaction prices reveals that thermal retrofitting increasesthe price of old residential buildings by an average of 2–3%, in thestudied city. The method based on the willingness to paybackinvestments in energy efficiency measures reveals that in Romania,60% of the costs of investments in thermal retrofitting may be con-sidered to be recovered during property transactions. This realitysupports the argument for taking into consideration the added va-lue due to energy performance when the financial analysis withinthe energy audit is performed.
The bottom line of the present paper is the recommendation toincorporate the sale value information in the financial analysis ofinvestments in energy efficiency measures, but to do it with cau-tion, only when and where, there are reliably proofs that the stud-ied real-estate market reacts to energy performance. Concluding,energy politics should create a broader awareness of all the advan-tages of energy efficient buildings, not only require that 20–20–20targets must be reached. The best way to include findings of higherprices for energy performing buildings in energy policies is doing awide marketing of research results, coherent as regards locationand time of collected data, instead of neglecting this aspect or justemphasizing that extra values exist.
Acknowledgments
Part of this paper is based on the research project ‘‘Improvingthe market impact of energy certification by introducing energy
efficiency and life-cycle costs into property appraisal practice’’(IMMOVALUE) financed by the Intelligent Energy Europe Program.
References
[1] European Parliament, Directive 2002/91/CE of the European Parliament and ofthe Council of 6 December 2002 on the energy performance of buildings.<http://eur-lex.europa.eu/LexUriServ/LexUriServ.do?uri=CELEX:32002L0091:EN:HTML> [accessed 08.01.10].
[2] European Parliament, Directive 2006/32/EC of the European Parliament and ofthe Council of 5 April 2006 on energy end-use efficiency and energy servicesand repealing Council Directive 93/76/EEC. <http://eur-lex.europa.eu/LexUriServ/LexUriServ.do?uri=CELEX:32006L0032:EN:HTML> [accessed08.01.10].
[3] Manfren M, Caputo P, Costa G. Paradigm shift in urban energy systemsthrough distributed generation: methods and models. Appl Energy2011;88:1032–48.
[4] Hamza N, Greenwood D. Energy conservation regulations: impacts on designand procurement of low energy buildings. Build Environ 2009;44:929–36.
[5] Zheng G, Jing Y, Huang H, Zhang X, Gao Y. Application of life cycle assessment(LCA) and extenics theory for building energy conservation assessment. Energy2009;34:1870–9.
[6] Chung W. Review of building energy-use performance benchmarkingmethodologies. Appl Energy 2011;88:1470–9.
[7] Yu Philip CH, Chow WK. A discussion on potentials of saving energy use forcommercial buildings in Hong Kong. Energy 2007;32:83–94.
[8] Nikolaidis Y, Pilavachi P, Chletsis A. Economic evaluation of energy savingmeasures in a common type of Greek building. Applied Energy.2009;86:2550–9.
[9] Rahman MM, Rasul MG, Khan MMK. Energy conservation measures in aninstitutional building in sub-tropical climate in Australia. Applied Energy2010;87:2994–3004.
[10] Aktacir MA, Büyükalaca O, Yılmaz T. A case study for influence of buildingthermal insulation on cooling load and air-conditioning system in the hot andhumid regions. Appl Energy 2010;87:599–607.
[11] Joelsson A, Gustavsson L. District heating and energy efficiency in detachedhouses of differing size and construction. Appl Energy 2009;86:126–34.
[12] Högberg L, Lind H, Grange K. Incentives for improving energy efficiency whenrenovating large-scale housing estates: a case study of the Swedish millionhomes program. Sustainability 2009;1:1349–65.
[13] Ballarini I, Corrado V. Application of energy rating methods to the existingbuilding stock: analysis of some residential buildings in Turin. Energy Build2009;41:790–800.
[14] Ekins P, Lees E. The impact of EU policies on energy use in and the evolution ofthe UK built environment. Energy Policy 2008;36:4580–3.
[15] Tronchin L, Fabbri K. A round robin test for buildings energy performance inItaly. Energy Build 2010;42:1862–77.
[16] Gram-Hanssen K, Bartiaux F, Jensen OM, Cantaert M. Do homeowners useenergy labels? A comparison between Denmark and Belgium. Energy Policy2007;35:2879–88.
[17] Nair G, Gustavsson L, Mahapatra K. Owners perception on the adoption ofbuilding envelope energy efficiency measures in Swedish detached houses.Appl Energy 2010;87:2411–9.
[18] Lior N. The ECOS 2009 World Energy Panel: an introduction to the Panel and tothe present (2009) situation in sustainable energy development. Energy2011;36:3620–8.
[19] Kragh J, Rose J. Energy renovation of single-family houses in Denmark utilisinglong-term financing based on equity. Appl Energy 2011;88:2245–53.
[20] Wouters P, Van Dijk D, Elsberger M, Miladinova G, Maldonado E, Sutherland G,et al. Implementation of energy performance of buildings directive-countryreports, Brussels, Belgium; 2008 October. <http://www.buildup.eu/publications/1302>.
[21] Jank R. Net zero and low energy buildings – theory and European practice.EnEff:Stadt, Fourth workshop, Energy efficient technologies for governmentbuildings new and retrofits. NY; January 16–18, 2008.
[22] Sayce S, Sundberg A, Clements B. Is sustainability reflected in commercialproperty prices: an analysis of the evidence base. RICS research report.London: Kingston University; January 2010.
[23] Chegut A, Eichholtz P, Kok N, Quigley J. The Value of green buildings newevidence from the United Kingdom. In: ERES 2010-ID 150. 17th ERES annualconference, Milan; June 23–26, 2010. <http://www.eres2010.org/contents/papers/id150.pdf>.
[24] IEA workshop. Evaluating the co-benefits of low-income weatherizationprograms. Dublin; January 27–28, 2010. <https://www.iea.org/work/2011/poverty/concept.pdf>.
[25] Entrop AG, Brouwers HJH, Reinders AHME. Evaluation of energy performanceindicators and financial aspects of energy saving techniques in residential realestate. Energy Build 2010;42:618–29.
[26] 8th Edition of the international valuation standards – IVS 2007. London:International Valuation Standards Committee; 2007.
[27] Statistics Austria. Stock of buildings and dwellings. <http://www.statistik.at/web_en/statistics/dwellings_buildings/stock_of_buildings_and_dwellings/dwellings_including_secondary_residences/index.html>.

D. Popescu et al. / Applied Energy 89 (2012) 454–463 463
[28] ASHRAE Standard 189.1P. Standard for the design of high – performance greenbuildings except low-rise residential buildings. Atlanta: ASHRAE organization;2010.
[29] Pivo G, Fisher J. Investment returns from responsible property investments:energy efficient, transit-oriented and urban regeneration office properties inthe US from 1998–2008. Responsible Property Investing Center, BostonCollege/University of Arizona/Benecki Center for Real Estate Studies/IndianaUniversity, Boston, working paper; March 3, 2009. <http://www.responsibleproperty.net/assets/files/pivo_fisher_investmentreturnsfromrpi3_3_09.pdf>.
[30] Murray R. McGraw-Hill construction’s green outlook 2009: trends drivingchange. New York: McGraw-Hill Publication; 2008.
[31] Miller N, Spivey J, Florance A. Does green pay off? J Real Estate PortfolioManage 2008;14:385–99.
[32] Fuerst F, McAllister P. Green noise or green value? Measuring the price effectsof environmental certification in commercial buildings. Working paper in realestate and planning. Reading, UK: Henley Business School; September 1, 2008.<http://www.ukgbc.org/site/resources/show-resource-details?id=690>.
[33] Eichholtz P, Kok N, Quigley JM. Doing good by doing well? Green officebuildings. Institute of Business and Economic Research, University ofCalifornia, Berkeley, Working paper W008-001; January 2009. <http://www.ucei.berkeley.edu/PDF/seminar20090130.pdf>.
[34] Uihlein A, Eder P. Policy options towards an energy efficient residentialbuilding stock in the EU-27. Energy Build 2010;42:791–8.
[35] Murphy L, Meijer F, Visscher H. Improving the energy performance of Dutchhouses: drawing lessons for neighbors. In: Proceedings of RICS COBRA researchconference. University of Cape Town; September 10–11, 2009. p. 1697–709.
[36] Audanaert A, De Boeck L, Roelants K. Economic analysis of the profitability ofenergy – saving architectural measures for the achievement of the EPBDstandard. Energy 2010;35:2965–71.
[37] Hens H. Energy efficient retrofit of an end of the row house: confrontingpredictions with long-term measurements. Energy Build 2010;10:1939–47.
[38] Difs K, Bennstam M, Trygg L, Nordenstam L. Energy conservation measures inbuildings heated by district heating – a local energy system perspective.Energy 2010;35:3194–203.
[39] Banfi S, Farsi M, Filippini M, Jakob M. Willingness to pay for energy-savingmeasures in residential buildings. Energy Econ 2008;30:503–16.
[40] Salvi M, Horejájová A, Müri R. Minergie macht sich bezahlt. Report from Centrefor Corporate Responsibility and Sustainability, University of Zurich,Switzerland; November, 2008. <http://minergie.ch/tl_files/download/ZKB_MINERGIE_Studie_2008.pdf> [accessed 08.01.10].
[41] Brounen D, Kok N, Menne J. Energy performance certification in the housingmarket. Implementation and valuation in the European Union. EuropeanCentre for Corporate Engagement, Maastricht University, Netherlands; April2009. <http://www.fdewb.unimaas.nl/finance/news/energy.pdf> [accessed08.01.10].
[42] Royal Institution of Chartered Surveyors. Sustainability and commercialproperty valuation. Valuation Information Paper No 13. Coventry, UK; TheRoyal Institution of Chartered Surveyors (RICS); 2009. <http://www.ukgbc.org/site/document/download/?document_id=739>.
[43] Building Surveying Professional Group. Sustainability and the RICS propertylifecycle – guidance note. RICS Books; 2009.
[44] Bienert S, Schutzenhofer C, Leopodsberger G, Bobsin K, Leutgob K, Huttler W,et al. Report 7.2. Methodologies for integration of energy performance and life-cycle costing indicators into property valuation practice. <http://immovalue.org//pdf/immvalue_wp7_report_d7.2.pdfproject-reports.html>.
[45] European Commission. Official Journal of the European Union. Directive 2010/31/EC of the European Parliament and the Council of 19 May 2010 on theenergy performance of buildings. Brussels, Belgium; 2010. <http://eur-lex.europa.eu/LexUriServ/LexUriServ.do?uri=OJ:L:2010:153:0013:0035:EN:PDF>[accessed 02.06.11].
[46] European Commission. Meeting document for the expert workshop on thecomparative framework methodology for cost optimal minimum energyperformance requirements; 16 March, 2011, Brussels. <http://ec.europa.eu/energy/efficiency/buildings/doc/meeting_document_16_march_final.pdf>.
[47] CIB – Conférence Internationale. The implementation of energy efficientbuildings policies in 5 continents. Brussels; October 14, 2009. <http://www.cstc.be/homepage/index.cfm?cat=services&sub=innov_support&pag=13&art=documents&niv01=conferences_seminars&niv02=4> [accessed07.01.10].
[48] Enseling A, Hinz E. Energetische Gebäudesanierung und Wirtschaftlichkeit –Eine Untersuchung am Beispiel des ‘‘Brunckviertels‘‘ in Ludwigshafen.Institute Wohnen und Umwelt GMBH, Darmstadt, Germany; 2006March. <http://www.energieberatung-dt.de/Broschueren/Energetische_Gebaeudesanierung_ Wirtschaftlichkeit.pdf>.
[49] Meins E, Wallbaum H, Hardziewski R, Feige A. Sustainability and propertyvaluation – a risk-based approach. Build Res Inform 2010;38(3):280–300.
[50] Meins E, Burkhard HP. Der Nachhaltigkeit von Immobilien einen finanziellenWert geben: ESI Immobilienbewertung – Nachhaltigkeit inclusive. Universityof Zürich, Switzerland; 2009. <https://www.zora.uzh.ch/19637/2/ESI_Nachhaltigkeit_inklusive_V.pdf>.
[51] Lorentz D, Truck S, Lutzkendorf T. Exploring the relationship between thesustainability of construction and market value. Theoretical basics and initialempirical results from the residential property sector. Prop Manage2007;25:119–49.
[52] Jim CY, Chen W. Impacts of urban environmental elements on residentialhousing prices in Guangzhou (China). Landscape Urban Plan 2006;78:422–34.
[53] Leopoldberger G, Bienert S, Brunauer W, Bobsin K, Schutzenhofer C.Energising property valuation in Europe. Putting a value on energy efficientbuildings. ERES 2010 – ID 178. 17th ERES annual conference. Milan; June 23–26, 2010.
[54] Ordinul ministrului transporturilor, constructiilor si turismului nr.157/2007.Metodologie de calcul al performant�ei energetice a cladirilor – Mc001/3[Methodology for calculation of the energy performance of buildings – Mc001/3]. Monitorul Oficial al României, Partea I, nr. 126bis; February 21, 2007.
[55] European Commission. Energy balance sheets – 2008–2009. Luxembourg:Office of the European Union; 2011. <http://epp.eurostat.ec.europa.eu/cache/ITY_OFFPUB/KS-EN-11-001/EN/KS-EN-11-001-EN.PDF>.
[56] European Commission. EUROSTAT statistical books 2009. Panorama of energy:energy statistics to support EU policies and solutions ISSN 1831-3256; 2009.<http://epp.eurostat.ec.europa.eu/cache/ITY_OFFPUB/KS-GH-09-001/EN/KS-GH-09-001-EN.PDF>.
[57] Leca A. Concerning some priorities of the Romanian energy sector. Proceedingsof the 9th Regional Energy Forum [CD-ROM]. Romania: Neptun-Olimp; June15–19, 2008.
[58] National Institute of Statistics. Census of population and dwellings. 2002.<http://www.insse.ro/cms/files/RPL2002INS/vol3/tabele/tab7.pdf>.
[59] Rotariu D. Buildings thermal rehabilitation effects upon Bucharest DistrictHeating Company. In: Proceedings of the 9th regional energy forum [CD-ROM].Romania: Neptun-Olimp; June 15–19, 2008.
[60] Maldonado E, editor. Implementing the energy performance of buildingsdirective. Featuring Country Reports. Brussels; 2011. <http://www.epbd-ca.org/Medias/Downloads/CA_Book_Implementing_the_EPBD_Featuring_Country_Reports_2010.pdf>.
[61] MO partea I, nr. 820/8.12.2010. Ordin pentru modificarea reglementariitehnice ‘‘Normativ privind calculul termotehnic al elementelor deconstructie al cladirilor’’, indicativ C107-2005, aprobata prin Ordinulministerului transporturilor, constructiilor si turismului nr.2.055/2005;December 8, 2010.
[62] National Institute of Statistics. Romania. <http://www.insse.ro>.[63] Warren-Myers G, Reed R. Sustainability: measurement and valuation? –
Insight from Australia and New Zealand. 15th Annual Pacific rim real estatesociety conference. Sydney; January 2009.
[64] Panait A. Ieftiniri de 35,000 EURO in Ploiesti. Expert imobiliar; December 22,2009. p. 11.
[65] Sipos C, Buglea A, Crivil A. Main possibilities to use the statistical methods inreal estate valuation. Valuation J 2009;6:5–21.
[66] Lefter O. Ieftiniri in lant pe piata imobiliara. Expert imobiliar; February 9, 2010.p. 3


