
Impact of Economic Crisis on Public R&D Georg Licht & Markus Nisch Center for European Economic...
19
Impact of Economic Crisis on Public R&D Georg Licht & Markus Nisch Center for European Economic Research (ZEW) Mannheim, Germany International Scientific Forum VUZF University Innovation: Engine for Economic Growth October 1, 2013, Sofia
-
Upload
howard-atkinson -
Category
Documents
-
view
219 -
download
0
Transcript of Impact of Economic Crisis on Public R&D Georg Licht & Markus Nisch Center for European Economic...

Impact of Economic Crisis on Public R&D
Georg Licht & Markus NischCenter for European Economic Research (ZEW)
Mannheim, Germany
International Scientific Forum VUZF UniversityInnovation: Engine for Economic Growth
October 1, 2013, Sofia

Agenda
Motivation
Public and private R&D as Drivers of Growth
R&D Investments over the Business Cycle
Current Economic Crisis and R&D Investments
Summary and Conclusions

Introduction & Motivation
Barcelona 3%-objective [2/3 by business sector; 1/3 by public sector]
Crisis hit the incentives and the ability of firms to invest into R&D
Fiscal consolidation: Two-faced Simulating growth vs. limits growth-promoting investment;

R&D, Growth, Productivity - Literature
R&D, Growth, and Productivity Theory: Romer 1986; Grossman/Helpman 1991; Aghion/Howitt
1998; etc. Empirical Evidence: Coe/Helpman 1995; Griliches 1998; etc.
Social Returns to R&D >> Private Returns to R&D Country level: Nadiri und Kim (1996); Park (1995, 2004); etc. Industry level: Griliches (1973); Goto und Suzuki (1979);
Bernstein (1998); Mamuneas (1999); etc. Firm level: Jaffe (1986), Harhoff (2000), Rouvinen (2002); etc.
Public R&D as Driver of Productivity Salter / Martin (2001)

R&D over the Business Cycle
PRIVATE R&D: Expected returns -> Crises increase uncertainty -> Lower
expected demand -> Downward pressure on R&D Financial constraints becomes more severe: Cash flow limits;
availability of bank loans reduce However: (Opportunity) cost of doing R&D decrease
PUBLIC R&D: Opportunity cost of R&D spending increase due to the impact
of crises on the demand for other government intervention: e.g. counter-cyclical demand side policies, unemployment benefits, etc.
Lower tax income

FI
SE
FR
ES
PLDE
IT
UK
RO
IE
CZ
AT
EELV
BG
HU
PT GR
SK
NLBE
DK
SI
< -10
-10 to -5
-4.9 to 0
0.1 to 4.9
5 to 10
> 10
Average growth rates of GBOARD(2008-2012; %)
Growth of R&D in Central
Government’s Budget
• North-South Gap in R&D becomes larger during the current economic and financial crisis
• Additional public R&D spendings increase in first year of the crises but in later phases public R&D growth declines or even becomes negative

Private R&D, Public R&D, and
R&D Intensity in 2010
0,0 0,5 1,0 1,5 2,0 2,5 3,0 3,5 4,0
GreeceSlovak R.
PolandHungary
ItalySpain
PortugalLuxembourg
Czech R.EstoniaIreland
UKNetherlands
BelgiumSlovenia
FranceAustria
GermanyDenmark
SwedenFinland
BERD
HERD
GOVERD
• Public R&D is more important for countries with a low R&D intensity
• North-South decline in R&D intensities
• BERD, HERD, GOVERD in % of GDP
Source: OECD-MSTI 2013-1

Measuring Public Funds for R&D at the Country Level
GBOARD = Government Appropriations or Outlays for R&D comprise all the budget items involving R&D and measuring or estimating their R&D content (Includes central government only)
Public R&D spending = + Business Enterprise R&D (BERD) financed by
Government+ Higher Education R&D (HERD) excluding HERD financed
by the private sector + Government Intramural R&D (GOVERD) excluding
GOVERD financed by the private sector
Source: OECD-MSTI 2013-1

Private R&D Expenditures and Public R&D Budgets- GBOARD Inflation Adjusted -
Growth rates BERD
Growth rates GBOARD
Growth rates BERD
Growth rates GBOARD
Growth rates BERD
Growth rates GBOARD
Growth rates BERD
Growth rates GBOARD

97-98 99-00 01-03 04-07 08-10 11-12 97-98 99-00 01-03 04-07 08-10 11-12
Southern Europe 4,9% 5,7% 4,2% 8,6% 1,7% -1,0% 5,7% 9,4% 5,2% 3,5% -0,1% -8,6%
Central Europe 3,4% 6,6% 1,8% 2,4% 2,1% 4,3% -1,3% 2,5% 2,0% -0,5% 5,2% 0,8%
Western Europe 2,9% 5,2% 1,2% 2,4% -1,0% -0,8% -2,1% 6,2% 6,2% -0,3% -1,8% -5,0%
Scandinavia 7,7% 11,2% 1,5% 1,9% 1,1% 1,9% -1,9% 1,9% 4,7% 1,9% 5,3% -1,3%
Eastern Europe 6,1% -0,4% 0,2% 9,4% 6,2% 16,4% 3,8% 2,3% 1,5% 7,0% 1,3% 0,4%
USA 6,6% 7,2% -1,9% 4,3% -0,3% -0,4% 1,7% 4,6% 8,6% 2,3% 0,2% -4,8%
Japan 3,3% 2,0% 4,1% 4,8% -3,9% 3,3% 3,5% 5,7% 4,5% 0,2% 1,5% 2,5%
Korea -4,3% 12,6% 7,5% 10,2% 6,6% 12,7% 12,6% 9,2% 7,3% 8,8% 6,2%
Germany 4,3% 7,3% 2,0% 2,6% 2,2% 5,8% -2,5% 0,0% 1,5% 1,7% 6,3% 1,1%
France 1,1% 4,3% 1,8% 1,6% 2,8% 2,2% -1,9% 4,0% 2,5% -4,6% 4,4% 1,0%
Italy 0,9% 3,7% 0,3% 5,7% 3,0% -0,1% 2,3% 8,7% 2,0% 0,5% -2,1% -7,4%
Spain 12,4% 8,3% 9,5% 10,7% -0,9% -3,1% 13,0% 9,8% 11,0% 6,1% 0,2% -15,2%
BERD growth rates GBOARD growth rates
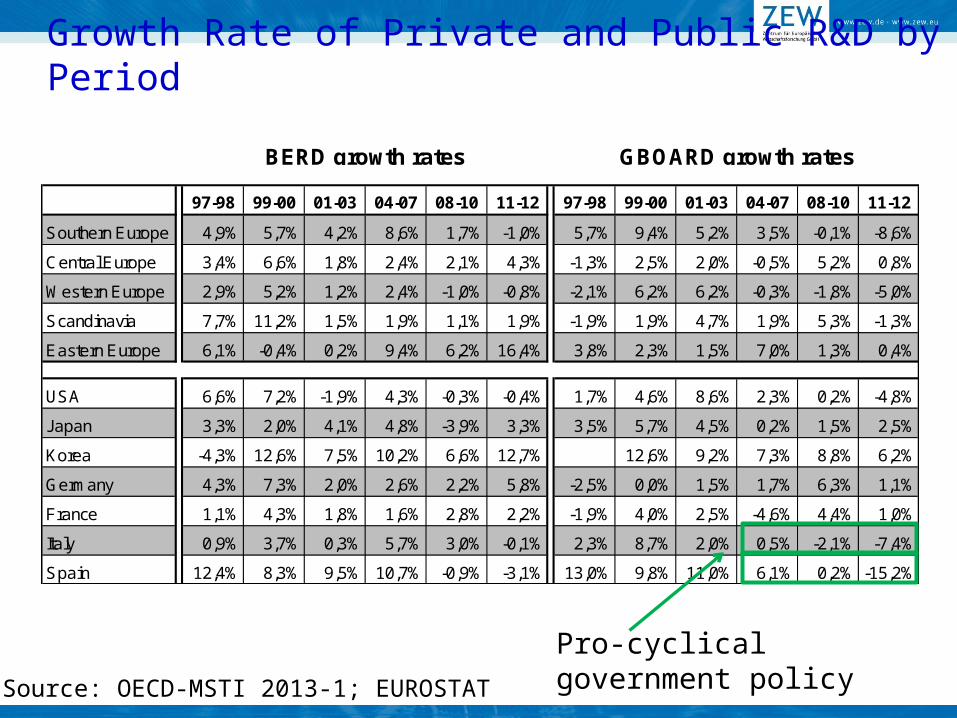
Growth Rate of Private and Public R&D by Period
Source: OECD-MSTI 2013-1; EUROSTAT

97-98 99-00 01-03 04-07 08-10 11-12 97-98 99-00 01-03 04-07 08-10 11-12
Southern Europe 4,9% 5,7% 4,2% 8,6% 1,7% -1,0% 5,7% 9,4% 5,2% 3,5% -0,1% -8,6%
Central Europe 3,4% 6,6% 1,8% 2,4% 2,1% 4,3% -1,3% 2,5% 2,0% -0,5% 5,2% 0,8%
Western Europe 2,9% 5,2% 1,2% 2,4% -1,0% -0,8% -2,1% 6,2% 6,2% -0,3% -1,8% -5,0%
Scandinavia 7,7% 11,2% 1,5% 1,9% 1,1% 1,9% -1,9% 1,9% 4,7% 1,9% 5,3% -1,3%
Eastern Europe 6,1% -0,4% 0,2% 9,4% 6,2% 16,4% 3,8% 2,3% 1,5% 7,0% 1,3% 0,4%
USA 6,6% 7,2% -1,9% 4,3% -0,3% -0,4% 1,7% 4,6% 8,6% 2,3% 0,2% -4,8%
Japan 3,3% 2,0% 4,1% 4,8% -3,9% 3,3% 3,5% 5,7% 4,5% 0,2% 1,5% 2,5%
Korea -4,3% 12,6% 7,5% 10,2% 6,6% 12,7% 12,6% 9,2% 7,3% 8,8% 6,2%
Germany 4,3% 7,3% 2,0% 2,6% 2,2% 5,8% -2,5% 0,0% 1,5% 1,7% 6,3% 1,1%
France 1,1% 4,3% 1,8% 1,6% 2,8% 2,2% -1,9% 4,0% 2,5% -4,6% 4,4% 1,0%
Italy 0,9% 3,7% 0,3% 5,7% 3,0% -0,1% 2,3% 8,7% 2,0% 0,5% -2,1% -7,4%
Spain 12,4% 8,3% 9,5% 10,7% -0,9% -3,1% 13,0% 9,8% 11,0% 6,1% 0,2% -15,2%
BERD growth rates GBOARD growth rates
Growth Rate of Private and Public R&D by Period
Source: OECD-MSTI 2013-1; EUROSTAT
Counter-cyclical government policy
97-98 99-00 01-03 04-07 08-10 11-12 97-98 99-00 01-03 04-07 08-10 11-12
Southern Europe 4,9% 5,7% 4,2% 8,6% 1,7% -1,0% 5,7% 9,4% 5,2% 3,5% -0,1% -8,6%
Central Europe 3,4% 6,6% 1,8% 2,4% 2,1% 4,3% -1,3% 2,5% 2,0% -0,5% 5,2% 0,8%
Western Europe 2,9% 5,2% 1,2% 2,4% -1,0% -0,8% -2,1% 6,2% 6,2% -0,3% -1,8% -5,0%
Scandinavia 7,7% 11,2% 1,5% 1,9% 1,1% 1,9% -1,9% 1,9% 4,7% 1,9% 5,3% -1,3%
Eastern Europe 6,1% -0,4% 0,2% 9,4% 6,2% 16,4% 3,8% 2,3% 1,5% 7,0% 1,3% 0,4%
USA 6,6% 7,2% -1,9% 4,3% -0,3% -0,4% 1,7% 4,6% 8,6% 2,3% 0,2% -4,8%
Japan 3,3% 2,0% 4,1% 4,8% -3,9% 3,3% 3,5% 5,7% 4,5% 0,2% 1,5% 2,5%
Korea -4,3% 12,6% 7,5% 10,2% 6,6% 12,7% 12,6% 9,2% 7,3% 8,8% 6,2%
Germany 4,3% 7,3% 2,0% 2,6% 2,2% 5,8% -2,5% 0,0% 1,5% 1,7% 6,3% 1,1%
France 1,1% 4,3% 1,8% 1,6% 2,8% 2,2% -1,9% 4,0% 2,5% -4,6% 4,4% 1,0%
Italy 0,9% 3,7% 0,3% 5,7% 3,0% -0,1% 2,3% 8,7% 2,0% 0,5% -2,1% -7,4%
Spain 12,4% 8,3% 9,5% 10,7% -0,9% -3,1% 13,0% 9,8% 11,0% 6,1% 0,2% -15,2%
BERD growth rates GBOARD growth rates
Growth Rate of Private and Public R&D by Period
Source: OECD-MSTI 2013-1; EUROSTAT
Pro-cyclical government policy
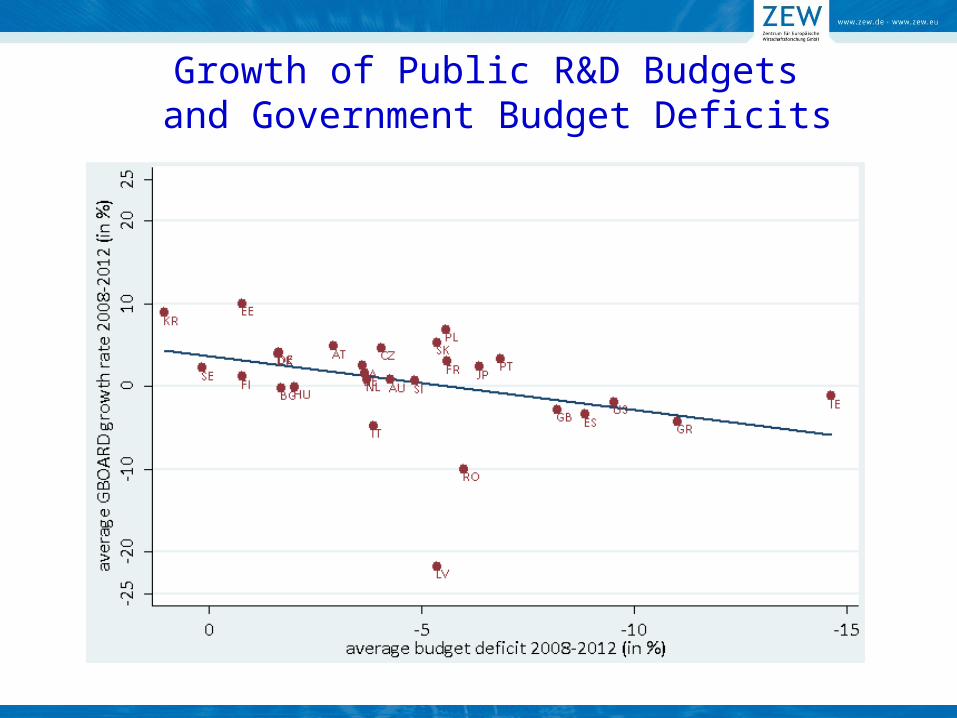
Growth of Public R&D Budgets and Government Budget Deficits
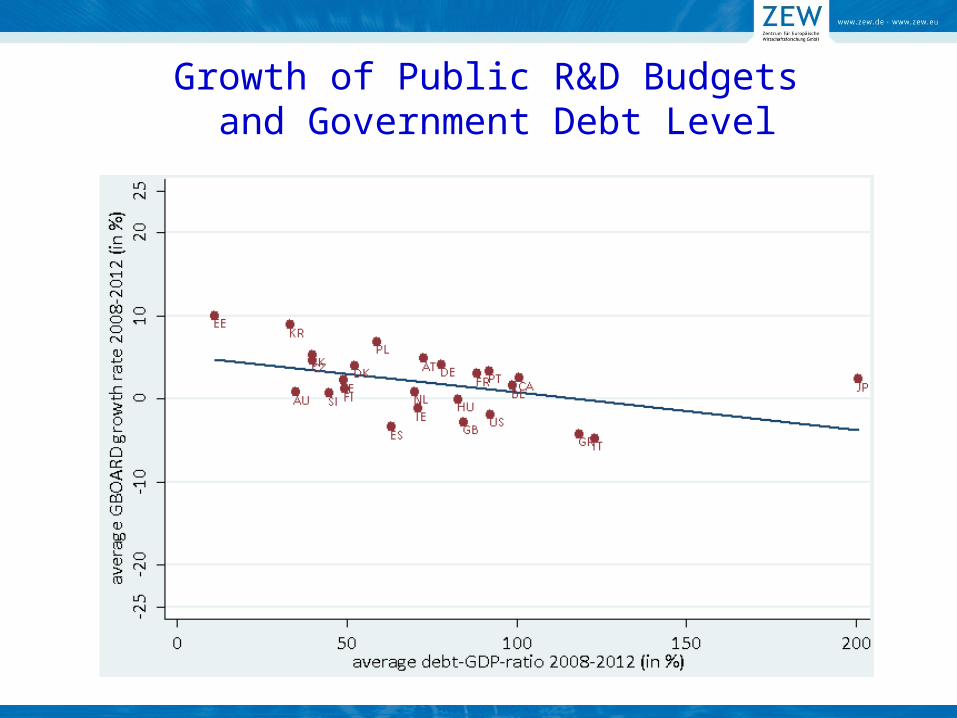
Growth of Public R&D Budgets and Government Debt Level

Empirical Approach
24 EU member states (EU-27 excluding Romania, Luxemburg, Malta)
Panel data at country level; Unbalanced panel covering the period 1981-2012
Arellano Bond Estimator
Three different models: BERD, GBOARD, PubR&D normalised by GDP to account for size of countries
Specification:R&Dit = f ( R&Dit-1 , GDPit-1, Interestit, Government budget
defizitit-1, Government debt levelit-1) + vi + eit

Drivers of Public and Private R&D Investments - Summary of Panel Regression Results -
Private R&D
/ GDP
Public R&D / GDP
(Budget Figures)
R&D Spending for Universities,
Public Research Institutes, and
R&D Subsidies to Private Sector /
GDP
Lagged endo. variable + + +
GDP + + +
Long-term interest rate - -
Government net lending / GDP - -
Government debt / GDP -
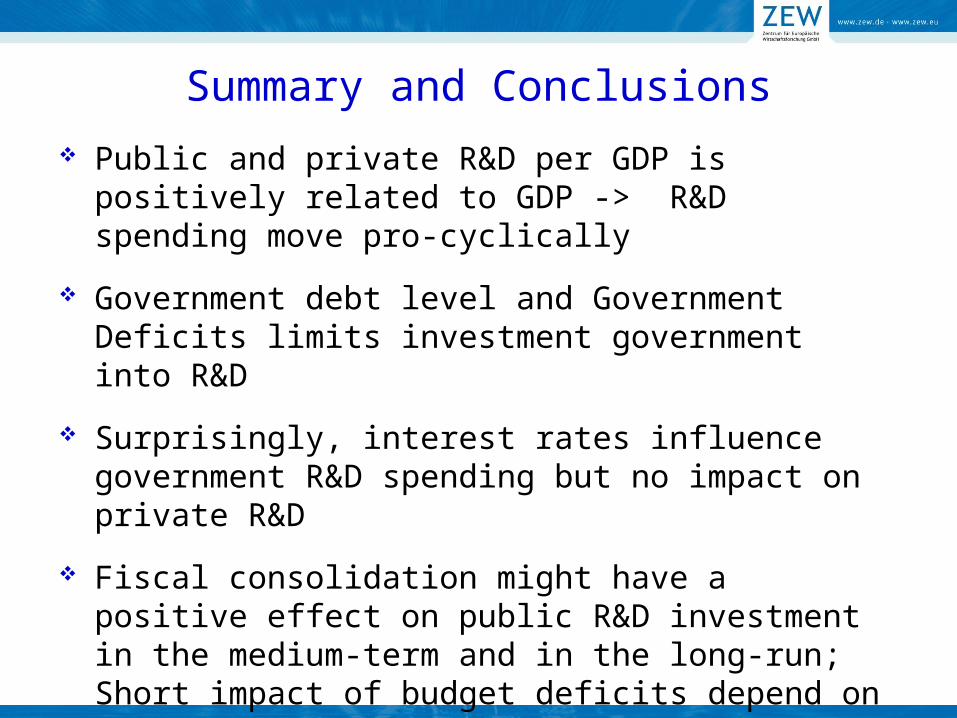
Summary and Conclusions
Public and private R&D per GDP is positively related to GDP -> R&D spending move pro-cyclically
Government debt level and Government Deficits limits investment government into R&D
Surprisingly, interest rates influence government R&D spending but no impact on private R&D
Fiscal consolidation might have a positive effect on public R&D investment in the medium-term and in the long-run; Short impact of budget deficits depend on how governments approach fiscal consolidation; History however shows that public R&D has to contribute to the reduction of government benefits

Thank You For Your Attention
Georg Licht [email protected] for European Economic Research www.zew.deZEW, Mannheim, Germany
Co: Science Metrix

Selected References
Aghion, P. and Howitt, P. (1998) Endogenous Growth Theory. Cambridge, MA: MIT Press.
Aghion, P., Askenazy, P., Berman, N., Cette, G. and Eymard, L. (2012) Credit constraints and the cyclicality of R&D investment: Evidence from France. Journal of the European Economic Association 10: 1001-1024.
Barlevy, G. (2007), On the cyclicality of R&D, American Economic Review 97, 1131–64.
Coad, A. and Rao, R. (2010) Firm growth and R&D expenditure. Economics of Innovation and New Technology 19: 127-145.
Coe, D.T. and Helpman, E. (1995) International R&D spillovers. European Economic Review 39: 859-887.
Comin, D. and Gertler, M. (2006) Medium-term business cycles. American Economic Review 96: 523-551.
Czarnitzki, D. and Licht, G. (2006) Additionality of public R&D grants in a transition economy, Economics of Transition 14: 101-131.
David, P.A., Hall, B.H. and Toole, A.A. (2000) Is public R&D a complement or substitute for private R&D? A review of the econometric evidence. Research Policy 29: 497-529.
Geroski, P.A. and Walters, C.F. (1995) Innovative activity over the business cycle. Economic Journal 105: 916-928.
González, X., Jaumandreu, J. and Pazó, C. (2005) Barriers to innovation and subsidy effectiveness. RAND Journal of Economics 36: 930-950.
Griffith, R., Redding, S. and Van Reenen, J. (2004) Mapping the two faces of R&D: Productivity growth in a panel of OECD industries. Review of Economics and Statistics 86: 883-895.
Griliches, Z. (1998) R&D and Productivity: The Econometric Evidence. Chicago: University of Chicago Press.
Guellec, D. and Van Pottelsberghe de la Potterie, B. (2001) R&D and productivity growth: Panel data analysis of 16 OECD countries. OECD Economic Studies 33: 103-127.
Hall, B.H., Mairesse, J. and Mohnen, P. (2010) Measuring the returns to R&D. In Hall, B.H. and Rosenberg, N. (Eds.) Handbook of the Economics of Innovation. Elsevier-North Holland.
Jones, C. (1995) R&D Based Models of Economic Growth, Journal of Political Economy 103, 759-784.
Link, A.N. and J.T. Scott (2011). Public Goods, Public Gains: Calculating the Social Benefits of Public R&D, New York: Oxford University Press.
Ouyang, M. (2011) On the cyclicality of R&D. Review of Economics and Statistics 93: 542-553.
Rafferty, M.C. (2003) Do business cycles influence long-run growth? The effect of aggregate demand on firm-financed R&D expenditures. Eastern Economic Journal 29: 607-618.
Romer, P.M. (1986) Increasing returns and long-run growth. Journal of Political Economy 94: 1002-1037.
Salter, A. and B. Martin (2001). The economic benefits of publicly funded basic research: a critical review, Research Policy 30, 509–532