Impact of Ebiz Iniviative on Fitm Value
16
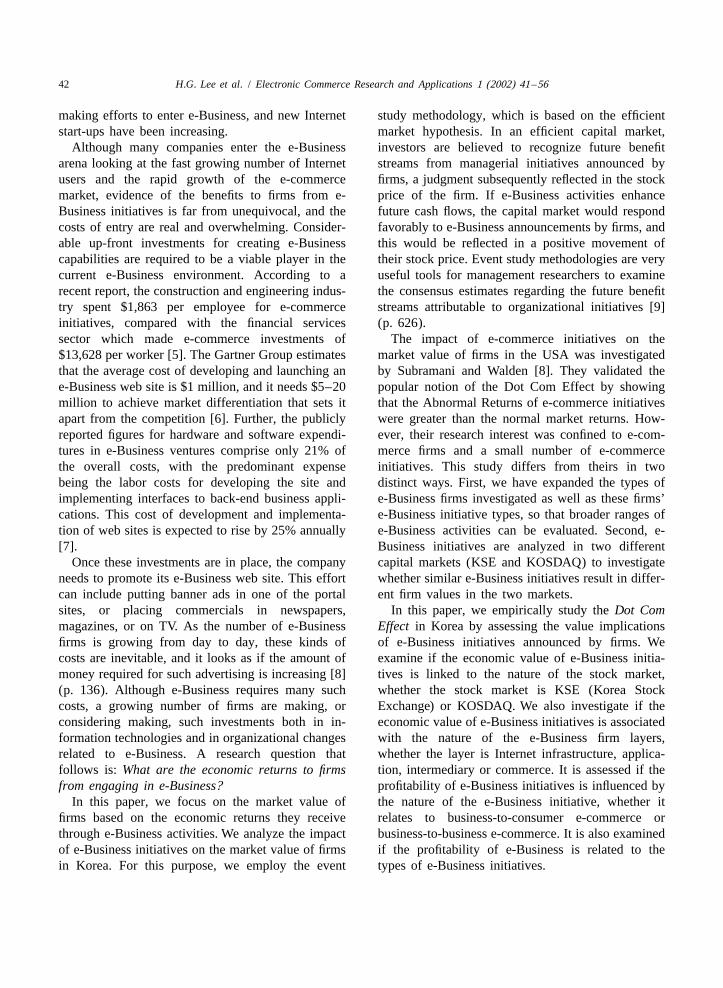
Electronic Commerce Research and Applications 1 (2002) 41–56 www.elsevier.com / locate / ecra Impact of e-Business initiatives on firm value * Ho Geun Lee , Dong Hwan Cho, Seong Chul Lee Department of Business Administration, College of Business and Economics, Yonsei University, Shinchon-Dong 134, Seodaemun-Ku, Seoul 120-749, South Korea Accepted 10 April 2002 Abstract A growing number of firms are competitively entering into e-Business because they see the high potential of e-Business growth as an opportunity. The positive expectation of the e-Business market leads most firms to go into e-Business, but it is not clear what kinds of benefits firms gain through e-Business. In this paper, we examine whether firms’ economic benefits are related to e-Business activities. For this purpose, we employ event study methodology and assess the cumulative abnormal returns for 782 e-Business initiatives by firms listed in Korean capital markets. The well-known Dot Com Effect is verified empirically by this study. The results of this study indicate that e-Business potential is highly valued in the capital market, and e-Business firms are expected to create significant benefits in the future period. 2002 Published by Elsevier Science B.V. Keywords: e-Business; Electronic commerce; Event study; Market value; Internet economy 1. Introduction means a lot of potential customers in the e-Business market. People are becoming more interested in the Inter- The e-commerce market around the world was net and e-Business all over the world. Such interest estimated to be more than $500 billion in 2001, and can be observed by the increasing number of Internet is expected to reach $1.49 trillion in 2003 according users. According to NUA, an Internet survey inves- to Forrester Research. LG Economic Research Insti- tigator in the US, the number of home Internet users tute and Andersen Consulting state that the e-com- was estimated to be 379 million in 2001 [1]. This merce market size in Korea is expected to grow figure is about twice the 201 million users in 1999. about 100% every year [3]. Another reason that firms Korea is not an exception to this fast growing trend, have been entering the e-Business market emulously and the number of Internet users in Korea was 19 is the high stock prices of Internet firms [4] (p. 25). million at the end of December 2000 [2]. This huge Korean Internet firms have had very high stock number of Internet users in Korea, and the world, prices compared to other stocks in Korea. The KOSDAQ index was over 290 at one time with an annual growth rate of more than 100%, and this number was actually driven by Internet firms. A *Corresponding author. Tel.: 182-2-2123-4470; fax: 182-2- number of brick-and-mortar firms, which observed 393-7430. E-mail address: [email protected] (H.G. Lee). the high stock prices of Internet firms, have been 1567-4223 / 02 / $ – see front matter 2002 Published by Elsevier Science B.V. PII: S1567-4223(02)00005-4
-
Upload
sahil-sudera -
Category
Documents
-
view
215 -
download
2
Transcript of Impact of Ebiz Iniviative on Fitm Value
Electronic Commerce Research and Applications 1 (2002) 41–56
www.elsevier.com/ locate/ecra
I mpact of e-Business initiatives on firm value*Ho Geun Lee , Dong Hwan Cho, Seong Chul Lee
Department of Business Administration, College of Business and Economics, Yonsei University, Shinchon-Dong 134, Seodaemun-Ku,Seoul 120-749, South Korea
Accepted 10 April 2002
Abstract
A growing number of firms are competitively entering into e-Business because they see the high potential of e-Businessgrowth as an opportunity. The positive expectation of the e-Business market leads most firms to go into e-Business, but it isnot clear what kinds of benefits firms gain through e-Business. In this paper, we examine whether firms’ economic benefitsare related to e-Business activities. For this purpose, we employ event study methodology and assess the cumulativeabnormal returns for 782 e-Business initiatives by firms listed in Korean capital markets. The well-knownDot Com Effect isverified empirically by this study. The results of this study indicate that e-Business potential is highly valued in the capitalmarket, and e-Business firms are expected to create significant benefits in the future period. 2002 Published by Elsevier Science B.V.
Keywords: e-Business; Electronic commerce; Event study; Market value; Internet economy
1 . Introduction means a lot of potential customers in the e-Businessmarket.
People are becoming more interested in the Inter- The e-commerce market around the world wasnet and e-Business all over the world. Such interest estimated to be more than $500 billion in 2001, andcan be observed by the increasing number of Internet is expected to reach $1.49 trillion in 2003 accordingusers. According to NUA, an Internet survey inves- to Forrester Research. LG Economic Research Insti-tigator in the US, the number of home Internet users tute and Andersen Consulting state that the e-com-was estimated to be 379 million in 2001 [1]. This merce market size in Korea is expected to growfigure is about twice the 201 million users in 1999. about 100% every year [3]. Another reason that firmsKorea is not an exception to this fast growing trend, have been entering the e-Business market emulouslyand the number of Internet users in Korea was 19 is the high stock prices of Internet firms [4] (p. 25).million at the end of December 2000 [2]. This huge Korean Internet firms have had very high stocknumber of Internet users in Korea, and the world, prices compared to other stocks in Korea. The
KOSDAQ index was over 290 at one time with anannual growth rate of more than 100%, and thisnumber was actually driven by Internet firms. A*Corresponding author. Tel.:182-2-2123-4470; fax:182-2-number of brick-and-mortar firms, which observed393-7430.
E-mail address: [email protected](H.G. Lee). the high stock prices of Internet firms, have been
1567-4223/02/$ – see front matter 2002 Published by Elsevier Science B.V.PI I : S1567-4223( 02 )00005-4
42 H.G. Lee et al. / Electronic Commerce Research and Applications 1 (2002) 41–56
making efforts to enter e-Business, and new Internet study methodology, which is based on the efficientstart-ups have been increasing. market hypothesis. In an efficient capital market,
Although many companies enter the e-Business investors are believed to recognize future benefitarena looking at the fast growing number of Internet streams from managerial initiatives announced byusers and the rapid growth of the e-commerce firms, a judgment subsequently reflected in the stockmarket, evidence of the benefits to firms from e- price of the firm. If e-Business activities enhanceBusiness initiatives is far from unequivocal, and the future cash flows, the capital market would respondcosts of entry are real and overwhelming. Consider- favorably to e-Business announcements by firms, andable up-front investments for creating e-Business this would be reflected in a positive movement ofcapabilities are required to be a viable player in the their stock price. Event study methodologies are verycurrent e-Business environment. According to a useful tools for management researchers to examinerecent report, the construction and engineering indus- the consensus estimates regarding the future benefittry spent $1,863 per employee for e-commerce streams attributable to organizational initiatives [9]initiatives, compared with the financial services (p. 626).sector which made e-commerce investments of The impact of e-commerce initiatives on the$13,628 per worker [5]. The Gartner Group estimates market value of firms in the USA was investigatedthat the average cost of developing and launching an by Subramani and Walden [8]. They validated thee-Business web site is $1 million, and it needs $5–20 popular notion of the Dot Com Effect by showingmillion to achieve market differentiation that sets it that the Abnormal Returns of e-commerce initiativesapart from the competition [6]. Further, the publicly were greater than the normal market returns. How-reported figures for hardware and software expendi- ever, their research interest was confined to e-com-tures in e-Business ventures comprise only 21% of merce firms and a small number of e-commercethe overall costs, with the predominant expense initiatives. This study differs from theirs in twobeing the labor costs for developing the site and distinct ways. First, we have expanded the types ofimplementing interfaces to back-end business appli- e-Business firms investigated as well as these firms’cations. This cost of development and implementa- e-Business initiative types, so that broader ranges oftion of web sites is expected to rise by 25% annually e-Business activities can be evaluated. Second, e-[7]. Business initiatives are analyzed in two different
Once these investments are in place, the company capital markets (KSE and KOSDAQ) to investigateneeds to promote its e-Business web site. This effort whether similar e-Business initiatives result in differ-can include putting banner ads in one of the portal ent firm values in the two markets.sites, or placing commercials in newspapers, In this paper, we empirically study theDot Commagazines, or on TV. As the number of e-Business Effect in Korea by assessing the value implicationsfirms is growing from day to day, these kinds of of e-Business initiatives announced by firms. Wecosts are inevitable, and it looks as if the amount of examine if the economic value of e-Business initia-money required for such advertising is increasing [8] tives is linked to the nature of the stock market,(p. 136). Although e-Business requires many such whether the stock market is KSE (Korea Stockcosts, a growing number of firms are making, or Exchange) or KOSDAQ. We also investigate if theconsidering making, such investments both in in- economic value of e-Business initiatives is associatedformation technologies and in organizational changes with the nature of the e-Business firm layers,related to e-Business. A research question that whether the layer is Internet infrastructure, applica-follows is: What are the economic returns to firms tion, intermediary or commerce. It is assessed if thefrom engaging in e-Business? profitability of e-Business initiatives is influenced by
In this paper, we focus on the market value of the nature of the e-Business initiative, whether itfirms based on the economic returns they receive relates to business-to-consumer e-commerce orthrough e-Business activities. We analyze the impact business-to-business e-commerce. It is also examinedof e-Business initiatives on the market value of firms if the profitability of e-Business is related to thein Korea. For this purpose, we employ the event types of e-Business initiatives.
H.G. Lee et al. / Electronic Commerce Research and Applications 1 (2002) 21–56 43
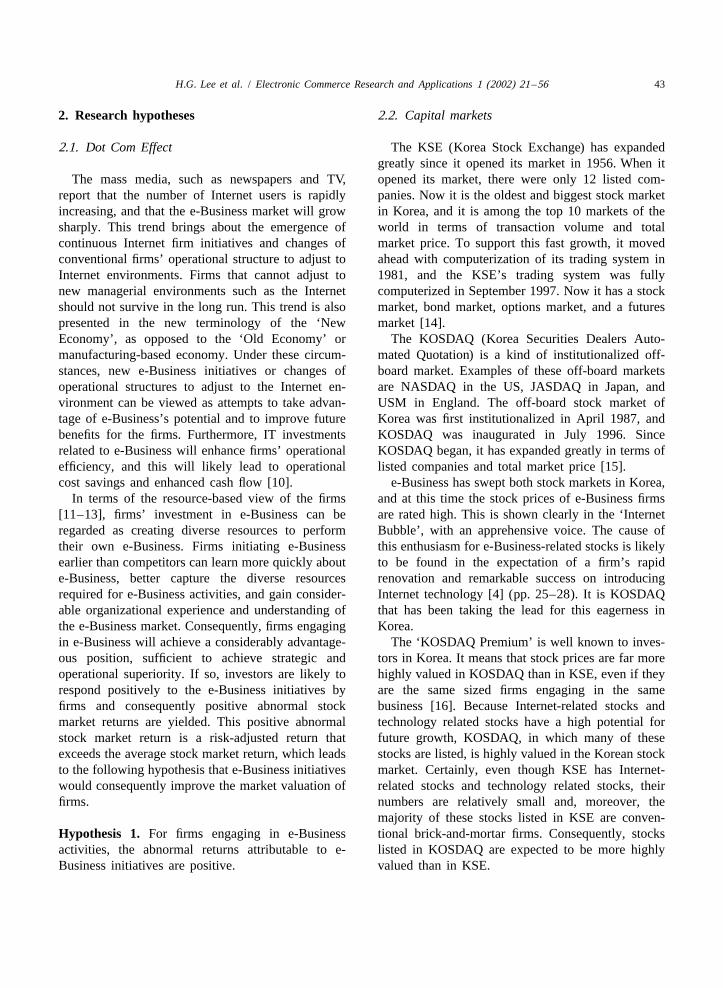
2 . Research hypotheses 2 .2. Capital markets
2 .1. Dot Com Effect The KSE (Korea Stock Exchange) has expandedgreatly since it opened its market in 1956. When it
The mass media, such as newspapers and TV, opened its market, there were only 12 listed com-report that the number of Internet users is rapidly panies. Now it is the oldest and biggest stock marketincreasing, and that the e-Business market will grow in Korea, and it is among the top 10 markets of thesharply. This trend brings about the emergence of world in terms of transaction volume and totalcontinuous Internet firm initiatives and changes of market price. To support this fast growth, it movedconventional firms’ operational structure to adjust to ahead with computerization of its trading system inInternet environments. Firms that cannot adjust to 1981, and the KSE’s trading system was fullynew managerial environments such as the Internet computerized in September 1997. Now it has a stockshould not survive in the long run. This trend is also market, bond market, options market, and a futurespresented in the new terminology of the ‘New market [14].Economy’, as opposed to the ‘Old Economy’ or The KOSDAQ (Korea Securities Dealers Auto-manufacturing-based economy. Under these circum- mated Quotation) is a kind of institutionalized off-stances, new e-Business initiatives or changes of board market. Examples of these off-board marketsoperational structures to adjust to the Internet en- are NASDAQ in the US, JASDAQ in Japan, andvironment can be viewed as attempts to take advan- USM in England. The off-board stock market oftage of e-Business’s potential and to improve future Korea was first institutionalized in April 1987, andbenefits for the firms. Furthermore, IT investments KOSDAQ was inaugurated in July 1996. Sincerelated to e-Business will enhance firms’ operational KOSDAQ began, it has expanded greatly in terms ofefficiency, and this will likely lead to operational listed companies and total market price [15].cost savings and enhanced cash flow [10]. e-Business has swept both stock markets in Korea,
In terms of the resource-based view of the firms and at this time the stock prices of e-Business firms[11–13], firms’ investment in e-Business can be are rated high. This is shown clearly in the ‘Internetregarded as creating diverse resources to perform Bubble’, with an apprehensive voice. The cause oftheir own e-Business. Firms initiating e-Business this enthusiasm for e-Business-related stocks is likelyearlier than competitors can learn more quickly about to be found in the expectation of a firm’s rapide-Business, better capture the diverse resources renovation and remarkable success on introducingrequired for e-Business activities, and gain consider- Internet technology [4] (pp. 25–28). It is KOSDAQable organizational experience and understanding of that has been taking the lead for this eagerness inthe e-Business market. Consequently, firms engaging Korea.in e-Business will achieve a considerably advantage- The ‘KOSDAQ Premium’ is well known to inves-ous position, sufficient to achieve strategic and tors in Korea. It means that stock prices are far moreoperational superiority. If so, investors are likely to highly valued in KOSDAQ than in KSE, even if theyrespond positively to the e-Business initiatives by are the same sized firms engaging in the samefirms and consequently positive abnormal stock business [16]. Because Internet-related stocks andmarket returns are yielded. This positive abnormal technology related stocks have a high potential forstock market return is a risk-adjusted return that future growth, KOSDAQ, in which many of theseexceeds the average stock market return, which leads stocks are listed, is highly valued in the Korean stockto the following hypothesis that e-Business initiatives market. Certainly, even though KSE has Internet-would consequently improve the market valuation of related stocks and technology related stocks, theirfirms. numbers are relatively small and, moreover, the
majority of these stocks listed in KSE are conven-Hypothesis 1. For firms engaging in e-Business tional brick-and-mortar firms. Consequently, stocksactivities, the abnormal returns attributable to e- listed in KOSDAQ are expected to be more highlyBusiness initiatives are positive. valued than in KSE.
44 H.G. Lee et al. / Electronic Commerce Research and Applications 1 (2002) 41–56
In the case of the United States, Internet firms ness investments, it is suggested that potentialperformed better than conventional brick-and-mortar growth and benefits of e-Business firms related to thefirms in terms of stock price returns in the period Intermediary or Commerce layer are relatively higherfrom June 1998 to June 1999. In this period, the than those related to the other layers. Also, e-Busi-index of Internet firm stocks increased to returns of ness is likely to substitute for the conventionalabout 400% annually. The returns of the S&P500 or business domain in these layers. Among Americanthe Dow-Jones Industrial Average based on conven- companies, Amazon.com may be a good example.tional firms increased 18.90%, on average [4] (pp. Amazon.com has encroached on the business of307–308). Similarly, in Korea, due to the ‘KOSDAQ Barnes & Noble, a gigantic bookseller in AmericanPremium’, the stock prices in KOSDAQ, where a book retailing. As a result, Barnes & Noble enteredlarge number of state-of-the-art Internet firms are into e-Business.centralized, are more highly valued. If so, investors However, reports indicate that a considerableare likely to respond more positively to e-Business number of e-Business firms, including Amazon.com,initiatives by the firms listed in KOSDAQ than those will be on the verge of bankruptcy sooner or laterlisted in KSE. This suggests that the abnormal due to fund starvation [18]. This analysis suggestsreturns of firms listed in KOSDAQ are higher than that their fund holdings will finally be exhaustedthe abnormal returns of KSE-listed firms after new because a large number of e-Business firms do note-Business initiatives. This leads to the following have solid profit structures. Considering this analysis,hypothesis. those e-Business firms in the Infrastructure or Appli-
cation layers equipped with a solid business baseHypothesis 2. The abnormal returns attributable to should be more profitable than e-Business firms ine-Business initiatives of KOSDAQ-listed firms are the Intermediary or Commerce layers.higher than the abnormal returns attributable to e- Some analysts predict that the firms which willBusiness initiatives of KSE-listed firms. eventually earn profits attributable to the growth of
e-Business are not those in the Intermediary or2 .3. e-Business firm layers Commerce layers, but are those in the Infrastructure
or Application layers. Metaphorically speaking, atThe e-Business firm categorization used in this the time of the ‘Gold Rush’ in the United States, it
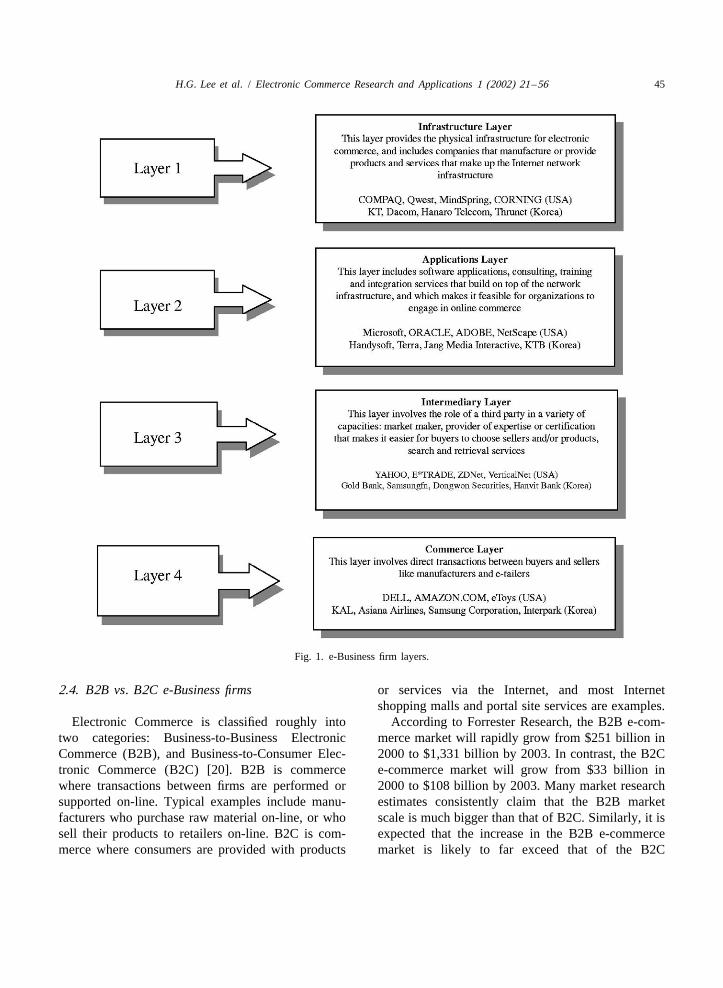
paper is based on the previous research of the was mining equipment providers who actually earnedUniversity of Texas and Cisco systems [17]. Accord- money, not gold mine operators or miners who wenting to this report, there is a natural structure or to seek for gold in the West. The bright prospect ofhierarchy to the Internet economy that can be e-Business growth has driven many firms to enterdirectly traced to how businesses generate revenues. e-Business. However, it may be the firms providingBased upon this type of structure, the Internet e-Business firms with equipment, networks, andeconomy is broadly classified into infrastructure and applications that ultimately earn money [19]. Basedeconomic activity categories. The infrastructure cate- on the above argument, it is difficult to estimategory is further divided into two distinct but com- accurately which firms among the four layers will beplementary layers: the Infrastructure layer, and the affected more by e-Business initiatives. Therefore,Applications layer. The economic activity category is we first hypothesize that the effects of e-Businessalso subdivided into two layers: the Intermediary initiatives are different according to the layers, andlayer and the Commerce layer. Fig. 1 shows these reveal the differences among layers through datalayers with example companies in the USA and analysis results.Korea.
Taking into account the rapidly increasing numberof Internet users, the expected future rapid growth of Hypothesis 3. The abnormal returns attributable tothe e-commerce market, and the enhancement of e-Business initiatives are different depending on thefirms’ operational efficiency attributable to e-Busi- layer to which the e-Business firm belongs.
H.G. Lee et al. / Electronic Commerce Research and Applications 1 (2002) 21–56 45
Fig. 1. e-Business firm layers.
2 .4. B2B vs. B2C e-Business firms or services via the Internet, and most Internetshopping malls and portal site services are examples.
Electronic Commerce is classified roughly into According to Forrester Research, the B2B e-com-two categories: Business-to-Business Electronic merce market will rapidly grow from $251 billion inCommerce (B2B), and Business-to-Consumer Elec- 2000 to $1,331 billion by 2003. In contrast, the B2Ctronic Commerce (B2C) [20]. B2B is commerce e-commerce market will grow from $33 billion inwhere transactions between firms are performed or 2000 to $108 billion by 2003. Many market researchsupported on-line. Typical examples include manu- estimates consistently claim that the B2B marketfacturers who purchase raw material on-line, or who scale is much bigger than that of B2C. Similarly, it issell their products to retailers on-line. B2C is com- expected that the increase in the B2B e-commercemerce where consumers are provided with products market is likely to far exceed that of the B2C
46 H.G. Lee et al. / Electronic Commerce Research and Applications 1 (2002) 41–56
e-commerce market in Korea. According to Ander- disclosed to the public with public announcements,son Consulting, the B2B e-commerce market in which can help investors’ judge investment decisionsKorea is estimated to grow from $300 million in rationally, can help securities circulate smoothly, and2000 to $7,100 million by 2005. The B2C e-com- can help the practice of fair trading to be establishedmerce market in Korea is estimated to grow from [23]. Public announcements on a legal basis can be$150 million in 2000 to $1,000 million by 2005 [3]. divided into two groups: legal, an enforced public
However, B2B e-Businesses inherently have risks. announcement, or autonomous, an optional publicIn order to activate e-commerce between firms, it is announcement. The former is an announcement byrequired to integrate the processes between the the commercial law, the securities exchange law, andparticipating firms. Establishing effective managerial KOSDAQ managerial regulations (public announce-processes between firms is also challenging [21]. ments in a narrow sense), and the latter is anThese tasks cannot be accomplished easily and thus announcement by the press (public announcementsB2B e-Business inherently involves complexity and in a broad sense) [24].high risk. In this paper, public announcements are limited to
B2B firms tend to be relatively large-sized. In autonomous optional public announcements made byother words, their sales volume and the number of firms through the press (Public announcement in aemployees are relatively large. In contrast, B2C firms broad sense). We are mainly interested in the publictend to be small-sized. According to CAPM (Capital announcements associated with new e-BusinessAsset Pricing Model), the expected returns of a stock initiatives or the expansion of an existing e-Business.are only evaluated by the systematic risk, regardless We classify them into three categories: (1) e-Busi-of the scale of the firm that issues the stocks. In ness initiatives related to the alliances between firms;reality, however, it has been observed that higher (2) e-Business initiatives related to the expansion ofabnormal returns are created in small-sized firms, conventional off-line firms by entering into e-Busi-which is termed the ‘firm size effect’ [22]. Consider- ness; and (3) e-Business initiatives related to theing this effect, it is suggested that the abnormal business expansion of existing e-Business firms.returns created by relatively small-sized B2C firms Table 1 shows the categories and the definitions ofare larger than those of larger B2B firms. each e-Business initiative used in this study.
Considering the inherent complexity and high risk Because these categories have different natures,of B2B e-Business, and the firm size effect in market valuations are likely to vary according to theactuality, it is estimated that the market valuation category of e-Business initiative. For instance, whenassociated with e-Business initiatives is higher in a brick-and-mortar firm enters into new on-lineB2C firms than in B2B firms. This leads to the markets, its impact might differ from when anfollowing hypothesis. Internet shopping mall expands its business within
on-line markets. Thus, we hypothesize that theHypothesis 4. The abnormal returns attributable to effects of e-Business initiatives are different depend-e-Business initiatives of B2C firms are higher than ing on the types of announcements.the abnormal returns attributable to e-Business initia-tives of B2B firms. Hypothesis 5. The abnormal returns attributable to
e-Business initiatives are different depending on the2 .5. e-Business initiative types types of e-Business initiatives.
Public announcements are intended to inform thestakeholders of any changed conditions about the 3 . Research designfirm. Legally, the public announcement system im-poses duties on companies, requiring them to an- 3 .1. Event study methodologynounce information essential to stakeholders’ judg-ment, such as financial statements or new business The event study methodology has begun to beinitiatives. Major information about the company is used as a powerful tool that can help IS researchers
H.G. Lee et al. / Electronic Commerce Research and Applications 1 (2002) 21–56 47
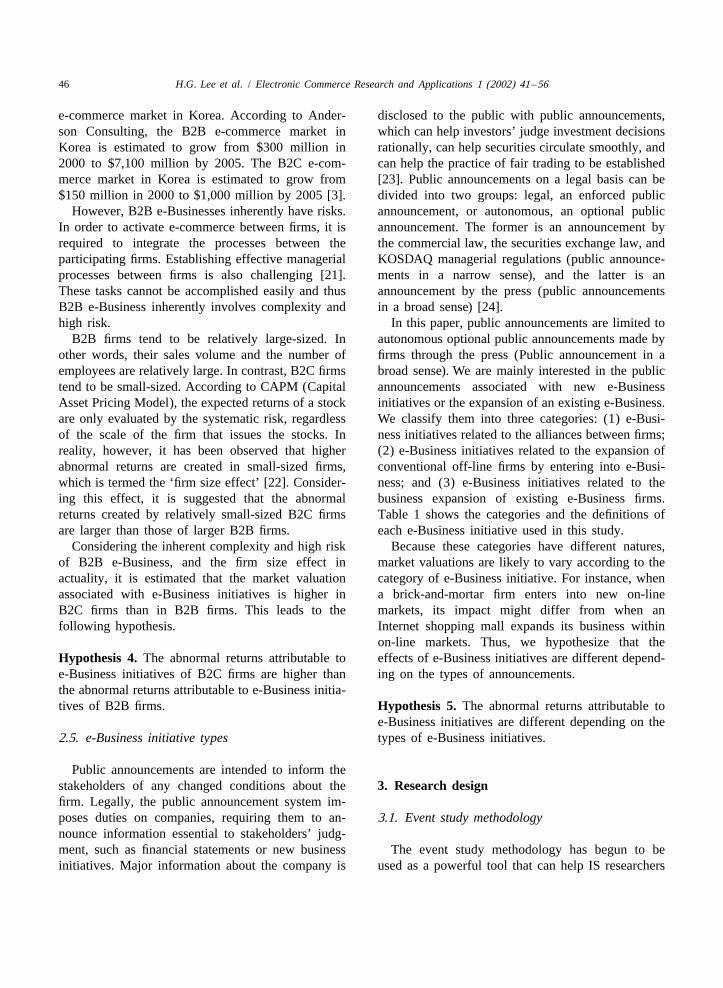
Table 1Classification of e-Business initiatives
Category Definition of e-Business initiative
Alliance-related 1.Alliance 1Business Expansioninitiatives Business expansion by alliance between companies
Example: LG International Corp. agrees to make strategicalliance with SK Global to develop B2B web-site ‘Chemround’2. Alliance 1 Investment 1Business ExpansionBusiness expansion by alliance and investment between companies,including the establishment of affiliated companiesExample: Hyundai Corporation establishes an e-Business firm togetherwith LG International and SK Global by participating in Chemround.com3. Alliance 1 Technology DevelopmentTechnology development by alliance between companiesExample: SK Telecom tries to develop new wireless multimediaservice together with AT&T
Business expansion 1.Change of Firm Namefrom non-Internet To change the company name into Dot Com, Net, Tech, etc.into e-Business Example: Kasan Electronics changes its name to Mplus Tech
2. Addition of Firm ObjectiveTo add e-Business-related objective to firm’s current objectives or tochange firm’s objective into e-Business-related objectiveExample: Kisan Telecom adds e-Business to its business objectives3. Expansion of Non-Internet Firm into e-BusinessTraditional company (non-Internet company) goes into e-BusinessExample: Pulmuone drives e-Business in retail industry
Business expansion 1.e-Business Domain Expansionof established To expand its own e-Business in the already entered domain, or to thee-Business firms lower layers (to expand its own e-Business in the same e-Business
firm layers, or when the firms in layer 3 or 4 expand their e-Businessinto layer 1 or 2 e-Business)Example: Terra expands its business into UMS-related equipmentmanufacturing and super-speed Internet business2. Layer 1/2 Firms’ e-Business Expansion into Layer 3/4Company in layer 1 or 2 goes into on-line e-Business of layer 3 or 4Example: Pantech expands its business into Internet and e-commerce services
Layer 1 (Infrastructure layer), layer 2 (Application layer), layer 3 (Intermediary layer), layer 4 (Commerce layer).
assess the business performance of IT investments company announcing the start of a new e-Businesssuch as e-Business initiatives. It obviates the need to can create future profit through this e-Businessanalyze accounting-based measures of IT invest- initiative, they would respond positively to thements’ benefits, which have been criticized because company’s new e-Business activities. This will bethey are often not adequate indicators of the true represented by ‘positive abnormal stock marketperformance of IT investments [9] (p. 626). return’ after the event day.
We take the event study methodology that esti- Selection of the length of an event period and anmates the AR (Abnormal Return) of firm activities as estimation period is based on previous event studies.a method for evaluating the market values of e- We select five days before and after the eventBusiness firms. AR represents the estimated future announcement (for a total of 11 days) as the eventreturn of firms forecasted by many investors related period to observe the effect of e-Business initiativesto e-Business initiatives in capital markets. This (t 5 [25,5]). For the estimation period, we used 45method has been successfully used in previous days before the event (t 5 [250,2 6]) to estimate thestudies [8,25,26]. If investors speculate that the expected return. Appendix A describes in detail how
48 H.G. Lee et al. / Electronic Commerce Research and Applications 1 (2002) 41–56
Table 2 ments by those selected firms was 388 in KSE andClassification of e-Business firms in Korea 394 in KOSDAQ for the predetermined six months.Layer Market Thus, a total of 782 e-Business initiatives were used
in analysis of the data.KSE KOSDAQ TotalIn order to test the research hypotheses, we
1 36 43 79classified these e-Business initiatives according to2 7 23 30the research variables. These research variables3 31 7 38
4 33 9 42 included KSE and KOSDAQ, e-Business firm layers,1, 2 2 1 3 B2B and B2C, and e-Business initiative types. Table1, 3 – 2 2 3 shows the distribution of e-Business initiatives1, 4 1 3 4
used for each hypothesis test. To maintain consis-2, 3 1 6 7tency throughout the analysis, we excluded some3, 4 5 1 6
1, 2, 4 2 – 2 sample data if they did not belong to relevant1, 3, 4 1 – 1 categories. Thus, three hypotheses (Hypotheses 3, 4,2, 3, 4 – 1 1 and 5) use some of the 782 data points.Total 119 96 215
4 . Analysis and discussionto calculate the abnormal return. This computation isconsistent with related studies in MIS, accounting 4 .1. Effect of e-Business initiativesand finance.
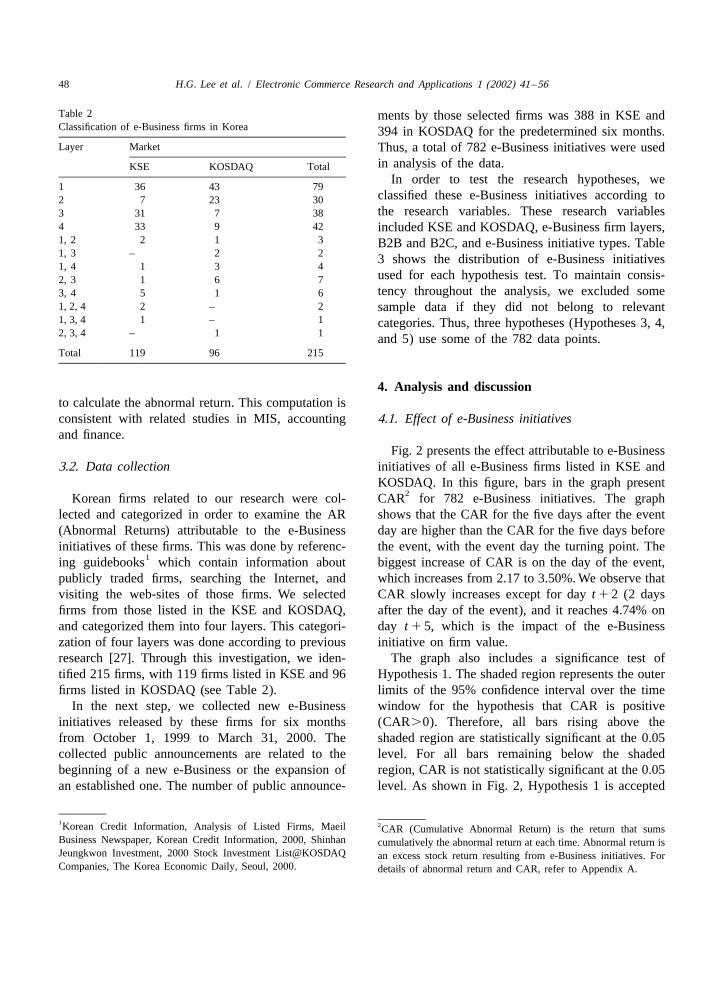
Fig. 2 presents the effect attributable to e-Business3 .2. Data collection initiatives of all e-Business firms listed in KSE and
KOSDAQ. In this figure, bars in the graph present2Korean firms related to our research were col- CAR for 782 e-Business initiatives. The graph
lected and categorized in order to examine the AR shows that the CAR for the five days after the event(Abnormal Returns) attributable to the e-Business day are higher than the CAR for the five days beforeinitiatives of these firms. This was done by referenc- the event, with the event day the turning point. The
1ing guidebooks which contain information about biggest increase of CAR is on the day of the event,publicly traded firms, searching the Internet, and which increases from 2.17 to 3.50%. We observe thatvisiting the web-sites of those firms. We selected CAR slowly increases except for dayt 1 2 (2 daysfirms from those listed in the KSE and KOSDAQ, after the day of the event), and it reaches 4.74% onand categorized them into four layers. This categori- dayt 1 5, which is the impact of the e-Businesszation of four layers was done according to previous initiative on firm value.research [27]. Through this investigation, we iden- The graph also includes a significance test oftified 215 firms, with 119 firms listed in KSE and 96 Hypothesis 1. The shaded region represents the outerfirms listed in KOSDAQ (see Table 2). limits of the 95% confidence interval over the time
In the next step, we collected new e-Business window for the hypothesis that CAR is positiveinitiatives released by these firms for six months (CAR.0). Therefore, all bars rising above thefrom October 1, 1999 to March 31, 2000. The shaded region are statistically significant at the 0.05collected public announcements are related to the level. For all bars remaining below the shadedbeginning of a new e-Business or the expansion of region, CAR is not statistically significant at the 0.05an established one. The number of public announce- level. As shown in Fig. 2, Hypothesis 1 is accepted
1 2Korean Credit Information, Analysis of Listed Firms, Maeil CAR (Cumulative Abnormal Return) is the return that sumsBusiness Newspaper, Korean Credit Information, 2000, Shinhan cumulatively the abnormal return at each time. Abnormal return isJeungkwon Investment, 2000 Stock Investment List@KOSDAQ an excess stock return resulting from e-Business initiatives. ForCompanies, The Korea Economic Daily, Seoul, 2000. details of abnormal return and CAR, refer to Appendix A.
H.G. Lee et al. / Electronic Commerce Research and Applications 1 (2002) 21–56 49
Table 3Number of e-Business initiatives
Distinction Market type
KSE KOSDAQ Total
Capital market KSE 388KOSDAQ 394
Total (Hypotheses 1 and 2) 388 394 782e-Business firm layers Layer 1 (Infrastructure) 165 172 337
Layer 2 (Application) 30 81 111Layer 3 (Intermediary) 48 19 67Layer 4 (Commerce) 65 25 90
Total (Hypothesis 3) 308 297 605B2B/B2C B2B 132 111 243
B2C 128 125 253Total (Hypothesis 4) 260 236 496e-Business initiative Alliance-related 105 98 203types Business expansion from
non-Internet into e-Business 38 61 99Business expansion ofestablished e-Business firms 49 48 97
Total (Hypothesis 5) 192 207 399
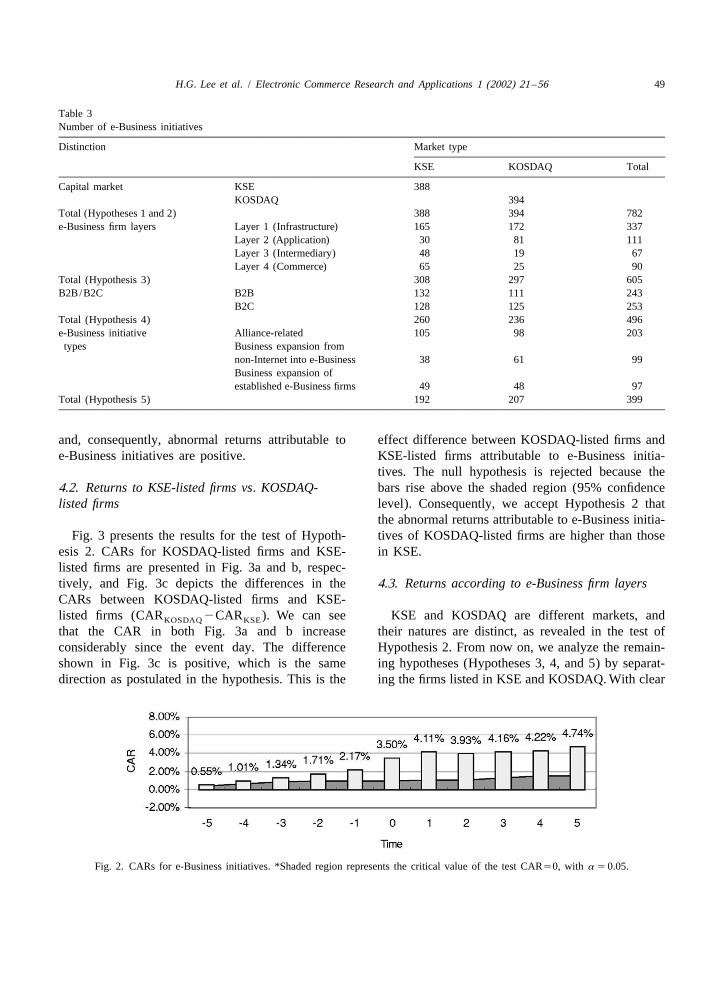
and, consequently, abnormal returns attributable to effect difference between KOSDAQ-listed firms ande-Business initiatives are positive. KSE-listed firms attributable to e-Business initia-
tives. The null hypothesis is rejected because the4 .2. Returns to KSE-listed firms vs. KOSDAQ- bars rise above the shaded region (95% confidencelisted firms level). Consequently, we accept Hypothesis 2 that
the abnormal returns attributable to e-Business initia-Fig. 3 presents the results for the test of Hypoth- tives of KOSDAQ-listed firms are higher than those
esis 2. CARs for KOSDAQ-listed firms and KSE- in KSE.listed firms are presented in Fig. 3a and b, respec-tively, and Fig. 3c depicts the differences in the 4 .3. Returns according to e-Business firm layersCARs between KOSDAQ-listed firms and KSE-listed firms (CAR 2CAR ). We can see KSE and KOSDAQ are different markets, andKOSDAQ KSE
that the CAR in both Fig. 3a and b increase their natures are distinct, as revealed in the test ofconsiderably since the event day. The difference Hypothesis 2. From now on, we analyze the remain-shown in Fig. 3c is positive, which is the same ing hypotheses (Hypotheses 3, 4, and 5) by separat-direction as postulated in the hypothesis. This is the ing the firms listed in KSE and KOSDAQ. With clear
Fig. 2. CARs for e-Business initiatives. *Shaded region represents the critical value of the test CAR50, with a 5 0.05.
50 H.G. Lee et al. / Electronic Commerce Research and Applications 1 (2002) 41–56
Fig. 3. CARs for KSE-listed firms vs. KOSDAQ-listed firms.
differences in KSE and KOSDAQ, hypothesis testing according to layers in KOSDAQ-listed firms. Conse-with combined data from both markets may lead to quently, Hypothesis 3, that the abnormal returns
3the wrong conclusions. We employ ANOVA to test attributable to e-Business initiatives are differentHypothesis 3 (detailed results are provided in Appen- according to the layers, is rejected for KOSDAQ.dix B). For KSE, theP value, which indicates the It is interesting to note that large software firmsdifference in CAR according to e-Business firm listed in KSE (Application layer firms) do not enjoylayers, is 0.037. Consequently, Hypothesis 3, that the ‘dot com effects,’ while firms in KOSDAQ exhibitabnormal returns attributable to e-Business initiatives significant impacts of e-Business initiatives on theirare different depending on the layers to which the firm value regardless of the layer. One possiblee-Business firm belongs, is accepted. To find the explanation for this difference is that investorsreason for this result, we performed post hoc consider the proliferation of e-Business as significant
4analysis to examine in which layers there is a opportunities for relatively small software firmsdifference. We found that CAR in layer 2 has a (mostly listed in KOSDAQ), but threats to largenegative (2) value, and is significantly different from software firms (mostly listed in KSE). For largethe CARs in other layers. Application layer firms, the focus on traditional
In KOSDAQ, the P value, which indicates the software may serve as a liability in the new digitaldifference in CAR according to e-Business firm economy, where small and fast moving softwarelayers, is 0.940, which is not significant at the 0.05 venture firms have advantages.level. No matter which layer firms in KOSDAQbelong to, their CARs of e-Business initiatives 4 .4. Returns to B2B firms vs. B2C firmsremain high. So, there is no difference in CAR
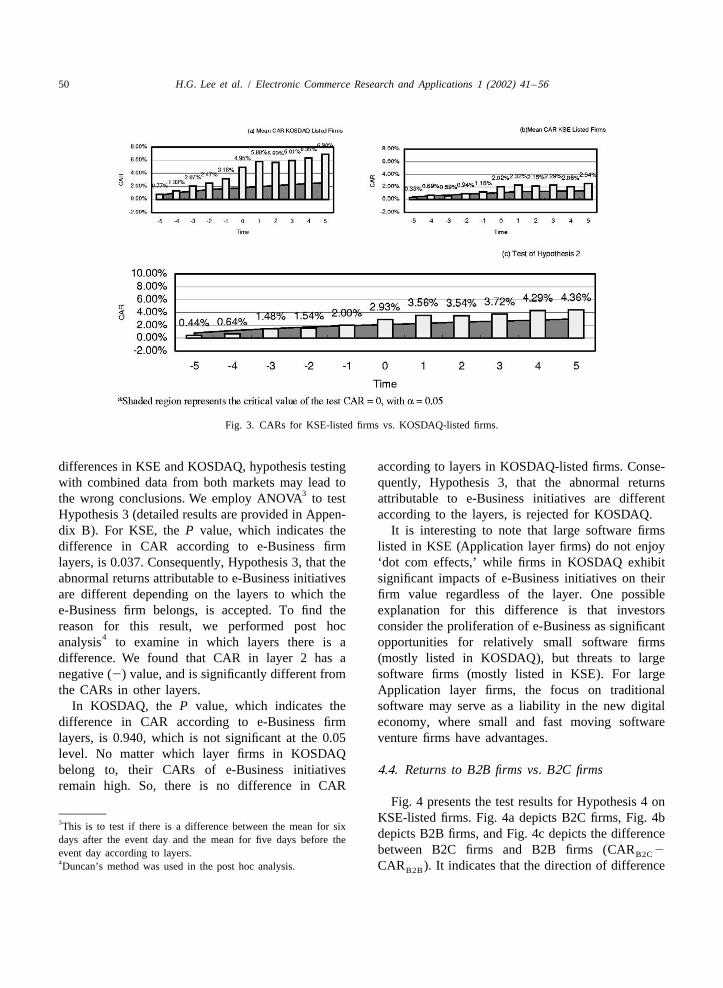
Fig. 4 presents the test results for Hypothesis 4 onKSE-listed firms. Fig. 4a depicts B2C firms, Fig. 4b3This is to test if there is a difference between the mean for sixdepicts B2B firms, and Fig. 4c depicts the differencedays after the event day and the mean for five days before thebetween B2C firms and B2B firms (CAR 2event day according to layers. B2C
4Duncan’s method was used in the post hoc analysis. CAR ). It indicates that the direction of differenceB2B
H.G. Lee et al. / Electronic Commerce Research and Applications 1 (2002) 21–56 51
Fig. 4. CARs for B2B firms and B2C firms in KSE.
is the same as hypothesized. In Fig. 4a, the CAR of than the abnormal returns attributable to e-Business2.96% on the day of the event continuously increases initiatives of B2B firms.to reach 4.80% at dayt 1 5. In Fig. 4b, the CAR Fig. 5 depicts the test results of Hypothesis 4 ongradually decreases at the turning point of dayt 1 1, KOSDAQ-listed firms. Fig. 5a depicts B2C firms,with the exception of 0.81% CAR on dayt 1 5. In Fig. 5b depicts B2B firms, and Fig. 5c depicts theFig. 4c, the CAR of B2C firms is higher than that of difference in CAR between B2C firms and B2BB2B firms for all the event window, and their CAR firms (CAR2CAR ). In Fig. 5a, the CAR ofB2C B2B
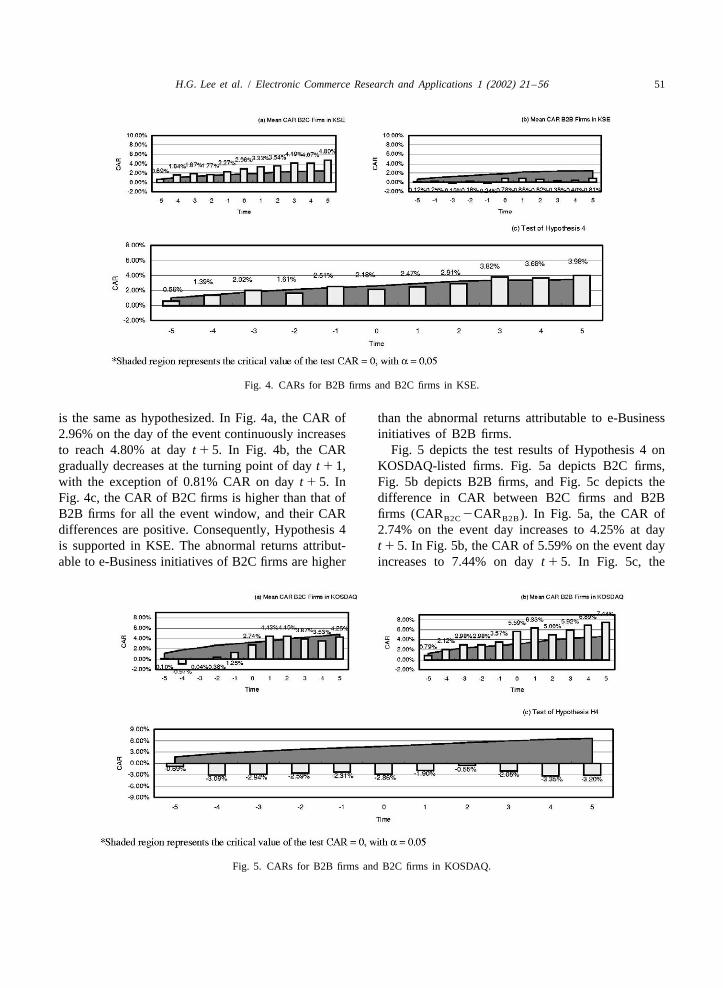
differences are positive. Consequently, Hypothesis 4 2.74% on the event day increases to 4.25% at dayis supported in KSE. The abnormal returns attribut- t 1 5. In Fig. 5b, the CAR of 5.59% on the event dayable to e-Business initiatives of B2C firms are higher increases to 7.44% on dayt 1 5. In Fig. 5c, the
Fig. 5. CARs for B2B firms and B2C firms in KOSDAQ.
52 H.G. Lee et al. / Electronic Commerce Research and Applications 1 (2002) 41–56
differences in CAR between B2C firms and B2B firms in KSE, and the analysis results are provided infirms listed in KOSDAQ (CAR 2CAR ) are Appendix B. According to the results, in KOSDAQ,B2C B2B
the opposite of those hypothesized (Hypothesis 4) theP value, which indicates the difference in CARand they are not significant across the event window according to the categories of public announcements,at the 0.05 level. Consequently, Hypothesis 4 is is 0.265, which is not statistically significant at therejected in KOSDAQ. The abnormal returns attribut- 0.05 level. Consequently, Hypothesis 5, that theable to e-Business initiatives of B2C firms are higher abnormal returns attributable to e-Businessthan the abnormal returns attributable to e-Business announcements are different according to theinitiatives of B2B firms. categories of public announcements, is rejected in
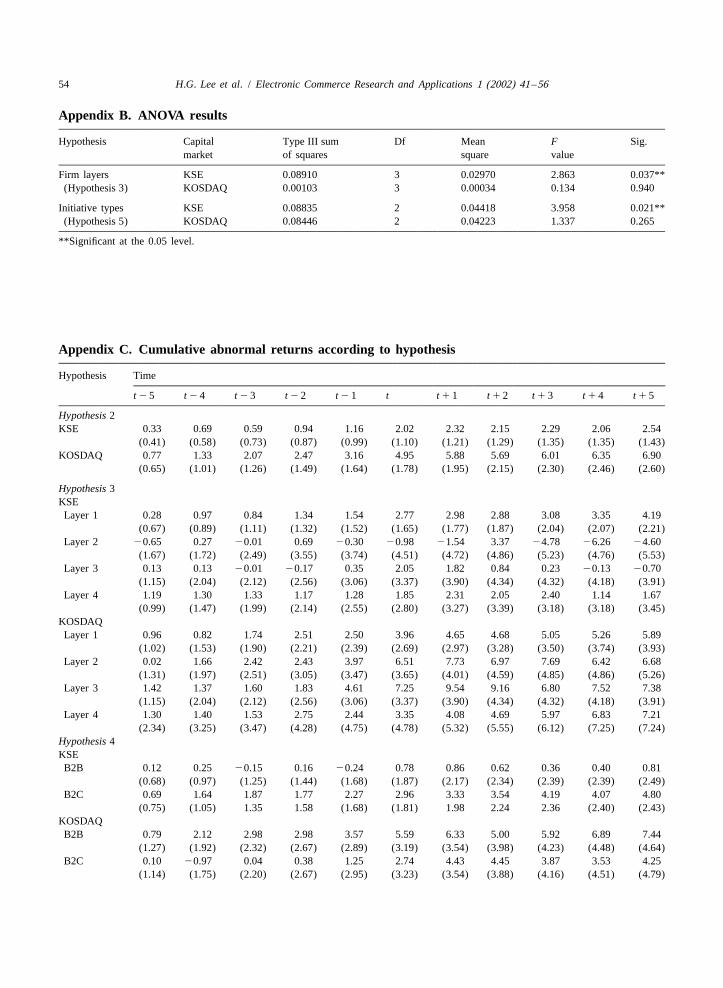
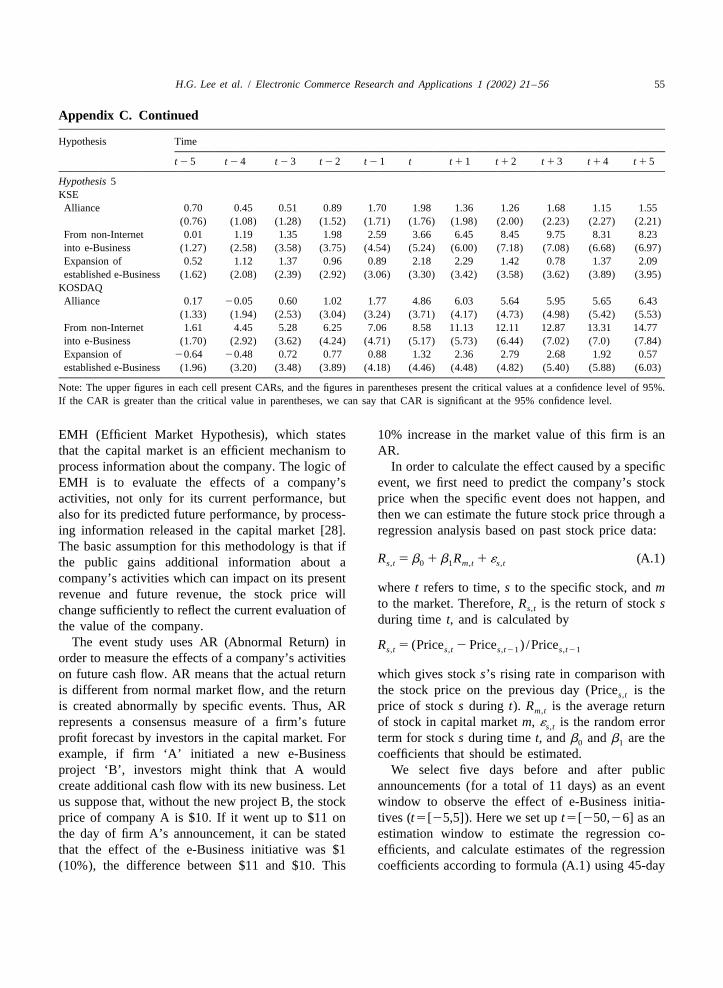
It should be noted that Hypothesis 4 is supported KOSDAQ.in KSE, but rejected in KOSDAQ. Although the These results are similar to those of Hypothesis 3.reason for this difference is not clear, we have a Whereas there are significant differences in CARplausible explanation. The period during which data according to e-Business firm layers and categories ofwas collected for this study was when the e-Business public announcements in KSE, there are no signifi-theme was transferring from B2C to B2B. Investors cant CAR differences in KOSDAQ.in KOSDAQ tend to be swift in absorbing new Appendix C provides the Cumulative Abnormaltrends in the Internet economy. Thus, B2B firms are Returns according to each hypothesis over the five-highly valuated in KOADAQ, which is sensitive to day time window.new trends in e-Business. In contrast, B2B firms areless valued in KSE, which is slow to respond to thenew e-Business movement. B2C firms have enjoyed
5 . Conclusionscale effects (B2C firms are smaller than B2B firms,thus gaining more stock returns than B2B firms) in
Overall, the results of this study suggest thatKSE and this results in supporting Hypothesis 4.e-Business initiatives contribute to the creation ofconsiderable future benefits for firms, which is4 .5. Returns according to the e-Business initiativereflected in an enhancement of the market values oftypesfirms. Similarly to the results of a previous study [8],
5 the results of this study suggest that firms competi-ANOVA was performed to test Hypothesis 5, andtively entering into e-Business may be consideredthe analysis results are provided in Appendix B. Inmore than a simple bandwagon effect or a manageri-KSE, theP value, which indicates the difference inal action mimicking other firms. e-BusinessCAR according to the types of e-Business initiatives,announcements enhance the market value of firmsis 0.021. This result is statistically significant at theand lead to the creation of value for the firms’0.05 level. Consequently, Hypothesis 5, that thestockholders.abnormal returns are different depending on the
Our main results are:types of e-Business initiatives, is accepted in KSE.6Again, post hoc analysis was performed to investi-
gate in which type there is a difference. It was 1. Capital markets respond positively to the e-revealed that business expansion from non-Internet Business initiatives of firms, which leads tointo e-Business is significantly different from the enhanced market value of the firms. The CARother categories. (Cumulative Abnormal Return) for e-Business
We tested Hypothesis 5 for the firms in KOSDAQ initiatives is 3.50% on the day of the event, andwith the same ANOVA analysis performed for the is 4.74% over the five-day time window around
the event date.2. This positive effect is observed more strongly in5This is to test if there is a difference between the mean for six
KOSDAQ-listed firms than in KSE-listed firms.days after the event day and the mean for five days before theThe difference in CAR (CAR 2event day according to layers. KOSDAQ
6Duncan’s method was used in the post hoc analysis. CAR ) of e-Business announcements isKSE
H.G. Lee et al. / Electronic Commerce Research and Applications 1 (2002) 21–56 53
2.93% on the day of the event and 4.36% over context. Second, e-Business initiatives are analyzedthe five-day time window. in two different capital markets (KSE and KOS-
3. Firms in KSE and KOSDAQ are classified into DAQ) to examine if similar e-Business initiativese-Business firm layers. For KSE, the abnormal result in different firm values in the two markets.returns attributable to e-Business initiatives are Third, the data collection periods are different.different according to the layer that firms belong Taking these differences into account, there areto. In contrast, for KOSDAQ, the abnormal some interesting comparisons between this researchreturns attributable to e-Business initiatives are result and those of the previous study. First, as thenot significantly different according to the layer US capital market, Korean capital markets reactfirms belong to. positively to firms’ announcements of e-Business
4. In the case of KSE, positive effects of e-Busi- initiatives, leading to a significant enhancement ofness initiatives are observed more strongly in the firm value. Second, B2C e-Business initiativesB2C firms than in B2B firms. The difference in have greater impacts on firm value than B2B e-CAR (CAR 2CAR ) is 2.18% on the day Business initiatives in the US capital market. How-B2C B2B
of the event and 3.98% in the five-day time ever, this phenomenon was observed only in KSE inwindow around the event date. For KOSDAQ, Korea. In KOSDAQ, B2B e-Business initiatives havethe positive effects of e-Business initiatives are greater impacts on firm value than B2C e-Businessnot significantly different between B2C firms initiatives. Third, ‘business expansion from non-In-and B2B firms. ternet into e-Business’ initiatives have greater im-
5. In the case of KSE, the abnormal returns pacts on the market value of the firm than ‘businessattributable to e-Business initiatives are ob- expansion of an established e-Business firm’ initia-served to be different according to the activity tives in Korea. This is opposite to the findings for thetype. For KOSDAQ, the abnormal returns at- USA. From these differences, we can postulate thattributable to e-Business initiatives are not sig- the capital market condition and investors’ responsesnificantly different according to the activity to e-Business actions differ in the USA and Korea.type. In particular, the CAR of public announce- In this paper, we have reported various e-Businessments related to business expansion from non- announcements that could affect the market values ofInternet into e-Business is 8.58% on the day of firms. Due to the fact that diverse e-Business initia-the event, and records the highest figure at tives were targeted, however, we could not obtain14.77% in the five-day time window around the sufficient data samples for some e-Business initiativeevent date. categories. For instance, the number of e-Business
initiatives by firms of layer 2 in KSE is only 30. ToThe effects of e-Business initiatives by firms have gain greater insight from this study, it would be
already been verified academically in the United necessary to accumulate research findings throughStates, and are also observed in KOSDAQ. However, continuous follow-up studies, with which it would bethis study highlights the different effects of e-Busi- possible to compare and analyze the Dot Com Effectness initiatives according to capital market, layer, according to time flow.and type of e-Business activity, in addition toexamining if there are actually effects of e-Businessannouncements. Furthermore, this study shows how A cknowledgementse-Business firms, in a variety of circumstances, cantake advantage of public announcements as a sound This work was supported by Korea Researchtool to manage their own stock prices according to Foundation Grant (KRF-2001-2-0770).their own conditions or opportunities.
This study is different from that of Subramani andWalden [8] in three distinct aspects. First, the types A ppendix A. Abnormal returnof e-Business firms investigated and the firms’ e-Business initiative types are defined in a broader The event study methodology is based on the
54 H.G. Lee et al. / Electronic Commerce Research and Applications 1 (2002) 41–56
Appendix B. ANOVA results
Hypothesis Capital Type III sum Df Mean F Sig.market of squares square value
Firm layers KSE 0.08910 3 0.02970 2.863 0.037**(Hypothesis 3) KOSDAQ 0.00103 3 0.00034 0.134 0.940
Initiative types KSE 0.08835 2 0.04418 3.958 0.021**(Hypothesis 5) KOSDAQ 0.08446 2 0.04223 1.337 0.265
**Significant at the 0.05 level.
Appendix C. Cumulative abnormal returns according to hypothesis
Hypothesis Time
t 25 t 2 4 t 2 3 t 2 2 t 2 1 t t 1 1 t 1 2 t 1 3 t 14 t 1 5
Hypothesis 2KSE 0.33 0.69 0.59 0.94 1.16 2.02 2.32 2.15 2.29 2.06 2.54
(0.41) (0.58) (0.73) (0.87) (0.99) (1.10) (1.21) (1.29) (1.35) (1.35) (1.43)KOSDAQ 0.77 1.33 2.07 2.47 3.16 4.95 5.88 5.69 6.01 6.35 6.90
(0.65) (1.01) (1.26) (1.49) (1.64) (1.78) (1.95) (2.15) (2.30) (2.46) (2.60)
Hypothesis 3KSELayer 1 0.28 0.97 0.84 1.34 1.54 2.77 2.98 2.88 3.08 3.35 4.19
(0.67) (0.89) (1.11) (1.32) (1.52) (1.65) (1.77) (1.87) (2.04) (2.07) (2.21)Layer 2 20.65 0.27 20.01 0.69 20.30 20.98 21.54 3.37 24.78 26.26 24.60
(1.67) (1.72) (2.49) (3.55) (3.74) (4.51) (4.72) (4.86) (5.23) (4.76) (5.53)Layer 3 0.13 0.13 20.01 20.17 0.35 2.05 1.82 0.84 0.23 20.13 20.70
(1.15) (2.04) (2.12) (2.56) (3.06) (3.37) (3.90) (4.34) (4.32) (4.18) (3.91)Layer 4 1.19 1.30 1.33 1.17 1.28 1.85 2.31 2.05 2.40 1.14 1.67
(0.99) (1.47) (1.99) (2.14) (2.55) (2.80) (3.27) (3.39) (3.18) (3.18) (3.45)KOSDAQLayer 1 0.96 0.82 1.74 2.51 2.50 3.96 4.65 4.68 5.05 5.26 5.89
(1.02) (1.53) (1.90) (2.21) (2.39) (2.69) (2.97) (3.28) (3.50) (3.74) (3.93)Layer 2 0.02 1.66 2.42 2.43 3.97 6.51 7.73 6.97 7.69 6.42 6.68
(1.31) (1.97) (2.51) (3.05) (3.47) (3.65) (4.01) (4.59) (4.85) (4.86) (5.26)Layer 3 1.42 1.37 1.60 1.83 4.61 7.25 9.54 9.16 6.80 7.52 7.38
(1.15) (2.04) (2.12) (2.56) (3.06) (3.37) (3.90) (4.34) (4.32) (4.18) (3.91)Layer 4 1.30 1.40 1.53 2.75 2.44 3.35 4.08 4.69 5.97 6.83 7.21
(2.34) (3.25) (3.47) (4.28) (4.75) (4.78) (5.32) (5.55) (6.12) (7.25) (7.24)Hypothesis 4KSEB2B 0.12 0.25 20.15 0.16 20.24 0.78 0.86 0.62 0.36 0.40 0.81
(0.68) (0.97) (1.25) (1.44) (1.68) (1.87) (2.17) (2.34) (2.39) (2.39) (2.49)B2C 0.69 1.64 1.87 1.77 2.27 2.96 3.33 3.54 4.19 4.07 4.80
(0.75) (1.05) 1.35 1.58 (1.68) (1.81) 1.98 2.24 2.36 (2.40) (2.43)KOSDAQB2B 0.79 2.12 2.98 2.98 3.57 5.59 6.33 5.00 5.92 6.89 7.44
(1.27) (1.92) (2.32) (2.67) (2.89) (3.19) (3.54) (3.98) (4.23) (4.48) (4.64)B2C 0.10 20.97 0.04 0.38 1.25 2.74 4.43 4.45 3.87 3.53 4.25
(1.14) (1.75) (2.20) (2.67) (2.95) (3.23) (3.54) (3.88) (4.16) (4.51) (4.79)
H.G. Lee et al. / Electronic Commerce Research and Applications 1 (2002) 21–56 55
Appendix C. Continued
Hypothesis Time
t 2 5 t 2 4 t 2 3 t 22 t 2 1 t t 1 1 t 1 2 t 13 t 1 4 t 1 5
Hypothesis 5KSEAlliance 0.70 0.45 0.51 0.89 1.70 1.98 1.36 1.26 1.68 1.15 1.55
(0.76) (1.08) (1.28) (1.52) (1.71) (1.76) (1.98) (2.00) (2.23) (2.27) (2.21)From non-Internet 0.01 1.19 1.35 1.98 2.59 3.66 6.45 8.45 9.75 8.31 8.23into e-Business (1.27) (2.58) (3.58) (3.75) (4.54) (5.24) (6.00) (7.18) (7.08) (6.68) (6.97)Expansion of 0.52 1.12 1.37 0.96 0.89 2.18 2.29 1.42 0.78 1.37 2.09established e-Business (1.62) (2.08) (2.39) (2.92) (3.06) (3.30) (3.42) (3.58) (3.62) (3.89) (3.95)
KOSDAQAlliance 0.17 20.05 0.60 1.02 1.77 4.86 6.03 5.64 5.95 5.65 6.43
(1.33) (1.94) (2.53) (3.04) (3.24) (3.71) (4.17) (4.73) (4.98) (5.42) (5.53)From non-Internet 1.61 4.45 5.28 6.25 7.06 8.58 11.13 12.11 12.87 13.31 14.77into e-Business (1.70) (2.92) (3.62) (4.24) (4.71) (5.17) (5.73) (6.44) (7.02) (7.0) (7.84)Expansion of 20.64 20.48 0.72 0.77 0.88 1.32 2.36 2.79 2.68 1.92 0.57established e-Business (1.96) (3.20) (3.48) (3.89) (4.18) (4.46) (4.48) (4.82) (5.40) (5.88) (6.03)
Note: The upper figures in each cell present CARs, and the figures in parentheses present the critical values at a confidence level of 95%.If the CAR is greater than the critical value in parentheses, we can say that CAR is significant at the 95% confidence level.
EMH (Efficient Market Hypothesis), which states 10% increase in the market value of this firm is anthat the capital market is an efficient mechanism to AR.process information about the company. The logic of In order to calculate the effect caused by a specificEMH is to evaluate the effects of a company’s event, we first need to predict the company’s stockactivities, not only for its current performance, but price when the specific event does not happen, andalso for its predicted future performance, by process- then we can estimate the future stock price through aing information released in the capital market [28]. regression analysis based on past stock price data:The basic assumption for this methodology is that if
R 5b 1b R 1´ (A.1)s,t 0 1 m,t s,tthe public gains additional information about acompany’s activities which can impact on its present
wheret refers to time,s to the specific stock, andmrevenue and future revenue, the stock price willto the market. Therefore,R is the return of stockss,tchange sufficiently to reflect the current evaluation ofduring time t, and is calculated bythe value of the company.
The event study uses AR (Abnormal Return) in R 5 (Price 2Price ) /Prices,t s,t s,t21 s,t21order to measure the effects of a company’s activitieson future cash flow. AR means that the actual return which gives stocks’s rising rate in comparison withis different from normal market flow, and the return the stock price on the previous day (Price is thes,t
is created abnormally by specific events. Thus, AR price of stocks during t). R is the average returnm,t
represents a consensus measure of a firm’s future of stock in capital marketm, ´ is the random errors,t
profit forecast by investors in the capital market. For term for stocks during timet, andb andb are the0 1
example, if firm ‘A’ initiated a new e-Business coefficients that should be estimated.project ‘B’, investors might think that A would We select five days before and after publiccreate additional cash flow with its new business. Let announcements (for a total of 11 days) as an eventus suppose that, without the new project B, the stock window to observe the effect of e-Business initia-price of company A is $10. If it went up to $11 on tives (t5[25,5]). Here we set upt5[250,26] as anthe day of firm A’s announcement, it can be stated estimation window to estimate the regression co-that the effect of the e-Business initiative was $1 efficients, and calculate estimates of the regression(10%), the difference between $11 and $10. This coefficients according to formula (A.1) using 45-day
56 H.G. Lee et al. / Electronic Commerce Research and Applications 1 (2002) 41–56
announcements on the market value of firms, Informationdata. Abnormal Returns can be calculated from theSystems Research 12 (2) (2001) 135–154.difference between the expected return calculated
[9] A. McWilliams, D. Siegel, Event studies in managementaccording to the above procedure and the actualresearch: theoretical and empirical issues, Academy of
stock return as follows: Management Journal 40 (3) (1997) 626–657.[10] G. Hamel, J. Sampler, The e-corporation: more than just
AR 5R 2 (b 1b R ) (A.2) web-based, it’s building a new industrial order, Fortune 138s,t s,t 0 1 m,t
(11) (1998) 80–92.[11] B. Wernerfelt, A resource-based view of the firm, StrategicThat is, when a specific company’s actual return
Management Journal 5 (2) (1984) 171–180.exceeds the figure expected by normal market flow[12] M.A. Peteraf, The cornerstones of competitive advantage: a
on a specific day, this surplus is Abnormal Return. A resource-based view, Strategic Management Journal 14 (3)specific firm’s CAR (Cumulative Abnormal Return) (1993) 179–191.
[13] C.K. Prahalad, G. Hamel, The core competence of theis the return that sums abnormal returns cumulativelycorporation, Harvard Business Review May/June (1990)at each timet during the event window. This is79–91.represented by the formula
[14] http: / /www.kse.or.kr.[15] http: / /www.kosdaq.or.kr.t
[16] Maeil Business Newspaper, Differences between KOSPI andCAR 5O AR (A.3)s,t s,t KOSDAQ, Nov. 8, 1999.t50[17] http: / /www.internetindicators.com/oct 1999.pdf.
][18] S. Yoon, Silicon valley report: gray prospect for Amazon-For details of the event study methodology, refer
.com, Maeil Business Newspaper, Oct. 30, 2000.to Ref. [9]. By calculating CAR, we can assess the[19] H. Lee, Say it again, Steve, The Korea Economic Daily,
impact of new e-Business initiatives on firm value. Sept. 30, 1999.[20] http: / /www.ecommerce.gov/emerging.htm.[21] P. Hart, C. Saunders, Power and trust: critical factors in the
adoption and use of electronic data interchange, OrganizationR eferences Science 8 (1) (1997) 23–42.
[22] J. Park, J. Park, J. Cho (Eds.), Modern Financial Manage-ment, Dasan, Seoul, 2001, pp. 379–380.[1] http: / /www.nua.ie /surveys.
[23] http: / /kse.or.kr /upload/ rule / rule014.zip.[2] http: / /stat.nic.or.kr /sdata.html.[24] http: / /kse.or.kr /upload/ rule / rule15.zip.[3] Enable, Softbank Media, Seoul, Dec. 1999.[25] V. Lane, R. Jacobson, Stock market reactions to brand[4] A. Perkins, M. Perkins, The Internet Bubble, Gimm-Young,
extension announcements: the effects of brand attitude andSeoul, 2000.familiarity, Journal of Marketing 59 (1) (1995) 63–77.[5] T. Hoffman, Study: 85% of IT departments fail to meet
[26] C.A. Mackinlay, Event studies in economics and finance,business needs, Computerworld 33 (41) (1999).Journal of Economic Literature 35 (1997) 13–39.[6] http: / /cnn.com/TECH/computing/9905/31/pockets.idg/
[27] http: / /www.internetindicators.com/archives.html.index.html.[28] E. Fama, L. Fisher, M.C. Jensen, The adjustment of stock[7] Anonymous, Cost to build e-commerce site tops $1 million,
prices to new information, International Economic ReviewGlobal Finance, New York, 13(7/8) (1999).10 (1) (1969) 1–21.[8] M. Subramani, E. Walden, The impact of e-commerce