Impact of Corporate Brands in Consumer Electronics and …€¦ · Impact of Corporate Brands in...
281
Impact of Corporate Brands in Consumer Electronics and Home Appliances Sector on its Extensions to Diversified Markets with special reference to L.G. Electronics India Thesis submitted to the Padmashree Dr. D.Y.Patil University, Department of Business Management in partial fulfillment of the requirements for the award of the Degree of DOCTOR OF PHILOSOPHY In BUSINESS MANAGEMENT Submitted by Mr. Mangesh Prasad Kasbekar (Enrollment No. DYP-PhD-086100007) Research Guide Prof. Dr. G.S. Monga PADMASHREE DR. D.Y.PATIL UNIVERSITY, DEPARTMENT OF BUSINESS MANAGEMENT, Sector 4, Plot No. 10, CBD Belapur, Navi Mumbai- 400614 August 2011
Transcript of Impact of Corporate Brands in Consumer Electronics and …€¦ · Impact of Corporate Brands in...
Impact of Corporate Brands in Consumer Electronics and Home Appliances Sector on its Extensions to Diversified Markets
with special reference to L.G. Electronics India
Thesis submitted to the Padmashree Dr. D.Y.Patil University, Department of Business Management
in partial fulfillment of the requirements for the award of the Degree of
DOCTOR OF PHILOSOPHY
In
BUSINESS MANAGEMENT
Submitted by
Mr. Mangesh Prasad Kasbekar
(Enrollment No. DYP-PhD-086100007)
Research Guide
Prof. Dr. G.S. Monga
PADMASHREE DR. D.Y.PATIL UNIVERSITY,
DEPARTMENT OF BUSINESS MANAGEMENT,
Sector 4, Plot No. 10,
CBD Belapur, Navi Mumbai- 400614
August 2011

Impact of Corporate Brands in Consumer Electronics and Home Appliances Sector on its Extensions to Diversified Markets with special reference to L.G. Electronics India

DECLARATION
I hereby declare that the thesis entitled, “Impact of Corporate Brands in
Consumer Electronics and Home Appliances Sector on its Extensions to
Diversified Markets with special reference to L.G. Electronics India”
submitted for the Award of Doctor of Philosophy in Business Management at the
Padmashree Dr. D.Y.Patil University Department of Business Management is my
original work and the thesis has not formed the basis for award of any degree,
associate ship, fellowship or any other similar titles
Place: Navi Mumbai
Date:
Signature of the Guide Signature of the Signature of the Student Head of the dept.

CERTIFICATE
This is to certify that the thesis entitled “Impact of Corporate Brands in
Consumer Electronics and Home Appliances Sector on its Extensions to
Diversified Markets with special reference to L.G. Electronics India” and
submitted by Mr. Mangesh Prasad Kasbekar is a bonafide research work for
the award of the Doctor of Philosophy in Business Management at the
Padmashree Dr. D. Y. Patil University Department of Business Management in
partial fulfillment of the requirements for the award of the Degree of Doctor of
Philosophy in Business Management and that the thesis has not formed the
basis for the award previously of any degree, diploma, associate ship, fellowship
or any other similar title of any University or Institution. Also certified that the
thesis represents an independent work on the part of the candidate.
Place: Navi Mumbai
Date:
Signature of the Signature of the GuideHead of the department

ACKNOWLEDGEMENT
I am indebted to the Padmashree Dr. D.Y. Patil University, Department of
Business Management, which has accepted me for the Doctorate program and
provided me with an excellent opportunity to carry out the present research
project.
I would like to express my sincere thanks to my guide Dr. G S Monga for his
assistance, encouragement and for spending necessary hours during this
research study. It was his constant inspiration that kept me together all the time
and work continuously towards achieving a high quality of work.
This thesis wouldn’t have been completed without the support, guidance, and
blessings of Dr. R. Gopal. He has helped me during my tough times even at odd
hours. Dr. Monga and Dr. Gopal, both have shaped me first as a better
researcher, and inducted me into the process of writing a good quality research.
I would specially like to mention Mr. Amol Koparkar from LG India for his
immense contribution. I thank all my faculty colleagues especially to Mrs.
Madhumita Patil, CEO, Chetana Institute of Management for their constant
support and motivation. I would like to take the privilege to thank Dr. Pradeep
Manjrekar for his valuable inputs. Finally I would like to thank my family for their
immense support and love without which this thesis wouldn’t have been
completed.
Place: Navi Mumbai
Date: Signature of the student

This thesis is dedicated to my family
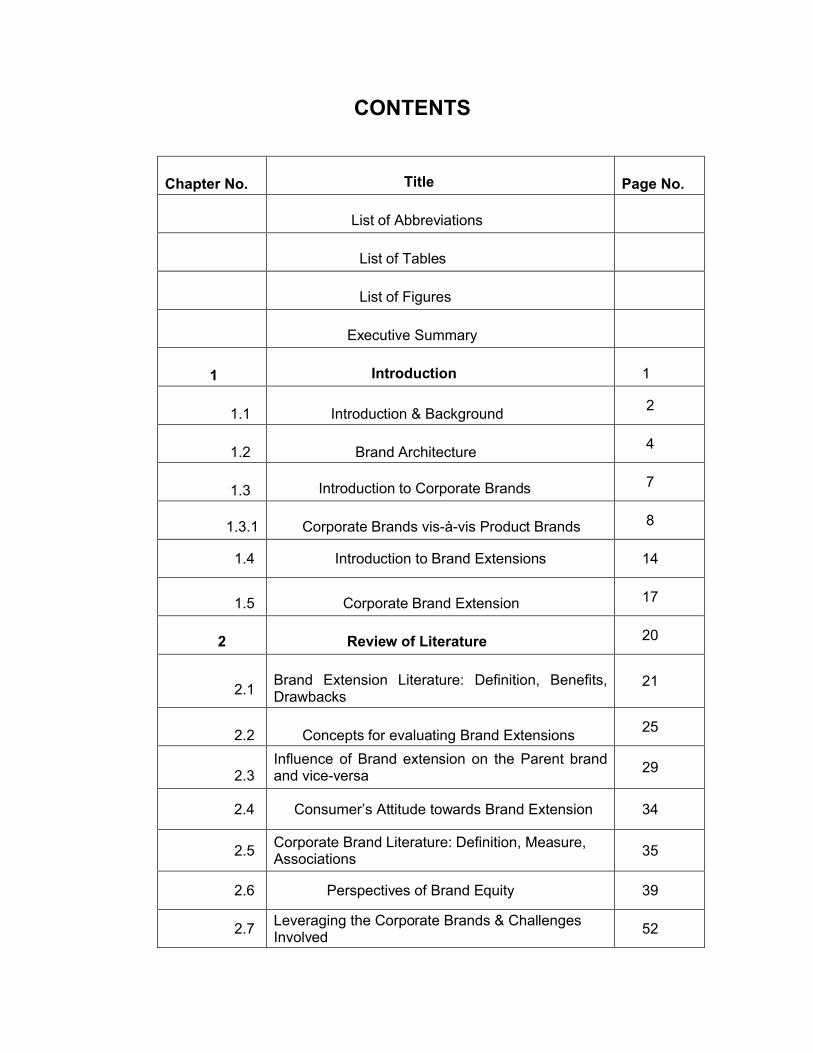
CONTENTS
Chapter No.
Title Page No.
List of Abbreviations
List of Tables
List of Figures
Executive Summary
1 Introduction 1
1.1 Introduction & Background 2
1.2 Brand Architecture 4
1.3 Introduction to Corporate Brands 7
1.3.1 Corporate Brands vis-à-vis Product Brands 8
1.4 Introduction to Brand Extensions 14
1.5
Corporate Brand Extension 17
2 Review of Literature
20
2.1Brand Extension Literature: Definition, Benefits, Drawbacks
21
2.2 Concepts for evaluating Brand Extensions
25
2.3Influence of Brand extension on the Parent brandand vice-versa
29
2.4 Consumer’s Attitude towards Brand Extension 34
2.5Corporate Brand Literature: Definition, Measure,Associations
35
2.6 Perspectives of Brand Equity 39
2.7Leveraging the Corporate Brands & ChallengesInvolved
52
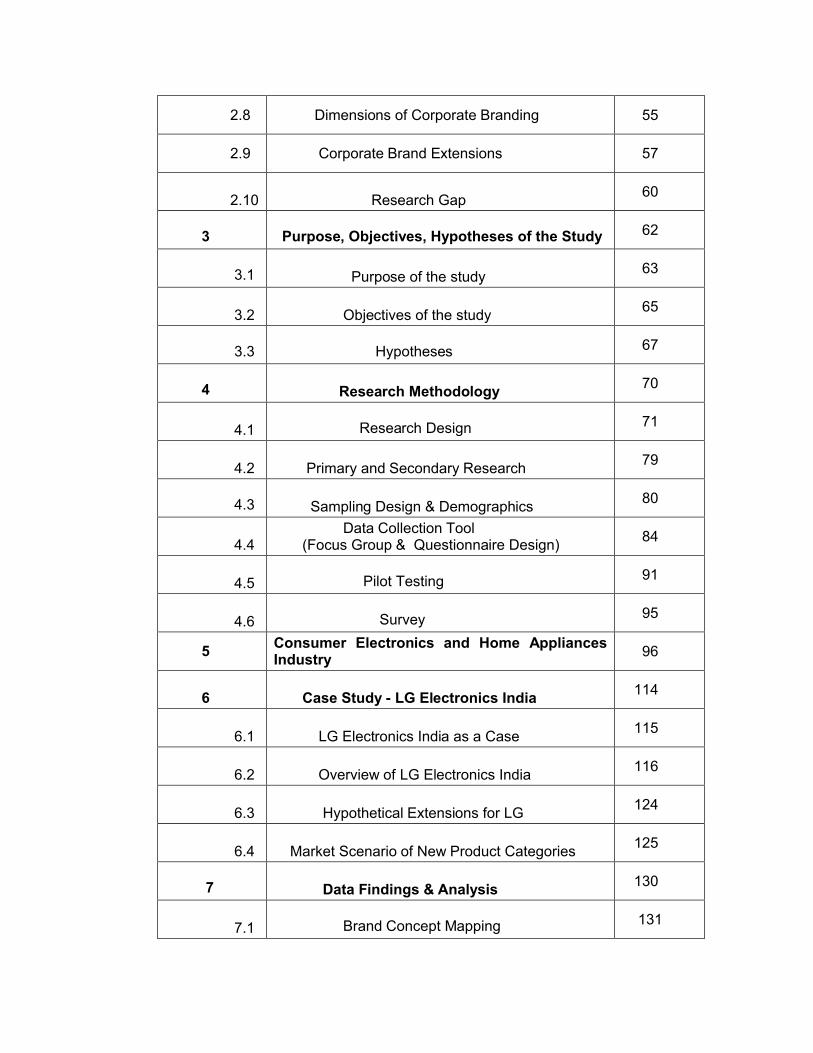
2.8 Dimensions of Corporate Branding 55
2.9 Corporate Brand Extensions 57
2.10 Research Gap 60
3
Purpose, Objectives, Hypotheses of the Study 62
3.1 Purpose of the study 63
3.2 Objectives of the study 65
3.3
Hypotheses 67
4 Research Methodology
70
4.1 Research Design 71
4.2 Primary and Secondary Research 79
4.3 Sampling Design & Demographics 80
4.4 Data Collection Tool (Focus Group & Questionnaire Design)
84
4.5 Pilot Testing 91
4.6
Survey 95
5Consumer Electronics and Home AppliancesIndustry
96
6 Case Study - LG Electronics India 114
6.1 LG Electronics India as a Case 115
6.2 Overview of LG Electronics India 116
6.3 Hypothetical Extensions for LG 124
6.4 Market Scenario of New Product Categories
125
7
Data Findings & Analysis
130
7.1 Brand Concept Mapping 131
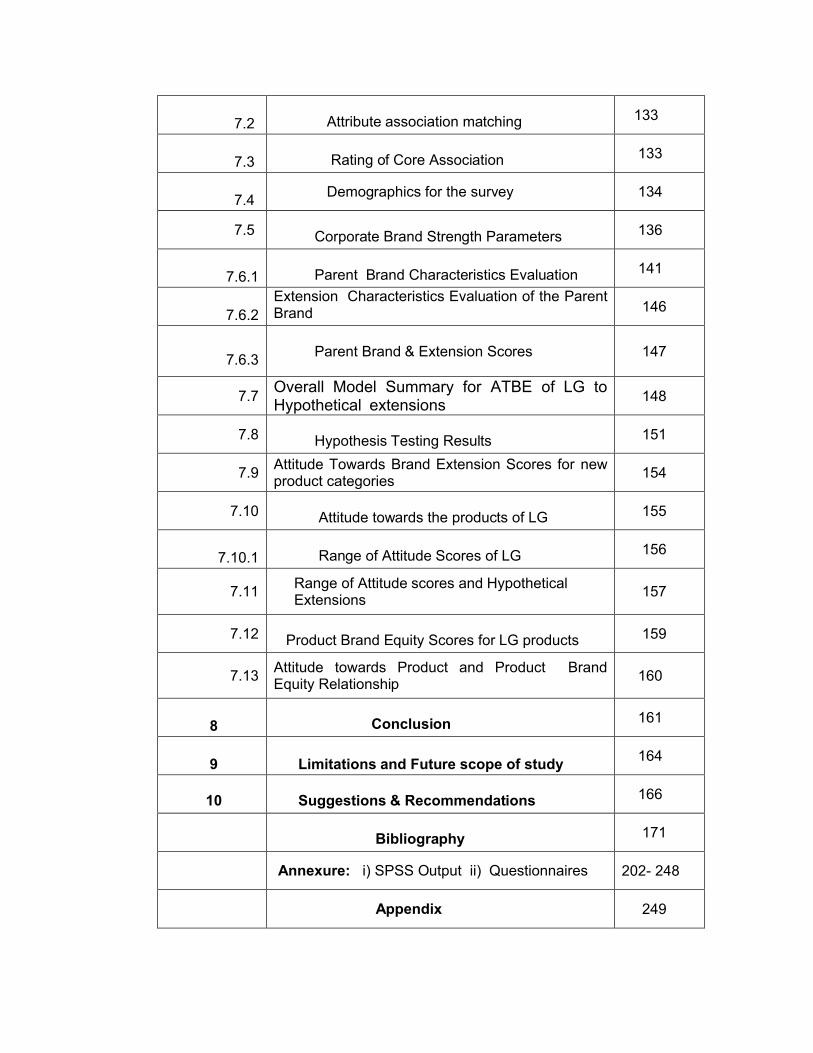
7.2 Attribute association matching 133
7.3 Rating of Core Association 133
7.4
Demographics for the survey 134
7.5 Corporate Brand Strength Parameters 136
7.6.1 Parent Brand Characteristics Evaluation 141
7.6.2
Extension Characteristics Evaluation of the Parent Brand 146
7.6.3
Parent Brand & Extension Scores 147
7.7Overall Model Summary for ATBE of LG to Hypothetical extensions
148
7.8 Hypothesis Testing Results 151
7.9Attitude Towards Brand Extension Scores for new product categories
154
7.10 Attitude towards the products of LG 155
7.10.1 Range of Attitude Scores of LG 156
7.11 Range of Attitude scores and Hypothetical Extensions
157
7.12 Product Brand Equity Scores for LG products 159
7.13Attitude towards Product and Product Brand Equity Relationship
160
8 Conclusion 161
9 Limitations and Future scope of study 164
10
Suggestions & Recommendations 166
Bibliography 171
Annexure: i) SPSS Output ii) Questionnaires 202- 248
Appendix 249
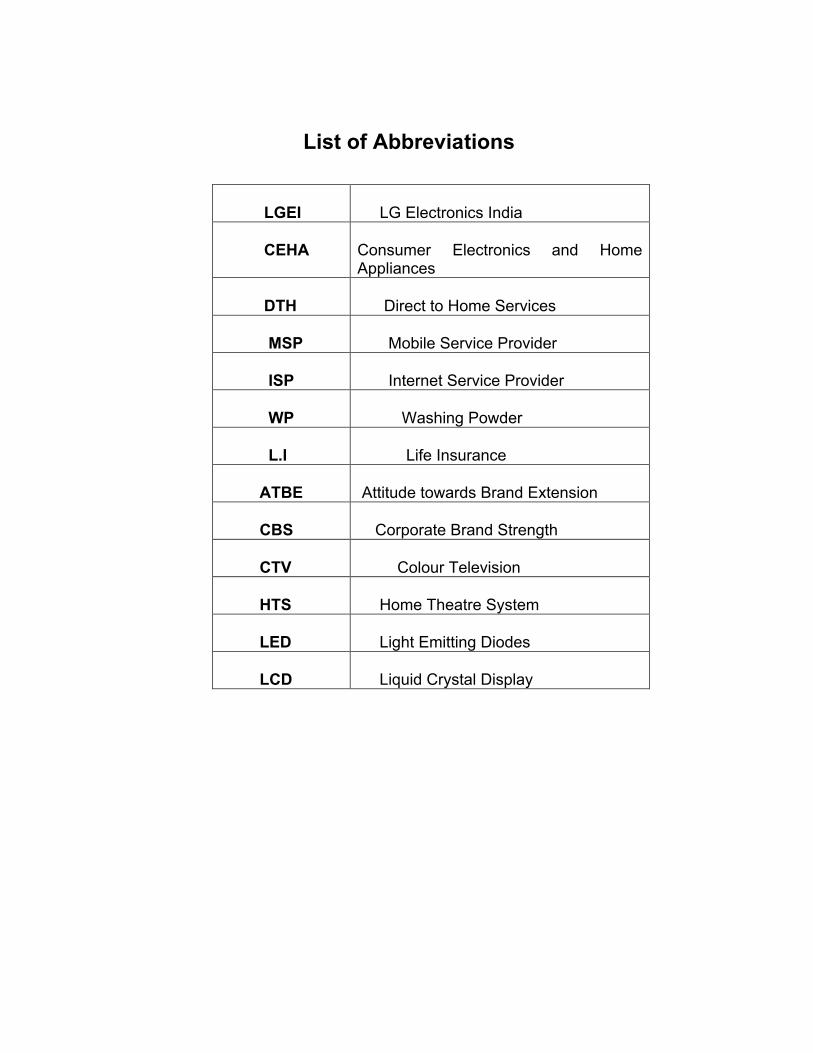
List of Abbreviations
LGEI LG Electronics India
CEHA Consumer Electronics and Home Appliances
DTH Direct to Home Services
MSP Mobile Service Provider
ISP Internet Service Provider
WP Washing Powder
L.I Life Insurance
ATBE Attitude towards Brand Extension
CBS Corporate Brand Strength
CTV Colour Television
HTS Home Theatre System
LED Light Emitting Diodes
LCD Liquid Crystal Display

List of Tables
Table No.
Content Page No.
1 Demographics of Respondents 82
2 Corporate Brand Positioning Mean Scores 138
3 Corporate Brand Identity Mean Scores 139
4 Corporate Brand Perceived Quality Mean Scores
140
5 Parent Brand Knowledge Mean Scores 142
6 Parent Brand Quality Mean Scores 143
7 Parent Brand Innovativeness Mean Scores 144
8 Corporate Ethics & Responsibility Mean Scores 145
9 Environmental Concern Mean Score 146
10 Parent Brand Parameters Mean Scores 147
11 Brand Extension Parameters Mean Scores 147
12 Model Summary for ATBE to Hypothetical extensions 148
13 F Table for ATBE to Hypothetical Extensions Model 149
14 Coefficients Table for ATBE to Hypothetical Extensions
149
15 Hypothetical Extension Mean Scores 154
16 Attitude Scores of LG products 155
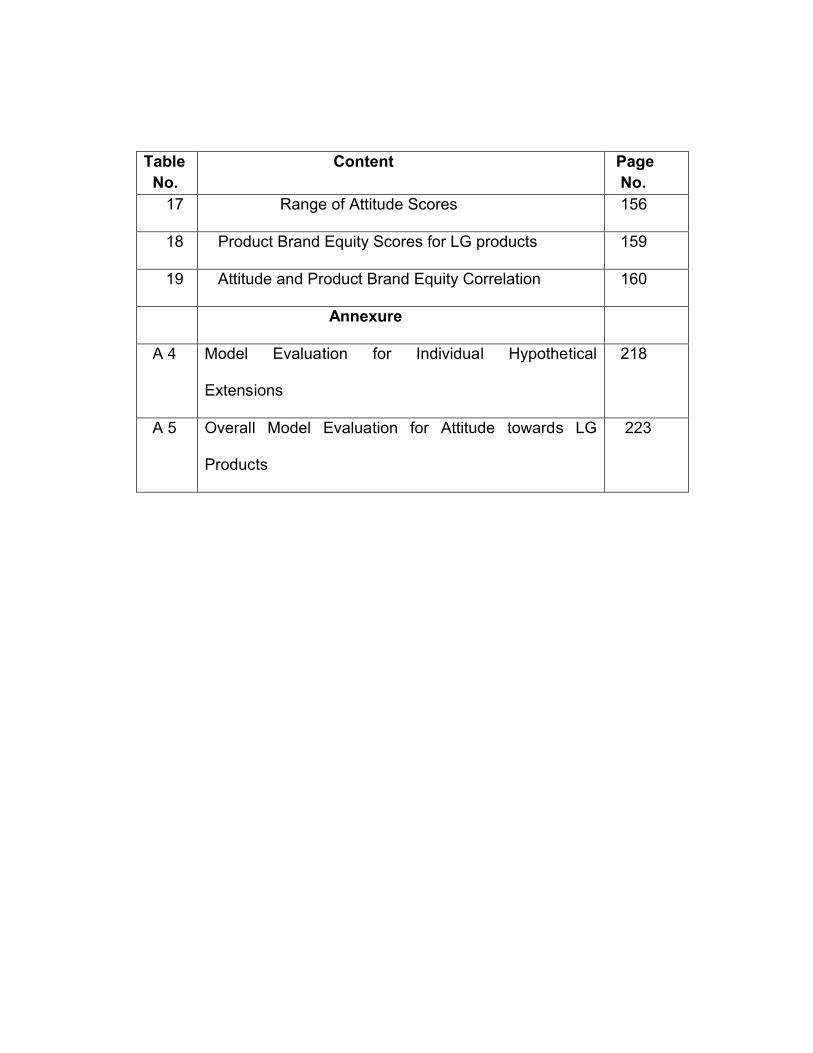
Table No.
Content Page No.
17 Range of Attitude Scores 156
18 Product Brand Equity Scores for LG products 159
19 Attitude and Product Brand Equity Correlation 160
Annexure
A 4 Model Evaluation for Individual Hypothetical
Extensions
218
A 5 Overall Model Evaluation for Attitude towards LG
Products
223

List of Figures
Figure No.
Content Page No.
1 Brand Equity Evaluation System 44
2 Indian Consumer Durable Industry Segment 98
3 Share of Wallet - Indian Consumer Trends 107
4 LG India Financial Performance 118
5 LG India Market Share 119
6 LG Brand Concept Map 131
7 Gender-Location Demographics 134
8 Occupation-Location Demographics 135

Executive Summary
Successful organizations all over the world recognize the importance of new
product launches as a means of organic growth and as a means to differentiate
themselves from others. At the same time, in an increasingly competitive
environment, it is not an easy task to create winning products. Considering the
high failure rate of new products, launching a new product is a risky proposition.
Brand marketers seek ways to achieve growth while reducing both the cost of
new product introductions as well as the risk of new product failure. A popular
way of launching new products has therefore been to leverage the equity of an
existing brand into a new sector, market, or product category popularly called as
Brand extension.
According to Aaker when brands are managed separately and independently,
overall resources allocation among brands may be less than optimal (1996).
Therefore, having the corporate brand, or in other words cohesive brand
portfolio, instead of number of individual product brands, is more rational from the
company’s point of view.
Companies are increasingly taking their corporate brand into new and unrelated
business areas in order to capitalize on their brand equity.
Since it’s a matter of establishing an association with the corporate brand, also
observed as a parent brand in branded house strategy or Master brand
architecture, the core association of the corporate brand plays a pivotal role in
deciding the extension with respect to the associations consumers have
regarding the corporate brand. In case of unrelated categories diversifications
usually known as conglomerate diversification, the extent of the core association
of the corporate brand seems to be more difficult.
Thus the purpose of this research lays in identifying the extent of the Corporate
Brand stretch i.e.; to what extent a Corporate Brand can stretch itself.
Simultaneously the extent to which a new product category would leverage on
the core associations of the Corporate Brand. Finally analyzing the extent of it’s
stretch to new product categories on its brand equity.
The objectives of the research are:
1. To study the extent to which a Corporate Brand can stretch itself
2. To study the core association of the Corporate Brand
3. To identify the new product categories and study how far can they leverage
on the core association.
4. To establish a relationship between Attitude towards Brand Extension and
various parameters which affect the same.
5. To measure the Attitude towards Brand Extension score for new product
categories (hypothetical extensions).
6. To measure the attitude towards the Corporate Brand’s products and
formulate a range across various sectors of the Corporate Brand, eventually
establishing cut offs for the respective sectors.

7. To analyze the Attitude towards Brand Extension score for new product
categories (hypothetical extensions) and the Attitudinal ranges established
for the Corporate Brand.
8. To examine the relationship between the attitudes towards the Corporate
Brand’s products scores with product brand equity scores of various
products of the Corporate Brand and thus establish a relationship with their
respective ranges.
9. To establish a relationship among Attitude towards brand extension scores
of the new product categories, attitudinal and product brand equity ranges of
the Corporate Brand and the Corporate Brand Strength (which is an integral
part of the Corporate Brand Equity).
Methodology Adopted
Considering the purpose of the research, an Exploratory as well as an
Experimental approach is taken into consideration. The entire research design is
divided into two parts; Part One which majorly adopts a Qualitative Methodology
and Part Two which purely adopts a Quantitative Methodology.
In Part One of the research design, a Brand Concept Map (BCM) is established
for the Corporate Brand (CB) under study, for which the extension possibilities in
the form of hypothetical extensions are taken into consideration to analyze how
far this corporate brand can stretch itself. This BCM would bring out the core
associations of this CB. The hypothetical extensions or the new product
categories which are to be associated with the CB, to test how far the CB can
associate itself with them, a Qualitative methodology is adopted with the help of
Focus Groups as a Data collection tool and the respondents are advised to write
down all the attributes they would be looking forward while purchasing such
products. These attributes are listed down and are ranked for individual
hypothetical extension or the new product category. With the help of a set of core
associations of the CB, an attribute association matching is done. The
respondents are also instructed to rate the core association of the CB on a scale
of 1 to 10 across the hypothetical extensions. A ranking of these hypothetical
extensions or new product categories is thus established from this exercise.
In Part Two of the research design, a Quantitative methodology is adopted for
evaluating i) Parent Brand characteristics & evaluation of the Parent brand
extensions to new product categories (This research considers the Parent Brand
to be the Corporate Brand.) ii) Attitude towards the CB’s products evaluation as
well as iii) Evaluation of product brand equity scores for the CB’s products. An
effort is also done in analyzing the Corporate Brand Strength, which forms an
integral part of Corporate Brand Equity
As a part of the Research design, a Case study approach has been adopted. LG
Electronics India as a case is taken into consideration, since they are the market
leaders in most of the Consumer electronics and Home appliances products.
Hence, it would be interesting to figure out how far LG can stretch itself.

In this research, hypothetical extensions are chosen for LG considering their
extensions within the arena of Consumer durables particularly consumer
electronics and outside the arena of Consumer durables (conglomerate
diversification). Five hypothetical extensions have been taken into consideration
for LG such as Direct to Home services (DTH), Mobile Service Provider (MSP),
Internet Service Provider (ISP), Washing Powder (W.P), Life Insurance (L.I.).
For evaluating the Attitude towards the Brand extension, the original model of
Attitude towards brand extension of Aaker and Keller has been modified in the
current context. First, the variable Knowledge has been added as an
independent variable. Second, independent variables such as Substitute and
Complement have been omitted and are replaced by a new variable Brand
Concept Consistency. Third, three new independent variables have been be
added to the new model i.e.; Innovativeness of the parent brand, Corporate
Ethics & Responsibility, and Environmental concern. Hence in the current model
of Attitude towards brand extension the independent variables taken into
consideration are Parent Brand Knowledge, Innovativeness, Parent Brand
Quality, Environmental concern, Transfer, Brand Concept Consistency, Difficulty
to produce, and Corporate Ethics and Responsibility.
The Attitude towards brand extension (ATBE) score has been calculated for each
hypothetical extension as well as the Attitude towards the current products of LG
is evaluated with the help of all the current products of LG evaluated on the same
parameters along with Product brand equity scores for all the current products of
LG.
From the above attitude scores of all the LG products, 3 different ranges of
attitudinal (Attitude) scores are established, viz; a. Total Range of Attitude scores
of LG, b. Range of Consumer Electronics Attitude Scores, c. Range of Home
Appliances Attitude Scores. The ATBE scores of the hypothetical extensions has
been compared with these ranges for their respective sectors i.e. the sectors to
which the hypothetical extensions belong for example Consumer Electronics or
Home Appliances sector or beyond. If the ATBE scores has been within the
range and above the cutoff of the respective ranges, the hypothetical extension
has been accepted or else the extension is rejected.
A relationship has been established between the Attitude scores of all the
products of LG and their respective Product brand Equity scores. Thus leading to
relationship between their respective ranges (Attitudinal Range and Product
Brand Equity Range).
A relationship has been finally established among Attitude towards brand
extension scores of the new product categories, attitudinal and product brand
equity ranges of the Corporate Brand and the Corporate Brand Strength (which is
an integral part of the Corporate Brand Equity).
For the evaluation of all the above mention scores a survey has been conducted
at major metropolitan cities viz; Mumbai, Delhi, Kolkata, Bangalore with a sample
size of 200 respondents each. An even distribution of 200 respondents is chosen
from each prime metro. Convenience sampling has been used as the sampling
technique for the survey. The demographic variable studied are Income, Gender

and Occupation. Questionnaire is used as a data collection tool. The entire
Questionnaire design is divided into four parts. The four parts are viz;
Questionnaire for i) Evaluation of Corporate Brand Strength ii) Parent (Corporate)
Brand Evaluation & evaluation of the parent brand extensions to hypothetical
product extensions, iii) Attitude towards all the LG products evaluation as well as
iv) Evaluation of product brand equity scores for all the LG products.
Findings of the Study
1. Amongst the Parent Brand Characteristics of the CB, Parent Brand
Knowledge has the highest rating most likely due to strong corporate
communication like the logo and the tagline as well as constant brand
promotions, followed by the parent brand quality and Innovation.
2. As far as the Parent brand extension characteristics is concerned, it is
observed that for hypothetical extensions such as Direct To Home Services
(DTH) and Mobile Service Provider (MSP) has relatively higher scores on
their Brand concept consistency and Transfer variable, most probably
because they are strongly associated to the electronics arena and are closely
related to the existing LG products such as LG CTVs and mobile phones
respectively, whereas products which are beyond electronics sphere has
shown a higher score for Difficulty to produce.
3. The Attitude Towards Brand Extension Scores is highest for the DTH service
hypothetical extension followed by LG as a Mobile service provider. The
hypothetical extensions such as washing powder and life insurance has the
least attitude towards brand extension score.

4. There has been a confirmation of ranking of the new product categories, both
quantitatively in part two by measuring the Attitude towards the Brand
Extension scores of the new product categories as well as qualitatively by
matching the set of attributes of the hypothetical extensions with the core
associations of LG qualitatively in part one.
5. In the Attitudinal scores of LG products LG LED has the highest score and Air
purifier has the lowest.
6. There exists a positive relationship between attitude towards CB’s products
scores as well as product brand equity scores which further implies that their
respective ranges also have a positive relationship. Which means that as the
range of the product attitude score is higher so is the product brand equity
range.
7. The ATBE of DTH is within the range and above the cutoff of the Range of
Consumer Electronics Attitude Score. Hence DTH as a hypothetical extension
is accepted.
8. The ATBE of MSP as a hypothetical extension of LG is within the range and
above the cutoff of the Range of Consumer Electronics Attitude Score. Hence
MSP as a hypothetical extension is accepted.
9. The ATBE of ISP as a hypothetical extension of LG is within the range and
above the cutoff of the Range of Consumer Electronics Attitude Score. Hence
ISP as a hypothetical extension is accepted.
10.The ATBE of W.P as a hypothetical extension of LG is out off the range and
below the cutoff of the Total range of Attitude Score of LG. Hence W.P as a
hypothetical extension is rejected.
11.The ATBE of L.I as a hypothetical extension of LG is out off the range and
below the cutoff of the Total range of Attitude Score of LG. Hence L.I as a
hypothetical extension is rejected.
Analysis
The ATBE score of the hypothetical extensions, W.P and L.I has been observed
falling well below the range of the attitude towards the products of CB, i.e.; falling
below the cut off score of the attitudinal range of the CB, which would eventually
lead to a higher product attitude range and thus a higher product brand equity
range. Higher product brand equity range in Master brand type of architecture,
which is a kind of umbrella branding, as seen in Corporate branding, would imply
a weaker umbrella brand equity, which eventually implies a weaker Corporate
brand strength, eventually weakening the Corporate Brand Equity. Thus leading
to a logical conclusion that LG should not diversify into these (L.I and W.P)
markets, in particular, other than CEHA market.
On the other hand the ATBE score of the hypothetical extensions, DTH, MSP
and ISP has been observed falling well above the range of the attitude towards
the products of CB, i.e.; falling above the cut off score of the attitudinal range of
the CB, which would eventually lead to a lower product attitude range and thus a
lower product brand equity range. Lower product brand equity range in Master

brand type of architecture, which is a kind of umbrella branding, as seen in
Corporate branding, would imply a stronger umbrella brand equity, which
eventually implies a stronger Corporate brand strength, eventually strengthening
the Corporate Brand Equity. Leading to a logical conclusion that LG should
diversify into these (DTH, MSP and ISP) markets, in particular, the product
categories which fall into the CEHA market.
Benefits
This research would thus benefit the organisations who adopt Corporate
branding strategies, with respect to how far can it stretch its corporate presence
without the corporate brand getting diluted or it’s brand equity getting affected.
This would in turn benefit the organisations in taking Corporate strategic
decisions with respect which product in an unknown category should they invest
and which ones should they not.
Scope & Limitation
As this study is primarily focused on the metros, one can figure out whether there
is a similar level of acceptance in the Tier II and Tier III cities as well as amongst
rural population since LG is spreading itself rapidly in the rural areas as a part of
its expansion strategy.
Suggestions
The research suggests a roadmap for any corporate brand to figure out its
eligibility in venturing into any kind of diversifications, which is as follows
1) Draw a “Brand Concept Map” for the Corporate Brand (CB)- Bring out the
“core associations” of CB. 2) Choose the “new product categories” (hypothetical
extensions). 3) Draw out a set of “attributes” for the “new product categories”
4) Correlate the set of attributes with the core associations of CB and rank the
new product categories. 5) Measure the “Attitude towards the Brand Extension
scores” of the new product categories and rank them. 6) Compare and reconfirm
the ranking with Step 4. (7) Calculate the Attitude scores of all the current
products of the CB and form the ranges and cut offs. 8) Check out the ATBE
score for the respective new product category (hypothetical extension), if it is
below the respective cut offs or beyond the range, reject the Hypothetical
extension or else accept it. 9) Calculate the Product Brand Equity scores of all
the current products of the CB. 10) With the help of Product brand equity scores
formulate a Product brand equity range for the CB. 11) Correlate the attitude
towards the products scores with the product brand equity scores. Find out the
relationship. 12) If there is a positive relationship between the attitude towards
the products scores and product brand equity scores of the CB, then it implies
that Narrower the Attitude towards products range (Range of Attitudinal scores)
=> Narrower the Product Brand Equity range => Stronger the Corporate Brand
Strength => Stronger the CBE. 13) If the ATBE score below the cut off or
beyond the range it may eventually affect the Corporate Brand Equity.
As per the findings and the subsequent analysis, we can recommend for
corporate brands like LG, which has a very strong presence in its electronics and
electronic related sphere that it should try and extend its corporate brand
essence in its own related field. This corporate brand has yet to build up a
greater sphere with respect to its sets of associations, for it to venture into
unrelated product categories.
Thus in general we can predict the success or failure of a corporate brand
extension, within or beyond its related sector, with the help of the above
mentioned roadmap.

1
CHAPTER 1
INTRODUCTION

2
Chapter 1
Introduction
1.1 Introduction & Background
Companies are able to realize in recent times, that leveraging on one of the most
important assets they own, the brand, may help them to achieve their long-term
growth objectives not only more quickly, but also in a more profitable way. These
companies are starting to view their products and services as more than just a
“thing” a customer buys. This makes sense, because brands are not only what a
company sells, they are what a company does and, more importantly, what a
company is.
Many companies, though, are not maximizing their financial returns because they
are not maximizing the power of their brands. For instance, if the company has
sales of $100 million, it means that the companies believe they can increase
revenues by $30 to $50 million with commensurate profits over the next five
years. This will happen if, and only if, companies decide to let the brand help to
drive their growth, and they take advantage of what is the most important
weapon they have at their disposal, i.e. their brand.
Balmer (2001a) views brand as an intangible but critical component of what a
company stands for. While a consumer generally does not have a relationship
with a product or a service, a consumer can have a relationship with a brand.
A brand represents a set of promises. It implies trust, consistency, and a defined
set of expectations. The strongest brands in the world own a positioning in the

3
consumer's mind that is unique to that brand and can universally be articulated
by almost everyone.
Nowadays, the company is witnessing a shift from product branding to corporate
branding (Aaker, 1996; de Chernatony, 1999; Hatch and Schultz, 2001, 2003;
Keller, 2003). Corporate branding goes far beyond the well-established tradition
of product branding: It does not explicitly deal with product features, but rather
transports a well defined set of corporate values (Aaker and Joachimsthaler,
2000; Hatch and Schultz, 2003; Schultz and de Chernatony, 2002). The general
aim of corporate branding is to build a sustainable bond between the branded
company and its customers through a clear value proposition (Schultz and de
Chernatony, 2002).
In an era when the emphasis is moving from line branding to corporate branding
(Balmer, 1995; Mitchell, 1997), there is a need to better appreciate the
management approach for corporate branding as this needs different
management from line branding. One of the key differences between line and
corporate branding is that the latter requires greater focus within the
organization. The size and composition of brand management teams are
changing, requiring greater co-ordination of activities. One of the implications of
this is that corporate marketing necessitates not only a planning perspective
which addresses the matching of external opportunities with core competencies,
but also considers the integration of internal activities to ensure cohesion and
therefore consistency in delivery.

4
The concept of the corporate brand has recently been raised to prominence in
both academic and practitioner fields, with a number of authors pointing to the
potential economic value inherent in managing and developing the brand at the
level of the organization (Fombrun and Van Riel, 1997; Greyser, 1999; Aaker and
Joachimsthaler,1999). Before proceeding into the meaning of Corporate Brands
and Corporate branding, it is imperative to study the architecture of brands,
cooperate branding being one of them.
1.2 Brand Architecture
Currently, there are many different branding architectures and strategies for a
company to pursue. Branding architecture illustrates the structure of the brand
portfolio that specifies brand roles and the relationships among and between
corporate, company and product brands (Aaker & Joachimsthaler, 2000b; Balmer
& Gray, 2003). In recent years, corporations have evolved from simple brand
architectures to complex brand architectures, due to the rising trend towards
industry consolidation through mergers and acquisitions (Muzellec & Lambkin,
2009; Aaker & Joachimsthaler, 2000b). Corporations’ complex branding
architectures make it extremely challenging for managers to manage them.
Therefore, companies should regularly rationalize brand portfolios in order to be
able to better serve customers and maximize profits (Kumar, 2003). After all, a
comprehensive analysis of a company’s brand portfolio can highlight which
brands are suited for possible brand extensions and leveraging brand equity.

5
Most companies do not regularly examine their brand portfolio. However,
managers should discover whether they are focusing on too many brands, and
discontinue less profitable brands (Kumar, 2003). It is important to clarify that
most large companies do not follow one concrete branding architecture, but use
a mixture of different branding strategies (Laforet & Saunders, 2005; Muzellec &
Lambkin, 2009). Aaker and Joachimsthaler (2000b) developed, ‘the brand
relationship spectrum’ which is an influential branding architecture tool that
illustrates four main branding strategies.
First of all, the two most extreme branding architectures will be explained, these
are ‘house of brands’ and ‘branded house’ and will explain ‘endorsed brands’ and
‘subbrands’ in more detail.
Corporate brands like P&G and Unilever are using a so-called house of brands
strategy. This implies that both firms have a wide range of powerful brands in
their brand portfolio. A house of brands strategy allows firms on the one hand to
position brands on functional benefits, and on the other hand to dominate niche
segments (Aaker & Joachimsthaler, 2000b).
The corporate and its product brands avoid being associated with each other and
do not show any clear linkages to the customers (Muzellec & Lambkin, 2009).
Throughout, the corporate brand can penetrate into new and different product
categories without the possibility of diluting its corporate equity (Muzellec &
Lambkin, 2009). If the new brand is unsuccessful this does not hurt the corporate
brand equity, because the corporate and product brand are clearly separated in
the minds of the customers.

6
By contrast, a branded house strategy is when both the corporation and its
products share the same name, which is known as the master brand (Muzellec &
Lambkin, 2009). Pursuing a branded house architecture can enhance clarity,
maximizes synergy and provides brand leverage (Aaker & Joachimsthaler,
2000b). An example of this is Virgin who uses its master brand name as an
umbrella in various different industries such as Virgin Atlantic and Virgin Money.
The advantage is that consumers may have developed favourable associations
towards the master brand and these favourable associations might be easily
transferred to its products. However, if the product is unsuccessful, sharing the
same name can hurt the master brand and have a devastating effect on brand
equity. Additionally, when the master brand weakens this can significantly affects
sales and profit margins (Aaker & Joachimsthaler, 2000b).
Endorsed brand is another branding architecture for a company to pursue. The
endorsed brand is independent, and usually endorsed by an organizational
brand. Corporate brand, Nestlé, uses an endorsed brand strategy on a variety of
its product brands (e.g. Kit Kat by Nestlé, Nesquik by Nestlé and Smarties by
Nestlé). Motivation for using an endorsement is that it provides credibility and
substance, and it also can provide beneficial associations for the endorser (Aaker
& Joachimsthaler, 2000a). However, there is also a downside to using an
endorsement strategy. For example, if Nestlé uses its corporate brand name to
endorse a variety of their product brands, and negative publicity spreads, this can
endanger the entire reputation of the company (Launders & Saunders, 2005).

7
The last brand architecture strategy draw upon is subbrands, which are brands
connected to a master brand and adapt the associations of the master brand
(Aaker & Joachimsthaler, 2000b). The connection between subbrands and
master brand is closer than between endorser and endorsed brand (Aaker &
Joachimsthaler, 2000b). This implies that subbrands can highly influence the
associations of the master brand. For companies to pursue a subbrand strategy
enables the master brand to stretch and enter new markets.
To conclude, there is a vast diversity in the way that corporations manage their
brand portfolios, even within the same industry, corporations pursue different
branding architectures (Laforet & Saunders, 1994). This paper deals with
Branded house strategy i.e.; the Master Brand Architecture, which is a prominent
brand architecture in Corporate Branding. For which it is necessary to
understand a Corporate Brand.
1.3 Introduction to Corporate Brand
Corporate brand is defined at the level of the company. The positive image of a
strong company usually extends to credibility of the products sold under the
company’s brand, both existing ones and those that are new to the market
(Siburian, 2004). According to Aaker when brands are managed separately and
independently, overall resources allocation among brands may be less than
optimal (1996). Therefore, having the corporate brand, or in other words
8
cohesive brand portfolio, instead of number of individual product brands, is more
rational from the company’s point of view.
Corporate brand is defined primarily by organizational associations (Aaker,
2004). It is extremely important to notice that organisational associations are
equally important for both product and corporate brands. Nevertheless, the
power, number and credibility of the organisational associations are larger in
case of corporate associations.
It is reported that a corporate brand can add value to the company’s product
policy and linking corporate and product brands will be beneficial to both the
corporate and its individual products. Several multinationals have become aware
of the importance of their names and are trying to establish and create a strong
link between their corporate brand and product brand (Uehling, 2000). However,
although there are many theories that have been advanced explaining how
customers evaluate and select a particular product (Bettman, 1970; de
Chernatony and Dall’Olmo Riley, 1998; Jamal and Goode, 2001; Kim and Chung,
1997; Lee and Ganesh, 1999; Low and Lamb, 2000; Mitchell and Olson, 1981;
Muthukrishnan and Kardes, 2001; Woodside and Clokey, 1974), most of these
attempts have only partially examined the impact of corporate branding on
consumers’ product evaluation.
1.3.1 Corporate Brands vis-a-vis Product Brands
The main distinction between the product brand and corporate brands is that
once the product brand is established, it begins its life in the eyes of customers
9
independent of the organisation which created it. Corporate brand is permanently
tied to both organisations and other brands of the company: product brands.
According to Aaker (2004), The corporate brand is special because it explicitly
and unambiguously represents an organisation as well as a product. As a driver
or endorser, it will have a host of characteristics and programs that can help build
the brand. It can help differentiate, create branded energizers, provide credibility,
facilitate brand management, support internal brand building, provide a basis for
a relationship to augment that of the product brand, support communication to
broad company constituencies, and provide the ultimate branded house.
First, differentiation in the organizational associations can be potentially found
out by corporate brands. While products and services tend to become similar
over time, organisations are inevitably very different. Wells Fargo is very different
from its competitor Bank of America in terms of style, personality, headquarters,
location, skills, citizen ship programmes and heritage. A person may be more
comfortable with one organisation over another, particularly if the products are
similar. The challenge is to identify those organizational characteristics and make
them relevant to customers.
Second, organizational programs can be drawn by a corporate brand that would
provide energy to product brands. Citizenship programmes and major
sponsorship will usually span the organisation and thus the corporate brand is in
much better position to exploit these than product brands, whose link to hem

10
might be weak. A corporate program is more effective and efficient than one that
reaches only one product class.
Third, credibility can be provided by corporate brand associations. Attitude
research in psychology has shown that believability and persuasive power is
enhanced when a spokesperson is perceived as being trustworthy, well-liked,
and expert. These same characteristics are relevant when evaluating whether a
claim made by an organisation will be given the benefit of the doubt; an
organisation will be liked because of its citizenship activities; and an expert
organisation will be seen as especially competent in making and selling its
products. Trust is a particularly important attribute and it is easier to develop for
an organisation than for a product.
Fourth, brand management is easier and more effective, leveraging on the
corporate brand across products and markets. Off- brand programs and
initiatives become more visible when the corporate brand is leverage across the
organisation.
Fifth, the translation of the corporate brand internally to employees must be
supported by the mission, goals, values, and culture of the organisation, It is
important for employees to buy into organizational values and programs. The
corporate brand identity serves as the link between the organisation and the
customer. Thus, it can play a key role in articulating these elements to
employees, retailers, and others who must buy into the goals and values of the
11
corporate brand and represent them to the customers. In case of product brands,
there is n o such supporting system.
Sixth, message provided by a corporate brand for the customer relationship that
can be very different from that of the product brand. This can be extremely
valuable for large, established brands that are perceived as reliable, high quality,
and respected but are also perceived as boring and dated. A solution is to
employ the organisation brand to represent the heritage and allow the product
brand to inject energy. If the product brand involves, a strong sub-brand, the sub-
brand can be the energy generator. However, if the product brand is the same as
the corporate brand, as it is for Virgin, Mitsubishi and G.E, then only a dual brand
conceptualization can achieve this.
Seventh contrast between product and corporate brand is a difference in who the
brand relates to in terms of both attraction and support. While product brands
mainly target consumers or customers, corporate brands also contribute to the
images formed and held by organisational and community members, investors,
partners, suppliers and other interested parties (i.e. all company stakeholders).
Instead of relating to consumers through a variety of individual products and
services with distinct product brand names, the corporate brand relates all of the
organisation’s multiple stakeholders and its products and services to each other
through their relationship with the corporation.
Eighth difference between product and corporate branding involves defining who
is responsible for the branding effort. Corporate branding requires much more
complicated and sophisticated organisational practices than did product branding
12
(for related arguments see Balmer, 2001a; de Chernatony, 2001; Will et al.,
1999; Harkness, 1999; Van Riel, 1995). Whereas product branding could be
handled within the marketing department of company, corporate branding
requires organisation-wide support.
The corporate brand is realized by the whole organisation from top to bottom and
across functional units, along with the audiences the brand is meant to attract
and engage. As we will argue next, this is because a successful corporate brand
is formed by the interplay between strategic vision, organisational culture and the
corporate images held by its stakeholders. As this range of issues significantly
overextends the expertise of the typical marketing department, we believe that
successful corporate branding involves the integrated efforts of all organizational
departments (e.g. operations, marketing, strategy, communication and human
resources). For example, Balmer (2001a, b) argued that deliberate and
orchestrated communication of corporate brands depends on the total corporate
communication mix because corporate branding requires integration of internal
and external communication, as well as creating coherence of expression across
multiplicity of channels and news media.
Ninth, the time dimension constitutes another difference between product and
corporate brands. Product brands live in the present. They are short term in their
ambitions to attract potential customers and help deliver sales. When product
brands have been around for some time, like Tide or Budweiser, marketers feel a
strong need to “freshen” them with innovative ad campaigns and to update their
13
iconography. Corporate brands, by contrast, live both in the past and the future
for, as Olins (1989) indicated, corporate brands stimulate associations with
heritage and articulate strategic visions of what is to come. As a symbol of the
company’s heritage and the vision of its leaders for the future, the corporate
brand has a much broader temporal base than does a product brand.
Tenth, Because of the greater reach of corporate brands relative to product
brands – in terms not only of relating past and future, but also of the number of
stakeholder groups targeted and the use of the whole company to support the
brand we believe that corporate branding takes on strategic importance relative
to the functional (marketing and sales) importance typically accorded a product
brand. The strategic importance of corporate branding lies not only in its
positioning of the company in its marketplace, but in creating internal
arrangements (e.g. organisational structure, physical design and culture) that
support the meaning of the corporate brand.
Finally, a corporate brand provides the ultimate branded house and captures all
the efficiencies of dialing up a single brand, even more so when descriptors are
employed and the use of sub brands is limited. In this case, the brand will gain
synergy and association reinforcement. Further, and more important, limited
brand building resources will be less diluted when there is a single mother brand.
The branded house is always the preferred strategy when it is feasible.

14
1.4 Brand Extensions
A brand extension is defined as using the current brand name to enter a different
product class, such as Ivory moving from soap to shampoo (Aaker and Keller,
1990), and Billabong entering the snowboard and skateboard categories from
their base in casual surfwear. This strategy is frequently used in mature fast-
moving consumer goods (FMCG) categories such as personal care products
(Ambler and Styles, 1997). Myriad academic studies have appeared exploring
successful approaches in applying brand extensions and investigating
consumers’ responses towards brand extensions (Aaker and Keller, 1990;
Ambler and Styles, 1997; Barone, 2005; Bottomley and Holden, 2001;
Fedorikhin, Park and Thomson, 2008)
Brand extensions have become one of the most heavily-researched topics as
well as one of the most influential areas in branding (Czellar, 2003). Successful
brand extensions depend on consumers’ perceptions of fit or similarity between
the new extension and the parent brand (Aaker and Keller, 1990; Czellar, 2003;
Klink and Smith, 2001; Volckner and Sattler, 2006). Furthermore, studies reveal
an interaction between the parent brand and the extension category: factors
affecting the parent brand will affect the extension as well. Similarly, factors that
influence the extension category will affect the parent brand (Byung Chul,
Jongwon and Robert, 2007; Hem, 2001; Kumar, 2005; Martinez and Pina, 2003;
Martinez, Polo and de Chernatony, 2008; Maureen, 1999; Nan, 2006; Yeung and
Wyer Jr, 2005). Customers evaluating brand extensions may change their core
15
beliefs about parent brands, which may lead to a stronger or weaker brand
positioning (Sheinin,2000).
Importance of Brand Extension is observed with regards to factors such as,
Innovation: which allows the brand to remain up to date and demonstrates and
increasing urge to detect and respond to the profound changes in customer
tastes & expectations. Brands that have stuck to a single state-of-art product,
relying on communication alone to update their image, have not done well.
Cost of advertising: Advertising is very essential to achieve an extended market
share (from local market to national to international market). If one adds to this
the need to be heard as much as the competitors, at least matching their share of
voice, one understands why advertising expenditure is raising so much. The cost
of advertising makes it impossible to support too many brands; efforts have to be
concentrated on a few brands only. It is imperative to decide which brands
should be advertised more. Therefore, brands extensions prove to be much more
economical.
Brand extension is the only way of defending a brand at risk in a basic market.
Brand extension gives access to an accumulated images capital. Brand
awareness surveys are done to find out the existing images of the brand in the
minds of the consumer. This not only makes us aware of the perception of the
brand in the market but also gives adequate information of the extension
potential of the brand.
Extending the brand enables the reinforcement of the image capital of the brand
and fuels it. By coming up with new or rejuvenated product, a brand can prove

16
that it is relevant and up to date. For that reason brand extension, far from
weakening the brand often makes it healthier.
The brand extension strategy is often seen as beneficial because it reduces new
product introduction marketing research and advertising costs, and increases the
chance of success due to higher preference derived from the core brand equity
(Chen & Liu, 2004). All investigations on the determinants of successful brand
extensions initially assume that a brand is an accumulation of associations
(Keller, 1993) and the parent brand associations can influence consumers'
reactions to brand extensions (Aaker & Keller, 1990; Bhat & Reddy, 2001). In
previous studies different authors identified some antecedents of brand
extension attitude of consumers. The antecedents they have identified are
parent brand trust and parent brand affect.
A brand extension strategy can be beneficial because it reduces the new product
introduction costs and also increases the chance of success (Kapferer, 1994).
The rationale behind brand extensions is simple: when a strong brand has been
established, the brand has moved beyond the functional product into a realm of
values. It makes economical sense to try to deliver the same emotional benefits
in a different market (Mortimer, 2003). Since awareness of a certain brand
already exists, costs of launching a new product will, ceteris paribus, be lower
than in the absence of a strong brand. The main objective of brand extensions is
hence to leverage the intangible qualities of a brand since the functional benefits
can generally be imitated (Urde, 1999).

17
1.5 Corporate Brand Extensions
A company makes a corporate brand extension when it relies on its corporate
name to launch a new product. A corporate brand extension clearly identifies an
organization with the product, and so evokes different reactions from consumers
than a product brand extension. A corporate brand may create associations in
consumers' minds that reflect the values, programs, and activities of the firm.
(Aaker & Keller 1998).
Companies are increasingly taking their corporate brand into new and unrelated
business areas in order to capitalize on their brand equity. Wally Olins points to
one of the most essential strategic issues concerning branding strategy: Brand
Extension. With the increasing focus on optimization of brand value, one of the
main strategic brand issues for companies to consider is how the brand equity
can create value across more activities, markets, and product categories (Balmer
& Grey, 2003; Aaker, 2004). Many companies therefore work at stretching or
extending their brand into business areas that are not related to the business in
which the brand originated.
One significant explanation for the success or failure of a corporate brand stretch
is to be found in the role played by the culture and identity of the organisation in
the brand stretch process. Brands and organizational culture and identity are
becoming more closely interlinked. A corporate brand stretch strategy and the
organizational culture and identity will therefore mutually influence each other.
Extensions always carry the risk of diluting what the original brand name means
to consumers, especially in the case of extensions that are inconsistent with the
18
brand’s existing image. The dilution has also been investigated through empirical
research and there are results showing that under certain conditions, a brand
extension can diminish consumer feelings and beliefs about a brand name. The
risk of diluting the parent brand is also a concern (Keller, 2000). The conclusion
in most research on brand extensions is that the brand needs to be a strong
brand with a very precise meaning- a solid brand identity- in order to cover a
broad range of unrelated products. The more a brand covers different categories,
the more it stretches and weakens, losing its force like an elastic band (Kapferer,
1992).
An example of a well known brand that has been stretched too far is the Pringle
brand, known for its colourful high quality knitwear for men and sponsorship of
top golfers. In 1993, the company rolled out a diversification strategy, and
suddenly the Pringle brand appeared on everything from jeans to cotton dresses,
blazers, luggage, belts and silk. Pringle even moved into retailing, launched a
chain of Pringle shops selling their own apparel, and soon discovered the logistic
nightmare which this rapid expansion entailed. All new product lines, apart from
knitwear, were outsourced and were found to be difficult to coordinate. They
became too diversified too fast, in areas their consumers didn’t expect them to
be. For eg; the cotton dresses which seemed to be out of step with the masculine
Pringle brand. From a theoretical perspective it can be argued that Pringle
extended its brand in directions, that in the minds of consumers, did not fit with
the original masculine, high class image closely connected to knitwear. The core

19
identity compromised, and the organisation also seemed to lack the necessary
competencies for the expansion so the launch failed.
The changing market dynamics and heightened competition of the global
economy has amplified the role of Corporate brands to an unsurpassed level.
Marketers seek ways to achieve growth while reducing both the cost of new
product introductions as well as the risk of new product failure. A popular way of
launching new products into a new sector or market has therefore been to
leverage the equity of the corporate brand.

20
CHAPTER 2
REVIEW OF LITERATURE

21
CHAPTER 2
REVIEW OF LITERATURE
2.1.1 Brand Extension Definition
According to Keller (2003), a brand extension is defined as “when a firm uses an
established brand name to introduce a new product”. Brand extensions are made
on an ad hoc basis or according to a strategy to create a range brand (Aaker,
1996).
Sharp (1993) illustrates how important it is that the extensions of a brand share
the features of the original brand, which were an important factor in the
differentiation of the competitors and lead to competitive advantage of the
original brand, in order to be able to use and manage the marketing strategy of
brand extensions wisely. Sustaining brand equity deals with maintaining the bond
with the customer, and proper usage of brand extension appears to be about
regarding the important factors that build the brand in the first place. Therefore,
one has to ensure that any extension of a brand is a quality product release that
will be held up well by the marketing effort.
Davis and Halligan (2001) illustrates how growing the value of a brand includes a
lot more than just extending that brand by adding products and services or
through maximizing delivery channels. In order for a brand extension to be
successful, the underlying association of the brand have to be created,

22
maintained and expanded because those associations imply a promise to the
consumer from the organisation as a whole. They also state that a brand is not
worth anything if it does not have an impact on the customer’s experience with
the company or organisation.
Davis and Halligan (2001) also believe that it is critical for a company to extend
the equity of their brands in order to achieve full growth and out space
competitors. If marketers manage to link brand extensions back to the customer
relationship and how the relationship has been used as a basis for brand
positioning, the extensions are even more dominant. When a brand is extended it
either extends the target market of the company, or it can also extend the
business definition or the point of difference, or extends the entire position of the
brand.
2.1.2 Benefits of Brand Extension
Keller (2003) distinguishes two kinds of benefits:(1) benefits that relate to the
acceptance of the brand extension, and (2) benefits that relate to the parent
brand image.
Kapferer (1997) also makes a distinction between brand extensions and their
benefits from an operational point of view, and proposes that brand extensions
that are intended to boost sales should be distinguished from new products that
carry brand image and exist to fuel the brand.
23
2.1.2 a. Benefits related to brand extension acceptance
As per Keller (2003) Brand extensions allow consumers to draw conclusions and
form expectations about the potential performance of a new product (i.e. the
brand extension) based on their existing knowledge about the brand.
Keller (2003) further claimed that provided a strong brand name is present, the
perceived risk by consumers is substantially reduced when familiarity and
knowledge about the parent brand is present.
Keller, Kapferer (2003) linked benefits derived from introducing new products
with achieving operational efficiencies. A favorable parent brand reduces costs
associated with gaining distribution since retailers are more positive to stock and
promote a brand extension. As per Keller, Kapferer (2003) another benefit relates
to marketing communications: since brand awareness already exists,
promotional activities (including introductory and follow-up advertising and other
marketing programs) of a brand extension can be less intensive and thus less
costly than those of a totally new brand and product. Other efficiencies includes
avoiding costly development of brand names, logos, symbols, packages,
characters, slogans, etc. (Keller, 2003).
2.1.2.b Benefits relating to the parent brand image
Brand extensions also have positive spillover effects on the parent brand. Firstly,
as per Keller (2003), extensions can clarify the brand meaning to consumers and
define the boundaries of the domain in which it competes. Secondly as per , by
24
improving the favorability of an existing brand association, adding a new brand
association, or a combination of these, a brand extension can enhance the
parent brand image.
Morrin (1999), in consistent with the above mentioned views, propose that
consumer exposure to brand extensions will increase parent brand awareness in
terms of recognition and recall.
Similarly, Balachander and Ghose (2003) find evidence of beneficial spillover
effects of advertising of a child brand, for example a brand extension, on choice
of a parent brand.
As per Keller (2003); Kapferer (1997) the third benefit involves brand
revitalization—a new or rejuvenated product can be a mean to renew interest
and improve attitude towards the parent brand.
2.1.3 Drawbacks associated with Brand Extension
Keller (2003) mentions several drawbacks of brand extensions. First, the image
of the parent brand can be hurt irrespective of the success or failure of the
extension. This happens when the attributes of the extension are seen as
inconsistent or conflicting with the corresponding attributes of the parent brand.
Second, brand extensions may obscure the identification of the brand with its
original categories, reducing brand awareness and/or diluting the brand meaning.
Third, brand extensions can lead to problems of practical nature, for example a

25
large number of extensions might confuse or frustrate customers, and there
might be problems with retailers being unwilling to shelf/store all the different
extensions.
Similarly, Loken and John (1993) suggest that “unsuccessful brand extensions
can dilute brand names by diminishing the favorable attitudes that consumers
have learned to associate with the family brand name”.
2.2 Concepts for Evaluating Brand Extensions
2.2.1 Extension reaction
Aaker and Keller’s (1990) study on how consumers evaluate brand extensions is
principle study in the field of brand extensions. The authors hypothesize that
“evaluations of brand extensions are based on the quality of the original brand,
the fit between the parent and extension categories and the interaction between
the two” (Bottomley & H olden, 2001, p. 494).
Despite the fact that this study by Aaker & Keller (1990) per se provides no
evidence that a direct relationship between the quality of the parent brand and
the consumer evaluation of the brand extension exist, the empirical
generalizability of Aaker and Keller’s (1990) model is well supported in Bottomley
and Holden’s (2001) secondary analysis, which examines seven replication
studies.

26
Bottomley and Holden (2001) draw three general conclusions:(1) The quality of
the parent brand and the fit between the parent brand and the brand extension
are key determinants of consumer evaluations of brand extensions; (2)
Consumer’s brand extension evaluations are also determined by (a) the
dimensions of fit (i.e. the complementarity and transferability of assets and skills)
between the parent brand and the brand extension, and (b) to what extent
consumers perceive the brand extension is difficult to produce; (3) Cultural
differences influence how brand extensions are evaluated with respect to relative
measurement factors.
2.2.2 Spillover and substitution effects
While Aaker and Keller (1990) and consequent replication studies provide a
rationale for leveraging parent brand equity through brand extensions, from
which economic profits can be extruded, Balachander and G hose (2003)
examine the reciprocal effect of brand extensions on the parent brand.
As per Balachander and Ghose (2003) the reciprocal effect of brand extensions
on the parent brand is measured by “brand-choice elasticities”, which measure
the increase in choice probability that results from increase in exposure. The
findings of Balachander and Ghose (2003) provide strong support to positive
spillover effects from advertising of a brand extension on choice of a parent
brand. This reciprocal spillover effect does, however, not seem to be
symmetrical—that is, forward spillover effects from advertising of a parent brand
on choice of a brand extension are limited.
27
2.2.3 Categorical and piecemeal evaluation processes
Kapferer (1997) states that to understand how consumers evaluate new brand
extensions, categorization theory is a useful concept. It aims at identifying the
processes by which consumers form categories, and assigns certain objects to
one category rather than another.
Mervis and Rosch (1981) propose that “a category exists whenever two or more
distinguishable objects are treated equivalently”. As per (Loken & John, 1993)
when a new brand extension is launched, a set of attributes or beliefs in addition
to the already existing family or parent brand image is introduced. If these
attributes or beliefs are consistent with the parent brand image, an extension is
considered to be acceptable (Kapferer, 1997) or perceived to “fit” the category
(Boush & Loken, 1991).
Fiske, Cohen (1982) and Brooks (1978) set up another concept for attitude
formation towards brand extensions so-called; “piecemeal”, “analytical” or
“computational” processing, where attitude is “computed” from specific brand
extension attributes. This type of model does not aim to describe conscious
evaluation processes (Boush & Loken, 1991).
Fiske and Pavelchak (1986) propose a two-step process of evaluation. In the first
step, the consumer attempts to match a brand extension (or some other new
object) with the current category. If categorization is successful, in other words, if

28
there is a match, the affect that is associated with the category type is applied to
the brand extension and so the evaluation process is complete. If there on the
other hand is a poor match between the category and the brand extension,
piecemeal processes are initiated. Affect is then evaluated through a weighted
combination of attributes.
As per Loken & John (1993), even if inconsistency implies that the extension is
not “integrated” in the parent category, an inconsistent brand extension can have
a negative impact on the parent brand by “diluting” specific attribute beliefs that
consumers have come to hold about an established brand name, rather than
“diluting” the global affect associated with the established brand name. The
negative impact of an inconsistent extension depends on the typicality of the
brand attribute at stake. Hence, brand dilution is an important issue when
launching new brand or category extensions.
2.2.4 Brand-specific associations
MacInnis & Nakamoto (1990) defines brand-specific association as an attribute
or benefit that differentiates a brand from competing brands. This means that a
brand can be associated with a salient attribute, but this association is per se not
strongly associated with competing brands or the product class as a whole
(Broniarczyk & Alba, 1994).

29
Since the brand association varies depending on the benefits that are sought
within a particular product category, a consumer’s evaluation of a brand
extension need not correspond to evaluation of that brand in its original category.
Thus Broniarczyk and Alba’s (1994) research comes up with three conclusions:
(1) A perceived lack of fit between the product category of the parent brand and
the proposed extension category can be overcome if key parent brand
associations are salient and relevant in the extension category; (2) brand-specific
associations allow for brand extensions to unrelated product categories. Brand-
specific associations moderate the role of product category similarity in brand
extension judgments; a brand extension is more preferred in an unrelated
category that valued its association than in a similar category that does not value
its associations; and (3) the boundaries for the appropriateness of a certain
brand extension were determined by knowledge about the incumbent brand.
2.3.1 Influence of Brand extension on the Parent brand
Three studies that investigated the influence of brand extensions on the parent
brands particularly influenced this research.
1. Martinez & Pina (2003) examined the negative impact of brand extensions on
parent brand image. 2. Pina, Martinez, De Chernatony, and Drury (2006)
developed an empirical model which explains the effects of service brand
extensions on corporate image. 3. Martinez, Polo, & de Chernatony (2008)
investigated the effect of brand extension strategies on brand image in a
30
comparative study of the UK and Spanish markets, particularly the industry of
sport products. These three studies suggest brand extensions have a significant
effect on the parent brand image.
Sheinin (2000) explored how brand extensions influence knowledge about parent
brands. The major finding is that brand extensions influence knowledge of
unfamiliar parent brands more than familiar parent brands. However brand image
and brand knowledge are only two dimensions of branding. Other aspects such
as the consumer-brand relationship, brand experience, brand personality, and
brand architecture still need to be examined.
2.3.2 Influence of the Parent Brand Characteristics on Brand
Extension
Keller (2003) states that there has to exist a brand node in the consumer’s
memory with a variety of associations linked to it–this is conceptualized as brand
knowledge. Information stored in the memory network can be verbal, visual,
abstract, or contextual in nature. Brand knowledge can be characterized in terms
of two components: brand awareness and brand image.
Whereas Broniarczyk & Alba (1994) claims that if consumers are to appreciate
the appropriateness of the brand extension, knowledge of the brand-specific
association is required.
Aaker and Keller (1990) propose a relation between perceived quality of parent
brand and consumers’ attitude toward the extensions in unrelated product
31
categories. As the perceived quality (termed QUALITY) of the parent brand is
higher, the transfer of positive attitudes toward the extension is also higher.
Zeithaml (1988) defines perceived quality as a global assessment of a
consumer’s judgment about the superiority or excellence of a product, and also
concludes that perceived quality is a construct that is on a higher level of
abstraction compared to a specific product attribute.
Keller and Aaker (1997) mention that corporate brand equity lies in the
association of consistent delivery of superior functionality and performance that
customers or suppliers have with a firm’s offering.
Keller and Aaker (1997) propose that marketing efforts that emphasize
innovation leads to favorable perceptions of corporate expertise and thus has a
positive impact on corporate brand extension evaluation. For the purposes of the
current study, it is then reasonable to assume that a parent brand that is
perceived to be innovative will lead to a more favorable brand extension
evaluation compared to a brand which is not perceived as innovative.
Aaker and Keller (1990) also states that the transfer of positive attitudes is also
influenced by the similarity between the corporate brand and the extension. This
follows the categorization theory and category-based processing, where
consumers evaluate a new brand extension as to how well this “fits” with the
parent brand.

32
Similarly, Boush and Loken (1991) propose that affect associated with the
original brand is transferred to the extension when similarity between the two
products is high. Following this, if consumers perceive a “fit” between a business-
to-business brand and a consumer product class, they will transfer perceptions of
quality to the new brand extension.
Aaker and Keller (1990) identify two additional dimensions of fit: the first one is
Complement, which is related to the product; the second one is Substitute, which
is related to the producer.
As per Henderson & Quandt (1980), when the product of the parent brand and
the brand extension can be consumed jointly to satisfy some need, it is said that
they complement each other. On the other hand, when the brand extension can
be used instead of the parent brand product, they are substitutes.
As per Bottomley & Holden (2001), substitutability is generally weak predictor,
since relatively few brand extensions represent true substitutes. In the case of an
extra-sectoral movement, the brand extension can by definition not substitute for
the product of the parent brand. The Substitute dimension will hence be omitted
from further analyses. The original microeconomic definition of complementarity
is limited for current purposes, as according to above given definition it involves
joint consumption of two product classes. In the case of an extra-sectoral
movement, it is not possible for a brand extension to complement the original
brand, since the customers for the original brand and brand extension
33
respectively are different.
Broniarczyk & Alba (1994) proposes a useful alternative measure for
complementarity that is the concept of brand associations, which proposes that
consumer do not only evaluate the brand extension based on the perceived
product category fit, but that their assessment are driven primarily by the
associations of the brand. In other words, if a person considers a brand
extension to be relevant with the original brand concept, the attitude towards the
extension will be positive.
Aaker and Keller (1990) also introduced a Difficulty as a variable, This denotes
the perceived difficulty in designing or producing the brand extension product. If
the extension is perceived to be difficult to make, consumers’ attitude towards the
extension will be negative. This is because a parent brand manufacturing a new
product class which is difficult to manufacture would challenge the competency of
the parent (corporate) brand resulting a costly or an incompetent end product
which may also take into consideration the cost of outsourcing if required to build
the unit or the product class, which would thereby lead to exploitive pricing.
Henderson and Quandt (1980) states that when the product of the parent brand
and the brand extension can be consumed jointly to satisfy some need, it is said
that they complement each other. On the other hand, when the brand extension
can be used instead of the parent brand product, they are substitutes.

34
2.4 Consumer’s Attitude towards Brand Extension
Aaker and Keller (1990) hypothesized that “the consumer’s attitude towards the
brand extension is a positive function of the quality of parent brand, the fit
between the parent’s brand category and the extension category (measured in
terms of the transferability of skills and expertise from one category to the other
and the complementarity and substitutability of one category and the other), the
interactions of quality with three fit variables, and the degree of difficulty in
designing and making a product in the extension category” (Bottomley & Holden,
2001, p. 495).
Loken and John (1993) stated that Inconsistent brand extension can have a
negative impact on the parent brand by “diluting” specific attribute beliefs that
consumers have come to hold about an established brand name, rather than
diluting the global effect associated with the established brand name. When a
new brand extension is launched, a set of attributes or beliefs in addition to the
already existing family or parent brand image is introduced.
Broniarczyk and Alba (1994) proposed that, If consumers are to appreciate the
appropriateness of the brand extension, knowledge of the brand specific
association is required. Consumer do not evaluate the brand extension based on
the perceived product category fit, but their assessment are driven primarily by
the association of the brand. Parent Brand Association (brand specific
association) should be salient and relevant to establish a strong relationship with
its brand extension to new product categories

35
Keller and Aaker (1997) stated that marketing efforts that emphasize innovation
leads to favorable perceptions of corporate expertise and thus has a positive
impact on corporate brand extension evaluation. Various types of Marketing
activities would influence corporate credibility and thus an overall effect on brand
extension evaluation
Bottomley and Holden (2001) suggested that the quality of the parent brand and
the fir between the parent brand and the extension are the key determinants for
consumers evaluation. Consumer’s brand extension evaluation is also
determined by the dimension of the fit.
2.5 Corporate Brand Literature: Definition, Associations &
Evaluation
In recent years, corporate brands have developed into strong drivers of financial
value for companies (Brand Channel, 2004). The market value of companies
holding strong corporate brands can be twice as high as their book values (Hatch
& Schultz, 2001). In addition, corporate brands are unique because they can
effectively represent an organization as well as a product (Aaker, 2004).
Corporate brands can be seen as the ultimate branded house, whereby the
product brand consists primarily of the corporate brand and a descriptor (Aaker,
2004).

36
2.5.1 Definition of Corporate Brands
King (1991) is considered the first researcher to classify what was then known as
the ’company brand’ as becoming the main discriminator. King (1991) argues
that consumer choice of their purchase decision will depend less on the
functional benefits of a product or service, rather the assessment of the entire
company culture is of most importance.
Aaker’s (2004) definition of corporate brand is principally defined by
organizational associations and reflects its heritage, assets, capabilities, people,
values, priorities and strategy. This implies that corporate brands are able to
develop and leverage various associations to its product brands.
Knox and Bickerton (2003) propose a more holistic definition of the corporate
brand, “the visual, verbal and behavioral expression of an organization’s unique
business model”.
Balmer and Gray (2003) emphasize that corporate brands can be considered a
navigational tool for a diversity of stakeholders that serve for different purposes
such as employment, investment and consumer buying behavior. For several
stakeholders, corporate brands are seen as symbols associated with key values
that represent quality and financial risk insurance.
37
2.5.2 Corporate Brand Associations
The previous paragraphs discussed the meaning of the corporate brand and the
its evaluation. It is important to clarify that there are various corporate brand
associations that compose the overall corporate brand construct. This paragraph
investigates the corporate brand associations that are most important in the
minds of the consumers.
Brown and Dacin (1997) researched two types of corporate associations, which
were corporate ability (CA) and corporate social responsibility (CSR). The
limitation of the study is that they only investigated two variables and the
products were highly technological. Consumers hold a wide range of corporate
brand associations and it is important to include this fact in the research at hand.
Bhattacharya & Sen (2003) finds out that most of the strongest consumer-
company relationships are based on consumer’s identification with the company.
This means that it is important for managers to identify which corporate brand
associations are meaningful for its existing customer base.
Uggla (2006) created a strategic model that links the corporate brand to partner
and institutions associations. The corporate brand association base is defined as
“the links that a corporate brand establishes to internal and external partner
associations such as brands, persons, product categories and institutionals that
add to end customer image and equity derived from the corporate brand”

38
As per (Uggla, 2006), Corporate brands can broaden their brand architecture
structures through the process of transferring brand image by borrowing or
building brand equity. The corporate brand association base can be extended
through transferring image of its own developed associations or transfer image
from partner associations.
The corporate brand, Virgin is an example of a corporate brand that has
successfully expanded the core concept into different industries. Virgin has
extended the brand association base through the transfer of its brand identity by
focusing on its strong corporate brand associations (Uggla, 2006).
Aaker & Joachimsthaler (2000) claims that the company’s brand associations
focus on ‘fun’ and being the ‘underdog’. Nike is an example of a corporate brand
that has transferred image from partner associations. The corporate brand Nike
associations focus on ‘excelling’ and ‘being active’, which could relate towards
top athletes. Through the creation of Nike Air Jordan several aspects of the
Michael Jordan brand image transferred to the corporate brand Nike.
As per Uggla (2006) Managers should use the corporate brand association base
model to distinguish and reinforce the corporate brand. However, managers
should be aware that there are risks involved by using the corporate brand
association base model. The most salient risk is the loss of control of the
corporate brand.

39
2.5.3 Corporate Brand Valuation
Aaker, Keller (1998), suggests that for building, measuring, and managing
corporate brands, its equity has become a top priority for many companies and
an important strategic branding decision. Corporate Brand Equity is thus
considered to be a significant tool to evaluate a corporate brand. This study
makes use of Brand Equity Evaluator which originates from BBDO’s (Barton
Batten Dustin & Osborn) BEES (Brand Equity Evaluation System) model for the
evaluation of Corporate Brand Equity. Accordingly, it becomes imperative to
study the perspective of brand equity at the first place which would eventually
lead to Corporate Brand Equity evaluation followed by evaluation of Corporate
Brand Strength.
2.6 Perspectives of Brand Equity
Farquahar (1989) suggests that Brand equity can be viewed from the three
different perspectives. One perspective is the so-called Consumer Based Brand
Equity, first used by Keller and Aaker. The second one is the firm's perspective
and the third point of view is the so called trade perspective.
a. Customer Based Brand Equity
According to Keller (2001) companies can develop strong brands only if the
brand development process includes the following steps: (1) establishment of
proper brand identity, (2) creation of the appropriate brand meaning, (3)
40
extraction of the right brand responses, and (4) building of appropriate brand
relationships with customers. Keller introduces six building blocks which are part
of the Customer Based Brand Equity pyramid. Those building blocks are:
salience, performance, imagery, judgment, feelings and resonance.
b. Firms’ Perspective (Company Based Brand Equity)
Keller (2001) defines company based brand equity as incremental cash flows
that are added by the brand itself to the overall company’s value. Added value of
the brand is higher, the stronger the brand. This statement has the following
implications. First, strong brands usually give the opportunity for successful
brand extensions and for brand licensing. Second, very important implication is
that strong brands are able to keep the profits at the usual level during the critical
situations for the company as a whole. Since the brand, in some way, is able to
transform a product into a “luxury good” regardless of the fact that generic
product is not classified in this category, profits will remain the same, or the
company will not have substantial decrease in profits during the period of crises
at the macroeconomic level.
The final implication of a strong brand can be examined through one of the
components in Porter’s Five Forces model, i.e. barrier to entry. Markets which
are dominated by leaders with very strong brands are usually not being a target
of attack by competitors, since companies which own weak brands cannot enter
the market. From microeconomics point of view, we can say that strong brands
41
are able to provide monopolistic position for a company in the market, or at least
in the niche market, in the long run.
c. Trade’s Perspective
Shocker (1994) claims trade’s perspective is becoming increasingly important
since the new level of competition is evolving in the product markets. This refers
to distributors. Traditionally, companies were distributing their products using the
following channels: company →wholesaler → retailer →final customer. Today,
internal relationships in this channel are becoming more complicated because
traditional distributors endanger manufacturers’ brands and represent fatal
obstacle to their success.
As per Shocker (1994), negotiating power of distributors in case of weaker
brands is higher in comparison to the negotiating power of producers. This
influences the marketing communication strategies of the corresponding
companies, since their focus is turning to the distributors instead of the
customers. In addition, brand managers have to choose between fighting the
distributor brands or joining them (i.e., produce private labels for the retailer). In
order to support adequate decision regarding the fighting vs. joining, brand
managers have to obtain marketing research information (Russel and Kamakura
1994).
Farquhar (1998) suggests that strong brands are usually highly leveraged and
this protects brands against private labels. Brand equity and the brand leverage
are moving into the same direction. This could mean that the highly leveraged

42
brands are at the same time stronger, and can have higher brand equity over the
other products in the market. This source of added value comes from easier
acceptance and wider distribution of powerful brands.
2.6.1 An Overview of the Brand Equity Models
Traditional classification divides all models of brand equity in three categories:
financial, consumer-based and composite models.
Bekmeier-Feuerhahn (1998) defines the financial approach of the brand equity
which is as follows: brand equity is a net present value of future net surpluses
over the cash inputs that owner of a brand can earn. Financially oriented
valuations of brand equity should result in monetary value, which can be included
in the financial statements of the company. Nevertheless, such valuations are of
very limited capacity since they do not take into account all the aspects of a
brand and its equity. Namely, they take into account purely financial aspects of
the brand. In addition, the application of these models is problematic in terms of:
discount rate, growth rate and useful life (Kapferer, 1992, p. 25).
Second category of models are consumer-based. They value the brand from the
consumer stand point.
As per Srivastava and Shocker (1991), the consumer-based perspective
assumes the two multi-dimensional concepts of brand strength and brand value
Brand strength is based on perceptions and behaviours of customers that allow
the brand to enjoy sustainable and differentiated competitive advantages.

43
According to Keller (1996), there are two approaches for measuring the
consumer-based brand equity: indirect approach and the direct approach The
indirect approach requires measuring brand awareness, characteristics and
relationships among brand associations. The direct approach, however, requires
experiments in which, one group of customers responds to an element of the
marketing program when it is attributed to the brand, and another group of
consumers responds to that same element when it is attributed to a fictitiously
named or unnamed version of the product or service.
2.6.2 BBDO’s Brand Equity Evaluation System (BEES)
The BBDO consulting, along with Interbrand Brand Consultants made its own
classification of models. BEES model is one of them. It is a multiphase factor
model. The main benefit of this model is that it takes into account differences
among industries. The main factor that distinguishes various industries is the
advertising support cost, which varies from one industry to another. If these
differences are not identified the results can be distorted. In addition, this
component makes this model more universal than others. The model identifies
eight determinants of the brand equity: Brand’s: sales performance and
potential, net operating margin, development prospects, international orientation,
advertising support, strength within the industry, image and earnings before
taxes.
Zimmerman( 2001) aggregates these eight determinants of brand equity to the
following elements: market quality, dominance in relevant market, and
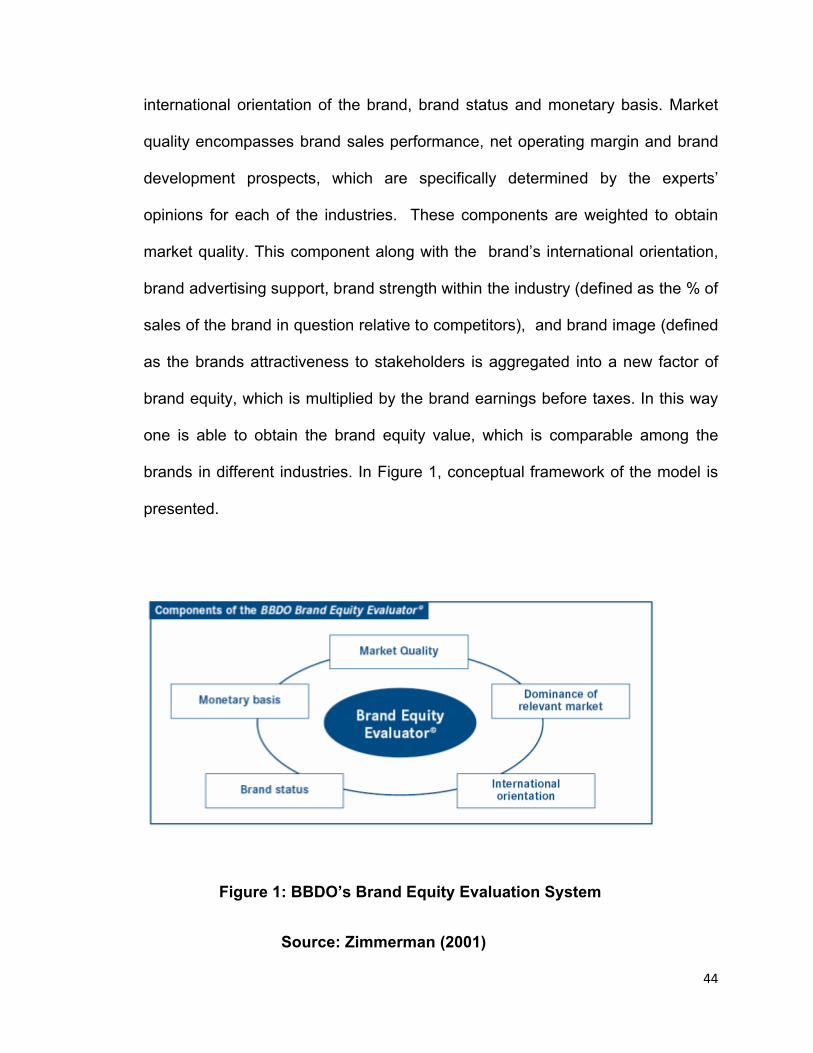
44
international orientation of the brand, brand status and monetary basis. Market
quality encompasses brand sales performance, net operating margin and brand
development prospects, which are specifically determined by the experts’
opinions for each of the industries. These components are weighted to obtain
market quality. This component along with the brand’s international orientation,
brand advertising support, brand strength within the industry (defined as the % of
sales of the brand in question relative to competitors), and brand image (defined
as the brands attractiveness to stakeholders is aggregated into a new factor of
brand equity, which is multiplied by the brand earnings before taxes. In this way
one is able to obtain the brand equity value, which is comparable among the
brands in different industries. In Figure 1, conceptual framework of the model is
presented.
Figure 1: BBDO’s Brand Equity Evaluation System
Source: Zimmerman (2001)

45
2.6.3 Brand Equity Evaluator Model
The Corporate Brand Equity evaluation in this study originates from the BBDO’s
BEES model. This model is called the Brand Equity Evaluator©
It consists of the following five elements: Market quality, Dominance of the
relevant market, International orientation of the brand, Brand strength, Monetary
basis.
According to Zimmerman (2001) this model is based on the top-down approach
since the valuation of the brand includes all dimensions of the brand: the industry
or the market in which the company operates; position of the brand in the market
or the industry; the orientation of the brand, which connects the brand either to
the local or international environment; the consumer perceptions of the brand
and the cash flows the brand generates for the company which is the owner of
the brand.
In accordance with that, brand valuation process consists of four stages:
valuation of the market quality (henceforward: MQ); valuation of the aggregate
factor value (henceforward: AFV), the valuation of the discounted cash flows
(henceforward: DCF) of a company or a product (depending on whether we talk
about company or product brand) and of the brand valuation itself (henceforward:
BV).
Market quality element is included in the analysis because it provides an analysis
of the “background” of the brand in terms of the environment in which the
company, launching the brand, operates. For the purpose of valuation of market

46
quality, a researcher needs to be familiar with the prospects of the market or the
industry in which the company operates. The elements considered to be the most
relevant for such an analysis include: sales performance (henceforward: SP) in
the market, net operating margin (henceforward: NOM), and extent to which the
market is brand driven (henceforward: BD).
According to Zimmerman (2002), SP in the relevant market is determined as the
three year average sales growth and as such provides a clear picture of the
future prospects of the market or the industry. If the sales growth rate is high, we
can define the market as a growing market - one that affords the opportunity for
a high future sales growth of the brand in question. On the other hand, if the
growth rates are low and/or stable, we can talk about a mature market, whereby
the future earning potential of the brand cannot be high. Third, if the sales growth
rates are negative, we can conclude that the market is in a declining faze,
whereby the future earning potential of the brand is much lower than in the two
previous cases. NOM of the market, which is defined as the return of sales,
provides a clear picture of the real earning power of the market, since the high
sales level, do not necessarily imply high profitability. If the high amount of
realized sales is “transferred” into the profit for the company, we can say that the
market is efficient enough, and that it has high earning power. The third element
of the MQ is BD. This element is determined as % of sales, which is spent on
advertising in the relevant market or the industry. Therefore, if the substantial
amount of sales is spent on advertising, companies are aware of the fact that
47
these expenditures are regained through higher brand strength (e.g. brand
knowledge) Zimmerman (2002).
Furthermore, these three components are aggregated into the MQ factor.
Weights are determined according to the relevance of individual ratios for the
specific valuation situation. The specific valuation situation, in this empirical
study, relates to the corporate brand valuation for the purpose of brand merger or
acquisition.
According to Zimmerman (2002), in accordance with the top-down approach,
after the determination of the quality of the market in which the brand operates,
one has to identify elements, which determine the quality of the brand itself. The
first element, which should be calculated for this purpose is the dominance of the
relevant market (hereafter DRM). This element describes the brands position in
the relevant market in comparison to other competitive brands. A combination of
high market quality, expressed in high market growth and high dominance of the
brand, is the main prerequisite for the high value of the brand in comparison to
other brands. Both of these indicators provide a better picture of the brand’s
current financial strength as well as its future potential for market domination.
The second element, to be determined with respect to the brand’s quality itself, is
its international orientation (hereafter: IOB). This element positions the brand
either at a local or at international level. It is defined as the brand sales at foreign
market relative to total sales of the brand. Specification of the brand’s relevant
market is important for determination of the international orientation of the brand
48
and dominance at relevant market. The relevant market is one which is more
important for the brand, than all other markets (i.e. local vs. foreign markets).
Nevertheless, the purpose of the valuation as well as the availability of data gives
the analyst the discretion right to define the relevant market on his/her own. It
should be emphasized, however, that in case of small markets (i.e. Slovenian),
one must be aware of the fact that the international dimension of the brand is
extremely important, since the possibilities for growth of the brand are very
limited in the domestic market.
The third element of the quality of the brand itself is the brand strength (here after
BS), This element provides explicit perception of the brand in the eyes of
consumers. All other elements, which are financial in their “character”, are implicit
representations of consumer perceptions.
After determining factors related to the quality of the brand itself (e.g. DRM, IOB
and BS), we can conduct the second stage of brand valuation, i.e. the AFV
valuation. This factor is calculated by weighting the four above-mentioned
factors. Weighting of the factors depends on the valuation situation as well as the
purpose of the analysis.
The third stage of the brand valuation process is the DCF analysis. DCF is
determined for the period of three years. Namely, the cash flows of the brand can
be determined with the higher rate of precision for 3 years in comparison to
longer periods. This element must be included in the brand equity model as it
gives it monetary character, and as it is used to reflect the cash flow generating

49
power of the brand. Due to existence of time value of money, cash flow
generated from the brand in different moments in time must be discounted at the
moment of its valuation. Therefore, a discount factor must be determined.
2.6.4. Corporate Brand Strength (CBS)
Aaker (1996) considers Corporate Brand Strength as the heart of Corporate
Brand Equity. Out of the parameters for evaluating the Corporate Brand Equity,
the brand strength element is the most important among all the other factors due
to the fact that brand familiarity provides comfort to the consumer. This is the
only element among the other four which provides explicit perception of the
brand in the eyes of consumers.
Kalafut (1997) identifies “measures that matter”, institutional investors base of
their judgments of intangible factors such as management quality, effectiveness
of new product development, and strength of market position. It is difficult to
communicate this information in the absence of a corporate brand strength.
According to Cravens and Guilding (1999), the appraisal of the brand strength
can reveal areas of the brand vulnerability. In this way, managers can consider
adequate actions that should be taken in order to make adjustments in the brand
management strategy and implementation, and they can make implications for
the reallocation of budget.
Aaker (1996) believes good management of the brand portfolio demands the
existence of the appropriate brand valuation tool as well as, other measures. If
one relies on existing measures in the company, which are part of a internal
50
accounting system, i.e., ROA, sales, cost margin or sales margin etc., one is
looking at short term measures, which do not provide incentives for the
investment in brands. Therefore, Aaker sees the brand strength as the sensitive
and credible measure, which supplements the short term financial measures.
This measure is defined by Zimmerman (2001), with four different elements:
brand identity, brand knowledge, brand positioning and perceived quality. Thus
the four parameters to measure Corporate Brand Strength are: Corporate Brand
Identity, Corporate Brand Awareness, Corporate Brand Positioning and
Perceived Quality of the Corporate Brand.
Corporate brand identity
According to Karjalainen (2003), the metaphorical use of the notion “identity” in
the corporate context suggest that companies can be described through specific
characteristics, due to the similarity with human beings.
Keller (1997) identifies identity functions in two directions: the brand towards the
customer and customer towards the brand. Since the focus of each market
oriented company is the customer, we can certainly claim that the former
approach is much more “in use” than the latter. Brand towards the customer
approach denotes that companies are becoming aware of the values, wishes and
needs of their customers, and are attempt to generate brands which are
communicating these values to the customers, and consequently meet the needs
of their customers. If the “mission” of the company is successful and it results in
the loyal customers, we can say that the company understands its customers.

51
The second direction, i.e., customers towards the brand comes from the values
of the customers, although the customer is one searching for the value-match.
The result is basically the same. An identification with the brand as such relates
to the acceptance of the certain values which are represented by the brand. The
value of the brand in question is higher than the value, which the customer would
obtain by buying another brand/product. The relation customer to brand can be
seen as the perfect “fit”.
Corporate brand awareness
According to Aaker (1996), Brand awareness is one of the elements of the Brand
Equity. It can affect both consumer perception and attitudes of the brand. The
levels of brand awareness are as follows : recognition, recall, top-of-mind, brand
dominance, brand knowledge and brand opinion.
Since the recognition is usually “attached” to new brands, the brand knowledge is
appropriate for well-established brands. One of the problems that have been
indicated by Aaker in the same study is that for some brands, name imagery
cannot be separated from the familiarity with brand symbols and the brand
imagery.
Corporate brand positioning
Sujan and Bettman (1989) finds one of the most important aspects of a brand
positioning in the product category, that is how different or similar the brand is
perceived to be in comparison to other brands in the product category. Therefore,

52
brand positioning influences the purchasing decisions in a way that consumer
sees the brand as unique, true and the one which meets his/her needs. The idea
of positioning, although it relates to the modern branding strategies.
Corporate brand perceived quality
Aaker (1996) studies perceived quality as one of the key elements of the brand
equity since it is proven that this element is associated with the price premium,
price elasticity, brand usage and stock return. As such, this element can be
applicable to all brand types, across products and markets. It is also very
important to notice that this element “works” only if we compare the brand in
question with the competitive brands.
The other issue is that loyal customer Aaker claims that quality “can be key
driver” (1999) in cases of some brands. It can be concluded that perceived
quality of products is extremely important, and it may be the most important
element. This is in line with the notion that most of the products in this sector can
be considered as “inferior” goods. This means that the choice of buying one good
instead of another, is due to the perceived quality, even in cases when the price
of later is higher.
2.7.1 Leveraging the Corporate Brand
Several academics have highlighted the opportunity of leveraging the corporate
brand (Aaker, 2004; Kay 2006; Uggla, 2006). This is because the corporate

53
brand has access to both organizational and product associations and has the
ability to portray various roles within the brand portfolio (Aaker, 2004).
According to Argenti & Druckenmiller (2004), it has become popular for
companies to borrow equity from the corporate brand to be able to provide
credibility and speed up the process of introducing new products.
As per Uggla (2006), the ability to leverage the corporate name creates many
opportunities for the corporate brand. The meaning behind the corporate brand
values can assist in the brand leveraging process.
As per Aaker (2004), First of all, corporate brands can differentiate themselves
from the competitor by focusing on their unique organizational associations. It is
essential to find out which key corporate brand associations should be
communicated to the consumers. As these corporate brand associations can
provide credibility to the consumer. When companies have established a credible
corporate name consumers are more likely to trust the brand. Leveraging the
corporate brand across product brands and penetrating into new markets can
make brand management more effective.
However, Kay (2006) argues that leveraging the corporate brands is only
applicable to strong corporate brands and when corporate brands join their
products brands to activities that create positive and meaningful associations

54
towards the corporate brand. As brand extensions are perceived more favourably
when there is an alignment between product classes, similarly leveraging the
corporate name is achievable, when there is an alignment between corporate
and product brands activities.
Overall, as per, Aaker & Keller (1990); Argenti & Druckenmiller (2004), the
concept of leveraging associations from corporate to its products brands is
similar to the concept of leveraging brand extensions because both use the
established brand name to launch new product brands in new markets. Both
concepts benefit from the use of leveraging its established brand equity.
2.7.2 Challenges in Leveraging the Corporate Brand
According to Balmer & Gray (2003), a strong corporate brand can be a valuable
resource for a company. Corporate brands are able to increase the
organization’s reputation, recognition and visibility (Hatch & Schultz, 2003a).
Nevertheless, as per Aaker (2004), there are also various risks involved with
leveraging the corporate brand. According to Uggla (2004), the key risk is the
loss of control of the corporate brand identity, associations and the core values.
Corporate brands can inhibit the company entering new market segments or
when they do not fit well with the existing target group (McDonald et al., 2001).
55
The corporate brand, Kraft Foods is an example of a corporate brand that inhibits
the company to enter new market segments. Kraft Foods has some influential
brands in its brand portfolio (e.g. Cadbury, LU, Milka, Oreo and Toblerone).
There is a clear difference between Kraft Foods as a corporate brand and Kraft
as the product brand. However, most consumers know Kraft only for its
mayonnaise and sauces and due to this strong consumer associations Kraft
Foods is restricted to enter new markets that are unrelated to the core product by
its corporate name.
Furthermore, as per Uggla (2006), the over exposure of a corporate brand can
lead to image dilution and less leveraging opportunities in the future.
Argenti & Druckenmiller (2004); Greyser et al., (2006) studied on the financial
scandals that put the organisation’s reputation at severe risk and thus affect the
enterprise. This scandal shows that having a recognized corporate name can
endanger the entire company.
According to Laforet & Saunders (2005), the negative reputation created has a
devastating impact on the enterprise. To conclude, there are many opportunities
and challenges involved with leveraging the corporate brand.
2.8 The Dimensions of Corporate Branding
The first wave of Corporate Branding took shape in the mid 1990s. Authors such
as Olins (1988), Aaker (1991), Balmer (1995,2001), Ind (1997), Keller (1997), de
Chernatony (1999), Kapferer (2000), Aaker and Joachimsthaler (2000), Hatch &

56
Schultz (2000, 2001), Gray & Balmer (2001), played a leading role in influencing
thought.
Through the process of globalization there has been a shift in marketing
emphasis from product branding to corporate branding, which focuses on
branding products and services in association to the corporation (Hatch &
Schultz, 2001; Kay, 2006).
According to Balmer & Gray (2003), managing a mixed portfolio of brands is
extremely challenging for managers. However, the corporate branding strategy
integrates a mixed brand portfolio into a marketing campaign (Kay, 2006). The
aim of corporate branding is to build a strong corporate brand with sound
corporate brand equity and to leverage positive corporate brand associations to
its various other product brands.
Schultz and Hatch (2003) claims Corporate branding to be congruent with the
strategic brand vision (Schultz and Hatch 2003), it dwells on developing brands
at an organizational level (Knox and Bickerton 2003) -which requires managing
interactions with multiple stakeholders (Balmer and Gray 2003, Knox and
Bickerton 2003, Hatch and Schultz 2003, Aaker 2004b).
According to (Argenti & Druckenmiller, 2004), there are various dimensions of
corporate branding. One of the most common dimension is by using an
established corporate name for all its existing product brands.
57
2.9 Corporate Brand Extensions
Limited academic research in the field of corporate brand extensions has been
published to date. Keller and Aaker (1997) did however examine in their working
paper how corporate marketing activities portraying a firm as innovative,
environmentally concern, and involved with the community might lead to positive
corporate credibility and thus have a positive effect on brand extension
evaluation.
Keller and Aaker (1997) examined how various types of corporate marketing
activities (communication activities portraying a firm as innovative,
environmentally concerned, and involved with the community) would influence
corporate credibility (i.e. perceived expertise, trustworthiness, and likeability) and
thus have a positive effect on brand extension evaluation. In their study, four
hypothetical corporate brand extensions outside the current brand offering were
presented alongside corporate descriptions that emphasized one of the following
three types of attributes: (1) A firm’s reputation of being innovative and
philosophy of launching technologically advanced products; (2) a firm’s policy to
offer “environmentally friendly” products and to manufacture products in an
environmentally safe fashion; and (3) a firm's philosophy to improve the quality of
life in local communities through various activities and programs.
The findings of Keller and Aaker (1997) suggest that corporate marketing efforts
can be beneficial as it improves perceptions and evaluations of a corporate brand
extension. Creating a positive corporate image and executing a corporate brand
strategy can thus facilitate new product acceptance. The three types of brand
58
attributes mentioned above can be categorized into innovativeness, corporate
social responsibility and environmental concern.
Innovativeness
According to Keller (2003), an innovative brand image involves being perceived
as being modern and up-to date, investing in research and development, utilizing
state-of-the-art manufacturing technologies, and introducing the latest product
features. Though this suggests that positive brand attributes that signal
innovativeness are important, surprisingly little research has been done in this
field.
Indeed, as per Roerich (2004), most research in the topic of innovativeness in
marketing has been in the area of consumer innovativeness and the innovation
diffusion, according to Ostlund (1974), different individuals have different
predispositions to adopt or buy new products. An important point to make is that
although innovative brand attributes is favorable for building brand equity, the
extent to which this is successful also depends on how “innovative” the target
audience is.
Keller & Aaker (1997) claims that marketing activities that emphasize innovation
have a significant impact on corporate brand extension evaluation as it leads to
the favorable perceptions of corporate expertise and to presumptions that the
corporate brand extension will also be innovative. Emphasis on innovation is the
only type of marketing activity that enhances the customer’s perceived “fit” of the

59
brand extension to the parent brand, as well as evaluations of specific product
attributes. Hence, marketing efforts to emphasize innovation significantly
increases both perceived quality and purchase likelihood score for the brand
extension.
Corporate Social Responsibility (CSR)
Much has been written about corporate social responsibility (CSR) in recent
years.
Kitchen (2003) argues that companies undeniably have responsibilities within
their surrounding community, and that these responsibilities must be clarified and
aligned with the companies’ core businesses. Since these responsibilities are
relationships and promises, CSR is ultimately a function of the brand .
Similarly, Keller and Aaker (1997) define CSR as “a firm's philosophy to improve
the quality of life in local communities through various activities and programs”
Environmental concern
Keller and Aaker (1997) define environmental concern as “a firm’s policy to sell
"environmentally friendly" products and to manufacture products in an
environmentally safe fashion”. Corporate marketing efforts that emphasize
environmental concern enhance perceptions of corporate trustworthiness and
likeability as well as inferences that the corporate brand extension is
environmentally aware.
60
2.10 Research Gap
Limited academic research in the field of corporate brand extensions has been
published to date. Keller and Aaker (1997) did however examine in their working
paper how corporate marketing activities portraying a firm as innovative,
environmentally concern, and involved with the community might lead to positive
corporate credibility and thus have a positive effect on brand extension
evaluation, as mentioned in the Literature review. Out of which only perceived
innovativeness had a significant impact on corporate brand extension evaluation,
because emphasis on innovation was the only type of marketing activity that
enhanced the perceived fit between the corporate parent brand and the
extension.
Extensive research has examined the process by which consumers evaluate
product brand extensions. Many researchers have also examined the
conceptualization, antecedents, and consequences of corporate image. Despite
the prevalence and importance of corporate branding strategies, relatively little
research, however, has examined how corporate-level associations affect the
success of brand extensions.
It has been observed from the review of Literature conducted so far in the field
of Corporate Brand Management and Brand Extensions that not much significant
work has been conducted on the issue of the extent to which a Corporate Brand

61
can stretch itself i.e.; how far a Corporate brand can stretch itself without.
Subsequently not much research is conducted on how far a new product
category to which the Corporate brand is venturing into would leverage on the
core associations of the Corporate Brand. This would lead in figuring out the
strength of association of the Corporate brand and how successful would the
new product category relate strongly with core associations. Further on
holistically, whether the Corporate Brand stretch to new product categories i.e.;
it’s diversification to new product categories affect its Parent (Corporate) brand
equity is yet to be further analyzed. Specially the Corporate brand stretching to
unrelated product categories or conglomerate diversifications. There is also a
dearth of research done in this field of Corporate brand extensions exclusively in
the Consumer Electronics and Home Appliances sector, which has been
extensively making use of brand extensions in there Umbrella branding type of
brand architecture. Last but not the least a very limited research of such kind has
been conducted in this sector in a dynamic and diversified market such as India,
which is one of the fastest growing economy in the world and a market which is
heavily cluttered with me too brands.
62
CHAPTER 3
PURPOSE OF THE STUDY
OBJECTIVES
HYPOTHESES

63
Chapter 3
3.1 Purpose of the study
Companies are increasingly taking their corporate brand into new and unrelated
business areas in order to capitalize on their brand equity. Wally Olins points to
one of the most essential strategic issues concerning branding strategy: Brand
Extension. With the increasing focus on optimization of brand value, one of the
main strategic brand issues for companies to consider is how the brand equity
can create value across more activities, markets, and product categories (Balmer
& Grey, 2003; Aaker, 2004). Many companies therefore work at stretching or
extending their brand into business areas that are not related to the business in
which the brand originated.
An exclusive usage of Corporate brand extensions is been conducted in the
consumer durable industry especially the Consumer electronics and Home
appliances sector, where a Corporate brand name is been stretched or extended
to its various product categories. Since it’s a matter of establishing an association
with the corporate brand, also observed as a parent brand in umbrella branding
architecture, and the new product category, the core association of the corporate
brand plays a pivotal role in deciding the extension with respect to the
associations consumers have regarding the corporate brand, also the manner in
which the corporate brand positions itself in the market i.e., the way a corporate
brand is better known in the market. The evaluation of the extension of the
corporate brand by the consumer is affected by the core associations of the

64
corporate brand. A parent brand usually stretches itself in related or unrelated
product categories in brand extensions. In case of unrelated categories
diversifications usually known as conglomerate diversification, the extent of the
core association of the parent brand seems to be more difficult.
Thus the research problem identified is with respect to the issue of the maximum
stretch of the Corporate Brand i.e.; the extent to which a Corporate Brand can
stretch itself. Also the extent to which a new product category would leverage on
the core associations of the Corporate Brand would be interesting to observe.
Further on, whether the Corporate Brand stretch to new product categories i.e.;
it’s diversification to new product categories particularly to conglomerate
diversifications, affect its Parent brand equity is yet a matter of importance to be
further identified. Thus for the Corporate giants in this field of CEHA, which is
exclusively following the umbrella branding architecture, a kind of framework is
necessary to be established as to what extent it’s Corporate brand can stretch
itself without affecting its parent brand equity.

65
3.2. OBJECTIVES
With regards to the problems identified in the previous chapter, a set of
objectives have been taken into consideration which would design a road map for
the extent to which a corporate brand can stretch itself.
1. To study the extent to which a Corporate Brand can stretch itself
2. To study the core association of the Corporate Brand
3. To identify the new product categories and study how far can they leverage
on the core association.
4. To establish a relationship between Attitude towards Brand Extension and
various parameters which affect the same.
5. To measure the Attitude towards Brand Extension score for new product
categories (hypothetical extensions).
6. To measure the attitude towards the Corporate Brand’s products and
formulate a range across various sectors of the Corporate Brand, eventually
establishing cut offs for the respective sectors.
66
7. To analyze the Attitude towards Brand Extension score for new product
categories (hypothetical extensions) and the Attitudinal ranges established
for the Corporate Brand.
8. To examine the relationship between the attitudes towards the Corporate
Brand’s products scores with product brand equity scores of various
products of the Corporate Brand and thus establish a relationship with their
respective ranges.
9. To establish a relationship among Attitude towards brand extension scores
of the new product categories, attitudinal and product brand equity ranges of
the Corporate Brand and the Corporate Brand Strength (which is an integral
part of the Corporate Brand Equity).
67
3.3. HYPOTHESES
Parent Brand Knowledge
H01: Higher perceptions of knowledge towards the parent brand does not
lead to higher favourable attitude towards its brand extension
H11: Higher perceptions of knowledge towards the parent brand lead to
higher favourable attitude towards its brand extension
Parent Brand Quality
H02: Higher perceptions of quality towards the parent brand does not lead
to higher favourable attitude towards its brand extension
H12: Higher perceptions of quality towards the parent brand lead to
higher favourable attitude towards its brand extension
Innovativeness
H03: Higher perceptions of innovativeness towards the parent brand does
not lead to higher favourable attitude towards its brand extension
H13 : Higher perceptions of innovativeness towards the parent brand lead
to higher favourable attitude towards its brand extension

68
Corporate Ethics & Responsibility
H04: Higher perceptions of corporate ethics & responsibility towards the
parent brand does not lead to higher favourable attitude towards its
brand extension
H14: Higher perceptions of corporate ethics & responsibility towards the
parent brand lead to higher favourable attitude towards its brand
extension
Environmental Concern
H05: Higher perceptions of environmental concern towards the parent
brand does not lead to higher favourable attitude towards its brand
extension
H15: Higher perceptions of environmental concern towards the parent
brand lead to higher favourable attitude towards its brand
extension
Transfer
H06: Higher perceptions of transferability of the parent brand
characteristics to the new product class does not lead to higher
favourable attitude towards its brand extension
H16: Higher perceptions of transferability of the parent brand
characteristics to the new product class lead to higher favourable
attitude towards its brand extension

69
Brand Concept Consistency
H07: Higher perceptions of brand concept consistency towards the
parent brand does not lead to higher favourable attitude towards its
brand extension
H17: Higher perceptions of brand concept consistency towards the
parent brand lead to higher favourable attitude towards its brand
extension
Difficulty
H08: The relationship between the difficulty of making the consumer
product class of the brand extension and the attitude toward the
brand extension is positive
H18: The relationship between the difficulty of making the consumer
product class of the brand extension and the attitude toward the
brand extension is negative
70
Chapter 4
RESEARCH METHODOLOGY

71
Chapter 4
Research Methodology
4.1 Research Design
Research Design is a blueprint of the study conducted, which includes data
collection, sample selection, types of questionnaire, processing of data and
finally interpretation of the data.
Considering the nature of the research, an Exploratory as well as an
Experimental approach have been employed. The entire research design is
divided into two parts. Part One which mainly adopts a Qualitative Methodology,
an effort has been done in analyzing the Corporate Brand in terms of its Core
Associations which is possible with the help of a Concept Map. The new product
categories (hypothetical extensions) are taken into consideration to analyze
whether and how they associate with the Corporate brand. A ranking is
established for the new product categories with respect to their strength of
association with the corporate brand. Whereas in Part Two which purely adopts a
Quantitative Methodology, an effort has been done to analyze quantitatively, how
far the Corporate Brand (CB) can stretch itself, making use of new product
categories in the form of hypothetical extensions which the CB has never
manufactured or marketed in the past. A ranking is again established of the
hypothetical extensions with the help of attitude towards brand extension score.
At the end of the research design, both the ranking are compared and confirmed
for the new product categories (hypothetical extensions), projecting which
72
extension is the closest to the CB and can be launched, and which extension is
the farthest and is risky for the CB to extend itself to that particular product
category.
In Part One of the research design, a Brand Concept Map (BCM) is established
for the Corporate Brand (CB) under study, for which the new product categories
in the form of hypothetical extensions are taken into consideration to analyze
how far this corporate brand can stretch itself. This BCM would bring out the core
associations of this CB. The applications of brand associations is put use for
understanding brand equity, as it involves identifying the network of strong,
favorable, and unique brand associations in consumer memory (Keller 1993).
Consumers might associate a brand with a particular attribute or feature, usage
situation, product spokesperson, or logo. These associations are typically viewed
as being organized in a network in a manner consistent with associative network
models of memory (see Anderson 1983). This association network constitutes a
brand’s image, identifies the brand’s uniqueness and value to consumers, and
suggests ways that the brand’s equity can be leveraged in the marketplace
(Aaker 1996).
For establishing a BCM, a set of 100 respondents, primarily youth, of an age
group of 18-39 are instructed to note down as many associations of the CB as
possible. These 100 respondents are further brought down to 50, which
represents the common set of associations w.r.t. the CB. These 50 respondents
are subsequently instructed to draw a concept map for the CB. An average of
73
these concept maps conclusively establishes the Brand Concept Map for the
Corporate Brand.
The hypothetical extensions or the new product categories which are to be
associated with the CB, to test how far the CB can associate itself with them, a
Qualitative methodology is adopted with the help of Focus Groups as a Data
collection tool and the respondents are advised to write down all the attributes
they would be looking forward while purchasing such products. These attributes
are listed down and are ranked for individual hypothetical extension or the new
product category. With the help of a set of core associations of the CB, an
attribute association matching is done.
The respondents are also instructed to rate the core association of the CB on a
scale of 1 to 10 across the hypothetical extensions. A ranking of these
hypothetical extensions or new product categories is thus established from this
exercise.
In Part Two of the Research Design, a Quantitative methodology is adopted for
evaluating i) Parent Brand characteristics & evaluation of the brand extensions
characteristics to new product categories ii) Attitude towards the CB’s products
evaluation as well as iii) Product brand equity scores for the CB’s products. An
effort is also done in analyzing the Corporate Brand Strength, which forms an
integral part of Corporate Brand Equity.

74
Corporate Brand Strength
As per Barton Batten Dustin & Osborn (BBDO) consulting, a conceptual model
for measuring Corporate Brand Equity called the Corporate Brand Equity
Evaluator consists of the following four elements viz; Market Quality (MQ),
Domain of the Relative Market (DRM), International Orientation of the brand
(IOB), Corporate Brand Strength (CBS) and the Discounted Cash Flow (DCF).
Out of the parameters for evaluating the Corporate Brand Equity, the most critical
factor is the Corporate Brand Strength, as this is the only factor which is
evaluated by the consumers. This is the only element among the other four which
provides explicit perception of the brand in the eyes of consumers.
Corporate Brand strength is further measured on 4 parameters: Brand
Awareness, Brand Identity, Brand Positioning, Perceived Quality (Yoo &
Donhthu, Washburn & Plank 2002).
Parent Brand & its Extension Characteristics
In this research the Parent Brand is considered to be the Corporate Brand. For
evaluating the Parent Brand characteristics as well as the Parent brand
extension characteristics, an exclusive use of Aaker and Keller (1990) Model of
Attitude towards brand extension is taken into consideration. This model is
further modified in the current study.

75
Attitude Towards Brand Extension Model (Original)
Aaker and Keller (1990) hypothesized that “the consumer’s attitude towards the
brand extension is a positive function of the quality of parent brand, the fit
between the parent’s brand category and the extension category (measured in
terms of the transferability of skills and expertise from one category to the other
and the complementarily and substitutability of one category and the other), the
interactions of quality with three fit variables, and the degree of difficulty in
designing and making a product in the extension category” (Bottomley & Holden,
2001)
Y= α + β1 Q+ β2 T+ β3 C+ β4 S+ β5 QT+ β6 QC+ β7 QS+ β8 D+ ε
Attitude Towards Brand Extension Model (Current Model)
The original model is modified in the current context. First, the variable
KNOWLEDGE has been added. Second, independent variables SUBSTITUTE
and COMPLEMENT are omitted and have been replaced by the new variable
BRAND CONCEPT CONSISTENCY (Adapted from Broniarczyk & Alba (1994)),
that if the brand association of the consumer brand extension are consistent with
brand concept of the parent brand, the attitude towards the brand extension is
positive. Third, three new independent variables have been added to the new
model they are; INNOVATIVENESS of the parent brand, CORPORATE ETHICS
& RESPONSIBILITY, and ENVIRONMENTAL CONCERN of the parent brand.

76
Thus in the current model of Attitude towards brand extension (ATBE) the
independent variables taken into consideration are Parent Brand
Knowledge, Innovativeness, Parent Brand Quality, Environmental concern,
Transfer, Brand Concept Consistency, Difficulty to produce, and Corporate
Ethics and Responsibility whereas Attitude towards brand extension is the
dependent variable .
Thus the current model for the Attitude towards Brand Extension is as follows:
Y = α + β1 K +β2 Q + β3 I + β4 C + β5 E + β6 T + β7 BCC + β8 D + ε
Where, Dependant Variable: Y = Attitude towards brand extension
Independent variables: K = Parent Brand Knowledge, I = Innovativeness, Q =
Parent Brand Quality, E = Environmental concern, T = Transfer, BCC = Brand
Concept Consistency, D = Difficulty to produce, C = CE&R, ε = Error term
The Independent variables include Parent brand as well as brand extension
characteristics which are as follows:
Parent brand characteristics (variables): K = Parent Brand Knowledge, I =
Innovativeness, Q = Parent Brand Quality, E = Environmental concern, C =
CE&R
And, Brand extension characteristics (variables): T = Transfer, BCC = Brand
Concept Consistency, D = Difficulty to produce.
77
Attitude Towards Brand Extension (ATBE) score for new product
categories (hypothetical extensions)
The Attitude towards Brand Extension (ATBE) score for new product categories
i.e.; hypothetical extensions is subsequently evaluated from the current model.
Attitude towards products of the CB:
Attitude towards the current products of the CB is evaluated with the help of the
same model as mentioned above. The products are subsequently ranked in a
descending order of sequence. An attitudinal range is established for the current
products along with its respective cutoff. The above mentioned ATBE score for
the respective new product category (hypothetical extension) is compared with
the attitudinal range of the current products. if it is below the respective cut offs or
beyond the range, reject the Hypothetical extension or else accept it.
Product Brand Equity (PBE) scores for CB’s products:
All the current products of the CB are taken into consideration. The four
parameters to measure product brand equity are viz; Awareness, Perceived
Quality, Image Association and Brand Loyalty.
Awareness level is tested with Unaided recall for CB’s products as well as
product recognition for its products whereas Image Association is tested on the
item scales such as; Make a person feel proud, increase the respect of the user,
are admired by friends and relatives, gives me pleasure, makes me feel that this
CB cares for me etc.
78
Perceived Quality level is tested with items such as: Perform as expected, offer
value for price, are functionable, are reliable, have technological sophistication
whereas Loyalty level was tested with items such as frequency of purchase,
repurchase, product switching, love to recommend, will go an extra mile.
Subsequently establish a Product brand equity range for the Corporate brand
(CB).
Relationship between Attitude towards Products and Product Brand Equity
of the CB and its subsequent impact on Hypothetical Extensions
A relationship is established between the Attitude scores of all the products of the
CB and their respective Product brand Equity scores to figure out whether the
relationship is positive or negative. If the relationship is positive, it indicates that
higher the attitude scores, higher the brand equity scores, similarly higher the
attitudinal range of the product’s of the CB brand, higher the product brand equity
range. For any CB which follows a Umbrella branding type of an architecture,
higher the product brand equity range indicates that the individual product brand
equity is higher than the Umbrella brand equity, which further indicates that the
Corporate brand presence/strength over the individual products is getting beyond
control, i.e. the CB is getting diluted. Thus the Corporate Brand Strength, which
is the core essence of the CB is weakening. As mentioned earlier during the
analysis of the Corporate Brand strength, it shows similar properties as that of
the parent brand characteristics in the attitude towards brand extension model. It
is also known that CBS is directly linked to the Corporate Brand Equity, thus the
new product category which tries to establish a relationship with the CB, falls
79
beyond the cut off or the range of the attitudinal scores, it would increase the
attitudinal range of the CB subsequently increasing the Product Brand equity
range of the CB products, thus diluting the essence of the CB thus affecting the
CBS, subsequently affecting the Corporate Brand Equity.
4.2 Primary and Secondary Research
A primary research in the form of survey and focus group has been conducted
taking LG as a Corporate Brand into consideration. In Part One of the research
design Focus Group has been used to understand the Corporate brand
associations of the CB in the form of Brand Concept Mapping (BCM), whereas a
survey has been conducted in the Part Two of the research design to evaluate
the attitude towards the brand, the extension parameters, and various other
parameters like attitude and product brand equity as mentioned in the research
methodology chapter, with the help of Questionnaire as a Data Collection tool.
Secondary market research refers to any data gathered for one purpose by one
party and then put to a second use by or made to serve the purpose of a second
party. Secondary market research is thus the broadest and most diffuse tool
within the toolbox, because it includes virtually any information that can be
reused within a market research context. Secondary research is also the closest
thing to an all-purpose market research tool, because virtually every project
makes some use of secondary data and almost any decision stage may
incorporate some kind of secondary research. As a general rule, relatively

80
speaking secondary research also is the cheapest and quickest form of market
research.
The secondary research has been conducted with respect to the data collected
from the Consumer Electronics and Appliances Manufacturer’s Association
(CEAMA) regarding the growth and the status of the Consumer Electronics and
Home Appliances sector. Consumer classification study has been collected from
National Council for Applied Economic Research (NCAER), India’s premier
economic institution. Data has also been collected from Ernst & Young and
Technopark Analysts regarding the Indian Consumer Durable sector and the
Indian consumer trend respectively. Data regarding LG Electronics India has
been sourced from the company’s corporate website.
4.3 Sampling Design & Demographics
Youth being a majority of the population in the metros are taken into
consideration as respondents. With the kind of lifestyle which an average Indian
metro youth dwells, she/he is heavily exposed to numerous brands and their
respective promotions through various media channels. These age groups are
also techno savvy and fall in the early phase of the consumer diffusion curve with
respect Consumer electronics products.
For the study, a significant sample size of 800 respondents in total is taken into
consideration across the prime metros viz; Mumbai, Delhi, Kolkata and
Bangalore, which has the potentiality of maximum youth population. An even
81
distribution of 200 respondents is chosen from each prime metro. The sampling
technique used for the survey is a Convenience sampling technique. This
technique is used since the respondents are readily available and not much effort
or filtration is required to choose respondents.
An equal distribution of 50 respondents is taken for each age group of 21-36
across each metro so as to bring uniformity, as the media exposure in case of
consumer electronics and home appliances is uniformly spread across the age
group. Similarly an equal distribution of 50 respondents is taken for each income
bracket for each metro, as with the kind of purchasing power significantly
increasing amongst the youth with better education and lifestyle, and more
importantly the price range of consumer electronics products in market with year
round promotions and discount offers there is hardly any significant difference
one may find within the income bracket. The income bracket has an categorical
option starting from 2.1 L, since LG is a premium brand and purchase of such
brands excepts a minimum income of atleast 2L and above. From Table no. the
Gender variable taken into consideration is with respect to the decision making
authority for the purchase of the consumer durable product. A significant ratio of
Male to Female is taken into consideration across the four metros. Occupation
profiles of the respondents has also been considered as a demographic variable,
where in the occupation profiles are broadly classified into Service Employees,
Professionals, and Entrepreneurs. Considering majority of the population to be
Service Employees, a large portion of the sample are taken to be service going
individuals whereas professional individuals include Doctors, Architects, CAs etc.
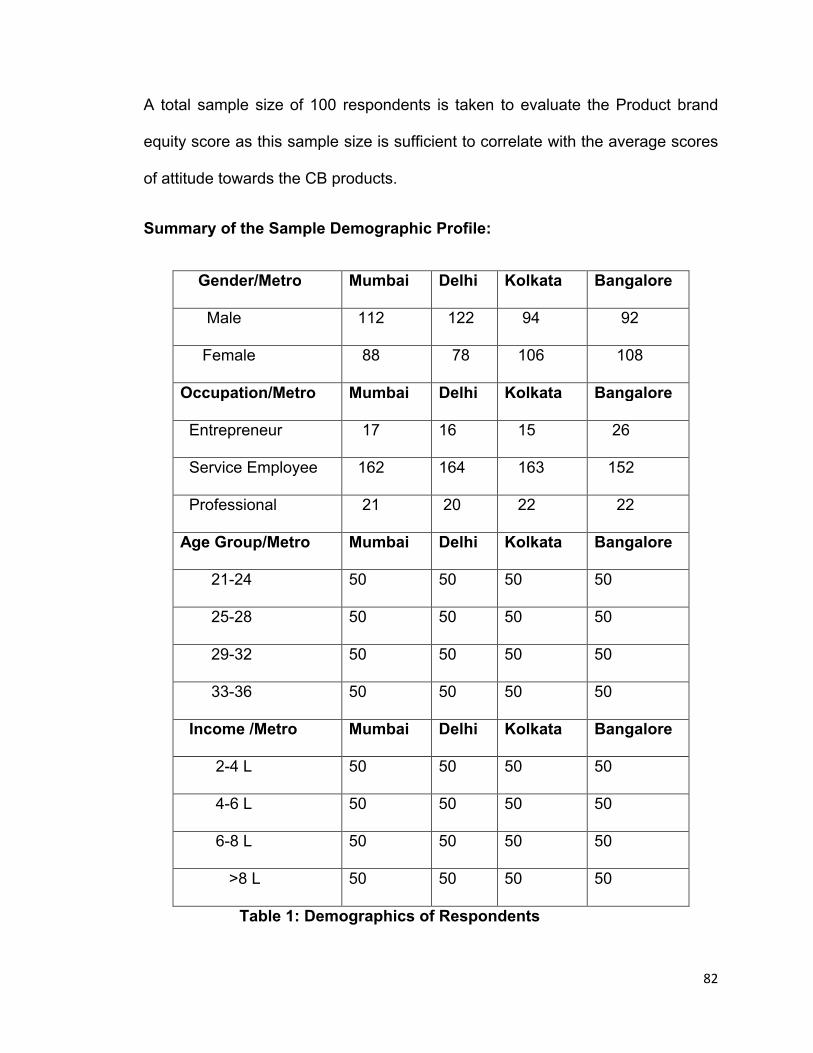
82
A total sample size of 100 respondents is taken to evaluate the Product brand
equity score as this sample size is sufficient to correlate with the average scores
of attitude towards the CB products.
Summary of the Sample Demographic Profile:
Table 1: Demographics of Respondents
Gender/Metro Mumbai Delhi Kolkata Bangalore
Male 112 122 94 92
Female 88 78 106 108
Occupation/Metro Mumbai Delhi Kolkata Bangalore
Entrepreneur 17 16 15 26
Service Employee 162 164 163 152
Professional 21 20 22 22
Age Group/Metro Mumbai Delhi Kolkata Bangalore
21-24 50 50 50 50
25-28 50 50 50 50
29-32 50 50 50 50
33-36 50 50 50 50
Income /Metro Mumbai Delhi Kolkata Bangalore
2-4 L 50 50 50 50
4-6 L 50 50 50 50
6-8 L 50 50 50 50
>8 L 50 50 50 50
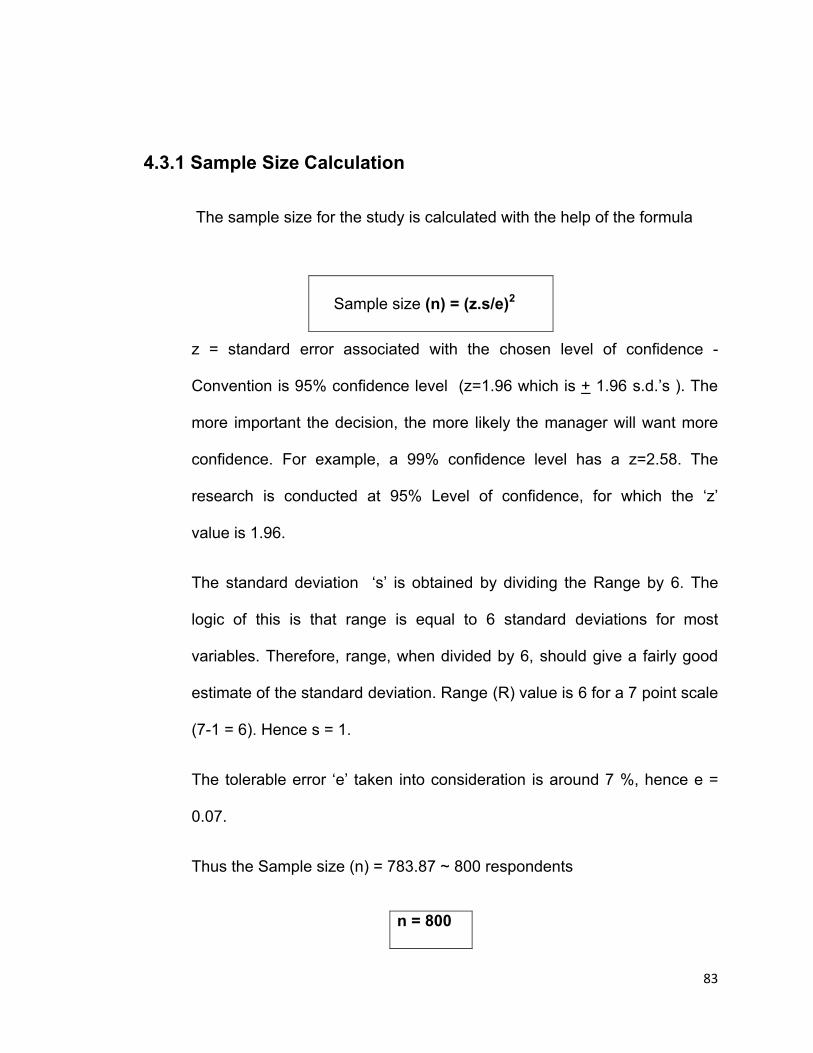
83
4.3.1 Sample Size Calculation
The sample size for the study is calculated with the help of the formula
z = standard error associated with the chosen level of confidence -
Convention is 95% confidence level (z=1.96 which is + 1.96 s.d.’s ). The
more important the decision, the more likely the manager will want more
confidence. For example, a 99% confidence level has a z=2.58. The
research is conducted at 95% Level of confidence, for which the ‘z’
value is 1.96.
The standard deviation ‘s’ is obtained by dividing the Range by 6. The
logic of this is that range is equal to 6 standard deviations for most
variables. Therefore, range, when divided by 6, should give a fairly good
estimate of the standard deviation. Range (R) value is 6 for a 7 point scale
(7-1 = 6). Hence s = 1.
The tolerable error ‘e’ taken into consideration is around 7 %, hence e =
0.07.
Thus the Sample size (n) = 783.87 ~ 800 respondents
Sample size (n) = (z.s/e)2
n = 800

84
4.4. Data Collection Tool
In Part One of the research design the data collection tool has been Focus Group
whereas in Part Two, Questionnaire has been used as a data collection tool.
4.4.1 Focus Group Technique
Focus Group (FG) has been conducted once the set of associations for the
Corporate brand (LG in this case), in form of brand concept map is constructed.
The respondents for the focus group have been primarily youth with the age
group of 18-39. The group has been heterogeneous, with a varied demographic
profile to ensure that the views are divergent in nature. The FG is conducted at a
neutral ground. Before the commencement of the FG the respondents are given
a brief about the way it should be conducted and the purpose of the discussion.
A group of 10 respondents have been used in the FG.
New product categories which are to be associated with the core association of
the corporate brand are brought forward to the respondents. The respondents
are advised to write down all the attributes they would be looking forward while
purchasing such products. These attributes are listed down and are ranked for
individual hypothetical extension or the new product category. With the help of
the above mentioned set of core associations of the CB, an attribute association
matching has been conducted.
85
4.4.2 Questionnaire Design
The Questionnaire is an essential data collection tool in the Part two of the
Research Design. The entire Questionnaire design is divided into four parts. The
four parts are viz; Questionnaire for i) Evaluation of Corporate Brand Strength ii)
Parent (Corporate) Brand Evaluation & evaluation of the parent brand extensions
to hypothetical product extensions, iii) Attitude towards all the LG products
evaluation as well as iv) Evaluation of product brand equity scores for all the LG
products.
The Parent Brand Evaluation consists of evaluating LG on the basis of
parameters like Parent Brand Knowledge, Parent Brand Quality, Innovativeness,
Concern for the environment and Corporate ethics and responsibility, whereas,
Corporate Brand Awareness, Perceived Quality of the Corporate Brand,
Corporate Brand Identity, and Corporate Brand Positioning, helps us to
understand the Corporate Brand Strength. Evaluation of parent brand extensions
to hypothetical product categories consists of evaluating variables such as
Transfer, Brand Concept Consistency, and Difficulty to produce. All the item
scales for the respective variables are scaled on a 7 point Likert scale. A
significant reliability is achieved for their respective item scales.
The questionnaire for product attitude measurement is with respect to
parameters such as overall perception of the brand extension, competency,
difficulty, consistency, association fit, capability, whereas the contents in the
product brand equity questionnaire is with respect to four parameters viz; product
86
brand knowledge, perceived quality, product brand loyalty and product brand
image association.
Scaling and Multi-item scales
The Likert scale is a widely used rating scale that requires the respondents to
indicate a degree of agreement or disagreement with each of a series of
statements about the stimulus objects (Albaum, 1997; Brody & Dietz, 1997;
Likert, 1932). The advantages of Likert-type scales are that they are easy to
construct and administer, and respondents are familiar about how to use them.
This makes Likert-type scales suitable for Internet surveys, mail, telephone or
personal interviews. A major disadvantage is that it takes longer to complete
Likert-type scales than other itemized rating scales because the respondents
have to read and fully reflect upon each statement (Malhotra and Birks, 2003).
To assess the overall quality (QUALITY) of each parent brand as well as each
brand extension, a 7-point Likert scale was used (1 = poor, 7 = outstanding). A
second 7point scale measure assessed the attributes of the parent brand (INN
OVATIVE, CORPORATE ETHICS & RESPONSIBILITY (CE&R) and
ENVIRONMENTAL CONCERN) where (1 = not at all, 7 = very). A third 7-point
scale measured the three fit variables (TRANSFER, BRAND CONCEPT
CONSISTENCY, and DIFFICULT) where (1= totally disagree, and 7= totally
agree). A fourth 7-point scale measured the familiarity about the parent brand
(KNOWLEDGE) where (1 = not at all, and 7 = very).
In Likert-type scales, the neutral points (4) can be considered to be natural
origins. As in the original Aaker and Keller (1990) model and consequent
87
replication studies, the measured ordinal scales can be interpreted as interval
scales. This allows for using multiple regression as an analytical method.
Multiple-item rating scales are often use in social sciences research to measure
abstract constructs (Aaker et al., 1998). By having several items that measure
the same so-called construct, the problem of having single unrepresentative
questions is solved (ibid.). The greater the number of initial items generated, the
better will be the final scale. The larger the scale, the greater is the reliability, but
shorter scales are easier for respondents to answer. Hence, a balance between
brevity and reliability has to be struck to determine the optimal scale.
Multiple-item scales were developed for the variables INNOVATIVE, CE&R,
TRANSFER, BRAN D CONCEPT CONSISTENCY, and DIFFICULTY by means
of 7-point Likert scales. Several items relevant for each variable were generated
to form constructs. The multiple-item scales were evaluated in the pilot-testing of
the questionnaire, after which some items were rephrased for clarity and some
were omitted for brevity with respect to the final length of the questionnaire.
Multiple Item Scales
Item scales for parameters of Corporate Brand Strength:
Corporate Brand Strength (CBS): The Corporate brand strength is evaluated on
the following four parameters viz; Corporate Brand Awareness, Perceived Quality
of the Corporate Brand, Corporate Brand Identity and Corporate Brand
Positioning. Following were the item scales used for the following:
88
Corporate Perceived Quality
In general, LG makes an effort to design products to fit the needs of the
customer
Over the past several years, the quality of most products have improved
For me style changes is not as important as improvements in quality
LG do not deliberately design products which will wear out as quickly as
possible
I am satisfied with products which are produced by L.G
Competitive brands associate me to lower quality than this brand
The likelihood that I will try the new products of L.G is very high
Corporate Brand Identity
L.G. truly stands for “Life is Good”
L.G. makes a better living for all of us
L.G. improves the quality of our lives
L.G. represents a “delightfully smart” brand
Corporate Brand Positioning
Make a person feel proud
Increase the respect of its user
Targets premium segment of customers
Are admired by friends and relatives

89
Express my personality
Helps me demonstrate certain status
Gives me pleasure
Make me feel that LG cares for me
Make me feel that LG understands me
Item Scales for Parent Brand Characteristics (in ATBE Model) :
The Parent Brand Evaluation consists of evaluating LG on the basis of
parameters like Parent Brand Knowledge, Parent Brand Quality, Innovativeness,
Concern for the environment and Corporate ethics and responsibility. Following
were the item scales used for the following:
Parent Brand Knowledge:
I am familiar with LG as a Consumer Electronics and Home
Appliances manufacturer
I know most of the products of LG
I know how well the products of LG function like
I can recognize LG among other competitive brands in this sector
Some characteristics of LG has come to my mind quickly
I can quickly recall the tagline and logo attached to LG
I can quickly imagine this manufacturer in my mind
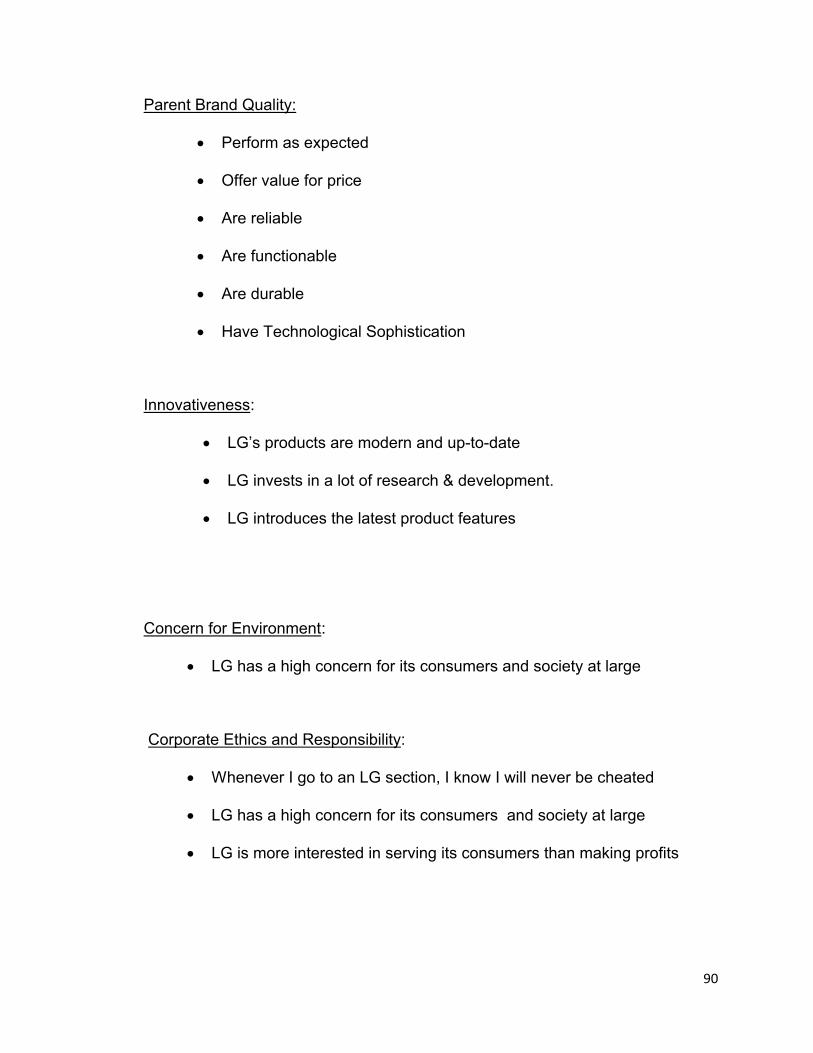
90
Parent Brand Quality:
Perform as expected
Offer value for price
Are reliable
Are functionable
Are durable
Have Technological Sophistication
Innovativeness:
LG’s products are modern and up-to-date
LG invests in a lot of research & development.
LG introduces the latest product features
Concern for Environment:
LG has a high concern for its consumers and society at large
Corporate Ethics and Responsibility:
Whenever I go to an LG section, I know I will never be cheated
LG has a high concern for its consumers and society at large
LG is more interested in serving its consumers than making profits

91
Item Scales for Parent Brand Extension Characteristics (in ATBE Model) :
Item Scales for Transfer:
L.G has the competency to make this product
L.G. has adequate capability to manufacture this new product
Item Scales for Difficulty:
This new product is difficult to make for L.G
Item Scales for Brand Concept Consistency:
This new product is consistent with the LG image
This new product is “delightfully smart”
This new product fits my association with LG brand.
4.5 Pilot-testing
Pilot-testing can be used to test the questionnaire on a small sample of
respondents to identify and eliminate potential problems (Martin & Polivka, 1995).
In social science research, it is advisable to take part in some observation and as
such the researcher has undertaken some sort of preliminary survey or what is
often called pilot survey. (Kothari 2005).

92
Purpose of the Pilot Study:
A paper version of the questionnaire with open-ended and close ended questions
concerning
1. To identify the questions which very difficult to comprehend and based on the
feedback make changes.
2. For checking the reliability of the questionnaire
3. For finding the validity of the questionnaire
4. Question content, wording, sequence, form and layout,
Instructions were handed out to fifty respondents in the city of Mumbai,
predominantly youth. The demographics of the respondents of the pilot-test were
similar to those who were included in the subsequent survey, i.e. they were
drawn from the same population. Some changes were made to the first version
of the questionnaire, including some questions were rephrased for sake of clarity.
Based on the objective of the pilot the data was collected from total of 800
respondents. The reliability of the instrument was checked by Cronbach Alpha
Validity & Reliability
Validity is the property by which a questionnaire measures what it is supposed to
measure. If we want to measure attitudes towards brands in terms of service and
product features, then that is what the critical questions in the questionnaire
should measure. The validity of questions on a questionnaire is measures.
According to Kerlinger (1973), ‘validity refers to the extent to which an empirical
measure adequately reflects the real meaning of the concept under
consideration’
93
It is very important to measure the validity of the instrument. There are several
types of validity and the researcher may have to try to prove validity of his
construct through various methods:
1. Content Validity: In measuring content validity both theory and the measuring
instrument are considered. The adequacy of an instrument can be tested either
through convergent validity or discrimination validity. Convergent validity involves
correlating the results of the present study with pre existing validating scales. In
their absence or they have not been used, the construct validity of a measure is
shown by showing that it relates to other variables to which it should be related
(Cambell and Friske, 1956; Green and Tull, 1980). Internal consistency therefore
is a good test for content validity.
2. Criterion validity: Criterion validity reflects the success of measures used for
prediction or estimation Cooper and Schindler (2003) suggest that any criterion
measure must be judged in terms of four quantities 1. Relevance 2. Freedom
from bias 3. Reliability and 4. Availability. A criterion is relevant if it is defined and
scored in terms we judge to be a proper measure. Freedom from basis is
attained when the criterion gives each respondent an equal opportunity. A
reliable criteria is stable or reproducible. Finally, information specified by the
criterion should be available. After these were ensured, the criterion validity is
established by the ability to predict the summed or averaged behaviour of large
number of individuals.
3. Construct validity: It is most important type of validity that is the strongest
evidence that the measurement is appropriate. The major reason is that there is
94
a strong link between theory and empirical measurement that the validate that
the measurement are appropriate. The major reason is that there is a strong link
between theory and empirical measurement that the validity seeks to establish.
Testing of hypothesis can be followed up or a part of proving construct validity.
The hypothesis can be tested by discriminate validity or by convergent validity.
Reliability
The use of this word is very often used in our lives. It is referred in terms of
dependable, consistence, predictable, stable and honest. In research reliability is
the property by which consistent results are achieved when we repeat the
measurement of something. A questionnaire used on a similar population that
produces similar result can be termed as reliable. Consistency of form and
manner of asking questions (their exact wording, the amount of structuring etc)
generally ensures reliability. Mainly reliability is a measure of how a scale can be
relied on to produce similar measurements every time we use the scale. Mainly
reliability is a measure of how a scale can be relied on to produce similar
measurements every time we use the scale.
Reliability for this study is by means of Cronbach’s alpha: It is the most common
form of internal consistency reliability coefficient Cronbach’s alpha is a lower
bound for the true reliability of the survey. Alpha equals zero when the true score
is not measured at all and there is only an error component. Alpha equals 1.0
when all items measure only the true score and there is no error component. The
computation of Cronbach’s alpha is based on the number of items on the survey
and the ratio of the average inter item covariance to the average item variance.
95
(Cooper and Schindler, 2006 ; Bryman and Bell 2008). A significant reliability is
achieved in the analysis of the pilot test, which is further utilized on a large scale
across the four metros.
4.6. Survey
As discussed initially a pilot study was conducted in the city of Mumbai with a
sample size of 50 respondents to check out the quality of the questionnaire. A
significant reliability was achieved at the analysis of the pilot test. This was
followed by a survey conducted at major metropolitan cities viz; Mumbai, Delhi,
Kolkata, Bangalore with a sample size of 200 respondents each. The
demographics in this survey was already mentioned in the Sampling design
section. The descriptive statistics of no. of respondents in each demographic
profile in each city is shown at the data analysis.

96
CHAPTER 5
Consumer Electronics and Home Appliances(CEHA) Industry

97
CHAPTER 5
Consumer Electronics and Home Appliances (CEHA) Industry
5.1 Overview of India’s Consumer Durables Market
India’s consumer market is riding the crest of the country’s economic boom. Driven
by a young population with access to disposable incomes and easy finance
options, the consumer market has been throwing up staggering figures. The Indian
durables market, with a market size of US$ 27.38 billion in 2008–09, has grown by
7.1% over the previous year.
India officially classifies its population in five groups, based on annual household
income based on year (1995-96 indices). These groups are: Lower Income; three
subgroups of Middle Income; and Higher Income. Household income in the top 20
boom cities in India is projected to grow at 10 per cent annually over the next eight
years, which is likely to increase consumer spending on durables. With the
emergence of concepts such as quick and easy loan, zero equated monthly
installment (EMI) charges, loan through credit card, loan over phone, it has
become easy for Indian consumers to afford more expensive consumer goods.

98
Figure 2: Indian Consumer Durable Industry Segment
Source: Electronics and Appliances Manufacturing- the India opportunity, Ernst
&Young, 2009
5.2 Indian Consumer Class
Even discounting the purchase power parity factor, income classifications do not
serve as an effective indicator of ownership and consumption trends in the
economy. Accordingly, the National Council for Applied Economic Research
(NCAER), India’s premier economic research institution, has released an
alternative classification system based on consumption indicators, which is more
relevant for ascertaining consumption patterns of various classes of goods.

99
There are five classes of consumer households, ranging from the destitute to the
highly affluent, which differ considerably in their consumption behavior and
ownership patterns across various categories of goods. These classes exist in
urban as well as rural households both, and consumption trends may differ
significantly between similar income households in urban and rural areas.
The rapid economic growth is increasing and enhancing employment and
business opportunities and in turn increasing disposable incomes. Middle class,
defined as households with disposable incomes from Rs 200,000 to 1,000,000 a
year comprises about 50 million people, roughly 5% of the population at present.
By 2025 the size of middle class will increase to about 583 million people, or 41%
of the population. Extreme rural poverty has declined from 94% in 1985 to 61% in
2005 and is projected to drop to 26% by 2025.
Affluent class, defined as earnings above Rs 1,000,000 a year will increase from
0.2% of the population at present to 2% of the population by 2025. Affluent
class’s share of national private consumption will increase from 7% at present to
20% in 2025.
Out of the consumer durable industry, the Consumer Electronics and Home
Appliances, CEHA segment is one of the biggest markets. The consumer
electronics industry comprises of communication devices, computing devices,
audio, video and gaming products. Whereas products such as Refrigerators,
Washing Machines, Air conditioners, Microwave ovens etc.. fall into the Home
appliances category.
100
5.3 Historical Overview of the Indian Electronic Industry
According to ELCINA, Electronic Industries Association of India (Formerly
Electronic Component Industries Association), the Electronics Industry in India
took off around 1965 with an orientation towards space and defense
technologies. This was rigidly controlled and initiated by the government. This
was followed by developments in consumer electronics mainly with transistor
radios, Black & White TV, Calculators and other audio products. Colour
Televisions soon followed. In 1982-a significant year in the history of television in
India - the government allowed thousands of colour TV sets to be imported into
the country to coincide with the broadcast of Asian Games in New Delhi. 1985
saw the advent of Computers and Telephone exchanges, which were succeeded
by Digital Exchanges in 1988. The period between 1984 and 1990 was the
golden period for electronics during which the industry witnessed continuous and
rapid growth.
From 1991 onwards, there was first an economic crises triggered by the Gulf War
which was followed by political and economic uncertainties within the country.
Pressure on the electronics industry remained though growth and developments
have continued with digitalisation in all sectors, and more recently the trend
towards convergence of technologies. After the software boom in mid 1990s
India's focus shifted to software. While the hardware sector was treated with
indifference by successive governments. Moreover the steep fall in custom tariffs
made the hardware sector suddenly vulnerable to international competition. In

101
1997 the ITA agreement was signed at the WTO where India committed itself to
total elimination of all customs duties on IT hardware by 2005. In the subsequent
years, a number of companies turned sick and had to be closed down.
At the same time companies like Moser Baer, Samtel Colour, Celetronix etc.
have made a mark globally.’
5.4 Growth of Consumer Electronics Production in India
The biggest attraction for MNCs is the growing Indian middle class. This market
is characterized with low penetration levels. MNCs hold an edge over their Indian
counterparts in terms of superior technology combined with a steady flow of
capital, while domestic companies compete on the basis of their well-
acknowledged brands, an extensive distribution network and an insight in local
market conditions.
One of the critical factors those influences durable demand is the government
spending on infrastructure, especially the rural electrification programme. Given
the government's inclination to cut back spending, rural electrification
programmes have always lagged behind schedule. This has not favoured
durable companies till now. Any incremental spending in infrastructure and
electrification programmes could spur growth of the industry.
The digital revolution is shaking up the consumer durables industry. With the
advent of MP3 music files, personal video recorders, game machines, digital
cameras, appliances with embedded devices, and a host of other media and
102
services, it is no longer clear who controls which part of home entertainment.
This has set off a battle for dominance, and the shakeup is spanning the entire
technology spectrum.
Microsoft Corp. is spending billions on entertainment initiatives such as its Xbox
video game console. Compaq and HP sell MP3 music players that plug into
home-stereo systems. Apple Computer is positioning its new iMac as a digital-
entertainment device. Sony is building Vaio computers that focus on integrating
multimedia applications.
Philips sells stereos that hook into a high-speed Internet connection to play
music from the Web. More startups are trying to carve out profitable niches in
digital music, video, and home networking. The industry is witnessing a number
of strategic alliances, to develop a range of capabilities - electronic hardware,
software and entertainment content.
As more consumers grow comfortable with technology, companies need to build
simpler devices that offer more entertainment and convenience. These new
machines need to work together readily, and should be as easy to set up and use
as a telephone or a television. Consumerization of technology could be a major
phenomenon over the next 5 to 10 years. This could hasten industry
consolidation, as healthy companies gain market share by buying out weaker
ones at attractive prices.
Apart from steady income gains, consumer financing has become a major driver
in the consumer durables industry. In the case of more expensive consumer
103
goods, such as LEDs/ LCDs, Colour televisions and personal computers,
retailers are joining forces with banks and finance companies to market their
goods more aggressively. Among department stores, other factors that will
support rising sales include a strong emphasis on retail technology, loyalty
schemes, private labels and the subletting of floor space in larger stores to
smaller retailers selling a variety of products and services, such as music and
coffee.
Rising disposable income and declining prices of durables have resulted in
increased volumes. An increase in disposable income is aided by an increase n
the number of both double-income and nuclear families. Production in the
consumer electronics industry has been estimated at US$ 6.7 billion in 2009–
2010. The segment registered a growth of 18 per cent in 2009–2010 from US$
5.5 billion in the previous year. The consumer electronics segment contributes
about 27 per cent to the total hardware production in the country.
Value growth of consumer electronics is expected to be higher than historical
levels as price declines for most of the products are not expected to be very
significant. Though price declines will continue, it will cease to be the primary
demand driver. Instead the continuing strength of income demographics will
support volume growth.
5.5 Home Appliances Sector
According to the CII (Confederation of Indian Industries) Home Appliances
Division the market for various Home Appliances will continue to grow right

104
through to 2015. The air conditioners market for example is set to grow at a
steady 10 per cent upto 2015. Washing machines are also expected to log in a
steady 9 per cent growth upto 2015, while microwaves are expected to grow the
fastest at 15.30 per cent upto 2009-2010 and then slow down to 12.5 per cent
upto 2015. Vacuum cleaners have not been a hot favourite amongst the Indian
buyer and is expected to grow at 7.6 per cent.
According to CII, white goods market in India is pegged at around Rs 80 billion
(inclusive of the unorganized segment). The refrigerator market has the
maximum share being valued at over Rs 37 billon, close on the heels is the air
conditioners market at Rs 35 billion. Washing machines have a comparatively
smaller share at Rs 7-8 billion. In volume terms the refrigerator market is
estimated at 3.0 million, washing machines at 1.4 million and air conditioners at
0.96 million.
The CII Home Appliances division has been tracking the geographical trends of
the home appliances market. According to them a closer look at the geographical
trends reveal that North India accounts for 36 to 46 per cent of the home
appliances market depending on which product we are talking about. For
example North India controls 36 per cent of the refrigerator market and 46 per
cent of washing machines market. The North Indian consumer is the biggest
buyer in every category followed by the West.
The home appliances consumer is spoilt for choice in every category of the
home appliances products. With companies such as Godrej planning to launch at

105
least one new innovation every quarter and the housewife stretching her budget
to buy the best possible product, there is ample room for new models to enter the
market.
Sensing the immense opportunities 5,200 crore segment is throwing up, many
global players are now heading towards the Indian market with their own treat for
their Indian consumers.
The home appliances market in India is currently dominated by foreign brands.
Korean brands, followed by American brands like Whirlpool, have replaced once
popular Indian names like Onida, BPL, Voltas, Kelvinator and Godrej as brand
leaders. Korean brands has performed much better on the score of offering value
for money products, and this has earned them confidence of Indian consumers.
According to Technopark Analysis 2010, for 3 consecutive years, India has
ranked first out of 30 emerging retail markets in the world’s most attractive
investment country. This propelled the Chinese home appliance enterprises to
develop markets in India and the latter soon became an important trading partner
for it.
Furthermore, according to the Technopark Analysis report, Indian appliance
producers have failed to focus on harnessing the power of their brands by
targeting smaller town markets and lower price points. Small town customers
today are equally bitten by the consumerism bug and global players have
successfully banked on this opportunity to drive penetration of their products into
these untapped areas.

106
5.6 India’s Consumer Electronics & Home Appliances (CEHA)
Market
India’s Consumer Electronics & Home Appliances market, CEHA, is riding the
crest of the country’s economic boom. According to the Consumer Electronics
and Appliances Manufacturer’ s Association (CEAMA), the industry is pegged
at Rs. 35,000 crore, is poised to grow at 15 percent in 2011 against 13
percent in 2010.
Due to a greater affordability, changing lifestyle, and boom in sectors like
housing and real estate as well as the evolution in commercial advertising,
the industry has experienced substantial changes in the last few years. With
access to disposable incomes and easy finance options and a young driven
population, the consumer market has been throwing up staggering figures.
According to CEAMA, the Indian consumer electronics market alone stood at an
estimated US$ 5 Billion as of the end of 2009, and is further projected to grow at
a CAGR of around 15% during our forecast period (2010-2013). Based on annual
household income (based on year 1995-96 indices), India officially classifies its
population in five groups, these groups are: Lower Income; three subgroups of
Middle Income; and Higher Income. Household income in the top 20 boom cities in
India is projected to grow at 10 per cent annually over the next eight years
according to CEAMA, which is likely to increase consumer spending on durables.
With the emergence of concepts such as quick and easy loan, zero equated
monthly installment (EMI) charges, loan through credit card, loan over phone, it
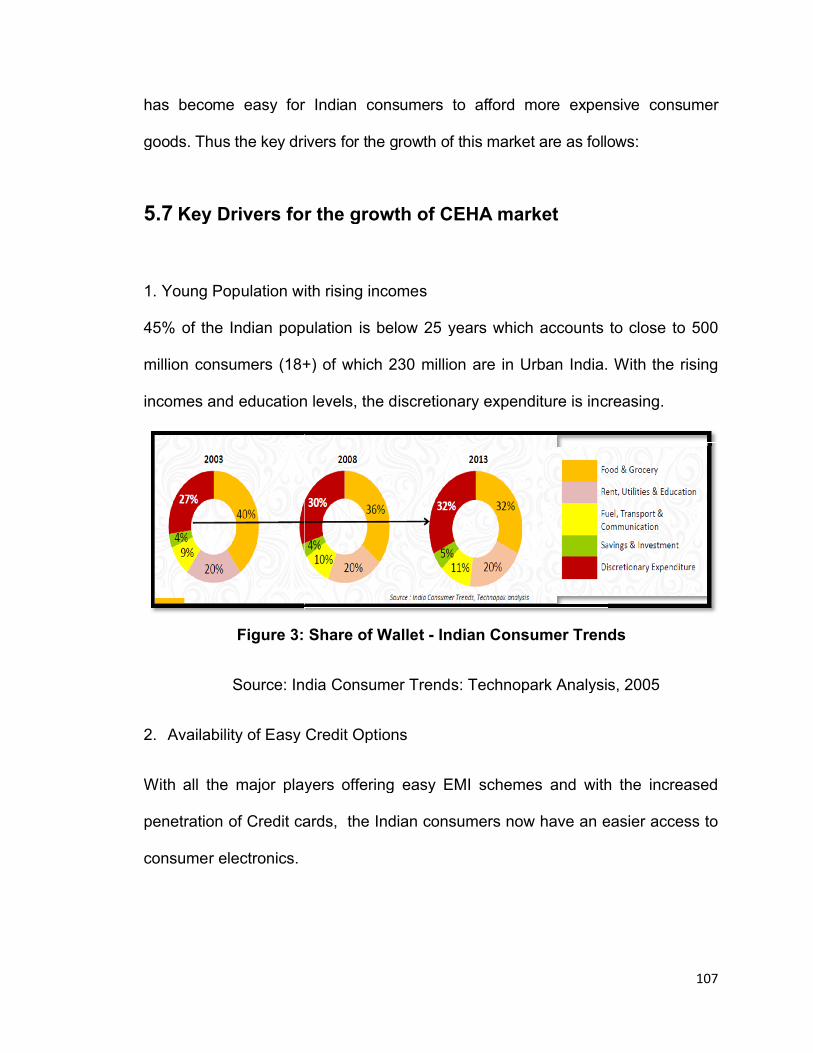
has become easy for Indian consumers to afford
goods. Thus the key drivers for the growth of this market are as follows:
5.7 Key Drivers for the growth of CEHA market
1. Young Population with rising incomes
45% of the Indian population is below 25 years which accounts to close to
million consumers (18+) of which 230 million are in Urban India. With the rising
incomes and education levels, the discretionary expenditure is increasing.
Figure 3: Share of Wallet
Source: India Consumer Trends: Technopark Analysis, 2005
2. Availability of Easy Credit Options
With all the major players offering easy EMI schemes and with the increased
penetration of Credit cards, the Indian consumers now have an easier access to
consumer electronics.
has become easy for Indian consumers to afford more expensive consumer
goods. Thus the key drivers for the growth of this market are as follows:
Key Drivers for the growth of CEHA market
Young Population with rising incomes
45% of the Indian population is below 25 years which accounts to close to
million consumers (18+) of which 230 million are in Urban India. With the rising
incomes and education levels, the discretionary expenditure is increasing.
: Share of Wallet - Indian Consumer Trends
Source: India Consumer Trends: Technopark Analysis, 2005
Availability of Easy Credit Options
With all the major players offering easy EMI schemes and with the increased
penetration of Credit cards, the Indian consumers now have an easier access to
107
more expensive consumer
goods. Thus the key drivers for the growth of this market are as follows:
45% of the Indian population is below 25 years which accounts to close to 500
million consumers (18+) of which 230 million are in Urban India. With the rising
incomes and education levels, the discretionary expenditure is increasing.
Indian Consumer Trends
Source: India Consumer Trends: Technopark Analysis, 2005
With all the major players offering easy EMI schemes and with the increased
penetration of Credit cards, the Indian consumers now have an easier access to

108
3. Changing Consumption Patterns
Gone are the times when people bought electronics with the intension of using it
for years together. With increasing speed of innovations and as new technologies
come in, the Indian consumer wants the latest and the best. Now mobile phones
are changed every year, laptops once in 2 years ,etc. People want to be trendy
and are becoming gizmo frenzy.
4. Falling Prices of Consumer Electronics
With new models, products and more competition, prices are being driven even
further down. Especially in the mobile phone segment, prices fall as much 20%
after 6 months after introduction.
5. Price Wars
With the increase in price wars due to the entry of new players in the market and
increase in manufacturing capacity by some original manufacturers, the
profitability and margins of the companies are adversely affected. Hence
companies need to increase focus on product / store differentiation to address
various segmental specific needs.
6. Lack of Distribution Networks and Logistics Management
Getting stock into a store in India is a massive challenge given the poor city
roads and complex intra city transportation regulations , high cost of moving
goods between starts, inefficient storage ( e.g. small store backrooms owing to
expensive real estate). It is of utmost importance to design an efficient network.
109
Transportation, including railway systems, highways has to meet global
standards. Airport capacities, power supply, warehouse facilities and timely
distribution are other areas which need to be enhanced. The distribution network
is also highly fragmented and is very poor in semi-urban and rural areas.
7. Presence of Gray Market in Consumer Electronics
Presence of gray market in consumer electronics products, especially in DVD
player, music players is definitely eating into the sales of the retailers. Counterfeit
products are present across a wide range of products.
8. Increasing Awareness of the Indian Consumers
With the increase in access to Internet information, and availability of wide range
of choices, consumers have become quite smart. They want the product that is
easy-to-handle, good in quality and low in price. Most importantly, consumers
want some guarantee for the product that they are buying.
The role of electronic companies doesn't end on the sale of the product, but
continues till the end of guarantee period.
9. Trained manpower shortage in India
There is lack of talent in consumer electronics retailing. Retailers need to spend
heavily on training its sales force to match the expectations of the Indian
consumers both in terms of technical knowledge and soft skills.

110
5.8 MNCs in CEHA Market with special reference to LG
India is one of the fastest-growing economies in the world with a GDP growth of
almost 8 percent. But despite the huge potential of the country, the performance
of Multinational Corporations (MNCs) in India has been potpourri. Many MNCs
which have succeeded remarkably elsewhere in the world have yet to make a
significant impact in India. At the same time, some MNCs have done pretty well
for themselves. The most successful MNCs in India have some common
characteristics. They have invested time and resources to understand local
consumers and business conditions. They have understood that the price points
that matter in India are different from those in other countries. In a country where
the middle and lower-end segments are critically important, affordability is a
crucial factor.
At the same time, some of the successful MNCs have also realized that price is
not the only factor driving purchase decisions. Value conscious consumers, will
pay a premium if the benefits of superior features and quality are seen too far
outweigh their cost. LG for example, has reengineered its TV product
specifications in order to develop three offerings specifically for India, including a
no-frills one to expand the market at the low end and a premium 21-inch flat TV
for the middle segment. By keeping the price of the premium offering to within 10
percent of the price of TVs with conventional screens, LG has persuaded many
consumers to buy it. These innovations have helped the company to establish a
very strong competitive position in the country's consumer durable-goods and
electronics appliances market.

111
Adhering to customer promise is important while competing in India which is one
of the key aspects of success. This is often reflected in the entry strategy.
Multinationals entering emerging markets often form joint ventures with local
partners for a variety of reasons. These include their ability to influence public
policy, to leverage existing products as well as marketing and sales capabilities,
and to comply with regulatory requirements when foreign participation is
restricted to less than 50 percent of a business. The second aspect of success is
the investments MNCs make in manufacturing facilities and other infrastructure
such as distribution. LG has not hesitated to pump in money. By early 2000, it
had invested almost $300 million with plans for investing another $100 million. In
recent times, LG has been increasing its production capacity in India, for most
products including colour televisions, washing machines, air conditioners,
microwave ovens and refrigerators.
A third aspect of success is the amount of time and effort spent on understanding
Indian consumers and then meeting their needs. LG has worked hard to
understand Indian customers and identify features which appeal to Indian
customers. LG televisions incorporate golden eye technology and multilingual on-
screen displays; refrigerators use 'preserve nutrition' technology and washing
machines the “chaos punch plus three” technology.
5.9 Corporate Brand Extensions in CEHA Industry
Corporate Brand Extension has been extensively practiced in both Consumer
Electronics as well as Home Appliances sector. Where in a Corporate brand’s

112
credibility and set of associations is stretched over new product categories. Many
of which have been able to leverage the advantage of the Corporate brand
depending on the Corporate Brand Strength, whereas few have failed in the
process. In India, Corporate Brand Extensions in consumer durable industry
have been fairly reasonable. With an Umbrella branding architecture, Consumer
durables giants like Samsung, LG, Philips, Videocon have put forward a strong
foothold in such type of brand architecture. There are successful brand extension
cases in the CEHA sector such as the famous Korean consumer electronics
manufacturer Samsung Electronics Co., a few years ago they used to produce
lower-end consumer electronics under a handful of unknown brands. But starting
from 2001, Samsung, which had repositioned to focus on building a more
upscale image through better quality, design, and innovation, came out with a
line of top-notch mobile phones and digital Televisions. Through these products,
the company’s technological prowess is showcased.
An example is the corporate brand Philips. Philips uses its established corporate
name to launch various distinctive products in dissimilar markets such as
consumer products, lighting and healthcare (Philips, 2010). The use of a well-
known corporate name can provide credibility, reassurance and provides a signal
of quality (Aaker, 2004). An example of a brand extension or more specifically a
category extension is the brand Playstation that is owned by corporate brand
Sony. Playstation has extended its products from game consoles towards mobile
entertainment. The Playstation portable is a successful brand extension as there

113
is alignment between product classes. Overall, there are many opportunities for
leveraging the corporate brand, but there are also challenges involved.
On the other hand Sony has established a reputation for making cutting edge
consumer electronics and getting new products to the market quickly. Generated
by its long history, track record of innovation and being the first to market, Sony
has developed a strong expertise component for making consumer electronics.
Despite Sony’s experience making computers for other brands, an early attempt
to produce a branded PC was not successful. Sony has recently reentered the
market and begun producing a branded PC. This extension is being met with
more success due to the PC’s emphasis on manipulating audio and video
information, and the increasing convergence between the fields of computing,
entertainment, and consumer electronics.
114
Chapter 6
Case Study – LG Electronics India

115
Chapter 6
Case Study – LG Electronics India
6.1 LG Electronics India as a Case
As a part of the Research design, a Case study approach has been adopted, as
Case study research excels at bringing us to an understanding of a complex
issue or can extend experience or add strength to the present study (Yin, 1984).
Case study research excels at bringing us to an understanding of a complex
issue or object and can extend experience or add strength to what is already
known through previous research. Case studies emphasize detailed contextual
analysis of a limited number of events or conditions and their relationships.
Researchers have used the case study research method for many years across
a variety of disciplines. Social scientists, in particular, have made wide use of this
qualitative research method to examine contemporary real-life situations and
provide the basis for the application of ideas and extension of methods.
Researcher Robert K. Yin defines the case study research method as an
empirical inquiry that investigates a contemporary phenomenon within its real-life
context; when the boundaries between phenomenon and context are not clearly
evident; and in which multiple sources of evidence are used (Yin, 1984, p. 23).
Since this research deals with a complex issue of brand stretching in the vast
CEHA market, one particular MNC, as a case, in the field of Consumer
electronics and Home Appliances, possibly a market leader in most of its
116
categories, is taken into consideration. LG Electronics India Pvt. Ltd (LGEIL)
a.k.a LG Electronics India, as a case is taken into consideration, since they are
market leaders in most of the Consumer electronics and Home appliances
products. They are the fastest growing MNCs in this sector and have a
significantly wide portfolio of 17 products in the field of Consumer electronics and
Home Appliances. Hence, it would be interesting to figure out how far can LG
stretch itself. As LGEIL is popularly known as LG in India, the subsequent
chapters addresses this corporate brand as LG.
6.2 Overview of LG Electronics India
LG Electronics India Pvt. Ltd., a wholly owned subsidiary of
LG Electronics, South Korea was established in January 1997 after clearance
from the Foreign Investment Promotion Board (FIPB). LG set up a state-of-the art
manufacturing facility at Greater Noida, near Delhi, in 1998, with an investment of
Rs 500 Crores. This facility manufactured Color Televisions, Washing Machines,
Air-Conditioners and Microwave Ovens.
LG Electronics India is the fastest growing company in the consumer electronics,
home appliances, and computer peripherals industry today. LG Electronics is
continually providing, superior technology products & value for money to more
than 50 lakh households in India. LGEIL is celebrating the 11th anniversary this
year. LG Soft India the innovation wing of LG Electronics in Bangalore is LG
Electronics' largest R&D centre outside Korea.
117
India contributes 6% to the company’s global revenue, and LG expect it to double
to 12% in the next three years. Over the next five-years, the company is hoping
that India would emerge as its second biggest market, overtaking Korea which
now holds that position. The Indian branch of LG exports to 40 countries.
In India for a decade now, it is the market leader in consumer durables ,and
recognised as a leading technology innovator in the information technology and
mobile communications business . It is the acknowledged trendsetter for the
consumer durable industry in India with the fastest ever nationwide reach, latest
global technology and product innovation.
One of the most formidable brands, LGEIL has an impressive portfolio of Home
Appliances, Consumer Durables, Digital Display products, GSM mobile phones
and IT products.
LG Electronics continues to pursue its 21st century vision of becoming a
worldwide leader in digital—ensuring customer satisfaction through innovative
products and superior service while aiming to rank among the world’s top three
electronics, information, and telecommunications firms by 2011.
The character of the consumer durables industry has changed dramatically. New
technologies like mobile and computing devices have taken precedence over
household goods.
The durables major plans to invest around Rs 80 million in 2011 on upgrading
and ramping up production capacity, and is aggressively considering options to
build an additional plant.

118
With an aim to triple its rural revenues by 2014, LG is planning to spend Rs 10
million to push its products through ITC’s e-Choupal and DCM Shriram’s rural
retail venture, Hariyali Kisaan Bazaar, in 14 states, and is looking to tap more
than 50,000 rural distributors of FMCG products, fertilisers and two-wheelers.
6.2.1 LG India’s Financial Performance:
Figure No.4: LGEIL Financial Performance
Source: LGEIL Corporate website, Corporate Information, Facts and figures
As per the above diagram LG Electronics India Pvt. Ltd (LGEIL), has achieved a
phenomenal financial growth of 11.3% over a decade (1999-2009). In just 10
years, LG Electronics has established dominance over the Indian white goods
market, edging out traditional multinational companies and Indian competitors.
The company accounts for the largest share of the $ 4 billion consumer durables,
electronics and appliance market with LG claiming the preferred brand position
for virtually every everything from televisions to microwave ovens and washing
machines.
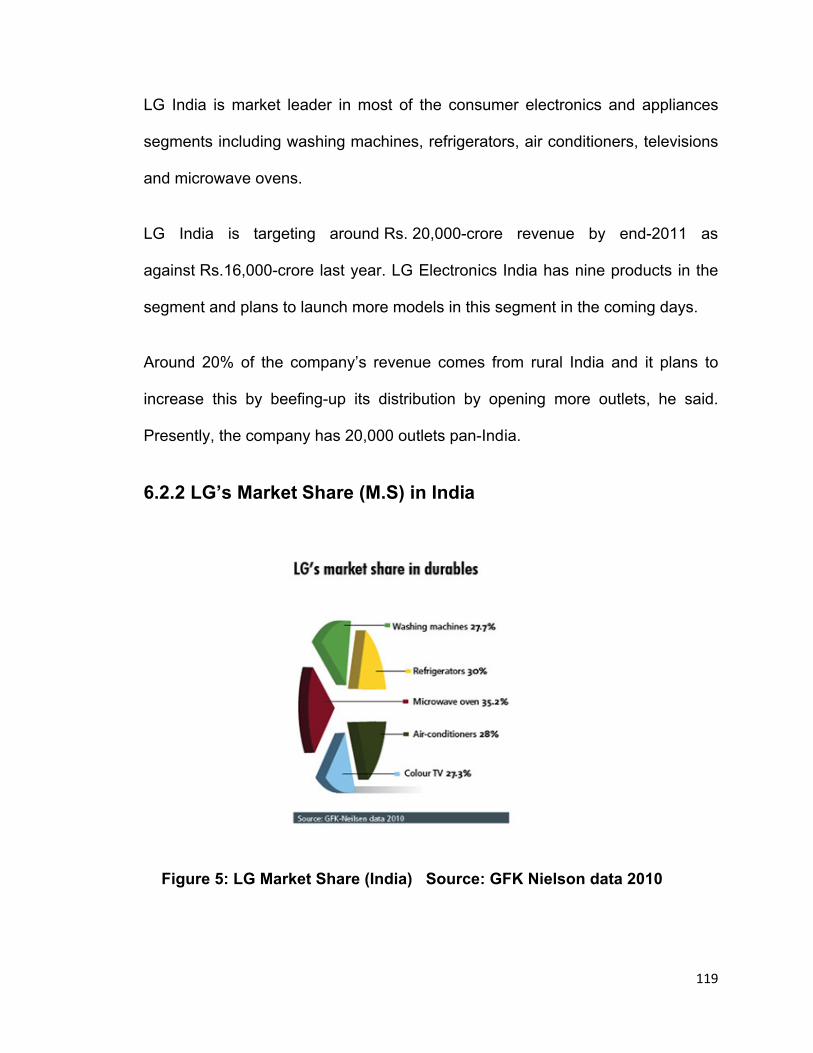
119
LG India is market leader in most of the consumer electronics and appliances
segments including washing machines, refrigerators, air conditioners, televisions
and microwave ovens.
LG India is targeting around Rs. 20,000-crore revenue by end-2011 as
against Rs.16,000-crore last year. LG Electronics India has nine products in the
segment and plans to launch more models in this segment in the coming days.
Around 20% of the company’s revenue comes from rural India and it plans to
increase this by beefing-up its distribution by opening more outlets, he said.
Presently, the company has 20,000 outlets pan-India.
6.2.2 LG’s Market Share (M.S) in India
Figure 5: LG Market Share (India) Source: GFK Nielson data 2010

120
As per Live Mint, April 2011, LG has a 29% market share in home entertainment
products in India and expect to up it to 32% by December 2011. Around 20% of
the company’s revenue comes from rural India and it plans to increase this by
beefing-up its distribution by opening more outlets. Presently, the company has
20,000 outlets pan-India.
In 2010-11, LG India has a leading Market share in major consumer electronics
and home appliances product category for instance LG India has a 27%, 29.2%,
and 35.2% in CTV, Refrigerator and Washing machine respectively, which are in
the lead.
LG rules CDMA mobile market with 48% of installed base market share. LG is
second most used handset manufacturer in India primarily due to its dominant
position in the CDMA.
As of 2010, the company's overall biz from the Indian market stood at Rs 16,000
crore, around 6% of its worldwide business.
As per Managing Director Soon Kwon, LG has set a target of Rs 20,000 crore
and to increase India's contribution by 12 per cent by 2015." Thus LG's sales
projections for 2011 show revenues of Rs 20,000 crore and by 2014 LG hopes to
touch around Rs 40,000 crore.
6.2.3 LG’s M.S vis-a-vis Competitors
LG Electronics competes majorly with Samsung, Philips and Whirlpool in the
domestic market. In Flat TVs LG is the Market Leader with 32.5% M.S., whereas
121
Samsung, Videocon and others are 27.5%, 10.3% and 29.7% respectively. In
Panel TVs LG is in the third position with 23.5% M.S, following Sony at 26.3%
M.S and the Market leader being Samsung with 29.4% M.S. In Frost free
refrigerators, LG is the Market leader with 31.6% M.S. followed by Samsung with
29.2% MS, Whirlpool with 19.2% MS and others falling in 20% M.S. In Direct cool
refrigerators as well LG is the Market leader with 28.6% MS followed by
Whirlpool, Godrej and Samsung with 18.7, 16.1, 14.2 % MS respectively.
LG is also market leader in Washing Machines both in Fully automatic and Semi
automatic with 27.2% M.S. followed by Samsung, Whirlpool and Videocon with
21.3%, 17% and 13.1% M.S. respectively.
LG also leads market in ACs and Microwave ovens with 29% and 31.6% MS
respectively. Samsung follows LG in both the above categories with 21.5 and
22% MS respectively.
As per Capitaline Neo data, by the end of Fiscal year 2011, Samsung’s revenues
are on a par with LG, and is likely to surpass it by the fiscal end of 2011 current.
says LG India’s total income grew from Rs 5.6 billion in 2004-05 to Rs 10 billion
in 2009-10, with a CAGR of 13.76%. On the other hand, Samsung had a higher
CAGR of over 20%, and with an income upwards of Rs 11 billion it has already
exceeded that of LG.
Domestic durables players such as Videocon, Mirc Electronics, Godrej, have
upped their ante too. They have technologically improved and expanded their
product lines, and with competitive pricing and an aggressive marketing strategy

122
are looking good to nibble away market share from international players like LG
and Samsung.
According to Crisil Research data, specialized players such as Voltas and Hitachi
in ACs and Whirlpool in refrigerators are another deterrent to LG’s rapid growth.
It’s because of them that LG even after having aggressively upped its market
share across segments, has barely been able to keep its share of the market
intact over the past five years.
To LG’s credit it has still managed to stay on the growth path, despite yielding
some ground to aggressive competitors. However, the future is going to be more
competitive, now that LG has lost its first mover advantage. Its long adopted
“Blue Ocean” strategy for growth in India may have given it the levers to play the
market so far. But now is the time to discard it, and catch up with the competition
in verticals LG is weak in, both in the value as well as volume segments.
LG’s Kwon has to realize that however much LG’s image might be premium (and
they have the full credit for that), finally, a typical Indian consumer – however
premium –would want, well, the ‘best price’. In other words, the Indian consumer
is quite different from a global consumer to the extent that he demands the
cheapest products in every segment.
6.2.4 LG’s Environmental Concern
Since 1994, LG Electronics has endeavored to minimize its impact on the
environment, from product development to final product. With the intention of
123
creating a cleaner planet and protecting people's health, LG Electronics has
adopted an environmental management strategy, developing eco-products while
actively supporting out-of-house environmental protection initiatives.
In an effort to respond quickly and efficiently to threats, LG operates continual
assessment and monitoring systems. The company also puts environmental
management principles into practice by applying an environmentally friendly
mindset to the entire production process, from design to development, to
production and distribution.
The company is also committed to the necessary research needed to devise
more efficient methods of taking-back and recycling end-of-life electronic
products. For all these reasons, LG is now well-known as a protector of the
environment, and significantly engaged in environmental initiatives inside and
out. In its bid to provide customers with eco-products, LG is also making strides
toward attaining its own sustainability goals.
LG Electronics' environmental management and eco-products strategies are
being implemented in the environment/energy sector, the health and safety
sector, and the comprehensive sector now laying the foundations for ongoing
sustainable management. These strategies are being implemented through
various means, such as Eco-design, Management of hazardous substances,
Recycling of end-of-life electronics products, Green program, Supporting
environmental communities (NGOs, stakeholders).

124
6.3 Hypothetical Extensions for LG
Hypothetical extensions are extensions of corporate brand to new product
categories which are not existing in the present scenario. These are hypothetical
in nature. In this research these hypothetical extensions are chosen considering
their extensions within the arena of Consumer durables particularly consumer
electronics and outside the arena of Consumer durables (conglomerate
diversification). Five hypothetical extensions have been taken into consideration
in this research such as Direct to Home services (DTH), Mobile Service Provider
(MSP), Internet Service Provider (ISP), Washing Powder (W.P), Life Insurance
(L.I.).
Since LG is popularly known for CTV, LCD, Plasmas it is interesting to find out
how consumers evaluate LG’s brand extensions to DTH. Same goes with the
case of LG Mobile phones and LG as a Mobile service provider. ISP is taken as a
diversification in consumer electronics, since LG has recently ventured in
computer peripherals. Non electronics category such as Washing powder is
taken into consideration, since LG are market leaders in Washing machines, it is
interesting to evaluate LG’s extension to washing powder.
As far as Life insurance is concerned, it is an absolute conglomerative
diversification like Washing Powder, but in this case, it’s not related to any of the
consumer electronic or home appliance product. Hence being a non durable and
a service type of product it is interesting to figure out how far is LG acceptable in
a non electronic arena such as Life insurance.
125
6.4 New Product Categories- Market Scenario
The current market scenario for the respective new product categories or
hypothetical extension for LG is as follows:
1. DTH (Direct to Home Services)
DTH (Direct To Home) service is basically a digital satellite service that provides
satellite television programming directly to subscribers home anywhere in the
country. Since it employs wireless technology, the television programs are
transmitted to the subscriber’s television directly from the satellite. This service
does not involve the usage of cables and any other wiring infrastructure.
India will become the largest direct-to-home (DTH) market in the world in terms
of subscribers by 2012, overtaking the U.S., according to a study by Media
Partners Asia (MPA).
As per their report, the number of Indian DTH subscribers will reach 58 million by
2020, and 45 million by 2014 from a net installed base of 17 million in 2009
whereas most direct-to-home (DTH) satellite pay-TV operators will start making
money after 2013.
Dish TV, Tata Sky, Sun Direct, Big TV, Airtel Digital TV, and Videocon D2H are
the only prominent DTH players in the Indian DTH market. Though earlier only
Tata Sky and Dish TV were the market leader in DTH but after the entry of new
DTH players competition became intense though the companies are trying to pull

126
customer by giving attractive packages, offers and free subscription. The market
share of various DTH players are as follows: DishTV : 30%, Sun Direct: 25%,
Tata Sky: 22%, BIG TV : 13%, Airtel : 8%. D2H : 2%.
There is a huge growth opportunity for DTH in India and it is projected to grow at
a CAGR of 24%. The future of DTH industry depends largely on pioneering
marketing tactics implemented by the DTH players. In fact, opportunity in India is
ten times more as compared to developed countries like the US and Europe.
2. Mobile Service Provider (MSP)
The Mobile Service Providers a.k.a Cellular Service Providers or Cellular
Operators has become highly competitive over the last four years. The industry is
highly fragmented. There are as many as 15 players who strive to gain
competitive edge in the market. As of September April 2011, Bharti Airtel led the
market with 19.19 per cent share, Reliance (16.77 per cent), Vodafone (16.56
per cent), BSNL (11.13 per cent), Idea (11.12 per cent), Tata (10.93 per cent),
Aircel (6.77 per cent), with the remaining share being held by other smaller
operators, according to Telecom Regulatory Authority of India (TRAI) database.
The growth in this category was led by Reliance Communications, which added
2.93 million subscribers, taking the subscriber base to 138.65 million at the end
of April 2011. Idea Cellular added 2.45 million new users, taking the user base to
91.95 million. Bharti Airtel added 2.41 million subscribers (increasing its user
base to 164.61 million), while Vodafone added 2.40 million users (taking its user

127
base to 136.97 million). Aircel added 1.10 million users, while Tata Teleservices
added 1.24 million users in April 2011.
3. Internet Service Provider (ISP)
In a decade’s time India has seen a considerable growth in its internet
penetration. After a period of market rationalisation, there are now around 160
operational ISPs in the country. Despite the large number of providers, just 10%
of the ISPs have 90% of the subscribers. The state-owned BSNL and MTNL
continue to dominate the market, holding first and second place in terms of
Internet subscribers and a massive 70% of the total subscriber base. Cybercafés
have certainly been playing a major role in fuelling the development of Internet in
India. About half of the total Internet subscriber base finally had broadband
access coming into 2010. Despite this relatively high proportion, development of
broadband Internet in India remains particularly slow, to the deep consternation
of the government.
While India initially embraced the internet with a degree of ambivalence, there
was tremendous enthusiasm among dial-up users and an estimated 60% of
Internet users were still regularly accessing the Internet via the country’s more
than 10,000 cybercafes. When it came to high-speed broadband access,
however, there was a reluctance to embrace, especially within the corporate
sector, and the growth of broadband remained relatively slow. By early 2011
there were just over 13 million broadband subscribers – a lowly penetration (by
population) of slightly more than 1%. Wireless broadband technologies were
128
attracting considerable interest in India as operators paid large licence fees on
the back of the government’s spectrum auction in mid-2010. Significant network
rollouts were underway and there was no doubt that this accelerating the
adoption of broadband. This report looks at the stage the development of
broadband Internet has reached in India.
The Major players and their respective Market shares in the ISP sector is as
follows:
As on March 2011, BSNL leads with a Market share of 57.52%, followed by
MTNL (12.31%), Reliance Commn Infra (11.05%), Bharti Airtel (7.29%) and
Hathway Cable & Datacom (1.77%).
4. Washing Powder Market
The market for washing powder or laundry detergents was spurred by changing
lifestyles, growing purchasing power, awareness about personal hygiene,
responsiveness to brands offering superior value and the spread of audio-visual
media. Added to all this, there was a drop in the price of washing machines. As a
result, the washing powder market grew significantly. In fully automatic washing
machines, even the prices of front loading machines have seen a dip. The fact
that machine washing clothes tend to take up more washing powder helped
consumption along.
In India, washing powders constitute a major chunk of the laundry detergent
market (nearly 70 per cent) while the rest consists of soaps and bars. The major
129
brands in this category include Ariel, Wheel, Ghari, Nirma, Surf, Tide, Rin and
Henko.
As per KPMG Advisory Services; Packaging innovation and price wars lead to an
increase in penetration. Detergent brands have based communication and brand
messages on features like whiteness, freshness, fragrance, ease of use and
stain removing opening up the category a lot more. Market players have slashed
prices and offered freebies or 'extra' grammage than before.
5. Life Insurance Sector
In recent times, there has been growing awareness about life insurance products
and the various benefits they offer to individuals. Offerings like unit linked
insurance plans (ULIPs) have done their bit to draw individuals towards the
insurance segment. Also tax benefits, presently under Section 80C of the Income
Tax Act, have contributed to their allure and helped in popularizing insurance
products. Conversely, there are products like medical insurance or mediclaim as
it is commonly referred to, which can add value to an individual’s insurance
portfolio, but are relatively lesser known. Currently, a US$41 billion industry, India
is the world's fifth largest life insurance market and growing at a rapid pace of 32-
34% annually as per Life Insurance Council studies.
The major Life Insurance players in the Indian market are; Life Insurance
Corporation of India, Bajaj Allianz Life Insurance Company Limited, SBI Life
Insurance Co. Ltd, Birla Sun Life Insurance Co. Ltd, HDFC Standard life
Insurance Co. Ltd just to name a few.
130
Chapter 7
Data Findings & Analysis
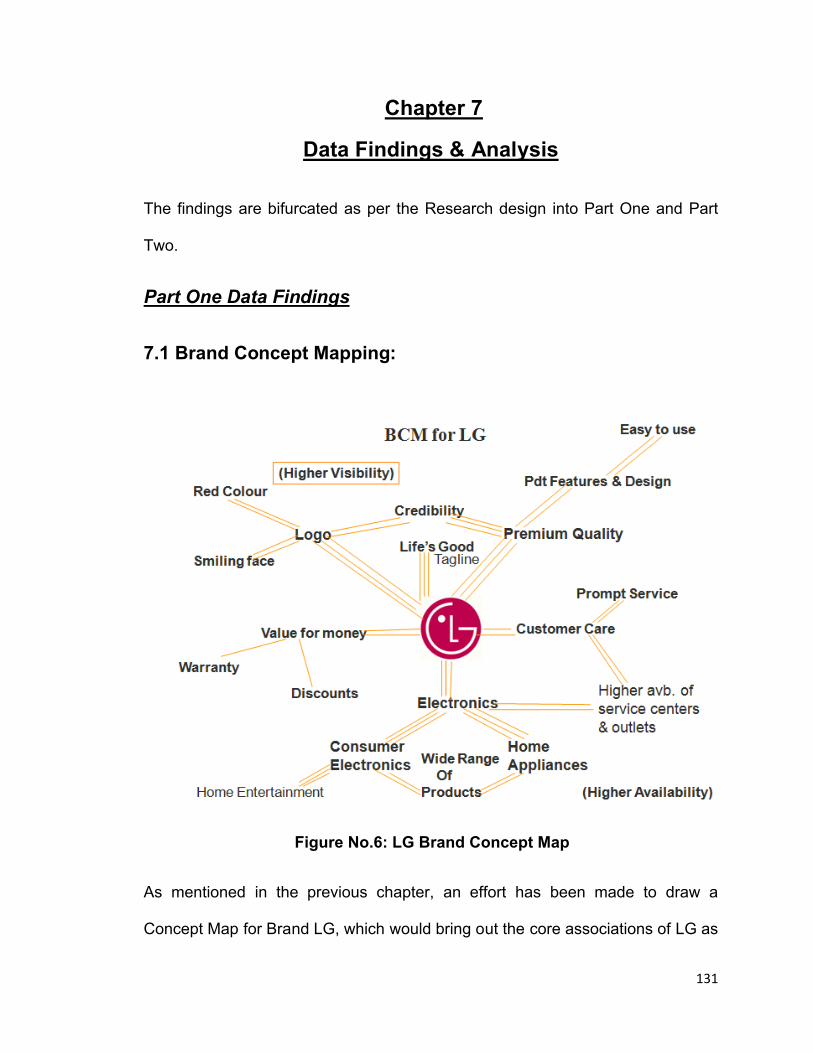
131
Chapter 7
Data Findings & Analysis
The findings are bifurcated as per the Research design into Part One and Part
Two.
Part One Data Findings
7.1 Brand Concept Mapping:
Figure No.6: LG Brand Concept Map
As mentioned in the previous chapter, an effort has been made to draw a
Concept Map for Brand LG, which would bring out the core associations of LG as

132
well as the strength of these associations. In the above figure of BCM it is
observed that there are a set of associations which are closest to LG. These are
called as First order associations. These associations also show their respective
strength. Three lines of association shows that the association is the strongest,
whereas two lines depict that the association is moderately strong. A one line
association conveys that the association is weak.
From the Brand Concept Mapping of LG it is been observed that the closest
associations i.e.; the first order associations for LG are: LG Logo, the Tagline
(Life’s Good), Premium Quality, Customer Care, Value for money and last but not
the least it’s strong association with Electronics sector; that is Electronics goods
both Consumer Electronics and Home Appliances. Out of which the Visibility
quotient (Logo and the Tagline) along with Quality and Electronics has a very
strong association. This visibility quotient is logical, as LG has been heavily into
promotions and every advertisement of LG follows by its corporate logo.
Association with Logo is backed up the prominent red colour as well as the
smiling face. The customer care which is the core association is associated with
high availability of service centers and prompt service, which can be a
beneficiary tool for any further line or brand extension of LG. LG is however
strongly associated with consumer electronics and home appliances which
further supports with a wide range of products. Looking at this association, in
particular which is purely category oriented, the diversifications of LG in other
than electronics category seems to be a tough challenge. LG is also moderately

133
associated with the factor “value for money”, which the respondents associate
with warranty and discounts which they expect during the festive season.
7.2 Attribute association matching
As per the research design, with the help of set of core associations of LG in the
LGEI BCM, an attribute association matching is conducted. Following are the list
of attributes for the respective hypothetical categories, matching the core
associations of LG: DTH: High Picture Quality, Customer Care, After Sales
Service, Reasonable Price (value for money), Consumer Electronics. MSP:
Customer Care: Availability of Prompt Service, Rates (value for money),
Consumer Electronics. ISP: Availability of Prompt Service, Value for money,
Consumer Electronics. WP: Credibility and LI: Credibility. As seen from the
respective associations, DTH has the maximum matches with the core
association followed by MSP and ISP, whereas WP and Life Insurance is not
matching with any of the core associations but with the second order association
that is Credibility.
7.3 Rating of Core Association
As mentioned in the research design, the respondents on the other hand are also
instructed to rate the core association of LG on a scale of 1 to 10 across the 5
hypothetical extensions, which further rank the hypothetical extensions. The
ranking of these hypothetical extension product categories is as follows: DTH,
Mobile Service Provider, Internet Service Provider, Washing powder, Life
Insurance
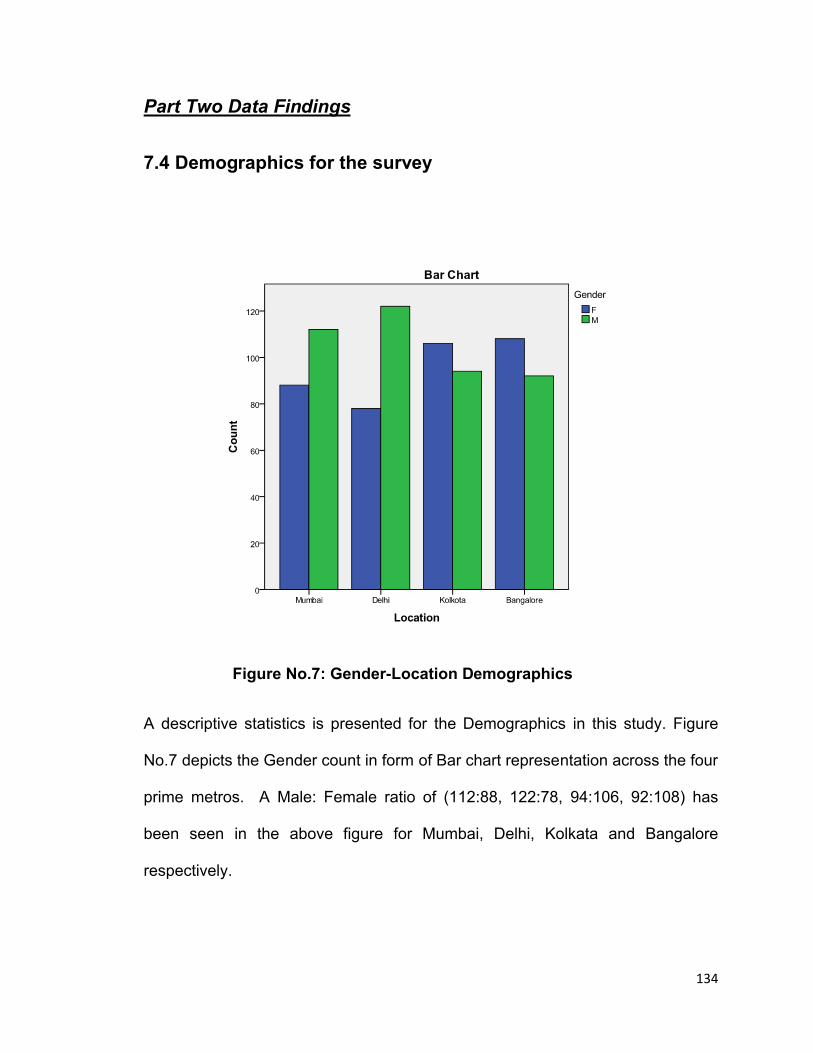
134
Part Two Data Findings
7.4 Demographics for the survey
Figure No.7: Gender-Location Demographics
A descriptive statistics is presented for the Demographics in this study. Figure
No.7 depicts the Gender count in form of Bar chart representation across the four
prime metros. A Male: Female ratio of (112:88, 122:78, 94:106, 92:108) has
been seen in the above figure for Mumbai, Delhi, Kolkata and Bangalore
respectively.

135
Figure No.8: Occupation-Location Demographics
Figure No.8 shows the selection of Occupation profile of the respondent across
the four metros. Amongst the three occupational profiles, Service Employment
has been given the highest percentage, as service sector is one of the largest
sector in India. The Entrepreneur: Service Employee: Professional rate is
(17:162:21), (16:164:20), (15:163:22), (26:152:22) across the four metros viz;
Mumbai, Delhi. Kolkata and Bangalore respectively.
136
7.5 Corporate Brand Strength (CBS) parameters analysis:
The strength of the Corporate brand is analyzed with respect to the following
parameters:
i. Corporate Brand Awareness:
The overall Corporate brand awareness for LG is evaluated on the basis of
Brand recall, logo and tagline identification, Ad Recall test as well as Recognition
test for Brand LG as well as the products of LGEI
With the Top 5 brand recall in the field of CEHA, 90.32% of the respondents
recalls for LG, with 30.8% in the Top of the Mind category. LG is followed by its
closest competitor Samsung with 77% brand recall and 23% in the Top of the
Mind category, whereas Sony takes the third position with 64.5% brand recall
and 18.5% in the top of the mind category.
In all 81 % of the respondents were able to identify correctly for LG’s tagline
Life’s Good, and all of them could recognize the popular LG logo.
In the Ad Recall Test conducted, amidst 20 TV commercial advertisements
displayed with a potpourri of different category of Advertisements, ranging from
automobiles to refrigerators, LG stands among the top 5 brands recalled, in the
no.4 position, below Airtel, Whirlpoool and Bajaj Pulsar DTSi. LG however stands
at the top when the consumers were asked to recall the top Consumer
electronics brands. With 93.5% respondents notice LG Advertisement only 29%
137
could recall LG Cookie mobile Ad whereas 71% couldn’t remember and 13%
recalled wrong product.
Even after displaying all LG products (brand recognition) only 21% are correct in
product recognition, this is on account of a high recall of the LG logo after the
Advertisement.
In the overall recognition test, all of the respondents have heard of LG. 11%
mention products which are non existing, whereas when the products of LG
where displayed, the most aware products are: CTVs, Refrigerators, Mobile
phones, Washing Machine, ACs, LCD/LED/Plasmas whereas the least aware
products are: Air purifier, Washer Dryer Combo, Dishwashers.
The overall Corporate brand awareness for LG is evaluated on the basis of
Brand recall, logo tagline identification, Ad Recall test as well as Recognition test
for Brand LG as well as the products of LG
With the Top 5 brand recall in the field of CEHA, LG has the highest brand recall
and a significant Top of the Mind category. LG is followed by its closest
competitor Samsung followed by Sony in the same category. All the respondents
could identify the LG logo whereas the tagline identification of LG was
significantly high.
In the Ad Recall Test conducted, amidst a series of TV commercial
advertisements displayed with a potpourri of different category of
Advertisements, ranging from automobiles to refrigerators, LG stood amongst the
4th position of the brands recalled whereas stands at the top when the consumers

138
were asked to recall the top Consumer electronics brands. A significantly low
amount of respondents could recall the product of LG and even after displaying
all LG products (brand recognition) only few of them could recollect the product,
this was on account of a high recall of the LG logo after the Advertisement. In the
overall recognition test, all of the respondents have heard of LG.
ii. Corporate Brand Positioning:
For evaluating the Corporate Brand Positioning the following item scales are
used which are scaled on a Likert scale of 1 to 7; where 1 is Totally Disagree and
7 is Totally agree. The item scales has an average reliability (Cronbach α) of
0.901. The mean scores for the item scales are as follows:
Corporate Brand Positioning Mean Scores
L.G. truly stands for “Life is Good” 5.68
L.G. makes a better living for all of us 4.91
L.G. improves the quality of our lives 4.73
L.G. represents a “delightfully smart” brand 5.05
Table No.2: Corporate Brand Positioning Mean Scores
As seen from the above table, for evaluating the Corporate Brand Positioning
various item scales are used. From the mean scores of these item scales it is
found that LG positioned strongly for what it stood out in the market i.e. Life is
Good.
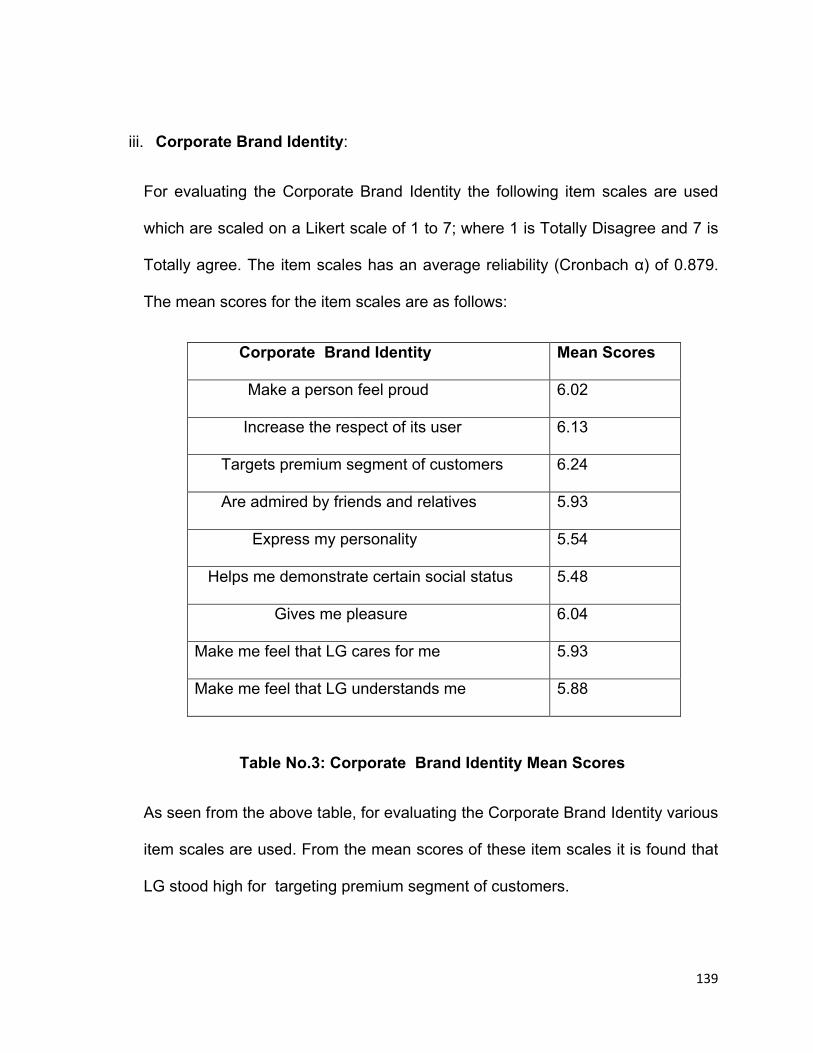
139
iii. Corporate Brand Identity:
For evaluating the Corporate Brand Identity the following item scales are used
which are scaled on a Likert scale of 1 to 7; where 1 is Totally Disagree and 7 is
Totally agree. The item scales has an average reliability (Cronbach α) of 0.879.
The mean scores for the item scales are as follows:
Corporate Brand Identity Mean Scores
Make a person feel proud 6.02
Increase the respect of its user 6.13
Targets premium segment of customers 6.24
Are admired by friends and relatives 5.93
Express my personality 5.54
Helps me demonstrate certain social status 5.48
Gives me pleasure 6.04
Make me feel that LG cares for me 5.93
Make me feel that LG understands me 5.88
Table No.3: Corporate Brand Identity Mean Scores
As seen from the above table, for evaluating the Corporate Brand Identity various
item scales are used. From the mean scores of these item scales it is found that
LG stood high for targeting premium segment of customers.
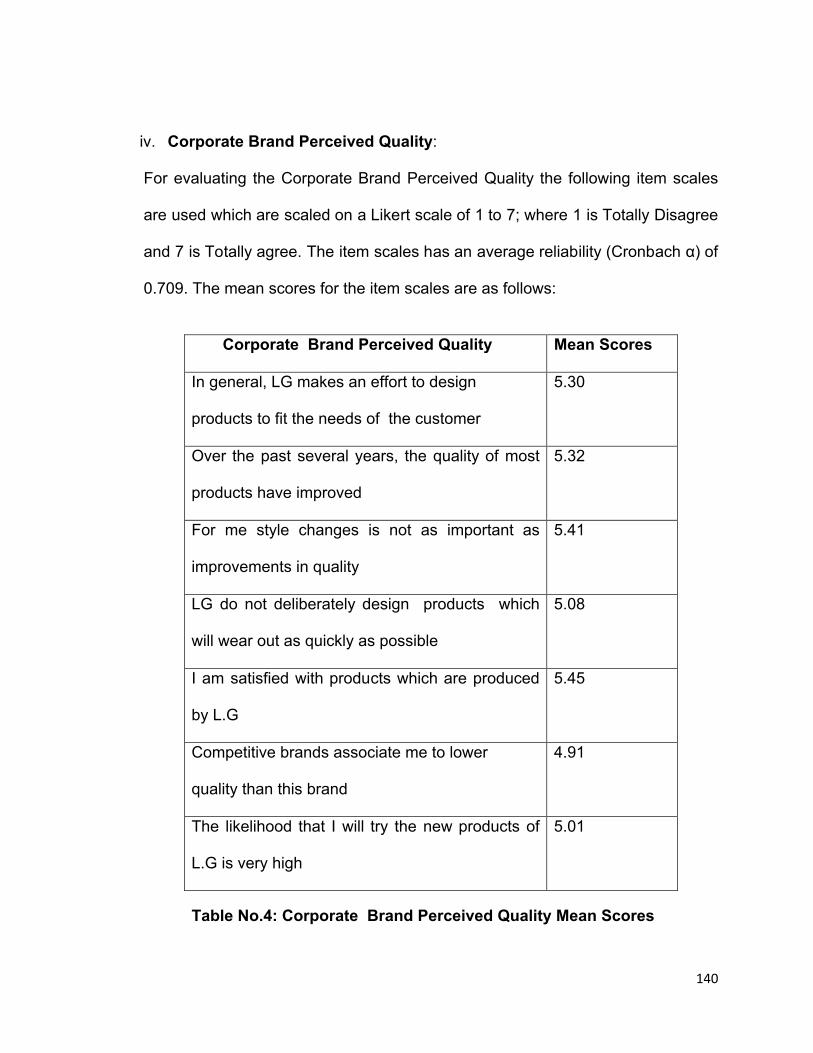
140
iv. Corporate Brand Perceived Quality:
For evaluating the Corporate Brand Perceived Quality the following item scales
are used which are scaled on a Likert scale of 1 to 7; where 1 is Totally Disagree
and 7 is Totally agree. The item scales has an average reliability (Cronbach α) of
0.709. The mean scores for the item scales are as follows:
Table No.4: Corporate Brand Perceived Quality Mean Scores
Corporate Brand Perceived Quality Mean Scores
In general, LG makes an effort to design
products to fit the needs of the customer
5.30
Over the past several years, the quality of most
products have improved
5.32
For me style changes is not as important as
improvements in quality
5.41
LG do not deliberately design products which
will wear out as quickly as possible
5.08
I am satisfied with products which are produced
by L.G
5.45
Competitive brands associate me to lower
quality than this brand
4.91
The likelihood that I will try the new products of
L.G is very high
5.01
141
As seen from the above table, for evaluating the Corporate Brand Perceived
Quality various item scales are used. From the mean scores of these item scales
it is found that LG stood high for the fact that the quality of most of its products
over the past several years have improved.
7.6 Attitude Towards Brand Extension (ATBE) Parameters
Evaluation
The Attitude towards brand extension parameters as mentioned in the current
model of ATBE in the research design is taken into consideration which involves
Parent brand characteristics as well as brand extension characteristics of the
Parent brand.
7.6.1 Parent Brand Characteristics Evaluation
As mentioned in the previous chapter, LG as a Parent brand is evaluated by the
consumers with respect to the following parameters:
i) Parent Brand Knowledge:
For evaluating the Parent Brand Knowledge the following item scales are used
which are scaled on a Likert scale of 1 to 7; where 1 is Totally Disagree and 7 is
Totally agree. The item scales has an average reliability (Cronbach α) of 0.825.
The mean scores for the item scales are as follows:
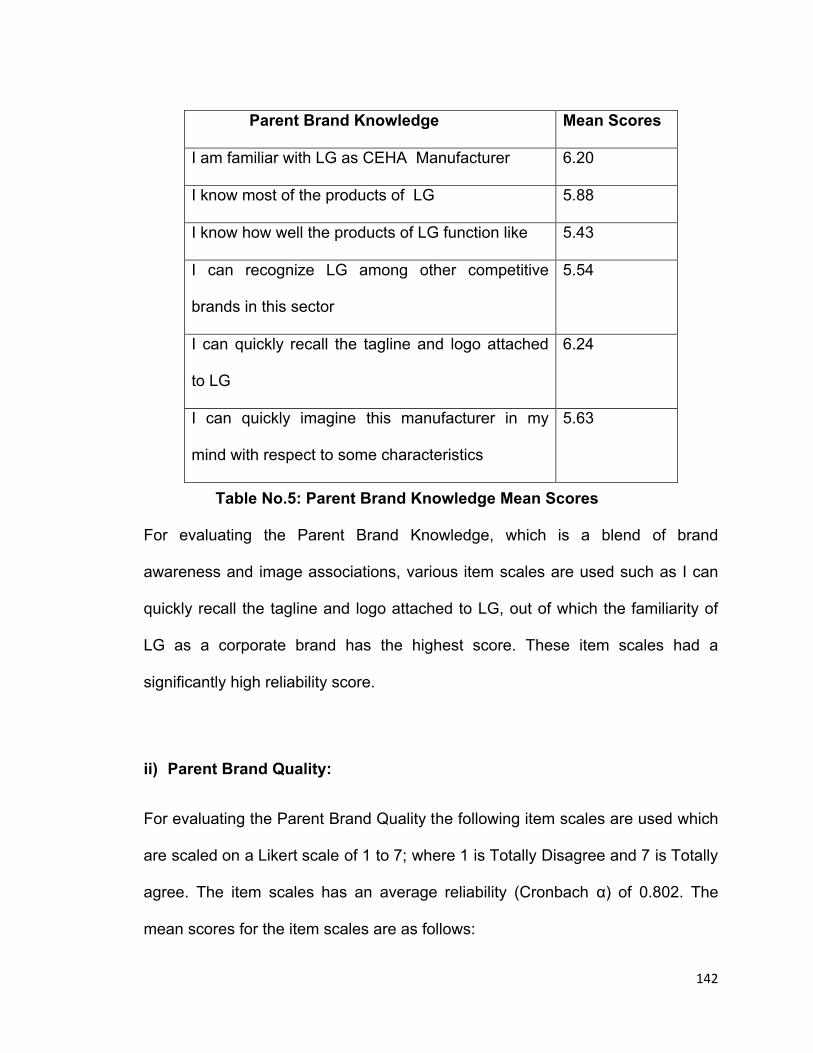
142
Table No.5: Parent Brand Knowledge Mean Scores
For evaluating the Parent Brand Knowledge, which is a blend of brand
awareness and image associations, various item scales are used such as I can
quickly recall the tagline and logo attached to LG, out of which the familiarity of
LG as a corporate brand has the highest score. These item scales had a
significantly high reliability score.
ii) Parent Brand Quality:
For evaluating the Parent Brand Quality the following item scales are used which
are scaled on a Likert scale of 1 to 7; where 1 is Totally Disagree and 7 is Totally
agree. The item scales has an average reliability (Cronbach α) of 0.802. The
mean scores for the item scales are as follows:
Parent Brand Knowledge Mean Scores
I am familiar with LG as CEHA Manufacturer 6.20
I know most of the products of LG 5.88
I know how well the products of LG function like 5.43
I can recognize LG among other competitive
brands in this sector
5.54
I can quickly recall the tagline and logo attached
to LG
6.24
I can quickly imagine this manufacturer in my
mind with respect to some characteristics
5.63

143
Table No.6: Parent Brand Quality Mean Scores
For evaluating the Parent Brand Quality, various item scales are used such as
LG performs as expected, have technological sophistication, offer value for price
are used, were in it stood high for functionability. The item scales had a
significantly high reliability score.
iii) Parent brand Innovativeness:
For evaluating the Parent Brand Innovativeness the following item scales are
used which are scaled on a Likert scale of 1 to 7; where 1 is Totally Disagree
and 7 is Totally agree. The item scales has an average reliability (Cronbach α)
of 0.781. The mean scores for the item scales are as follows:
Parent Brand Quality Mean Scores
Perform as expected 5.44
Offer value for price 5.29
Are reliable 5.43
Are functionable 5.49
Are durable 4.83
Have Technological Sophistication 5.15
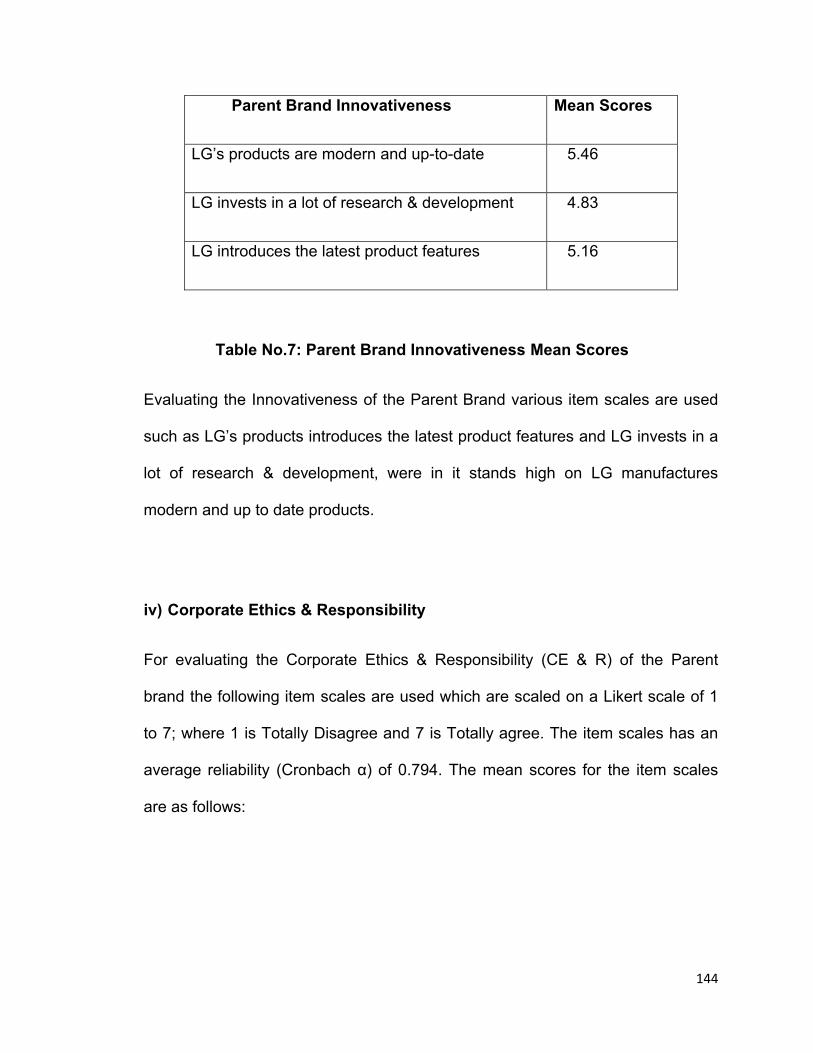
144
Parent Brand Innovativeness Mean Scores
LG’s products are modern and up-to-date 5.46
LG invests in a lot of research & development 4.83
LG introduces the latest product features 5.16
Table No.7: Parent Brand Innovativeness Mean Scores
Evaluating the Innovativeness of the Parent Brand various item scales are used
such as LG’s products introduces the latest product features and LG invests in a
lot of research & development, were in it stands high on LG manufactures
modern and up to date products.
iv) Corporate Ethics & Responsibility
For evaluating the Corporate Ethics & Responsibility (CE & R) of the Parent
brand the following item scales are used which are scaled on a Likert scale of 1
to 7; where 1 is Totally Disagree and 7 is Totally agree. The item scales has an
average reliability (Cronbach α) of 0.794. The mean scores for the item scales
are as follows:
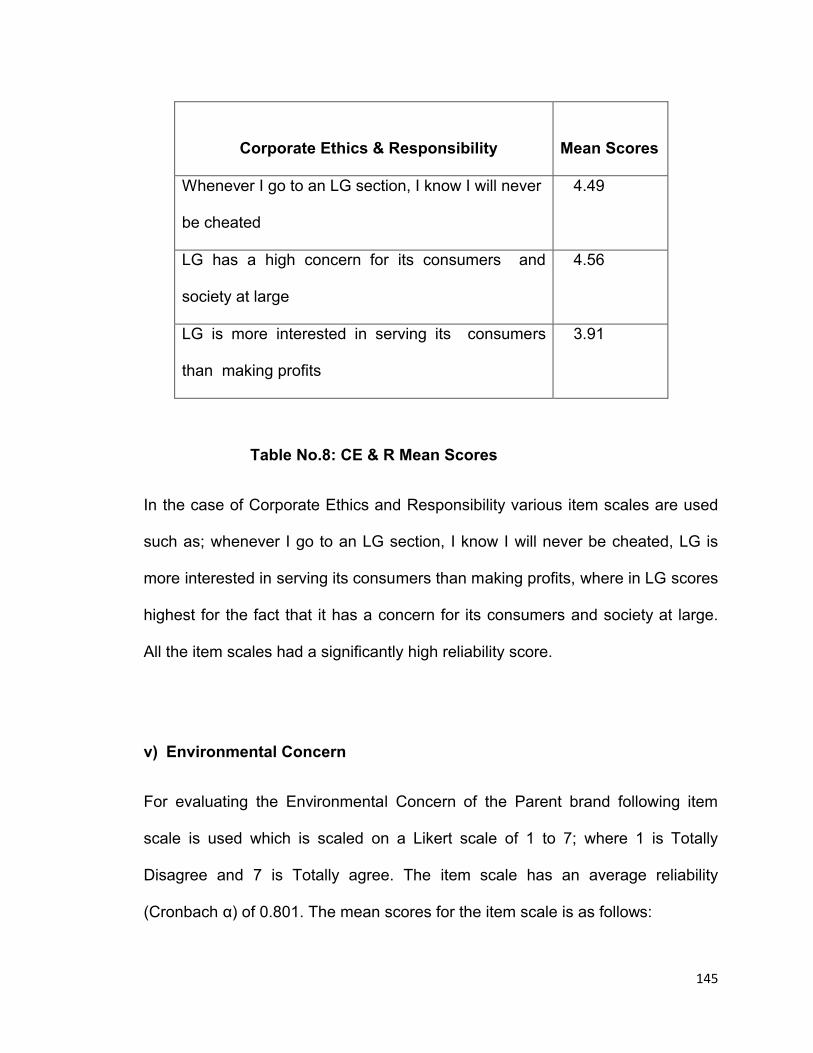
145
Table No.8: CE & R Mean Scores
In the case of Corporate Ethics and Responsibility various item scales are used
such as; whenever I go to an LG section, I know I will never be cheated, LG is
more interested in serving its consumers than making profits, where in LG scores
highest for the fact that it has a concern for its consumers and society at large.
All the item scales had a significantly high reliability score.
v) Environmental Concern
For evaluating the Environmental Concern of the Parent brand following item
scale is used which is scaled on a Likert scale of 1 to 7; where 1 is Totally
Disagree and 7 is Totally agree. The item scale has an average reliability
(Cronbach α) of 0.801. The mean scores for the item scale is as follows:
Corporate Ethics & Responsibility Mean Scores
Whenever I go to an LG section, I know I will never
be cheated
4.49
LG has a high concern for its consumers and
society at large
4.56
LG is more interested in serving its consumers
than making profits
3.91
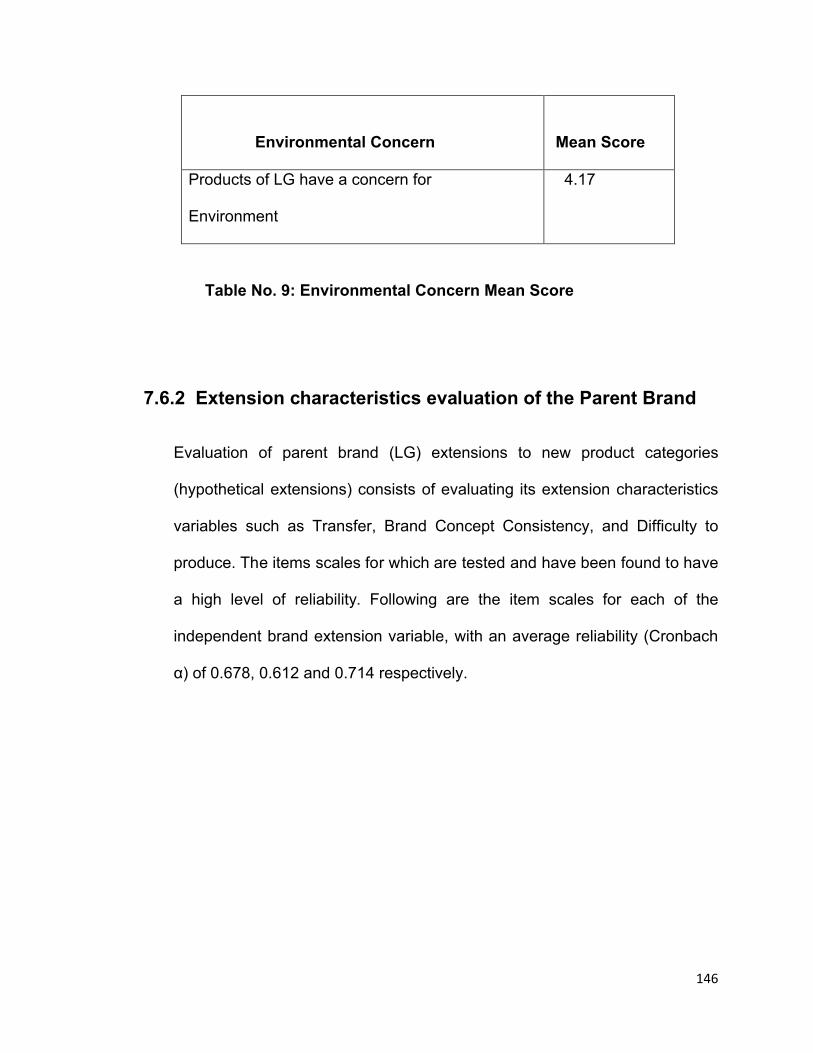
146
Environmental Concern Mean Score
Products of LG have a concern for
Environment
4.17
Table No. 9: Environmental Concern Mean Score
7.6.2 Extension characteristics evaluation of the Parent Brand
Evaluation of parent brand (LG) extensions to new product categories
(hypothetical extensions) consists of evaluating its extension characteristics
variables such as Transfer, Brand Concept Consistency, and Difficulty to
produce. The items scales for which are tested and have been found to have
a high level of reliability. Following are the item scales for each of the
independent brand extension variable, with an average reliability (Cronbach
α) of 0.678, 0.612 and 0.714 respectively.
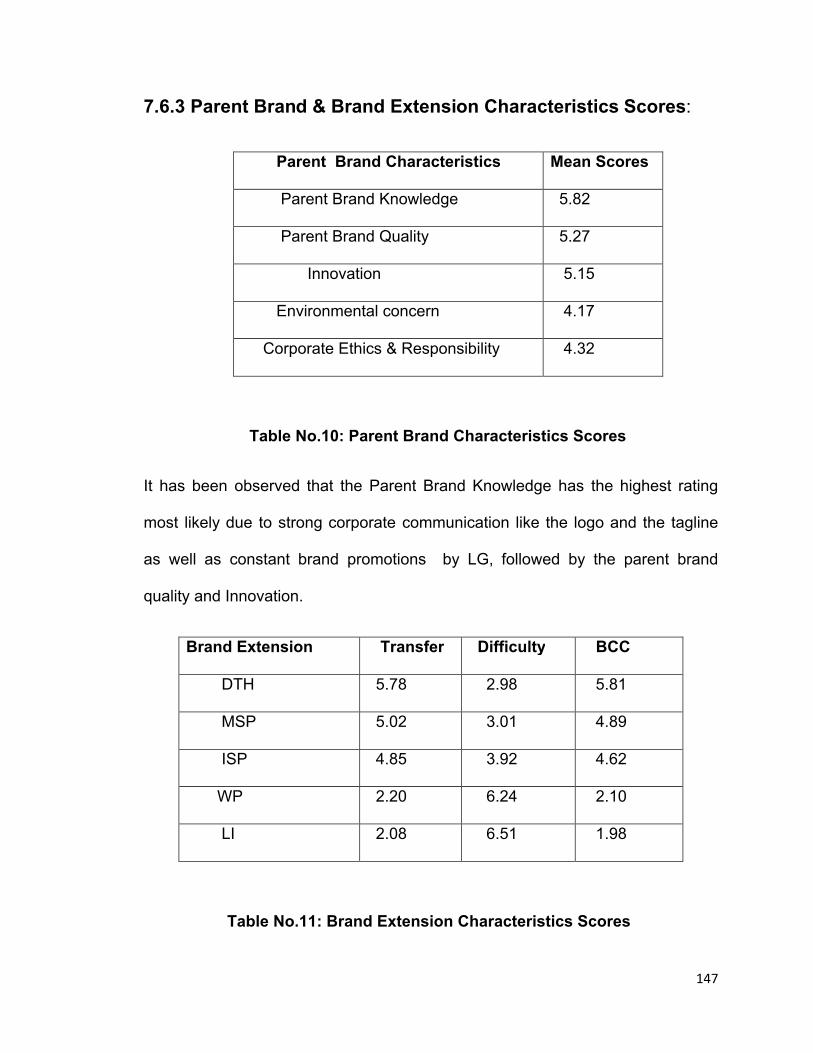
147
7.6.3 Parent Brand & Brand Extension Characteristics Scores:
Parent Brand Characteristics Mean Scores
Parent Brand Knowledge 5.82
Parent Brand Quality 5.27
Innovation 5.15
Environmental concern 4.17
Corporate Ethics & Responsibility 4.32
Table No.10: Parent Brand Characteristics Scores
It has been observed that the Parent Brand Knowledge has the highest rating
most likely due to strong corporate communication like the logo and the tagline
as well as constant brand promotions by LG, followed by the parent brand
quality and Innovation.
Table No.11: Brand Extension Characteristics Scores
Brand Extension Transfer Difficulty BCC
DTH 5.78 2.98 5.81
MSP 5.02 3.01 4.89
ISP 4.85 3.92 4.62
WP 2.20 6.24 2.10
LI 2.08 6.51 1.98
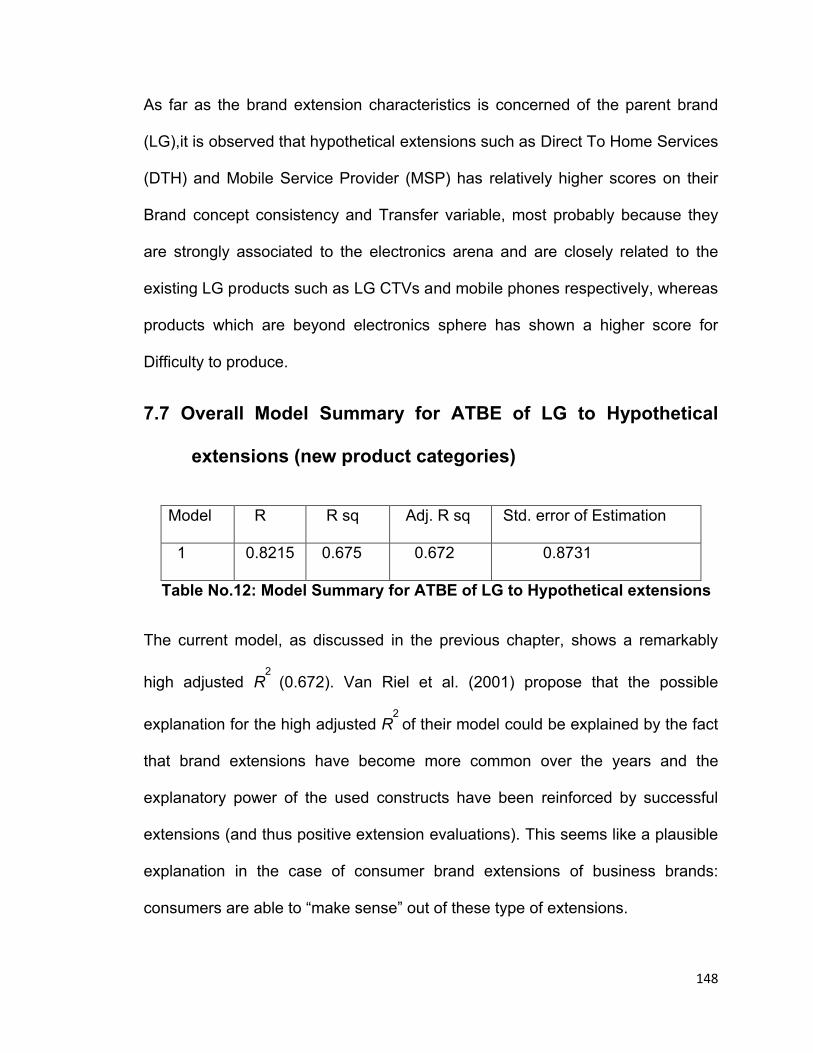
148
As far as the brand extension characteristics is concerned of the parent brand
(LG),it is observed that hypothetical extensions such as Direct To Home Services
(DTH) and Mobile Service Provider (MSP) has relatively higher scores on their
Brand concept consistency and Transfer variable, most probably because they
are strongly associated to the electronics arena and are closely related to the
existing LG products such as LG CTVs and mobile phones respectively, whereas
products which are beyond electronics sphere has shown a higher score for
Difficulty to produce.
7.7 Overall Model Summary for ATBE of LG to Hypothetical
extensions (new product categories)
Table No.12: Model Summary for ATBE of LG to Hypothetical extensions
The current model, as discussed in the previous chapter, shows a remarkably
high adjusted R2
(0.672). Van Riel et al. (2001) propose that the possible
explanation for the high adjusted R2
of their model could be explained by the fact
that brand extensions have become more common over the years and the
explanatory power of the used constructs have been reinforced by successful
extensions (and thus positive extension evaluations). This seems like a plausible
explanation in the case of consumer brand extensions of business brands:
consumers are able to “make sense” out of these type of extensions.
Model R R sq Adj. R sq Std. error of Estimation
1 0.8215 0.675 0.672 0.8731
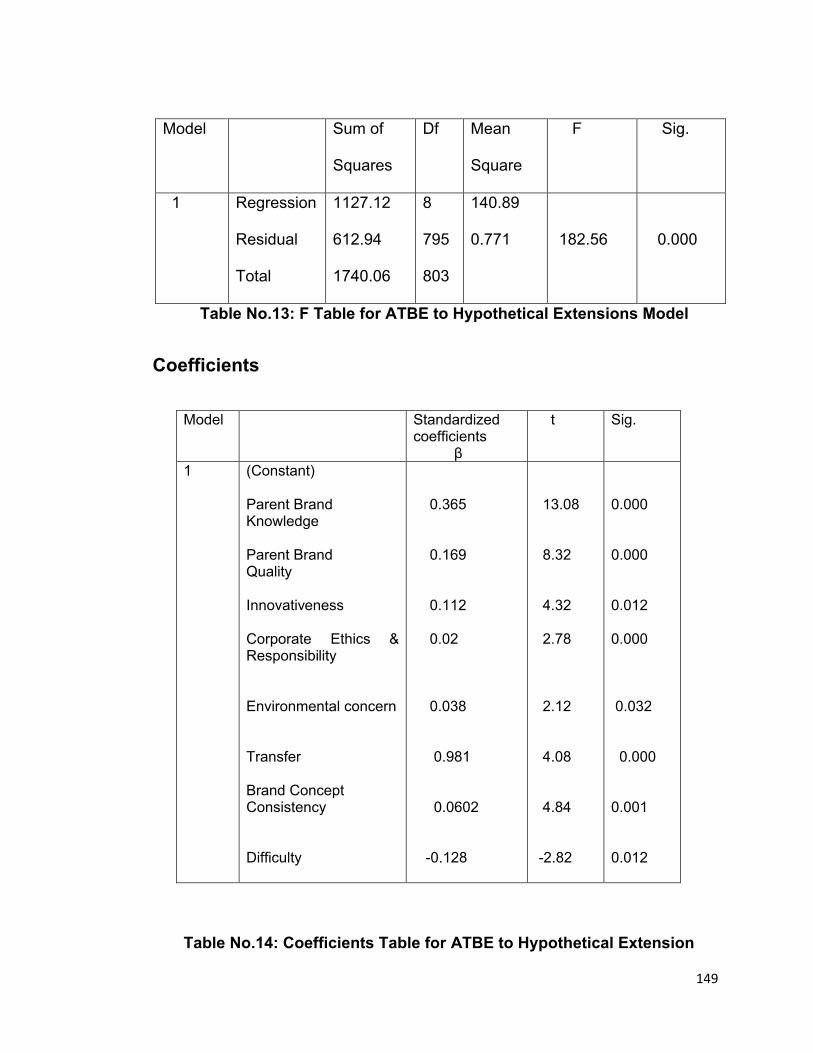
149
Table No.13: F Table for ATBE to Hypothetical Extensions Model
Coefficients
Model Standardized coefficients β
t Sig.
1 (Constant)
Parent BrandKnowledge
Parent Brand Quality
Innovativeness
Corporate Ethics & Responsibility
Environmental concern
Transfer
Brand Concept Consistency
Difficulty
0.365
0.169
0.112 0.02 0.038
0.981
0.0602 -0.128
13.08
8.32
4.32
2.78
2.12
4.08
4.84
-2.82
0.000
0.000
0.012
0.000
0.032
0.000
0.001
0.012
Table No.14: Coefficients Table for ATBE to Hypothetical Extension
Model Sum of
Squares
Df Mean
Square
F Sig.
1 Regression
Residual
Total
1127.12
612.94
1740.06
8
795
803
140.89
0.771 182.56 0.000

150
From Table 13 it is observed that with a higher F value of 182.56 at Sig. value of
p= 0.000 for 5% level of significance, the whole model is significant and thus
stable.
Whereas from the coefficients table for ATBE to hypothetical extensions (Table
14) it’s been observed that all the independent variables are significant at p<0.05.
The t values of all the independent variables are statistically significant. The Beta
coefficients, which indicates the weight of each independent variable signifies
that the parent brand characteristics are weighted relatively higher than the
extension characteristics variable. The highest weightage stands out for Parent
brand knowledge variable, which shows that LG as a Corporate brand has a very
high recognition and familiarity also with the respect to the various products of
LG, which holds true as they are dominating the market for a decade in the
consumer electronics and home appliances sector. Parent brand quality has
been given the second highest weightage, which is also observed in the core
association of the corporate brand in its Brand concept mapping. Amongst the
brand extension characteristics, Difficulty variable has a beta coefficient negative,
which implies that this factor is negatively affecting the attitude towards brand
extension dependent variable, which means that if the difficulty to produce a new
product class is high the attitude towards its extension is low or vice versa.
With the help of the above table 14, hypothesis tests results are produced in the
next section.
151
7.8 Hypothesis Testing Results
H 1: Parent Brand Knowledge
The beta coefficient (0.405) for the variable KNOWLEDGE is significant at
p = 0.000. Hence the null hypothesis has to be rejected. Also the beta coefficient
is highest for this variable which shows its highest weightage. Thus to
summarize, for the Model ATBE to hypothetical extensions, KNOWELEDGE is a
significant variable at p value <0.05
H2: Parent Brand Quality
The beta coefficient (0.249) for the variable QUALITY is significant at p = 0.000.
Hence the null hypothesis has to be rejected. Also the beta coefficient is second
highest for this variable which shows its respective weightage. Thus to
summarize, for the Model ATBE to hypothetical extensions, QUALITY is a
significant variable at p value <0.05
H3: Innovativeness
The beta coefficient (0.116) for the variable INNOVATIVENESS is significant at p
= 0.012. Hence the null hypothesis has to be rejected. Also the beta coefficient is
relatively high with respect to the remaining variables. Thus to summarize, for the
Model ATBE to hypothetical extensions, INNOVATIVENESS is a significant
variable at p value <0.05
152
H4: Corporate Ethics & Responsibility
The beta coefficient (0.055) for the variable CE &R is significant at p = 0.000.
Hence the null hypothesis has to be rejected. Also the beta coefficient is
relatively moderate with respect to the other variables. Thus to summarize, for
the Model ATBE to hypothetical extensions, CE&R is a significant variable at p
value <0.05
H5: Environmental Concern
The beta coefficient (0.042) for the variable ENVIRONMENT is significant at p =
0.032. Hence the null hypothesis has to be rejected. Also amongst the parent
brand factors, this particular factor has the least beta coefficient which shows that
Environmental concern for LGEI has the least weightage to affect the attitude
towards brand extension. Thus to summarize, for the Model ATBE to hypothetical
extensions, ENVIRONMENT is a significant variable at p value <0.05
H6: Transfer
The beta coefficient (0.102) for the variable TRANSFER is significant at p =
0.000. Hence the null hypothesis has to be rejected. Also amongst brand
extension factors, the beta coefficient of this factor is relatively high with respect
to the other variables. Thus to summarize, for the Model ATBE to hypothetical
extensions, TRANSFER is a significant variable at p value <0.05

153
H7: Brand Concept Consistency
The beta coefficient (0.130) for the variable BRAND CONCEPT CONSISTENCY
is significant at p = 0.001. Hence the null hypothesis has to be rejected. Also
amongst brand extension factors, the beta coefficient of this factor is the highest
with respect to the other variables. Thus to summarize, for the Model ATBE to
hypothetical extensions, BRAND CONCEPT CONSISTENCY is a significant
variable at p value <0.05
H8: DIFFICULTY
The beta coefficient (-0.062) for the variable DIFFICULTY is significant at p =
0.012. Hence the null hypothesis has to be rejected. Also amongst all the other
factors, the beta coefficient of this factor is negative, which implies that this factor
is negatively affecting the attitude towards brand extension dependent variable,
which means that if the difficulty to produce a new product class is high the
attitude towards its extension is low or vice versa. Thus to summarize, for the
Model ATBE to hypothetical extensions, DIFFICULTY is a significant variable at
p value <0.05
Hence, as observed from Table 15, all the independent variables are significant
for p values (<0.05), as shown in the Annexure. Thus we reject the Null
Hypotheses from 1 to 8 as mentioned in Chapter no.3

154
7.9 Attitude Towards Brand Extension (ATBE) Score for new
product categories (hypothetical extensions)
Table No. 15: Hypothetical Extensions Mean Scores
As seen from the above table the Attitude Towards Brand Extension Scores is
highest for the DTH service hypothetical extension followed by LG as a Mobile
service provider. The hypothetical extensions such as washing powder and life
insurance has the least attitude towards brand extension score. The mean
scores indicates the likelihood of the hypothetical product extension by the
consumers. The Model summary and the coefficient table for individual
hypothetical extension is seen in Annexure A 4.0. These mean scores however
does not give any indication to how far the scores are acceptable, for which the
overall attitudinal range of LG is required, for which evaluation of all the 17
products of LG are taken into consideration.
Hypothetical Extension Mean Scores
DTH 5.12
MSP 4.78
ISP 4.41
Washing Powder 2.21
Life Insurance 2.10
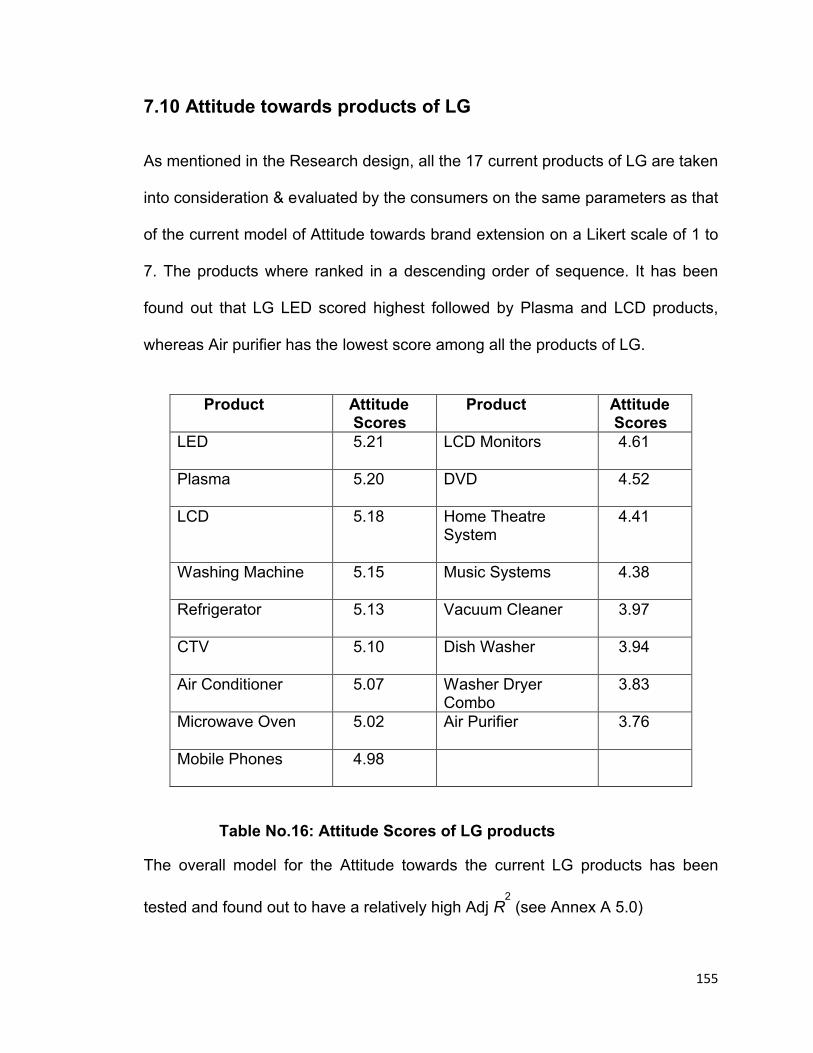
155
7.10 Attitude towards products of LG
As mentioned in the Research design, all the 17 current products of LG are taken
into consideration & evaluated by the consumers on the same parameters as that
of the current model of Attitude towards brand extension on a Likert scale of 1 to
7. The products where ranked in a descending order of sequence. It has been
found out that LG LED scored highest followed by Plasma and LCD products,
whereas Air purifier has the lowest score among all the products of LG.
Table No.16: Attitude Scores of LG products
The overall model for the Attitude towards the current LG products has been
tested and found out to have a relatively high Adj R2
(see Annex A 5.0)
Product Attitude Scores
Product Attitude Scores
LED 5.21 LCD Monitors 4.61
Plasma 5.20 DVD 4.52
LCD 5.18 Home TheatreSystem
4.41
Washing Machine 5.15 Music Systems 4.38
Refrigerator 5.13 Vacuum Cleaner 3.97
CTV 5.10 Dish Washer 3.94
Air Conditioner 5.07 Washer DryerCombo
3.83
Microwave Oven 5.02 Air Purifier 3.76
Mobile Phones 4.98
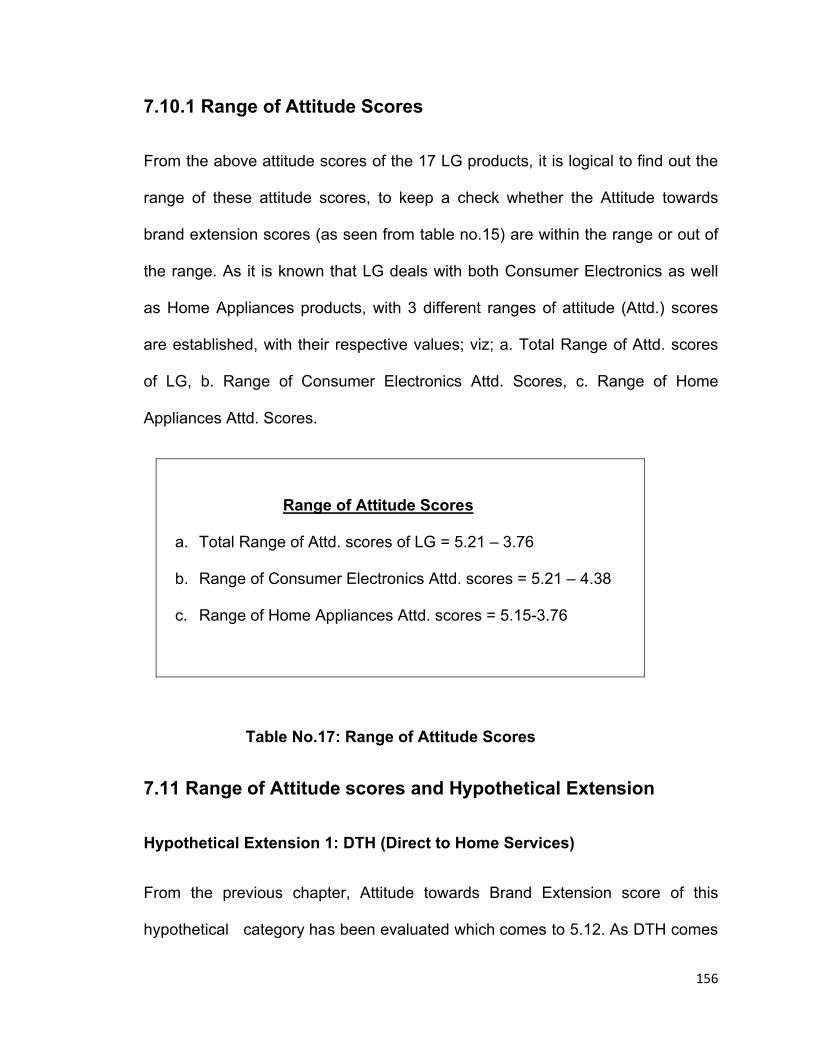
156
7.10.1 Range of Attitude Scores
From the above attitude scores of the 17 LG products, it is logical to find out the
range of these attitude scores, to keep a check whether the Attitude towards
brand extension scores (as seen from table no.15) are within the range or out of
the range. As it is known that LG deals with both Consumer Electronics as well
as Home Appliances products, with 3 different ranges of attitude (Attd.) scores
are established, with their respective values; viz; a. Total Range of Attd. scores
of LG, b. Range of Consumer Electronics Attd. Scores, c. Range of Home
Appliances Attd. Scores.
Range of Attitude Scores
a. Total Range of Attd. scores of LG = 5.21 – 3.76
b. Range of Consumer Electronics Attd. scores = 5.21 – 4.38
c. Range of Home Appliances Attd. scores = 5.15-3.76
Table No.17: Range of Attitude Scores
7.11 Range of Attitude scores and Hypothetical Extension
Hypothetical Extension 1: DTH (Direct to Home Services)
From the previous chapter, Attitude towards Brand Extension score of this
hypothetical category has been evaluated which comes to 5.12. As DTH comes

157
under Consumer Electronics, we compare the DTH ATBE score with the Range
of Consumer Electronics Attd. score, which is in the range from 5.21-4.38. Since
the ATBE of DTH is within the range and above the cutoff of 4.38, this
hypothetical extension is accepted.
Moreover, given the range of Visual display products attitude scores of 5.21-5.10,
the ATBE of DTH is still higher than the visual display cut off of 5.10. In case, if
the ATBE of DTH is in between 5.10 and 4.38, the product extension would
require some improvisation like an in built DTH to the LCD/Plasma/LED.
Whereas if the ATBE is less than 4.38 this hypothetical product is rejected.
Hypothetical Extension 2: MSP (Mobile Service Provider)
Attitude towards Brand Extension score of this hypothetical category has been
evaluated which comes to 4.78. As MSP comes under Consumer Electronics, we
compare the MSP ATBE score with the Range of Consumer Electronics Attd.
score, which is in the range from 5.21-4.38. Since the ATBE of MSP is within the
range and above the cutoff of 4.38, this hypothetical extension is accepted.
Moreover, given the cutoff of Mobile phone attitude score i.e.; 4.98, the ATBE of
MSP falls in the range between 4.38 and 4.98, which means it is accepted as an
electronic product but still requires improvisation to get associated with the
mobile phone category of LG. However, as seen from the ATBE score, there is
not much significant difference between the ATBE and the Mobile phones
Attitude score, hence this new product extension is just accepted. In case, if the
ATBE of MSP is less than 4.38 this hypothetical product is rejected.

158
Hypothetical Extension 3: ISP (Internet Service Provider)
Attitude towards Brand Extension score of this hypothetical category has been
evaluated which comes to 4.41. As ISP comes under Consumer Electronics, we
compare the ISP ATBE score with the Range of Consumer Electronics Attd.
score, which is in the range from 5.21-4.38. Since the ATBE of ISP is within the
range and above the cutoff of 4.38, this hypothetical extension is accepted.
However the ATBE of this product extension is just above the cut off range for
consumer electronics hence this extension is just accepted. In case, if the ATBE
of ISP is less than 4.38 this hypothetical product is rejected.
Hypothetical Extension 4: WP (Washing Powder)
Attitude towards Brand Extension score of this hypothetical category has been
evaluated which comes to 2.21. As WP does not come under Consumer
Electronics, we compare the WP ATBE score with the entire range of LG
products Attd.score, which is in the range from 5.21-3.76. Since the ATBE of WP
is well below the cutoff of 4.38, this hypothetical extension is rejected.
It is interesting to know that even the combined average attitudinal score of WP
and Washing Machine is still lower than the LG attitudinal cut off. Hence this
hypothetical product extension should be rejected.
Hypothetical Extension 5: LI (Life Insurance)
Attitude towards Brand Extension score of this hypothetical category has been
evaluated which comes to 2.10. As L.I. does not come under Consumer
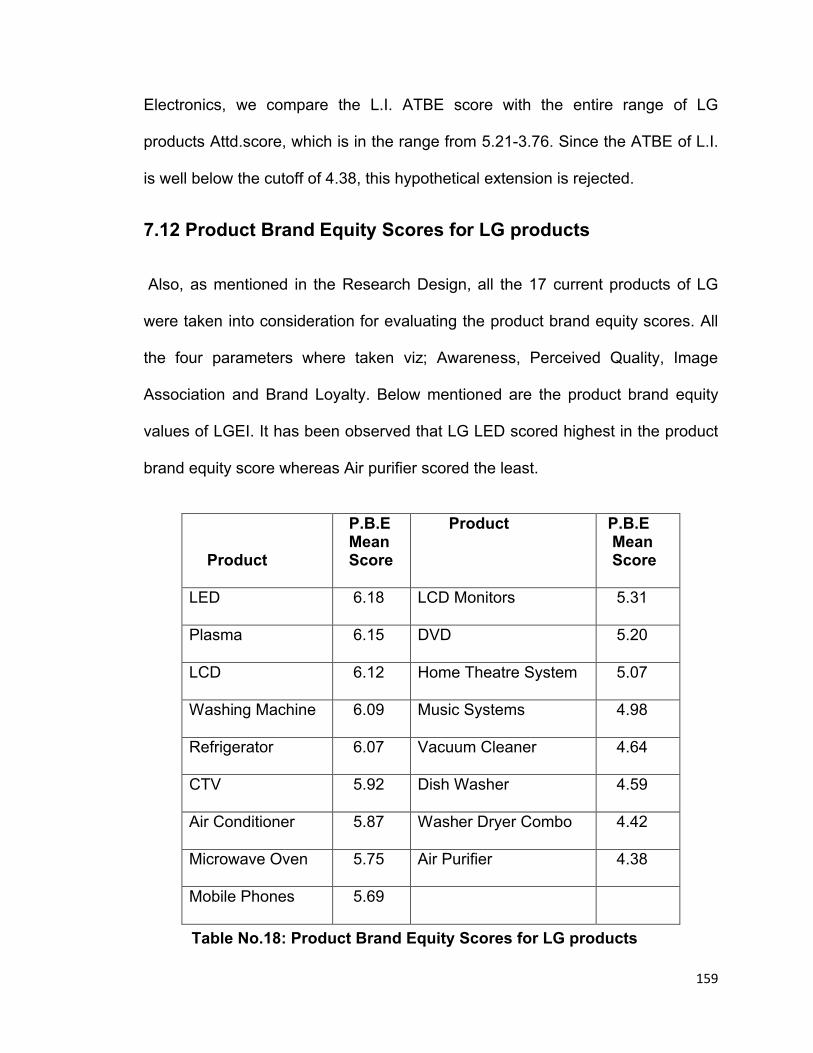
159
Electronics, we compare the L.I. ATBE score with the entire range of LG
products Attd.score, which is in the range from 5.21-3.76. Since the ATBE of L.I.
is well below the cutoff of 4.38, this hypothetical extension is rejected.
7.12 Product Brand Equity Scores for LG products
Also, as mentioned in the Research Design, all the 17 current products of LG
were taken into consideration for evaluating the product brand equity scores. All
the four parameters where taken viz; Awareness, Perceived Quality, Image
Association and Brand Loyalty. Below mentioned are the product brand equity
values of LGEI. It has been observed that LG LED scored highest in the product
brand equity score whereas Air purifier scored the least.
Table No.18: Product Brand Equity Scores for LG products
Product
P.B.E Mean Score
Product P.B.E Mean Score
LED 6.18 LCD Monitors 5.31
Plasma 6.15 DVD 5.20
LCD 6.12 Home Theatre System 5.07
Washing Machine 6.09 Music Systems 4.98
Refrigerator 6.07 Vacuum Cleaner 4.64
CTV 5.92 Dish Washer 4.59
Air Conditioner 5.87 Washer Dryer Combo 4.42
Microwave Oven 5.75 Air Purifier 4.38
Mobile Phones 5.69

160
7.13 Attitude towards Products and Product Brand Equity scores
Relationship
Table 19: Attitude and Product Brand Equity Correlation
A very high correlation is observed between the Attitude towards the LG products
scores and the Product brand equity scores of all the products of LG, to be as
high as 0.994. Which brings to a logical conclusion that there exists a positive
relationship between the two. A customer-based perspective in the
measurement of brand equity focuses on the experiences that consumers have
with a brand. The stronger the brand, the stronger the customer's attitude toward
the products or services associated with the brand. When
customers experience a product or service, if these experience measures are
positive and endure over time, they result in brand loyalty.
Correlations
LG Attitude scores
LG Brand Equity scores
LG Attitude scores Pearson Correlation
1 .994**
Sig. (2-tailed) .000
N 17 17
LG Brand Equity scores
Pearson Correlation
.994** 1
Sig. (2-tailed) .000
N 17 17
**. Correlation is significant at the 0.01 level (2-tailed).
161
Chapter 8
Conclusion
162
Chapter 8
Conclusion
A strong corporate brand acts as a focal point for the attention, interest and
activity stakeholders bring to a corporation. Like a beacon in the fog, a corporate
brand attracts and orients relevant audiences, stakeholders and constituencies
around the recognizable values and symbols that differentiate the organisation.
Brand extensions allow consumers to draw conclusions and form expectations
about the potential performance of a new product (i.e. the brand extension)
based on their existing knowledge about the brand. The set of associations for
which the parent corporate stands in the market, for what it is known for in the
market, is of prime importance, as it was seen through the brand concept map of
the corporate brand. It is been seen that there has been a confirmation of ranking
of the new product categories, both quantitatively by measuring the Attitude
towards the Brand Extension scores of the new product categories as well as
matching the set of attributes of the hypothetical extensions with the core
associations of LG qualitatively in part one.
As seen from the analysis there exists a positive relationship between the
product brand attitude scores as well as product brand equity scores which
further implies that their respective ranges also have a positive relationship.
Which means that as the range of the product attitude score is higher so is the
product brand equity range. In such a scenario if the ATBE of the hypothetical
extension is falling well below the range of the product attitude, i.e.; falling below
163
the cut off score of the attitudinal range, it will eventually lead to a higher product
attitude range which will lead to a higher product brand equity range. Higher
range in such Umbrella branding type of architecture, would imply a weaker
umbrella brand equity score, which eventually leads to a weaker Corporate brand
strength, eventually weakening the Corporate Brand Equity.
This research would thus benefit the organisations who adopt Corporate
branding strategies, with respect to how far can it stretch its corporate presence
without the parent brand getting diluted or its brand equity getting affected. This
would in turn benefit the organisations in taking Corporate strategic decisions
with respect which product in an unknown category should they invest and which
ones should they not.
164
Chapter 9
LIMITATION AND FUTURE SCOPE
165
Chapter 9
Limitation & Future Scope of Study
The study of the brand extension of LG brand in India has been primarily
conducted in the four prime metros of the country predominantly where there is a
majority of youth population. The attitude towards the brand extension of LG is
thus extracted and analyzed with respect to the prime metros, whereas the
further scope of this study lays to figure out whether there is a similar level of
acceptance or rejection of the brand extension in other parts of the nation
particularly in the Tier II and Tier III cities, which are rapidly growing, as well as
the Rural population, which covers nearly 70% of Indian population. At present
the urban and rural markets in India are growing at an annual rate of 7 to 10 per
cent and 25 per cent respectively. One of the key enablers of this growth has
been the increasing penetration of organized retail. While there are established
distribution networks in both rural and urban India, the presence of well-known
brands and organized sector is increasing. Hence there is a huge scope of
research in the rural areas. Since Consumer Electronics giants and MNC players
like LG is spreading itself rapidly in the Tier II & III as well as rural areas as a part
of its expansion strategy, there lies the future scope of research.
166
Chapter 10
Suggestion and Recommendation

167
Chapter 10
Suggestion and Recommendation
The research suggests a roadmap for any corporate brand to figure out its
eligibility in venturing into any kind of diversifications, which is as follows:
Part One
1) Draw a “Brand Concept Map” for the Corporate Brand (CB)- Bring out the
“core associations” of CB. 2) Choose the “new product categories” (hypothetical
extensions). 3) Draw out a set of “attributes” for the “new product categories” 4)
Correlate the set of attributes with the core associations of CB and rank the new
product categories.
Part Two
1) Measure the “Attitude towards the Brand Extension scores” of the new product
categories and rank them. 2) Compare and reconfirm the ranking with Step 4.
(3) Calculate the Attitude scores of all the current products of the CB and form
the ranges and cut offs. 4) Check out the ATBE score for the respective new
product category (hypothetical extension), if it is below the respective cut offs or
beyond the range, reject the Hypothetical extension or else accept it. (5)
Calculate the Product Brand Equity scores of all the current products of the CB.
(6) With the help of Product brand equity scores formulate a Product brand equity
range for the CB. (7) Correlate the attitude towards the products scores with the
product brand equity scores. Find out the relationship. (8) If there is a positive
168
relationship between the attitude towards the products scores and product brand
equity scores of the CB, then it implies that Narrower the Attitude towards
products range (Range of Attitudinal scores) => Narrower the Product Brand
Equity range => Stronger the CBS => Stronger the CBE. (9) If the ATBE score
below the cut off or beyond the range it may eventually affect the Corporate
Brand Equity.
In case of Master Branding Strategy which is adopted in Consumer Electronics,
the Corporate Brand is associated with every product brand. Hence it is obvious
that lower the range of the product brand equity stronger is its Corporate Brand
Strength.
Which eventually means that the Umbrella Brand Equity is stronger than the
individual product brand equity, on the other hand if the product brand equity
range is large it means that individually the product brand equity is stronger than
the umbrella brand equity or the Corporate brand equity.
As observed there is a positive relationship between the attitude towards the
products scores and product brand equity scores, which means narrower the
Attitude towards products range (Range of Attitudinal scores), narrower the
Product Brand Equity range, which indicates a stronger Corporate Brand
Strength which means a stronger Corporate Brand Equity.
Hence, If the ATBE score below the cut off or beyond the range it may eventually
affect the Corporate Brand Equity.

169
In the given 5 Hypothetical extensions, DTH’s, MSP’s as well as ISP’s ATBE
scores are above the cut off for L.G range of products, hence they are welcomed
in the LG range of families and will not affect the CBE. Whereas Washing
Powder and Life Insurance are well below the cut offs of LG range of products,
hence these products are rejected as they would affect the CBE of LGEI.
It is been observed that the hypothetical extensions such as Direct To Home
Services (DTH) and Mobile Service Provider (MSP) has relatively higher scores
on their Brand concept consistency and Transfer variable, most probably
because they are strongly associated to the electronics arena and are closely
related to the existing LG products such as LG CTVs and mobile phones
respectively, whereas products which are beyond electronics sphere has shown
a higher score for Difficulty to produce.
Since LG is popularly known for CTV, LCD, Plasmas, consumers evaluate highly
for the LG’s brand extensions to DTH, with a high attitude towards DTH product
category. The case of LG as a Mobile service provider has also relatively shown
a high attitude towards brand extension (relatively lesser to DTH), probably as it
also comes in the electronic arena, and consumers can easily relate it with
mobile phones. LG’s ISP extension is taken as a diversification in consumer
electronics, since LG has recently ventured in computer peripherals, so has a
relatively lesser attitude towards brand extension compared to the previous two.
With Non electronics category such as Washing powder taken into consideration,
consumers gave a low rating mostly because this product category was out of
consumer electronics sector, though this was related to the existing Washing

170
machine product, even the combine average score of their attitude level failed to
reach the LG attitude cut off range. As far as Life insurance is concerned it being
an absolute conglomerate diversification like Washing Powder, but in this case is
not related to any of the consumer electronic or home appliance product. Hence
being a non electronic, non durable and a service product it failed to be a part of
LG’s brand extension.
As per the findings and the subsequent analysis, we can recommend for
corporate brands like LG, which has a very strong presence in its electronics and
electronic related sphere that it should try and extend its corporate brand
essence in its own related field. This corporate brand has yet to build up a
greater sphere with respect to its sets of associations, for it to venture into
unrelated product categories.
Thus in general we can predict the success or failure of a corporate brand
extension, within or beyond its related sector, with the help of the above
mentioned roadmap.

171
BIBLIOGRAPHY

172
Bibliography
Aaker, D.A., (2004), Leveraging the corporate brand, California Management
Review, Vol. 46, No.3, pp.6-18;
Aaker, David, and Kevin Keller (1990), “Consumer Evaluations of Brand
Extensions,” Journal of Marketing 54, 27–41.
Aaker, D. A. 1990. “Brand Extensions: The Good, The Bad, and TheUgly,"
Sloan Management Review, 31 (Summer) 47-56.
Aaker, D. A. 1991. Managing Brand Equity: Capitalizing on the Value of
the Brand Name, NewYork, The Free press.
Balmer, J., M., T. and Gray, E., R., (1999), Corporate Identity and Corporate
Communications: Creating a Competitive Advantage, Corporate
Communications: An International Journal, Vol. 4, No. 4, pp.171-176;
Balmer, J., M., T. and Gray, E.R. (2003), Corporate Brands: What are they?
What of them?, European Journal of Marketing, Vol. 37, No. 7-8, pp.972-997;
Balmer, J.M.T. (2001a). “The three virtues and seven deadly sins of corporate
brand management”, Journal of General Management, Vol. 27 No. 1, pp. 1-17.
173
Balachander.S, Ghoose (2003), “Reciprocal spillover effects: A strategic benefit
of brand extensions” Journal of Marketing 67(2), pg 67-88
Balmer, J.M.T. 2001. Corporate identity, corporate branding and corporate
marketing – Seeing through the fog. European Journal of Marketing 35 (3/4),
248-291.
Balmer, J.M.T, Greyser, S.A. 2006. Corporate marketing: Integrating corporate
identity, corporate branding, corporate communications, corporate image and
corporate reputation, European Journal of Marketing 40 (7/8), 730-741.
Balmer, J.M.T, Liao, M. 2007. Student corporate brand identification: an
exploratory case study. Corporate Communications: An International Journal 12
(4), 356-375.
Balmer, J.M.T., Greyser, S.A, Urde, M. 2006. The Crown as a corporate brand:
Insights from monarchies. Journal of Brand Management 14 (1/2), 137.
Barclay, I. and Benson, M. (1990), “Success in new product development:
lessons from the past”, Leadership and Organization Development Journal, Vol.
11 No. 6, pp. 4-12.
Belk, R.W. (1988). Possession and the extended self. Journal of Consumer
Research, 15, 139-168.

174
Bhattacharya, C.B. & Sen, S. (2003). Consumer-company identification: a
framework for understanding consumers' relationships with companies. Journal
of Marketing, 67, 76-88
Bhat, S. and Reddy, S.K. (1998) “Symbolic and Functional Positioning of
Brands”. Journal of Consumer Marketing, Vol. 15, No. 1, 1998, p. 32-43.
Block, P.H., Sherrell, D.L. and Ridgway, N.M. (1986), “Consumer search: an
extended framework”, Journal of Consumer Research, Vol. 13, June, pp. 19.
Bottomley, P.A., Holden, S. J. S., 2001. Do we really know how consumers
evaluate brand extensions? Empirical generalizations based on secondary
analysis of eight studies. Journal of Marketing Research 38, 494-500.
Bottomley, P.A.; Doyle, J.R. (1996) The Formation of Attitudes Towards Brand
Extensions: Testing and Generalising Aaker and Keller’s Model, International
Journal of Research in Marketing, Vol. 13, No. 4, pp. 365-377.
Boush, D. M., Loken, B. 1991. A process-tracing study of brand extension
evaluation. Journal of Marketing Research 28 (1), 16-28.
Boush, D. M., & Loken, B. 1991. “A process-tracing study of brand extension
evaluation”. Journal of Marketing Research, February 28,
16-28.
Brown, T., J. and Dacin, P., A., (1997), The Company and the Product:
Corporate Associations and Product Responses, Journal of Marketing, January;

175
Brown, T., J., (2003), Book Reviews: Corporate Reputation and Competitiveness,
Corporate Reputation Review, Vol. 5, No. 4, pp.368-370;
Brozniarczyk, S.M.; Alba, J.W. (1994) The Importance of the Brand in Brand
Extensions, Journal of Marketing Research, Vol. 31, pp. 214-228.
Cabral, Lu´ıs (2000), “Stretching Firm and Brand Reputation,” Rand Journal of
Economics31, 658–673.
Chaudhuri, A. and Holbrook, M.B. (2001), “The chain of effects form brand trust
and brand effect to brand performance: the role of brand loyalty”, Journal of
Marketing, Vol. 65 No. 2, pp. 81-93.
Chen, A.C. (2001), “Using free association to examine the relationship between
the characteristics of brand associations and brand equity”, Journal of Product &
Brand Management, Vol. 10 Nos. 6/7, pp. 439-49.
Choi, Jay Pil (1997), “Brand Extension and Informational Leverage,” Review of
Economic Studies 65, 655–69.
Choi, Chong Ju, and Carlo Scarpa (1992), “Credible Spatial Preemption Through
Reputation Extension,” International Journal of Industrial Organization 10, 439–
447.

176
Chun, R. and Davies, G., (2006), The Influence of Corporate Character on
Customers and Employees: Exploring Similarities and Differences, Journal of the
Academy of Marketing Science, Vol. 34, No. 2, pp.138-146;
Cohen, J. B. (1982). “The role of affect in categorization: Towards a
reconsideration of the concept of attitude”, in Advances in Consumer research.
Corti, P., (2003), Book Reviews: Revealing the Corporation. Perspectives on
Identity, Image, Reputation, Corporate Branding and Corporate-level Marketing,
European Journal of Marketing, Vol. 37, No. 7-8, pp.1142-1150;
Cronbach, L. J. (1951) “Coefficient alpha and the internal structure of tests”,
Psychometrica, 16, 297-334.
Czellar, S. and Palazzo, G. (2004). “The impact of perceived corporate brand
values on brand preference: an exploratory empirical study” Master Thesis,
Universite De Lausanne.
Dacin, P. A. and Smith, D. C. (1994). “The effect of brand portfolio characteristics
on consumer evaluations of brand extensions”. Journal of Marketing Research,
31, 229- 242.
Dacin, P., A. and Brown, T., J., (2005), Corporate Identity and Corporate
Associations: a framework for future research, Corporate Reputation Review,
Vol. 5, No. 2-3, pp.254-263;
177
Dalrymple, Douglas J. and Parsons, Leonard J. (2000), “Marketing
Management”, 7 the., USA, Hermitage Publishing Service, Inc.
Davis, Scott M. (2002), Brand Asset Management: Driving Profitable Growth
through Your Brands, San Francisco, Josey Bass.
Davis, Scott M. M. and Micheal Dunn (2002), Building the Brand-Driven
Business: Operationalize Your Brand to Drive Profitable Growth, San Francisco,
Josey Bass.
de Chernatony, L. and Segal-Horn, S. (2001). “Building on services'
characteristics to develop successful services brands”. Journal of Marketing
Management, 17(7/8), 645-669.
de Ruyter, K. and Wetzels, M. (2000). “The role of corporate image and
extension similarity in service brand extensions”. Journal of Economic
Psychology, 21(6), 639- 660.
Dolich, Ira J. (1996). “Congruence Relationship Between Self Images and
Product Brands” Journal of Marketing Research, Vol. 6, Feb. 1969, p. 80-84.
Douglas J. Dalrymple and Leonard J. Parsous (2000), the textbook of Marketing
Management, USA
178
Douglas, S. P., Craig, C. S. and Nijssen, E. J. (2001). “Executive insights:
integrating branding strategy across markets: building international brand
architecture”. Journal of International Marketing, 9(2), 97-114.
Dyson, P., Farr, A. and Hollis, N. (1996), “Understanding, measuring, and using
brand equity”, Journal of Advertising Research, November/December, pp. 9-21.
Erickson, G.M.,Johansson, J.K. and Chao, P. (1984), “Image variables in multi-
attribute product evaluations: country-of-origin effects”, Journal of Consumer
Research,Vol. 11, September, pp. 694-9.
Farquhar, Peter H. (1989), “Managing Brand Equity”, Marketing Research, 1
(September), 24-33.
Farquhar, Peter H., J. Y. Han, Y. Iriji (1991), Recognizing and Measuring Brand
Assets, Report 91-119, Marketing Science Institute, Cambridge, MA.
Fiske, S. T. (1982). “Schema-triggered affect: applications to social perception” in
Affect and Cognition:The 17th
AnnualCarnegie Sym podium on Cognition, Clark,
M. S. and Fiske, S. T., eds. Hillsdale, N J:Lawrence Erlbaum Associates, 171-
190.
Fiske, S. T. and Pavelchak, M. A. (1986). “Category-based versus piecemeal-
based affective responses: developments in schema-triggered affect”, in The
Handbook of Motivation and Cognition: Foundation for Social Behaviour,
Sorrentino, R. W . and Higgins, E. T., eds. New York: Guilford Press, 167-203.
179
Fombrun, C. (1996). Reputation: Realising Value from the Corporate Image,
Harvard Business School Press, Boston, MA.
Fombrun, C.J. and Van Riel, C.B.M. (1997). “The reputational landscape”,
Corporate Reputation Review, Vol. 1 No. 1, pp. 5-15.
Fournier, S. (1998). Consumers and their brands: Developing relationship theory
in consumer research. Journal of Consumer Research, 24 (4), 343-73.
Gaines-Ross D.L. 1997. Part III: Measuring and Valuing Reputations: Leveraging
Corporate Equity. Corporate Reputation Review 1 (1), 51.
Gallarza, M.G., Daura, I.G, García, H.C. 2002. Destination image. Towards a
conceptual framework. Annals of Tourism Research 29 (1), 56-78.
Gotsi, M, Andriopoulos, C. 2007. Understanding the pitfalls in the corporate
rebranding process Corporate Communications: An International Journal 12 (4),
341-355.
Gregory, J.R. 2001. The bottom-line impact of corporate brand investment: An
analytical perspective on the drivers of ROI of corporate brand communications.
Journal of Brand Management 8 (6), 405.

180
Gregory J.R. 1998. Does corporate reputation provide a cushion to companies
facing market volatility? Some supportive evidence. Corporate Reputation
Review 1 (3), 288.
Gregory J.R. 1997. Part III: Measuring and valuing reputations: ROI: Calculating
advertising's impact on stock price. Corporate Reputation Review 1 (1), 56.
Gregory J.R, McNaughton L. 2004. Brand logic: A business case for
communications. Journal of Advertising Research 44 (3), 232-236.
Gregory, J.R. (2004). The Best of Branding: Best Practices in Corporate Brand,
McGraw-Hill.
Gregory, J.R.& Wiechmann, J.G. (1997), Leveraging Corporate Brand, NTC
Business Book.
Greyser, S. (1999). “Advancing and enhancing corporate reputation”, Corporate
Communications, Vol. 4 No. 4, pp. 177-81.
Greyser, S.A., Balmer, J.M.T, Urde, M. 2006. The monarchy as a corporate
brand: Some corporate communications dimensions. European Journal of
Marketing 40 (7/8), 902-908. 11
Griffin, J.J. 2002. To brand or not to brand? Trade-offs in corporate branding
decisions. Corporate Reputation Review 5 (2/3), 228.
181
Griffin, J. J. (2002). “Branding as strategy:new forms of decision-processes”.
Corporate Reputation Review , 5(2/3), 227-240.
Gylling, C, Lindberg-Repo, K. 2006. Investigating the links between a corporate
brand and a customer brand. Journal of Brand Management 13 (4/5), 257.
Gurhan-Canli, Z., Maheswaran, D., 1998. The effects of extensions on brand
name dilution and enhancement. Journal of Marketing Research 35 (4), 464-473.
Hansen, F, Christensen, L.B. 2007. Dimensions in consumer evaluation of
corporate brands and the role of emotional response strength (NERS). Innovative
Marketing 3 (3), 19-27.
Harris, F. and De Chernatony, L., (2001), Corporate Branding and Corporate
Brand Performance, European Journal of Marketing, Vol. 35, No. 3-4, pp.441-
456;
Hatch, M., J. and Schultz, M., (1997), Relations between organizational culture,
identity and image, European Journal of Marketing, Vol. 31, No. 5-6, pp.356 et ff.;
Hatch, M., J. and Schultz, M., (2003), Bringing the corporation into corporate
branding, European Journal of Marketing, Vol. 37, No. 7-8, pp.1041-1064;
Hatch, M.J., & Schultz, M. (2001). Are the strategic stars aligned for your
corporate brand? Harvard Business Review, 79, 128-134
182
Hair, J. F., Anderson, R. E., Tatham, R. L. and Black, W . C. (1998).
Multivariate Data Analysis (5th
Ed.). U pper Saddle River, N J:Prentice H all.
Hem, L. E., Iversen, N. M., 2002. Transfer of brand equity in brand extensions:
The importance of brand loyalty. Advances in Consumer Research 30, 72-79.
He, H, Balmer, J.M.T. 2006. Alliance brands: Building corporate brands through
strategic alliances? Journal of Brand Management 13 (4/5), 242.
He, H, Balmer, J.M.T. 2007. Identity studies: multiple perspectives and
implications for corporate-level marketing. European Journal of Marketing 41
(7/8), 765-785.
Hubbard, R. and Armstrong, J. S. (1994). “Replications and extensions in
marketing: rarely published but quite contrary”. International Journal of Research
in Marketing, 11(3), 233-249.
Jacoby, J. and Kaplan, L.B. (1972), “The components of perceived risk”, in
Venkatesan, M. (Ed.), Proceedings of the Third Annual Conference of the
Association for Consumer Research, Association for Consumer Research,
College Park, MD, pp. 382-93.
Jarillo, J.C. (1988), “On strategic networks”, Strategic Management Journal, Vol.
19, pp. 31-41.
183
Jitchaya, W. (2005). “Brand Awareness, Association and Influences on
Purchasing Decision: a case study of The Body Shop in Thailand”, Master thesis:
AIT University, Thailand.
Joanna Barrett, Ashley Lye & P. Venkateswarlu, Consumer Perceptions of Brand
Extensions: Generalising Aaker & Keller’s Model, University of Canterbury.
Jokanivic, J. (2005). “Corporate Brand Equity Valuation in The Food and
Beverage Industry in Slovenia” , Master Thesis: University of LjubJana, Slovenia.
Kapferer, Jean-Noel (1997), Strategic Brand Management, Great Britain, Kogan
Page.
Keller, K. Lane and David A. A. (1992), “The Effects of Sequential Introduction of
Brand Extensions” Journal of Marketing Research, 29(1), 35-50.
Keller K.L, Aaker D.A. 1998. The impact of corporate marketing on a company's
brand extensions. Corporate Reputation Review 1 (4), 356.
Keller K. L. and Sood, S. (2001/2), “The Effects of Branding Strategies and
Product Experience on Brand Evaluations”, Forthcoming in Journal of Marketing

184
Keller, K., L. and Richey, K., (2006), The importance of corporate brand
personality traits to a successful 21st century business, Brand Management, Vol.
14, No. 1-2, pp.74-81;
Keller, K.L. (2000b). “Building and managing corporate brand equity”, in Schultz,
M.,Hatch, M.J.and Larsen, M.H. (Eds). The Expressive Organisation – Linking
Identity, Reputation, and the Corporate Brand, Oxford University Press, Oxford.
Keller, K.L. (2003). Brand synthesis: the multidimensionality of brand knowledge.
Journal of Consumer Research, 29, 595-600.
Keller, K.L. (2003). Strategic Brand Management: Building, Measuring and
Managing Brand Equity, 2nd ed., Prentice-Hall, Englewood Cliffs, NJ.
Keller, K. L., & Sood, S. (2003). Brand equity dilution. Sloan Management
Review, 45(1), 12—15.
Keller, Kevin Lane (1993), “Conceptualizing, Measuring, and Managing
Customer-Based Brand Equity”, Journal of Marketing, 57 (January), 1-22.
Kent, J.R. and Allen T.C.: Competitive Interference Effects in Consumer Memory
for Advertising: The Role of Brand Familiarity. Journal of Marketing, Vol. 58,
No. 3, 1994, p. 97-105.

185
Kim, C.K., Lavak, A.M. and Smith, M. (2001), “Consumer evaluations of vertical
brand extensions and core brands”, Journal of Business Research, Vol. 52, pp.
211-22.
Kim, Hong-Bumm, Woo Gon Kim, and Jeong A. AN (2003), “The Effect of
Consumer-Based Brand Equity on Firms’ Financial Performance”, Journal of
Consumer Marketing, 20 (4), 335-351.
King, Stephen (1991), “Brand Building in the 1990’s”, Journal of Marketing
Management, 7 (1), 3-13.
Kirmani, A., Sood, S. and Bridges, S. (1999), “The ownership effect in consumer
responses to brand line stretches”, Journal of Marketing, Vol. 63 January, pp. 88-
101.
Klink, R. R. and Daniel C. S. 2001. “Threats to External Validity of Brand
Extension Research,” Journal of Marketing Research 38(3), 326-335.
Klink, R.R. and Smith, D.C. (2001), “Threats to the external validity of brand
extension research”, Journal of Marketing Research, Vol. 38 No. 3, pp. 326-35.
Knox, S. and Bickerton, D., (2003), The Six Conventions of Corporate Branding,
European Journal of Marketing, Vol. 37, No.7-8, pp. 998-1016;
Knox, S., Maklan, S. and Thompson, K.E. (2000), “Building the unique value
proposition”, in Schultz, M., Hatch, M.J. and Larsen, M.H. (Eds), The Expressive
186
Organisation – Linking Identity, Reputation, and the Corporate Brand, Oxford
University Press, Oxford.
Kohli, Chiranjeev and Mrungak Thakor (1997), “Branding Consumer Goods:
Insights form Theory and Practice”, Journal of Consumer Marketing, 14 (3), 206-
219.
Krishnan, B. C. and Hartline, M. D. (2001). “Brand equity: is it more important in
services?”. Journal of Services Marketing, 15(5), 328-342.
Kotler, P. (2000), Marketing Management: Analysis, Planning, Implementation
and Control, 10th ed., Prentice-Hall, Englewood Cliffs, NJ.
Kotler, Philip and G.Armstrong (2001), “Principles of Marketing”, 9th ed., New
Jersey: Prentice-Hall, Inc.
Labahn, D.W. and Kohli, C. (1997), “Maintaining client commitment in advertising
agency-client relationships”, Industrial Marketing Management, Vol. 26, pp. 497-
508.
Laforet, S. 2007. British grocers' brand extension in financial services. Journal of
Product & Brand Management 16 (2), 82-97.
Lambert, Z.V. (1972). “Perceptual patterns, information handling and
innovativeness”. Journalof M marketing Research, 9(4), 427.
187
Lance, Charles E. (1988), “Residual centering, exploratory and confirmatory
moderator analysis, and decomposition of effects in path models containing
interactions,” Applied Psychological Measurement, 12(2), 163-175.
Lassa, Walfried, Banwari Mittal, and Sharma Arun (1995), “Measuring Customer-
Based Brand Equity”, Journal of Consumer Marketing, 12 (4), 11-19.
Leone, R. P. and Schultz, R. L. (1980). “A study of Marketing Generalizations”.
Journal of Marketing, 44(1), 11-18.
Likert, R. (1932). “A technique for the measurements of attitudes”. Archives of
Psychology, 140.
Logman, Marc (2004), “The LOGMAN Model: A Logical Brand Management
Model”, Journal of Product and Brand Management, 13 (2), 94-104.
Loken, B. and John, D. R. (1993). “Diluting brand beliefs: when do brand
extensions have a negative impact?”. Journalof Marketing, 57(3), 71-85.
Lynch, J. G. and Thomas K. S. 1982. “Memory and Intentional Factors in
Consumer Choice: Concepts and Research Methods.” Journal of Consumer
Research, 9(June), 18-37.
MacInnis, D.J. and Nakamoto, K. (1990), “Examining factors that influence the
perceived goodness of brand extensions” Working paper no. 54, Karl Eller
Graduate School of Management, University of Arizona, Tucson, AZ.
188
McAllister, D.J. (1995), “Affect and cognition based trust as foundations for
interpersonal cooperation in organizations”, Academy of Management Journal,
Vol. 38, February, pp. 24-59.
McDonald, M.H.B., De Chernatony, L., and Harris, F., (2001), Corporate
marketing and service brands. Moving beyond the fast-moving consumer goods
model, European Journal of Marketing, Vol. 35, No. 3-4,pp.335 et ff.;
MCADAM, RODNEY AND DENIS LEONARD (2003), “Corporate Social
Responsibility in a Total Quality Management Context: Opportunities for
Sustainable Growth”, Corporate Governance, 3 (4), 36-45.
McAlexender, James H., John W. Schouten, and Harold F. Koenig (2002),
“Building Brand Community”, Journal of Marketing, 65 (January), 38-54.
McWillaim, Giland Angela Dumas (1997), “Using Metaphors in New Brand
Design”, Journal of Marketing Management, 13, 265-284.
McWilliam, G. (1993), “The effect of brand typology on brand extension fit:
commercial and academic research findings”, European Advances in Consumer
Research, Vol. 1, pp. 485-91.
MacInnis, D. J. and Nakamoto, K. (1990). “Examining factors that influence the

189
perceived goodness of brand extensions”. Working Paper #54, Karl Eller
Graduate School of Management, University of Arizona.
Mackay, M. M. (2001). “Application of brand equity measures in service markets”.
Journal of Services Marketing, 15(3), 210-221.
Meijs, M., (2002), The myth of manageability of Corporate Identity, Corporate
Reputation Review, Vol. 5, No.1, pp.20-34;
Malhotra, N . K. and Birks, D. F. (2003). Marketing Research: An Applied
Approach (3rd Ed.). Harlow: Prentice-Hall.
Malhotra N.T. and Birks D.F. (1999). Marketing Research: An Applied Approach,
FT, Prentice Hall Inc. London, p.770
Martinez, E., de Chernatony, L., 2004. The effect of brand extension strategies
on brand image. Journal of Consumer Marketing 21 (1), 39-50.
Martinez, E., Pina, J.A., 2003. The negative impact of brand extensions on
parent brand image. Journal of Product and Brand Management 12 (7), 432 –
448.
Michell, P., King, J. and Reast, J. (2001). “Brand values related to industrial
products”. Industrial Marketing Management, 30(5), 415-425.
Mitchell, V. W. (1999), “Consumer Perceived Risk: Conceptualizations and

190
Models”, European Journal of Marketing, 33 (1 & 2).
Moorman, C., Deshpande, R. and Zaltman, G. (1993), “Factor affecting trust in
market research relationships”, Journal of Marketing, Vol. 57, January, pp. 81-
101.
Moorthi, Y. L. R. (2002). “An approach to branding services”. Journalof Services
Marketing, 16(3), 259-274.
Morrin, M. (1999). “The impact of brand extensions on parent brand memory
structures and retrieval processes”. Journal of Marketing Research, 36(4), 517-
526.
Montoya, W. & Mitzi M. and Calantone, R. 1994. Determinants of New product
Performance: A Review and Meta-Analysis”, Journal of Product Innovation
Management, 11 (November), pp. 397-417.
Motameni, R. and M. Shahorkhi (1998), “Brand Equity Valuation: A Global
Perspective”, Journal of Product and Brand Management, 7 (4), 275-290.
Motion, J. &Leitch, S & Brodie, R. (2003): Equity in corporate co-branding: The
case of Adidas and the All Blacks, European Journal of Marketing 37(7/8) 1180-
1094
Mudambi, S. (2002). “Branding importance in business-to-business markets -
191
Three buyer clusters”. Industrial Marketing Management, 31(6), 525-533.
Muniz, Albert M. JR. and Thomas C. O’Guinn (2001), “Brand Community”,
Journal of Consumer Research, 27 (March), 412-432.
Muzellec, L. 2006. What is in a name change? Rejoycing corporate names to
create corporate brands. Corporate Reputation Review 8 (4), 305.
Muzellec, L, Lambkin, M. 2006. Corporate rebranding: destroying, transferring or
creating brand equity? European Journal of Marketing 40 (7/8), 803-824.
Muzellec, L, Lambkin, M. 2007. Does Diageo make your Guinness taste better?
Journal of Product and Brand Management 16 (5), 321-333.
Muzellec, L., Doogan, M, Lambkin, M. 2003. Corporate rebranding - an
exploratory review. Irish Marketing Review 16 (2), 31.
Nanji, Z. and Parsons, K. (1997), “So many choices”, Telephony, Vol. 233 No. 7,
pp. 34-40.
Newman, J.W. and Staelin, R. (1972), “Prepurchase information seeking for new
cars and major household appliances”, Journal of Marketing Research, Vol. 9,
August, pp. 249-57.
Neter, J., Wasserman, W . and Kutner, M. H . (1990), Applied Linear Statistical
Models: Regression, Analysis of Variance, and Experimental Designs. Burr
Ridge, IL: Irwin.
O'Cass, A. and G race, D. (2003). “An exploratory perspective of service brand
192
associations”. Journal of Services Marketing, 17(5), 452-475.
Olins,W. (1989), Corporate Identity, Harvard Business School Press, Boston,
MA.
Ostlund, L. E. (1974). “Perceived innovation attributes as predictors of
innovativeness”. Journal of Consumer Research, 1(2), 23-29.
Palazzo, G, Basu, K. 2007. The ethical backlash of corporate branding. Journal
of Business Ethics 73 (4), 333. 14
Papadatos, C. 2006. The art of storytelling: how loyalty marketers can build
emotional connections to their brands. Journal of Consumer Marketing 23 (7),
382-384.
Papasolomou, I, Vrontis, D. (2006a). Building corporate branding through internal
marketing: the case of the UK retail bank industry. The Journal of Product and
Brand Management 15 (1), 37-47.
Papasolomou, I, Vrontis, D. (2006b). Using internal marketing to ignite the
corporate brand: The case of the UK retail bank industry. Journal of Brand
Management 14 (1/2), 177.
Park, C. W. & Millberg, S & Lawson, R. 1991. “Evaluation of Brand Extensions:
The role of Product Level Similarity and Brand Concept Consistency” Journal
of Consumer Research, 18(September), 185- 193.

193
Parkerson, B, Saunders, J. 2005. City branding: Can goods and services
branding models be used to brand cities? Place Branding 1 (3), 242.
Peterson, R. A. (1994). “A meta-analysis of Cronbach’s coefficient alpha”,
Journal of Consumer research, 21, 381-91.
Piña, J.M., Martinez, E., de Chernatony, L, Drury, S. 2006. The effect of service
brand extensions on corporate image: An empirical model. European Journal of
Marketing 40 (1/2),174-197.
Pitt, L.F., Watson, R.T., Berthon, P., Wynn, D, Zinkhan, G. 2006. The Penguin's
Window: corporate brands from an open-source perspective. Journal of the
Academy of Marketing Science 34 (2), 115.
Polonsky, M.J, Jevons, C. 2006. Understanding issue complexity when building a
socially responsible brand. European Business Review 18 (5), 340-349.
Park, C. Whan, Bernard J. Jaworski, and Deborah J.Macinnis (1986), “Strategic
Brand Concept- Image Management”, Journal of Marketing, 50 (October), 135-
145.
Punj, G. (1987), “Prosearch decision making in consumer durable purchases”,
Journal of Consumer Marketing, Vol. 4, Winter, pp. 71-82.
Rajagopal and Sanchez, R. (2004). “Conceptual analysis of brand architecture
and relationships within product categories”. Brand Management, 11(3), 233-247.
194
Rangaswamy, A., Burke, R.R. and Oliva, T.A. (1993), “Brand equity and the
extendability of brand names”, International Journal of Research in Marketing,
Vol. 10, pp. 61-75.
Rao, A. R. and Monroe, K. B. 1989. “The Effect of Price, Brand Name, and Store
Name on Buyers’ Perceptions of Product Quality: An Integrative Review”,
Journal of Marketing Research, 26 (August), pp. 35 1-357.
Ravi, P., Pascale, G. Quester and Ray, W. Cooksey (2005) “ Customer- based
brand equity: Improving the measurement”, Journal of Product & Brand
Management, Vol. 10 No.3, pp. 143-154
Reast, J.D. (2003), “The role of brand trust within related and unrelated brand
extension activities: a consumer perspective”, unpublished PhD thesis, Leeds
University Business School, Leeds University, Leeds, January.
Reddy, S.K., Holak, S.L. and Bhat, S. (1994), “To extend or not to extend:
success determinants of line extensions”, Journal of Marketing Research, Vol.
31, May, pp. 243-62.
Riel, A.C.R. van, Lemmink, J. and Ouwersloot, H . (2001). “Consumer
evaluations of service brand extensions”. Journalof Service Research, 3(3), 220-
231.

195
Rio, A., Vazquez, R. and Iglesias, V. (2001a), “The role of the brand name in
obtaining differential advantages”, Journal of Product & Brand Management,
Vol. 10 No. 7, pp. 452-65
Rio, A., Vazquez, R. and Iglesias, V. (2001b), “The effects of brand associations
on consumer response”, Journal of Consumer Marketing, Vol. 18 No. 5, pp. 410-
25.
Rossiter, J.R. and Percy, L. (1987), Advertising and Promotion Management,
McGraw- Hill, New York, NY
Roerich, G . (2004). “Consumer innovativeness: concepts and measurements”.
Journalof Business Research, 57(6), 671-677.
Saunders J, Guoqun F. 1997. Dual branding: how corporate names add value.
Journal of Product & Brand Management 6 (1), 40-48.
SCHMITT, BREND H. (1999), Experiential Marketing: How to Get Customers to
Sense, Feel, Act and Relate to Your Company and Brands, New York, Free
Press.
Schultz, Majken and Mary JO Hatch (2003), “The Cycles of Corporate Branding:
The Case of the LEGO Company”, California Management Review, 46 (1), 6-26.
Schultz, M., Hatch, M.J. and Larsen, M.H. (Eds), The Expressive Organisation–
Linking Identity, Reputation, and the Corporate Brand, Oxford University Press,
Oxford.

196
Schultz, D.E, Kitchen, P.J. 2004. Managing the changes in corporate branding
and communication: closing and re-opening the Corporate Umbrella*. Corporate
Reputation Review 6 (4), 347.
Schultz, M., & de Chernatony, L. (2002). The challenge of corporate branding.
Corporate Reputation Review, 5, pp. 105-112.
Sharma, S. (1996). Applied Multivariate Techniques. New York. John Wiley &
Sons, p.493.
Shocker, A.D., R.K. Srivastava, and R.W. Rueckert (1994), “Challenges and
Opportunities Facing Brand Management: An Introduction to a Special Issue”,
Journal of Marketing Research, 31 (May), 149-158.
Simon, H. (1957), Administrative Behaviour. A Study of Decision-Making
Processes in Administrative Organizations, Macmillan, New York, NY.
Simon, Carol J. and Mary W. Sullivan (1993), “The Measurement and
Determinants of Brand Equity: a Financial Approach”, Marketing Science, 12
(Winter), 28-52.
Smith, Craig N. (2003), “Corporate Social Responsibility: Whether or How?”,
California Management Review, 45 (4), 52-76.
Smith, D.C. and Andrews, J. (1995), “Rethinking the effect of perceived fit on
customers’ perceptions of new products”, Journal of the Academy of Marketing
Science, Vol. 23, Winter, pp. 115-24.

197
Smith, D. C. and Park, C. W. 1992. “The Effects of Brand Extensions on Market
Share and Advertising Efficiency”, Journal of Marketing Research, 29, pp. 296-
313.
Smith, Scott M. and David S. Alcorn (1991), “Cause Marketing: A New Direction
in the Marketing of Corporate Responsibility”, Journal of Services Marketing, 5
(4), 21-37.
SPEAK, KARL D. (1998), “Brand Stewardship”, Design Management Journal,
Winter, 32-37.
Srivastava, R.K and A.D. Shocker(1991), Brand Equity: A Perspective on its
Meaning and Measurement, Report 91-124, Marketing Science Institute,
Cambridge,
Souiden, N., Kassim, N.M, Hong, H. 2006. The effect of corporate branding
dimensions on consumers' product evaluation: A cross-cultural analysis.
European Journal of Marketing 40 (7/8), 825-845.
Sujan, M. and Bettman James R. (1989) “The Effects of Brand Positioning
Strategies on Consumers’ Brand and Category Perception: Some Insights from
Schema Research. Journal of Marketing Research, Vol. 26, Nov. 1989, p. 454-
467.

198
Sullivan, M. (1990). Measuring image spillovers in umbrella branded products.
Journal of Business, 63(3), 309—329.
Sunde, L. and Brodie, R.J., (1993). “Consumer evaluations of brand extensions:
Further empirical evidence”. International Journal of Research in Marketing, 10,
47-53.
Thakor, Mrugnak V. and Anne M. Lavack (2003), “Effect of Perceived Brand
Origin Associations on Consumer Perceptions of Quality”, Journal of Product and
Brand Management, 12 (6), 394-407.
Tollin, K. 2007. Branding at a corporate management level. Innovative Marketing
3 (1), 23.
Topalian, A. 2003. Experienced reality: The development of corporate identity in
the digital era European Journal of Marketing 37 (7/8), 1119-1132.
Trueman, M., Klemm, M, Giroud, A. 2004. Can a city communicate? Bradford as
a corporate brand. Corporate Communications: An International Journal 9 (4),
317-330.
Uggla, H. 2006. The corporate brand association base: A conceptual model for
the creation of inclusive brand architecture. European Journal of Marketing 40
(7/8), 785-802.
199
Underwood, Robert, Edward Bond, and Robert Baer (2001), “Building Service
Brands Via Social Identity: Lessons From the Sports Marketplace”, Journal of
Marketing Theory and Practice, 9 (Winter), 1-13.
Urde, M. (1999). “Brand orientation: a mindset for building brands into strategic
resources”. Journal of Marketing Management, 15(1-3), 117-133.
Urde, M. 2003. Core value-based corporate brand building. European Journal of
Marketing 37, (7/8), 1017-1040.
Vallaster, C, de Chernatony, L. 2006. Internal brand building and structuration:
the role of leadership. European Journal of Marketing 40 (7/8), 761-784. 16
Van Riel, A.C.R., Lemminto, J. and Ouwersloot, H. (2001), “Consumer
evaluations of service brand extensions”,Journal of Service Research, Vol. 3 No.
3, pp. 220-31.
Van den Bosch, A.L.M., Elving, W.J.L, de Jong, M.D.T. 2006. The impact of
organisational characteristics on corporate visual identity. European Journal of
Marketing 40 (7/8), 870-885.
Van Rekom, J., Jacobs, G., Verlegh, P.W.J, Podnar, K. 2006. Capturing the
essence of a corporate brand personality: A Western brand in Eastern Europe.
Journal of Brand Management 14 (1/2), 114.
Van Riel, Cees B M. 2002. Top of mind awareness of corporate brands among
the Dutch public Corporate Reputation Review 4 (4), 362.
200
Van Riel, Cees B M, van Bruggen, G.H. 2002. Incorporating business unit
managers' perspectives in corporate-branding strategy decision making.
Corporate Reputation Review 5 (2/3), 241.
Vitiello, R, Willcocks, M. 2006. The difference is in the detail: Its potential as a
place branding tool and impact upon perceptions and responses. Place Branding
2 (3), 248.
Vo’lckner, F., & Sattler, H. (2006). Drivers of brand extension success. Journal of
Marketing, 70(2), 18—34.
Wanida, W. (2002). “Consumer behavior and factors affecting buying decision of
house brand of Tesco Lotus”, Independent study, Kasetsart University, Thailand
Webster, F. E. Jr. and Keller, K. L. (2004). “A roadmap for branding in industrial
markets”. Brand Management, 11(5), 388-402.
Webster, F.E. (2000), “Understanding the relationships among brands,
consumers, and resellers”, Journal of the Academy of Marketing Science, Vol. 28
No. 1, pp. 17-24.
Wheeler, A.R., Richey, R.G., Tokkman, M, Sablynski, C.J. 2006. Retaining
employees for service competency: The role of corporate brand identity. Journal
of Brand Management 14 (1/2),96.
Wilkinson A, Balmer J.M.T. 1996. Corporate and generic identities: lessons from
the Cooperative Bank. International Journal of Bank Marketing 14 (4), 22-35

201
Xie, H.Y, Boggs, D.J. 2006. Corporate branding versus product branding in
emerging markets: A conceptual framework. Marketing Intelligence & Planning
24 (4), 347-364
Yoo, B. and Donthu, N. (2001), “Developing and validating a multidimensional
consumer-based brand equity scale”, Journal of Business Research, Vol. 52, pp.
1-14.
Zeithaml, V.A. (1988), “Consumer perceptions of price, quality, and value: a
means- end model and synthesis of evidence”, Journal of Marketing, Vol. 52 No.
3, pp 2-22.

202
ANNEXURE
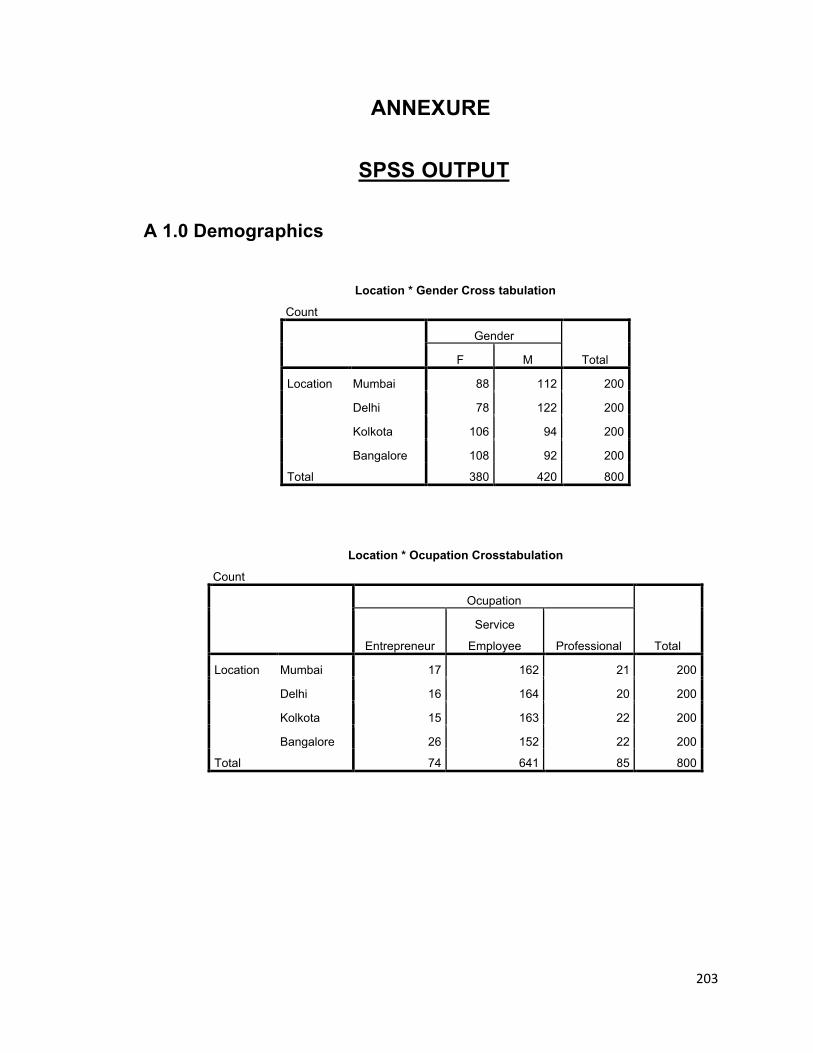
203
ANNEXURE
SPSS OUTPUT
A 1.0 Demographics
Location * Gender Cross tabulation
Count
Gender
TotalF M
Location Mumbai 88 112 200
Delhi 78 122 200
Kolkota 106 94 200
Bangalore 108 92 200
Total 380 420 800
Location * Ocupation Crosstabulation
Count
Ocupation
TotalEntrepreneur
Service
Employee Professional
Location Mumbai 17 162 21 200
Delhi 16 164 20 200
Kolkota 15 163 22 200
Bangalore 26 152 22 200
Total 74 641 85 800

204
A 2.0 Item Scale Statistics – Corporate Brand Strength
a. Corporate Brand Positioning
Item Statistics
Mean Std. Deviation N
CBP1 5.6810 .7342 800
CBP 2 4.9112 .8156 800
CBP 3 4.7330 .7431 800
CBP 4 5.0514 .6851 800
Summary Item Statistics
Mean Minimum Maximum RangeMaximum/Minimum N. of
items Item Means 5.09 4.54 5.82 1.28 1.281 4
Reliability Statistics
Cronbach's
Alpha
Cronbach's
Alpha Based on
Standardized
Items N of Items
.901 .857 4

205
b. Corporate Brand Perceived Quality
Item Statistics
Mean Std. Deviation N
CBQ1 5.3022 .9512 800
CBQ2 5.3214 .7356 800
CBQ3 5.4155 .8825 800
CBQ4 5.0803 .6622 800
CBQ5 5.4522 1.044 800
CBQ6
CBQ7
4.9142
5.0132
0.556
0.887
800
800
Summary Item Statistics
Mean Minimum Maximum RangeMaximum/Minimum N. of
items Item Means 5.21 4.78 5.54 0.76 1.158 7
Reliability Statistics
Cronbach's
Alpha
Cronbach's
Alpha Based on
Standardized
Items N of Items
.802 .763 7

206
c. Corporate Brand Identity
Reliability Statistics
Cronbach's
Alpha
Cronbach's
Alpha Based on
Standardized
Items N of Items
.879 .836 9
Summary Item Statistics
Mean Minimum Maximum RangeMaximum/Minimum N. of
items Item Means 5.91 5.48 6.38 0.9 1.16 9
Item Statistics
Mean Std. Deviation N
CBI1 6.02 .52142 800
CBI 2 6.13 .63316 800
CBI 3
CBI 4
CBI 5
CBI 6
CBI 7
CBI 8
CBI 9
6.24
5.93
5.54
5.48
6.04
5.93
5.88
.72344
1.0233
.86772
1.0023
.8922
.9454
.6421
800
800
800
800
800
800
800

207
A 3.0 Item Scale Statistics – Parent Brand Characteristics
a. Parent Brand Knowledge
Case Processing Summary
N %
Cases Valid 800 100.0
Excludeda 0 .0
Total 800 100.0
a. Listwise deletion based on all variables in the
procedure.
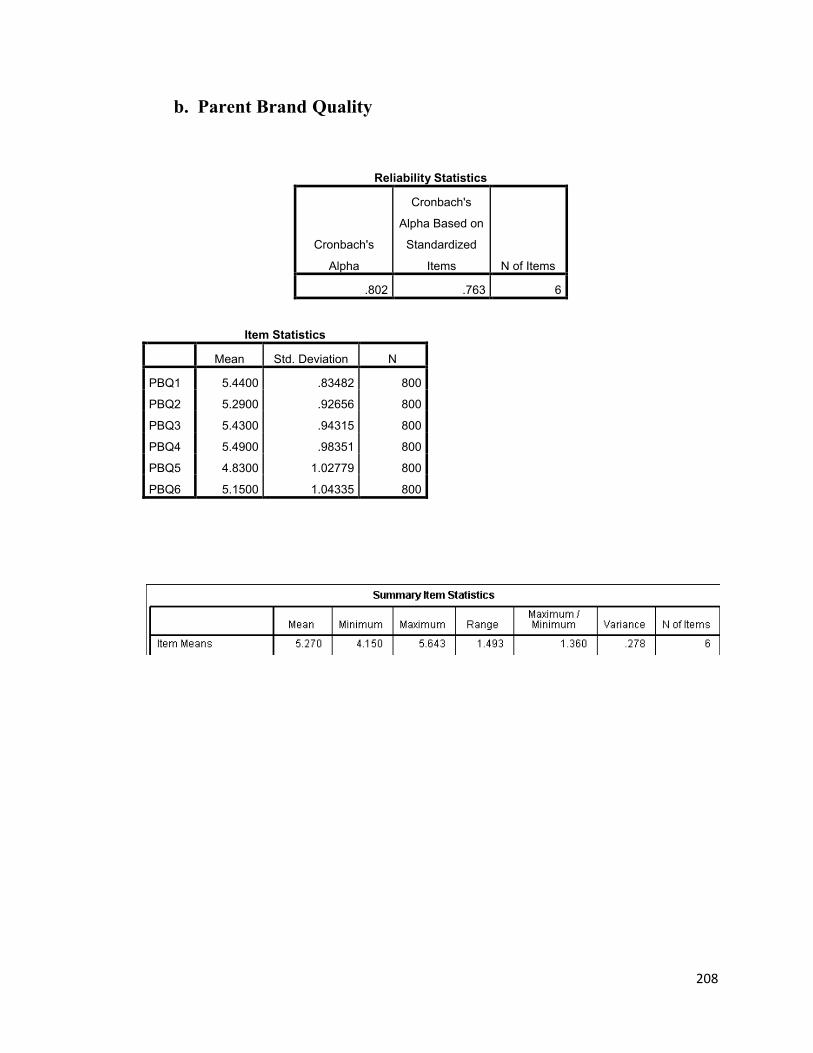
208
b. Parent Brand Quality
Item Statistics
Mean Std. Deviation N
PBQ1 5.4400 .83482 800
PBQ2 5.2900 .92656 800
PBQ3 5.4300 .94315 800
PBQ4 5.4900 .98351 800
PBQ5 4.8300 1.02779 800
PBQ6 5.1500 1.04335 800
Reliability Statistics
Cronbach's
Alpha
Cronbach's
Alpha Based on
Standardized
Items N of Items
.802 .763 6
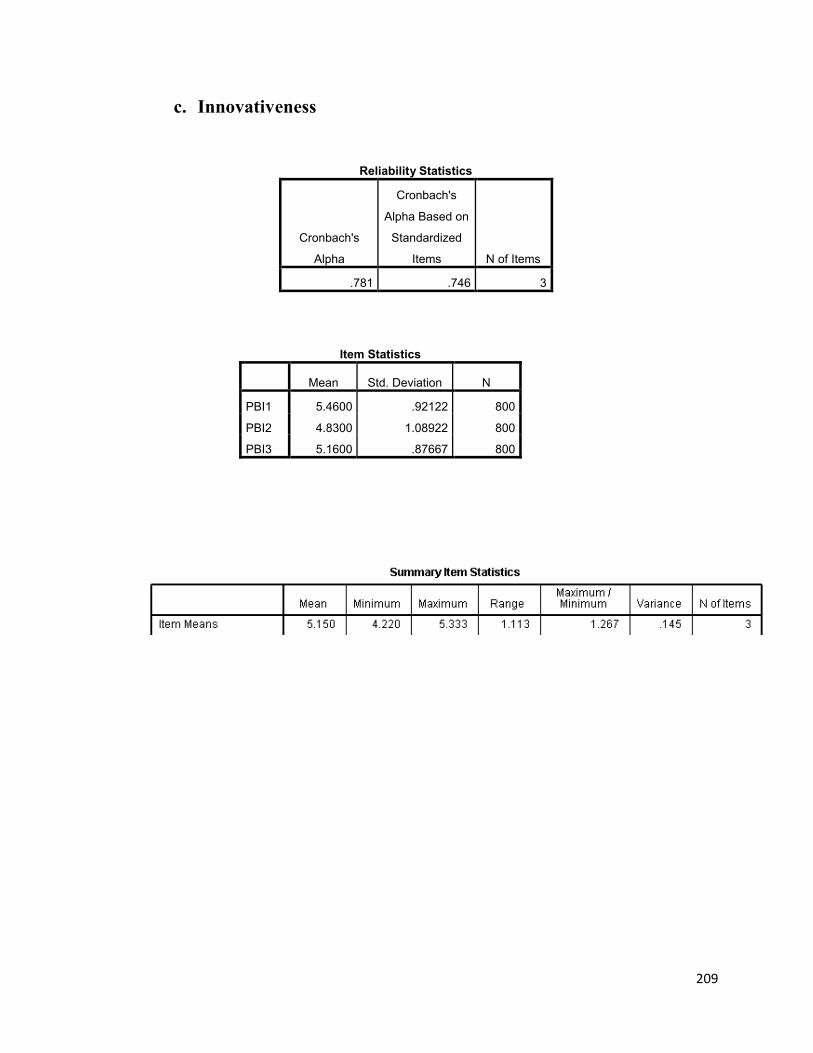
209
c. Innovativeness
Reliability Statistics
Cronbach's
Alpha
Cronbach's
Alpha Based on
Standardized
Items N of Items
.781 .746 3
Item Statistics
Mean Std. Deviation N
PBI1 5.4600 .92122 800
PBI2 4.8300 1.08922 800
PBI3 5.1600 .87667 800
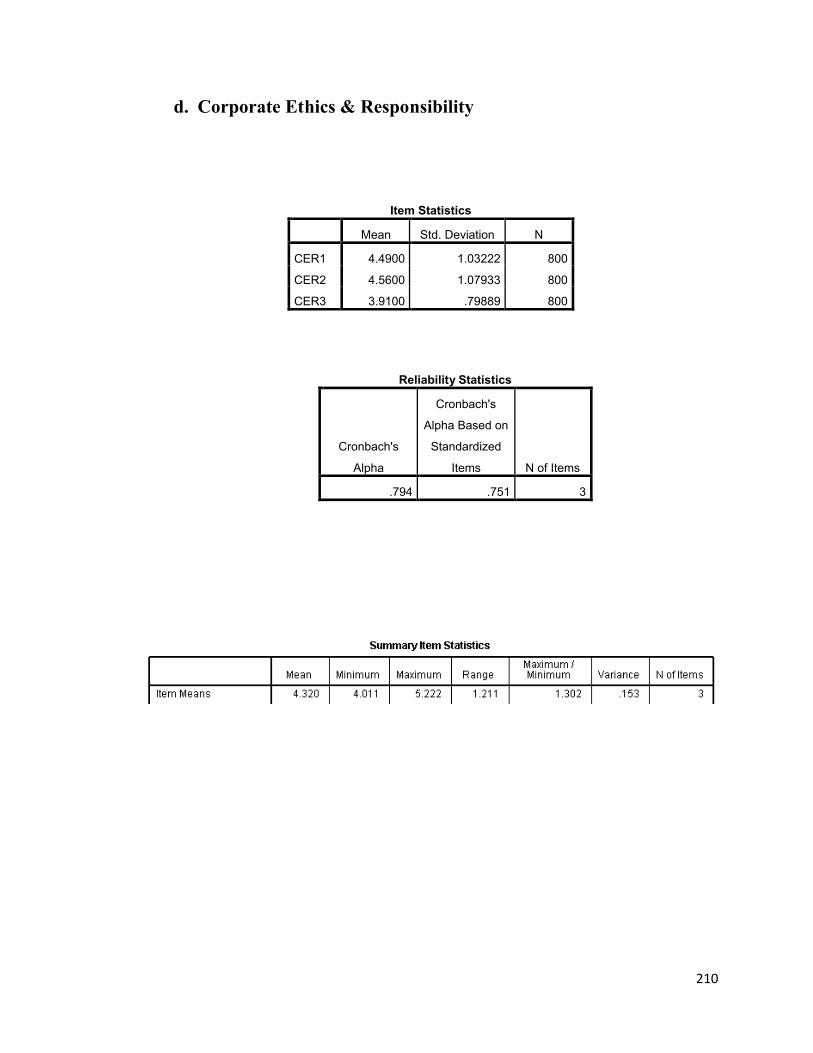
210
d. Corporate Ethics & Responsibility
Reliability Statistics
Cronbach's
Alpha
Cronbach's
Alpha Based on
Standardized
Items N of Items
.794 .751 3
Item Statistics
Mean Std. Deviation N
CER1 4.4900 1.03222 800
CER2 4.5600 1.07933 800
CER3 3.9100 .79889 800
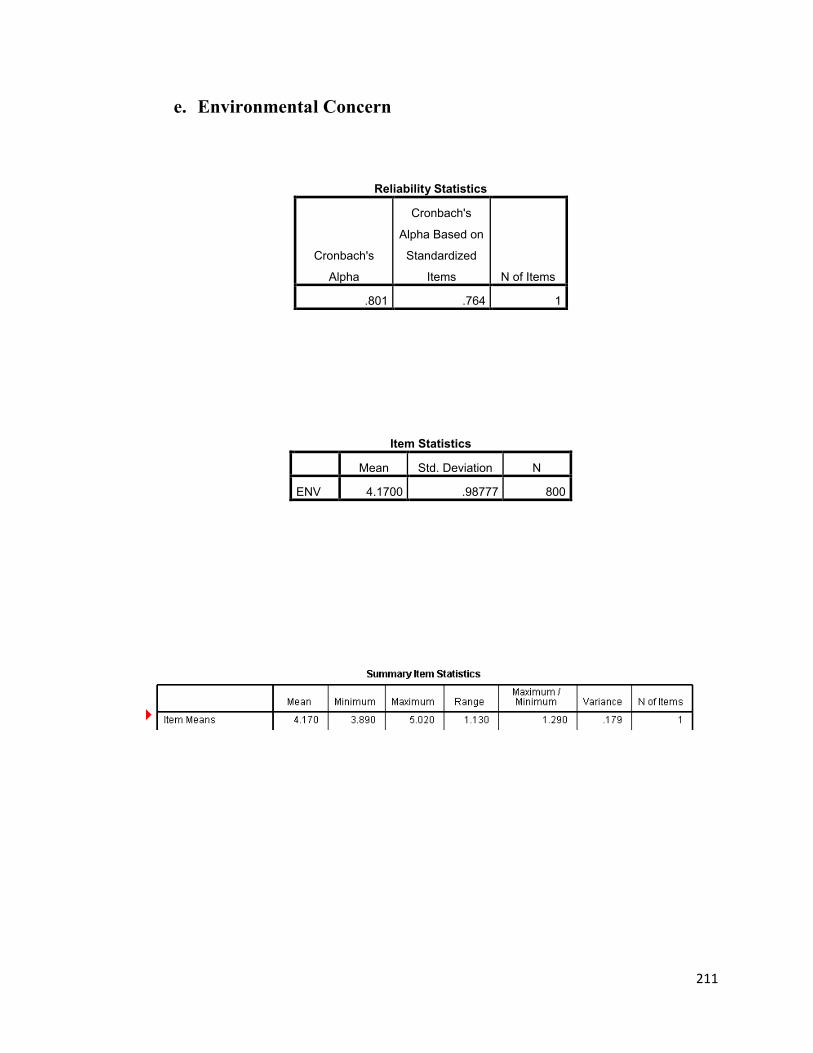
211
e. Environmental Concern
Reliability Statistics
Cronbach's
Alpha
Cronbach's
Alpha Based on
Standardized
Items N of Items
.801 .764 1
Item Statistics
Mean Std. Deviation N
ENV 4.1700 .98777 800

212
A 3.1 Item Scale Statistics - Brand Extension Characteristics
A 3.1.1 Reliability Statistics
Transfer
Reliability Statistics
Cronbach's
Alpha
Cronbach's
Alpha Based on
Standardized
Items N of Items
.678 .642 2
Difficulty
Brand Concept Consistency
Reliability Statistics
Cronbach's
Alpha
Cronbach's
Alpha Based on
Standardized
Items N of Items
.612 .601 1
Reliability Statistics
Cronbach's
Alpha
Cronbach's
Alpha Based on
Standardized
Items N of Items
.714 .708 3

213
A 3.1.2 Brand Extension Characteristics Scores
DTH
a. Transfer
Summary Item Statistics
Mean Minimum Maximum RangeMaximum/Minimum N. of
items Item Means 5.78 5.22 6.02 0.8 1.153 2
b. Difficulty
Summary Item Statistics
Mean Minimum Maximum RangeMaximum/Minimum N. of
items Item Means 2.98 2.45 3.12 0.67 1.273 1
c. Brand Concept Consistency
Summary Item Statistics
Mean Minimum Maximum RangeMaximum/Minimum N. of
items Item Means 5.81 5.15 6.08 0.93 1.180 3

214
MSP
a. Transfer
Summary Item Statistics
Mean Minimum Maximum RangeMaximum/Minimum N. of
items Item Means 5.02 4.84 5.52 0.68 1.140 2
b. Difficulty
Summary Item Statistics
Mean Minimum Maximum RangeMaximum/Minimum N. of
items Item Means 3.01 2.85 3.57 0.72 1.252 1
c. Brand Concept Consistency
Summary Item Statistics
Mean Minimum Maximum RangeMaximum/Minimum N. of
items Item Means 4.89 4.21 5.34 1.13 1.268 3
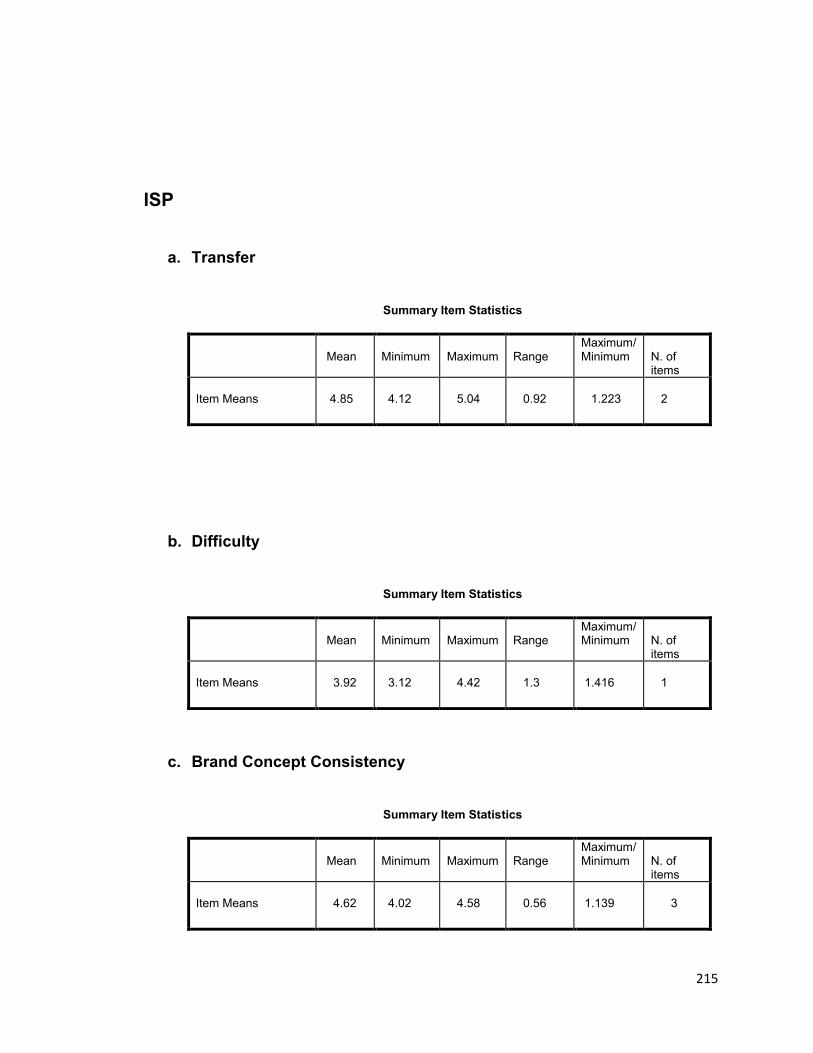
215
ISP
a. Transfer
Summary Item Statistics
Mean Minimum Maximum RangeMaximum/Minimum N. of
items Item Means 4.85 4.12 5.04 0.92 1.223 2
b. Difficulty
Summary Item Statistics
Mean Minimum Maximum RangeMaximum/Minimum N. of
items Item Means 3.92 3.12 4.42 1.3 1.416 1
c. Brand Concept Consistency
Summary Item Statistics
Mean Minimum Maximum RangeMaximum/Minimum N. of
items Item Means 4.62 4.02 4.58 0.56 1.139 3

216
Washing Powder
a. Transfer
Summary Item Statistics
Mean Minimum Maximum RangeMaximum/Minimum N. of
items Item Means 2.20 2.02 2.98 0.96 1.475 2
b. Difficulty
Summary Item Statistics
Mean Minimum Maximum RangeMaximum/Minimum N. of
items Item Means 6.24 6.02 6.88 0.86 1.142 1
c. Brand Concept Consistency
Summary Item Statistics
Mean Minimum Maximum RangeMaximum/Minimum N. of
items Item Means 2.10 1.89 2.88 0.99 1.523 3
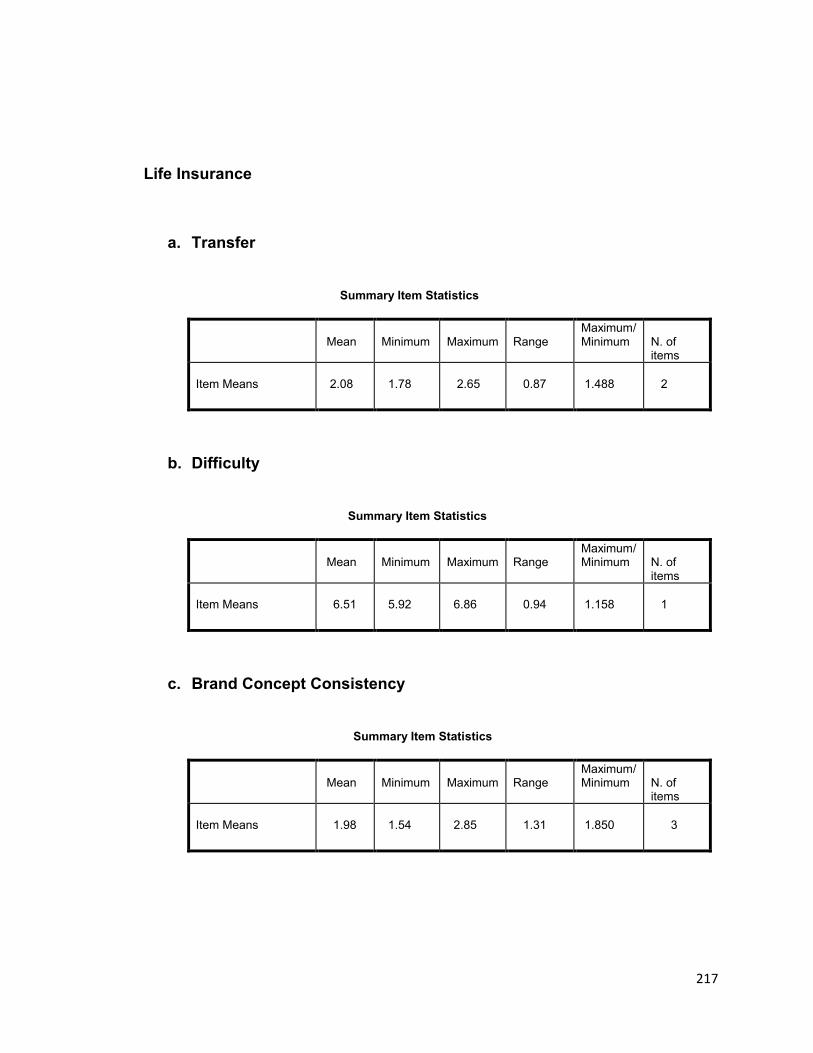
217
Life Insurance
a. Transfer
Summary Item Statistics
Mean Minimum Maximum RangeMaximum/Minimum N. of
items Item Means 2.08 1.78 2.65 0.87 1.488 2
b. Difficulty
Summary Item Statistics
Mean Minimum Maximum RangeMaximum/Minimum N. of
items Item Means 6.51 5.92 6.86 0.94 1.158 1
c. Brand Concept Consistency
Summary Item Statistics
Mean Minimum Maximum RangeMaximum/Minimum N. of
items Item Means 1.98 1.54 2.85 1.31 1.850 3
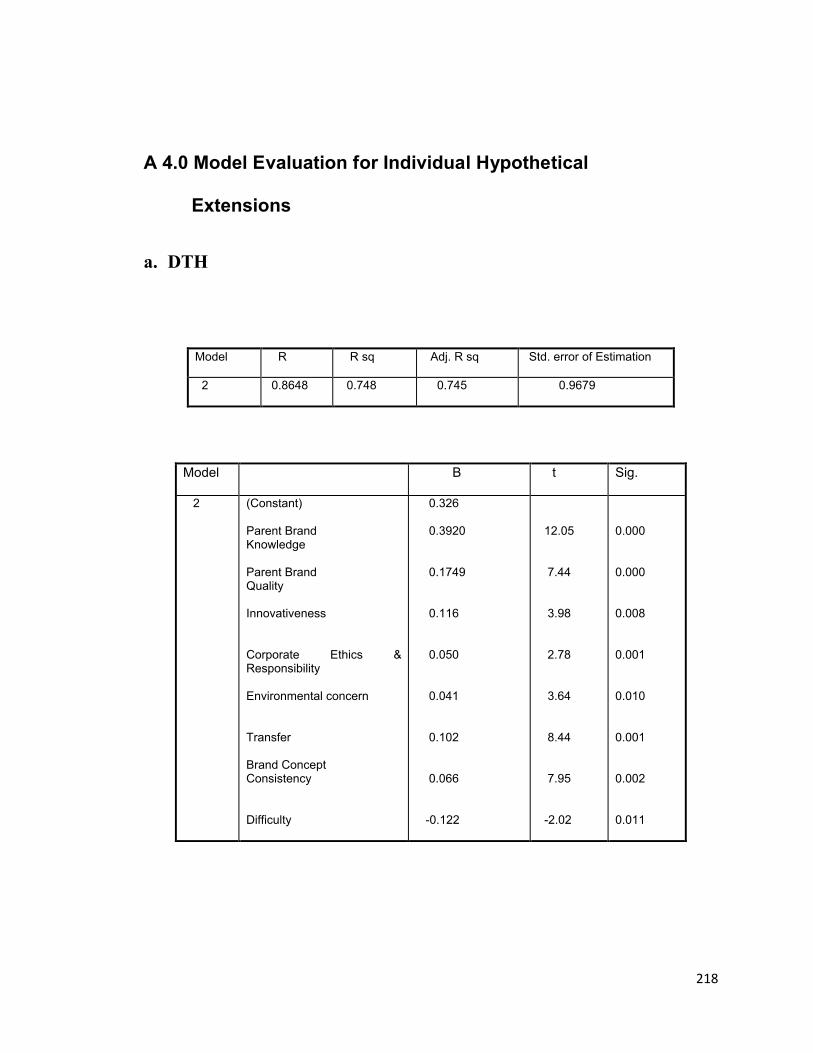
218
A 4.0 Model Evaluation for Individual Hypothetical
Extensions
a. DTH
Model R R sq Adj. R sq Std. error of Estimation
2 0.8648 0.748 0.745 0.9679
Model B t Sig.
2 (Constant)
Parent BrandKnowledge
Parent Brand Quality
Innovativeness
Corporate Ethics & Responsibility
Environmental concern
Transfer
Brand Concept Consistency
Difficulty
0.326
0.3920
0.1749
0.116
0.050 0.041
0.102
0.066 -0.122
12.05
7.44
3.98
2.78
3.64
8.44
7.95
-2.02
0.000
0.000
0.008
0.001
0.010
0.001
0.002
0.011

219
b. MSP
Model R R sq Adj. R sq Std. error of Estimation
3 0.8408 0.707 0. 704 0.9131
Model B t Sig.
3 (Constant)
Parent BrandKnowledge
Parent Brand Quality
Innovativeness
Corporate Ethics & Responsibility
Environmental concern
Transfer
Brand Concept Consistency
Difficulty
0.28
0.384
0.167
0.109
0.046 0.033
0.110
0.071 -0.134
11.81
7.18
3.45
2.45
3.18
8.02
7.25
-2.14
0.000
0.002
0.004
0.011
0.012
0.002
0.005
0.015

220
c. ISP
Model R R sq Adj. R sq Std. error of Estimation
4 0.8272 0.6844 0.6841 0.9246
Model B t Sig.
4 (Constant)
Parent BrandKnowledge
Parent Brand Quality
Innovativeness
Corporate Ethics & Responsibility
Environmental concern
Transfer
Brand Concept Consistency
Difficulty
0.395
0.347
0.165
0.106
0.042 0.030
0.111
0.068 -0.147
11.02
6.84
2.86
2.32
2.78
7.64
6.67
-2.82
0.000
0.002
0.005
0.014
0.012
0.004
0.008
0.018

221
d. Washing Powder
Model R R sq Adj. R sq Std. error of Estimation
5 0.777 0.605 0.602 0.9422
Model B t Sig.
5 (Constant)
Parent BrandKnowledge
Parent Brand Quality
Innovativeness
Corporate Ethics & Responsibility
Environmental concern
Transfer
Brand Concept Consistency
Difficulty
0.535
0.304
0.112
0.054
0.016 0.027
0.06
0.017 -0.210
10.24
6.06
2.32
2.10
2.25
7.18
5.85
-3.12
0.001
0.003
0.005
0.013
0.014
0.005
0.010
0.020
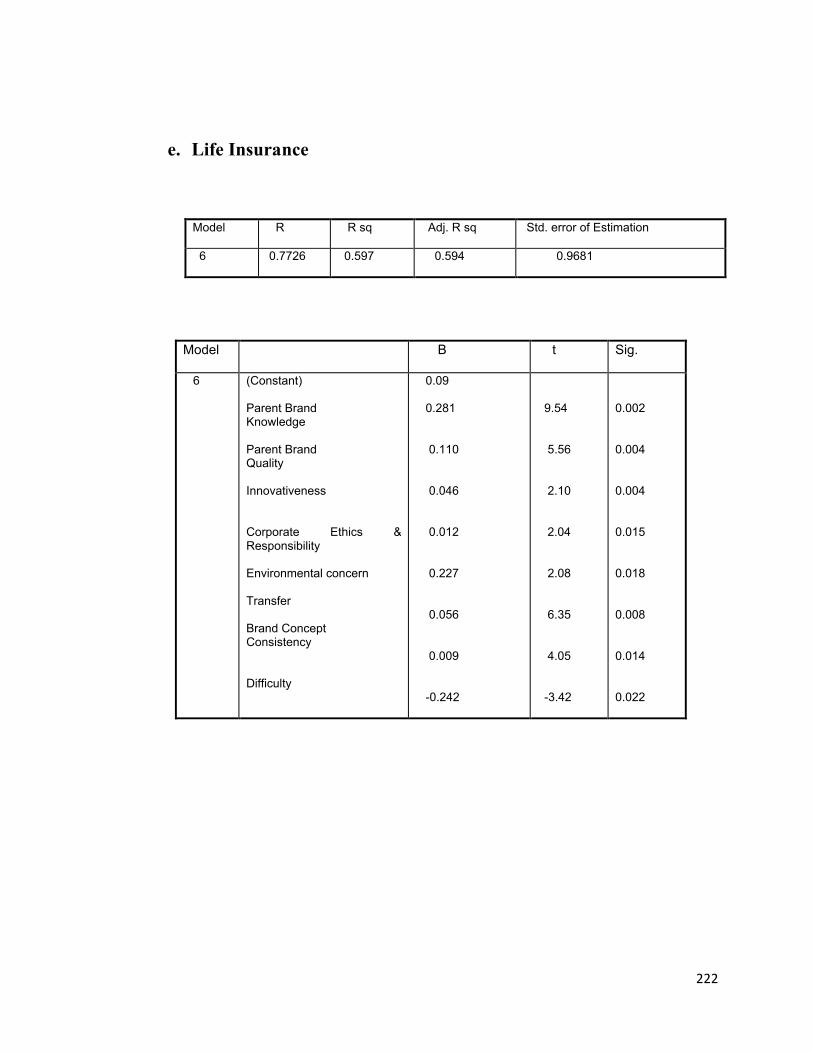
222
e. Life Insurance
Model R R sq Adj. R sq Std. error of Estimation
6 0.7726 0.597 0.594 0.9681
Model B t Sig.
6 (Constant)
Parent BrandKnowledge
Parent Brand Quality
Innovativeness
Corporate Ethics & Responsibility
Environmental concern
Transfer
Brand Concept Consistency
Difficulty
0.09
0.281
0.110
0.046
0.012 0.227
0.056
0.009 -0.242
9.54
5.56
2.10
2.04
2.08
6.35
4.05
-3.42
0.002
0.004
0.004
0.015
0.018
0.008
0.014
0.022
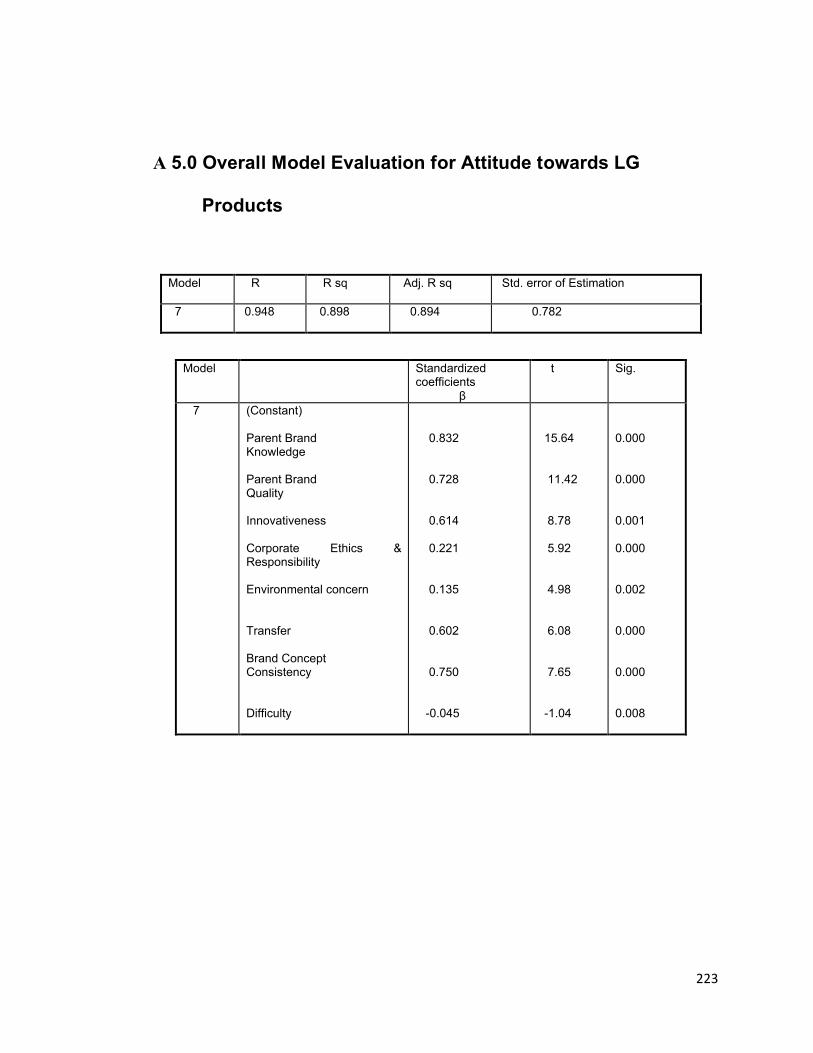
223
A 5.0 Overall Model Evaluation for Attitude towards LG
Products
Model R R sq Adj. R sq Std. error of Estimation
7 0.948 0.898 0.894 0.782
Model Standardized coefficients β
t Sig.
7 (Constant)
Parent BrandKnowledge
Parent Brand Quality
Innovativeness
Corporate Ethics & Responsibility
Environmental concern
Transfer
Brand Concept Consistency
Difficulty
0.832
0.728
0.614 0.221 0.135
0.602
0.750 -0.045
15.64
11.42
8.78
5.92
4.98
6.08
7.65
-1.04
0.000
0.000
0.001
0.000
0.002
0.000
0.000
0.008

224
A 6.0 Product Brand Equity Scores of LG products
Statistics
PBE Score LG Airconditioner
N Valid 100
Missing 0
Mean 5.8700
Std. Deviation 1.2349
Statistics
PBE Score LG DVD
N Valid 100
Missing 0
Mean 5.200
Std. Deviation 1.4271
Statistics
PBE Score LG Airpurifier
N Valid 100
Missing 0
Mean 4.380
Std. Deviation 1.603
Statistics
PBE Score LG Colour Television
N Valid 100
Missing 0
Mean 5.920
Std. Deviation 0.6240

225
Statistics
PBE Score LG Dishwasher
N Valid 100
Missing 0
Mean 4.590
Std. Deviation 1.537
Statistics
PBE Score LG Home Theatre
System
N Valid 100
Missing 0
Mean 5.070
Std. Deviation 1.163
Statistics
PBE Score LCD
N Valid 100
Missing 0
Mean 6.120
Std. Deviation 0.763
Statistics
PBE Score LED
N Valid 100
Missing 0
Mean 6.180
Std. Deviation 1.4215
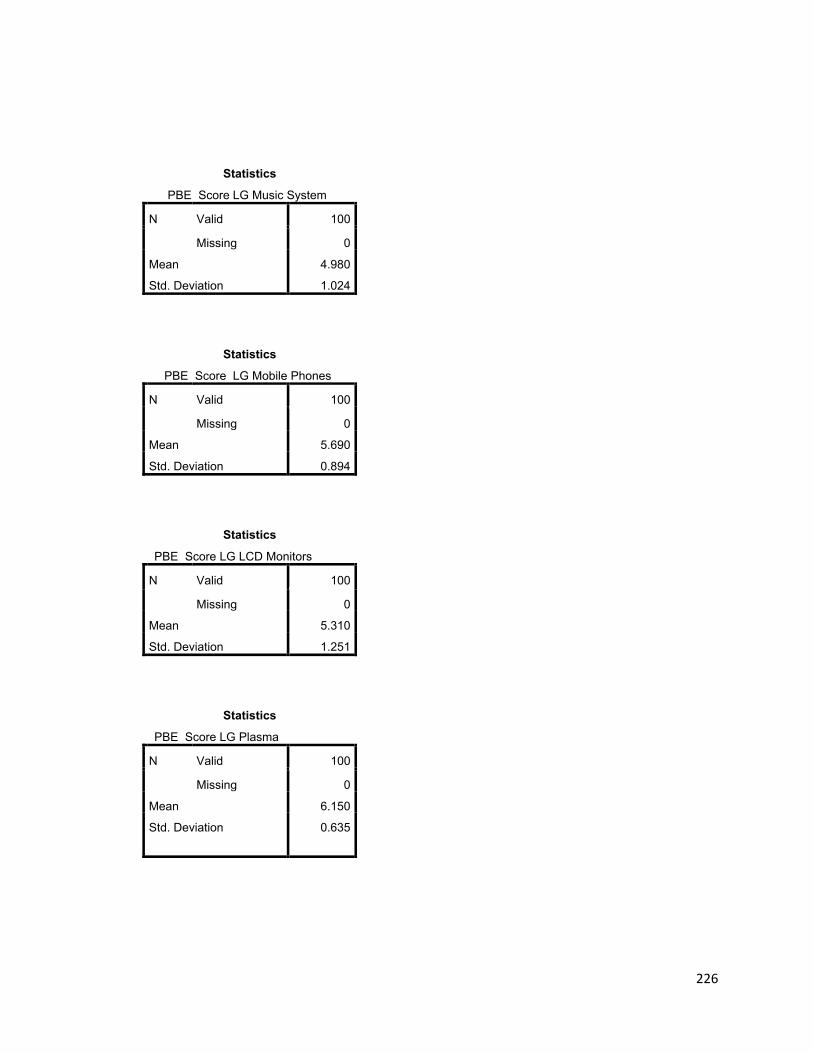
226
Statistics
PBE Score LG Music System
N Valid 100
Missing 0
Mean 4.980
Std. Deviation 1.024
Statistics
PBE Score LG Mobile Phones
N Valid 100
Missing 0
Mean 5.690
Std. Deviation 0.894
Statistics
PBE Score LG LCD Monitors
N Valid 100
Missing 0
Mean 5.310
Std. Deviation 1.251
Statistics
PBE Score LG Plasma
N Valid 100
Missing 0
Mean 6.150
Std. Deviation 0.635
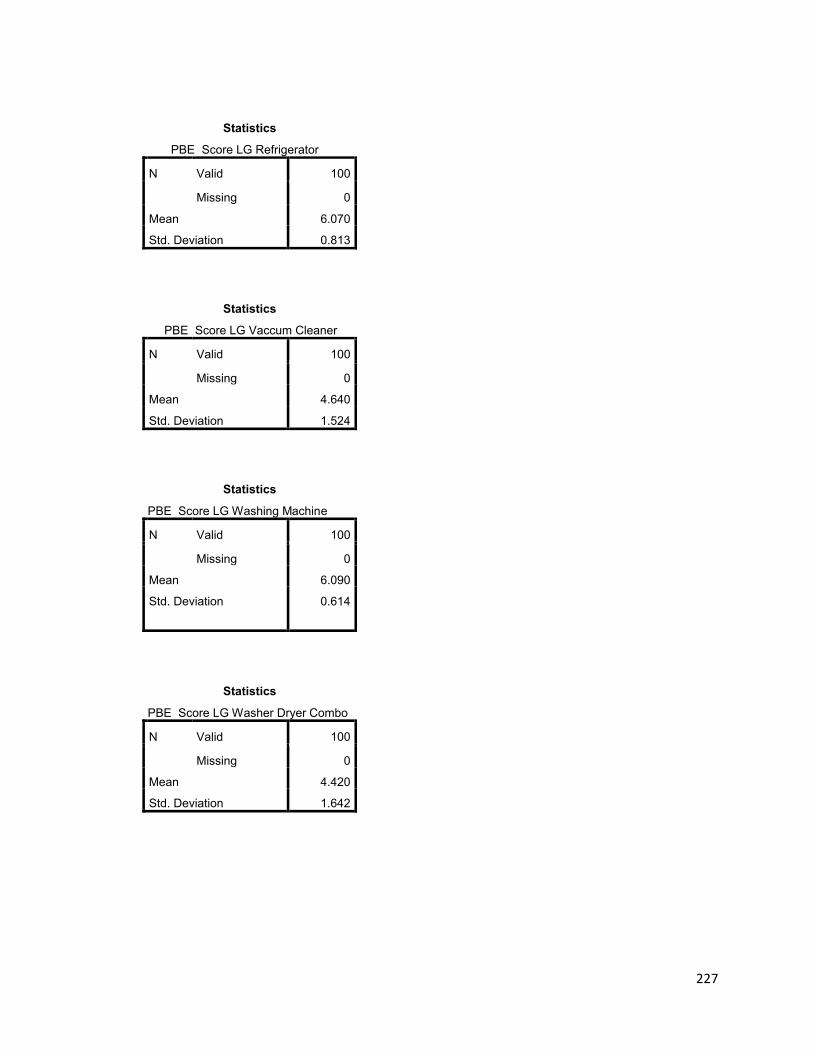
227
Statistics
PBE Score LG Refrigerator
N Valid 100
Missing 0
Mean 6.070
Std. Deviation 0.813
Statistics
PBE Score LG Vaccum Cleaner
N Valid 100
Missing 0
Mean 4.640
Std. Deviation 1.524
Statistics
PBE Score LG Washing Machine
N Valid 100
Missing 0
Mean 6.090
Std. Deviation 0.614
Statistics
PBE Score LG Washer Dryer Combo
N Valid 100
Missing 0
Mean 4.420
Std. Deviation 1.642
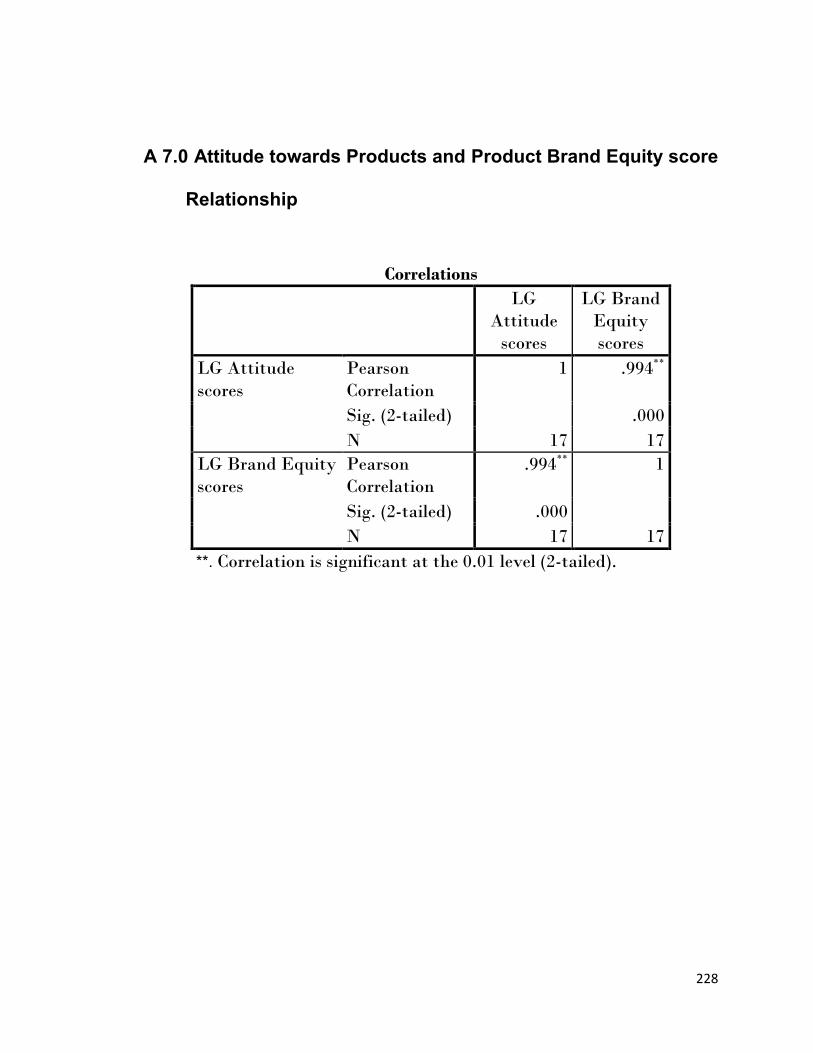
228
A 7.0 Attitude towards Products and Product Brand Equity score
Relationship
CorrelationsLG
Attitude scores
LG Brand Equity scores
LG Attitude scores
Pearson Correlation
1 .994**
Sig. (2-tailed) .000N 17 17
LG Brand Equity scores
Pearson Correlation
.994** 1
Sig. (2-tailed) .000N 17 17
**. Correlation is significant at the 0.01 level (2-tailed).

229
QUESTIONNAIRES

230
QUESTIONNAIRE -1
PART – I
------------------------------------------------------------------------------------------------------------
Name: Place:
Gender: M F
Age: 21- 24 25-28 29-32 33-36
Occupation: Entrepreneur Service Employée Professional
Income Bracket: 2-4 L 4-6 L 6-8 L > 8 L
------------------------------------------------------------------------------------------------------------
PART –II
1. Thinking about Consumer Electronics (LCD/CTV/Sound systems) and Home Appliances (Washing M/c, ACs, Refrigerators, Microwave Oven), kindly mention all the Manufacturers (Brands) of these products that you can think of:
2. Below mentioned are few taglines of Consumer Electronics brands. Match the following taglines with their respective brands
Sony Next is what
Panasonic Experience Change
Godrej Appliances Your Magic is Homemaking
Onida Designed by Curiosity
L.G. Like No Other
Whirlpool Tumko Dekha To Ye Design Aaya
Samsung Idea’s for Life
Videocon Life’s Good
3. Given below are few Logos of Consumer Electronic Manufacturers. Kindly mention their respective Corporate brand names:
4. Kindly observe the TV commercials for the next 15 mins and answer the following questions:
a. List the top 5 Brands
b. List the top 5 Consumer Electronic brand Manufacturers from these Ads
c. Did you notice any
Yes
d. Which product of
Product: ____________ Don’t Remember:
Given below are few Logos of Consumer Electronic Manufacturers. Kindly mention their respective Corporate brand names:
( )
( )
( )
Kindly observe the TV commercials for the next 15 mins and answer the following questions:
List the top 5 Brands which you can recall from these Ads displayed
List the top 5 Consumer Electronic brand Manufacturers from these
Did you notice any L.G Advertisement?
Yes No
Which product of L.G was advertised?
Product: ____________ Don’t Remember:
231
Given below are few Logos of Consumer Electronic Manufacturers. Kindly
( )
( )
Kindly observe the TV commercials for the next 15 mins and answer the
which you can recall from these Ads displayed
List the top 5 Consumer Electronic brand Manufacturers from these
Product: ____________ Don’t Remember:

232
(If you couldn’t answer which product, answer the same after Q.8 )
e. How memorable would you rate the advertising recall of L.G?
1 It is not memorable, not distinct2345 It is very memorable and distinct
5. Have you heard of L.G before?
Yes No
6. Are you a user of any LG product?
Yes No
If Yes, which ones: _____________________
7. Can you list the products associated with this Manufacturer?
1.______________2.____________3._____________4. _________
5.______________6.____________7._____________8._________
9.___________10.___________

233
8. Amongst the set of product categories mentioned below, where you aware
that LG produces and markets these? If yes, kindly tick in the appropriate
box.
1. LCD 8. Refrigerators
2. DVD Player 9. Washer Dryer Combo
3. Home Theatre System 10. Dishwasher
4. Music System 11. Microwave Oven
5. Mobile Phones 12. Vacuum Cleaner
6. LED/LCD monitors 13. Air Purifier
7. Projectors 14. Air Conditioners
8. Washing Machine 15. CTV
16. LED 17. Plasma
234
--------------------------------------------------------------------------------------------------------
PART III
-------------------------------------------------------------------------------------------------------
9. Kindly rate the following statements on a scale of 1 to 7
TD = Totally Disagree, TA = Totally Agree
a. I am familiar with LG as a Consumer Electronics TD TAand Home Appliances manufacturer 1 2 3 4 5 6 7
b. I am buying the products manufactured by LG 1 2 3 4 5 6 7
c. I know most of the products of LG 1 2 3 4 5 6 7
d. I know how well the products of LG function like 1 2 3 4 5 6 7
e. I can recognize LG among other competitive brands 1 2 3 4 5 6 7in this sector
f. Some characteristics of LG has come to my 1 2 3 4 5 6 7mind quickly
g. I can quickly recall the tagline and logo attached 1 2 3 4 5 6 7 to LG
h. I can quickly imagine this manufacturer in my mind 1 2 3 4 5 6 7

235
11.Kindly rate the following statements on a scale of 1 to 7 TD = Totally Disagree, TA = Totally Agree
TD TA
(i) L.G. truly stands for “Life is Good” 1 2 3 4 5 6 7
(ii) L.G. makes a better living for all of us 1 2 3 4 5 6 7
(iii) L.G. improves the quality of our lives 1 2 3 4 5 6 7
(iv) L.G. represents a “delightfully smart” 1 2 3 4 5 6 7
brand
12.Rate the following statements on a scale of 1 to 7 TD = Totally Disagree, TA = Totally Agree
The products of LG as per you:
TD TA
a. Make a person feel proud 1 2 3 4 5 6 7
b. Increase the respect of its user 1 2 3 4 5 6 7
c. Targets premium segment of 1 2 3 4 5 6 7customers
d. Are admired by friends and 1 2 3 4 5 6 7 relatives
e. Express my personality 1 2 3 4 5 6 7

236
f. Helps me demonstrate certain social 1 2 3 4 5 6 7 status
g. Gives me pleasure 1 2 3 4 5 6 7
h. Make me feel that LG cares for me 1 2 3 4 5 6 7
i. Make me feel that LG understands me 1 2 3 4 5 6 7
13.Rate the following statements on a scale of 1 to 7 TD = Totally Disagree, TA = Totally Agree
The products of LG as per you:
TD TA
(i) Perform as expected 1 2 3 4 5 6 7
(ii) Offer value for price 1 2 3 4 5 6 7
(iii) Are reliable 1 2 3 4 5 6 7
(iv) Are functionable 1 2 3 4 5 6 7
(v) Are durable 1 2 3 4 5 6 7
(vi) Have Technological 1 2 3 4 5 6 7 Sophistication
237
14.Rate the following statements on a scale of 1 to 7 TD = Totally Disagree, TA = Totally Agree
TD TA
(i ) In general, LG makes an effort to design products to fit the needs of the customer 1 2 3 4 5 6 7
(ii) Over the past several years, the quality of most products have improved 1 2 3 4 5 6 7
(iii) For me style changes is not as important as improvements in quality 1 2 3 4 5 6 7
(iv) LG do not deliberately design products which will wear out as quickly as possible 1 2 3 4 5 6 7
(v) LG clearly stands out of its competitors 1 2 3 4 5 6 7
(vi) I am satisfied with products which are 1 2 3 4 5 6 7 produced by L.G
(vii) Competitive brands associate me to 1 2 3 4 5 6 7 lower quality than this brand
(ix) The likelihood that I will try the new products of L.G is very high 1 2 3 4 5 6 7

238
15.Rate the following statements on a scale of 1 to 7 TD = Totally Disagree, TA = Totally Agree
TD TA
(i) LG’s products are modern and up-to-date 1 2 3 4 5 6 7
(ii) LG invests in a lot of research & devpt. 1 2 3 4 5 6 7
(iii) LG introduces the latest product features 1 2 3 4 5 6 7
(iv) Products of LG have a concern for env 1 2 3 4 5 6 7
(v) Whenever I go to an LG section, I know I will never be cheated 1 2 3 4 5 6 7
(vi) LG has a high concern for its consumers and society at large 1 2 3 4 5 6 7
(vii) LG is more interested in serving its consumers than making profits 1 2 3 4 5 6 7
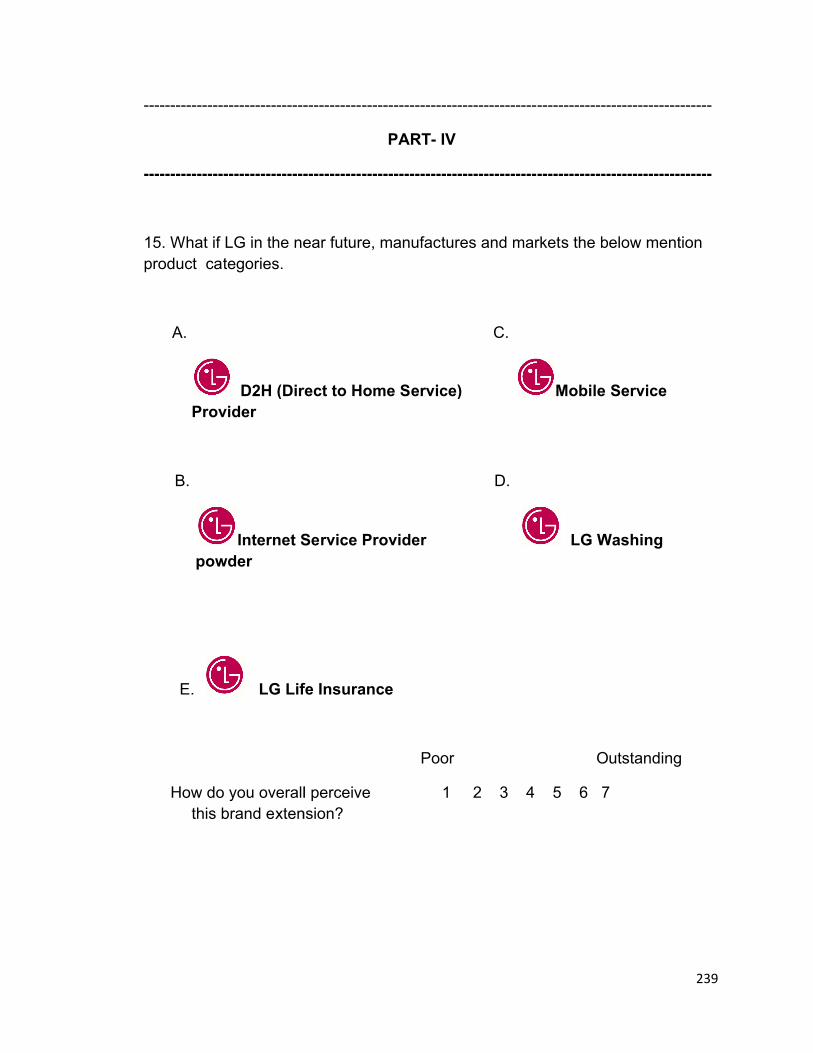
-----------------------------------------------------------------------------------------------------------
-----------------------------------------------------------------------------------------------------------
15. What if LG in the near future, manufactures and markets the below mention product categories.
A.
D2H (Direct to Home Service) Provider
B.
Internet Service Provider powder
E. LG Life Insurance
How do you overall perceive this brand extension?
-----------------------------------------------------------------------------------------------------------
PART- IV
-----------------------------------------------------------------------------------------------------------
15. What if LG in the near future, manufactures and markets the below mention
A. C.
D2H (Direct to Home Service) Mobile Service
D.
Internet Service Provider LG Washing
LG Life Insurance
Poor Outstanding
How do you overall perceive 1 2 3 4 5 6 7this brand extension?
239
-----------------------------------------------------------------------------------------------------------
-----------------------------------------------------------------------------------------------------------
15. What if LG in the near future, manufactures and markets the below mention
Mobile Service
LG Washing
Poor Outstanding
1 2 3 4 5 6 7

240
With respect to the above mentioned product categories, kindly rate the following statements on a scale from 1 to 7 were 1= Totally Disagree, 7 = Totally Agree.
a. If this product existed in the market, A ___B___C___D___E___I will purchase it
b. L.G has the competency to make this product A ___B___C___D___E___
c. This new product is difficult to make for L.G. A ___B___C___D___E___
d. This new product is consistent with the A ___B___C___D___E___ LG image (Life’s Good)
e. This new product fits my association with A ___B___C___D___E___LG brand
f. L.G. has adequate capability to manufacture A ___B___C___D___E___ this new product
Kindly write down the immediate associations you have with LG brand

Q1. Amongst the set of product categories mentioned below of
How do you overall perceive this brand extension?
1. LCD 2. LED
3. Plasma
4. Dishwasher
5. Music System 6. Mobile Phones 7. LED/LCD monitors 8. DVD Player 9. Washing Machine
With respect to the above mentioned product categories, kindly rate the following statements on a scale from 1 to 7 were 1= Totally Disagree, 7 = Totally Agree.
a. I will purchase
1 __ 2 __ 3__ 4 __ 5 __ 6 __ 7 __ 8 __ 9 _13___ 14___ 15 ___
QUESTIONNAIRE -2
Q1. Amongst the set of product categories mentioned below of
Poor Outstanding
How do you overall perceive 1 2 3 4 5 6 7this brand extension?
LCD 10. Refrigerators
LED 11. Washer Dryer Combo
12. Home Theatre System
Dishwasher 13. Microwave Oven
Music System 14. Vacuum Cleaner
Mobile Phones 15. Air Purifier
LED/LCD monitors 16. Air Conditioners
DVD Player 17. CTV
Washing Machine
With respect to the above mentioned product categories, kindly rate the following statements on a scale from 1 to 7 were 1= Totally Disagree, 7 =
I will purchase this product
1 __ 2 __ 3__ 4 __ 5 __ 6 __ 7 __ 8 __ 9 __ 10__ 11__ 12 ___ 13___ 14___ 15 ___
241
Q1. Amongst the set of product categories mentioned below of
Poor Outstanding
1 2 3 4 5 6 7
r Combo
Home Theatre System
Microwave Oven
Vacuum Cleaner
Air Conditioners
With respect to the above mentioned product categories, kindly rate the following statements on a scale from 1 to 7 were 1= Totally Disagree, 7 =
_ 10__ 11__ 12 ___

242
b. L.G has the competency to make this product
1 __ 2 __ 3__ 4 __ 5 __ 6 __ 7 __ 8 __ 9 __ 10__ 11__ 12 ___ 13___ 14___ 15 ___
c. This new product is difficult to make for L.G.
1 __ 2 __ 3__ 4 __ 5 __ 6 __ 7 __ 8 __ 9 __ 10__ 11__ 12 ___ 13___ 14___ 15 ___
d. This new product is consistent with the LG image (Life’s Good)
1 __ 2 __ 3__ 4 __ 5 __ 6 __ 7 __ 8 __ 9 __ 10__ 11__ 12 ___ 13___ 14___ 15 ___
e. This new product fits my association with LG brand
1 __ 2 __ 3__ 4 __ 5 __ 6 __ 7 __ 8 __ 9 __ 10__ 11__ 12 ___ 13___ 14___ 15 ___
f. L.G. has adequate capability to manufacture this new product
1 __ 2 __ 3__ 4 __ 5 __ 6 __ 7 __ 8 __ 9 __ 10__ 11__ 12 ___ 13___ 14___ 15 ___
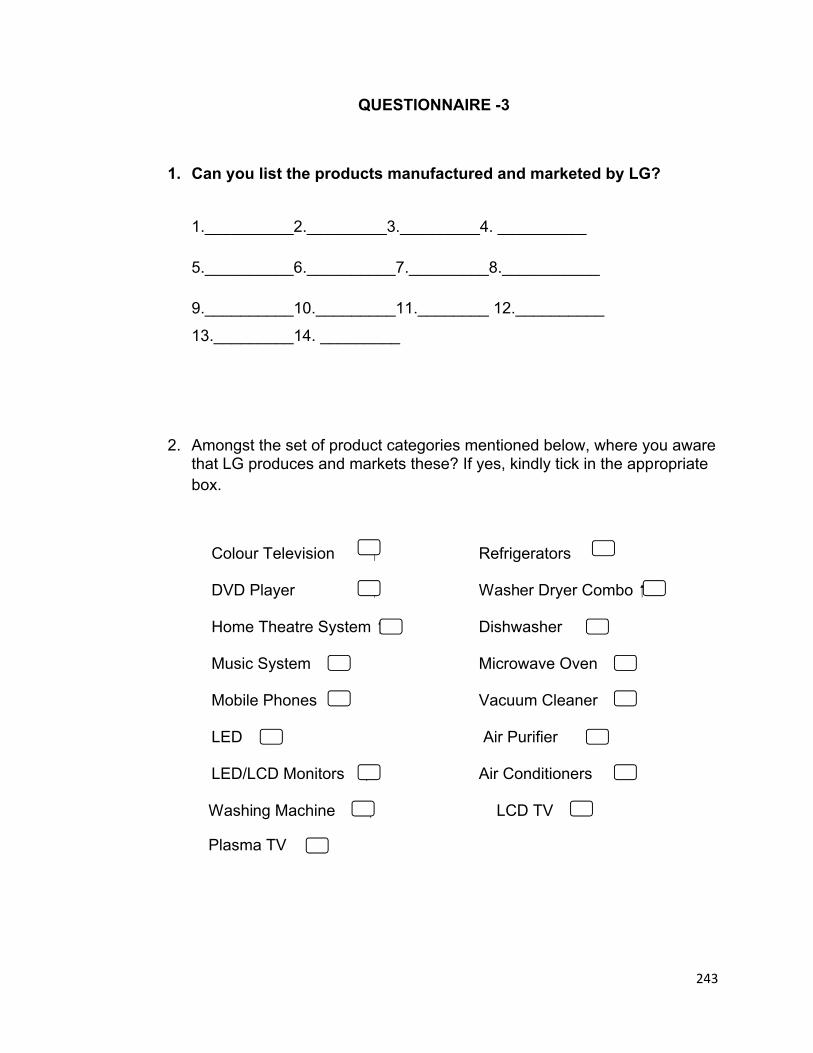
243
QUESTIONNAIRE -3
1. Can you list the products manufactured and marketed by LG?
1.__________2._________3._________4. __________
5.__________6.__________7._________8.___________
9.__________10._________11.________ 12.__________
13._________14. _________
2. Amongst the set of product categories mentioned below, where you aware that LG produces and markets these? If yes, kindly tick in the appropriate box.
Colour Television Refrigerators DVD Player Washer Dryer Combo
Home Theatre System Dishwasher Music System Microwave Oven Mobile Phones Vacuum Cleaner LED Air Purifier LED/LCD Monitors Air Conditioners
Washing Machine LCD TV
Plasma TV
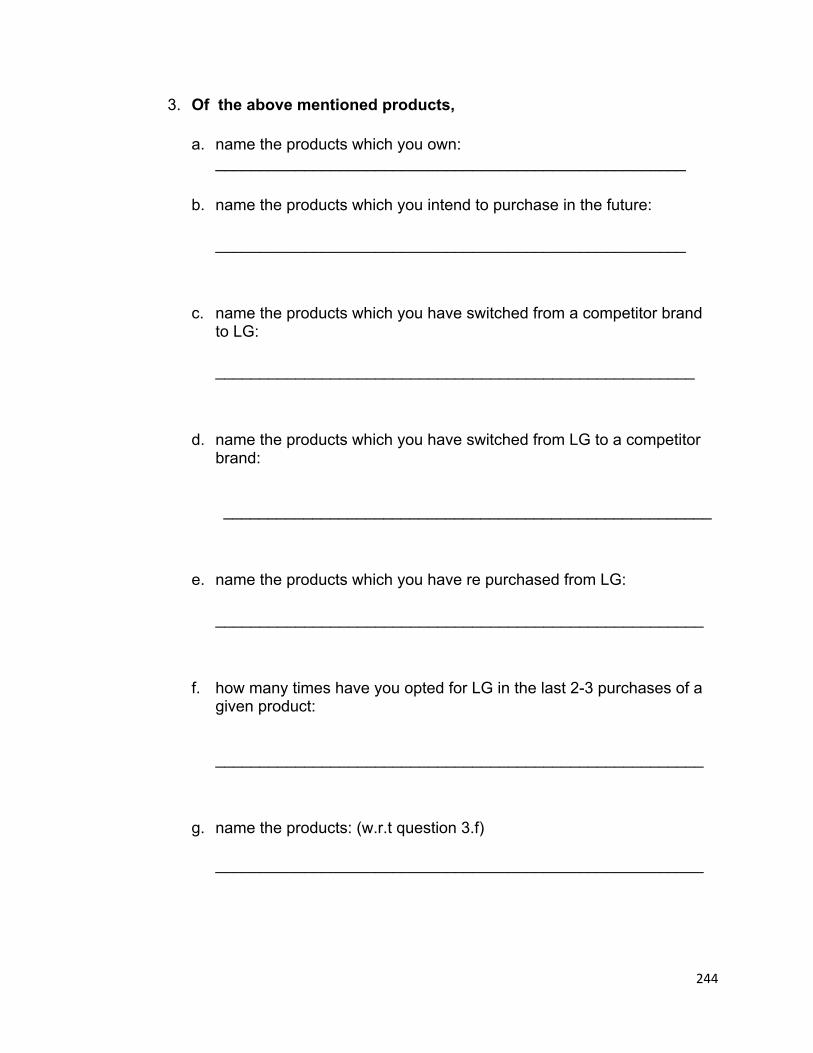
244
3. Of the above mentioned products,
a. name the products which you own:_____________________________________________________
b. name the products which you intend to purchase in the future:
_____________________________________________________
c. name the products which you have switched from a competitor brand to LG:
______________________________________________________
d. name the products which you have switched from LG to a competitor brand:
_______________________________________________________
e. name the products which you have re purchased from LG:
_______________________________________________________
f. how many times have you opted for LG in the last 2-3 purchases of a given product:
_______________________________________________________
g. name the products: (w.r.t question 3.f)
_______________________________________________________

245
h. name the products which I would love to recommend/gift to my dear ones:
________________________________________________________
i. name the products were I will go an extra-mile, if I don’t get an LG:
________________________________________________________
j. name the products which:
you must go: ________________________
should go: ________________________
may go: ________________________
may not go: ________________________
definitely not: ________________________
k. name the products which you have seen recently on air (television)?
___________________________________________
4. Rate the following statements on a scale of 1 to 7 for the different products of LG
TD = Totally Disagree, TA = Totally Agree
TD TA
a. Make a person feel proud 1 2 3 4 5 6 7
b. Increase the respect of its user 1 2 3 4 5 6 7
c. Targets premium segment of customers 1 2 3 4 5 6 7
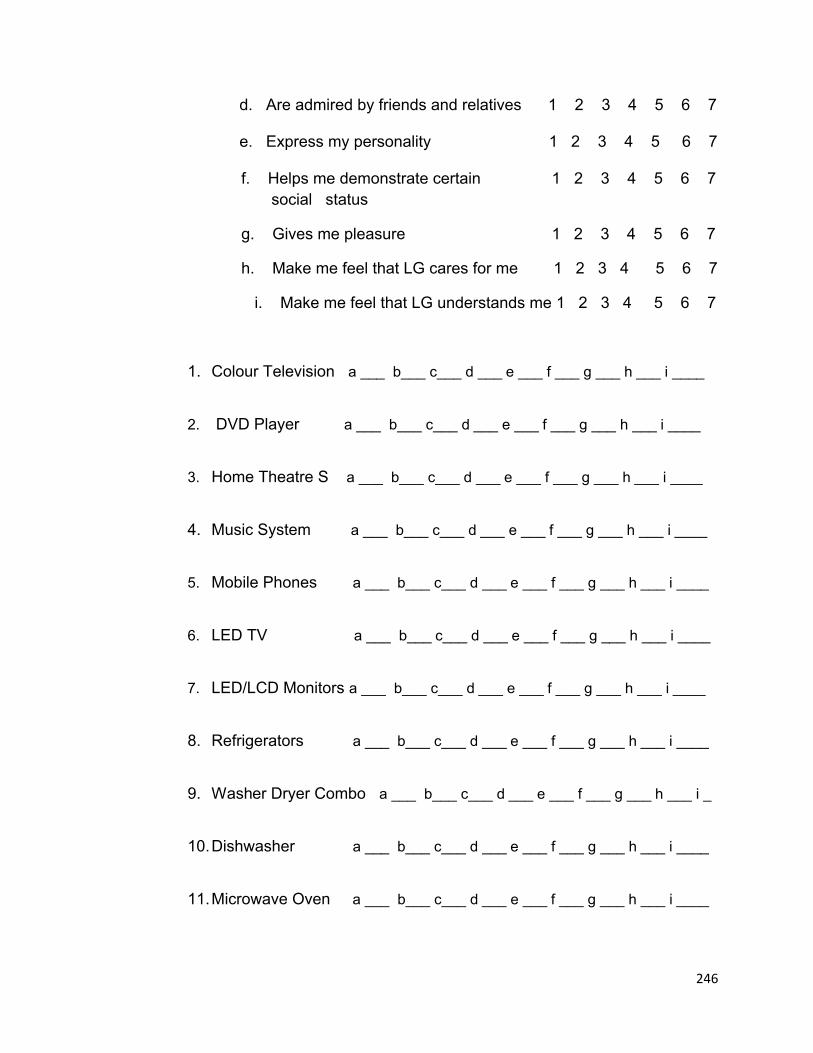
246
d. Are admired by friends and relatives 1 2 3 4 5 6 7
e. Express my personality 1 2 3 4 5 6 7
f. Helps me demonstrate certain 1 2 3 4 5 6 7 social status
g. Gives me pleasure 1 2 3 4 5 6 7
h. Make me feel that LG cares for me 1 2 3 4 5 6 7
i. Make me feel that LG understands me 1 2 3 4 5 6 7
1. Colour Television a ___ b___ c___ d ___ e ___ f ___ g ___ h ___ i ____
2. DVD Player a ___ b___ c___ d ___ e ___ f ___ g ___ h ___ i ____
3. Home Theatre S a ___ b___ c___ d ___ e ___ f ___ g ___ h ___ i ____
4. Music System a ___ b___ c___ d ___ e ___ f ___ g ___ h ___ i ____
5. Mobile Phones a ___ b___ c___ d ___ e ___ f ___ g ___ h ___ i ____
6. LED TV a ___ b___ c___ d ___ e ___ f ___ g ___ h ___ i ____
7. LED/LCD Monitors a ___ b___ c___ d ___ e ___ f ___ g ___ h ___ i ____
8. Refrigerators a ___ b___ c___ d ___ e ___ f ___ g ___ h ___ i ____
9. Washer Dryer Combo a ___ b___ c___ d ___ e ___ f ___ g ___ h ___ i _
10.Dishwasher a ___ b___ c___ d ___ e ___ f ___ g ___ h ___ i ____
11.Microwave Oven a ___ b___ c___ d ___ e ___ f ___ g ___ h ___ i ____

247
12.Vacuum Cleaner a ___ b___ c___ d ___ e ___ f ___ g ___ h ___ i ____
13.Air Purifier a ___ b___ c___ d ___ e ___ f ___ g ___ h ___ i ____
14.Air Conditioners a ___ b___ c___ d ___ e ___ f ___ g ___ h ___ i ____
15.Washing Machine a ___ b___ c___ d ___ e ___ f ___ g ___ h ___ i ____
16.LCD TV a ___ b___ c___ d ___ e ___ f ___ g ___ h ___ i ____
17.Plasma TV a ___ b___ c___ d ___ e ___ f ___ g ___ h ___ i ____
5. Rate the following statements on a scale of 1 to 7 TD = Totally Disagree, TA = Totally Agree
TD TA
(a) Perform as expected 1 2 3 4 5 6 7
(b) Offer value for price 1 2 3 4 5 6 7
(c) Are reliable 1 2 3 4 5 6 7
(d) Are functionable 1 2 3 4 5 6 7
(e) Are durable 1 2 3 4 5 6 7
(f) Have Technological 1 2 3 4 5 6 7 Sophistication
(g) Are premium in their price 1 2 3 4 5 6 7
1. Colour Television a ___ b___ c___ d ___ e ___ f ___ g ___
2. DVD Player a ___ b___ c___ d ___ e ___ f ___ g ___
3. Home Theatre S a ___ b___ c___ d ___ e ___ f ___ g ___
248
4. Music System a ___ b___ c___ d ___ e ___ f ___ g___
5. Mobile Phones a ___ b___ c___ d ___ e ___ f ___ g ___
6. LED/LCD TV a ___ b___ c___ d ___ e ___ f ___ g___
7. LED/LCD Monitors a ___ b___ c___ d ___ e ___ f ___ g___
8. Refrigerators a ___ b___ c___ d ___ e ___ f ___ g___
9. Washer Dryer Combo a ___ b___ c___ d ___ e ___ f ___ g___
10.Dishwasher a ___ b___ c___ d ___ e ___ f ___ g___
11.Microwave Oven a ___ b___ c___ d ___ e ___ f ___ g___
12.Vacuum Cleaner a ___ b___ c___ d ___ e ___ f ___ g___
13.Air Purifier a ___ b___ c___ d ___ e ___ f ___ g___
14.Air Conditioners a ___ b___ c___ d ___ e ___ f ___ g___
15.Washing Machine a ___ b___ c___ d ___ e ___ f ___ g___
16.LCD TV a ___ b___ c___ d ___ e ___ f ___ g ___
17.Plasma TV a ___ b___ c___ d ___ e ___ f ___ g ___
249
APPENDIX
CEAMA
Consumer Electronics and Appliances Manufacturers Association (z) (formerly
CETMA) is an all India body of organizations in Consumer Electronics and
Durables sector, Rs.30,000 cores industry. It is registered as a non-profit
organization, looking after the common interest of the members, for sustainable
growth in the sector. It has been in existence for last 30 years. Presently, there
are more than100 members.
CEAMA is one of the few industry bodies which provide a single platform to the
manufacturers and the trade to help develop healthy relations. It has organized
many seminars in various states across the country and first time a grand
seminar is organized in Bangalore to provide an industry platform to the trade
partners. CEAMA also invites the consumer bodies to gather their viewpoint
which helps in the growth of the industry.
Members are manufacturers of Consumer Electronic products & Home
Appliances products. The membership spectrum comprises of Domestic and
MNCs, and includes large, medium & small-scale sectors. It is truly a
representative organization for collective industrial promotional Members are
manufacturers of Consumer Electronic products & Home Appliances products.
The membership spectrum comprises of Domestic and MNCs, and includes
large, medium & small-scale sectors. It is truly a representative organization for
collective industrial promotional activities.

250
ELCINA
ELCINA was established in 1967 when India's Electronics industry was still in its
infancy. Since then, ELCINA has been well known as an interactive forum for
electronics and IT manufacturers. Apart from the basic objective of promoting
hardware manufacturing through active representation and advice to the
Government, ELCINA has been networking with national and international
technical institutions and business promotion bodies to further the interests of its
members. Today, in an increasingly liberalized environment, there is greater
focus on professional and value-added services rendered by the Association to
the Electronics and IT Community.
As India's oldest and largest electronics Association, ELCINA has always
remained committed to the promotion of electronics manufacturing culture in the
country, focusing on components - the building blocks of electronics
industry. ELCINA has widened its horizons and broadened its activities to include
the development of entire Electronics and IT Hardware, including components &
assemblies, consumer electronics, telecom, IT, industrial/professional,
defense/strategic electronics and other emerging areas like medical and
automobile electronics, embedded systems and hardware design.
ELCINA continues to work towards correlating the common interest of electronic
hardware manufacturers with that of manufacturers of electronic materials,
machinery and service providers, for accelerating growth.
251
ELCINA has taken the initiative to create awareness on issues impacting
hardware manufacturing, such as policy and environmental developments,
drawing up a well-defined agenda for both - the Government as well as the
industry. ELCINA believes that the Government and the industry need to work
together to stimulate manufacturing and catalyse an IT/Electronics boom that is
sustainable. In sync with this philosophy, ELCINA is persistently working for
changes that would strengthen India's electronics and IT manufacturing base and
make it a leader on the world electronics map.

252
Confederation of Indian Industry (CII)
The Confederation of Indian Industry (CII) works to create and sustain an
environment conducive to the growth of industry in India, partnering industry and
government alike through advisory and consultative processes.
CII is a non-government, not-for-profit, industry led and industry managed
organisation, playing a proactive role in India's development process. Founded
over 116 years ago, it is India's premier business association, with a direct
membership of over 8100 organisations from the private as well as public
sectors, including SMEs and MNCs, and an indirect membership of over 90,000
companies from around 400 national and regional sectoral associations.
CII catalyses change by working closely with government on policy issues,
enhancing efficiency, competitiveness and expanding business opportunities for
industry through a range of specialized services and global linkages. It also
provides a platform for sectoral consensus building and networking. Major
emphasis is laid on projecting a positive image of business, assisting industry to
identify and execute corporate citizenship programmes. Partnerships with over
120 NGOs across the country carry forward our initiatives in integrated and
inclusive development, which include health, education, livelihood, diversity
management, skill development and water, to name a few.

253
Technopak
Technopak made its foray into Management Consultancy in 1991. The services
offered by us across diverse sectors have had a far reaching impact on the
businesses of our varied clients.
Founded on the principle of “concept to commissioning”, we have been the
trusted advisors for more than 20 years. We are the strategic advisors to our
clients during the ideation phase and implementation guides through start-ups.
Our team comprises of uniquely talented professionals from leading International
and Indian engineering and management institutes. Our consultants have the
expertise and hands-on industry experience in their fields of specialization and
represent a wide variety of functional backgrounds. This enormous knowledge
and talent pool enables Technopak to create special customized teams for each
project, depending on the client requirements.
Based in Gurgaon (NCR Delhi, India), we engage and connect with clients
across the world. We have worked with an array of Clients across numerous
projects, in 20 countries besides India, spread over 5 continents.
With a team of established domain experts at work, Technopak builds and
enhances business capabilities for leading Indian and international companies,
by offering end-to-end solutions that are unique due to our rich experience,
strong industry relationships and an in depth knowledge of the Indian market.
254
NCAER (National Council of Applied Economic Research)
NCAER has done pioneering research work in areas of applied economics with
an emphasis on policy analysis and application of modern quantitative
techniques to development issues, regional development and planning,
household income, consumption, savings /investment and energy.
NCAER's current research is clustered into four broad research areas:
Growth, Trade and Economic Management
Investment Climate, Physical and Economic Infrastructure
Agriculture, Rural Development and Resource Management
Household Behavoiur, Poverty, Human Development, Informality and Gender
NCAER's research is supported by sponsors and subscribers in both the official
and private sector. Such support can be either for a specific project or for a multi-
year programme. All research is invariably supervised by a member of NCAER's
senior staff.
255
BBDO Consulting Services
Batten & Company commonly known as BBDO (Batten, Barton, Durstine &
Osborn) is a leading management consultants for Marketing & Sales Consulting..
The priority of their consulting services includes all marketing-driven questions in
form of integrative company strategies. Acting as specialists, the company offers
their customers long term experiences in fields such as: Marketing efficiency
programs, Brand portfolio/brand architecture optimization, Customer insights
management, Market and customer segmentation, Marketing organization, Brand
positioning, Marketing post merger integration etc.
Batten & Company was founded in 2000, then named BBDO Consulting. It
operates as an international management and strategy consulting firm of BBDO
Worldwide, at the same time, one of the leading international network of
agencies comprising 290 offices in 77 countries. Since 2010, this independence
accompanied by the simultaneous access to the resources of a global network is
reflected in the company’s name. In the past years, more than 1000 projects
were carried out successfully. International blue chip customers and market
leaders of all sectors trust in the expertise of the company in the fields of
strategic marketing and customer management.
Batten & Company combines the comprehensive know-how of qualified staff
from consulting and industry. The deep knowledge of local markets linked with a
global perspective is an essential part of the company’s success.

256