Impact of Climate Variation and Change Events on Threatened or Vulnerable Salmonids in British...
39
Impact of Climate Variation and Change Events on Threatened or Vulnerable Salmonids in British Columbia: Implications for Conservation and Restoration Planning Kim Hyatt, Margot Stockwell & Paul Rankin Fisheries & Oceans Canada, Salmon in Regional Ecosystems Program, Pacific Biological Station, Nanaimo, B.C. Feb 3, 2005: CIG Work Seattle
-
Upload
tyrese-bayes -
Category
Documents
-
view
216 -
download
1
Transcript of Impact of Climate Variation and Change Events on Threatened or Vulnerable Salmonids in British...

Impact of Climate Variation and Change Events on Threatened or Vulnerable Salmonids in British Columbia: Implications for Conservation and
Restoration Planning
Kim Hyatt, Margot Stockwell & Paul RankinFisheries & Oceans Canada, Salmon in Regional Ecosystems Program,
Pacific Biological Station, Nanaimo, B.C.
Feb 3, 2005: CIG Work Seattle

Sockeye Salmon Index Stocks on the Eastern Rim of the Pacific
• approximately 30% of all BC sockeye populations originate from watersheds near the southern end of the species range in North America
• these populations are likely to be highly sensitive to climate change

Subject Stocks and Study Area

Trends in Adult Sockeye Returns to the Columbia River(1890 - 1999)
• Okanagan sockeye are the last anadromous salmon stock of dozens that formerly returned to Canada through the Columbia River.
• The stock is currently depressed and fluctuates with a time weighted average to decline.

Study ThemeS
T R
E S
SClimate change will challenge the scope for life history adaptation by southern sockeye populations to variations in seasonal thermal regimes and associated changes to aquatic ecosystems.
• many elements of behaviour, physiology, & ecology of sockeye are controlled by temperature
• physiological performance is optimal at 15 C
• sockeye are increasingly stressed between 17 and 24 C
• 25 C is lethal
Results presented here first for Okanagan sockeye are part of a general approach to developing: (1) time series estimates of annual and seasonal changes in aquatic thermal regimes, (2) analysis of sockeye population responses to historic variations in climate, (3) inferences about global warming impacts on sockeye populations and (4) identification of potential options for effective stock management, conservation and/or restoration.

Changes to Aquatic Thermal Regimes in Southern Watersheds Pose Threats to Salmon at Several Life History Stages
General procedure developed on Okanagan sockeye is to:
(1) identify a biophysical model or “set of rules” for a given life history response and then (2) predict consequences of climate change
Analysis of sockeye responses to seasonal & annual variations in thermal regimes are now complete for life history stages involving:
(1) adult migration
(2) adult spawn timing
(3) egg-fry incubation
(4) juvenile rearing

• Sockeye migration through Zosel Dam on the Okanagan River is often “polymodal” ( )
• Sockeye migration through Wells Dam on the Columbia mainstem is generally “unimodal” ( )
Derivation of Temperature “Rules” for Adult Migration(Hyatt et al. 2003. Can. Wat. Res. J. 28: 689-713)
true water temp
spawners
0
5
10
15
20
25
30
1-J
an
1-F
eb
1-M
ar
1-A
pr
1-M
ay
1-J
un
1-J
ul
1-A
ug
1-S
ep
1-O
ct
1-N
ov
1-D
ec
wa
ter
tem
pe
ratu
re
0
2
4
6
8
10
ad
ult
sock
eye
as
% t
ota
l pa
ssa
ge
0
5
10
15
20
25
1-J
an
1-F
eb
1-M
ar
1-A
pr
1-M
ay
1-J
un
1-J
ul
1-A
ug
1-S
ep
1-O
ct
1-N
ov
1-D
ec
wa
ter
tem
pe
ratu
re
0
2
4
6
8
10
ad
ult
sock
eye
as
% t
ota
l pa
ssa
ge
0
5
10
15
20
25
30
1-J
an
1-F
eb
1-M
ar
1-A
pr
1-M
ay
1-J
un
1-J
ul
1-A
ug
1-S
ep
1-O
ct
1-N
ov
1-D
ec
wa
ter
tem
pe
ratu
re
0
2
4
6
8
10
12
14
ad
ult
sock
eye
as
% t
ota
l pa
ssa
ge
• Disruptions & delays to entry of Okanagan coincide with seasonal temperature variations. ( )
• Adult migrations stop at 21 C when temperature is increasing• Migration resumes at 21 - 22 C when seasonal temperatures decrease

Predicted versus observed delays for Okanagan sockeye adults based on temperature stop & start migration model

• Applying temperature-migration rules suggest delays may range from 0 - 54 days & an average of 30 days per annum. The magnitude of delays alternate with PDO cycles & have been increasing steadily in association with climate warming during 1985 - 2000 compared with lesser delays in the “cool” 1947-1985 interval.
Temperature-based Stop & Start “Rule” Predictions of Adult Sockeye Migration Delay
Adult sockeye migration delay based on seasonal changes in water temperature of the Okanagan River

Derivation of Temperature “Rules” for Adult Spawn Timing
0
5
10
15
20
25
1-Ja
n
1-F
eb
1-M
ar
1-A
pr
1-M
ay
1-Ju
n
1-Ju
l
1-A
ug
1-S
ep
1-O
ct
1-N
ov
1-D
ec
wat
er t
empe
ratu
re
0
10
20
30
40
50
spaw
ners
(as
% t
otal
)
1947
0
5
10
15
20
25
1-Ja
n
1-F
eb
1-M
ar
1-A
pr
1-M
ay
1-Ju
n
1-Ju
l
1-A
ug
1-S
ep
1-O
ct
1-N
ov
1-D
ec
wat
er t
empe
ratu
re
0
10
20
30
40
50
spaw
ners
(as
% t
otal
)
1951
0
5
10
15
20
25
1-Ja
n
1-F
eb
1-M
ar
1-A
pr
1-M
ay
1-Ju
n
1-Ju
l
1-A
ug
1-S
ep
1-O
ct
1-N
ov
1-D
ec
wat
er t
empe
ratu
re
0
10
20
30
40
50
spaw
ners
(as
% t
otal
)
1952
0
5
10
15
20
25
1-Ja
n
1-F
eb
1-M
ar
1-A
pr
1-M
ay
1-Ju
n
1-Ju
l
1-A
ug
1-S
ep
1-O
ct
1-N
ov
1-D
ec
wat
er t
empe
ratu
re
0
10
20
30
40
50
spaw
ners
(as
% t
otal
)
1957
0
5
10
15
20
25
1-Ja
n
1-F
eb
1-M
ar
1-A
pr
1-M
ay
1-Ju
n
1-Ju
l
1-A
ug
1-S
ep
1-O
ct
1-N
ov
1-D
ec
wat
er t
empe
ratu
re
0
10
20
30
40
50
spaw
ners
(as
% t
otal
)
1962
0
5
10
15
20
25
1-Ja
n
1-F
eb
1-M
ar
1-A
pr
1-M
ay
1-Ju
n
1-Ju
l
1-A
ug
1-S
ep
1-O
ct
1-N
ov
1-D
ec
wat
er t
empe
ratu
re
0
10
20
30
40
50
spaw
ners
(as
% t
otal
)
1971
0
5
10
15
20
25
1-Ja
n
1-F
eb
1-M
ar
1-A
pr
1-M
ay
1-Ju
n
1-Ju
l
1-A
ug
1-S
ep
1-O
ct
1-N
ov
1-D
ec
0
10
20
30
40
50
spaw
ners
(as
% t
otal
)
0
5
10
15
20
25
1-Ja
n
1-F
eb
1-M
ar
1-A
pr
1-M
ay
1-Ju
n
1-Ju
l
1-A
ug
1-S
ep
1-O
ct
1-N
ov
1-D
ec
0
10
20
30
40
50
spaw
ners
(as
% t
otal
)
0
5
10
15
20
25
1-Ja
n
1-F
eb
1-M
ar
1-A
pr
1-M
ay
1-Ju
n
1-Ju
l
1-A
ug
1-S
ep
1-O
ct
1-N
ov
1-D
ec
0
10
20
30
40
50
60
spaw
ners
(as
% t
otal
)
water temperature (actual)
sockeye spawningwater temperature (interpolated)
water temperature 12º C
• peak spawn timing occurs at 12 °C on average (range 8 - 15 °C)

Okanagan Adult Sockeye Average Peak Spawn Date
“Cool” Period1947 - 1985
“Warm” Period1985 - 2000
October 11th
(Oct. 3 - Oct. 19)n = 11
October 19th
(Oct. 10 - Oct. 24)n = 12
• peak spawning by adult sockeye has been delayed, on average, by 9 days during recent “warm” interval

ATU Model “Rules” Used to Estimate Hatch & Emergence Dates for Okanagan Sockeye Eggs and Fry
“Cool Period”
1947-1985
“Warm” Period
1985-2001
Peak Hatching Dates
Feb. 16Dec. 03 – Apr. 09
n = 10*
Mar. 03Feb. 05 – Mar. 26
n = 11*
On average, 100% hatch date is delayed by 15 days during warm intervals (i.e. 1985-2001) relative to cooler intervals (i.e. 1947-1985).
Eggs Hatching
Fry Recruitment
OKANAGANRIVER
SPAWNINGAREA
OSOYOOS LAKE
Derivation of Temperature “Rules” for Habitat Use by Juvenile Sockeye in Osoyoos Lake
November June
Winter – juvenile sockeye use most of the water column
Summer – sockeye concentrate near the thermocline
• Juvenile sockeye rear in Osoyoos Lake for 1 year.
• Acoustic and trawl surveys are used to follow seasonal changes in habitat use by juvenile sockeye rearing in Osoyoos Lake.
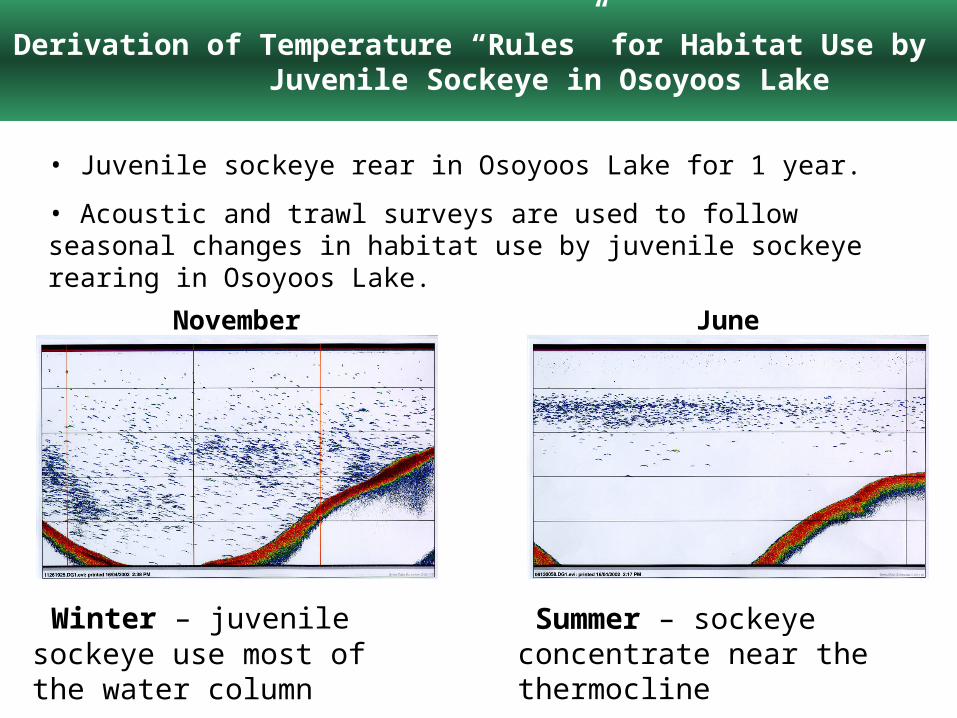
Day versus Night Distribution Changes Reveal “Rules” for Seasonal Habitat Utilization by Juvenile Sockeye in Lakes
• “17 degree rule”: night ascent limited by 17 C water
• “4 mg rule”: daytime descent limited by 4 mg/l O2 level

Seasonal Restriction of Vertical Distribution
Temperature and Oxygen extremes operate togetherto restrict the useable rearing volume of Osoyoos Lake.
South - unsuitable for rearing through summer & fall. Sockeye avoid this basin or die.Central - unsuitable for summer rearing although some sockeye may survive.North - suitable for rearing but still poses a challenge for sockeye in late summer and fall in some years.
North Central South

Seasonal & Annual Variations in Physical Conditions May Cause Mortality Events
5.9% loss per week = 95 % loss over 4 months

• temperature induced exclusions of juvenile sockeye from surface waters of Osoyoos Lake range from 40 - 120 days per year and average 78 days per year.
• the temperature-oxygen “squeeze” has likely been more severe during the current “warm” period (1985 - 2000) compared to the earlier “cool” period (1945 - 1985).
• these effects are especially clear in Osoyoos Lake but are similar in distant locations suggesting a regional climate “driver” associated with PDO cycles.
17 ºC “Rule” Predictions of Number of Days Juvenile Sockeye are Excluded from Surface Waters of Osoyoos (B.C. Interior)
and Great Central (Vancouver Island) Lakes (1924 - 1998)
(a) Osoyoos (a) Great Central
20
40
60
80
100
120
140
1920 1940 1960 1980 2000
Year
Day
s o
ver
17 C
elci
us
20
40
60
80
100
120
140
1920 1940 1960 1980 2000
Year
Day
s o
ver
17 C
elci
us
all year mean = 77 days all year mean = 91 days
warm cool warm warm cool warm
x = 85 days x = 68 days x = 78 days x = 100 days x = 82 days x = 94 days

Climate Change Impacts on Sockeye
To date, our studies on Okanagan sockeye suggest:
• high temperatures delay adult migration by 30 days on average (range 0-54) and average delays double in “warm” (1985-2002) vs “cool” (1947-1985) intervals. (Migration delays induce more pre-spawn mortality & reduce gamete viability).
• spawn timing during “warm” vs “cool” intervals is delayed by an average of 9 days while 100% egg hatch may be delayed by 15 days on average. (Hatching delays expose eggs to additional risk of loss from redd scour events during spring “floods”).
• summer temperature and O2 extremes control the quantity and quality of juvenile rearing habitat in Osoyoos Lake. (Differences in days of summer exclusion from surface waters in warm and cool intervals will influence feeding energetics and production levels of juvenile sockeye).
• the temp-O2 “squeezes” may be severe enough to induce major mortality events (e.g. 1998 event). (Rearing habitats have been reduced to zero in all basins of Osoyoos Lake at least twice in the past 30 years).

Implications for “Threatened” Sakinaw and Cultus Lake Sockeye Salmon
Small populations of sockeye originating from Sakinaw and Cultus lakes have exhibited more than a 90% decline within a few generations prompting an “emergency recovery” designation by COSEWIC and a petition to list them under SARA legislation in Canada.
Sakinaw Cultus
1
10
100
1,000
10,000
100,000
1940 1950 1960 1970 1980 1990 2000Year
Spa
wne
r A
bund
ance
1
10
100
1,000
10,000
100,000
1950 1960 1970 1980 1990 2000Year
Spa
wne
r A
bund
ance

Climate Change Events Will Affect Recovery Prospects for Depressed or Threatened Sockeye Stocks Such as Sakinaw and Cultus
Climate variation & change events are “non-stationary” & have a predictable influence on salmon life history events during specific periods (e.g. “warm” versus “cold” PDO intervals that each last 20-30 years) .
-5
5
15
25
35
45
55
65
1920 1930 1940 1950 1960 1970 1980 1990 2000 2010
Da
ys O
ve
r 2
1 C
elc
ius
-5
5
15
25
35
45
55
65
1900 1910 1920 1930 1940 1950 1960 1970 1980 1990 2000 2010
Da
ys O
ve
r 2
1 C
elc
ius
60
80
100
120
140
160
180
1920 1930 1940 1950 1960 1970 1980 1990 2000 2010
Da
ys O
ve
r 1
7 C
elc
ius
40
60
80
100
120
140
160
1900 1910 1920 1930 1940 1950 1960 1970 1980 1990 2000 2010
Da
ys O
ve
r 1
7 C
elc
ius
(b) “Exclusion” of Sakinaw fry (d) “Exclusion” of Cultus fry
warm cool warm
warm cool warm
warm cool warmcool
warm cool warmcool
Mean = 10 days
Mean = 122 days
x = 5
% ND = 45.5
x = 9
% ND = 29.0
x = 16
% ND = 7.7
x = 119 x = 118 x = 127
x = 19 x = 29 x = 23 x = 34
% ND = 12.0 % ND = 0.0 % ND = 9.7 % ND = 0.0
x = 93 x = 109 x = 118x = 118
Mean = 26 days
Mean = 110 days
(a) “Delay” of Sakinaw adults (b) “Delay” of Cultus adults

CVC Effects on Resident Salmonids in Georgia Basin Lakes

200 m
N
groundwater spring
CVC Effects on Resident Salmonids in Marion Lake, B.C.
Kokanee
Rainbow Trout
Marion L. is a small (29 ha), shallow (6m maximum depth), sub-alpine lake in the UBC Research Forest on the north shore of the Fraser River

Rainbow Trout Surface Feeding Activity and Temperature
Trout feeding activity at the lake surface falls off rapidly at temperatures <60C or >180C.

Salmonid Aggregations in a Spring-fed Thermal Refuge
Kokanee and large trout routinely aggregate in cool water refuges when lake surface temperatures exceed 210C

Temperatures at Depth in Marion Lake and the Spring
When seasonal temperatures exceed 21oC at the surface and 17oC at 4m in the lake they remain below 110C at depths > 2m in the spring
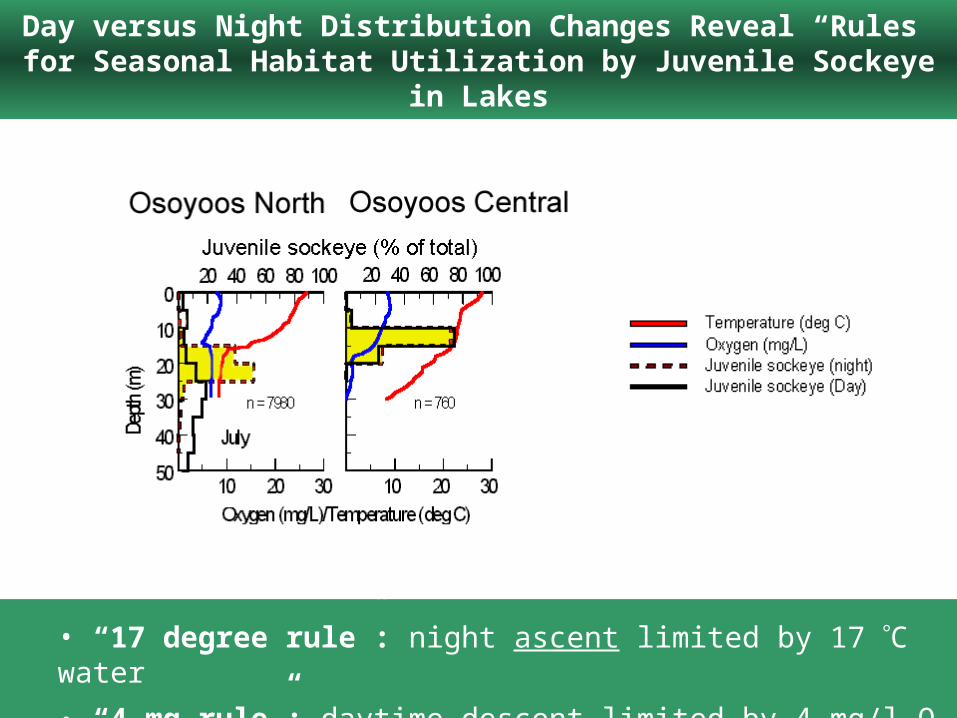
Climate Change Impacts on Frequency and Duration of Thermal Refuging by Marion Lake Salmonids
cool warm cool warm
x = 10.7
nr = 8 yr nr = 4 yr nr = 7 yr nr = 2 yr
nr = no refuge (# days above 21°C = 0)
adr = 7 days adr = 7.8 days adr = 10.1 days adr = 17 days

Interim Conclusions
• Our impact assessment model of sockeye life history responses to climate variations developed for Okanagan sockeye suggests southern stocks will be highly sensitive to future climate change.
• Our life history “models” developed on Okanagan sockeye may be usefully extended to quantify impacts on sockeye populations throughout the Pacific region (e.g. stocks in Sakinaw, Cultus and Marion lakes) .
• Climate variation & change effects on salmon populations are “non-stationary” (e.g. PDO cycles & longer term climate warming), partially predictable & should be assessed for their importance for effective salmon conservation & restoration planning.
• The latter will challenge institutional capacity and the existing socioeconomic order (e.g. Columbia R. salmon conservation & restoration experience).
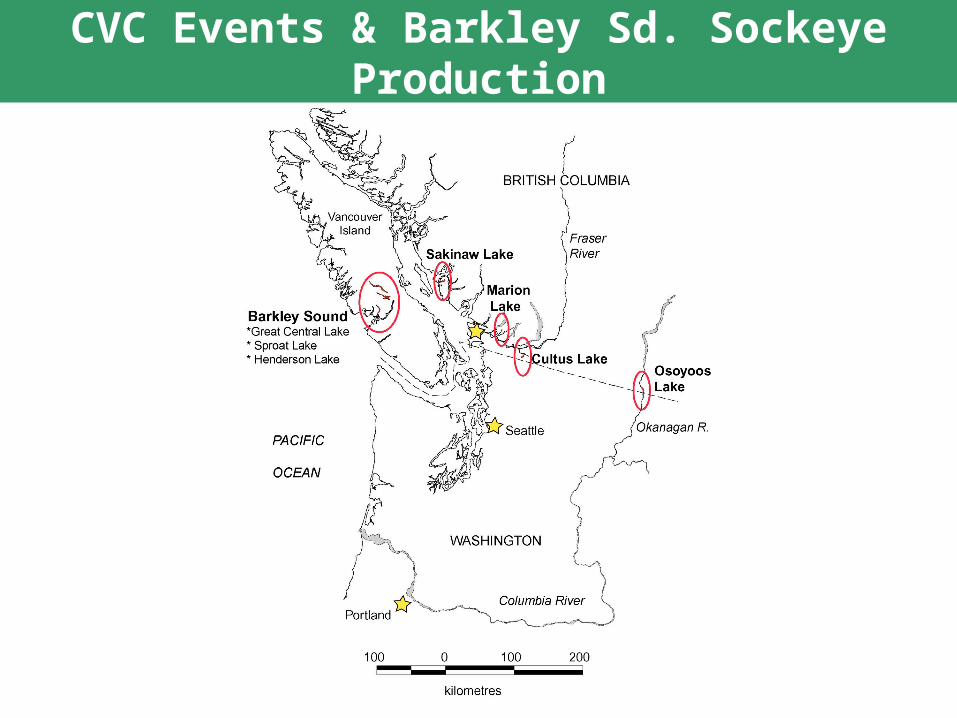
CVC Events & Barkley Sd. Sockeye Production

Barkley Sound Sockeye Return Variations
- returns exhibit two multi-decadal, production “regimes” (i.e. low & high average production)
- lots of within decade variation to complicate harvest management
19601900 200019401920 1980
1800
1600
2000
1000
800
600
400
200
0
1400
1200Sockeye returns decline 2 yrs after strong ENSO events
Sock
eye
(tho
usan
ds)

Long term (1903 – 1986) trends in sockeye returns exhibit stanzas of below & above average production that are not related
in any meaningful way to parent stock & recruitment
40
20
0
80
100
120
60
- 20
- 40- 60- 80
- 120
10 20 30 40 50 60 70 80
Above Average
Below Average
% o
f M
ean

Trends in marine temperature (Year N) & Barkley Sd sockeye returns (Year N+2) suggest production is depressed or enhanced by warm & cool coastal ocean
conditions respectively reflecting both ENSO & PDO cycles
0.0
0.1
0.2
0.3
0.4
0.5
0.6
0.7
0.8
0.9
0 5 10 15 20 25 30 35 40 45 50
SN
D’s
1935YEAR
1960 1984
Warm PDO
Warm PDOCool PDO
Year NYear N + 2

Partitioning of freshwater & marine survival within & among sockeye index stocks confirmed declines in early 80’s were localized to SWVI stocks and had
marine, not freshwater, origins.

Barkley Sound sockeye are especially sensitive because of theirtransitional zone location over which the subarctic domain has a varying influence (Fulton
and LeBrasseur 1985)
Strong El Niño- La Nina events induce major changes in continental shelf ecosystems.
Some of thesechanges alterecosystem capacityto support “robust”salmon populations.

Exotic Species Sightings off the BC Coast During 1983 (J. Fulton, P.B.S.)
(Brama japonica)
(Mola mola)
(Scomber japonicus)
(Sarda chiliensis)
(Pelicanus occidentalis)
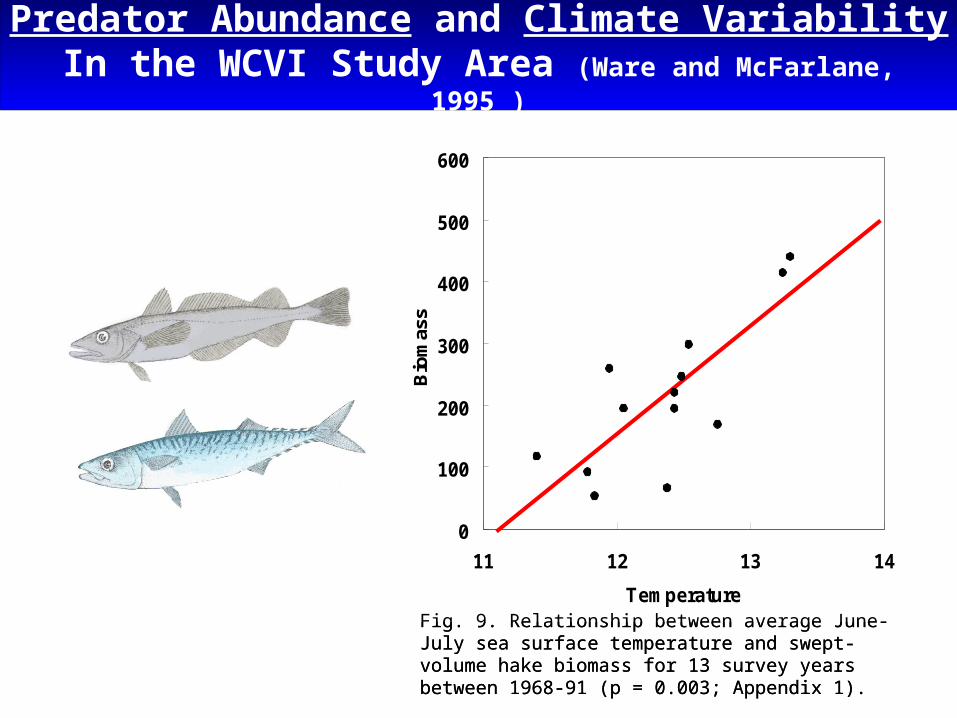
Predator Abundance and Climate VariabilityIn the WCVI Study Area (Ware and McFarlane, 1995 )
0
100
200
300
400
500
600
11 12 13 14
Temperature
Bio
mas
s
Fig. 9. Relationship between average June-July sea surface temperature and swept-volume hake biomass for 13 survey years between 1968-91 (p = 0.003; Appendix 1).

Two-State Model of El Nino – La Nina Mediated Production Responses of Barkley Sd. Sockeye (Hyatt et al. 1989)
Slow growth by juvenile sockeye
Sockeye Fry Recruitment:increases
decreases
Low northward transport
Dominant piscivores coevolved with sockeye
Average to low mortality for juvenile sockeye
Average to above average adult returns
Zooplankton: high biomass and large size
Rapid growth by juvenile sockeye
High northward transport
Dominant piscivores “foreign” to sockeye
Above average mortality for juvenile sockeye
Below average adult returns
Zooplankton: low biomass, small size

Salmon have complex life histories that integrate events in freshwater & marine ecosystems. Simple associations don’t reveal freshwater or marine causation (i.e. mechanisms for regime changes in climate & salmon production identified in many recent studies remain untested for freshwater vs marine origins not to mention their specific causes)
Offshore
Marine
ZoneCoastal Marine Zone
Nearshore Freshwater Zone
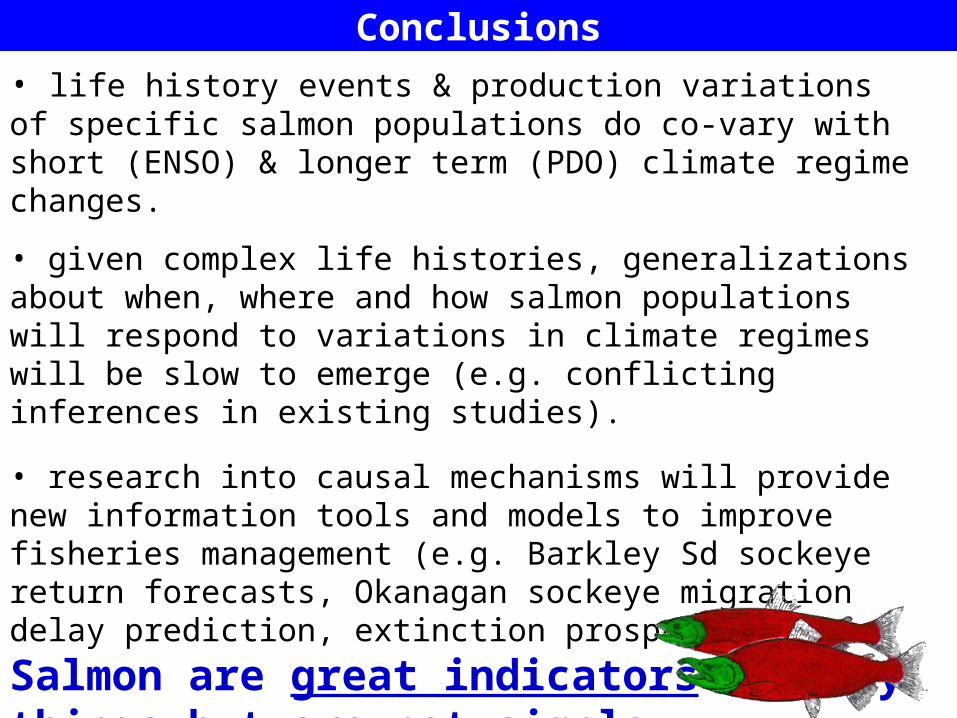
Conclusions
• life history events & production variations of specific salmon populations do co-vary with short (ENSO) & longer term (PDO) climate regime changes.
• given complex life histories, generalizations about when, where and how salmon populations will respond to variations in climate regimes will be slow to emerge (e.g. conflicting inferences in existing studies).
• research into causal mechanisms will provide new information tools and models to improve fisheries management (e.g. Barkley Sd sockeye return forecasts, Okanagan sockeye migration delay prediction,
extinction prospects). Salmon are great indicators of many things but are not simple indicators of hardly anything !

Possible Adaptation Responses by Managers
• eliminate harvest to compensate for decreased stock productivity (most harvest already eliminated; requires renegotiation of Salmon Treaty provisions).
• alter water management rules to favour fish production benefits to compensate for decreased stock productivity (holding back scour inducing flows in Okanagan Lake may induce millions of $$ of flood losses in Kelowna; requires renegotiation of Canada-BC Okanagan Basin Water Agreement).
• engineer new water-control facilities to reduce water temp, adult migration and egg hatch delays (capital costs in excess of $100 million).
• allocate more stored water in summer-fall to control temp-O2 “squeeze” and compensate for mortality events in Osoyoos Lake (limited summer water worth millions of $$ to users e.g. wineries who won’t give up willingly).
• ignore stock declines and risk triggering SARA-COSEWIC listing in Canada and ESA listing in the U.S. (would trigger challenges in courts by water and fisheries resource stakeholders in both countries; could provoke constitutional challenge by First Nations groups in Canada).