Impact of Climate Change on Cereal Market and Food...
26
________________________________________________________________________________________________ ________________________________________________________________________________________________ Impact of Climate Change on Cereal Market and Food Security in Sudan: Stochastic Approach and CGE Model Sassi M. 1 and Cardaci A. 1 1 Department of Economics and Management, University of Pavia, Pavia, Italy [email protected] Paper prepared for presentation at the 1 st AIEAA Conference ‘Towards a Sustainable Bio-economy: Economic Issues and Policy Challenges’ 4-5 June, 2012 Trento, Italy Summary The paper aims at analysing the impact of the likely change in rainfall on food availability and access to food in Sudan. The empirical investigation is based on an integrated approach consisting of a stochastic method and CGE model. The former provides the likely changes in sorghum, millet and wheat productivity and their probability of occurrence according to rainfall predictions based on historical data. These results are at the basis of the shocks simulated in a standard CGE model augmented with a stochastic component. Achievements underline the negative impact on the two dimensions of food security taken into consideration, mainly due to a reduction in cereal supply, a marked cereal inflation pressure and income contraction; the grater negative effect on the poorest households; and a deterioration of the economic performance of the country. In this context, the paper stresses a strong interconnection among climate change, poverty and food insecurity and thus the need for an integrated policy-making approach.
Transcript of Impact of Climate Change on Cereal Market and Food...

________________________________________________________________________________________________
________________________________________________________________________________________________
Impact of Climate Change on Cereal Market and Food Security in
Sudan: Stochastic Approach and CGE Model
Sassi M.1 and Cardaci A.1 1 Department of Economics and Management, University of Pavia, Pavia, Italy
Paper prepared for presentation at the 1st AIEAA Conference ‘Towards a Sustainable Bio-economy: Economic Issues and Policy Challenges’
4-5 June, 2012 Trento, Italy
Summary
The paper aims at analysing the impact of the likely change in rainfall on food availability and access to
food in Sudan. The empirical investigation is based on an integrated approach consisting of a stochastic
method and CGE model. The former provides the likely changes in sorghum, millet and wheat productivity
and their probability of occurrence according to rainfall predictions based on historical data. These results
are at the basis of the shocks simulated in a standard CGE model augmented with a stochastic component.
Achievements underline the negative impact on the two dimensions of food security taken into consideration,
mainly due to a reduction in cereal supply, a marked cereal inflation pressure and income contraction; the
grater negative effect on the poorest households; and a deterioration of the economic performance of the
country. In this context, the paper stresses a strong interconnection among climate change, poverty and food
insecurity and thus the need for an integrated policy-making approach.

________________________________________________________________________________________________
________________________________________________________________________________________________
Keywords: climate change, food security, stochastic approach, cge, sudan JEL Classification codes: C68; Q18; Q54

1st AIEAA Conference – Towards a Sustainable Bio-economy: Economic Issues and Policy Challenges Trento, 4-5 June 2012 ________________________________________________________________________________________________
________________________________________________________________________________________________
1
Impact of Climate Change on Cereal Market and Food Security in
Sudan: Stochastic Approach and CGE Model
Sassi M.1 and Cardaci A.1 1 Department of Economics and Management, University of Pavia, Pavia, Italy
1. INTRODUCTION
The evidence from the literature agrees on three points: there is a high probability of significant changes in
global climate (Ito et al., 2010; IPCC, 2007); the state of environment will continue to deteriorate if the right
actions are not taken (Torres, 2008); and the relative impacts of climate change are greater in low-income
countries (Tol, 2010). These latter are more vulnerable due to several factors, among which there are their
location in tropical zones of the equatorial area, increasing temperatures that already affect production in
sectors like agriculture, their lower adaptation and institutional capacity.
The recently developed empirical investigations focus on specific aspects of the effect of climate change.
The major topics concern the impact on agriculture and forestry, water resources, coastal zones, energy
consumption, air quality and human health and welfare (Tol, 2010). Little attention is given to food security,
particularly in Sub-Saharan Africa (Thompson et al., 2010). This paper addresses this topic, focusing on the
impact of rainfall.
Changes in the precipitation patterns are one of the dimensions of climate change. This is of great
importance in developing countries, where the rain-fed agriculture is still a dominant economic activity. Also
in this respect, Sub-Saharan Africa shows a higher vulnerability compared to other developing areas. For
example, in the continent, more than 95 per cent of the farmed land is rain-fed, whereas this is almost 90 per
cent in Latin America, about 60 per cent in South Asia, 65 per cent in East Asia, and 75 per cent in the Near
East and North Africa (Huho, 2011). This sector also constitutes the livelihood base for a vast majority of
inhabitants and, for this reason, it plays a crucial role in food security (Wani et al., 2009).
The paper focuses on Sudan, one of the poorest countries in the world, and with more than a quarter of the
population undernourished and 27 per cent of children under five malnourished (UNEP, 2007). Rainfall
patterns make this country the driest and most at risk in Africa (Sassi, 2012). Indeed, precipitation is
concentrated in four months only, and it is extremely variable over space, according to the ecological zones,
and over time, with extreme weather events more frequent than normal.
The Sudanese agriculture is based on three farming systems, the traditional and mechanised rain-fed
agriculture and the irrigated sector. According to the data provided by the General Directorate of
Agricultural Planning and Economics of the Ministry of Agriculture and Forests, the former two sectors

1st AIEAA Conference – Towards a Sustainable Bio-economy: Economic Issues and Policy Challenges Trento, 4-5 June 2012 ________________________________________________________________________________________________
________________________________________________________________________________________________
2
contribute to the production of the majority of staple foods, that is all millet and 75.93 per cent of sorghum.
The Sudanese grain diet is completed by wheat, which instead is mainly grown with the irrigation system. As
millet, sorghum and wheat are the major sources of food availability in the country, the paper limits climate-
induced damage to these three crops. Nevertheless, rain-fed agriculture is also important for the economic
access to food, as 70 per cent of the population depends on this sector for employment, income and, more
generally, livelihood.
The above mentioned dimensions of the concept of food security introduced by the 1996 World Food
Summit, i.e. food availability and access, are the specific focus of this paper. More precisely, the research
questions of this paper are: according to the historical rainfall data, what is the likely change in millet,
sorghum and wheat productivity and its probability of occurrence? Hence, what is the impact of such a
change on food availability and household access to food and on the overall economy of the country? The
answer is provided by integrating two methodologies: the stochastic analysis and the CGE model.
In the literature, the economic impact of climate change has been assessed by either partial equilibrium or
general equilibrium approaches. The former depict only part of an overall economy. On the contrary, general
equilibrium models look at the economy as a whole system, where industries have an effect on each other or
the rest of the economy; thus they provide an economy-wide analysis that may capture the links between the
sector affected by the shock (in our case millet, sorghum and wheat) and the others (Zhai et al., 2009).
With the CGE model, this paper takes into consideration both of them, within an economy-wide approach.
This analytical perspective is lacking in the investigation developed with respect to Sub-Saharan Africa.
There are examples for Asia, such as the study of van der Mensbrugghe (2010).
More precisely, the paper uses the CGE model developed at the International Food Policy Research Institute
(IFPRI) by Lofgren et al. (2002). The model is based on the 2004 social accounting matrix (SAM) for Sudan
(Siddig, 2011), thereby considering the country prior to the separation. What is more, the CGE model is
augmented with a stochastic component in order to simulate three different rainfall scenarios, which are the
result of a risk analysis approach using Monte Carlo methods. This paper does not simulate the “10 per cent
shock” traditionally adopted by the empirical literature due to its easy interpretation. Instead, the stochastic
method allows defining the extreme values of an interval, within which the effect of the simulated shocks has
a 90 per cent probability to happen, and its mean value, if the historical trend is confirmed.
To this aim, a stochastic shock-parameter is added to the value-added function. A similar methodology has
been adopted by Harris et al. (2001) with the aim of simulating the general uncertainty in agriculture and/or
uncertainty caused by ENSO (El Niño/Southern Oscillation) events in Mexico. However, in comparison to
that analysis, this paper improves the definition of the stochastic shocks.
Another new element introduced by this paper is that it goes far beyond the traditional economy-wide
general equilibrium analysis developed for Sudan, which only assesses the impact of trade liberalisation or
exchange rate policies (Elbushra et al., 2010; Siddig, 2011; Siddig and Babiker, 2011).
The analysis developed here can contribute to better inform the current debate underway in Sudan on the
strategy and the actions needed to tackle climate change, consequent to the signature of the international
1st AIEAA Conference – Towards a Sustainable Bio-economy: Economic Issues and Policy Challenges Trento, 4-5 June 2012 ________________________________________________________________________________________________
________________________________________________________________________________________________
3
agreements and conventions such as the Kyoto Protocol and UNFCCC and the completion of its National
Adaption Programme for Action (NAPA) (Zakieledeen, 2009).
The paper is structured as follows: section 2 introduces the methodology, articulated into the stochastic
model and the CGE model; section 3 discusses achievements starting from the stochastic model, moving on
to the scenarios and the related shocks simulated in the CGE model; section 4 concludes.
2. METHODOLOGY
2.1 Stochastic method
Risk analysis refers to the Monte Carlo method, a computer-based approach developed in the 1940s that uses
statistical sampling techniques to obtain a probabilistic approximation to the solution of a mathematical
equation model (Metropolis 1949; Hayse 2000).
It starts with the definition of the parametric model that explains the phenomena investigated and the
estimation of its parameters. Then a probability distribution function is assigned to each of the input
stochastic explanatory variables. The output from the model is calculated many times, randomly selecting a
new value from the probability distributions for each of the input explanatory variables every time. The
outputs from each run of the model are saved and a probability distribution for the output values is generated.
This allows the probability of occurrence of any particular output value to be calculated. This paper makes
reference to such values for the definition of the adopted scenarios.
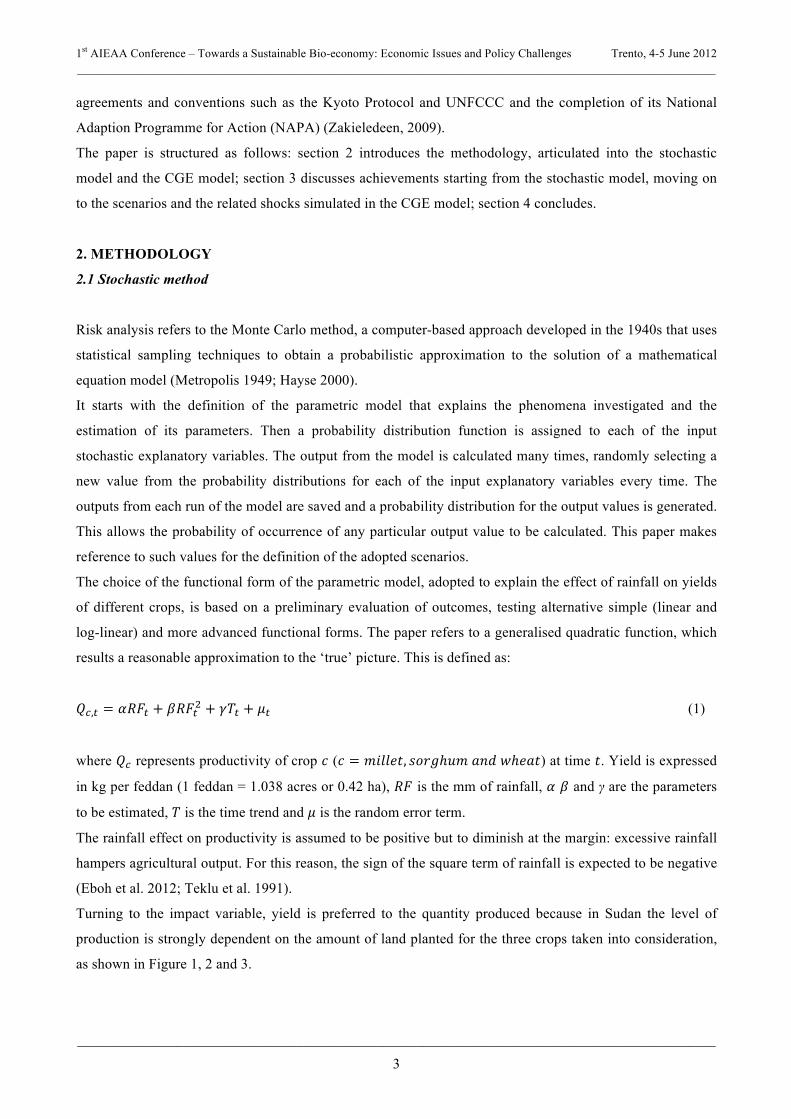
The choice of the functional form of the parametric model, adopted to explain the effect of rainfall on yields
of different crops, is based on a preliminary evaluation of outcomes, testing alternative simple (linear and
log-linear) and more advanced functional forms. The paper refers to a generalised quadratic function, which
results a reasonable approximation to the ‘true’ picture. This is defined as:
!!,! = !!"! + !!"!! + !!! + !! (1)
where !! represents productivity of crop ! (! = !"##$%, !"#$ℎ!" !"# !ℎ!"#) at time !. Yield is expressed
in kg per feddan (1 feddan = 1.038 acres or 0.42 ha), !" is the mm of rainfall, ! ! and γ are the parameters
to be estimated, ! is the time trend and ! is the random error term.
The rainfall effect on productivity is assumed to be positive but to diminish at the margin: excessive rainfall
hampers agricultural output. For this reason, the sign of the square term of rainfall is expected to be negative
(Eboh et al. 2012; Teklu et al. 1991).
Turning to the impact variable, yield is preferred to the quantity produced because in Sudan the level of
production is strongly dependent on the amount of land planted for the three crops taken into consideration,
as shown in Figure 1, 2 and 3.

1st AIEAA Conference – Towards a Sustainable Bio-economy: Economic Issues and Policy Challenges Trento, 4-5 June 2012 ________________________________________________________________________________________________
________________________________________________________________________________________________
4
Figure 1 – Millet: Production (000 tons), yield (kg/fed) and area planted (feddan) (1954/53 – 2007/06).
Source: authors’ elaboration based on data provided by General Directorate of Agricultural Planning and Economics of the Ministry of Agriculture and Forests
Figure 2 – Sorghum: Production (000 tons), yield (kg/fed) and area planted (feddan) (1954/53 – 2007/06).
Source: authors’ elaboration based on data provided by General Directorate of Agricultural Planning and Economics of the Ministry of Agriculture and Forests
0
2000
4000
6000
8000
10000
12000
0
200
400
600
800
1000
1200
1954/53
1956/55
1958/57
1960/59
1962/61
1964/63
1966/65
1968/67
1970/69
1972/71
1974/73
1976/75
1978/77
1980/79
1982/81
1984/83
1986/85
1988/87
1990/89
1992/91
1994/93
1996/95
1998/97
2000/99
2002/01
2004/03
2006/05
Feddan
000 tons and kg/fed
Production (000 tons) Yield (Kg/fed) Area planted (feddan)
0
5000
10000
15000
20000
25000
0
1000
2000
3000
4000
5000
6000
1954/53
1956/55
1958/57
1960/59
1962/61
1964/63
1966/65
1968/67
1970/69
1972/71
1974/73
1976/75
1978/77
1980/79
1982/81
1984/83
1986/85
1988/87
1990/89
1992/91
1994/93
1996/95
1998/97
2000/99
2002/01
2004/03
2006/05
feddan
000 tons and kg/fed
Production (000 tons) Yield (Kg/fed) Area planted (feddan)

1st AIEAA Conference – Towards a Sustainable Bio-economy: Economic Issues and Policy Challenges Trento, 4-5 June 2012 ________________________________________________________________________________________________
________________________________________________________________________________________________
5
Figure 3 – Wheat: Production (000 tons), yield (kg/fed) and area planted (feddan) (1954/53 – 2007/06).
Source: authors’ elaboration based on data provided by General Directorate of Agricultural Planning and Economics of the Ministry of Agriculture and Forests
Data make reference to the time period from 1954/53-2007/06. Information on yields has been provided by
the General Directorate of Agricultural Planning and Economics of the Ministry of Agriculture and Forests.
Precipitation data till 1999 are those elaborated at the aggregate level for Sudan by Tim Mirchell and
available at the web site http://www.cru.uea.ac.uk/cru/data/hrg/. Information from 2000 to 2007 has been
provided by the Arab Organization for Agricultural Development disaggregated by meteorological station.
This latter has been aggregated at the country level adopting the same methodology followed by Mirchell,
that is the simple average precipitation by meteorological station.
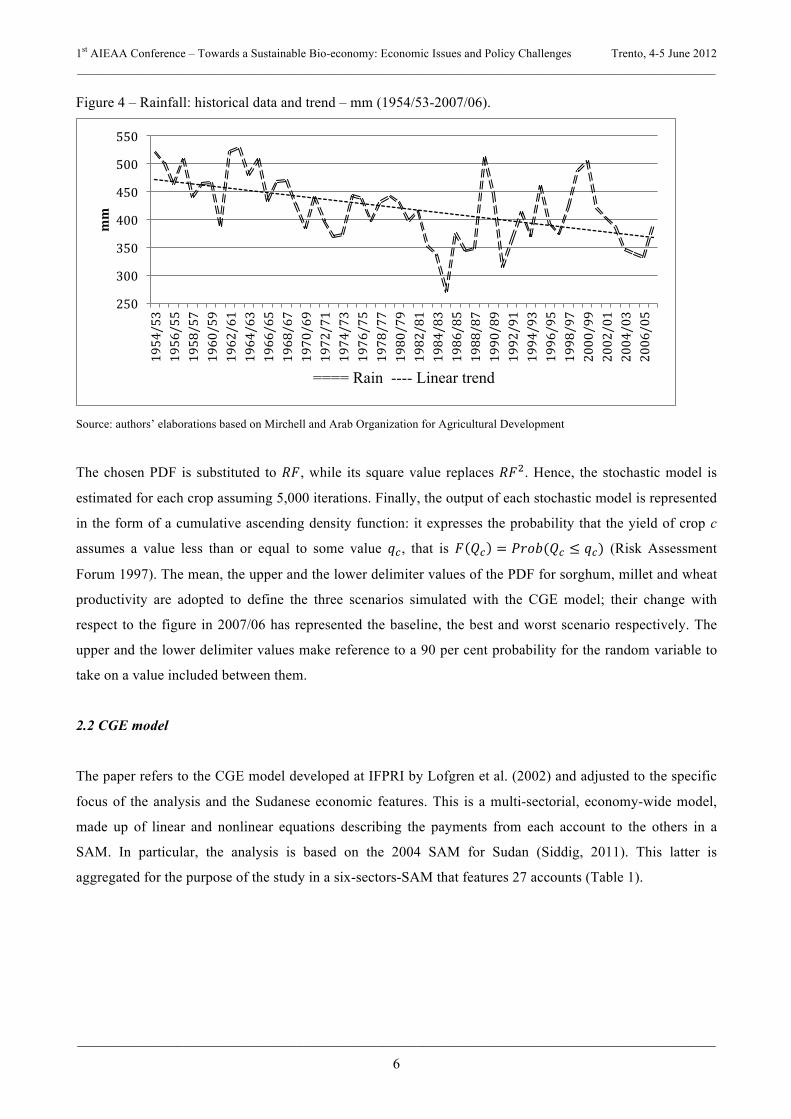
Figure 4 shows the historical data for rainfall and its linear trend suggesting a decreasing tendency over the
time period taken into consideration and wider fluctuations starting from the 1980s.
In order to characterise the stochastic model, the likely values assumed by rainfall and its square value are
represented by a probability density function (PDF). For rainfall, it makes reference to the historical data of
precipitation and it is defined by introducing hypothesis on the lower and upper bound. Harris et al. (2001)
introduce a normal PDF for precipitation, with values included between ±∞. On the contrary, this analysis
assumes the lower bound equal to zero, due to the fact that precipitation cannot have a negative value, and
the upper bound limited but unknown, in order to include extreme weather events, such as floods.
Furthermore, the distribution function is not selected a priori as in the above-mentioned study by Harris et al.
(2001). In fact, it is chosen according to three statistics tests, which measure the compatibility of rainfall and
its square value with the selected PDF: they are the Chi-squared statistic (C-S), the Kolmogorov-Simirnov
statistic (K-S), Anderson-Darling statistic (A-D) (Palisade Corporation 2010).
0
200
400
600
800
1000
1200
1400
0
200
400
600
800
1000
1200
1954/53
1956/55
1958/57
1960/59
1962/61
1964/63
1966/65
1968/67
1970/69
1972/71
1974/73
1976/75
1978/77
1980/79
1982/81
1984/83
1986/85
1988/87
1990/89
1992/91
1994/93
1996/95
1998/97
2000/99
2002/01
2004/03
2006/05
feddan
ooo tons and kg/fed
Production (000 tons) Yield (Kg/fed) Area planted (feddan)
1st AIEAA Conference – Towards a Sustainable Bio-economy: Economic Issues and Policy Challenges Trento, 4-5 June 2012 ________________________________________________________________________________________________
________________________________________________________________________________________________
6
Figure 4 – Rainfall: historical data and trend – mm (1954/53-2007/06).
Source: authors’ elaborations based on Mirchell and Arab Organization for Agricultural Development
The chosen PDF is substituted to !", while its square value replaces !"!. Hence, the stochastic model is
estimated for each crop assuming 5,000 iterations. Finally, the output of each stochastic model is represented
in the form of a cumulative ascending density function: it expresses the probability that the yield of crop c
assumes a value less than or equal to some value !!, that is ! !! = !"#$(!! ≤ !!) (Risk Assessment
Forum 1997). The mean, the upper and the lower delimiter values of the PDF for sorghum, millet and wheat
productivity are adopted to define the three scenarios simulated with the CGE model; their change with
respect to the figure in 2007/06 has represented the baseline, the best and worst scenario respectively. The
upper and the lower delimiter values make reference to a 90 per cent probability for the random variable to
take on a value included between them.
2.2 CGE model
The paper refers to the CGE model developed at IFPRI by Lofgren et al. (2002) and adjusted to the specific
focus of the analysis and the Sudanese economic features. This is a multi-sectorial, economy-wide model,
made up of linear and nonlinear equations describing the payments from each account to the others in a
SAM. In particular, the analysis is based on the 2004 SAM for Sudan (Siddig, 2011). This latter is
aggregated for the purpose of the study in a six-sectors-SAM that features 27 accounts (Table 1).
250
300
350
400
450
500
550 1954/53
1956/55
1958/57
1960/59
1962/61
1964/63
1966/65
1968/67
1970/69
1972/71
1974/73
1976/75
1978/77
1980/79
1982/81
1984/83
1986/85
1988/87
1990/89
1992/91
1994/93
1996/95
1998/97
2000/99
2002/01
2004/03
2006/05
mm
==== Rain ---- Linear trend
1st AIEAA Conference – Towards a Sustainable Bio-economy: Economic Issues and Policy Challenges Trento, 4-5 June 2012 ________________________________________________________________________________________________
________________________________________________________________________________________________
7
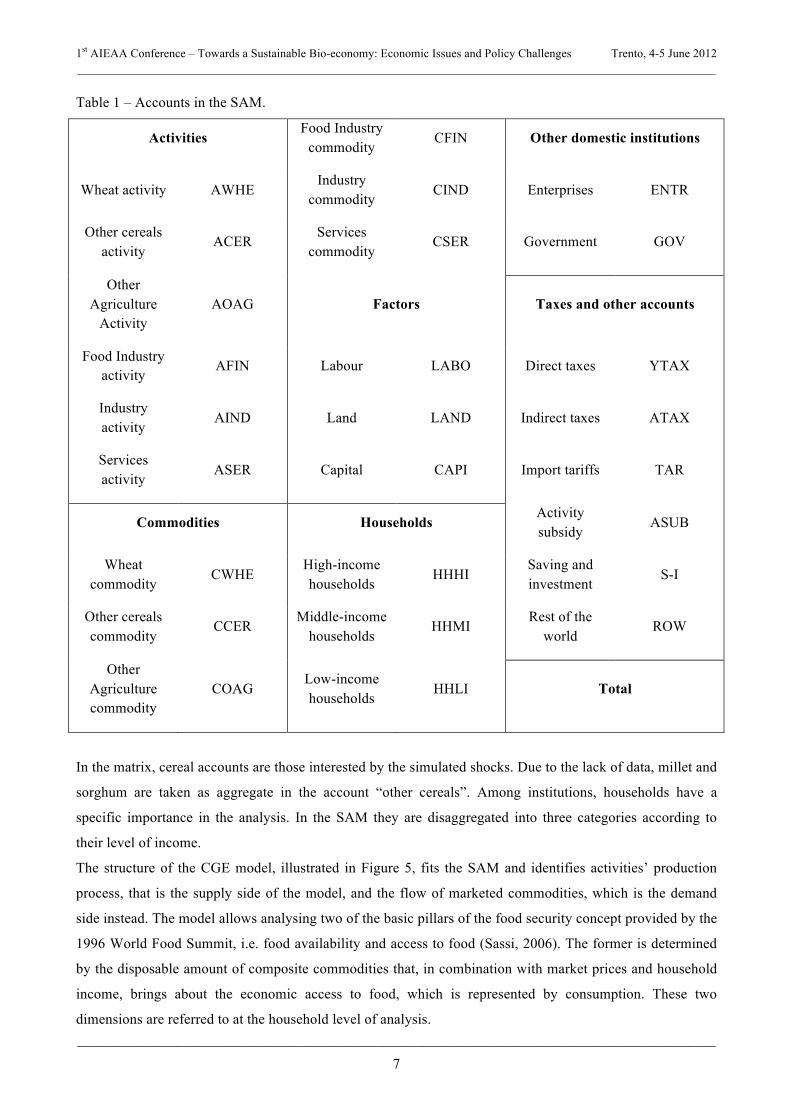
Table 1 – Accounts in the SAM.
Activities Food Industry
commodity CFIN Other domestic institutions
Wheat activity AWHE Industry
commodity CIND Enterprises ENTR
Other cereals activity
ACER Services
commodity CSER Government GOV
Other Agriculture
Activity AOAG Factors Taxes and other accounts
Food Industry activity
AFIN Labour LABO Direct taxes YTAX
Industry activity
AIND Land LAND Indirect taxes ATAX
Services activity
ASER Capital CAPI Import tariffs TAR
Commodities Households Activity subsidy
ASUB
Wheat commodity
CWHE High-income households
HHHI Saving and investment
S-I
Other cereals commodity
CCER Middle-income
households HHMI
Rest of the world
ROW
Other Agriculture commodity
COAG Low-income households
HHLI Total
In the matrix, cereal accounts are those interested by the simulated shocks. Due to the lack of data, millet and
sorghum are taken as aggregate in the account “other cereals”. Among institutions, households have a
specific importance in the analysis. In the SAM they are disaggregated into three categories according to
their level of income.
The structure of the CGE model, illustrated in Figure 5, fits the SAM and identifies activities’ production
process, that is the supply side of the model, and the flow of marketed commodities, which is the demand
side instead. The model allows analysing two of the basic pillars of the food security concept provided by the
1996 World Food Summit, i.e. food availability and access to food (Sassi, 2006). The former is determined
by the disposable amount of composite commodities that, in combination with market prices and household
income, brings about the economic access to food, which is represented by consumption. These two
dimensions are referred to at the household level of analysis.
1st AIEAA Conference – Towards a Sustainable Bio-economy: Economic Issues and Policy Challenges Trento, 4-5 June 2012 ________________________________________________________________________________________________
________________________________________________________________________________________________
8
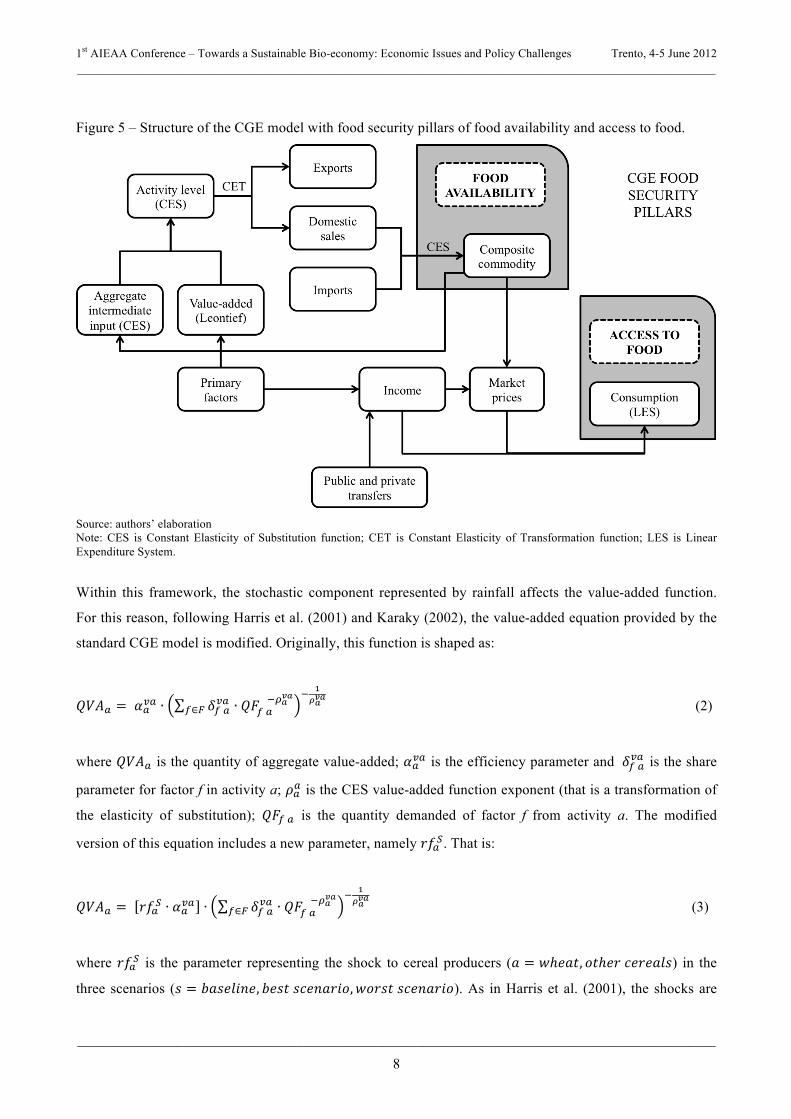
Figure 5 – Structure of the CGE model with food security pillars of food availability and access to food.
Source: authors’ elaboration Note: CES is Constant Elasticity of Substitution function; CET is Constant Elasticity of Transformation function; LES is Linear Expenditure System.
Within this framework, the stochastic component represented by rainfall affects the value-added function.
For this reason, following Harris et al. (2001) and Karaky (2002), the value-added equation provided by the
standard CGE model is modified. Originally, this function is shaped as:
!"#! = !!!" ∙ !! !!" ∙ !"! ! !!!!"
!∈!! !!!!" (2)
where !"#! is the quantity of aggregate value-added; !!!" is the efficiency parameter and !! !!" is the share
parameter for factor f in activity a; !!! is the CES value-added function exponent (that is a transformation of
the elasticity of substitution); !"! ! is the quantity demanded of factor f from activity a. The modified
version of this equation includes a new parameter, namely !"!!. That is:
!"#! = !"!! ∙ !!!" ∙ !! !!" ∙ !"! ! !!!!"
!∈!! !!!!" (3)
where !"!! is the parameter representing the shock to cereal producers (! = !ℎ!"#, !"ℎ!" !"#"$%&) in the
three scenarios (! = !"#$%&'$, !"#$ !"#$%&'(,!"#$% !"#$%&'(). As in Harris et al. (2001), the shocks are

1st AIEAA Conference – Towards a Sustainable Bio-economy: Economic Issues and Policy Challenges Trento, 4-5 June 2012 ________________________________________________________________________________________________
________________________________________________________________________________________________
9
Hicks-neutral technological shocks, meaning that the proportion of inputs for each output remains the same.
In equation 3, !"!! is such that 0 < !"!! < 1. As a matter of fact, !"!! is defined as:
!"!! = 1 + !"#$!! (4)
where !"#$!! equals the results of the risk analysis.
2.2.1 Model closure
A final aspect taken into consideration for the definition of the CGE model is its closure. The
macroeconomic consistency of the model is achieved imposing a number of constraints. These refer to the
savings-investment balance, the government balance and the current account balance. Furthermore, since the
way macroeconomic variables adjust in the modelled economy is determined by the choice of the constraints
(Thurlow et al., 2002), these latters have to be set up looking at the way macroeconomic causalities work in
the Sudanese economy.
In particular, an investment-driven closure is used, with savings being the flexible variable (Elbushra et al,
2010; Siddig, K. et al., 2011). Such a constraint implies savings to adjust as investment varies. Moreover, in
the government balance, government savings is the endogenous variable, whereas all tax rates are exogenous
(Hassan et al., 1996; Elbushra et al, 2010; Siddig, K. et al., 2011). Finally, in the current account balance,
foreign savings is the flexible variable, whilst the real exchange rate is fixed.
Such a set of constraints seems to fit the Sudanese context for different reasons.
As the closure is investment-driven, the level of investment depends on entrepreneurs’ long-term
expectations and the role of assuring that investment is fully financed falls on savings. Therefore, in order to
enable private savings to follow investment variations, the base-year savings rates of domestic non-
government institutions adjust by the same number of percentage points. Nevertheless, in Sudan, the share of
government savings in total domestic savings is equal to 68%, thus meaning that government savings plays
the most important role in assuring that investment is fully financed (a similar criterion has been adopted by
Lofgren et al. (2001) for setting fixed investment quantities in a CGE model for Malawi). Using data from
the base simulation in our model, we have calculated this share as:
!"#$
!"#!∙ !!!"#$! ∙!"!!∈!"#!"# !!"#$ (5)
where !"#$ is government savings, !"#! is the marginal propensity to save of domestic nongovernment
institutions (!"#$"%), !"#$! is the direct tax rate for such institutions and !"! is their income. Hence,
!"#! ∙ 1 − !"#$! ∙ !"!!∈!"#$"% is private savings and, together with government savings, it combines to

1st AIEAA Conference – Towards a Sustainable Bio-economy: Economic Issues and Policy Challenges Trento, 4-5 June 2012 ________________________________________________________________________________________________
________________________________________________________________________________________________
10
bring about total domestic savings. This is derived from equation 6, which identifies the savings-investment
balance in the model as:
!"#! ∙ 1 − !"#$! ∙ !"!!∈!"#$"% + !"!" + !"# ∙ !"#$ = !"! ∙ !"#$!!∈! + !"! ∙ !"#$!!∈! (6)
The left-hand side of this equation identifies total savings, whereas the right-hand side describes total
investment. In addition to the already defined variables, !"# is the exchange rate and !"#$ is foreign
savings (i.e. the current account deficit). On the right-hand side, !"#$! is the quantity of investment demand
for commodity c, !"! is the composite commodity price and !"#$! is the quantity of stock change.
Moreover, as Taylor et al. (2006) point out, the idea behind flexible government savings is that governments
across the globe use automatic stabilisers and public works programmes to counter negative effects of
economic downturns, thus meaning the deficit (and not tax revenue) is endogenous. Finally, concerning the
current account balance, Sudan has a managed exchange rate regime (Collier et al., 1989; Hassan et al.,
1996; Elbushra et al, 2010; Siddig, K. et al., 2011) thus leaving us no choice but to make foreign savings the
clearing variable.
3. RESULTS
3.1 The parametric model
Results achieved by estimating equation 1 for millet and sorghum, through an Ordinary Last Square (OLS)
method, are illustrated in the following equations:
!!"##$%,! = 1
0.96650.0000
∗ !"! −1
0.00080.0083
∗ !"!!1
− 3.44350.0000
∗ !! + !!
!! = 0.9484; ! = 312.3 (0) (7)
(…) p-value
!!"#$!!",! = 1
1.45760.0000
∗ !"! −1
0.00140.0006
∗ !"!! 1
− 2.4659 0.0000
∗ !! + !!
!! = 0.9752; ! = 668.5 (0) (8)
(…) p-value

1st AIEAA Conference – Towards a Sustainable Bio-economy: Economic Issues and Policy Challenges Trento, 4-5 June 2012 ________________________________________________________________________________________________
________________________________________________________________________________________________
11
For wheat, the trend variable is not statistically significant. In risk analysis the definition of the parametric
model represents an important phase because the output of the stochastic model is sensitive to its structure.
The literature suggests to consider only the model input parameters that contribute the most to explain the
phenomena investigated, excluding those unimportant (Palisade Corporation 2010; Risk Assessment Forum
1997). For this reason, the stochastic model for wheat refers to the following parametric model:
!!!!"#,! =1
3.77840.0000
∗ !"! −1
0.00530.0000
∗ !"!! + !!
!! = 0.9176; ! = 289.6 (0) (9)
(…) p-value
In the three equations, the estimated parameters are statistically significant and show the expected sign.
Wheat productivity is the most sensitive to rainfall, followed by that of sorghum and millet. Millet is the
most inherently drought-tolerant of all the major staples representing a key cereal grain crop in the dry-lands.
In general, millet fits in the same areas of adaptation as sorghum, except that it is somewhat more drought
tolerant (http://www.cgiar.org/impact/global/des_fact2.html).
The sign of the estimated parameters suggests that precipitation affects the productivity of all the three crops
but at a decreasing rate. Finally, the trend variable has a statistically significant negative impact on sorghum
and millet productivity.
3.2 The stochastic model
The stochastic model derives from the above equations, substituting a probability density function to the
explanatory variables, that is mm of precipitation and its square value. A Riskbetageneral function fits the
historical data of precipitation: all the statistics tests have the lowest value for this distribution function
(Table 2).
Table 2 – Rainfall (RF): Specification of the probability distribution functions and statistics test.
Function C-S K-S A-D
RiskBetaGeneral(15.401;7,4421;0;622.57) 3.6667 0.3399 0.0807
RiskTriang(0;528.3;528.3) 28.6667 27.2467 0.3561
RiskUniform(0;538.27) 76.6667 +infinity 0.5784
Note: (…) are the arguments of the function

1st AIEAA Conference – Towards a Sustainable Bio-economy: Economic Issues and Policy Challenges Trento, 4-5 June 2012 ________________________________________________________________________________________________
________________________________________________________________________________________________
12
The parametric models are rewritten, substituting to !" the function
RiskBetaGeneral(15.401;7,4421;0;622.57), to !"! its square value, and to ! the number 55 that is the
number of observations plus one.
The output from the stochastic model for each crop is represented in terms of a probability distribution
function with the indication of the mean value and the delimiters corresponding to a 90 per cent probability.
This information is summarised in Table 3.
Table 3 – Output from the stochastic models.
Sorghum Wheat Millet Mean value 224.47 633.36 72.53
Upper delimiter 243.50 673.10 95.40 Lower delimiter 184.60 538.60 33.40
The scenarios adopted to define the shocks simulated in the CGE model are delineated on the basis of these
values calculating the change between each of them and the 2007/06 corresponding figure. The baseline is
defined with the mean value, the best scenario with the upper delimiter value and the worst scenario with the
lower delimiter value. As previously underlined, the SAM on which the CGE model is based, considers
millet and sorghum together in the account “other cereals”. Thus, the percentage change for the quantity
produced by this aggregate category is obtained as the weighted average of the sorghum and millet values,
using the average harvested area of the last ten years as a weight. Table 4 illustrates the scenarios adopted in
the analysis, as well as the simulated shocks that are computed on the basis of equation 4.
Table 4 – Scenarios and shocks.
Scenarios Shocks
Wheat Other cereals Wheat Other cereals Baseline
(mean value) -0.3600 -0.3575 0,6399 0,6424
Best (upper delimiter) -0.3198 -0.2667 0,6801 0,7332
Worst lower delimiter) -0.4557 -0.5287 0,5442 0,4712
Looking at the results from the simulations in the CGE model, the best and the worst scenario can be
interpreted as the extreme values of an interval within which there is a 90 per cent probability for the impact
to happen.
1st AIEAA Conference – Towards a Sustainable Bio-economy: Economic Issues and Policy Challenges Trento, 4-5 June 2012 ________________________________________________________________________________________________
________________________________________________________________________________________________
13
3.3 CGE food security pillars
3.3.1 Food availability
Under the effect of the three shocks simulated in this paper, food security in Sudan is expected to deteriorate
significantly.
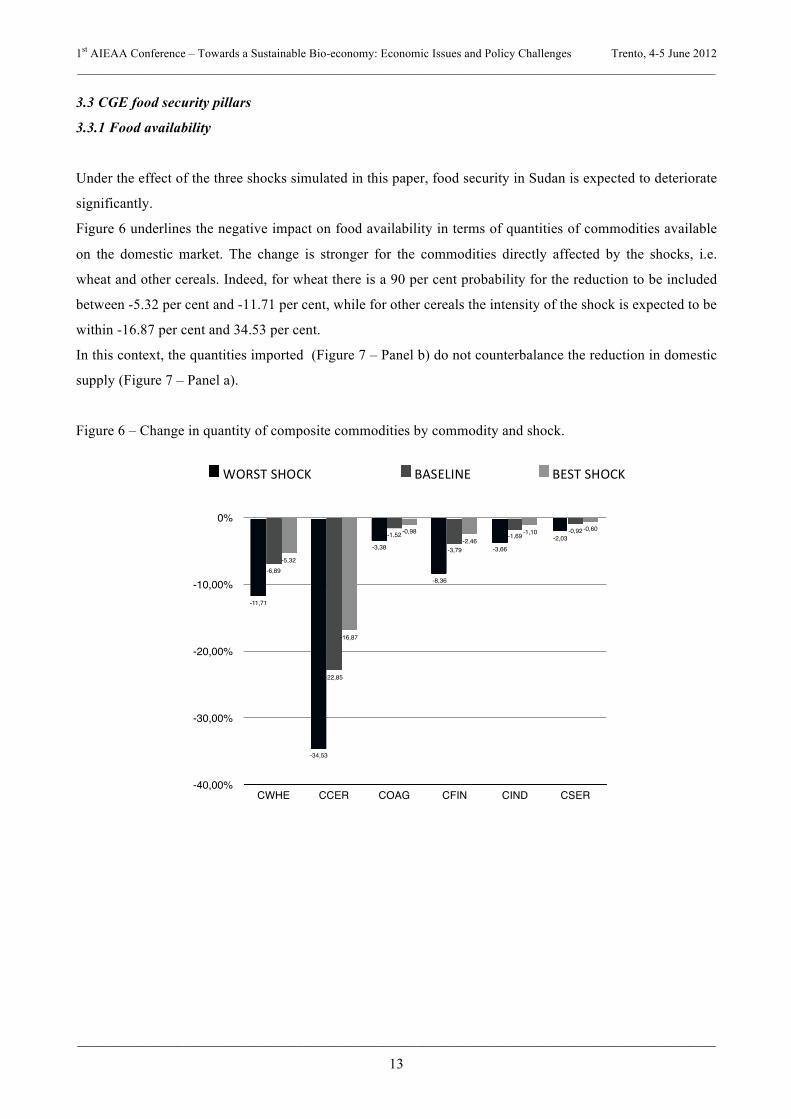
Figure 6 underlines the negative impact on food availability in terms of quantities of commodities available
on the domestic market. The change is stronger for the commodities directly affected by the shocks, i.e.
wheat and other cereals. Indeed, for wheat there is a 90 per cent probability for the reduction to be included
between -5.32 per cent and -11.71 per cent, while for other cereals the intensity of the shock is expected to be
within -16.87 per cent and 34.53 per cent.
In this context, the quantities imported (Figure 7 – Panel b) do not counterbalance the reduction in domestic
supply (Figure 7 – Panel a).
Figure 6 – Change in quantity of composite commodities by commodity and shock.
-40,00%
-30,00%
-20,00%
-10,00%
0%
CWHE CCER COAG CFIN CIND CSER
-0,60-1,10-2,46
-0,98
-16,87
-5,32
-0,92-1,69
-3,79
-1,52
-22,85
-6,89
-2,03
-3,66
-8,36
-3,38
-34,53
-11,71
WORST SHOCK BASELINE BEST SHOCK
1st AIEAA Conference – Towards a Sustainable Bio-economy: Economic Issues and Policy Challenges Trento, 4-5 June 2012 ________________________________________________________________________________________________
________________________________________________________________________________________________
14
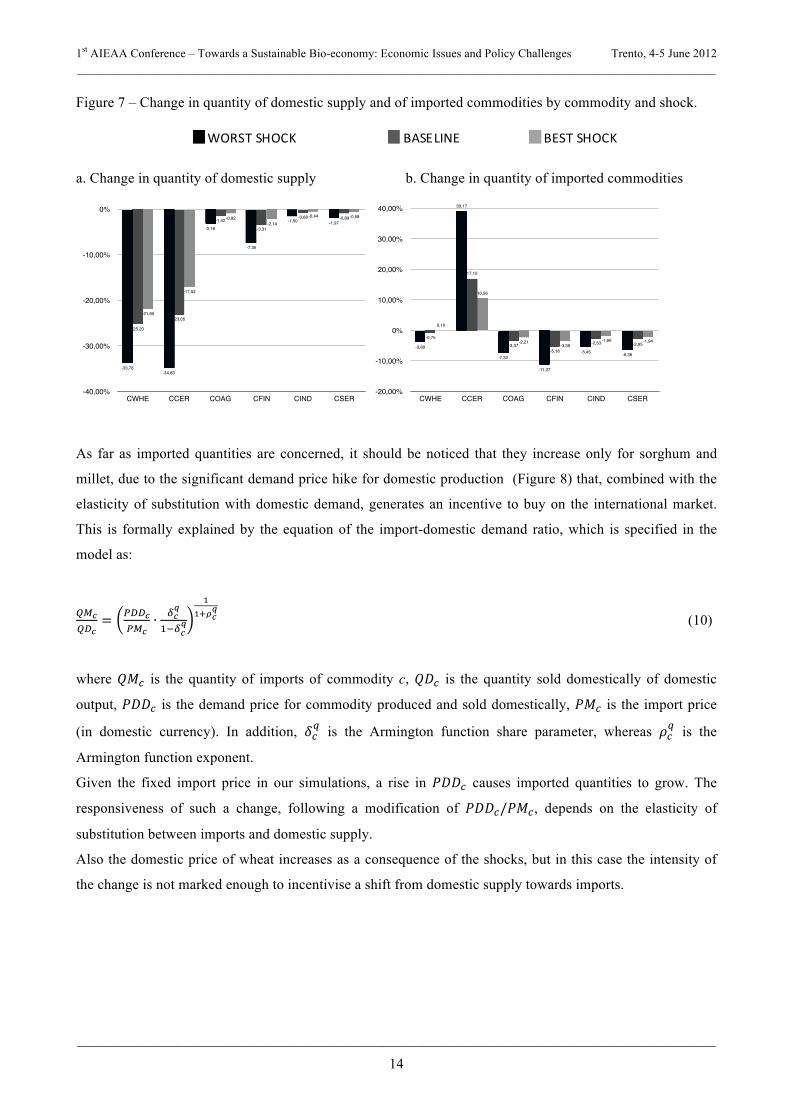
Figure 7 – Change in quantity of domestic supply and of imported commodities by commodity and shock.
a. Change in quantity of domestic supply b. Change in quantity of imported commodities
As far as imported quantities are concerned, it should be noticed that they increase only for sorghum and
millet, due to the significant demand price hike for domestic production (Figure 8) that, combined with the
elasticity of substitution with domestic demand, generates an incentive to buy on the international market.
This is formally explained by the equation of the import-domestic demand ratio, which is specified in the
model as:
!"!!"!
= !""!!"!
∙ !!!
!!!!!
!!!!!
! (10)
where !"! is the quantity of imports of commodity c, !"! is the quantity sold domestically of domestic
output, !""! is the demand price for commodity produced and sold domestically, !"! is the import price
(in domestic currency). In addition, !!! is the Armington function share parameter, whereas !!
! is the
Armington function exponent.
Given the fixed import price in our simulations, a rise in !""! causes imported quantities to grow. The
responsiveness of such a change, following a modification of !""!/!"!, depends on the elasticity of
substitution between imports and domestic supply.
Also the domestic price of wheat increases as a consequence of the shocks, but in this case the intensity of
the change is not marked enough to incentivise a shift from domestic supply towards imports.
-40,00%
-30,00%
-20,00%
-10,00%
0%
CWHE CCER COAG CFIN CIND CSER
-0,58-0,44
-2,14-0,92
-17,02
-21,85
-0,89-0,68
-3,31
-1,42
-23,05
-25,20
-1,97-1,50
-7,35
-3,18
-34,83-33,78
-20,00%
-10,00%
0%
10,00%
20,00%
30,00%
40,00%
CWHE CCER COAG CFIN CIND CSER
-1,94-1,66-3,39
-2,21
10,56
0,10
-2,95-2,53
-5,18-3,37
17,12
-0,75
-6,36-5,45
-11,27
-7,32
39,17
-3,89
WORST SHOCK BASELINE BEST SHOCK
1st AIEAA Conference – Towards a Sustainable Bio-economy: Economic Issues and Policy Challenges Trento, 4-5 June 2012 ________________________________________________________________________________________________
________________________________________________________________________________________________
15
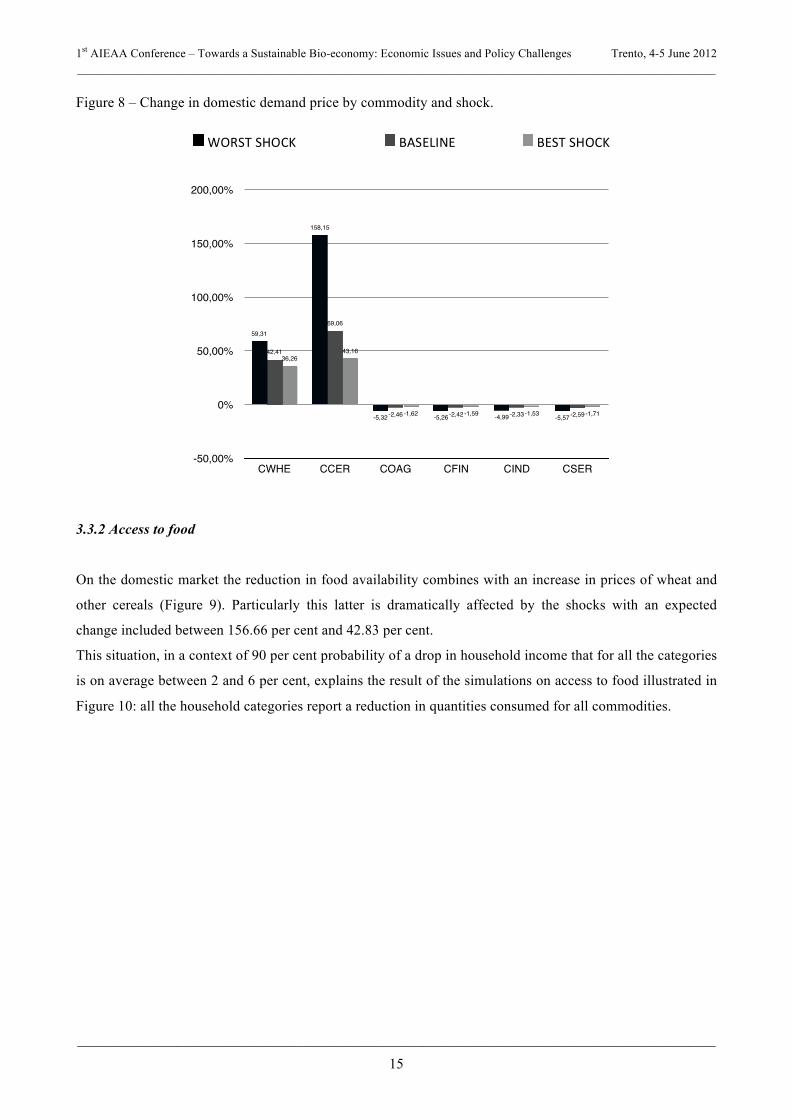
Figure 8 – Change in domestic demand price by commodity and shock.
3.3.2 Access to food
On the domestic market the reduction in food availability combines with an increase in prices of wheat and
other cereals (Figure 9). Particularly this latter is dramatically affected by the shocks with an expected
change included between 156.66 per cent and 42.83 per cent.
This situation, in a context of 90 per cent probability of a drop in household income that for all the categories
is on average between 2 and 6 per cent, explains the result of the simulations on access to food illustrated in
Figure 10: all the household categories report a reduction in quantities consumed for all commodities.
-50,00%
0%
50,00%
100,00%
150,00%
200,00%
CWHE CCER COAG CFIN CIND CSER
-1,71-1,53-1,59-1,62
43,1636,26
-2,59-2,33-2,42-2,46
69,06
42,41
-5,57-4,99-5,26-5,32
158,15
59,31
WORST SHOCK BASELINE BEST SHOCK

1st AIEAA Conference – Towards a Sustainable Bio-economy: Economic Issues and Policy Challenges Trento, 4-5 June 2012 ________________________________________________________________________________________________
________________________________________________________________________________________________
16
Figure 9 – Change in price of composite commodities by commodity and shock.
Figure 10 – Change in quantity of consumed commodities by households and shock.
a. Wheat b. Sorghum and millet
c. Other agriculture d. Food industry
-50,00%
0%
50,00%
100,00%
150,00%
200,00%
CWHE CCER COAG CFIN CIND CSER
-1,69-0,71-1,19-1,55
42,83
7,20
-2,56-1,08-1,81-2,35
68,50
8,30
-5,50-2,32-3,94-5,07
156,66
11,18
-30,00%
-22,50%
-15,00%
-7,50%
0%
HHLI HHMI HHHI
-2,94
-5,30
-11,81
-3,77
-6,85
-14,97
-6,31
-11,59
-24,52
-70,00%
-52,50%
-35,00%
-17,50%
0%
HHLI HHMI HHHI
-9,64
-19,01
-32,01
-9,64
-25,65
-43,29
-14,39
-38,31
-64,82
WORST SHOCK BASELINE BEST SHOCK
WORST SHOCK BASELINE BEST SHOCK

1st AIEAA Conference – Towards a Sustainable Bio-economy: Economic Issues and Policy Challenges Trento, 4-5 June 2012 ________________________________________________________________________________________________
________________________________________________________________________________________________
17
e. Industry f. Services
Other cereals demand shows the highest expected reduction with the possibility for the low-income
households to reduce by half their consumption. In general terms, this household category is the most
affected by the shocks simulated on the side of wheat and other cereal demand, followed by middle and high-
income households.
However, the direction of the shocks intensity is opposite for other agricultural products: most of the burden
of the consequences of the three shocks is on high-income households. Instead, concerning demand for other
crops, the greatest fall in quantity consumed is for middle-income households.
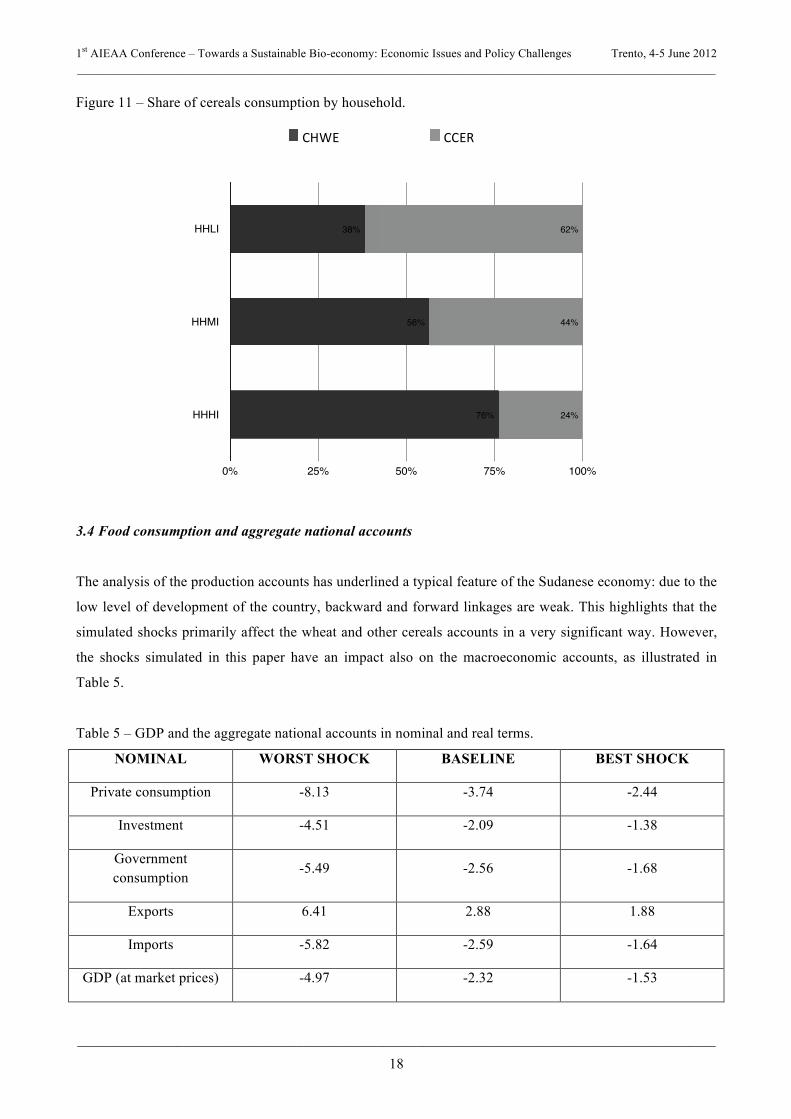
A noteworthy issue regards wheat and other cereals. As a matter of fact, the impact on food security of low-
income households is even more severe considering that these two commodities are staple food and that, for
this household category, other cereals represents more than 50 per cent of their total demand for cereals
(figure 11).
-6,00%
-4,50%
-3,00%
-1,50%
0%
HHLI HHMI HHHI
-1,58
-0,96-0,71
-2,42
-1,48-1,13
-5,35
-3,30
-2,59
-15,00%
-11,25%
-7,50%
-3,75%
0%
HHLI HHMI HHHI
-2,03
-3,69
-1,55
-3,10
-5,68
-2,43
-6,79
-12,57
-5,49
-15,00%
-11,25%
-7,50%
-3,75%
0%
HHLI HHMI HHHI
-2,21
-4,14
-1,75
-3,37
-6,35
-2,73
-7,34
-13,96
-6,10
-6,00%
-4,50%
-3,00%
-1,50%
0%
HHLI HHMI HHHI
-1,13
-1,71
-0,70
-1,74
-2,65
-1,11
-3,85
-5,95
-2,57
1st AIEAA Conference – Towards a Sustainable Bio-economy: Economic Issues and Policy Challenges Trento, 4-5 June 2012 ________________________________________________________________________________________________
________________________________________________________________________________________________
18
Figure 11 – Share of cereals consumption by household.
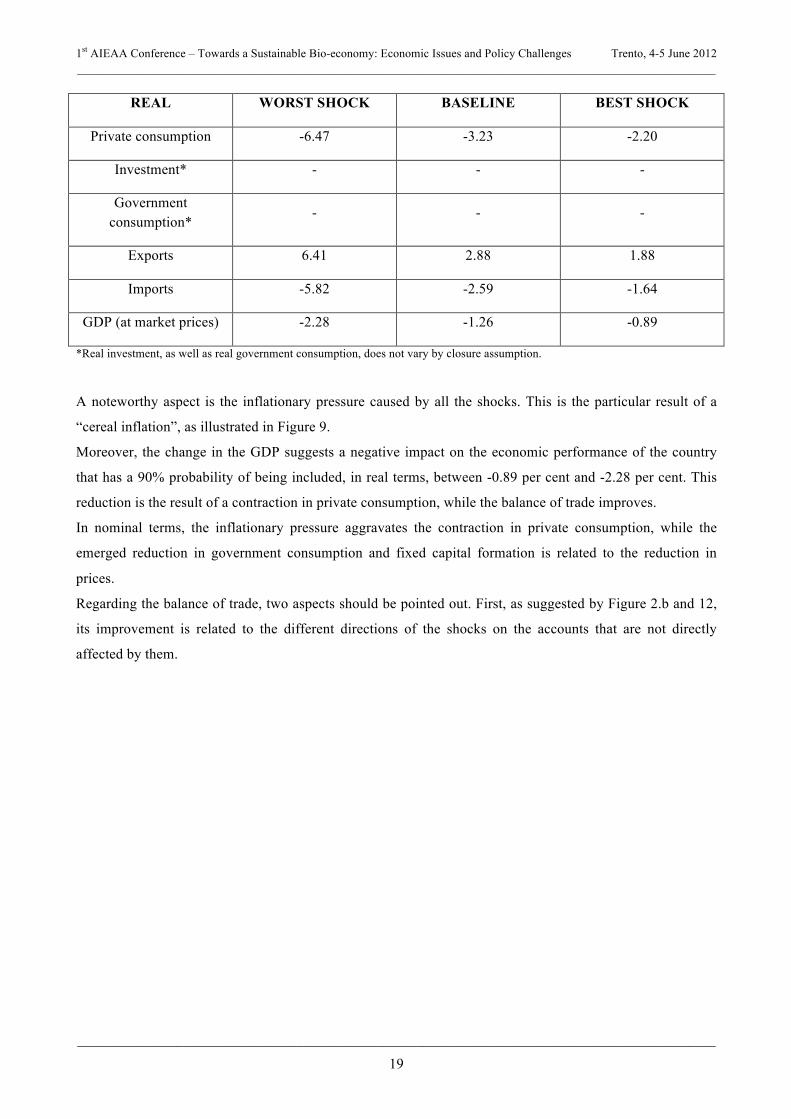
3.4 Food consumption and aggregate national accounts
The analysis of the production accounts has underlined a typical feature of the Sudanese economy: due to the
low level of development of the country, backward and forward linkages are weak. This highlights that the
simulated shocks primarily affect the wheat and other cereals accounts in a very significant way. However,
the shocks simulated in this paper have an impact also on the macroeconomic accounts, as illustrated in
Table 5.
Table 5 – GDP and the aggregate national accounts in nominal and real terms.
NOMINAL WORST SHOCK BASELINE BEST SHOCK
Private consumption -8.13 -3.74 -2.44
Investment -4.51 -2.09 -1.38
Government consumption
-5.49 -2.56 -1.68
Exports 6.41 2.88 1.88
Imports -5.82 -2.59 -1.64
GDP (at market prices) -4.97 -2.32 -1.53
HHLI
HHMI
HHHI
0% 25% 50% 75% 100%
24%
44%
62%
76%
56%
38%
CHWE CCER
1st AIEAA Conference – Towards a Sustainable Bio-economy: Economic Issues and Policy Challenges Trento, 4-5 June 2012 ________________________________________________________________________________________________
________________________________________________________________________________________________
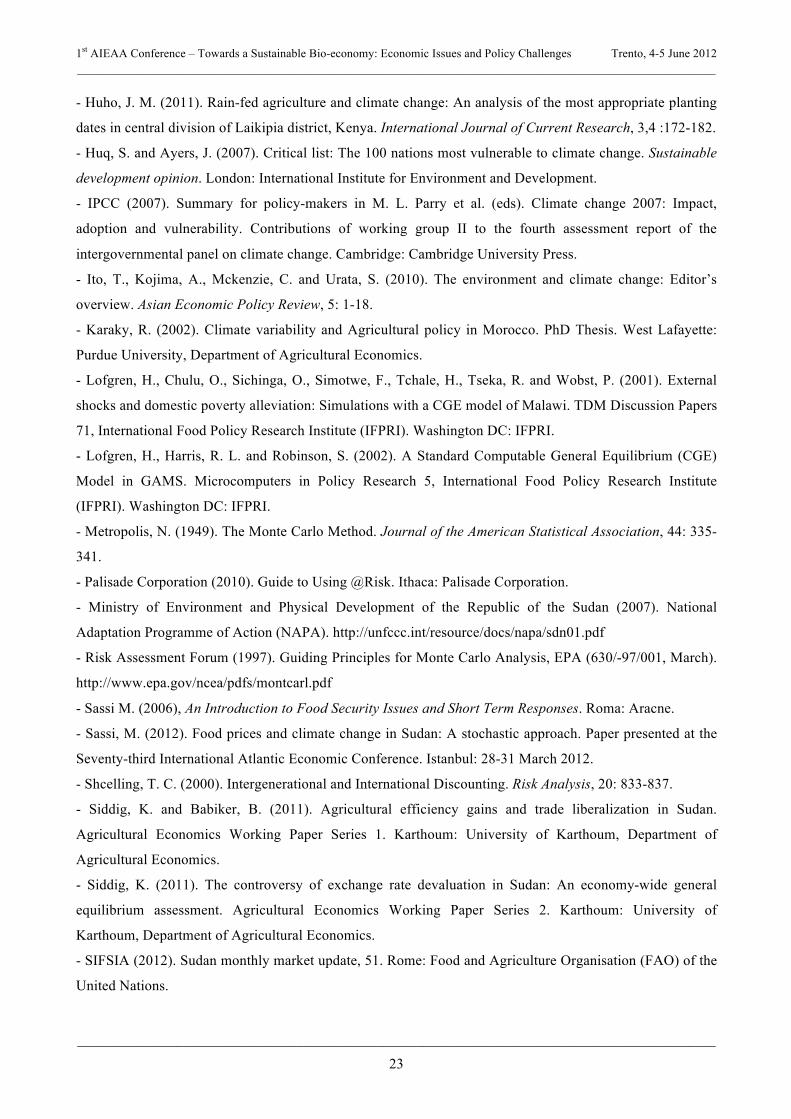
19
REAL WORST SHOCK BASELINE BEST SHOCK
Private consumption -6.47 -3.23 -2.20
Investment* - - -
Government consumption*
- - -
Exports 6.41 2.88 1.88
Imports -5.82 -2.59 -1.64
GDP (at market prices) -2.28 -1.26 -0.89
*Real investment, as well as real government consumption, does not vary by closure assumption.
A noteworthy aspect is the inflationary pressure caused by all the shocks. This is the particular result of a
“cereal inflation”, as illustrated in Figure 9.
Moreover, the change in the GDP suggests a negative impact on the economic performance of the country
that has a 90% probability of being included, in real terms, between -0.89 per cent and -2.28 per cent. This
reduction is the result of a contraction in private consumption, while the balance of trade improves.
In nominal terms, the inflationary pressure aggravates the contraction in private consumption, while the
emerged reduction in government consumption and fixed capital formation is related to the reduction in
prices.
Regarding the balance of trade, two aspects should be pointed out. First, as suggested by Figure 2.b and 12,
its improvement is related to the different directions of the shocks on the accounts that are not directly
affected by them.

1st AIEAA Conference – Towards a Sustainable Bio-economy: Economic Issues and Policy Challenges Trento, 4-5 June 2012 ________________________________________________________________________________________________
________________________________________________________________________________________________
20
Figure 12 – Change in quantity of exports* by commodity and shock.
*Wheat is not included because it is not exported
The “export incentive” provided to non-cereal activities is related to the reduction in domestic demand prices
for these accounts (Figure 8) in a context of fixed export prices, in combination with the elasticity of
substitution with domestic demand. This is captured by the export-domestic demand ration, which in the
model is written as:
!"!!"!
= !"!!"#!
∙ !!!!!
!!!
!!!!!! (11)
where !"! is the quantity of exports, !"! is the quantity sold domestically of domestic output, !!! is the CET
function share parameter and !!! is the CET function exponent.
Secondly, the improvement in the balance of trade is also explained by the fact that cereals represent only
0.10 per cent of total exports and 9.34 per cent of total imports.
Another important negative aspect that has to be highlighted is the reduction in nominal government
consumption that represents an important component of the GDP and, thus, of the Sudanese economic
growth and development.
-90,00%
-67,50%
-45,00%
-22,50%
0%
22,50%
CCER COAG CFIN CIND CSER
2,202,050,401,71
-53,26
3,363,130,552,59
-66,79
7,466,921,01
5,67
-85,71
WORST SHOCK BASELINE BEST SHOCK

1st AIEAA Conference – Towards a Sustainable Bio-economy: Economic Issues and Policy Challenges Trento, 4-5 June 2012 ________________________________________________________________________________________________
________________________________________________________________________________________________
21
4. CONCLUSIONS
By integrating a stochastic and a CGE model, this paper has investigated the consequences of different
rainfall scenarios on food security in Sudan with a specific focus on food availability and household access
to food.
From 1953/54 to 2006/07, precipitation in Sudan has reduced and the estimated parametric model has
confirmed its direct correlation with the productivity of sorghum, millet and wheat and the decreasing rate of
its intensity over time as suggested for the 1980s by Teklu et al. (1991). If the historical rainfall trend is
confirmed, the stochastic model has predicted a further reduction of the yield for the three selected crops,
confirming the expectations provided by the literature (UNEP, 2007; NAPA, 2007). On the basis of these
predictions, the CGE model has suggested a dramatic deterioration of both food availability and access to
food as a consequence of climate change; this is in line with the achievement of the World Food Programme
(2012) according to which below-average rainfall and delayed rains have a serious impact on food security.
In the model, the decline in food availability is due to a marked reduction in the quantity of cereal
commodities available on the domestic market. This is consistent with the literature arguing that the most
direct impact of climate change on food security is through availability due to changes in crop productivity
(Thompson, 2010). In the Sudanese case this situation is aggravated by a reduction in cereals import
incentives.
The worsening in access to food, instead, arises from the combination of the expected drop in household
income and the major cereal inflationary pressure. As a consequence, all household categories are affected
by the climatic shocks, with the biggest impact on the poorest households. This was an expected result taking
into consideration that the poorest spend more than 80 per cent of their total budget on food and that half of
their total demand is for cereals (SIFSIA, 2012).
The CGE model has also made possible to identify the main macroeconomic causalities in the Sudanese
economy, following the impact of rainfall shocks on food security. In this respect, the paper has first allowed
addressing the open question about the possible effects of climate change on economic growth rates (Tol,
2010). The predicted contraction in private consumption under the simulated shocks is the main responsible
for the expected negative economic performance of the country. This paper has suggested a 90 per cent
probability for the GDP to drop between 0.89 and 2.28 per cent; the result is in line with the study by Dell et
al. (2008) who argue that climate change causes a contraction of the economy of poor countries between 0.6
and 2.9 per cent.
In this context a question arises: are policies for climate change alone able to reduce the impact of less
rainfall on food security in Sudan?
The literature is focused on different levels of analysis. A part of it emphasises the role of climate change
policies, while another deems development interventions as viable alternatives to them, underlining the fact
that they may have negative and perverse effects on economic development (Tol, 2010). Other authors study

1st AIEAA Conference – Towards a Sustainable Bio-economy: Economic Issues and Policy Challenges Trento, 4-5 June 2012 ________________________________________________________________________________________________
________________________________________________________________________________________________
22
alternative solutions to climate policies, taking into account the possibility to act on non-climatic factors
(Shcelling, 2000) or to introduce adaptation and coping strategies (Huq and Ayers, 2009).
This paper does not advocate a specific policy intervention being better than others, nor it acknowledges that
one area needs to be prioritised. Instead, this work clearly stresses the need to evaluate a different possible
policy perspective: climate change, poverty and food insecurity are strongly interlinked, thereby suggesting a
coordination of policies in these three targeted areas. In the policy-making process, it should be opened a
dialogue among these three levels of intervention, with a sound integration of the climate change policy
within those aimed at promoting development and food security.
ACKNOWLEDGMENTS
A preliminary version of this article was presented at the 86th AES annual conference held at the University
of Warwick (16-18 April 2012). The authors thank, for information provided, comments and suggestions, Dr.
Khalid Sidding (University of Hohenheim – Germany), Dr. Abdalatif Ahmed Ijaimi (FAO – Sudan),
Marwan Mirghani (WFP-Sudan) and the participants at the “Training workshop in food security, concepts,
analysis and climate change”, organized by the University of Gezira (Sudan) and the University of Pavia
(Italy) in Medani – Sudan from 17 to 21.12.2011.
REFERENCES
- Adger, W. N. (2006). Vulnerability. Global environmental change, 16: 268-281.
- Arndt, C. and Tarp, F. (2000). Agricultural technology, risk and gender: A CGE analysis of Mozambique.
World Development 28(7): 1307-1326.
- Collier, P. and Joshi, V. (1989). Exchange rate policies in developing countries. Oxford review of economic
policy 5(3): 94-113.
- Dell, M., Jones, B. F. and Olken B. A. (2008). Climate change and economic growth: Evidence from the
last half century. NBER Working Paper, 14132. Cambridge, MA: National Bureau of Economic Research.
- Eboh, E., Oduh, M, Ujah, O (2012). Drivers and Sustainability of Agricultural Growth In Nigeria, AIAE
Research Paper 8. http://www.aiaenigeria.org/Publications/Researchpaper8.pdf
- Elbushra, A. A., Elsheikh, O. E. and Salih, A. A. A. (2010). Impact of exchange rate reforms on Sudan’s
economy: Applied general equilibrium analysis. African Journal of Agricultural Research 5(6): 442-448.
- Harris, R. L. and Robinson, S. (2001). Economy-wide effects of El Niño/Southern Oscillation (ENSO) in
Mexico and the role of improved forecasting and technological change. TDM Discussion Papers 83,
International Food Policy Research Institute (IFPRI). Washington DC: IFPRI.
- Hassan, M. R. and Hallam, A. (1996). Macro-economic linkages to agriculture: A general equilibrium
model for Sudan. Journal of Agricultural Economics 47(1): 66-88.
Hayse, J.W. (2000). Using Monte Carlo Analysis in Ecological Risk Assessments.
http://web.ead.anl.gov/ecorisk/issue/pdf/montecarlo.pdf
1st AIEAA Conference – Towards a Sustainable Bio-economy: Economic Issues and Policy Challenges Trento, 4-5 June 2012 ________________________________________________________________________________________________
________________________________________________________________________________________________
23
- Huho, J. M. (2011). Rain-fed agriculture and climate change: An analysis of the most appropriate planting
dates in central division of Laikipia district, Kenya. International Journal of Current Research, 3,4 :172-182.
- Huq, S. and Ayers, J. (2007). Critical list: The 100 nations most vulnerable to climate change. Sustainable
development opinion. London: International Institute for Environment and Development.
- IPCC (2007). Summary for policy-makers in M. L. Parry et al. (eds). Climate change 2007: Impact,
adoption and vulnerability. Contributions of working group II to the fourth assessment report of the
intergovernmental panel on climate change. Cambridge: Cambridge University Press.
- Ito, T., Kojima, A., Mckenzie, C. and Urata, S. (2010). The environment and climate change: Editor’s
overview. Asian Economic Policy Review, 5: 1-18.
- Karaky, R. (2002). Climate variability and Agricultural policy in Morocco. PhD Thesis. West Lafayette:
Purdue University, Department of Agricultural Economics.
- Lofgren, H., Chulu, O., Sichinga, O., Simotwe, F., Tchale, H., Tseka, R. and Wobst, P. (2001). External
shocks and domestic poverty alleviation: Simulations with a CGE model of Malawi. TDM Discussion Papers
71, International Food Policy Research Institute (IFPRI). Washington DC: IFPRI.
- Lofgren, H., Harris, R. L. and Robinson, S. (2002). A Standard Computable General Equilibrium (CGE)
Model in GAMS. Microcomputers in Policy Research 5, International Food Policy Research Institute
(IFPRI). Washington DC: IFPRI.
- Metropolis, N. (1949). The Monte Carlo Method. Journal of the American Statistical Association, 44: 335-
341.
- Palisade Corporation (2010). Guide to Using @Risk. Ithaca: Palisade Corporation.
- Ministry of Environment and Physical Development of the Republic of the Sudan (2007). National
Adaptation Programme of Action (NAPA). http://unfccc.int/resource/docs/napa/sdn01.pdf
- Risk Assessment Forum (1997). Guiding Principles for Monte Carlo Analysis, EPA (630/-97/001, March).
http://www.epa.gov/ncea/pdfs/montcarl.pdf
- Sassi M. (2006), An Introduction to Food Security Issues and Short Term Responses. Roma: Aracne.
- Sassi, M. (2012). Food prices and climate change in Sudan: A stochastic approach. Paper presented at the
Seventy-third International Atlantic Economic Conference. Istanbul: 28-31 March 2012.
- Shcelling, T. C. (2000). Intergenerational and International Discounting. Risk Analysis, 20: 833-837.
- Siddig, K. and Babiker, B. (2011). Agricultural efficiency gains and trade liberalization in Sudan.
Agricultural Economics Working Paper Series 1. Karthoum: University of Karthoum, Department of
Agricultural Economics.
- Siddig, K. (2011). The controversy of exchange rate devaluation in Sudan: An economy-wide general
equilibrium assessment. Agricultural Economics Working Paper Series 2. Karthoum: University of
Karthoum, Department of Agricultural Economics.
- SIFSIA (2012). Sudan monthly market update, 51. Rome: Food and Agriculture Organisation (FAO) of the
United Nations.
1st AIEAA Conference – Towards a Sustainable Bio-economy: Economic Issues and Policy Challenges Trento, 4-5 June 2012 ________________________________________________________________________________________________
________________________________________________________________________________________________
24
http://www.fao.org/fileadmin/user_upload/sifsia/docs/Sudan%20Monthly%20Market%20Update%20March
%202012.pdf
- Smit, B. and Wandel, J. (2006). Adaptation, adaptive capacity and vulnerability. Global environmental
change, 16: 282-292.
- Taylor, L. and von Armin, R. (2006). Modelling the Impact of Trade Liberalisation – A Critique of
Computable General Equilibrium Models. A report prepared for Oxfam International.
http://oxfamilibrary.openrepository.com/oxfam/bitstream/10546/112547/1/rr-modelling-impact-trade-
liberalisation-010707-en.pdf
- Teklu, T., von Braun, J. and Zaki, E. (1991). Drought and Famine Relationship in Sudan: Policy
Implications. Research Report 88, International Food Policy Research Institute (IFPRI). Washington DC:
IFPRI.
- Thompson, H. E., Berrang-Ford, L. and Ford, J. D. (2010). Climate change and food security in Sub-
Saharna Africa: A systematic literature review. Sustainability, 2: 2719-2733.
- Thurlow, J. and van Seventer, D. E. (2002). A Standard Computable General Equilibrium Model for South
Africa. TDM Discussion Papers 100, International Food Policy Research Institute (IFPRI). Washington DC:
IFPRI.
- Tol, R. S. J. (2010). The economic impact of climate change. Perspektiven der Wirtschaftpolitik, 11(s1):
13-37.
- Torres, R. (2008). Notes, debates and communications. The social impact of policies to address climate
change: A review of the issues. International Labour Review, 147 (2-3): 275-279.
- UNEP (2007). Sudan: Post-conflict environmental assessment. Nairobi: United Nations Environment
Programme (UNEP).
http://postconflict.unep.ch/publications/UNEP_Sudan_synthesis_E.pdf
- van der Mensbrugghe, D. (2010). Climate change policy options for Asian economies: Findings from an
integrated assessment model. Asian Economic Policy Review, 5(1): 63-83.
- Wani, S. P., Sreedevi, T. K., Rockstrom, J. and Ramakrishna, Y. S. (2009). Rainfed agriculture: past trends
and future prospects. In Wani, S. P., Rockstrom, J. and Oweis, T. (eds) Rainfed agriculture: Unlocking the
potential. CAB International, London: 1-36.
- WFP (2012). Global Update – Food Security Monitoring, 6. Rome: World Food Programme (WFP).
http://documents.wfp.org/stellent/groups/public/documents/ena/wfp245717.pdf
http://documents.wfp.org/stellent/groups/public/documents/ena/wfp244527.pdf
- Zakieledeen, S. A. (2009). Adaptation to climate change: A vulnerability assessment for Sudan. Gatekeeper
Series 142, International Institute for Environment and Development (IIED). London: IIED.
- Zhai, F., Lin, T. and Byambadorj, E. (2009). A general equilibrium analysis of the impact of climate
change on agriculture in the People’s Republic of China. Asian Development Review, 26(1): 206-225.