Impact of Changes in Fiscal Federalism and Four- teenth ... · formula which has become uniform...
38
Impact of Changes in Fiscal Federalism and Four- teenth Finance Commission Recommendations Scenarios on States Autonomy and Social Sector Priorities No. 257 15-March-2019 Amarnath H K and Alka Singh National Institute of Public Finance and Policy New Delhi NIPFP Working paper series
Transcript of Impact of Changes in Fiscal Federalism and Four- teenth ... · formula which has become uniform...

Accessed at https://www.nipfp.org.in/publications/working-papers/1852/ Page 1
Working Paper No. 257
Impact of Changes in Fiscal Federalism and Four-
teenth Finance Commission Recommendations Scenarios on States Autonomy and Social Sector Priorities
No. 257 15-March-2019 Amarnath H K and Alka Singh
National Institute of Public Finance and Policy
New Delhi
NIPFP Working paper series

Accessed at https://www.nipfp.org.in/publications/working-papers/1852/ Page 2
Working Paper No. 257
Impact of Changes in Fiscal Federalism and Fourteenth Finance Commission Recommendations
Scenarios on States Autonomy and Social Sector Priorities
Amar Nath H K1
Alka Singh
Abstract
This paper compares the additional gains from higher tax devolution in the post
14th FC period, with the additional burden due to the withdrawal of certain central
schemes and the changes in the sharing pattern of major Centrally Sponsored Schemes
calling for greater contribution from the states. Average burden of the general category
states due to CSS is 0.69 percent of combined GSDP of these states, whereas gains in tax
devolution is 0.71 percent of combined GSDP of these states for the year 2015-16. In the
following year, the difference is even less. This paper questions the rhetoric of greater
autonomy for the states, which claims that the states have got additional money in the
form of tax devolution and are therefore free to decide the priorities. The paper also dis-
cusses declining priority for social sector and child budgeting in the post 14th FC years,
2015-16 and 2016-17.
1 Associate Professor, National Institute of Public Finance and Policy, New Delhi and Alka Singh is Head, Policy & Advocacy, Save The Children, India
Accessed at https://www.nipfp.org.in/publications/working-papers/1852/ Page 3
Working Paper No. 257
1. Introduction
Emerging reforms and fundamental changes in the intergovernmental fiscal rela-
tions in India post Fourteenth Finance Commission (FFC) aimed at enhanced autonomy
to the state governments in order to prioritize their needs. It was envisaged that this will
not only help states with flexibility to allocate as per their priority but social sector will
also benefit, though the trends of percent share of allocation to the total state budgets
does not really seems to have prioritized social sectors. It is, therefore, important to look
at four years of fourteenth finance commission and expected gains at state level with in-
creased devolution. To further strengthen service delivery, management scope in conver-
gence and avoid duplication, these years have also witnessed structural changes in the
federal transfers in the administration and sharing pattern of the Centrally Sponsored
Schemes. With the formation of NITI Aayog, Five Year Plans system was replaced with
Vision 2030 and Action Plan for 3 years. This resulted in withdrawal of central support
for the state plans through block grants and normal central assistance.
Part of the autonomy given to States in the form of increased devolution has been
tied up with increased States contribution towards centrally sponsored schemes (CSS). In
addition to this other reforms like lending for State Electricity board under UDAY scheme,
introduction of GST and compensation towards losses in revenue have also resulted in
straining the State finances. It is in this context an attempt is made to estimate the gains
and burden for the States and see whether States’ priorities have changed.
2. Changing Scenario in Fiscal Federal Relations
2.1 Devolution
The Fourteenth Finance Commission (FFC) recommended a hike in tax devolu-
tion to the States from 32% to 42% of central revenues as divisible pool. The devolution
formula which has become uniform without differentiating Special Category States and
including the forest area in the formula has enabled hilly terrain Special Category States
to get an edge over General Category States in devolution. The finance commission rec-
ommendation has necessitated some changes in the structure of centrally sponsored
schemes (CSS).
2.2 Restructuring of Centrally Sponsored schemes.
Central funding was stopped for some of the Centrally Sponsored Schemes. Im-
portant and major ones are Backward Regions Grant Fund (BRGF), Normal Central Assis-
tance for State Plans, Special Plan Assistance, and Additional Central Assistance for LWE
Accessed at https://www.nipfp.org.in/publications/working-papers/1852/ Page 4
Working Paper No. 257
Districts, National E governance Action Plan, Rajiv Gandhi Panchayat Sashaktikaran Ab-
hiyan, and Scheme for empowerment Adolescent Girls (SABLA).
The central schemes were grouped in to Core of the Core, Core and Optional
Schemes. The core of the core schemes in the category of Rural Employment Guarantee,
Social Assistance and Umbrella programs for SC, ST, Differently Abled, Minorities and
Backward classes continued to get 100 percent grant from the Centre.
All the flagship programs like National Health Mission, Sarva Shiksha Abhiyan,
Rashtriya Madhyamika Shiksha Abhiyan, Housing schemes, Urban Renewal Mission, Var-
ious Agricultural Programs. All schemes administered by Ministry of Rural Development,
Urban Development (except MGNREGS), ministry of Agriculture and other ministries
have been categorized as Core schemes with sharing pattern of 60:40 for General Cate-
gory States and 90:10 for Special Category States. The sharing pattern was 75:25 earlier.
This resulted in making the States to contribute more towards CSS expenditures.
Some of nationally important schemes under central Sector Schemes like Aids Con-
trol, Disease Control and Skill development are continued with 100 per cent central fund-
ing.
Introduction of GST has resulted in uncertainty of revenue mobilization in short
run due to implementation glitches in some States. Therefore the Centre agreed to com-
pensate States incurring losses in in revenue due to GST.
Another major change in fiscal federal relations is central assistance in the form of
lending to States under Ujwala DISCOM assurance Yojana (UDAY) to improve the op-
erational efficiency of the DISCOMS. This has impacted on interest payments in the reve-
nue expenditure of the states.
With all these major changes various studies show an increase in central transfers
to states giving more money to states. Chakraborty (2017, 2018) has argued that there is
an increase in central transfers - the devolution and grants as % of States GSDP for all
states. The Grants in Aid which was falling till 2014-15 has started raising after 2014-15.
There have been some losers and some gainers in tax devolution and Grants in Aid. Prom-
inent losers among the states in getting central grants are Manipur, Assam, Nagaland, Pun-
jab and Tripura in both years.
Chaudhury, Mita (2018) highlights falling priorities in social expenditures post FFC
period and the expenditures under flagships programs like NHM have just been closer
55% of allocations. Falling expenditures under social Sectors is to be taken seriously as
we are going through demographic dividend in economy.

Accessed at https://www.nipfp.org.in/publications/working-papers/1852/ Page 5
Working Paper No. 257
Source: Budget Documents of Union Government and CSO
3. Gains from tax devolution
Prior to Fourteenth Finance Commission’s recommendation, only 32% of Central
Revenues were included in divisible pool to be shared among States. The FFC recommen-
dation was historic in giving more autonomy to the States and compelling the Centre to
downsize the expanding CSS year after year by increasing the share of divisible pool to
42%. The Fourteenth Finance Commission was also historic in not considering the Special
Category States as separate group in formulating the devolution formula.
However, higher weightage given to the forest area in the devolution formula gave
an edge to Special Category States as these hilly States were compensated heavily due to
higher forest area. The FFC recommendations gave a more money in the form of tax de-
volution and enabled the States to have more autonomy in deciding their priorities. In this
section we estimate the gains each State has got.
It is visible from the Table 1 that the tax devolution to the States increased from
2.71% of GDP in 2014-15 to a whopping 3.68% in 2015-16 and further 3.97 % in 2016-
17. The devolution stood at 4.13% of GDP in 2017-18 RE and 4.34% in 2018-19.
The total tax devolution with revised formula and increased divisible pool from
2015-16 onwards are given in the Table 2. The additional devolution is calculated as the
difference between the devolution with 42% as per 14th Finance Commission recommen-
dation and the calculated devolution if the 32% share in the central revenue as divisible
pool had continued ignoring other changes in the devolution formula.
2.93 2.93 2.83 2.71
3.683.97
4.13 4.34
3.47
3.01 2.96 2.83
2.552.60
2.91 2.89
0.00
0.50
1.00
1.50
2.00
2.50
3.00
3.50
4.00
4.50
5.00
2011-12 2012-13 2013-14 2014-15 2015-16 2016-17 2017-18 2018-19
Transfers to States as % of GDP
Devolution Grants in aid

Accessed at https://www.nipfp.org.in/publications/working-papers/1852/ Page 6
Working Paper No. 257
Table 1: Central Transfers as % of GDP
Year Devolution Grants In Aid
2011-12 2.93 3.47
2012-13 2.93 3.01
2013-14 2.83 2.96
2014-15 2.71 2.83
2015-16 3.68 2.55
2016-17 3.97 2.60
2017-18 4.13 2.91
2018-19 4.34 2.89
Note: Grants In Aid include grants passing through outside budget up to 2013-14
Source: Budget Documents Centre and CSO
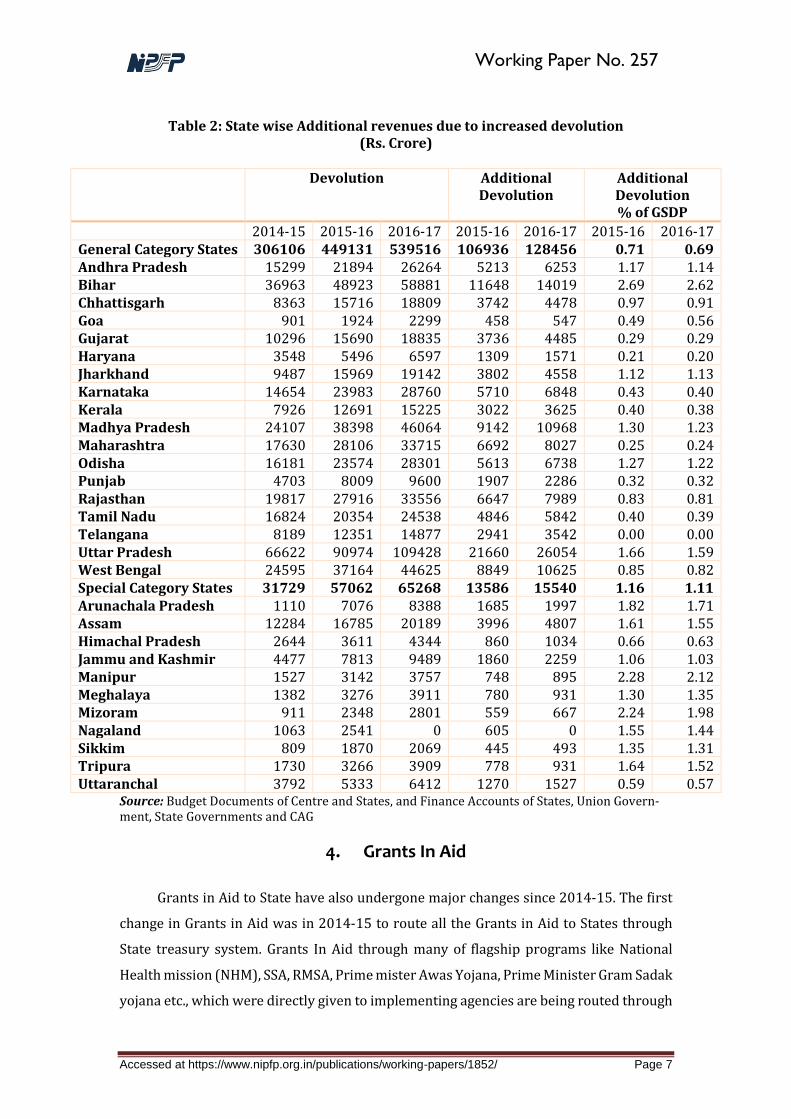
As far as the individual States are concerned devolution to the General Category
States increased from Rs. 306106 Crore in 2014-15 to Rs. 449131 Crore in 2015-16 and
Rs 539516 Crore in 2016-17. This has resulted into a hike of 0.71% in 2015-16 and 0.69%
in 2016-17 in terms as % to GSDP.
Devolution to the Special Category States increased from Rs. 31729 Crore in 2014-
15 to Rs. 57062 Crore in 2015-16 and Rs 65268 Crore in 2016-17. This has resulted into
a hike of 1.16% 2015-16 and 1.11% in 2016-17 in terms as % to GSDP.
One can observe from the Table 2 that hike is higher for the States of Bihar, Andhra
Pradesh, Jharkhand, Madhya Pradesh, Odisha, and Uttar Pradesh among the General Cat-
egory States due to backwardness and forest area coverage. At the same time among Spe-
cial Category States, all the States have got an additional devolution of above 1% of GSDP
with exception of Himachal Pradesh and Uttarakhand. Increase is higher for the States of
Mizoram, Manipur, and Arunachal Pradesh among the Special Category States. The hike
in devolution due to hike in the divisible pool is to the extent of 0.69% of GSDP for General
Category States and 1.11% of GSDP for Special Category States.
Accessed at https://www.nipfp.org.in/publications/working-papers/1852/ Page 7
Working Paper No. 257
Table 2: State wise Additional revenues due to increased devolution
(Rs. Crore)
Devolution Additional Devolution
Additional Devolution % of GSDP
2014-15 2015-16 2016-17 2015-16 2016-17 2015-16 2016-17 General Category States 306106 449131 539516 106936 128456 0.71 0.69 Andhra Pradesh 15299 21894 26264 5213 6253 1.17 1.14 Bihar 36963 48923 58881 11648 14019 2.69 2.62 Chhattisgarh 8363 15716 18809 3742 4478 0.97 0.91 Goa 901 1924 2299 458 547 0.49 0.56 Gujarat 10296 15690 18835 3736 4485 0.29 0.29 Haryana 3548 5496 6597 1309 1571 0.21 0.20 Jharkhand 9487 15969 19142 3802 4558 1.12 1.13 Karnataka 14654 23983 28760 5710 6848 0.43 0.40 Kerala 7926 12691 15225 3022 3625 0.40 0.38 Madhya Pradesh 24107 38398 46064 9142 10968 1.30 1.23 Maharashtra 17630 28106 33715 6692 8027 0.25 0.24 Odisha 16181 23574 28301 5613 6738 1.27 1.22 Punjab 4703 8009 9600 1907 2286 0.32 0.32 Rajasthan 19817 27916 33556 6647 7989 0.83 0.81 Tamil Nadu 16824 20354 24538 4846 5842 0.40 0.39 Telangana 8189 12351 14877 2941 3542 0.00 0.00 Uttar Pradesh 66622 90974 109428 21660 26054 1.66 1.59 West Bengal 24595 37164 44625 8849 10625 0.85 0.82 Special Category States 31729 57062 65268 13586 15540 1.16 1.11 Arunachala Pradesh 1110 7076 8388 1685 1997 1.82 1.71 Assam 12284 16785 20189 3996 4807 1.61 1.55 Himachal Pradesh 2644 3611 4344 860 1034 0.66 0.63 Jammu and Kashmir 4477 7813 9489 1860 2259 1.06 1.03 Manipur 1527 3142 3757 748 895 2.28 2.12 Meghalaya 1382 3276 3911 780 931 1.30 1.35 Mizoram 911 2348 2801 559 667 2.24 1.98 Nagaland 1063 2541 0 605 0 1.55 1.44 Sikkim 809 1870 2069 445 493 1.35 1.31 Tripura 1730 3266 3909 778 931 1.64 1.52 Uttaranchal 3792 5333 6412 1270 1527 0.59 0.57
Source: Budget Documents of Centre and States, and Finance Accounts of States, Union Govern-ment, State Governments and CAG
4. Grants In Aid
Grants in Aid to State have also undergone major changes since 2014-15. The first
change in Grants in Aid was in 2014-15 to route all the Grants in Aid to States through
State treasury system. Grants In Aid through many of flagship programs like National
Health mission (NHM), SSA, RMSA, Prime mister Awas Yojana, Prime Minister Gram Sadak
yojana etc., which were directly given to implementing agencies are being routed through
Accessed at https://www.nipfp.org.in/publications/working-papers/1852/ Page 8
Working Paper No. 257
State budget. The second major change implemented in December 2015-16, as recom-
mended by high powered committee of chief ministers is integration of many of the cen-
trally sponsored schemes into fewer schemes and withdrawal of certain centrally spon-
sored schemes like Backwards regions grants fund (BRGF), Panchayat Sashaktikaran
Yojana, Normal Central Assistance for State Plans, and many other smaller schemes. The
third major change was grouping 28 CSS into Core of the Core (100% central Assistance),
Core Schemes (60:40 for General Category States) and other optional schemes (50% cen-
tral assistance). The fourth change is making these transfers to States as Grants in Aid for
State plans.
The total Grants In Aid to States from the Centre which were higher than tax devo-
lution prior to FFC recommendation have declined in terms of % to GDP and are lesser
than the total volume of Tax devolution. The total Grants in Aid has declined from 3.47%
of GDP in 2011-12 to 2.55% in 2015-16 and then increased marginally to 2.6% in 2016-
17. The revised estimates for 2017-18 stood at 2.91% and the budget estimates for 2018-
19 stood at 2.89%. The major CSS in terms of Volumes of transfers are, NHM, PMAY,
MGNREGA, SSA, RMSA, and ICDS. One can see sharp decline in total Grants In Aid from
2.83% in 2014-15 to 2.55% in 2015-16 and increasing it to 2.60 in 201617 still less than
the levels of 2012-13.
When it comes to individual States, the General Category States bore the brunt of
changes in sharing pattern to 60:40 and particularly backward States with the withdrawal
of BRGF. With this, General Category States have to contribute higher share towards get-
ting Grants in Aid from the Centre. However the Special Category States continue to get
grants with pre-existing 90:10 sharing pattern.
Withdrawal of Central assistance for State plans through Normal Central assistance
and BRGF has resulted in loss of RS. 37685 Crore to General Category States and Rs. 35460
Crore for Special Category States at the level of 2013-14. This ranges between 0.5% of
GSDP to 1.27% of GSDP across States (See Table 3 for General Category States) in 2013-
14. We have assumed 2013-14 level as the reduction in such grants to the States.
Nearly 45% of total grants in aid from Centre are in the form sharing pattern of
60:40 ratio. Therefore with simple assumption of 45% of grants given to the states have
sharing burden of 40% which was earlier only 25%, additional burden on States towards
sharing the expenditures under CSS is estimated. Changes in sharing pattern has resulted
into additional contribution by the General Category States towards CSS. These States
were contributing only 25% prior to 2015-16 than 40% as of now. Which means for every
100 spent under CSS by the States, the General Category States have to spend Rs. 40 rather

Accessed at https://www.nipfp.org.in/publications/working-papers/1852/ Page 9
Working Paper No. 257
than Rs. 25. This has resulted in General Category States contributing additionally RS.
41806 crore more towards Core CSS schemes in 2016-17. State wise additional Contribu-
tion is given in Table 3.
Table 3: Additional expenditures in terms of additional contribution for CSS
Total Grants Normal Central assistances and BRGF
Grants with Sharing Pattern
Additional Contribution to CSS
2013-14 2015-16 2016-17 2013-14 2015-16 2016-17 2015-16 2016-17
General Category States
143945 256282 278704 37685 115327 125417 38442 41806
Andhra Pradesh 8991 21927 23346 2510 9867 10506 3289 3502
Bihar 12584 19566 20559 5438 8805 9252 2935 3084
Chhattisgarh 4726 8062 10262 1672 3628 4618 1209 1539
Goa 357 221 293 135 100 132 33 44
Gujarat 6883 8949 13218 2274 4027 5948 1342 1983
Haryana 4127 6379 5678 469 2870 2555 957 852
Jharkhand 4065 7338 9261 1099 3302 4168 1101 1389
Karnataka 9099 13929 15703 2199 6268 7066 2089 2355
Kerala 4138 8921 8510 817 4015 3830 1338 1277
Madhya Pradesh 11777 18330 23963 3935 8249 10783 2750 3594
Maharashtra 13241 16899 21653 2832 7604 9744 2535 3248
Odisha 8429 14129 15082 3096 6358 6787 2119 2262
Punjab 3401 4174 4776 855 1878 2149 626 716
Rajasthan 8744 18728 19483 1796 8428 8767 2809 2922
Tamil Nadu 9122 19260 19838 2773 8667 8927 2889 2976
Telangana 0 9394 9752 0 4227 4388 1409 1463
Uttar Pradesh 22405 31861 32537 2191 14338 14642 4779 4881
West Bengal 11853 28214 24791 3595 12696 11156 4232 3719
Special Category States
62007 69614 77387 35460 31326 34824
Arunachal Pradesh
3935 2550 2138 2467 1148 962
Assam 8938 12825 12598 5663 5771 5669
Himachal Pradesh
6314 11296 13164 3760 5083 5924
Jammu and Kashmir
13843 16728 20599 8791 7528 9269
Manipur 5111 4438 4621 2475 1997 2079
Meghalaya 3417 2481 3157 1935 1117 1420
Mizoram 3483 3672 3791 NA 1653 1706
Nagaland 4947 4819 5553 2149 2169 2499
Sikkim 2244 934 1437 1803 420 647
Tripura 4699 4566 4095 2876 2055 1843
Uttarakhand 5075 5304 6234 3540 2387 2805
Source: Budget Documents of States, and Finance Accounts of States, State Governments and CAG.

Accessed at https://www.nipfp.org.in/publications/working-papers/1852/ Page 10
Working Paper No. 257
However the Special Category States continued to get the Grants in Aid under CSS
with 90:10 sharing pattern and also got benefitted through tax devolution in terms of in-
crease in the divisible share and also inclusion of forest coverage in the devolution for-
mula.
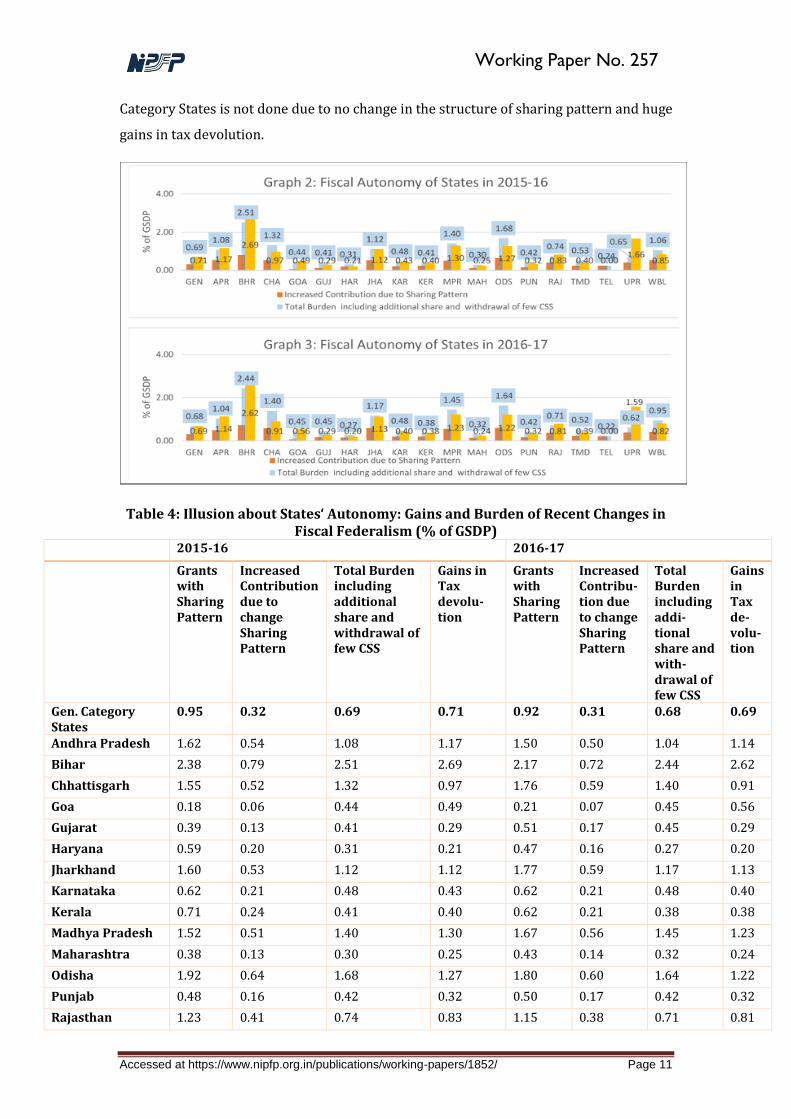
5. Fiscal Autonomy: Reality V/S Expectations
The view that the States have got additional money in the form of tax devolution
and the States are free to decide their priorities is a mere illusion. This gain in tax devolu-
tion has been offset by the fact that General Category States have to shell out more to-
wards sharing the expenditure under CSS and tradition of Centre contributing to the State
Plans through Planning commission devolved normal central assistance has been diluted
and withdrawn. Grants under BRGF and Panchyati Sashaktikarn Scheme are also discon-
tinued with effect from 2015-16. It is in this context we look at the comparative picture of
States’ autonomy. Table 4 gives us the picture particularly among General Category States
the gains accrued to increased devolution and imposed burden on States due to increased
contribution towards CSS and withdrawal of normal central assistance and BRGF. Due to
inconsistencies in the data in 2015-16, the extent of autonomy in terms of gains in tax
devolution and burden on the States due to increased contribution and withdrawal of cer-
tain CSS is also estimated for 2016-17. The termination of normal central assistance for
State plans and discontinuation of BRGF and other CSS is frozen at the level of 2013-14 in
terms as % of GSDP for each state. Grants under State plan schemes in 2013-14 is not
comparable with 2015-16 and 2016-17 due to inclusion of flagship programs under State
plan schemes. After doing the necessary adjustments the total burden is computed. Since
there is huge variation between allocations and actual releases, these calculation are done
only for two years for which actuals are available.
Average Burden on the General Category States due to CSS is 0.69% and gain in tax
devolution is 0.71% of GSDP in 2015-16 and same is 0.68% and 0.69% of GSDP respec-
tively in 2016-17. In States like Chhattisgarh, Madhya Pradesh Punjab, Tamil Nadu and
west Bengal the gain is lesser than the burden. This is mainly due to withdrawal of BRGF
in all States except Tamil Nadu. Only in case of Uttar Pradesh the difference between Gains
and burden huge with a gain of 1.66% of GSDP in tax devolution and burden of only 0.65%
of GSDP due to changes in CSS. The difference in gains and burden narrows down for all
States that were receiving the grants under BRGF and grants for LWE affected districts.
These are low income States like Bihar, Jharkhand, Madhya Pradesh and Chhattisgarh.
However huge gain for Uttar Pradesh need further investigation. This exercise for Special
Accessed at https://www.nipfp.org.in/publications/working-papers/1852/ Page 11
Working Paper No. 257
Category States is not done due to no change in the structure of sharing pattern and huge
gains in tax devolution.
Table 4: Illusion about States‘ Autonomy: Gains and Burden of Recent Changes in Fiscal Federalism (% of GSDP)
2015-16 2016-17
Grants with Sharing Pattern
Increased Contribution due to change Sharing Pattern
Total Burden including additional share and withdrawal of few CSS
Gains in Tax devolu-tion
Grants with Sharing Pattern
Increased Contribu-tion due to change Sharing Pattern
Total Burden including addi-tional share and with-drawal of few CSS
Gains in Tax de-volu-tion
Gen. Category States
0.95 0.32 0.69 0.71 0.92 0.31 0.68 0.69
Andhra Pradesh 1.62 0.54 1.08 1.17 1.50 0.50 1.04 1.14
Bihar 2.38 0.79 2.51 2.69 2.17 0.72 2.44 2.62
Chhattisgarh 1.55 0.52 1.32 0.97 1.76 0.59 1.40 0.91
Goa 0.18 0.06 0.44 0.49 0.21 0.07 0.45 0.56
Gujarat 0.39 0.13 0.41 0.29 0.51 0.17 0.45 0.29
Haryana 0.59 0.20 0.31 0.21 0.47 0.16 0.27 0.20
Jharkhand 1.60 0.53 1.12 1.12 1.77 0.59 1.17 1.13
Karnataka 0.62 0.21 0.48 0.43 0.62 0.21 0.48 0.40
Kerala 0.71 0.24 0.41 0.40 0.62 0.21 0.38 0.38
Madhya Pradesh 1.52 0.51 1.40 1.30 1.67 0.56 1.45 1.23
Maharashtra 0.38 0.13 0.30 0.25 0.43 0.14 0.32 0.24
Odisha 1.92 0.64 1.68 1.27 1.80 0.60 1.64 1.22
Punjab 0.48 0.16 0.42 0.32 0.50 0.17 0.42 0.32
Rajasthan 1.23 0.41 0.74 0.83 1.15 0.38 0.71 0.81
Accessed at https://www.nipfp.org.in/publications/working-papers/1852/ Page 12
Working Paper No. 257
Tamil Nadu 0.74 0.25 0.53 0.40 0.70 0.23 0.52 0.39
Telangana 0.73 0.24 0.24 0.00 0.67 0.22 0.22 0.00
Uttar Pradesh 1.26 0.42 0.65 1.66 1.17 0.39 0.62 1.59
West Bengal 1.59 0.53 1.06 0.85 1.27 0.42 0.95 0.82
Source: Budget Documents of States, State Governments and , and Finance Accounts of States, CAG and CSO for GSDP
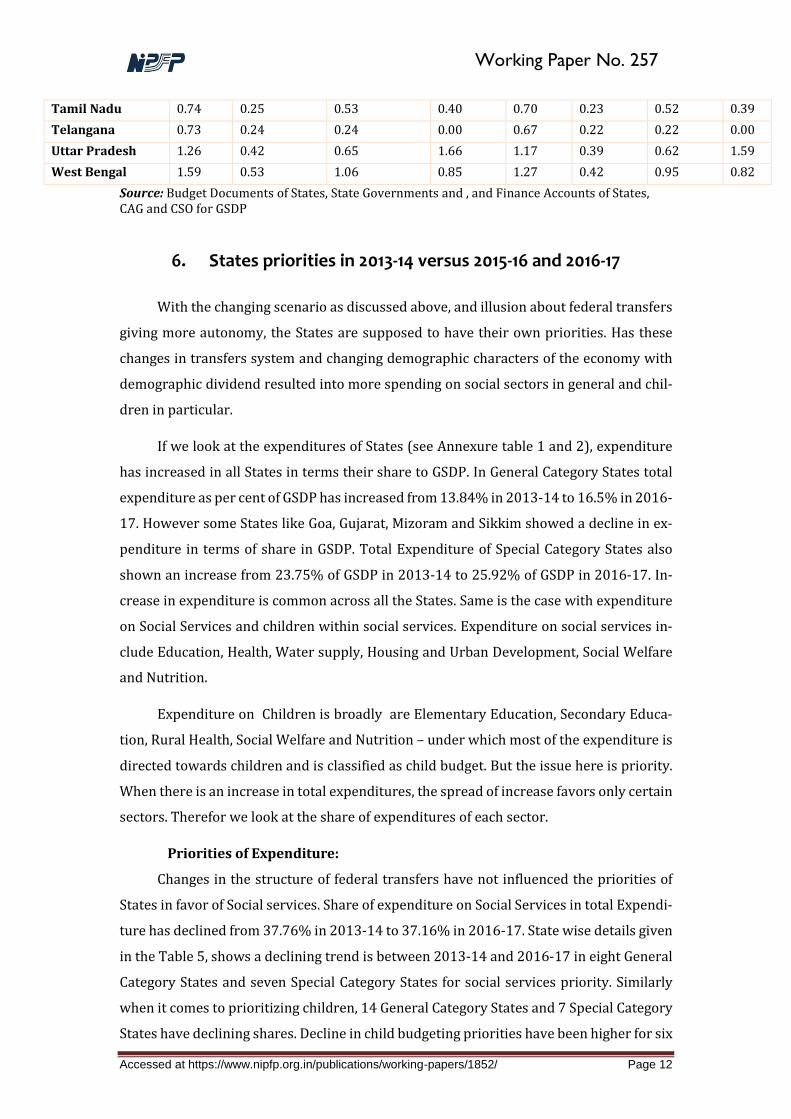
6. States priorities in 2013-14 versus 2015-16 and 2016-17
With the changing scenario as discussed above, and illusion about federal transfers
giving more autonomy, the States are supposed to have their own priorities. Has these
changes in transfers system and changing demographic characters of the economy with
demographic dividend resulted into more spending on social sectors in general and chil-
dren in particular.
If we look at the expenditures of States (see Annexure table 1 and 2), expenditure
has increased in all States in terms their share to GSDP. In General Category States total
expenditure as per cent of GSDP has increased from 13.84% in 2013-14 to 16.5% in 2016-
17. However some States like Goa, Gujarat, Mizoram and Sikkim showed a decline in ex-
penditure in terms of share in GSDP. Total Expenditure of Special Category States also
shown an increase from 23.75% of GSDP in 2013-14 to 25.92% of GSDP in 2016-17. In-
crease in expenditure is common across all the States. Same is the case with expenditure
on Social Services and children within social services. Expenditure on social services in-
clude Education, Health, Water supply, Housing and Urban Development, Social Welfare
and Nutrition.
Expenditure on Children is broadly are Elementary Education, Secondary Educa-
tion, Rural Health, Social Welfare and Nutrition – under which most of the expenditure is
directed towards children and is classified as child budget. But the issue here is priority.
When there is an increase in total expenditures, the spread of increase favors only certain
sectors. Therefor we look at the share of expenditures of each sector.
Priorities of Expenditure:
Changes in the structure of federal transfers have not influenced the priorities of
States in favor of Social services. Share of expenditure on Social Services in total Expendi-
ture has declined from 37.76% in 2013-14 to 37.16% in 2016-17. State wise details given
in the Table 5, shows a declining trend is between 2013-14 and 2016-17 in eight General
Category States and seven Special Category States for social services priority. Similarly
when it comes to prioritizing children, 14 General Category States and 7 Special Category
States have declining shares. Decline in child budgeting priorities have been higher for six

Accessed at https://www.nipfp.org.in/publications/working-papers/1852/ Page 13
Working Paper No. 257
General Category States where the social sectors shares have not declined. They are An-
dhra Pradesh, Gujarat, Jharkhand, Karnataka, Kerala and Punjab. In most of the States the
fall in the share of child expenditure is higher than the fall in the share of social sector
expenditure. This means that States prioritize other economic services over social ser-
vices by drastically reducing child budget. However a detailed analysis shall reveal
whether it is education or health or nutrition which is taking a hit when the State govern-
ment cut their expenditure.
Table 5: Child and Social Sector Priorities across States pre and post FFC
Ratio of Social Expenditure in Total
Ratio of Children Expenditure in Total
State 2013-14 2015-16 2016-17 2013-14 2015-16 2016-17
General Category States
37.76 37.37 37.16 22.51 21.53 20.84
Andhra Pradesh 36.87 44.37 40.09 24.22 25.67 21.86
Bihar 36.94 35.96 36.34 22.13 23.26 20.88
Chhattisgarh 40.00 35.14 41.30 25.53 25.31 27.65
Goa 35.93 35.11 35.96 22.25 21.05 21.77
Gujarat 39.85 40.47 40.52 21.48 21.06 20.94
Haryana 37.62 34.89 35.95 17.63 17.28 17.05
Jharkhand 32.42 35.49 35.91 22.02 20.78 19.44
Karnataka 33.61 37.48 38.39 16.28 16.49 16.19
Kerala 33.34 33.23 34.63 19.73 17.79 18.65
Madhya Pradesh 36.77 39.17 34.89 24.92 22.56 20.32
Maharashtra 41.82 39.83 39.18 26.24 25.05 23.18
Odisha 38.31 36.33 36.64 22.41 21.18 21.44
Punjab 27.94 29.60 28.10 19.29 20.24 19.04
Rajasthan 40.41 38.48 38.57 21.30 20.08 20.43
Tamil Nadu 40.93 37.79 35.27 21.91 21.00 20.31
Telangana 36.45 33.49 18.51 19.06
Uttar Pradesh 35.35 33.99 35.58 24.29 22.37 22.85
West Bengal 41.49 39.63 42.34 22.79 22.26 21.39
Special Category States
36.16 36.44 36.25 22.46 23.21 21.16
Arunachal Pradesh 30.68 28.77 33.15 14.60 15.25 15.93
Assam 42.77 46.18 44.14 31.16 36.13 27.17
Himachal Pradesh 37.40 34.85 36.93 23.15 19.96 20.85
Jammu and Kashmir 28.91 32.01 28.84 15.40 18.24 16.38
Manipur 27.55 27.37 25.52 17.54 17.60 15.36
Meghalaya 35.69 36.00 36.97 22.04 23.77 23.21
Mizoram 36.82 38.71 36.60 17.35 17.41 17.06
Nagaland 29.12 27.56 27.56 19.02 17.83 17.83
Sikkim 35.30 33.59 35.01 19.86 22.58 20.42
Tripura 40.38 36.26 42.01 22.37 20.02 20.92
Uttarakhand 40.84 39.52 37.97 25.64 24.44 23.49
Source: Finance Accounts of States, CAG

Accessed at https://www.nipfp.org.in/publications/working-papers/1852/ Page 14
Working Paper No. 257
Centre’s Spending on Children
Much of the expenditure at State level on Social Sectors in general and Children in
particular is influenced by the Grants in Aid from the Centre. The states receive condi-
tional grants for expenditure on Health, Education and Nutrition under schemes like Na-
tional Health Mission, National Education Mission, Merit Scholarships for SC, ST, BC and
0.00
5.00
10.00
15.00
20.00
25.00
30.00
35.00
40.00
45.00
50.00
GEN ÀPR BHR CHA GOA GUJ HAR JHA KAR KER MPR MAH ODS PNB RAJ TND TEL UPR WBL SPL ARP ASM HPR JAK MAN MEG MIZ NAG SKM TRP UTT
PRIORITY OF SOCIAL EXPENDITURES (% of Total Expenditure)
2013-2014 2016-2017
0.00
5.00
10.00
15.00
20.00
25.00
30.00
35.00
GEN ÀPR BHR CHA GOA GUJ HAR JHA KAR KER MPR MAH ODS PNB RAJ TND TEL UPR WBL SPL ARP ASM HPR JAK MAN MEG MIZ NAG SKM TRP UTT
Prioirty of Child Budgeting (% of Total Expenditure)
2013-2014 2016-2017
-8.00
-6.00
-4.00
-2.00
0.00
2.00
4.00
6.00
GEN ÀPR BHR CHA GOA GUJ HAR JHA KAR KER MPR MAH ODS PNB RAJ TND TEL UPR WBL SPL ARP ASM HPR JAK MAN MEG MIZ NAG SKM TRP UTT
Changing Priorities towads Social Sectors and Child Budget
(% of Total Expenditure)
Change in Social Exp in 2016-17 over 2013-14 Change in Child Exp in 2016-17 over 2013-14

Accessed at https://www.nipfp.org.in/publications/working-papers/1852/ Page 15
Working Paper No. 257
Minorities, Integrated Child Development Scheme and Integrated Child Protection
Schemes.
Post Fourteenth finance commission the share of grants in aid for major CSS on Chil-
dren in total expenditure has declined between 2013-14 and 2016-17. It is visible from
the Table 6 total expenditure on children by the central government has declined from
0.72 % of GDP in 2013-14 to 0.65 % of GDP in 2016-17 and there is no significant rise in
allocations in 2016-17 and 2017-18 when compared to actual expenditures in 2016-17.
Even when it comes to priorities the share of Child Budget has declined from 4.64% in
2013-14 to 4.53% in 2016-17 though actual expenditures are higher than the allocations
in all the years. Drastic reduction in central assistance to states is visible in education (El-
ementary and Secondary) and Nutrition under ICDS. In spite of including secondary edu-
cation under education mission grants, the grants in aid for education has declined from
0.34% of GDP to 0.27% of GDP between 2013-14 and 2016-17 and similar is the case with
Nutrition.
It is clearly visible that declining priorities towards Social sectors and children at
State level is influenced by the declining grants in aid from the Centre towards Children.
Union Governments Spending on Children through Grants In Aid
Total Expenditure of Union Government
Total Child Budget
Major Schemes for Children
Health Schemes
Education Midday meals
ICDS Protection
% of GDP
2013-14A 15.52 0.72 0.70 0.17 0.34 0.04 0.15 0.00
2014-15A 14.98 0.72 0.69 0.15 0.31 0.08 0.15 0.00
2015-16A 14.95 0.69 0.64 0.17 0.28 0.07 0.11 0.00
2016-17A 14.31 0.65 0.60 0.17 0.27 0.06 0.10 0.00
2013-14BE 16.80 0.82 0.80 0.17 0.36 0.12 0.15 0.00
2014-15BE 16.04 0.63 0.60 0.15 0.36 0.08 0.00 0.00
2015-16BE 14.60 0.50 0.48 0.13 0.27 0.07 0.00 0.00
2016-17BE 14.46 0.65 0.60 0.16 0.27 0.06 0.10 0.00
2017-18BE 14.13 0.66 0.61 0.18 0.26 0.06 0.10 0.00
Share in Total Expenditure
2013-14A
4.64 4.49 1.09 2.18 0.26 0.96 0.00
2014-15A
4.78 4.60 0.97 2.06 0.56 0.99 0.02
2015-16A
4.60 4.29 1.16 1.90 0.44 0.76 0.02
2016-17A
4.53 4.19 1.18 1.87 0.43 0.68 0.03
2013-14BE
4.87 4.74 1.01 2.15 0.70 0.87 0.01
2014-15BE
3.91 3.75 0.94 2.26 0.51 0.02 0.02
2015-16BE
3.39 3.26 0.92 1.85 0.46 0.03 0.02
2016-17BE
4.47 4.11 1.10 1.87 0.44 0.68 0.02
2017-18BE
4.69 4.31 1.28 1.86 0.42 0.72 0.03
2018-19BE
4.54 4.19 1.27 1.80 0.38 0.71 0.03
Source (basic data): Detailed Demand For Grants, Union Budget Documents, Various Years, Gov-
ernment of India.

Accessed at https://www.nipfp.org.in/publications/working-papers/1852/ Page 16
Working Paper No. 257
7. Conclusions:
Fourteenth Finance Commission’s recommendations have increased the devolution
to States by increasing the share of divisible pool and favoring the hilly Special Category
States with inclusion of Forest Coverage in devolution criteria. Special Category States and
some States like Madhya Pradesh, Chhattisgarh, and Jharkhand received higher hike in
the tax devolution. Increase in divisible pool compelled the Centre to withdraw few
schemes like normal central assistance, BRGF, Panchayat Shasaktikaran yojana and also
restructure sharing pattern of many of the Flagship CSS. Restructuring the sharing pattern
did not affect the Special Category States. The loss in share of Grants due to withdrawal of
CSS affected Special Category States and Low-income States as BRGF was one of the major
CSS among them.
Higher transfers through devolution and more autonomy to States is an illusion and
is offset by the fact that States contribution towards CSS expenditures increased from
25% to 40% and States had to continue committed expenditures under CSS which have
been withdrawn.
The total burden on State defined here as additional contribution towards CSS in
General Category States and committed expenditures for CSS schemes which have been
discontinued and reduction in State plan Grants with withdrawal of Normal Central As-
sistance. Net gain in untied transfers and autonomy to the States gets narrowed down due
to these additional burdens on States.
Though there is an increase in total transfers and total expenditures of the States,
there is a declining priority towards Social sectors and Child Budgeting. Even the grants
in aid to States towards funding of child budget at State level has declined post FFC period
particularly for Education and ICDS without any substantial increases for Child Protection
and Health.

Accessed at https://www.nipfp.org.in/publications/working-papers/1852/ Page 17
Working Paper No. 257
References
Chaudhury Mita, 2018. Ranjan Kumar Mohanty, "Utilisation, Fund Flows and Public
Financial Management under the National Health Mission" Forthcoming
Economic and Political Weekly.
Chakraborty Pinaki, 2018. Lekha Chakraborty, Manish Gupta, “Emerging Issues in
State Finances Post Fourteenth Finance Commission – Analysis of State
Budgets 2016-17”, National Institute of Public Finance and Policy, New
Delhi.
Chakraborty Pinaki, 2018. et all, Lekha Chakraborty, Manish Gupta, Amandeep Kaur
“Analysis of State Budgets 2017-18: Emerging Issues”, National Institute of
Public Finance and Policy, New Delhi

Accessed at https://www.nipfp.org.in/publications/working-papers/1852/ Page 18
Working Paper No. 257
Annexure Table 1: State Wise Expenditure as % of GSDP
Total Expenditure as % of GSDP Social Services as % of GSDP Expenditure on Children as % of GSDP
State 2013-14 2015-16 2016-17 2013-14 2015-16 2016-17 2013-14 2015-16 2016-17
General Category States 13.84 16.24 16.48 5.22 6.07 6.12 3.11 3.50 3.43
Andhra Pradesh 13.53 18.05 18.78 4.99 8.01 7.53 3.28 4.64 4.11
Bihar 24.12 29.12 28.64 8.91 10.47 10.41 5.34 6.77 5.98
Chhattisgarh 18.10 22.05 21.98 7.24 7.75 9.08 4.62 5.58 6.08
Goa 21.75 18.24 16.76 7.81 6.40 6.03 4.84 3.84 3.65
Gujarat 12.13 11.66 10.86 4.83 4.72 4.40 2.61 2.46 2.27
Haryana 11.44 13.63 13.75 4.30 4.76 4.94 2.02 2.36 2.34
Jharkhand 14.95 21.64 23.75 4.85 7.68 8.53 3.29 4.50 4.62
Karnataka 13.00 13.60 14.13 4.37 5.10 5.43 2.12 2.24 2.29
Kerala 13.93 15.35 16.28 4.64 5.10 5.64 2.75 2.73 3.04
Madhya Pradesh 18.36 21.48 22.68 6.75 8.42 7.91 4.58 4.85 4.61
Maharashtra 10.60 10.73 10.58 4.43 4.27 4.14 2.78 2.69 2.45
Odisha 18.00 22.94 22.14 6.90 8.33 8.11 4.04 4.86 4.75
Punjab 13.20 13.62 13.92 3.69 4.03 3.91 2.55 2.76 2.65
Rajasthan 16.18 18.75 18.98 6.54 7.22 7.32 3.45 3.77 3.88
Tamil Nadu 13.11 13.60 13.69 5.37 5.14 4.83 2.87 2.86 2.78
Telangana 0.00 15.48 17.42 0.00 5.64 5.83 0.00 2.87 3.32
Uttar Pradesh 20.31 24.37 24.51 7.18 8.28 8.72 4.93 5.45 5.60
West Bengal 14.59 16.46 16.52 6.05 6.52 7.00 3.32 3.66 3.53
Special Category States 23.75 24.52 25.92 8.59 8.94 9.40 5.34 5.69 5.49
Arunachal Pradesh 50.83 55.83 53.99 15.60 16.06 17.90 7.42 8.51 8.60
Assam 19.79 17.42 21.57 8.46 8.04 9.52 6.17 6.29 5.86
Himachal Pradesh 20.27 22.03 22.89 7.58 7.68 8.45 4.69 4.40 4.77

Accessed at https://www.nipfp.org.in/publications/working-papers/1852/ Page 19
Working Paper No. 257
Jammu and Kashmir 33.01 37.33 37.92 9.54 11.95 10.93 5.08 6.81 6.21
Manipur 43.32 44.14 45.94 11.94 12.08 11.72 7.60 7.77 7.06
Meghalaya 28.89 29.70 35.35 10.31 10.69 13.07 6.37 7.06 8.21
Mizoram 53.59 41.49 40.55 19.74 16.06 14.84 9.30 7.23 6.92
Nagaland 41.88 44.26 44.24 12.20 12.20 12.19 7.97 7.89 7.89
Sikkim 31.52 23.73 22.52 11.13 7.97 7.88 6.26 5.36 4.60
Tripura 29.66 32.17 30.50 11.98 11.67 12.81 6.63 6.44 6.38
Uttarakhand 13.37 15.53 15.45 5.46 6.14 5.87 3.43 3.80 3.63
Accessed at https://www.nipfp.org.in/publications/working-papers/1852/ Page 20
Working Paper No. 257
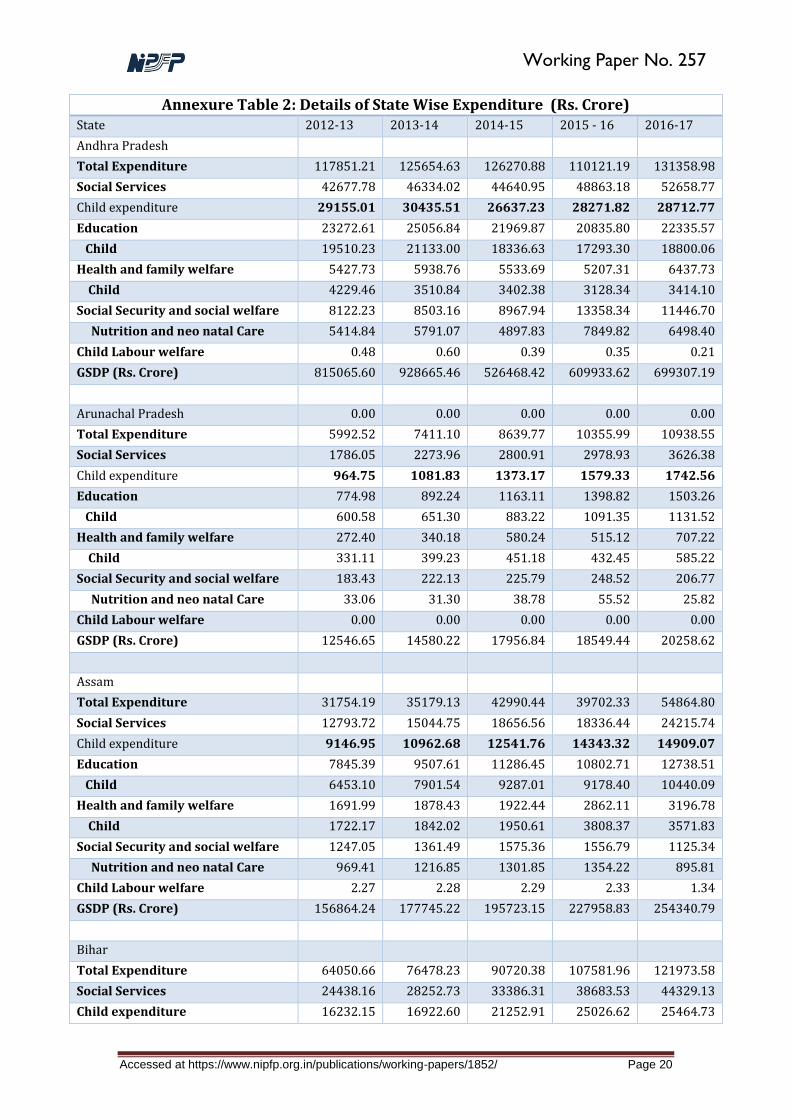
Annexure Table 2: Details of State Wise Expenditure (Rs. Crore) State 2012-13 2013-14 2014-15 2015 - 16 2016-17
Andhra Pradesh
Total Expenditure 117851.21 125654.63 126270.88 110121.19 131358.98
Social Services 42677.78 46334.02 44640.95 48863.18 52658.77
Child expenditure 29155.01 30435.51 26637.23 28271.82 28712.77
Education 23272.61 25056.84 21969.87 20835.80 22335.57
Child 19510.23 21133.00 18336.63 17293.30 18800.06
Health and family welfare 5427.73 5938.76 5533.69 5207.31 6437.73
Child 4229.46 3510.84 3402.38 3128.34 3414.10
Social Security and social welfare 8122.23 8503.16 8967.94 13358.34 11446.70
Nutrition and neo natal Care 5414.84 5791.07 4897.83 7849.82 6498.40
Child Labour welfare 0.48 0.60 0.39 0.35 0.21
GSDP (Rs. Crore) 815065.60 928665.46 526468.42 609933.62 699307.19
Arunachal Pradesh 0.00 0.00 0.00 0.00 0.00
Total Expenditure 5992.52 7411.10 8639.77 10355.99 10938.55
Social Services 1786.05 2273.96 2800.91 2978.93 3626.38
Child expenditure 964.75 1081.83 1373.17 1579.33 1742.56
Education 774.98 892.24 1163.11 1398.82 1503.26
Child 600.58 651.30 883.22 1091.35 1131.52
Health and family welfare 272.40 340.18 580.24 515.12 707.22
Child 331.11 399.23 451.18 432.45 585.22
Social Security and social welfare 183.43 222.13 225.79 248.52 206.77
Nutrition and neo natal Care 33.06 31.30 38.78 55.52 25.82
Child Labour welfare 0.00 0.00 0.00 0.00 0.00
GSDP (Rs. Crore) 12546.65 14580.22 17956.84 18549.44 20258.62
Assam
Total Expenditure 31754.19 35179.13 42990.44 39702.33 54864.80
Social Services 12793.72 15044.75 18656.56 18336.44 24215.74
Child expenditure 9146.95 10962.68 12541.76 14343.32 14909.07
Education 7845.39 9507.61 11286.45 10802.71 12738.51
Child 6453.10 7901.54 9287.01 9178.40 10440.09
Health and family welfare 1691.99 1878.43 1922.44 2862.11 3196.78
Child 1722.17 1842.02 1950.61 3808.37 3571.83
Social Security and social welfare 1247.05 1361.49 1575.36 1556.79 1125.34
Nutrition and neo natal Care 969.41 1216.85 1301.85 1354.22 895.81
Child Labour welfare 2.27 2.28 2.29 2.33 1.34
GSDP (Rs. Crore) 156864.24 177745.22 195723.15 227958.83 254340.79
Bihar
Total Expenditure 64050.66 76478.23 90720.38 107581.96 121973.58
Social Services 24438.16 28252.73 33386.31 38683.53 44329.13
Child expenditure 16232.15 16922.60 21252.91 25026.62 25464.73

Accessed at https://www.nipfp.org.in/publications/working-papers/1852/ Page 21
Working Paper No. 257
Education 15590.96 16231.90 17897.31 22048.34 21885.37
Child 12241.83 12116.07 14412.16 18262.04 17523.58
Health and family welfare 2398.39 2573.59 3603.97 4571.32 5492.90
Child 2272.50 2386.31 4517.09 4543.59 5793.89
Social Security and social welfare 2828.53 3891.12 5538.23 5492.61 5942.42
Nutrition and neo natal Care 1715.09 2417.34 2320.20 2215.14 2142.89
Child Labour welfare 2.73 2.88 3.46 5.85 4.36
GSDP (Rs. Crore) 282367.93 317101.34 342950.94 369469.45 425887.89
Chhattisgarh
Total Expenditure 31891.17 37433.77 46105.54 51646.07 57635.11
Social Services 12407.05 14974.07 16948.72 18146.37 23802.24
Child expenditure 8332.69 9557.34 12825.07 13070.85 15934.90
Education 6993.75 7853.87 9859.98 10179.62 12233.05
Child 6272.67 6992.83 9005.46 8865.13 10884.65
Health and family welfare 1292.91 1555.56 2333.35 2709.24 3292.27
Child 1179.95 1413.14 2549.64 2922.48 3671.51
Social Security and social welfare 2108.65 3477.70 1937.28 2007.40 2148.17
Nutrition and neo natal Care 865.12 1125.45 1256.55 1264.56 1360.83
Child Labour welfare 14.95 25.92 13.41 18.68 17.91
GSDP (Rs. Crore) 177511.32 206833.19 221142.26 234212.37 262263.36
Goa
Total Expenditure 7003.62 7811.50 8644.36 10041.83 10504.71
Social Services 2393.08 2806.66 3093.22 3526.07 3777.22
Child expenditure 1451.78 1738.22 1862.78 2113.53 2287.00
Education 1146.33 1306.94 1386.03 1530.27 1595.37
Child 727.13 834.85 899.68 972.94 1053.28
Health and family welfare 424.41 462.47 506.46 574.19 670.56
Child 362.21 399.66 427.65 487.38 594.35
Social Security and social welfare 381.69 527.67 566.06 683.67 667.35
Nutrition and neo natal Care 358.28 499.04 531.03 649.53 634.08
Child Labour welfare 4.16 4.67 4.42 3.68 5.29
GSDP (Rs. Crore) 38120.02 35921.10 47814.18 55053.85 62660.79
Gujarat
Total Expenditure 90885.01 97935.91 110809.47 119947.98 126203.32
Social Services 35611.91 39031.89 43899.86 48537.04 51141.03
Child expenditure 18645.04 21041.45 23230.66 25264.51 26421.31
Education 16187.99 18403.32 20867.43 22393.44 23166.51
Child 13301.98 15157.70 16824.98 18219.55 19242.70
Health and family welfare 4626.36 5083.49 6366.90 7125.10 7699.53
Child 2800.28 3065.52 3542.61 3950.86 4522.95
Social Security and social welfare 2923.04 3160.43 3222.63 3497.53 3066.03
Nutrition and neo natal Care 2530.64 2807.66 2840.03 3064.47 2610.92

Accessed at https://www.nipfp.org.in/publications/working-papers/1852/ Page 22
Working Paper No. 257
Child Labour welfare 12.14 10.58 23.04 29.63 44.74
GSDP (Rs. Crore) 724495.36 807623.19 921773.15 1029009.74 1162286.54
Haryana
Total Expenditure 43833.57 45821.70 52833.41 66144.03 75266.53
Social Services 15962.35 17237.36 21018.12 23078.86 27059.90
Child expenditure 7767.26 8079.80 10569.43 11431.50 12832.13
Education 7328.10 7709.76 9613.45 10334.44 11501.39
Child 5968.54 6231.33 7850.06 8284.61 9395.24
Health and family welfare 1600.89 1752.47 2238.72 2524.90 3044.43
Child 1115.11 1235.76 1843.50 2257.70 2500.21
Social Security and social welfare 2391.44 2494.53 3713.91 4293.50 5122.55
Nutrition and neo natal Care 683.13 612.26 875.38 888.71 936.16
Child Labour welfare 0.47 0.45 0.50 0.47 0.53
GSDP (Rs. Crore) 347032.01 400662.12 437462.07 485183.99 547396.06
Himachal Pradesh
Total Expenditure 18129.05 19208.35 22259.95 25167.30 28843.25
Social Services 6566.83 7183.57 7973.49 8771.94 10650.99
Child expenditure 4200.34 4447.23 5126.18 5023.42 6012.60
Education 3651.31 3847.94 4323.46 4479.46 5299.56
Child 3101.75 3294.40 3784.20 3710.02 4460.27
Health and family welfare 1006.48 1074.21 1299.45 1417.39 1786.85
Child 838.56 884.96 1035.56 1012.63 1203.93
Social Security and social welfare 491.01 553.90 638.12 703.23 819.70
Nutrition and neo natal Care 260.03 267.87 306.42 300.78 348.40
Child Labour welfare 0.00 0.00 0.00 0.00 0.00
GSDP (Rs. Crore) 82819.78 94764.16 103772.32 114239.41 126020.15
Jammu and Kashmir
Total Expenditure 30341.26 31564.62 34463.14 43751.33 48097.71
Social Services 8506.49 9125.72 10109.92 14004.76 13869.46
Child expenditure 4279.60 4862.20 5262.77 7980.50 7880.52
Education 3940.03 4437.00 4865.67 6694.25 6498.06
Child 2700.10 3206.20 3610.79 5258.04 5037.33
Health and family welfare 1622.54 1784.91 2015.13 2610.03 2810.34
Child 974.08 1125.41 1123.10 2029.02 2149.21
Social Security and social welfare 771.76 688.39 767.89 1843.25 1360.50
Nutrition and neo natal Care 601.77 526.92 525.01 690.60 690.46
Child Labour welfare 3.66 3.68 3.87 2.85 3.52
GSDP (Rs. Crore) 87137.73 95618.74 98369.85 117186.53 126846.54
Jharkhand
Total Expenditure 27618.30 28194.39 37337.84 44711.34 55949.72
Social Services 9338.36 9139.46 12824.84 15867.22 20089.38

Accessed at https://www.nipfp.org.in/publications/working-papers/1852/ Page 23
Working Paper No. 257
Child expenditure 5997.40 6209.28 7944.91 9291.02 10877.57
Education 5239.77 4842.70 6839.67 8027.25 9793.43
Child 4378.38 3974.84 5788.88 6783.77 8082.86
Health and family welfare 955.57 1143.28 1618.98 2173.25 2479.24
Child 929.51 1241.74 1071.19 1280.92 1481.37
Social Security and social welfare 1497.93 1589.50 1902.51 2238.54 2569.00
Nutrition and neo natal Care 685.22 986.40 1077.02 1223.52 1311.11
Child Labour welfare 4.29 6.30 7.82 2.81 2.24
GSDP (Rs. Crore) 174723.69 188566.71 218525.17 206612.80 235560.23
Karnataka
Total Expenditure 91771.73 106136.43 123236.59 137741.61 160054.97
Social Services 33335.78 35674.57 43547.14 51621.00 61446.08
Child expenditure 15928.27 17277.73 21633.45 22718.59 25914.58
Education 15726.63 17507.49 20394.20 21848.46 25238.27
Child 12486.16 13819.08 16565.23 16893.89 19375.54
Health and family welfare 3929.10 4533.48 5848.53 5829.46 6882.88
Child 1697.17 1927.58 3263.29 3480.42 4257.69
Social Security and social welfare 4608.46 4955.51 5923.86 6780.42 7301.65
Nutrition and neo natal Care 1737.76 1519.84 1754.41 2191.72 2263.95
Child Labour welfare 7.18 11.24 50.52 152.56 17.39
GSDP (Rs. Crore) 695413.05 816666.15 912646.54 1012804.09 1132392.97
Kerala
Total Expenditure 58092.04 64779.83 76001.02 86189.51 101222.26
Social Services 19439.39 21596.99 24593.38 28638.31 35057.39
Child expenditure 11408.28 12780.92 14230.36 15331.40 18881.93
Education 11141.80 12556.66 13799.50 15302.16 18389.11
Child 8506.67 9529.38 10701.60 11491.09 14259.63
Health and family welfare 3243.47 3637.86 4228.30 4771.24 5987.57
Child 2019.94 2289.79 2395.34 2621.30 3145.08
Social Security and social welfare 2039.27 2246.57 3073.51 4333.21 5328.69
Nutrition and neo natal Care 483.07 583.85 677.12 726.77 946.47
Child Labour welfare 398.60 377.89 456.30 492.24 530.74
GSDP (Rs. Crore) 412313.00 465041.21 512564.05 561545.62 621699.77
Madhya Pradesh
Total Expenditure 74535.43 80682.28 94250.49 116606.17 146825.68
Social Services 25996.47 29667.50 34137.47 45675.41 51227.59
Child expenditure 17235.81 20107.67 22772.38 26301.00 29828.09
Education 13401.84 16264.26 18930.78 21146.57 25197.95
Child 11823.19 14401.96 16855.67 18322.45 21990.02
Health and family welfare 3305.02 3449.61 4761.82 5454.08 5940.27
Child 2423.36 2473.81 3603.48 3875.41 3998.95
Social Security and social welfare 4158.01 4203.93 3256.74 5471.84 5439.74
Accessed at https://www.nipfp.org.in/publications/working-papers/1852/ Page 24
Working Paper No. 257
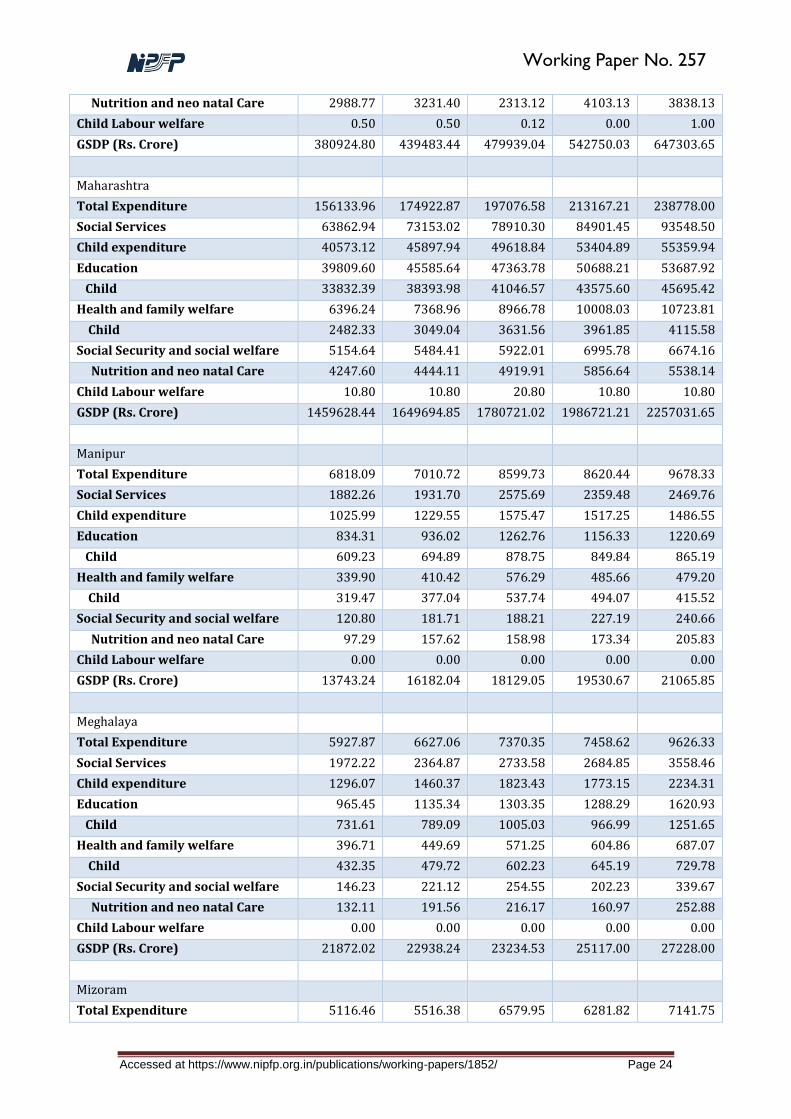
Nutrition and neo natal Care 2988.77 3231.40 2313.12 4103.13 3838.13
Child Labour welfare 0.50 0.50 0.12 0.00 1.00
GSDP (Rs. Crore) 380924.80 439483.44 479939.04 542750.03 647303.65
Maharashtra
Total Expenditure 156133.96 174922.87 197076.58 213167.21 238778.00
Social Services 63862.94 73153.02 78910.30 84901.45 93548.50
Child expenditure 40573.12 45897.94 49618.84 53404.89 55359.94
Education 39809.60 45585.64 47363.78 50688.21 53687.92
Child 33832.39 38393.98 41046.57 43575.60 45695.42
Health and family welfare 6396.24 7368.96 8966.78 10008.03 10723.81
Child 2482.33 3049.04 3631.56 3961.85 4115.58
Social Security and social welfare 5154.64 5484.41 5922.01 6995.78 6674.16
Nutrition and neo natal Care 4247.60 4444.11 4919.91 5856.64 5538.14
Child Labour welfare 10.80 10.80 20.80 10.80 10.80
GSDP (Rs. Crore) 1459628.44 1649694.85 1780721.02 1986721.21 2257031.65
Manipur
Total Expenditure 6818.09 7010.72 8599.73 8620.44 9678.33
Social Services 1882.26 1931.70 2575.69 2359.48 2469.76
Child expenditure 1025.99 1229.55 1575.47 1517.25 1486.55
Education 834.31 936.02 1262.76 1156.33 1220.69
Child 609.23 694.89 878.75 849.84 865.19
Health and family welfare 339.90 410.42 576.29 485.66 479.20
Child 319.47 377.04 537.74 494.07 415.52
Social Security and social welfare 120.80 181.71 188.21 227.19 240.66
Nutrition and neo natal Care 97.29 157.62 158.98 173.34 205.83
Child Labour welfare 0.00 0.00 0.00 0.00 0.00
GSDP (Rs. Crore) 13743.24 16182.04 18129.05 19530.67 21065.85
Meghalaya
Total Expenditure 5927.87 6627.06 7370.35 7458.62 9626.33
Social Services 1972.22 2364.87 2733.58 2684.85 3558.46
Child expenditure 1296.07 1460.37 1823.43 1773.15 2234.31
Education 965.45 1135.34 1303.35 1288.29 1620.93
Child 731.61 789.09 1005.03 966.99 1251.65
Health and family welfare 396.71 449.69 571.25 604.86 687.07
Child 432.35 479.72 602.23 645.19 729.78
Social Security and social welfare 146.23 221.12 254.55 202.23 339.67
Nutrition and neo natal Care 132.11 191.56 216.17 160.97 252.88
Child Labour welfare 0.00 0.00 0.00 0.00 0.00
GSDP (Rs. Crore) 21872.02 22938.24 23234.53 25117.00 27228.00
Mizoram
Total Expenditure 5116.46 5516.38 6579.95 6281.82 7141.75

Accessed at https://www.nipfp.org.in/publications/working-papers/1852/ Page 25
Working Paper No. 257
Social Services 1874.64 2031.41 2474.93 2431.91 2614.14
Child expenditure 813.26 957.20 1129.96 1093.86 1218.49
Education 840.18 965.70 1163.71 1157.23 1182.44
Child 518.42 587.28 793.14 756.75 886.59
Health and family welfare 221.27 262.55 345.86 378.42 399.00
Child 242.30 302.97 298.72 293.94 299.79
Social Security and social welfare 142.40 169.38 148.38 178.86 173.29
Nutrition and neo natal Care 52.54 66.96 38.11 43.16 32.11
Child Labour welfare 0.00 0.00 0.00 0.00 0.00
GSDP (Rs. Crore) 8361.93 10293.37 13509.40 15138.86 17613.18
Nagaland
Total Expenditure 6856.57 6957.41 7785.58 8641.16 0.00
Social Services 1808.59 2026.03 2206.17 2381.11 0.00
Child expenditure 1183.18 1323.28 1348.24 1541.06 0.00
Education 978.79 1128.38 1137.10 1323.97 0.00
Child 778.14 870.42 912.11 1099.62 0.00
Health and family welfare 291.96 300.94 415.69 464.96 0.00
Child 263.87 288.32 310.14 307.71 0.00
Social Security and social welfare 175.53 191.34 165.52 184.20 0.00
Nutrition and neo natal Care 140.39 163.72 125.37 133.31 0.00
Child Labour welfare 0.77 0.82 0.62 0.42 0.00
GSDP (Rs. Crore) 14121.27 16611.73 18400.67 19523.95 21487.54
Odisha
Total Expenditure 43859.74 53374.15 62210.37 75896.18 83511.60
Social Services 16181.47 20446.34 23252.53 27571.71 30601.16
Child expenditure 10559.79 11963.35 14088.81 16072.99 17900.85
Education 8520.49 9726.52 11596.48 13511.21 14043.31
Child 7045.74 7948.27 9177.90 10858.21 11496.69
Health and family welfare 1764.94 1956.94 3187.31 3680.55 4729.25
Child 1684.35 1542.92 2940.43 3573.14 4295.55
Social Security and social welfare 3272.67 4163.37 3592.13 3851.09 3886.78
Nutrition and neo natal Care 1828.53 2470.56 1968.48 1639.47 2106.25
Child Labour welfare 1.17 1.60 2.01 2.17 2.37
GSDP (Rs. Crore) 261699.60 296475.38 314267.07 330873.77 377201.78
Punjab
Total Expenditure 41373.76 43841.28 49731.93 53132.91 59642.35
Social Services 11906.12 12249.42 14523.66 15726.49 16759.44
Child expenditure 8111.01 8456.59 10212.69 10751.98 11356.22
Education 7240.53 7440.78 8548.51 9292.86 9514.56
Child 5982.83 6311.82 7506.88 7941.70 8196.98
Health and family welfare 1903.23 1969.18 2364.24 2606.28 2890.23
Child 1556.11 1572.24 1986.20 2060.52 2358.72

Accessed at https://www.nipfp.org.in/publications/working-papers/1852/ Page 26
Working Paper No. 257
Social Security and social welfare 1251.53 1231.28 1445.75 1537.34 1633.72
Nutrition and neo natal Care 571.79 572.11 719.54 749.66 800.42
Child Labour welfare 0.29 0.43 0.06 0.10 0.10
GSDP (Rs. Crore) 297733.82 332146.94 355101.82 390087.44 428339.91
Rajasthan
Total Expenditure 74145.37 89174.25 110644.66 128224.50 144119.79
Social Services 28133.04 36037.40 43591.52 49344.12 55585.97
Child expenditure 16505.14 18991.80 23636.38 25749.21 29446.51
Education 13794.62 16285.97 20183.90 22095.00 25549.90
Child 12434.76 14705.62 18606.53 20189.44 23624.40
Health and family welfare 3891.66 4751.63 6457.72 7757.80 8252.13
Child 2548.49 2696.53 3236.35 3810.36 3960.74
Social Security and social welfare 2448.19 5191.81 5509.13 5346.60 5894.92
Nutrition and neo natal Care 1287.21 1407.43 1513.45 1446.47 1538.67
Child Labour welfare 234.68 182.22 280.05 302.93 322.70
GSDP (Rs. Crore) 493551.24 551031.02 615694.80 683758.12 759234.50
Sikkim
Total Expenditure 3854.70 4369.90 4711.66 4278.56 4508.37
Social Services 1238.69 1542.58 1549.53 1436.99 1578.28
Child expenditure 747.94 867.73 918.13 965.96 920.57
Education 602.62 701.92 769.94 802.17 822.39
Child 488.59 570.55 659.56 698.39 673.39
Health and family welfare 243.74 254.84 259.83 260.64 281.94
Child 234.35 263.06 223.08 225.49 237.08
Social Security and social welfare 51.27 62.53 64.89 90.43 70.51
Nutrition and neo natal Care 25.00 34.12 35.48 42.07 10.10
Child Labour welfare 0.00 0.00 0.00 0.00 0.00
GSDP (Rs. Crore) 12338.42 13861.90 15406.72 18033.94 20020.46
Tamil Nadu
Total Expenditure 111635.11 126997.74 146630.98 159987.81 173904.75
Social Services 43772.54 51984.90 54582.98 60466.73 61338.36
Child expenditure 22922.44 27826.62 32059.43 33593.19 35313.14
Education 19649.44 24202.29 27327.16 29134.66 30357.16
Child 15327.29 19027.83 22180.81 22956.26 24732.48
Health and family welfare 5290.15 6019.63 7468.81 8345.00 8640.86
Child 3978.25 4637.47 5823.85 6467.00 6493.31
Social Security and social welfare 10651.71 11920.30 11866.21 12397.22 11085.59
Nutrition and neo natal Care 3613.59 4158.07 4050.60 4165.99 4082.68
Child Labour welfare 3.31 3.25 4.17 3.94 4.67
GSDP (Rs. Crore) 854825.35 968530.45 1072677.97 1176500.03 1270490.21
Telangana
Accessed at https://www.nipfp.org.in/publications/working-papers/1852/ Page 27
Working Paper No. 257
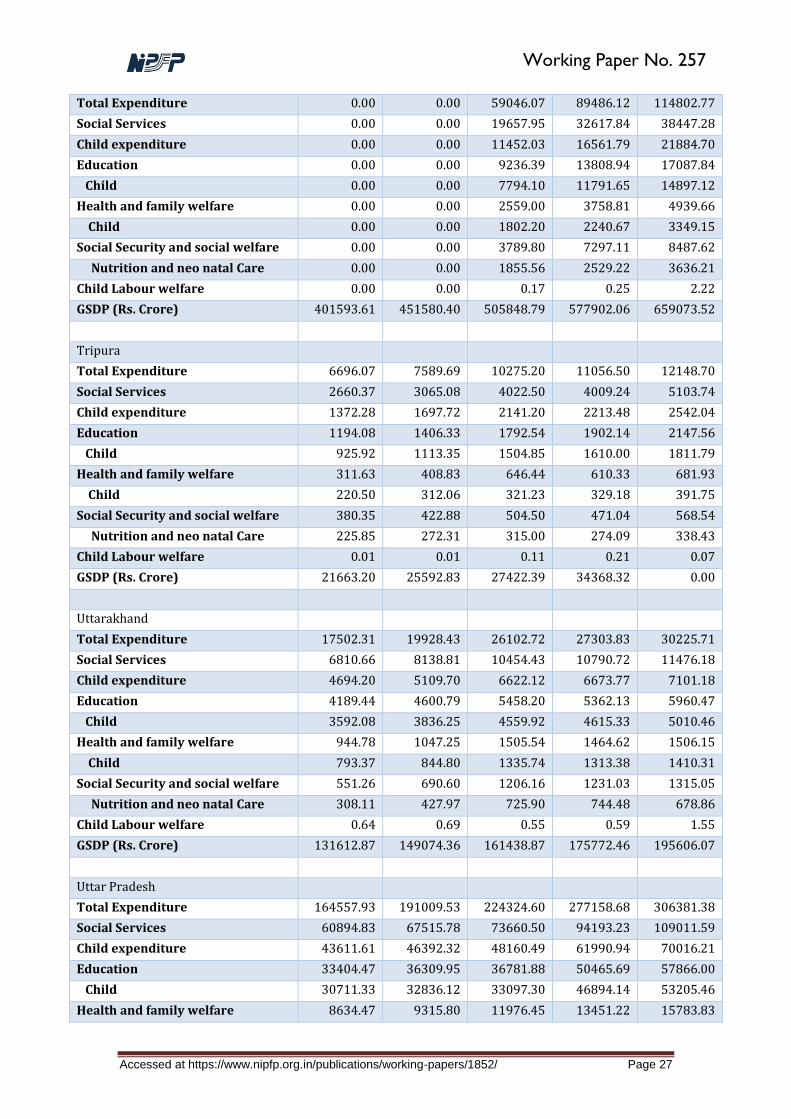
Total Expenditure 0.00 0.00 59046.07 89486.12 114802.77
Social Services 0.00 0.00 19657.95 32617.84 38447.28
Child expenditure 0.00 0.00 11452.03 16561.79 21884.70
Education 0.00 0.00 9236.39 13808.94 17087.84
Child 0.00 0.00 7794.10 11791.65 14897.12
Health and family welfare 0.00 0.00 2559.00 3758.81 4939.66
Child 0.00 0.00 1802.20 2240.67 3349.15
Social Security and social welfare 0.00 0.00 3789.80 7297.11 8487.62
Nutrition and neo natal Care 0.00 0.00 1855.56 2529.22 3636.21
Child Labour welfare 0.00 0.00 0.17 0.25 2.22
GSDP (Rs. Crore) 401593.61 451580.40 505848.79 577902.06 659073.52
Tripura
Total Expenditure 6696.07 7589.69 10275.20 11056.50 12148.70
Social Services 2660.37 3065.08 4022.50 4009.24 5103.74
Child expenditure 1372.28 1697.72 2141.20 2213.48 2542.04
Education 1194.08 1406.33 1792.54 1902.14 2147.56
Child 925.92 1113.35 1504.85 1610.00 1811.79
Health and family welfare 311.63 408.83 646.44 610.33 681.93
Child 220.50 312.06 321.23 329.18 391.75
Social Security and social welfare 380.35 422.88 504.50 471.04 568.54
Nutrition and neo natal Care 225.85 272.31 315.00 274.09 338.43
Child Labour welfare 0.01 0.01 0.11 0.21 0.07
GSDP (Rs. Crore) 21663.20 25592.83 27422.39 34368.32 0.00
Uttarakhand
Total Expenditure 17502.31 19928.43 26102.72 27303.83 30225.71
Social Services 6810.66 8138.81 10454.43 10790.72 11476.18
Child expenditure 4694.20 5109.70 6622.12 6673.77 7101.18
Education 4189.44 4600.79 5458.20 5362.13 5960.47
Child 3592.08 3836.25 4559.92 4615.33 5010.46
Health and family welfare 944.78 1047.25 1505.54 1464.62 1506.15
Child 793.37 844.80 1335.74 1313.38 1410.31
Social Security and social welfare 551.26 690.60 1206.16 1231.03 1315.05
Nutrition and neo natal Care 308.11 427.97 725.90 744.48 678.86
Child Labour welfare 0.64 0.69 0.55 0.59 1.55
GSDP (Rs. Crore) 131612.87 149074.36 161438.87 175772.46 195606.07
Uttar Pradesh
Total Expenditure 164557.93 191009.53 224324.60 277158.68 306381.38
Social Services 60894.83 67515.78 73660.50 94193.23 109011.59
Child expenditure 43611.61 46392.32 48160.49 61990.94 70016.21
Education 33404.47 36309.95 36781.88 50465.69 57866.00
Child 30711.33 32836.12 33097.30 46894.14 53205.46
Health and family welfare 8634.47 9315.80 11976.45 13451.22 15783.83

Accessed at https://www.nipfp.org.in/publications/working-papers/1852/ Page 28
Working Paper No. 257
Child 6659.57 6405.88 7780.86 8310.72 9019.85
Social Security and social welfare 9723.16 11450.54 12005.00 12383.29 15006.27
Nutrition and neo natal Care 6194.00 7110.06 7217.32 6744.94 7764.44
Child Labour welfare 46.71 40.25 65.01 41.14 26.46
GSDP (Rs. Crore) 822392.92 940356.43 1011789.69 1137210.00 1250213.00
West Bengal
Total Expenditure 86658.18 98724.22 113530.22 131247.44 145253.99
Social Services 35726.73 40962.11 44379.60 52016.65 61504.92
Child expenditure 20749.39 22499.16 27237.13 29214.54 31077.03
Education 18008.83 19545.29 22266.92 22641.67 25022.61
Child 14786.59 15372.13 18095.92 18404.60 20314.23
Health and family welfare 4026.87 4848.94 6375.11 7858.78 8262.33
Child 3751.26 4439.89 6000.95 7228.91 7169.37
Social Security and social welfare 6953.55 8911.56 7318.25 10757.41 15676.46
Nutrition and neo natal Care 2210.05 2685.57 3138.38 3529.24 3590.94
Child Labour welfare 1.48 1.57 1.88 51.79 2.49
GSDP (Rs. Crore) 591464.45 676848.06 718081.66 797299.80 879167.04

Accessed at https://www.nipfp.org.in/publications/working-papers/1852/ Page 29
Working Paper No. 257
Annexure Table 1: Expenditure of States (Rs. Crore) State / Expenditure 2012-13 2013-14 2014-15 2015 - 16 2016-17
Andhra Pradesh
Total Expenditure 117851.21 125654.63 126270.88 110121.19 131358.98
Social Services 42677.78 46334.02 44640.95 48863.18 52658.77
Child expenditure 291.55 304.36 266.37 282.72 287.13
Education 23272.61 25056.84 21969.87 20835.80 22335.57
Child 19510.23 21133.00 18336.63 17293.30 18800.06
Health and family welfare 5427.73 5938.76 5533.69 5207.31 6437.73
Child 4229.46 3510.84 3402.38 3128.34 3414.10
Social Security and social welfare 8122.23 8503.16 8967.94 13358.34 11446.70
Nutrition and neo natal Care 5414.84 5791.07 4897.83 7849.82 6498.40
Child Labour welfare 0.48 0.60 0.39 0.35 0.21
GSDP (Rs. Crore) 815065.60 928665.46 526468.42 609933.62 699307.19
Arunachala Pradesh 0.00 0.00 0.00 0.00 0.00
Total Expenditure 5992.52 7411.10 8639.77 10355.99 10938.55
Social Services 1786.05 2273.96 2800.91 2978.93 3626.38
Child expenditure 9.65 10.82 13.73 15.79 17.43
Education 774.98 892.24 1163.11 1398.82 1503.26
Child 600.58 651.30 883.22 1091.35 1131.52
Health and family welfare 272.40 340.18 580.24 515.12 707.22
Child 331.11 399.23 451.18 432.45 585.22
Social Security and social welfare 183.43 222.13 225.79 248.52 206.77
Nutrition and neo natal Care 33.06 31.30 38.78 55.52 25.82
Child Labour welfare 0.00 0.00 0.00 0.00 0.00
GSDP (Rs. Crore) 12546.65 14580.22 17956.84 18549.44 20258.62
Assam
Total Expenditure 31754.19 35179.13 42990.44 39702.33 54864.80
Social Services 12793.72 15044.75 18656.56 18336.44 24215.74
Child expenditure 91.47 109.63 125.42 143.43 149.09
Education 7845.39 9507.61 11286.45 10802.71 12738.51
Child 6453.10 7901.54 9287.01 9178.40 10440.09
Health and family welfare 1691.99 1878.43 1922.44 2862.11 3196.78
Child 1722.17 1842.02 1950.61 3808.37 3571.83
Social Security and social welfare 1247.05 1361.49 1575.36 1556.79 1125.34
Nutrition and neo natal Care 969.41 1216.85 1301.85 1354.22 895.81
Child Labour welfare 2.27 2.28 2.29 2.33 1.34
GSDP (Rs. Crore) 156864.24 177745.22 195723.15 227958.83 254340.79
Bihar
Total Expenditure 64050.66 76478.23 90720.38 107581.96 121973.58
Social Services 24438.16 28252.73 33386.31 38683.53 44329.13
Child expenditure 162.32 169.23 212.53 250.27 254.65

Accessed at https://www.nipfp.org.in/publications/working-papers/1852/ Page 30
Working Paper No. 257
Education 15590.96 16231.90 17897.31 22048.34 21885.37
Child 12241.83 12116.07 14412.16 18262.04 17523.58
Health and family welfare 2398.39 2573.59 3603.97 4571.32 5492.90
Child 2272.50 2386.31 4517.09 4543.59 5793.89
Social Security and social welfare 2828.53 3891.12 5538.23 5492.61 5942.42
Nutrition and neo natal Care 1715.09 2417.34 2320.20 2215.14 2142.89
Child Labour welfare 2.73 2.88 3.46 5.85 4.36
GSDP (Rs. Crore) 282367.93 317101.34 342950.94 369469.45 425887.89
Chhattisgarh
Total Expenditure 31891.17 37433.77 46105.54 51646.07 57635.11
Social Services 12407.05 14974.07 16948.72 18146.37 23802.24
Child expenditure 83.33 95.57 128.25 130.71 159.35
Education 6993.75 7853.87 9859.98 10179.62 12233.05
Child 6272.67 6992.83 9005.46 8865.13 10884.65
Health and family welfare 1292.91 1555.56 2333.35 2709.24 3292.27
Child 1179.95 1413.14 2549.64 2922.48 3671.51
Social Security and social welfare 2108.65 3477.70 1937.28 2007.40 2148.17
Nutrition and neo natal Care 865.12 1125.45 1256.55 1264.56 1360.83
Child Labour welfare 14.95 25.92 13.41 18.68 17.91
GSDP (Rs. Crore) 177511.32 206833.19 221142.26 234212.37 262263.36
Goa
Total Expenditure 7003.62 7811.50 8644.36 10041.83 10504.71
Social Services 2393.08 2806.66 3093.22 3526.07 3777.22
Child expenditure 14.52 17.38 18.63 21.14 22.87
Education 1146.33 1306.94 1386.03 1530.27 1595.37
Child 727.13 834.85 899.68 972.94 1053.28
Health and family welfare 424.41 462.47 506.46 574.19 670.56
Child 362.21 399.66 427.65 487.38 594.35
Social Security and social welfare 381.69 527.67 566.06 683.67 667.35
Nutrition and neo natal Care 358.28 499.04 531.03 649.53 634.08
Child Labour welfare 4.16 4.67 4.42 3.68 5.29
GSDP (Rs. Crore) 38120.02 35921.10 47814.18 55053.85 62660.79
Gujarat
Total Expenditure 90885.01 97935.91 110809.47 119947.98 126203.32
Social Services 35611.91 39031.89 43899.86 48537.04 51141.03
Child expenditure 186.45 210.41 232.31 252.65 264.21
Education 16187.99 18403.32 20867.43 22393.44 23166.51
Child 13301.98 15157.70 16824.98 18219.55 19242.70
Health and family welfare 4626.36 5083.49 6366.90 7125.10 7699.53
Child 2800.28 3065.52 3542.61 3950.86 4522.95
Social Security and social welfare 2923.04 3160.43 3222.63 3497.53 3066.03
Nutrition and neo natal Care 2530.64 2807.66 2840.03 3064.47 2610.92

Accessed at https://www.nipfp.org.in/publications/working-papers/1852/ Page 31
Working Paper No. 257
Child Labour welfare 12.14 10.58 23.04 29.63 44.74
GSDP (Rs. Crore) 724495.36 807623.19 921773.15 1029009.74 1162286.54
Haryana
Total Expenditure 43833.57 45821.70 52833.41 66144.03 75266.53
Social Services 15962.35 17237.36 21018.12 23078.86 27059.90
Child expenditure 77.67 80.80 105.69 114.32 128.32
Education 7328.10 7709.76 9613.45 10334.44 11501.39
Child 5968.54 6231.33 7850.06 8284.61 9395.24
Health and family welfare 1600.89 1752.47 2238.72 2524.90 3044.43
Child 1115.11 1235.76 1843.50 2257.70 2500.21
Social Security and social welfare 2391.44 2494.53 3713.91 4293.50 5122.55
Nutrition and neo natal Care 683.13 612.26 875.38 888.71 936.16
Child Labour welfare 0.47 0.45 0.50 0.47 0.53
GSDP (Rs. Crore) 347032.01 400662.12 437462.07 485183.99 547396.06
Himachal Pradesh
Total Expenditure 18129.05 19208.35 22259.95 25167.30 28843.25
Social Services 6566.83 7183.57 7973.49 8771.94 10650.99
Child expenditure 42.00 44.47 51.26 50.23 60.13
Education 3651.31 3847.94 4323.46 4479.46 5299.56
Child 3101.75 3294.40 3784.20 3710.02 4460.27
Health and family welfare 1006.48 1074.21 1299.45 1417.39 1786.85
Child 838.56 884.96 1035.56 1012.63 1203.93
Social Security and social welfare 491.01 553.90 638.12 703.23 819.70
Nutrition and neo natal Care 260.03 267.87 306.42 300.78 348.40
Child Labour welfare 0.00 0.00 0.00 0.00 0.00
GSDP (Rs. Crore) 82819.78 94764.16 103772.32 114239.41 126020.15
Jammu and Kashmir
Total Expenditure 30341.26 31564.62 34463.14 43751.33 48097.71
Social Services 8506.49 9125.72 10109.92 14004.76 13869.46
Child expenditure 42.80 48.62 52.63 79.81 78.81
Education 3940.03 4437.00 4865.67 6694.25 6498.06
Child 2700.10 3206.20 3610.79 5258.04 5037.33
Health and family welfare 1622.54 1784.91 2015.13 2610.03 2810.34
Child 974.08 1125.41 1123.10 2029.02 2149.21
Social Security and social welfare 771.76 688.39 767.89 1843.25 1360.50
Nutrition and neo natal Care 601.77 526.92 525.01 690.60 690.46
Child Labour welfare 3.66 3.68 3.87 2.85 3.52
GSDP (Rs. Crore) 87137.73 95618.74 98369.85 117186.53 126846.54
Jharkhand
Total Expenditure 27618.30 28194.39 37337.84 44711.34 55949.72
Social Services 9338.36 9139.46 12824.84 15867.22 20089.38

Accessed at https://www.nipfp.org.in/publications/working-papers/1852/ Page 32
Working Paper No. 257
Child expenditure 59.97 62.09 79.45 92.91 108.78
Education 5239.77 4842.70 6839.67 8027.25 9793.43
Child 4378.38 3974.84 5788.88 6783.77 8082.86
Health and family welfare 955.57 1143.28 1618.98 2173.25 2479.24
Child 929.51 1241.74 1071.19 1280.92 1481.37
Social Security and social welfare 1497.93 1589.50 1902.51 2238.54 2569.00
Nutrition and neo natal Care 685.22 986.40 1077.02 1223.52 1311.11
Child Labour welfare 4.29 6.30 7.82 2.81 2.24
GSDP (Rs. Crore) 174723.69 188566.71 218525.17 206612.80 235560.23
Karnataka
Total Expenditure 91771.73 106136.43 123236.59 137741.61 160054.97
Social Services 33335.78 35674.57 43547.14 51621.00 61446.08
Child expenditure 159.28 172.78 216.33 227.19 259.15
Education 15726.63 17507.49 20394.20 21848.46 25238.27
Child 12486.16 13819.08 16565.23 16893.89 19375.54
Health and family welfare 3929.10 4533.48 5848.53 5829.46 6882.88
Child 1697.17 1927.58 3263.29 3480.42 4257.69
Social Security and social welfare 4608.46 4955.51 5923.86 6780.42 7301.65
Nutrition and neo natal Care 1737.76 1519.84 1754.41 2191.72 2263.95
Child Labour welfare 7.18 11.24 50.52 152.56 17.39
GSDP (Rs. Crore) 695413.05 816666.15 912646.54 1012804.09 1132392.97
Kerala
Total Expenditure 58092.04 64779.83 76001.02 86189.51 101222.26
Social Services 19439.39 21596.99 24593.38 28638.31 35057.39
Child expenditure 114.08 127.81 142.30 153.31 188.82
Education 11141.80 12556.66 13799.50 15302.16 18389.11
Child 8506.67 9529.38 10701.60 11491.09 14259.63
Health and family welfare 3243.47 3637.86 4228.30 4771.24 5987.57
Child 2019.94 2289.79 2395.34 2621.30 3145.08
Social Security and social welfare 2039.27 2246.57 3073.51 4333.21 5328.69
Nutrition and neo natal Care 483.07 583.85 677.12 726.77 946.47
Child Labour welfare 398.60 377.89 456.30 492.24 530.74
GSDP (Rs. Crore) 412313.00 465041.21 512564.05 561545.62 621699.77
Madhya Pradesh
Total Expenditure 74535.43 80682.28 94250.49 116606.17 146825.68
Social Services 25996.47 29667.50 34137.47 45675.41 51227.59
Child expenditure 172.36 201.08 227.72 263.01 298.28
Education 13401.84 16264.26 18930.78 21146.57 25197.95
Child 11823.19 14401.96 16855.67 18322.45 21990.02
Health and family welfare 3305.02 3449.61 4761.82 5454.08 5940.27
Child 2423.36 2473.81 3603.48 3875.41 3998.95
Social Security and social welfare 4158.01 4203.93 3256.74 5471.84 5439.74
Accessed at https://www.nipfp.org.in/publications/working-papers/1852/ Page 33
Working Paper No. 257
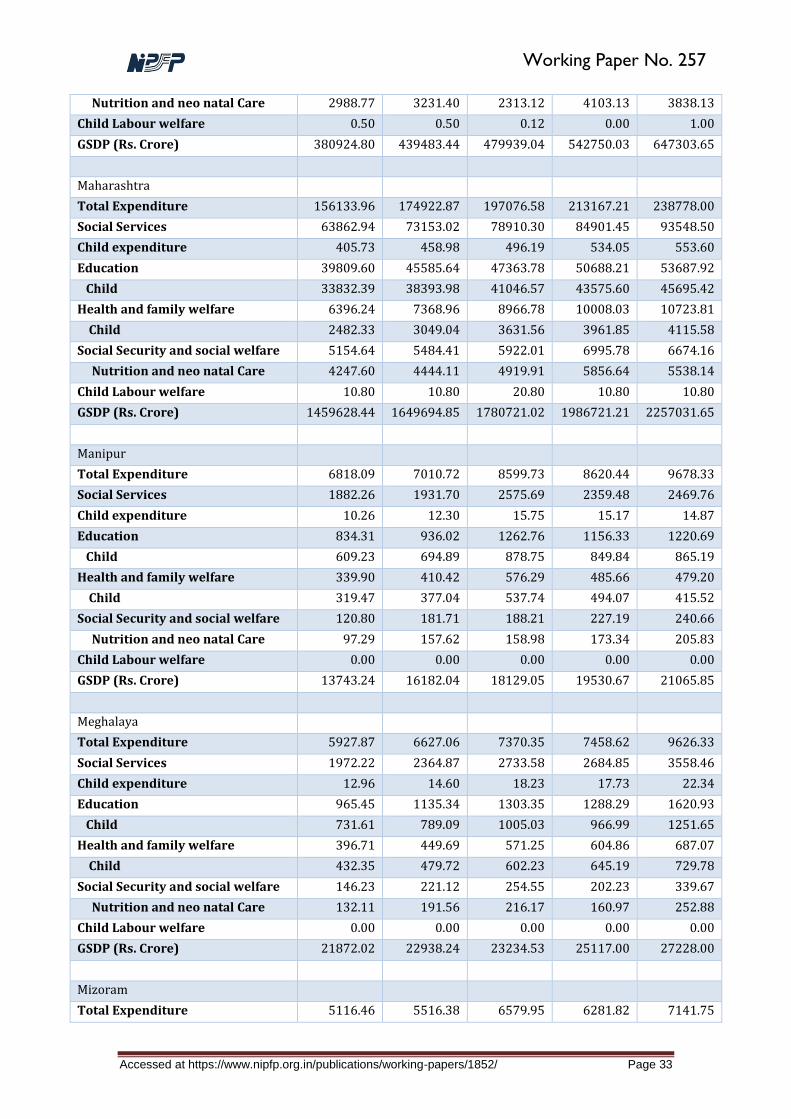
Nutrition and neo natal Care 2988.77 3231.40 2313.12 4103.13 3838.13
Child Labour welfare 0.50 0.50 0.12 0.00 1.00
GSDP (Rs. Crore) 380924.80 439483.44 479939.04 542750.03 647303.65
Maharashtra
Total Expenditure 156133.96 174922.87 197076.58 213167.21 238778.00
Social Services 63862.94 73153.02 78910.30 84901.45 93548.50
Child expenditure 405.73 458.98 496.19 534.05 553.60
Education 39809.60 45585.64 47363.78 50688.21 53687.92
Child 33832.39 38393.98 41046.57 43575.60 45695.42
Health and family welfare 6396.24 7368.96 8966.78 10008.03 10723.81
Child 2482.33 3049.04 3631.56 3961.85 4115.58
Social Security and social welfare 5154.64 5484.41 5922.01 6995.78 6674.16
Nutrition and neo natal Care 4247.60 4444.11 4919.91 5856.64 5538.14
Child Labour welfare 10.80 10.80 20.80 10.80 10.80
GSDP (Rs. Crore) 1459628.44 1649694.85 1780721.02 1986721.21 2257031.65
Manipur
Total Expenditure 6818.09 7010.72 8599.73 8620.44 9678.33
Social Services 1882.26 1931.70 2575.69 2359.48 2469.76
Child expenditure 10.26 12.30 15.75 15.17 14.87
Education 834.31 936.02 1262.76 1156.33 1220.69
Child 609.23 694.89 878.75 849.84 865.19
Health and family welfare 339.90 410.42 576.29 485.66 479.20
Child 319.47 377.04 537.74 494.07 415.52
Social Security and social welfare 120.80 181.71 188.21 227.19 240.66
Nutrition and neo natal Care 97.29 157.62 158.98 173.34 205.83
Child Labour welfare 0.00 0.00 0.00 0.00 0.00
GSDP (Rs. Crore) 13743.24 16182.04 18129.05 19530.67 21065.85
Meghalaya
Total Expenditure 5927.87 6627.06 7370.35 7458.62 9626.33
Social Services 1972.22 2364.87 2733.58 2684.85 3558.46
Child expenditure 12.96 14.60 18.23 17.73 22.34
Education 965.45 1135.34 1303.35 1288.29 1620.93
Child 731.61 789.09 1005.03 966.99 1251.65
Health and family welfare 396.71 449.69 571.25 604.86 687.07
Child 432.35 479.72 602.23 645.19 729.78
Social Security and social welfare 146.23 221.12 254.55 202.23 339.67
Nutrition and neo natal Care 132.11 191.56 216.17 160.97 252.88
Child Labour welfare 0.00 0.00 0.00 0.00 0.00
GSDP (Rs. Crore) 21872.02 22938.24 23234.53 25117.00 27228.00
Mizoram
Total Expenditure 5116.46 5516.38 6579.95 6281.82 7141.75

Accessed at https://www.nipfp.org.in/publications/working-papers/1852/ Page 34
Working Paper No. 257
Social Services 1874.64 2031.41 2474.93 2431.91 2614.14
Child expenditure 8.13 9.57 11.30 10.94 12.18
Education 840.18 965.70 1163.71 1157.23 1182.44
Child 518.42 587.28 793.14 756.75 886.59
Health and family welfare 221.27 262.55 345.86 378.42 399.00
Child 242.30 302.97 298.72 293.94 299.79
Social Security and social welfare 142.40 169.38 148.38 178.86 173.29
Nutrition and neo natal Care 52.54 66.96 38.11 43.16 32.11
Child Labour welfare 0.00 0.00 0.00 0.00 0.00
GSDP (Rs. Crore) 8361.93 10293.37 13509.40 15138.86 17613.18
Nagaland
Total Expenditure 6856.57 6957.41 7785.58 8641.16 0.00
Social Services 1808.59 2026.03 2206.17 2381.11 0.00
Child expenditure 11.83 13.23 13.48 15.41 0.00
Education 978.79 1128.38 1137.10 1323.97 0.00
Child 778.14 870.42 912.11 1099.62 0.00
Health and family welfare 291.96 300.94 415.69 464.96 0.00
Child 263.87 288.32 310.14 307.71 0.00
Social Security and social welfare 175.53 191.34 165.52 184.20 0.00
Nutrition and neo natal Care 140.39 163.72 125.37 133.31 0.00
Child Labour welfare 0.77 0.82 0.62 0.42 0.00
GSDP (Rs. Crore) 14121.27 16611.73 18400.67 19523.95 21487.54
Odisha
Total Expenditure 43859.74 53374.15 62210.37 75896.18 83511.60
Social Services 16181.47 20446.34 23252.53 27571.71 30601.16
Child expenditure 105.60 119.63 140.89 160.73 179.01
Education 8520.49 9726.52 11596.48 13511.21 14043.31
Child 7045.74 7948.27 9177.90 10858.21 11496.69
Health and family welfare 1764.94 1956.94 3187.31 3680.55 4729.25
Child 1684.35 1542.92 2940.43 3573.14 4295.55
Social Security and social welfare 3272.67 4163.37 3592.13 3851.09 3886.78
Nutrition and neo natal Care 1828.53 2470.56 1968.48 1639.47 2106.25
Child Labour welfare 1.17 1.60 2.01 2.17 2.37
GSDP (Rs. Crore) 261699.60 296475.38 314267.07 330873.77 377201.78
Punjab
Total Expenditure 41373.76 43841.28 49731.93 53132.91 59642.35
Social Services 11906.12 12249.42 14523.66 15726.49 16759.44
Child expenditure 81.11 84.57 102.13 107.52 113.56
Education 7240.53 7440.78 8548.51 9292.86 9514.56
Child 5982.83 6311.82 7506.88 7941.70 8196.98
Health and family welfare 1903.23 1969.18 2364.24 2606.28 2890.23
Child 1556.11 1572.24 1986.20 2060.52 2358.72

Accessed at https://www.nipfp.org.in/publications/working-papers/1852/ Page 35
Working Paper No. 257
Social Security and social welfare 1251.53 1231.28 1445.75 1537.34 1633.72
Nutrition and neo natal Care 571.79 572.11 719.54 749.66 800.42
Child Labour welfare 0.29 0.43 0.06 0.10 0.10
GSDP (Rs. Crore) 297733.82 332146.94 355101.82 390087.44 428339.91
Rajasthan
Total Expenditure 74145.37 89174.25 110644.66 128224.50 144119.79
Social Services 28133.04 36037.40 43591.52 49344.12 55585.97
Child expenditure 165.05 189.92 236.36 257.49 294.47
Education 13794.62 16285.97 20183.90 22095.00 25549.90
Child 12434.76 14705.62 18606.53 20189.44 23624.40
Health and family welfare 3891.66 4751.63 6457.72 7757.80 8252.13
Child 2548.49 2696.53 3236.35 3810.36 3960.74
Social Security and social welfare 2448.19 5191.81 5509.13 5346.60 5894.92
Nutrition and neo natal Care 1287.21 1407.43 1513.45 1446.47 1538.67
Child Labour welfare 234.68 182.22 280.05 302.93 322.70
GSDP (Rs. Crore) 493551.24 551031.02 615694.80 683758.12 759234.50
Sikkim
Total Expenditure 3854.70 4369.90 4711.66 4278.56 4508.37
Social Services 1238.69 1542.58 1549.53 1436.99 1578.28
Child expenditure 7.48 8.68 9.18 9.66 9.21
Education 602.62 701.92 769.94 802.17 822.39
Child 488.59 570.55 659.56 698.39 673.39
Health and family welfare 243.74 254.84 259.83 260.64 281.94
Child 234.35 263.06 223.08 225.49 237.08
Social Security and social welfare 51.27 62.53 64.89 90.43 70.51
Nutrition and neo natal Care 25.00 34.12 35.48 42.07 10.10
Child Labour welfare 0.00 0.00 0.00 0.00 0.00
GSDP (Rs. Crore) 12338.42 13861.90 15406.72 18033.94 20020.46
Tamil Nadu
Total Expenditure 111635.11 126997.74 146630.98 159987.81 173904.75
Social Services 43772.54 51984.90 54582.98 60466.73 61338.36
Child expenditure 229.22 278.27 320.59 335.93 353.13
Education 19649.44 24202.29 27327.16 29134.66 30357.16
Child 15327.29 19027.83 22180.81 22956.26 24732.48
Health and family welfare 5290.15 6019.63 7468.81 8345.00 8640.86
Child 3978.25 4637.47 5823.85 6467.00 6493.31
Social Security and social welfare 10651.71 11920.30 11866.21 12397.22 11085.59
Nutrition and neo natal Care 3613.59 4158.07 4050.60 4165.99 4082.68
Child Labour welfare 3.31 3.25 4.17 3.94 4.67
GSDP (Rs. Crore) 854825.35 968530.45 1072677.97 1176500.03 1270490.21
Telangana

Accessed at https://www.nipfp.org.in/publications/working-papers/1852/ Page 36
Working Paper No. 257
Total Expenditure 0.00 0.00 59046.07 89486.12 114802.77
Social Services 0.00 0.00 19657.95 32617.84 38447.28
Child expenditure 0.00 0.00 114.52 165.62 218.85
Education 0.00 0.00 9236.39 13808.94 17087.84
Child 0.00 0.00 7794.10 11791.65 14897.12
Health and family welfare 0.00 0.00 2559.00 3758.81 4939.66
Child 0.00 0.00 1802.20 2240.67 3349.15
Social Security and social welfare 0.00 0.00 3789.80 7297.11 8487.62
Nutrition and neo natal Care 0.00 0.00 1855.56 2529.22 3636.21
Child Labour welfare 0.00 0.00 0.17 0.25 2.22
GSDP (Rs. Crore) 401593.61 451580.40 505848.79 577902.06 659073.52
Tripura
Total Expenditure 6696.07 7589.69 10275.20 11056.50 12148.70
Social Services 2660.37 3065.08 4022.50 4009.24 5103.74
Child expenditure 13.72 16.98 21.41 22.13 25.42
Education 1194.08 1406.33 1792.54 1902.14 2147.56
Child 925.92 1113.35 1504.85 1610.00 1811.79
Health and family welfare 311.63 408.83 646.44 610.33 681.93
Child 220.50 312.06 321.23 329.18 391.75
Social Security and social welfare 380.35 422.88 504.50 471.04 568.54
Nutrition and neo natal Care 225.85 272.31 315.00 274.09 338.43
Child Labour welfare 0.01 0.01 0.11 0.21 0.07
GSDP (Rs. Crore) 21663.20 25592.83 27422.39 34368.32 0.00
Uttarakhand
Total Expenditure 17502.31 19928.43 26102.72 27303.83 30225.71
Social Services 6810.66 8138.81 10454.43 10790.72 11476.18
Child expenditure 46.94 51.10 66.22 66.74 71.01
Education 4189.44 4600.79 5458.20 5362.13 5960.47
Child 3592.08 3836.25 4559.92 4615.33 5010.46
Health and family welfare 944.78 1047.25 1505.54 1464.62 1506.15
Child 793.37 844.80 1335.74 1313.38 1410.31
Social Security and social welfare 551.26 690.60 1206.16 1231.03 1315.05
Nutrition and neo natal Care 308.11 427.97 725.90 744.48 678.86
Child Labour welfare 0.64 0.69 0.55 0.59 1.55
GSDP (Rs. Crore) 131612.87 149074.36 161438.87 175772.46 195606.07
Uttar Pradesh
Total Expenditure 164557.93 191009.53 224324.60 277158.68 306381.38
Social Services 60894.83 67515.78 73660.50 94193.23 109011.59
Child expenditure 436.12 463.92 481.60 619.91 700.16
Education 33404.47 36309.95 36781.88 50465.69 57866.00
Child 30711.33 32836.12 33097.30 46894.14 53205.46
Health and family welfare 8634.47 9315.80 11976.45 13451.22 15783.83

Accessed at https://www.nipfp.org.in/publications/working-papers/1852/ Page 37
Working Paper No. 257
Child 6659.57 6405.88 7780.86 8310.72 9019.85
Social Security and social welfare 9723.16 11450.54 12005.00 12383.29 15006.27
Nutrition and neo natal Care 6194.00 7110.06 7217.32 6744.94 7764.44
Child Labour welfare 46.71 40.25 65.01 41.14 26.46
GSDP (Rs. Crore) 822392.92 940356.43 1011789.69 1137210.00 1250213.00
West Bengal
Total Expenditure 86658.18 98724.22 113530.22 131247.44 145253.99
Social Services 35726.73 40962.11 44379.60 52016.65 61504.92
Child expenditure 207.49 224.99 272.37 292.15 310.77
Education 18008.83 19545.29 22266.92 22641.67 25022.61
Child 14786.59 15372.13 18095.92 18404.60 20314.23
Health and family welfare 4026.87 4848.94 6375.11 7858.78 8262.33
Child 3751.26 4439.89 6000.95 7228.91 7169.37
Social Security and social welfare 6953.55 8911.56 7318.25 10757.41 15676.46
Nutrition and neo natal Care 2210.05 2685.57 3138.38 3529.24 3590.94
Child Labour welfare 1.48 1.57 1.88 51.79 2.49
GSDP (Rs. Crore) 591464.45 676848.06 718081.66 797299.80 879167.04

Working Paper No. 257
MORE IN THE SERIES
Chakraborty, L., Nayyar, V., and
Jain, K. (2019). The Political
Economy of Gender Budgeting:
Empirical Evidence from India,
WP No. 256 (March).
Mukherjee, S., (2019). Inter-
Governmental Fiscal Transfers
in the Presence of Revenue Un-
certainty: The Case of Goods
and Services Tax (GST) in India,
WP No. 255 (February).
Choudhury, M., and Dutta, P.
(2019). Private Hospitals in
Health Insurance Network in
India: A Reflection for Imple-
mentation of Ayushman Bharat,
WP No. 254 (February)
Amarnath H K, is Associate
Professor, NIPFP
Email: [email protected]
Alka Singh is Head, Policy & Advocacy,
Save The Children, India
National Institute of Public Finance and Policy, 18/2, Satsang Vihar Marg,
Special Institutional Area (Near JNU), New Delhi 110067
Tel. No. 26569303, 26569780, 26569784 Fax: 91-11-26852548
www.nipfp.org.in

![Our [National] Federalism - Yale Law Journal · source: federalism now comes from federal statutes. It is “National Federalism”— statutory federalism, or “intrastatutory”](https://static.fdocuments.in/doc/165x107/5f84f6df3b712117dc60d34f/our-national-federalism-yale-law-journal-source-federalism-now-comes-from-federal.jpg)