IMPACT OF CANOPY MANAGEMENT ON BIO …apply.jar.punjab.gov.pk/upload/1456201788_118_5-4302.pdf ·...
15
Impact of canopy management on bio-economic efficiency of chick pea J. Agric. Res., 2015, 53(2) 187 IMPACT OF CANOPY MANAGEMENT ON BIO-ECONOMIC EFFICIENCY OF CHICK PEA (CICER ARIETINUM L.) UNDER ARID CONDITIONS Muhammad Aslam*, Abdul Ghaffar Sagoo**, Amir Hussain***, Niaz Hussain, Muhammad Irshad, Khalid Hussain, Abdul Ghaffar, Muhammad Nadeem, Azhar Mehmood, Naeem-ud-Din and Mudassar Khaliq* ABSTRACT A study was conducted at Arid Zone Research Institute, Bhakkar, Pakistan during 2007-10 to observe the impact of canopy management on bio-economic efficiency of chickpea on sandy loam soil. Treatmetns comprising plant growth regulators i.e. Nephthalene Acetic Acid (NAA) was kept in main plots while four available moisture depletion levels (ASMDL 50, ASMDL 65, ASMDL 80 and ASMDL 95) were kept in sub-plots, using split plot arrangements. Naphthalene acetic acid (4.5% as sodium salt) was applied @ 600 ml per hectare at 90, 110, 130, 150 and 165 days after sowing. The results showed that NAA applied at flower blooming stage (90 days after sowing) significantly increased number of pods per plant, seeds per pod , 100-seed weight and seed yield by 12.50, 6.98, 9.59 and 13.98 percent, respectively compared with control (NAA0). Treatment combination NAA1 x ASMDL80 gave maximum pods per plant (70.68), 100-seed weight (30.15 g) and grain yield (3219.1 kg/ha). Water productivity ranged from 8.23 (ASDML50 x NAA0) to 18.18 kg per ha per min (NAA x ASSML95). Maximum dry matter accumulation was recorded at 150 DAS in case of both NAA levels. The application of 600 ml per hectare NAA at flower initiation and maintenance of irrigation at 80 percent ASMDL (total amount of water applied was 252 mm with irrigation depth of 126 mm each) proved best for higher chickpea seed yield with 4.28 BCR. KEYWORDS: Cicer arietinum; naphthalene acetic acid; soil moisture levels; canopy management; bio-economic efficiency; Pakistan. INTRODUCTION Chickpea (Cicer arietinum L.) is widely grown in arid and semi-arid regions where its yield is governed by available moisture level during growth period. Trend of plant growth regulators use such as naphthalene acetic (NAA) is *Arid Zone Research Institute, Bhakkar, **Office of Assistant Land Reclamation Research Officer, Mondy Town, Bhakkar, ***Agriculture Officer (Extension), Bhakkar, Pakistan.
Transcript of IMPACT OF CANOPY MANAGEMENT ON BIO …apply.jar.punjab.gov.pk/upload/1456201788_118_5-4302.pdf ·...

Impact of canopy management on bio-economic efficiency of chick pea
J. Agric. Res., 2015, 53(2)
187
IMPACT OF CANOPY MANAGEMENT ON BIO-ECONOMIC EFFICIENCY OF CHICK PEA (CICER ARIETINUM L.)
UNDER ARID CONDITIONS
Muhammad Aslam*, Abdul Ghaffar Sagoo**, Amir Hussain***, Niaz Hussain, Muhammad Irshad, Khalid Hussain, Abdul Ghaffar, Muhammad Nadeem,
Azhar Mehmood, Naeem-ud-Din and Mudassar Khaliq*
ABSTRACT
A study was conducted at Arid Zone Research Institute, Bhakkar, Pakistan during 2007-10 to observe the impact of canopy management on bio-economic efficiency of chickpea on sandy loam soil. Treatmetns comprising plant growth regulators i.e. Nephthalene Acetic Acid (NAA) was kept in main plots while four available moisture depletion levels (ASMDL 50, ASMDL 65, ASMDL 80 and ASMDL 95) were kept in sub-plots, using split plot arrangements. Naphthalene acetic acid (4.5% as sodium salt) was applied @ 600 ml per hectare at 90, 110, 130, 150 and 165 days after sowing. The results showed that NAA applied at flower blooming stage (90 days after sowing) significantly increased number of pods per plant, seeds per pod , 100-seed weight and seed yield by 12.50, 6.98, 9.59 and 13.98 percent, respectively compared with control (NAA0). Treatment combination NAA1 x ASMDL80 gave maximum pods per plant (70.68), 100-seed weight (30.15 g) and grain yield (3219.1 kg/ha). Water productivity ranged from 8.23 (ASDML50 x NAA0) to 18.18 kg per ha per min (NAA x ASSML95). Maximum dry matter accumulation was recorded at 150 DAS in case of both NAA levels. The application of 600 ml per hectare NAA at flower initiation and maintenance of irrigation at 80 percent ASMDL (total amount of water applied was 252 mm with irrigation depth of 126 mm each) proved best for higher chickpea seed yield with 4.28 BCR. KEYWORDS: Cicer arietinum; naphthalene acetic acid; soil moisture levels;
canopy management; bio-economic efficiency; Pakistan.
INTRODUCTION Chickpea (Cicer arietinum L.) is widely grown in arid and semi-arid regions where its yield is governed by available moisture level during growth period. Trend of plant growth regulators use such as naphthalene acetic (NAA) is
*Arid Zone Research Institute, Bhakkar, **Office of Assistant Land Reclamation Research Officer, Mondy Town, Bhakkar, ***Agriculture Officer (Extension), Bhakkar, Pakistan.
M. Aslam et al.
J. Agric. Res., 2015, 53(2)
188
getting higher interest therefore it is being used over million of hectares worldwide. Napthalene acetic acid as aynthetic auxin, promotes cellular elongation, root development, helps for DNA replication (20), reduces the flower fall, increases pods per plant, grains per pod and ultimately yield of chickpea. Pods per plant, grains per pod and pod weight in chickpea were increased with 25-50 ppm NAA at five days interval starting at flowering stage. In same context Bai et al. (7) observed a significant increase in yield and yield component of Vigna radiata with the application of eight foliar sprays of NAA @ 25 mg per liter at seven days intervals starting at flowering. The highest yield (2.35 t/ha) of chickpea was achieved with 20 ppm of NAA when sprayed at bud initiation and pod formation stages (25). NAA supplied at 50% flowering, increased pods per plant and pod weight per plant while decreased the flowers drop. Chickpea is acclimatized to wide range of soils and environmental conditions. Soil moisture depletion is the primary cause of decrease in crop growth and hence yields. The potential evapotranspiration of chickpea crop ranges from 204-280 mm (21) and the consumptive use of water based on water balance in root zone should be 247-290 mm (15). Increase in water use from 4.8 to 10.6 kg per ha per mm exhibited an increase in chickpea yield (18). In this scenario, measurement of available soil moisture level is helpful for increasing water productivity and hence yields. Chickpea irrigated at 15, 30 or 45 percent available soil moisture at 1, 2 and 3 irrigations, respectively exhibited maximum yield with two irrigations (23). Dry matter accumulation and seed yield per unit area decreased under drought and water deficit conditions (8, 14). Scheduling irrigation at critical growth stages saves 2.3 cm water compared with un-scheduled irrigation in chickpea (9). However, unnecessary irrigations decreased yield and yield components causing the wastage of irrigation water (16). On the other hand, chickpea gave double yield under irrigated conditions than that of un-irrigated (26). Maximum biological yield of chickpea was recorded at 80 percent ASMDL (3). Chickpea when subjected to high (50% available) and low (90% available) water stress, produced 8-19 percent higher seed yield at low moisture stress compared with high moisture stress (13). Maximum chickpea yield was recorded at 80 percent available soil moisture depletion level (2). Crop canopy plays an important role in crop growth and productivity. Imbalanced crop canopy hinders photosynthetic activities by mal penetration and interception of light, branching pattern, flowering intensity and grain
Impact of canopy management on bio-economic efficiency of chick pea
J. Agric. Res., 2015, 53(2)
189
formation. The prime factor which controls crop canopy is the availability of soil moisture. Excessive soil moisture not only leads to wastage of water and nutrients but also increases the risk of crop lodging. The objective of the present study was to manage crop canopy and conserve irrigation water for better economic efficiency of chickpea under arid environmental conditions.
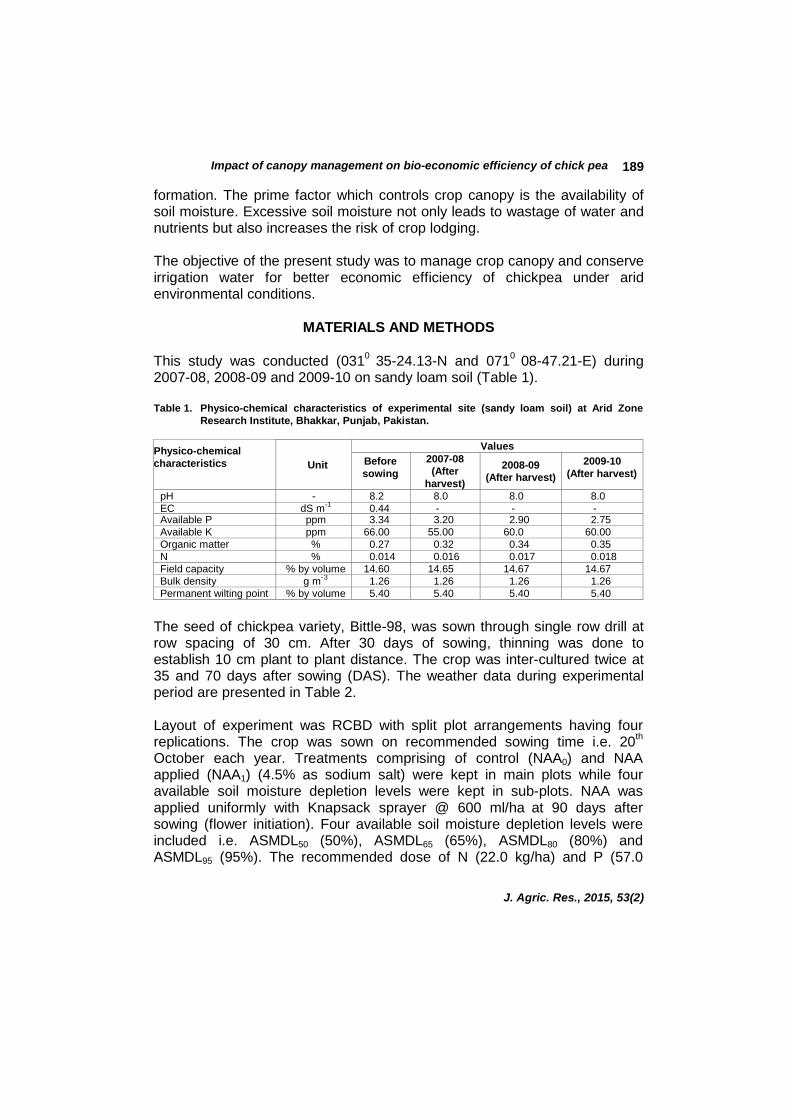
MATERIALS AND METHODS This study was conducted (0310 35-24.13-N and 0710 08-47.21-E) during 2007-08, 2008-09 and 2009-10 on sandy loam soil (Table 1). Table 1. Physico-chemical characteristics of experimental site (sandy loam soil) at Arid Zone
Research Institute, Bhakkar, Punjab, Pakistan.
Physico-chemical characteristics Unit
Values
Before sowing
2007-08 (After
harvest)
2008-09 (After harvest)
2009-10 (After harvest)
pH - 8.2 8.0 8.0 8.0 EC dS m-1 0.44 - - - Available P ppm 3.34 3.20 2.90 2.75 Available K ppm 66.00 55.00 60.0 60.00 Organic matter % 0.27 0.32 0.34 0.35 N % 0.014 0.016 0.017 0.018 Field capacity % by volume 14.60 14.65 14.67 14.67 Bulk density g m-3 1.26 1.26 1.26 1.26 Permanent wilting point % by volume 5.40 5.40 5.40 5.40
The seed of chickpea variety, Bittle-98, was sown through single row drill at row spacing of 30 cm. After 30 days of sowing, thinning was done to establish 10 cm plant to plant distance. The crop was inter-cultured twice at 35 and 70 days after sowing (DAS). The weather data during experimental period are presented in Table 2. Layout of experiment was RCBD with split plot arrangements having four replications. The crop was sown on recommended sowing time i.e. 20th October each year. Treatments comprising of control (NAA0) and NAA applied (NAA1) (4.5% as sodium salt) were kept in main plots while four available soil moisture depletion levels were kept in sub-plots. NAA was applied uniformly with Knapsack sprayer @ 600 ml/ha at 90 days after sowing (flower initiation). Four available soil moisture depletion levels were included i.e. ASMDL50 (50%), ASMDL65 (65%), ASMDL80 (80%) and ASMDL95 (95%). The recommended dose of N (22.0 kg/ha) and P (57.0
M. Aslam et al.
J. Agric. Res., 2015, 53(2)
190
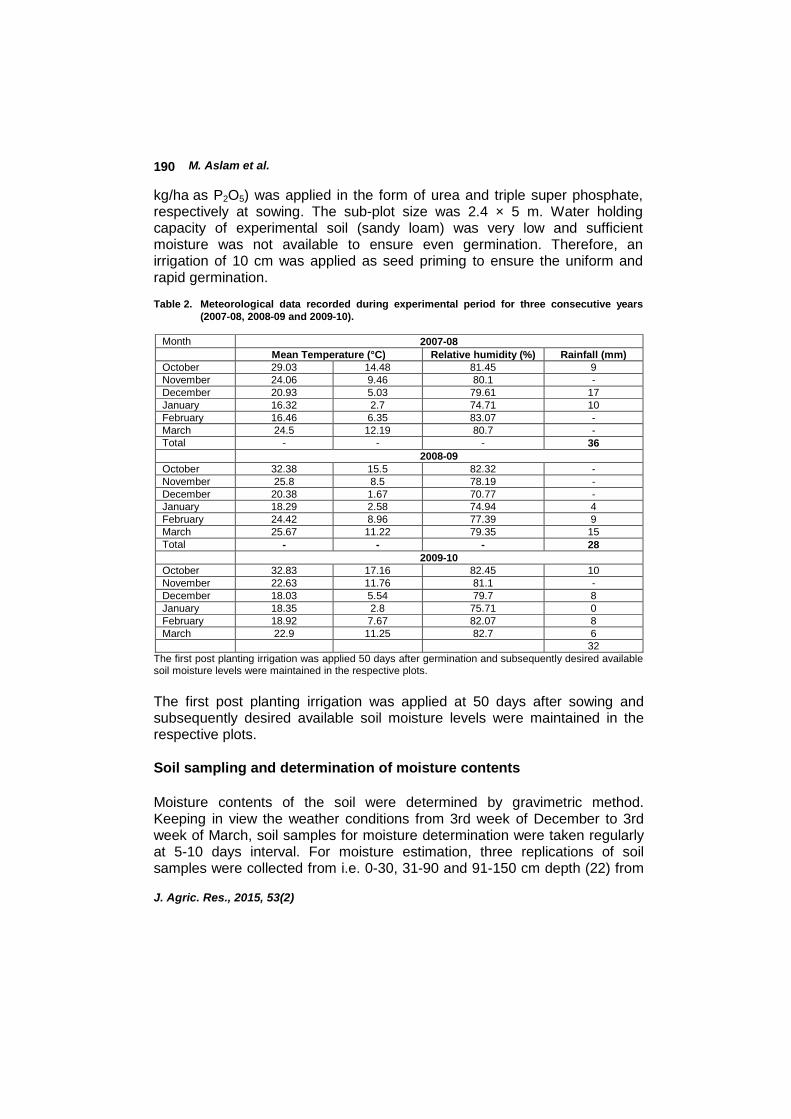
kg/ha as P2O5) was applied in the form of urea and triple super phosphate, respectively at sowing. The sub-plot size was 2.4 × 5 m. Water holding capacity of experimental soil (sandy loam) was very low and sufficient moisture was not available to ensure even germination. Therefore, an irrigation of 10 cm was applied as seed priming to ensure the uniform and rapid germination. Table 2. Meteorological data recorded during experimental period for three consecutive years
(2007-08, 2008-09 and 2009-10).
Month 2007-08 Mean Temperature (°C) Relative humidity (%) Rainfall (mm) October 29.03 14.48 81.45 9 November 24.06 9.46 80.1 - December 20.93 5.03 79.61 17 January 16.32 2.7 74.71 10 February 16.46 6.35 83.07 - March 24.5 12.19 80.7 - Total - - - 36 2008-09 October 32.38 15.5 82.32 - November 25.8 8.5 78.19 - December 20.38 1.67 70.77 - January 18.29 2.58 74.94 4 February 24.42 8.96 77.39 9 March 25.67 11.22 79.35 15 Total - - - 28 2009-10 October 32.83 17.16 82.45 10 November 22.63 11.76 81.1 - December 18.03 5.54 79.7 8 January 18.35 2.8 75.71 0 February 18.92 7.67 82.07 8 March 22.9 11.25 82.7 6 32
The first post planting irrigation was applied 50 days after germination and subsequently desired available soil moisture levels were maintained in the respective plots. The first post planting irrigation was applied at 50 days after sowing and subsequently desired available soil moisture levels were maintained in the respective plots. Soil sampling and determination of moisture contents Moisture contents of the soil were determined by gravimetric method. Keeping in view the weather conditions from 3rd week of December to 3rd week of March, soil samples for moisture determination were taken regularly at 5-10 days interval. For moisture estimation, three replications of soil samples were collected from i.e. 0-30, 31-90 and 91-150 cm depth (22) from

Impact of canopy management on bio-economic efficiency of chick pea
J. Agric. Res., 2015, 53(2)
191
each sub-plot. Moisture of each sample was calculated separately and average was calculated. Soil moisture contents were determined as OW (%) = (Ws1 - Ws2)/ Ws2× 100 (U.S. Salinity Lab. Staff, 1954), whereas Ow, Ws1 and Ws2 represent soil moisture percentage on oven dry weight basis, soil sample weight before oven drying (g) and soil sample weight after oven drying (g), respectively. Available soil moisture contents on volume basis at different depletion levels were calculated as proposed by Penman (19) and French and Legg (12), ASMDL= (Fc-θi) 100/Fc-PWP, where PWP, θi and Fc were the permanent wilting point, soil moisture contents in percent by volume before irrigation and field capacity respectively shown in Table 3. Table 3. Depth of irrigation applied to different ASMDL and total amount of water applied.
ASMDL Critical soil water contents at irrigation
(% volume)
Depth of Irrigation
(mm)
Total amount of water applied + ppt (mm)
2006-07 2007-08 2008-09 Average ASMDL50 (50%) 10.00 69 312 304 308 308 ASMDL65 (65%) 8.62 90 306 298 302 302 ASMDL80 (80%) 7.24 110 256 248 252 252 ASMDL95 (95%) 5.86 131 167 159 163 163
Irrigation was applied to respective plots as soon as the desired available soil moisture depletion level obtained in the crop root zone by adapting straight border irrigation system. Soil moisture contents prior to irrigation (θi) were computed by the equation Pb = Wd/Vi (10), where Pb represents bulk density of soil (g/cm3), Wd denoted weight of oven dried soil (g) and Vi denoted total volume of soil and voids (cm3).The percent moisture contents on volume basis were determined by following U.S. Salinity Lab. Staff (1954) formula i.e. Ov(%) = (Pb ×Ow)/Pw where Ov(%), Pb and PW are soil moisture content on volume basis (%), bulk density of soil (g/cm) and density of water (g/cm), respectively.
Irrigation
Crop was irrigated at critical soil moisture contents (θi) to bring back the root zone to field capacity. Depth of irrigation for each ASMDL (Table 3) was directly measured by field sampling method of crop water requirement by equation (Dw= Drz(Fc-Oi)/100 (17), where Dw is the depth of water to be applied (mm), Drz is depth of root zone (150 cm). Quantity of water applied to each treatment was measured by installation of cut throat flume (8"× 3').
M. Aslam et al.
J. Agric. Res., 2015, 53(2)
192
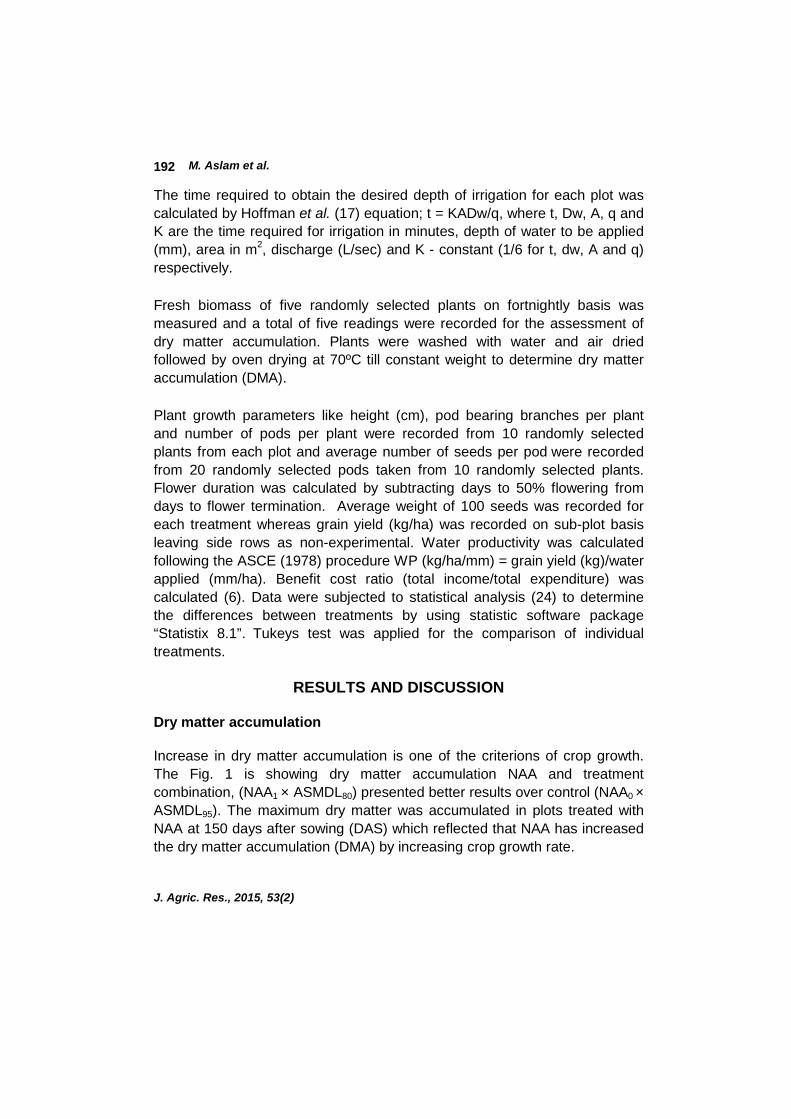
The time required to obtain the desired depth of irrigation for each plot was calculated by Hoffman et al. (17) equation; t = KADw/q, where t, Dw, A, q and K are the time required for irrigation in minutes, depth of water to be applied (mm), area in m2, discharge (L/sec) and K - constant (1/6 for t, dw, A and q) respectively. Fresh biomass of five randomly selected plants on fortnightly basis was measured and a total of five readings were recorded for the assessment of dry matter accumulation. Plants were washed with water and air dried followed by oven drying at 70ºC till constant weight to determine dry matter accumulation (DMA). Plant growth parameters like height (cm), pod bearing branches per plant and number of pods per plant were recorded from 10 randomly selected plants from each plot and average number of seeds per pod were recorded from 20 randomly selected pods taken from 10 randomly selected plants. Flower duration was calculated by subtracting days to 50% flowering from days to flower termination. Average weight of 100 seeds was recorded for each treatment whereas grain yield (kg/ha) was recorded on sub-plot basis leaving side rows as non-experimental. Water productivity was calculated following the ASCE (1978) procedure WP (kg/ha/mm) = grain yield (kg)/water applied (mm/ha). Benefit cost ratio (total income/total expenditure) was calculated (6). Data were subjected to statistical analysis (24) to determine the differences between treatments by using statistic software package “Statistix 8.1”. Tukeys test was applied for the comparison of individual treatments.
RESULTS AND DISCUSSION
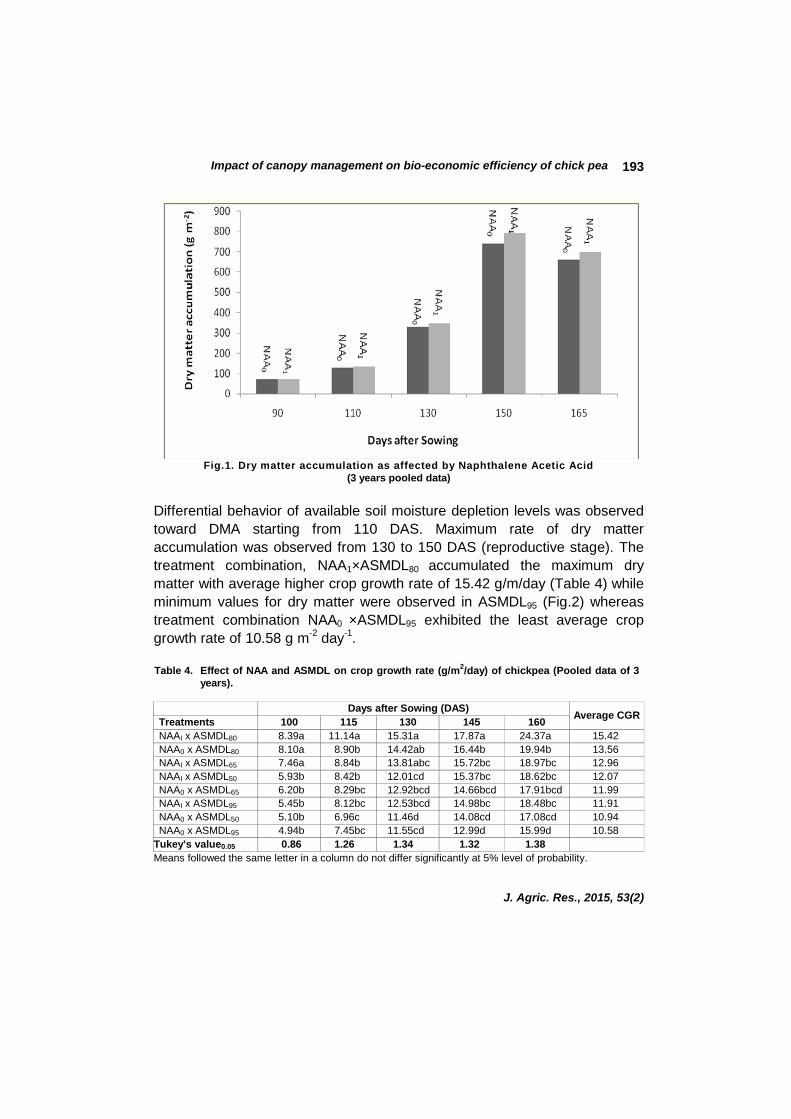
Dry matter accumulation Increase in dry matter accumulation is one of the criterions of crop growth. The Fig. 1 is showing dry matter accumulation NAA and treatment combination, (NAA1 × ASMDL80) presented better results over control (NAA0 × ASMDL95). The maximum dry matter was accumulated in plots treated with NAA at 150 days after sowing (DAS) which reflected that NAA has increased the dry matter accumulation (DMA) by increasing crop growth rate.
Impact of canopy management on bio-economic efficiency of chick pea
J. Agric. Res., 2015, 53(2)
193
Fig.1. Dry matter accumulation as affected by Naphthalene Acetic Acid
(3 years pooled data)
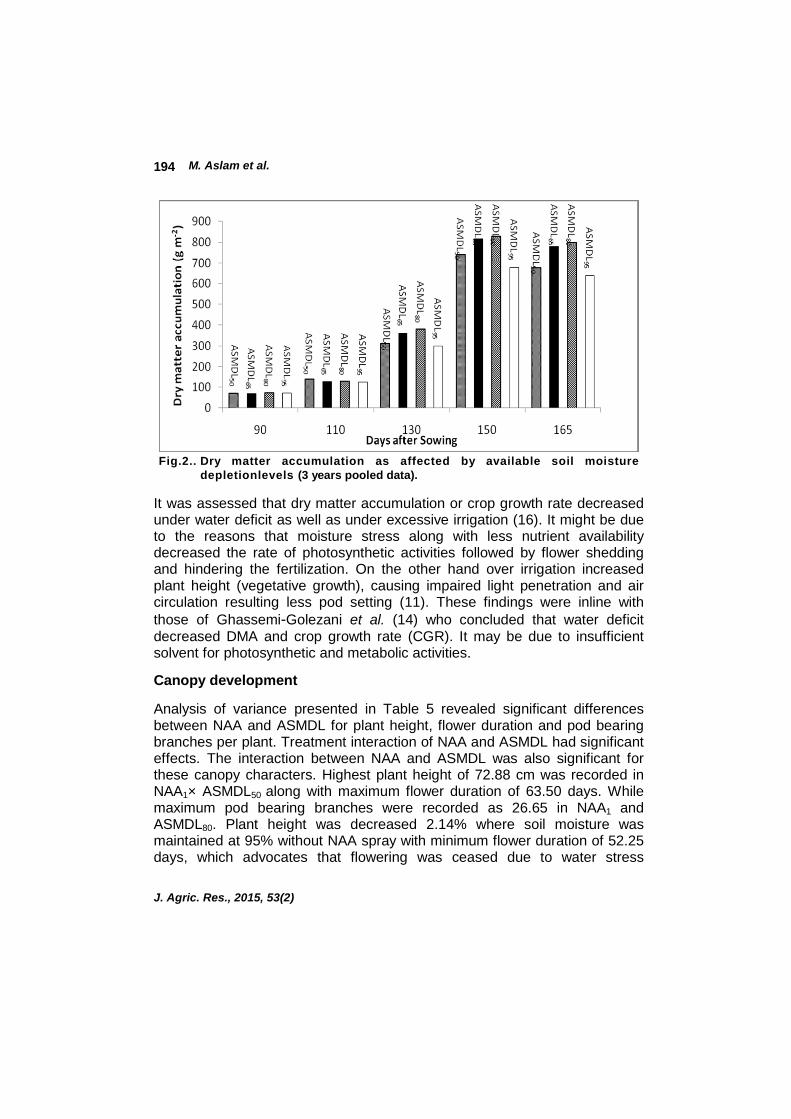
Differential behavior of available soil moisture depletion levels was observed toward DMA starting from 110 DAS. Maximum rate of dry matter accumulation was observed from 130 to 150 DAS (reproductive stage). The treatment combination, NAA1×ASMDL80 accumulated the maximum dry matter with average higher crop growth rate of 15.42 g/m/day (Table 4) while minimum values for dry matter were observed in ASMDL95 (Fig.2) whereas treatment combination NAA0 ×ASMDL95 exhibited the least average crop growth rate of 10.58 g m-2 day-1. Table 4. Effect of NAA and ASMDL on crop growth rate (g/m2/day) of chickpea (Pooled data of 3
years).
Days after Sowing (DAS) Average CGR
Treatments 100 115 130 145 160 NAAI x ASMDL80 8.39a 11.14a 15.31a 17.87a 24.37a 15.42 NAA0 x ASMDL80 8.10a 8.90b 14.42ab 16.44b 19.94b 13.56 NAAI x ASMDL65 7.46a 8.84b 13.81abc 15.72bc 18.97bc 12.96 NAAI x ASMDL50 5.93b 8.42b 12.01cd 15.37bc 18.62bc 12.07 NAA0 x ASMDL65 6.20b 8.29bc 12.92bcd 14.66bcd 17.91bcd 11.99 NAAI x ASMDL95 5.45b 8.12bc 12.53bcd 14.98bc 18.48bc 11.91 NAA0 x ASMDL50 5.10b 6.96c 11.46d 14.08cd 17.08cd 10.94 NAA0 x ASMDL95 4.94b 7.45bc 11.55cd 12.99d 15.99d 10.58
Tukey’s value0.05 0.86 1.26 1.34 1.32 1.38 Means followed the same letter in a column do not differ significantly at 5% level of probability.
M. Aslam et al.
J. Agric. Res., 2015, 53(2)
194
Fig.2.. Dry matter accumulation as affected by available soil moisture
depletionlevels (3 years pooled data).
It was assessed that dry matter accumulation or crop growth rate decreased under water deficit as well as under excessive irrigation (16). It might be due to the reasons that moisture stress along with less nutrient availability decreased the rate of photosynthetic activities followed by flower shedding and hindering the fertilization. On the other hand over irrigation increased plant height (vegetative growth), causing impaired light penetration and air circulation resulting less pod setting (11). These findings were inline with those of Ghassemi-Golezani et al. (14) who concluded that water deficit decreased DMA and crop growth rate (CGR). It may be due to insufficient solvent for photosynthetic and metabolic activities.
Canopy development
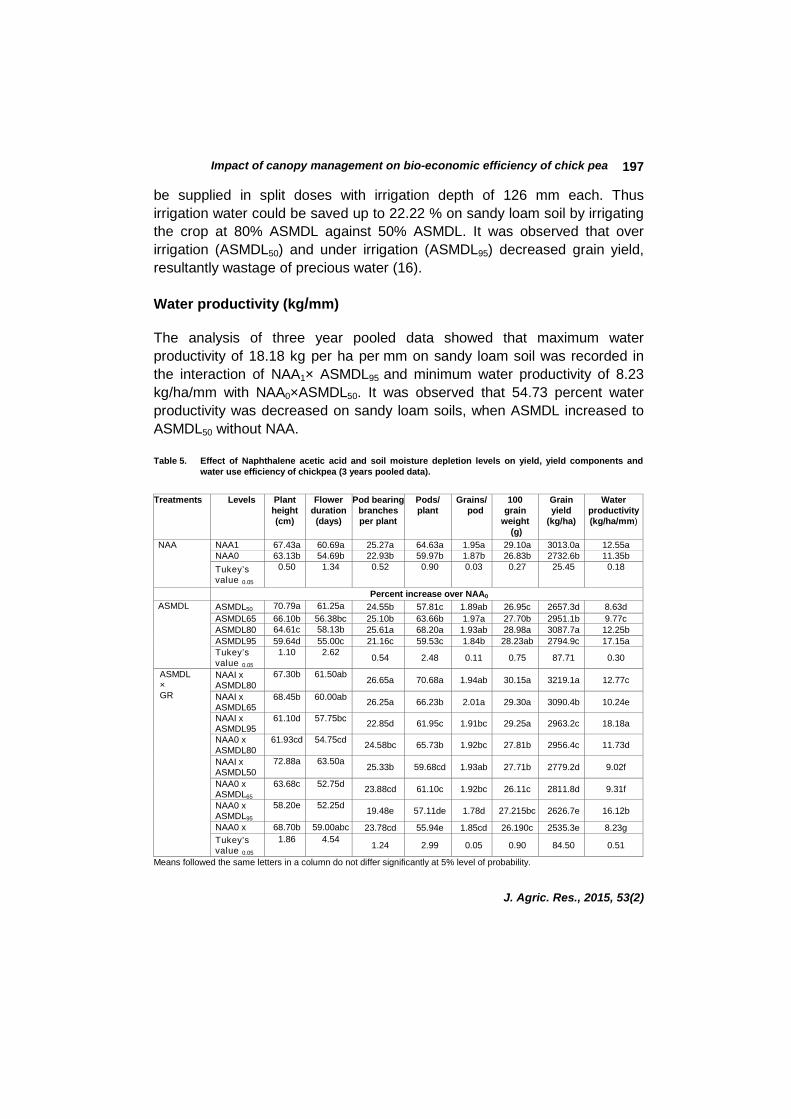
Analysis of variance presented in Table 5 revealed significant differences between NAA and ASMDL for plant height, flower duration and pod bearing branches per plant. Treatment interaction of NAA and ASMDL had significant effects. The interaction between NAA and ASMDL was also significant for these canopy characters. Highest plant height of 72.88 cm was recorded in NAA1× ASMDL50 along with maximum flower duration of 63.50 days. While maximum pod bearing branches were recorded as 26.65 in NAA1 and ASMDL80. Plant height was decreased 2.14% where soil moisture was maintained at 95% without NAA spray with minimum flower duration of 52.25 days, which advocates that flowering was ceased due to water stress
Impact of canopy management on bio-economic efficiency of chick pea
J. Agric. Res., 2015, 53(2)
195
accompanied by less pod formation and hence the less yield. NAA application at flowering stage increased flower duration and pod bearing branches per plant by 10.97 and 9.25% respectively. It might be inferred that NAA might be used on chickpea for extention of flowering period and secondary branches per plant. Similarly maximum branches per plant were obtained where soil moisture was maintained at 80% depletion, thus giving an increase of 21% against 95% ASMDL which shows that plant remained under stress in either case of irrigation at 50% ASMDL or 95% ASMDL. Treatment combination of NAA1 and ASMDL80 depicted maximum branches per plant as 26.65 against minimum of 19.48 in NAA0× ASMDL95. Branches per plant were decreased 26.9 and 10.77% under water stress (NAA0×ASMDL95) and over irrigation (NAA0× ASMDL50) respectively. It might be assessed that treatment combination of NAA1× ASMDL80 are more reliable for better canopy development. The canopy management has a positive impact on yield by reducing lodging, improving light interception, air circulation along with efficient utilization of resources. Yield and yield components The interaction between NAA and ASMDL was also significant for all the parameters (Table 5). The treatment combination NAA1× ASMDL80 showed highest (70.68) pods per plant. However, application of NAA remained on top with average 64.63 pods per plant. The treatment interaction for average number of seeds per pod and 100-seed weight (g) were ranging from 1.78 to 2.01and 26.11 to 30.15, which ultimately increased the grain yield ranging from 2535.3 to 3219.1 kg ha-1. The increase in number of pods per plant, number of seeds per pod, 100-seeds weight and seed yield were 11.50, 6.99, 9.50 and 15.30% respectively with NAA and better than control (NAA0). The ASMDL significantly increased the yield and yield components gaining maximum number of pods per plant (68.20), 100-seeds weight (28.98 g) and grain yield (3087.70 kg/ha) with 80% available soil moisture depletion level (ASMDL80). Plant growth regulator with optimum availability of soil moisture (20%) increased 26.35 and 23.76% number of pods per plant against NAA0× ASMDL50 and NAA0× ASMDL95, respectively (Table 5). This might be due to the reasons that NAA increased flowering and in turn pods per plant. The NAA application at 90 DAS increased pods per plant by 7.8%. Apart from this, over irrigation (ASMDL50) and water stress (ASMDL95) decreased number of pods per plant against ASMDL80 by 15.23 and 12.71%, respectively. Moreover, over irrigation increased the plant height, chances of lodging, flower drop and less pod setting and drought stressed plants were
M. Aslam et al.
J. Agric. Res., 2015, 53(2)
196
unable to draw the solvent for the movement of solutes and the growth ceased. Hassan and Sarkar (16) observed that application of more than 143 mm irrigation water gradually decreased yield and water productivity, causing the wastage of irrigation water. Growth regulator (NAA) with 80% available soil moisture depletion level increased average number of seeds per pod (12.92%) Because, NAA enhanced the cell elongation with more flowers, reduced flower drop and helped in pod setting (1). It is obvious that plant growth regulator showed an increase of 4.27% in number of seeds per pod compared with check. The average number of seeds per plant was increased (7.07%) by the availability of optimum water supply, i.e. ASMDL80 against water stress conditions i.e.ASMDL95.These results agree with those of Gan et al. (13), who concluded that seed yield was 8–19% more at 90% available moisture compared to 50 % available moisture. However, NAA increased hundred seeds weight over (8.46 %) control. An improvement of 7.53% in average 100 seed weight was recorded by optimum soil moisture supply (ASMDL80) against over irrigation (ASMDL50). These results revealed that NAA application alongwith maintenance of optimum soil moisture (NAA1×ASMDL80) in the root zone increased pods per plant (15.12%) against NAA0×ASMDL50. Application of NAA increased pods bearing capacity and other yield components like number of seeds per pod, 100-seed weight and ultimately the grain yield. Application of plant growth regulator with 80% ASMDL increased grain yield 26.97% compare with NAA0×ASMDL50. It might be NAA with optimum supply of soil moisture (ASMDL80) that increased number of pods per plant, seeds per pod, 100-seed weight and yield. Seed yield was increased by 10.26% with the application of plant growth regulator (NAA). It might be inferred that NAA encouraged flower retention and increased pods bearing branches, pods per plant, 100-grain weight and ultimately seed yield. These findings agree with those of Bai et al. (7) and Upadhyay et al. (25) who reported that spray of NAA enhanced the number of pods per plant, pod weight per plant and gave 17.7% higher seed yield over the control. It was observed that seed yield was decreased by 13.94% in ASMDL50 and by 9.48% ASMDL95 and maximum yield was recorded in ASMDL80. Thus irrigation water was saved by 27.42 % with better management.
Irrigation It is depicted from three years pooled data that total supply of 252 mm irrigation water (Table 3) is optimum on sandy loam soil for maximum grain yield and dry matter accumulation (Fig. 2) under arid conditions. Water could
Impact of canopy management on bio-economic efficiency of chick pea
J. Agric. Res., 2015, 53(2)
197
be supplied in split doses with irrigation depth of 126 mm each. Thus irrigation water could be saved up to 22.22 % on sandy loam soil by irrigating the crop at 80% ASMDL against 50% ASMDL. It was observed that over irrigation (ASMDL50) and under irrigation (ASMDL95) decreased grain yield, resultantly wastage of precious water (16). Water productivity (kg/mm) The analysis of three year pooled data showed that maximum water productivity of 18.18 kg per ha per mm on sandy loam soil was recorded in the interaction of NAA1× ASMDL95 and minimum water productivity of 8.23 kg/ha/mm with NAA0×ASMDL50. It was observed that 54.73 percent water productivity was decreased on sandy loam soils, when ASMDL increased to ASMDL50 without NAA. Table 5. Effect of Naphthalene acetic acid and soil moisture depletion levels on yield, yield components and
water use efficiency of chickpea (3 years pooled data).
Treatments Levels Plant
height (cm)
Flower duration (days)
Pod bearing branches per plant
Pods/ plant
Grains/ pod
100 grain
weight (g)
Grain yield
(kg/ha)
Water productivity (kg/ha/mm)
NAA NAA1 67.43a 60.69a 25.27a 64.63a 1.95a 29.10a 3013.0a 12.55a NAA0 63.13b 54.69b 22.93b 59.97b 1.87b 26.83b 2732.6b 11.35b
Tukey’s value 0.05
0.50 1.34 0.52 0.90 0.03 0.27 25.45 0.18
Percent increase over NAA0 ASMDL ASMDL50 70.79a 61.25a 24.55b 57.81c 1.89ab 26.95c 2657.3d 8.63d
ASMDL65 66.10b 56.38bc 25.10b 63.66b 1.97a 27.70b 2951.1b 9.77c ASMDL80 64.61c 58.13b 25.61a 68.20a 1.93ab 28.98a 3087.7a 12.25b ASMDL95 59.64d 55.00c 21.16c 59.53c 1.84b 28.23ab 2794.9c 17.15a Tukey’s value 0.05
1.10 2.62 0.54 2.48 0.11 0.75 87.71 0.30
ASMDL × GR
NAAI x ASMDL80
67.30b 61.50ab 26.65a 70.68a 1.94ab 30.15a 3219.1a 12.77c
NAAI x ASMDL65
68.45b 60.00ab 26.25a 66.23b 2.01a 29.30a 3090.4b 10.24e
NAAI x ASMDL95
61.10d 57.75bc 22.85d 61.95c 1.91bc 29.25a 2963.2c 18.18a
NAA0 x ASMDL80
61.93cd 54.75cd 24.58bc 65.73b 1.92bc 27.81b 2956.4c 11.73d
NAAI x ASMDL50
72.88a 63.50a 25.33b 59.68cd 1.93ab 27.71b 2779.2d 9.02f
NAA0 x ASMDL65
63.68c 52.75d 23.88cd 61.10c 1.92bc 26.11c 2811.8d 9.31f
NAA0 x ASMDL95
58.20e 52.25d 19.48e 57.11de 1.78d 27.215bc 2626.7e 16.12b
NAA0 x ASMDL50
68.70b 59.00abc 23.78cd 55.94e 1.85cd 26.190c 2535.3e 8.23g Tukey’s value 0.05
1.86 4.54 1.24 2.99 0.05 0.90 84.50 0.51
Means followed the same letters in a column do not differ significantly at 5% level of probability.

M. Aslam et al.
J. Agric. Res., 2015, 53(2)
198
Moreover, when irrigation water quantity was increased from ASMDL95 to ASMDL50, water productivity was decreased by 49.68 %. Treatment combination, NAA1×ASMDL80 gave the maximum yield of 3219.1 kg/ha with water productivity of 12.77 kg/ha/mm. Maximum water productivity was recorded when minimum irrigation level (ASMDL95) was maintained (Table 5) and it decreased by 48.78 and 54.73 % with over irrigation (beyond the optimal dose) and no plant growth regulator. Application of irrigation at 50 % ASMDL kept the soil moist throughout the growth period creating suffocation in the rhizosphere and increased the chances of lodging due to which grain yield was decreased depicting less water productivity (8.63 kg ha-1 mm-1). Similarly 95 % ASMDL created the drought conditions adversely affecting the growth. The results agree with earlier findings (8, 26, 13) who stated that water productivity increased as water application declined from maximum to optimum level.
Benefit cost ratio
Return of investment was calculated on the basis of benefit cost ratio (BCR). The analysis of three years pooled data regarding benefit cost ratio (BCR) (Table 6) revealed that different values of BCR were recorded at different ASMDL and growth regulator treatments. Table 6. Three years average economic analysis and BCR as affected by naphthalene acetic acid
and soil moisture depletion levels for chickpea (2007-08 to 2009-10).
Treatment Seed yield
(kg/ha)
Variables cost
(Rs/ha)
Gross income (Rs/ha)
Total Cost (Rs/ha)
Net income (Rs/ha)
BCR
NAA0 × ASMDL50
2535.3 500 56277 16169 39931 3.38
NAA0 × ASMDL65
2811.8 400 62360 16169 42417 3.76
NAA0 × ASMDL80
2956.4 300 65541 16169 45981 3.98
NAA0× ASMDL95
2626.7 200 58287 16169 40635 3.56
NAA1 × ASMDL50
2779.2 700 61542 16169 46399 3.65
NAA1 × ASMDL65
3090.4 600 68489 16169 51437 4.08
NAA1 × ASMDL80
3219.1 500 71320 16169 54737 4.28
NAA1 x ASMDL95
2963.2 400 65690 16169 50359 3.96
Triple Super Phosphate (TSP) @ Rs. 950 per 50 kg during 2007, 1000 during 2008 and 1050 during 2009, Application charges of fertilizer/ha (1 man day) @ 100.00, Hand weeding @ Rs. 1000/ha (10 man days @ Rs. 100/day), Price of seed of Bittle-98 @ Rs. 19/kg during 2007, 22.50 during 2008 and 26 during 2009, Price of Inoculum Packet of 250 g/ha @ Rs. 100 per 250 g Packet., Application charges of Inoculum ha-1 (1/2 man day) @ Rs. 40.00, Income (straw) = Rs. 500/ha, Variables = Water application charges and Growth regulator charges
Impact of canopy management on bio-economic efficiency of chick pea
J. Agric. Res., 2015, 53(2)
199
The highest BCR (4.28) was recorded in the interaction of NAA1×ASMDL80 and lowest (3.38) with NAA0 ×ASMDL50 on sandy loam soil. It was observed that 26.63 % higher BCR was recorded in the interaction of NAA1×ASMDL80 compared with NAA0 × ASMDL50. The increase in BCR in the interaction of NAA1×ASMDL80 was ascribed to complimentary effects of increased nutrient availability and better photosynthetic activities with better utilization of resources resulting in higher grain yield and net benefit to the farmer.
CONCLUSION From the foregoing discussions, it may be concluded that application of NAA with irrigation to chickpea crop at 80 % depletion of available soil moisture increased yield and yield components. Application of 252 mm irrigation water/ rainfall on sandy loam soil is economical under arid conditions with BCR of 4.28. Each irrigation depth must not be increased more than 126 mm to avoid the deep percolation. Therefore, irrigation at 80 % available soil moisture depletion level and application of NAA at 600 ml ha-1, at flowering is best to obtain maximum grain yield of chickpea.
ACKNOWLEDGEMENTS
This Research was funded/ supported by Directorate of Arid Zone Research Institute Bhakkar, Punjab, Pakistan, Gomal University Dera Ismail Khan Khyber Pakhtunkhawa Pakistan, Soil and Water Testing Laboratory, Ayub Agricultural Research Institute, Faisalabad, Punjab, Pakistan
REFERENCES 1. Aslam, M., E. Ahmad, A. G. Sagoo, K. Hussain, M. Ayaz, Inayat Ullah,
A. Hussain and Himayatullah. 2010. Effect of plant growth regular (NAA) and available soil moisture depletions on yield and yield components of chickpea. Sarhad J. Agric 26(4):325-335.
2. Aslam, M., E. A. Khan, Himayatullah, M. Ayaz, H.K. Ahmad. M. Mansoor and K. Hussain. 2010. Effect of available soil moisture depletions and de-topping treatments on yield and yield components of chickpea. Sarhad J. Agric. 26(2):177-186.
3. Aslam, M., H.K. Ahmad, Himayatullah, M. Ayaz, E. Ahmad and M. Arshad, 2008. Effect of available soil moisture depletion levels and topping treatments on crop growth rate and total dry biomass in chickpea. J. Agric. Res. 46(3):229-243.
M. Aslam et al.
J. Agric. Res., 2015, 53(2)
200
4. American Society of Civil Engineers/ASCE. 1978. Describing Irrigation Efficiency and Uniformity. The On-farm Irrigation Committee of the Irrigation and Drainage Division of the ASCE. Proceedings of the ASCE 104, IR 1:35-41.
5. Anon. 2007. Crop location. Bhakkar-sandy loam soil (031◦35- 24.13-N and 071◦08-47.21- E) Google Earth June 6, 2007. August 17, 2007.
6. Anon. 1988. From Agronomic Data to Farmer Recommendations, An Economic Training Manual, CIMMYT, Mexico, P. 5:25-33.
7. Bai, D. I. S., A. T. Abraham and S.T. Mercy. 1987. Hormonal influence of crop performance in green gram. Legume Res. 10 (1):49-52.
8. Basu, P. S. and D. N. Singh. 2003. Physiology and abiotic stresses in chickpea. In Chickpea Research in India M. Ali, S. Kumar and N.B. Singh. (eds). (IIPR,) Kanpur, India. p. 137-166.
9. Bhunia, S. R., 1997. Contribution of production factors in yield, economics and irrigation water saving of chickpea. Adv. in Agric. Res. in India.7: 11-14.
10. Blake, G. R. and K. H. Hartge. 1986. Bulk and particle density. In. A Klute (ed) Methods of soil analysis. Part. Agron. 9, SSSA Madison WI, USA. p 363-382.
11. Ejaz A. K., M. Aslam, H. K. Ahmad, Himayatullah, M. A. Khan and A. Hussain. 2010. Effect of row spacing and seeding rates on growth, yield and yield components of chickpea. Sarhad J. Agric. 26(2):201-211.
12. French, B. K. and B. J. Legg. 1979. Rothamsted irrigation.1964-76. J. Agric. Sci. Camb. 92:15-37.
13. Gan, Y., J. Wang, S. V. Angadi and C.L. McDonald. 2008. Response of chickpea to short period of high temperature and water stress at different developmental stages. Proc. 14thAustr.Agron.Conf.21-25 Sept. 2008.
14. Ghassemi-Golezani, K., M. Movahhedi, F. Rahimzadeh-Khoyi and M. Moghaddam. 1998. Effect of water deficit on growth and yield of two chickpea varieties at different plant densities. Agric. Sci. Tabriz. 7(3-4):17-42.
15. Gupta, R. K. and G. G. Agarwal. 1977. Consumptive use of water by gram and linseed. Indian J. Agric. Sci. 47(1):22-26.
16. Hassan, A.A. and A.A. Sarkar. 1999. Water use and yield relations of chickpea as influenced by different irrigation levels. Thai J. Agric. Sci. 32(3):349-354.
17. Hoffman, G. J., T. A. Howell, and K.H. Solomon. 1990. Management of Farm Irrigation Systems. Amer. Soc. Agric. Engr. ASAE Monograph No. 9. St. Joseph, MI. Pp.1040.
Impact of canopy management on bio-economic efficiency of chick pea
J. Agric. Res., 2015, 53(2)
201
18. Nielson, D. C., 2001. Production functions for chickpea, field pea and lentil in the central great plain. Agron. J. 93:563-569.
19. Penman, H. L. 1970. Woburn irrigation 1960-8.iv Design and interpretation. J. Agric. Sci. Camb., 75: 69-73.
20. Ranjan, R., S. S. Purohit and V. Parsad. 2003. Commercial application of plant growth regulators. In: Plant Hormones: Action and Application. (Eds) Agrobios, India. p.183-208.
21. Sharma, H. C., T. Singh, and D. S. R. Mohan. 1974. Response of gram varieties to irrigation. Haryana Agric. Univ. J. Res. 4 (4):255-260.
22. Singh, D. P. and B. D. Chaudhary. 1998. Drought tolerance in field crops: from understanding to realization: In: Behl, R.K., D. P. Singh, and D. P. Lodhi. (eds) Crop Improvement for Stress Tolerance. CCS Haryana Agric. Uni. Hisar and Max Mullar Bhavan New Dehli, India, p. 33-36.
23. Singh K. S. P., B. K. Singh and S. N. Singh. 1992. Effect of irrigation and inoculation on growth and nodulation in chickpea (Cicer arietinum L.). J. Appld. Biol. 2(1-2):46-49.
24. Steel, R. G. D., J. H. Torrie and D. Dicky. 1997. Principles and Procedures of Statistics. A Biometrical Approach.3rd ed. McGraw Hill Book Co. Inc. New York.
25. Upadhyay, R. G., B. B. Singh, and D. N. Yadav. 1993. Effect of bioregulators on biochemical constituent and yield of chickpea (Cicer arietinum L.).Indian. J. Plant Physiol. 36(3):195-196.
26. Verghis, T. I., B. A. Mckenzie and G. D. Hill. 1999. Effect of light and soil moisture on yield, yield components, and abortion of reproduction structures of chickpea (Cicer arietinum L.) in Canterbury, New Zealand. New Zealand J. Crop & Hort. Sci. 27:153-161.
Received: November 11, 2013 Accepted: October 15, 2014
***