IMPACT OF BRICK KILN OPERATION TO THE DEGRADATION OF …
67
IMPACT OF BRICK KILN OPERATION TO THE DEGRADATION OF SOIL QUALITY OF AGRICULTURAL LAND KAMRUL HASAN DEPARTMENT OFAGROFORESTRY AND ENVIRONMENTAL SCIENCE SHER-E-BANGLA AGRICULTURAL UNIVERSITY, DHAKA-1207 JUNE, 2018
Transcript of IMPACT OF BRICK KILN OPERATION TO THE DEGRADATION OF …

IMPACT OF BRICK KILN OPERATION TO THE DEGRADATION OF
SOIL QUALITY OF AGRICULTURAL LAND
KAMRUL HASAN
DEPARTMENT OFAGROFORESTRY AND ENVIRONMENTAL SCIENCE
SHER-E-BANGLA AGRICULTURAL UNIVERSITY,
DHAKA-1207
JUNE, 2018

IMPACT OF BRICK KILN OPERATION TO THE DEGRADATION OF
SOIL QUALITY OF AGRICULTURAL LAND
A Thesis
Submitted to the Faculty of Agriculture,
Sher-e-Bangla Agricultural University, Dhaka,
in partial fulfillment of the requirements
for the degree of
MASTER OF SCIENCE
IN
AGROFORESTRY AND ENVIRONMENTAL SCIENCE
SEMESTER: JANUARY -JUNE, 2018
Approved by:
Dr. Nazmun Naher Professor
Supervisor
Abdul Halim Assistant Professor
Co-Supervisor
Prof. Dr. Nazmun Naher
Chairman
Examination Committee
BY
KAMRUL HASAN
REGISTRATION NO. 11-04274

DEPARTMENT OF AGROFORESTRY AND ENVIRONMENTAL SCIENCE
Sher-e-Bangla Agricultural
University (SAU) Sher-e-
Bangla Nagar, Dhaka-1207
CERTIFICATE
This is to certify that the thesis entitled “IMPACT OF BRICK KILN OPERATION
TO THE DEGRADATION OF SOIL QUALITY OF AGRICULTURAL LAND”
submitted to the Faculty of Agriculture, Sher-e-Bangla Agricultural University (SAU),
Dhaka in partial fulfillment of the requirements for the degree of MASTER OF
SCIENCE IN AGROFORESTRY AND ENVIRONMENTAL SCIENCE, embodies
the results of a piece of bona fide research work carried out by KAMRUL HASAN,
Registration no. 11-04274 under my supervision and guidance. No part of the thesis has
been submitted for any other degree or diploma.
I further certify that such help or source of information, as has been availed of during the
course of this investigation has duly been acknowledged.
Dr. Nazmun Naher
Professor
Supervisor
Dated: June, 2018 Dhaka, Bangladesh

DEDICATED TO
MY
BELOVED PARENTS

i
ACKNOWLEDGEMENTS
All the praises, gratitude and thanks are due to the omniscient, omnipresent and omnipotent
Allah who enabled me to pursue education in Agriculture discipline and to complete this
thesis for the degree of Master of Science (MS) in Agroforestry and Environmental
Science.
I wish to express my sincere appreciation, profound gratitude and best regards to my
supervisor and Chairman, Prof. Dr. Nazmun Naher, Dept. of Agroforestry and
Environmental Science, Sher-e-Bangla Agricultural University, Dhaka, for her guidance
and supervision in carrying out the research work, continuous inspiration, constructive
comments and encouragement during my research work and guidance in preparation of
manuscript of the thesis. I am grateful to my co-supervisor Abdul Halim, Assistant
Professor, Department of Agroforestry and Environmental Science,SAU. for his valuable
advice, constructive criticism and factual comments in upgrading the research with all
possible help during the research period and preparation of the thesis.
I would like to express my deepest respect and boundless gratitude to my honorable teachers
of the Department of Agroforestry and Environmental Science, Sher-e-Bangla
Agricultural University, Dhaka, for their valuable teaching, sympathetic co-operation
and inspirations throughout the course of this study and research work.
Here I also would like to acknowledge laboratory and field staffs for their active help
during the research period.
I am indebted to my last but not least profound and grateful gratitude to my beloved
parents, friends and all of my relatives for their inspiration, blessing and encouragement
that opened the gate of my higher studies in my life.
The Author
June, 2018
SAU, Dhaka

ii
IMPACT OF BRICK KILN OPERATION TO THE DEGRADATION OF SOIL QUALITY OF AGRICULTURAL LAND
ABSTRACT
Brick kiln is a big environmental issue in terms of agricultural production. The soil of brick kiln less productive compare to soil far from brick kiln. The aim of the study is to assess the impact of brick kiln operation for soil quality degradation in different area of Kurigram. The study was conducted with 24 soil samples collected from six brick kiln and adjacent agricultural field at Kurigram district. The study reveals that brick kiln industrial activity affected the soil characteristics and degraded soil quality. The results indicated that burning of soils significantly decreased the average pH values of soils both in surface and subsurface soil. The Organic matter content of the samples recorded from 0.250 to 0.920 in the burnt soil and from 0.290 to 1.055 in the unburnt soil for surface soil and for subsurface soil 0.210 to 0.740 and 0.206 to 0.705 in burnt and unburnt soil respectively. The total N content in the surface soil ranged from 0.023 to 0.100% and 0.029 to 0.123% in the burnt and unburnt soil, respectively. In case of subsurface soil, the nitrogen content in burnt and unburnt soil ranged from 0.020% to 0.068% and 0.023% to 0.073% respectively. The available P content of the samples in surface soil were within the range of 9.85 to 10.10 ppm in the burnt soil and of 17.40 to 21.90 ppm in the unburnt soil. In subsurface soil the range were from 8.60 to 13.10 for burnt soil and from 11.00 to 19.00 ppm for unburnt soil. The level of exchangeable potassium content in burnt soil ranged from 0.092 to 0.363 meq100g-1 in surface soil and 0.083 to 0.113 meq100g-1 in subsurface soil. In case of unburnt soil near the brick field the range is from 0.190 to 0.518 meq100g-1 in the surface soil and from 0.102 to 0.412 meq100g-1 in subsurface soil. The EC of burnt soil were ranged from 9.8 to 32.2 dsm-1 for surface soil and from 5.3 to 13.2 dsm-1 for subsurface soil. For the unburnt soil near brick field were from 13.4 to 36.1 dsm-1 for surface soil and from 8.5 to 24.6 dsm-1 for subsurface soil. All the chemical properties of soil decreased in burnt soil of brick kiln than the unburnt agricultural field. The chemical properties also decreased with increasing depth. The study reaves that brick burning near agricultural field is detrimental for soil fertility. The burning of enormous C, N and S not only degrade the agricultural soils but also contributing to the changes in the global climate.

iii
LIST OF CONTENTS
CHAPTER TITLE PAGE
NO.
ACKNOWLEDGEMENTS i
ABSTRACT ii
LIST OF CONTENTS iii
LIST OF TABLES v
LIST OF FIGURES vi
LIST OF PLATES Vii
LIST OF ABBREVIATIONS AND ACRONYMS viii
LIST OF APPENDICES ix1 INTRODUCTION 1-3
2 REVIEW OF LITERATURE 4-13
2.1 Chemical properties and nutrient status of burnt and
unburnt soil
4
2.2 Heavy metal concentration in soils 9
2.3 Environmental impact of Brick kiln operation 10
3 MATERIALS AND METHODS 14-23
3.1 Study area 14
3.1.1 Site Selection 14
3.1.2 Location 14
3.2 Abiotic characteristics 16
3.2.1 Climate 16
3.2.2 Characteristics of soil 17
3.3 Biotic characteristics 17
3.3.1 Characteristics of vegetation 17
3.4 Sampling Period 17
iv
LIST OF CONTENTS (Contd.)
CHAPTER TITLE PAGE NO.
3.5 Sampling design 18
3.6 Sample Collection 18
3.7 Sample Preparation 21
3.8 Soil Sample Analysis 21
3.8.1 Textural class 21
3.8.2 Soil PH 21
3.8.3 Soil Organic matter (OM) content 22
3.8.4 Determination of Nitrogen (N) in soil sample 22
3.8.5 Determination of Phosphorus (P) in soil sample 22
3.8.6 Determination of Potassium (K) in soil sample 23
3.8.7 Electrical Conductivity (EC) 23
3.8.8 Zinc (Zn) and Cupper (Cu) determination 23
3.9 Statistical Analysis 23
4 RESULTS AND DISCUSSION 24-41
4.1 Soil pH 24
4.2 Organic matter (OM) 27
4.3 Nitrogen contents (N) 29
4.4 Phosphorus availability (P) 31
4.5 Exchangeable potassium (K) 33
4.6 Electrical conductivity (EC) 35
4.7 Available Copper (Cu) 37
4.8 Available Zinc (Zn) 39
5 SUMMARY AND CONCLUSION 41-45
6 REFERENCES 46-50
APPENDIX 51-54
v
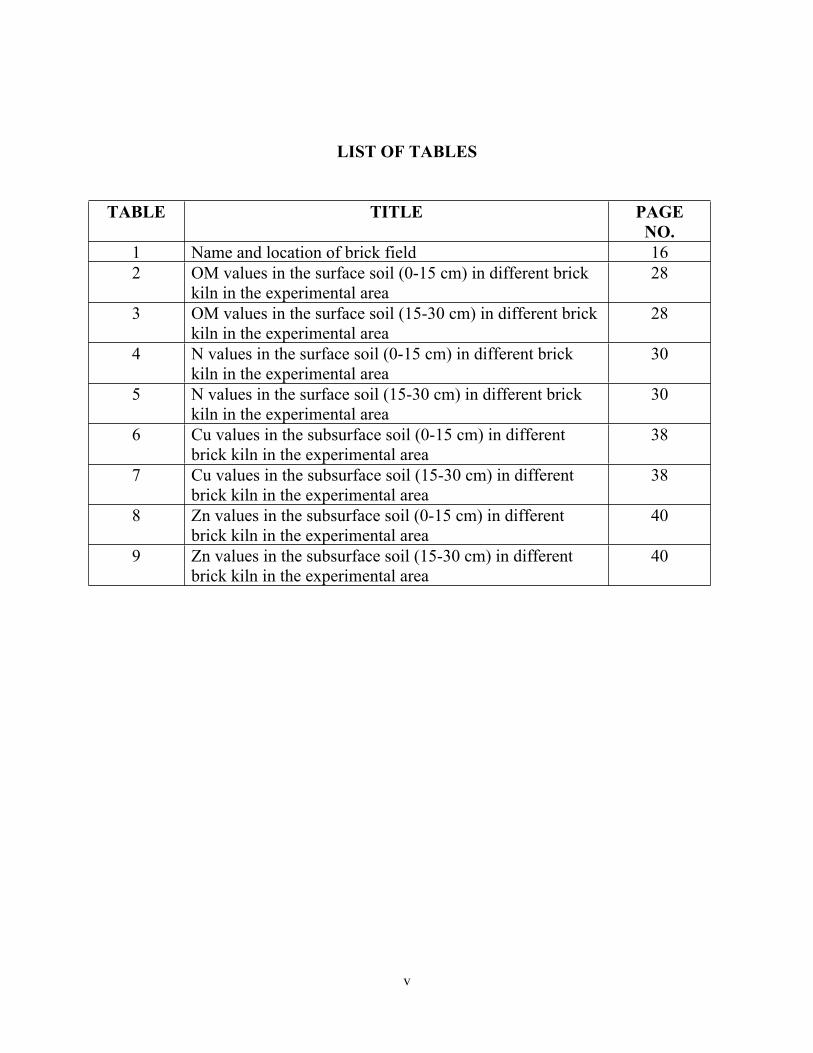
LIST OF TABLES
TABLE TITLE PAGENO.
1 Name and location of brick field 162 OM values in the surface soil (0-15 cm) in different brick
kiln in the experimental area28
3 OM values in the surface soil (15-30 cm) in different brick kiln in the experimental area
28
4 N values in the surface soil (0-15 cm) in different brick kiln in the experimental area
30
5 N values in the surface soil (15-30 cm) in different brick kiln in the experimental area
30
6 Cu values in the subsurface soil (0-15 cm) in different brick kiln in the experimental area
38
7 Cu values in the subsurface soil (15-30 cm) in different brick kiln in the experimental area
38
8 Zn values in the subsurface soil (0-15 cm) in different brick kiln in the experimental area
40
9 Zn values in the subsurface soil (15-30 cm) in different brick kiln in the experimental area
40

vi
LIST OF FIGURES
FIGURE TITLE PAGENO.
1 A schematic map of study site and sample collation point in the Kurigram district in Bangladesh
15
2 pH values in the surface soil (0-15 cm) in different brick kiln in the experimental area
25
3 pH values in the surface soil (15-30 cm) in different brick kiln in the area
26
4 P values in the surface soil (0-15 cm) in different brick kiln in the experimental area
32
5 P values in the surface soil (15-30 cm) in different brick kiln in the experimental area
32
6 K values in the surface soil (0-15 cm) in different brick kiln in the experimental area
34
7 K values in the surface soil (15-30 cm) in different brick kiln in the experimental area
34
8 EC values in the surface soil (0-15 cm) in different brick kiln in the experimental area
36
9 EC values in the surface soil (15-30 cm) in different brick kiln in the experimental area
36

vii
LIST OF PLATES
PLATE TITLE PAGENO.
1 Plate a, b, c, d showing the overview of a brick field and soil collection from the brick kiln and adjacent field
19
2 Plate e, f, g, h showing soil collection in unburnt agricultural field near the brick kiln
20

viii
LIST OF APPENDICES
APPENDIX TITLE PAGENO.
I pH values in the surface soil (0-15 cm) in different brick kiln in the experimental area
51
II pH values in the surface soil (15-30 cm) in different brick kiln in the experimental area
51
III P values in the surface soil (0-15 cm) in different brick kiln in the experimental area
52
IV P values in the surface soil (15-30 cm) in different brick kiln in the experimental area
52
V K values in the surface soil (0-15 cm) in different brick kiln in the experimental area
53
VI K values in the subsurface soil (15-30 cm) in different brick kiln in the experimental area
53
VII EC values in the surface soil (0-15 cm) in different brick kiln in the experimental area
54
VIII EC values in the subsurface soil (15-30 cm) in different brick kiln in the experimental area
54

ix
LIST OF ABBREVIATION AND ACRONYMS
AEZ Agro-Ecological Zone
OM Organic matter
Burnt soil Soil collected from the brick kiln
Unburnt soil Soil collected from the agricultural field far from brick kiln
EC Electrical conductivity
pH Potential of Hydrogen
N Nitrogen
P Phosphorus
K Potassium
ha Hector
µ Average
cm Centimeter
m meter
% Percent
0C Degree Celsius
FAO Food and Agriculture Organization
PM Parts Per Million

1
CHAPTER I
INTRODUCTION
Urbanization and industrialization in developing countries has created a demand for
construction activities, which resulted in the fast growth of the brick-making industry. The
brick industry is considered a small/cottage industry and there is only seasonal employment
opportunity despite an enormous amount of investment (GEFONT, 2007). In conjunction
with the urbanization, brick industries are rapidly increasing and migrations of people into
the city areas pressurize to produce more brick. As a result, more and more brick kilns are
being built. Bricks are the most important building material in housing development and
are used as basic construction material in vogue of urbanization. The removal of topsoil
for urban uses mainly for brick-making is growing rapidly due to the tremendous growth
in urbanization and industrialization in many developing countries. Unfortunately, brick
kilns are mostly situated on fertile agricultural land, as brick manufacturers need silty clay
loam to silty clay soils with good drainage conditions (Mukherjee et al., 2013).
Bangladesh’s population growth and increasing affluence have contributed to increased
construction and demand for building materials. Though bricks are the main construction
material in Bangladesh, their production, mostly in the form of widely dispersed single
small kilns, contribute substantially to poor air quality and poor community health
(Brunekreef and Holgate, 2002; Cohen et al., 2005; Guttikunda et al., 2013; Ostro, 2004
and Pope et al., 2002). During the dry season when they operate (normally November to
April) contribute an estimated 40% of the 2.5 micron particulate matter (PM2.5) in the air
in Dhaka and throughout Bangladesh (Guttikunda et al., 2013 and Hossain et al., 2007).
Statistical modeling suggests that the air pollution generated by brick kilns results in
between 530 and 5000 premature adult deaths annually in Dhaka alone (Croitoru and
Sarraf, 2012 and Guttikunda and Khaliquzzaman, 2014).

2
In addition to air quality problems, brick production impacts agricultural production by
utilizing fertile topsoil from agricultural lands (Brunel et al., 2011 and Kathuria and
Balasubramanian, 2013) and releasing toxins, including heavy metals, that influence
agricultural productivity (Skinder et al., 2014) and threaten food security (Lal, 2013).
Topsoil, the upper surface of the earth's crust, is a naturally deposited material that mixes
rich humus with minerals and composted material. It is one of the earth's most vital
resources, because it contains all the essential chemical, physical and biological
components for growing plants (Tucker et al., 1995 and Rai et al., 2009). It represents a
delicate nutritional balance that provides food for many of the animals on earth, either
directly in the form of plant material or indirectly in the form of products from animals that
eat plants (Rai et al., 2009). But topsoil degradation and environmental pollution are the
most serious problems in the world today as a result of natural or anthropogenic factors,
because of their adverse effects on agriculture and the life on earth (Eswaran et al., 1999
and Khan et al., 2007).
Brick burning is one of the principal agents of topsoil degradation (Rahman and Khan,
2001). The brick kiln operation over the years covers not only the neighboring area of
vegetation with layers of brick dust, but also consistently dissipates heat all around. It alters
the physicochemical properties and habitats of nearby soil by destroying the topsoil
nutrient elements (macronutrients such as C, H, O, N, P, K, Ca, Mg and S, and
micronutrients such as B, Cu, Fe, Mn, Mo and Zn) and soil biota (Gupta and Narayan, 2010
and Imtiaz et al., 2010). Moreover, emission of gaseous pollutants and ash significantly
affect the human health and vegetation (Gupta and Narayan, 2010). Brick kilns also have
adverse effects on biodiversity and biogeo-chemical cycling (Khan et al., 2007).

3
Brick kilns are destroying large area of land every year especially in Bangladesh where
bricks are made by collecting topsoil from agricultural land. It increased into 5000 ha
during the 1998 to 1999 period in different pockets of brick fields (Rahman and Khan,
2001). These affected areas are expanding rapidly due to the increase in brick production
(IUSS, 2002). There are about 6,000 brick manufacturers in Bangladesh which produce
about 18 billion pieces of brick a year. Many of them do not have proper license and the
local government authorities do not have necessary resources to keep track of the fields
(Rahman, 2012). The urbanization and the demand of brick manufacturing have resulted
in change of the land used pattern from the good agricultural land turned into agriculturally
unproductive lands around several growing cities of the developing world (Kathuria, 2007).
Indigenous soil knowledge, concerns about environmental quality, wisdom and economic
uses of soils are, therefore, very essential for long-term protection of soil resources
(Warkentin, 2002 and Ekosse et al., 2006). The objective of the study was, especially on
soil nutrient status of agricultural land around the brick field area.
Objectives
1. To determine the different chemical properties of the sample soil and
2. To ascertain and examine the land quality degradation through brick field in the
study area.
4
CHAPTER II
REVIEW OF LITERATURE
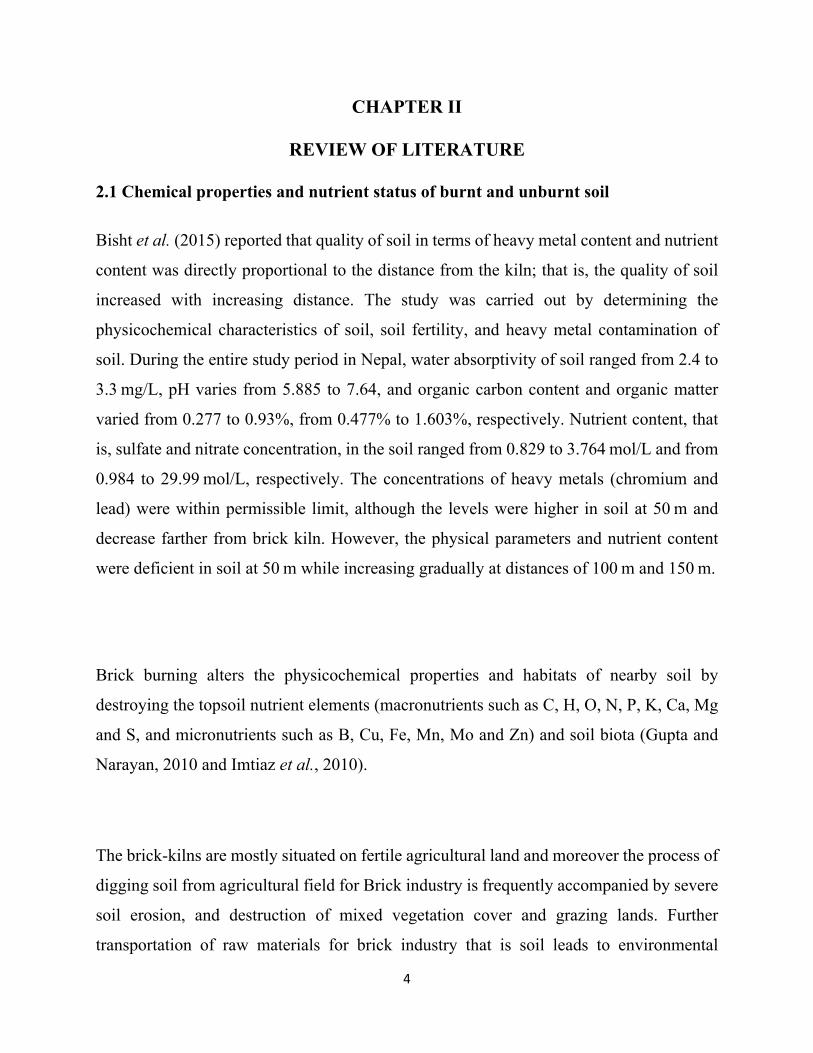
2.1 Chemical properties and nutrient status of burnt and unburnt soil
Bisht et al. (2015) reported that quality of soil in terms of heavy metal content and nutrient
content was directly proportional to the distance from the kiln; that is, the quality of soil
increased with increasing distance. The study was carried out by determining the
physicochemical characteristics of soil, soil fertility, and heavy metal contamination of
soil. During the entire study period in Nepal, water absorptivity of soil ranged from 2.4 to
3.3 mg/L, pH varies from 5.885 to 7.64, and organic carbon content and organic matter
varied from 0.277 to 0.93%, from 0.477% to 1.603%, respectively. Nutrient content, that
is, sulfate and nitrate concentration, in the soil ranged from 0.829 to 3.764 mol/L and from
0.984 to 29.99 mol/L, respectively. The concentrations of heavy metals (chromium and
lead) were within permissible limit, although the levels were higher in soil at 50 m and
decrease farther from brick kiln. However, the physical parameters and nutrient content
were deficient in soil at 50 m while increasing gradually at distances of 100 m and 150 m.
Brick burning alters the physicochemical properties and habitats of nearby soil by
destroying the topsoil nutrient elements (macronutrients such as C, H, O, N, P, K, Ca, Mg
and S, and micronutrients such as B, Cu, Fe, Mn, Mo and Zn) and soil biota (Gupta and
Narayan, 2010 and Imtiaz et al., 2010).
The brick-kilns are mostly situated on fertile agricultural land and moreover the process of
digging soil from agricultural field for Brick industry is frequently accompanied by severe
soil erosion, and destruction of mixed vegetation cover and grazing lands. Further
transportation of raw materials for brick industry that is soil leads to environmental

5
pollution by mixing of dust particles in the atmosphere along with CO2 accumulation
during burning of fresh bricks was stated by Jerin et al. 2017.
Biswas et al. (2018) revealed that 40–80% reduction in crop production and 40–70%
reduction in income due to soil removal. The loss of the soil reduces agricultural yields
leading to both short-term and longer-term impacts on crop production that influence the
country’s food security. Soil degradation is an important threat to sustainable agriculture.
In Bangladesh, brick production contributes to soil loss as the country relies on clay-rich
soil for brick making. An in-depth understanding of why farmers sell soil and the
corresponding impacts on agricultural productivity is critical for developing and
implementing new policies for utilizing alternate materials and methods in Bangladesh
and other areas that continue to rely on fired clay bricks as their primary building
material. A team of anthropologists conducted 120 structured interviews and 20 in-depth
interviews in two different geographical areas in Bangladesh to understand the incentives
for and impacts of selling soil. The primary reason farmers sold soil was pressure from
neighboring farmers who had previously sold soil. Once neighboring property owners
had sold soil, then farmers felt they needed to sell their soil to level their land with the
neighboring plot to avoid future production loss. Short-term monetary gain from selling
soil was also a strong motivator helping farmers manage acute financial crises. In
addition, farmers are frequently compelled to sell soil for brick making because of
coercive practices by brick-owners and their soil brokers.
A study was conducted to evaluate the changes in soil properties due to the impacts of brick
kiln in the vicinity of the Kirtonkhola River, Barisal. During the entire study period,
moisture content of soil ranged from 18.77% to 56.49%; bulk density and particle density
varies from 0.23 - 0.53 g/cm3 and 1.11 - 3.15 g/cm3 , respectively; soil porosity varies
from 60.36% to 88.14%; pH varies from 6.98 to 8.85 and organic carbon content varies
from 0.22% to 1.4%.The pH of the soil decreased with increasing distance from the kiln;
moisture content and organic carbon increased with distance; particle density was more or

6
less in ideal condition for plant growth but bulk density and porosity indicates poor soil
structure which is unfavorable for plant (Rajonee et al., 2018).
The agricultural production in the soil close to the brick kiln was lesser than the same soil
far from brick kiln. The Electrical Conductance (EC) was found almost double in the soil
samples close to the brick field than the soil samples far from brick field. The organic
matter content in the soil sample close to the brickfield was significantly lower than that of
the far soil sample. The mean values of total N, available P and S were also significantly
lower in the soil samples close to the brick kiln, 0.05%, 12.4, and 8.36 ppm respectively in
the close soils, while 0.06%, 24.6, and 11.7 ppm respectively in the far soil. There were no
significant changes observed in the other elements. The study was conducted to assess the
impact of brick kiln operation to Bangladesh, during the period of July to December 2013
by Islam et al. (2017).
Kathuria (2007) stated that unfortunately, brick kilns are mostly situated on fertile
agricultural land, as brick manufacturers need silty clay loam to silty clay soils with good
drainage conditions. The urbanization and the demand of brick manufacturing have
resulted in change of the land used pattern from the good agricultural land turned into
agriculturally unproductive lands around several growing cities of the developing world
The agricultural production in the soil close to the brick kiln was lesser than the same soil
far from brick kiln. The Electrical Conductance (EC) was found almost double in the soil
samples close to the brick field than the soil samples far from brick field. The organic
matter content in the soil sample close to the brickfield was significantly lower than that of
the far soil sample. The mean values of total N, available P and S were also significantly
lower in the soil samples close to the brick kiln, 0.05%, 12.4, and 8.36 ppm respectively in
7
the close soils, while 0.06%, 24.6, and 11.7 ppm respectively in the far soil. There were no
significant changes observed in the other elements. These study was conducted at Singair
of Kalihati upazila in Tangail, Bangladesh, during the period of July to December 2013 by
Rahman et al. (2015).
Gupta et al. (2010) found that the working brick kiln site, which experienced exposure to
industrial activity for short term, showed highest total plant biomass (349-812g m -2), and
higher mean soil organic C (0.77%), total N (0.05%) and moisture content (2.75% in
summer). In contrast, the abandoned brick kiln site, which witnessed long-term
disturbance, had highest belowground biomass (179- 253g m -2) with relatively poor soil
resources (mean soil organic C (0.20%), total N (0.05%)). Belowground biomass of plant
communities significantly declined with increasing soil organic C and total N. Higher
species diversity was found at sites with low as well as high plant biomass. Thus, this study
revealed that long-term brick kiln industrial activity affected the soil characteristics, and
concomitantly the structure of plant biomass (particularly the belowground), and species
diversity. Brick kiln sites in an Indian dry tropical peri-urban region, differing in the period
of exposure to industrial activity and distance from the brick baking center, were
investigated seasonally for their impact on plant biomass (aboveground and belowground),
diversity structure and soils. A total of 72 angiospermic plant species distributed over 25
families were recorded across different sites and seasons.
A study was conducted with the selected soil profile of burnt (soil around brick kilns) and
unburnt (agricultural land) soils in the Dinajpur, Rangpur, Rajshahi, Khulna and Patuakhali
districts to evaluate the effects of brick kilns on soil degradation and environmental
pollution by Khan et al. (2007). They found that The pH values of the unburnt soils
increased as a function of the soil depth for Rangpur, Khulna and Patuakhali, while
decreased for the soil profiles in Dinajpur. Burning of soils significantly (p<0.05)

8
decreased the average pH values of soils by 0.4 pH units (7 % increase over average content
= IOAC), but strikingly increased the average EC values from 0.26 to 1.77 mS/cm (592 %
IOAC) and the effect was pronounced with the depth function. The average sand content
of the soil profiles increased by 330%, while the silt and clay contents decreased by 49 and
40 %, respectively. The average losses arising from the burning of agricultural soils were
amounted to 63% for organic matter, 56 to 86 % and 23 to 88 % for available and total N,
P, K and S, respectively. This huge loss through the burning of 1 m deep soil profile, i.e.
almost 3/4th of the deterioration of soil fertility is not only reducing the crop production
but also polluting the associated environment and atmosphere. The burning of enormous
C, N and S not only degrade the agricultural soils but also contributing to the changes in
the global climate.
Das et al. (2015) stated that the land degradation scenario in terms of environmental cost
of brick manufacturing is much higher than the economic returns readily available. The
study has been undertaken to assess impact of brick making on the degradation of land in
Khejuri where about 25- brick kilns and 23- tile fields have been developed during last 10-
15 years along the adjacent location of Hijli River, Rasulpur River and tidal channels.
Jerin et al. (2016) surveyed with the questionnaire and found out Crop loss, decreased soil
fertility and subsequent reductions in crop production. Trees around brickfields were
dusted badly and water quality of nearby water bodies deteriorated because of emerged
dust and ash from brickfields. Noticeable negative impacts on aquaculture were found. This
study investigated environmental and socio-economic impacts of brickfields at Bagatipara
Upazila of Natore district,

9
2.2 Heavy metal concentration in soils
The effect of brickworks emissions on heavy metal content of soil and plants around the
brick kiln chimneys was studied in the year 2006 by Ismail et al. (2012). Two brick kilns
(A and B) about 600 m away from Ring Road at Sufaid Dheri on southern side of Ring
Road Peshawar were selected for this study. Cd and Cr concentration in plants for Brick
kiln A and B respectively were (2.03 and 1.9, 5.76 and 3.5 mg kg-1). Concentration of
heavy metals in soil (AB-DTPA extractable Cd, Cr for Brick kiln A and B respectively
were (0.03 and 0.41, 0.10 and 0.08 mg kg-1). High load of dust with 23.8 to 46.0 g m-2
month-1 at 50 m distance indicated higher pollution near the brick kiln chimneys. Heavy
metals in the dust samples showed that Cd and Cr are added into environment with a rate
of 0.08 and 0.52 mg m -2 month-1, respectively at 50 m distance from brick kiln chimney.
Achakzai et al. (2017) studied heavy metals present in agricultural soil adjacent to
functional Brick Kilns in Rawalpindi and found out that the concentrations of all studied
metals were above the permissible limits especially at agriculture soil located adjacent to
brick kilns. However, at few sites the concentrations were found below the permissible
limits. The results of study showed that brick kilns have great potential of deteriorating the
quality of environment so, it is recommended that the monitoring of soil and plants around
brick kilns should be carried out on regular basis in order to develop control measures to
prevent the impacts of heavy metals pollution.
2.3 Environmental impact of Brick kiln operation
Jerin et al. (2016) run a questionnaire survey at selected community members living at or
near brick field areas with the aim to assess impacts of brick fields on air, water, soil,
vegetation as well as socio-economic conditions. Trees around brickfields were dusted
badly and water quality of nearby water bodies deteriorated because of emerged dust and
ash from brickfields. Noticeable negative impacts on aquaculture were found. Except few,

10
a majority of the respondents were suffering from various diseases like eye irritation, skin
diseases, and respiratory problems. Despite creating work opportunities for local people,
brick fields of the study area adversely affected the environment and social economy.
The oxidation of pyrite (FeS2) takes place in a stepwise approach with an initial release of
SO2 around 450°C from brick making raw material with an additional increase in
temperature and the subsequent emission of sulfates occurs as SO2 (Banerjee et al., 1980
and Junge, 1992 and Sanders, 1995).
Skinder et al. (2014) said in their studies that Brick manufacturing is the fastest-growing
industrial sector in many countries (like china, India, Bangladesh and Pakistan) and among
the top three sectors, along with vehicle exhaust and resuspended road dust, contributing
to the air pollution and health problems in Dhaka (Bangladesh). The total emissions from
the brick manufacturing in the Greater Dhaka region, to produce 3.5 billion bricks per year
has been estimated about 23,300 tons of particulate matter having aerodynamic diameter <
2.5 μm (PM2.5), 15,500 tons of sulfur dioxide (SO2), 302,000 tons of carbon monoxide
(CO), 6,000 tons of black carbon (BC) and 1.8 million tons of carbon dioxide (CO2).
Emission of individual air pollutant from brick kilns varied significantly during a firing
batch (seven days) and between kilns. Average emission factors per 1,000 bricks were 6.35
to 12.3 kg of CO, 0.52 to 5.9 kg of SO2 and 0.64 to 1.4 kg of particulate matter (PM).
Presently sulphur dioxide (SO2), oxides of nitrogen (NOx) and suspended particulate
matter (SPM) are the main issue pertaining to air pollution problems in developing
countries, where it contributes both to urban pollution and to regional acid depositions.
Skinder et al. (2014) studied and revealed that all the pollutants SOx, NOx , RSPM,
NRSPM and SPM (sum of RSPM and NRSPM) were crossing the limits prescribed by
National Ambient Air Quality Standards (NAAQS) during the operational phase of brick
11
kilns. Further, the air quality index (AQI) was calculated and the study sites were
categorized from severe to high pollution including residential areas which is of most
concern in respect to health conditions of the local people. Inter correlations of SOx, NOx,
RSPM, NRSPM and SPM showing very strong correlations (p < 0.01) with each other
indicated that their sources are the same i.e. brick kilns. This is the first type of study that
has been undertaken where mushrooming of brick kilns (more than 15 brick kilns just in 2
km diameter) is deteriorating the air quality. Although industrialization is very important
for the development of a country, this is a bitter fact that it speeds up the process of
environmental degradation as was observed at the Panzan village of district Budgam in
Jammu and Kashmir state (India).
Monga et al. (2012) found that mean respirable dust exposure in firing section was the
highest (19.51 mg/m3 ) while mean respirable dust exposure in mixing and molding section
was the lowest (10.08 mg/m3 ). The objective of this cross-sectional study was to
investigate the prevalence and determinants of respiratory symptoms and their association
with occupational dust exposure among the brick kiln workers. Brick kiln workers are
exposed to dust particles and are susceptible to multiple pulmonary complications.
Problems like asthma, chronic obstructive pulmonary symptoms, and silicosis are more
common among them. As brick kiln industry is an unorganized sector, so it was decided to
evaluate the respiratory symptoms and lung capacities in these workers and compare them
with controls.
Air pollution has local as well as global impacts. Both living and non-living organism are
facing the adverse effect of pollution. Plant health is affected by air pollution because
pollutants like fluorine, lead, and mercury damage the plants. Acid rain, fog formation,
bio-diversity loss etc. are the negative impacts for air pollution in environment.
Industrialization is the major reason for acid rain because industries emits sulphur dioxide

12
and oxides of nitrogen, which combines with water vapour in the atmosphere and forms
mild acids. When it comes to the earth as rain, we call it acid rain. It causes extensive
damage to plant lives, buildings and contaminate of lakes and rivers (EPA, 2012).
Fog is another phenomenon whose effect can extend to nearby areas. Due to air pollution,
ratio of fog formation is accelerating. This fog can damage normal transportation systems,
reduce the growth of crops due to decrease of sunlight. Bio-diversity of different areas can
degrade due to air pollution because all these chemical components are affects the
organisms (WHO, 2011).
As we understand that brick kilns are one of the major sources for air pollution. So, as
environmental rules, brick kilns should not be set up on arable lands and minimum three
kilometers distance away from any housing area, reserve forest, and educational institution.
However, no rule is maintaining for setup brick kilns. As a result brick kilns produces black
smoke which ultimately move away the species which are involved pollination process.
This ultimately declines the agricultural and farming production (Islam, 2012).
The effects of brick kilns have both long term and short-term impacts in the environment.
In short term the vegetation process hampers, crops production decreases, plants fruits falls
down etc. and long term impacts are ozone depletions, global warming, photochemical
smog’s, land fertility decreases, ground water level down etc. (Pokhrel and Lee, 2011).
For the brick production, top soil is removed from the land and it takes between 25 to 30
years for those lands to be fertile as earlier. The period can be longer if vast quantities of
toxic wastes such as in the form of carbon monoxide and sulphur oxide will mix into the

13
land. On average each kiln burn 350 tons of woods a year, so more kilns means having a
devastating effect on the forests (Morley, 2012).
Brick kiln removes on an average of 1500 MT of soil per ropani (0.05 ha) per year. Burning
soil decreases the soil pH making it acidic, increase sand and decrease the clay content. It
has serious impacts on soil physical, biological, and chemical properties resulting sharp
declination in soil fertility and productivity. Moreover, it removes organic matters and
makes the soil incapable for crop cultivation. Local farmers have already experienced that,
their visibility reduced for brick kilns pollution. For saving their life, they wanted to stop
the brick kilns or adapt scientific technologies to the brick kilns to reduce pollution. 80%
of them had strong view to adopt new technology as soon as possible for reduce pollution.
Some of the respondents told us that, for the old pattern of brick kilns human were suffering
more than modern brick kilns area. They also shared us that along with their health
problem, they were facing less food production, shortage of ground water; all types of
plants nearby brick kilns were in exhausted condition. So, it is clear from people perception
that people living nearby brick kilns are suffering more and they feel the adverse effect of
air pollution.

14
CHAPTER III
MATERIALS AND METHODS
3.1 Study area
3.1.1 Site Selection
The selection of the brick kilns was based on the production capacity and nearness to
agricultural lands based on the fact that the study comprised of determination of
contamination in cropped land.
3.1.2 Location
This study was conducted at Ulipur, Kurigram and Rajarhut upazila in Kurigram district,
during the period from July, 2018 to November, 2018. The study area was situated at 25°23'
and 26°14' north latitudes and in between 89°27' and 89°54' east longitudes at an altitude
of 38 meter above the sea level (Bangladesh Population Census 2001). The population is
2,069,273 (2011 national population census). This district is surrounded by Cooch Behar
district of India in the north, Gaibandha district of Bangladesh in the south, Assam state of
India in the east and, Lalmonirhat and Rangpur districts of Bangladesh in the west. There
are 11 upazilas and 72 unions and 1872 villages in Kurigram. The study was carried out to
estimate the soil degradation at 6 different brick kiln.

15
Figure 1. A schematic map of study site and sample collation point in the Kurigram district in
Bangladesh
16
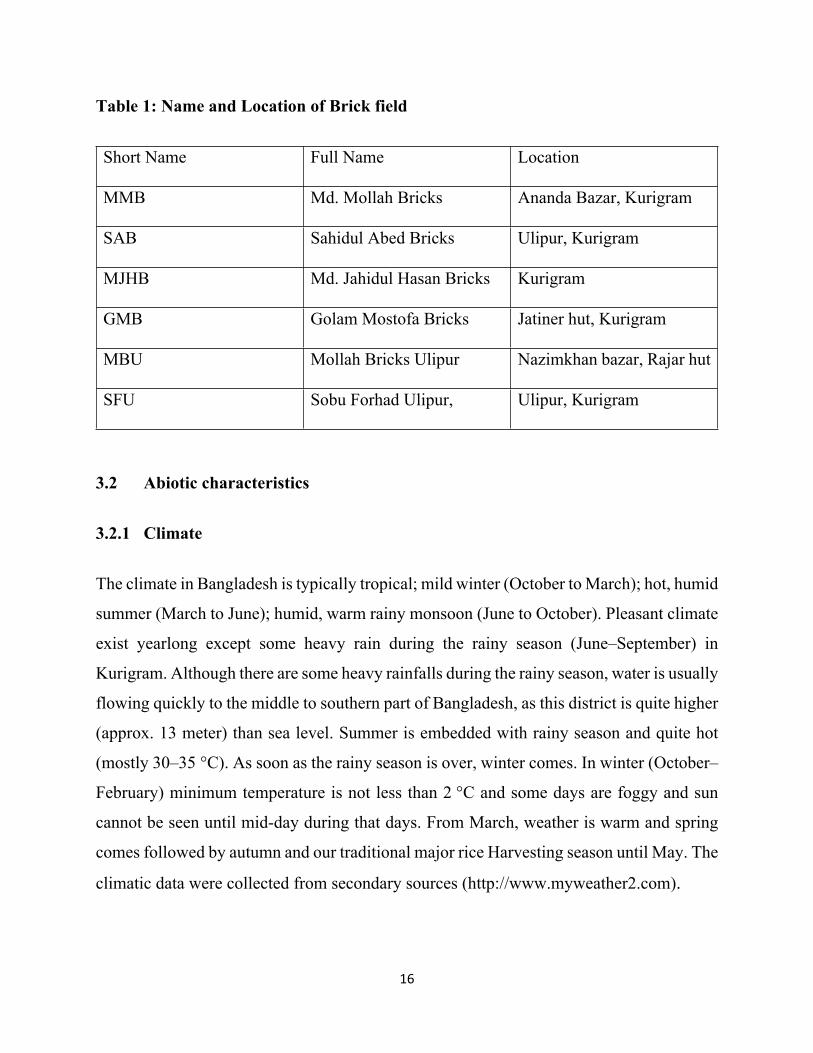
Table 1: Name and Location of Brick field
Short Name Full Name Location
MMB Md. Mollah Bricks Ananda Bazar, Kurigram
SAB Sahidul Abed Bricks Ulipur, Kurigram
MJHB Md. Jahidul Hasan Bricks Kurigram
GMB Golam Mostofa Bricks Jatiner hut, Kurigram
MBU Mollah Bricks Ulipur Nazimkhan bazar, Rajar hut
SFU Sobu Forhad Ulipur, Ulipur, Kurigram
3.2 Abiotic characteristics
3.2.1 Climate
The climate in Bangladesh is typically tropical; mild winter (October to March); hot, humid
summer (March to June); humid, warm rainy monsoon (June to October). Pleasant climate
exist yearlong except some heavy rain during the rainy season (June–September) in
Kurigram. Although there are some heavy rainfalls during the rainy season, water is usually
flowing quickly to the middle to southern part of Bangladesh, as this district is quite higher
(approx. 13 meter) than sea level. Summer is embedded with rainy season and quite hot
(mostly 30–35 °C). As soon as the rainy season is over, winter comes. In winter (October–
February) minimum temperature is not less than 2 °C and some days are foggy and sun
cannot be seen until mid-day during that days. From March, weather is warm and spring
comes followed by autumn and our traditional major rice Harvesting season until May. The
climatic data were collected from secondary sources (http://www.myweather2.com).

17
3.2.2 Characteristics of soil
The soil of the experimental site is a medium high land belongs to the general soil type,
Non-calcareous Alluvium under the Agro Ecological Zone (AEZ) 2, The Active Tista
Floodplain. This region includes the active floodplains of Teesta, Dharla and Dudkumar
rivers. It has complex patterns of low, generally smooth ridges, inter-ridge depressions,
river channels and cut-off channels. The area has irregular patterns of grey stratified, sands
and silts. They are moderately acidic throughout and parent alluvium is rich in minerals.
Four general soil types occur in the region; of which, Non-calcareous Alluvium
predominates. Organic matter content is low and CEC is medium. Soil fertility level, in
general, is low to medium. There also have unstable char land throughout the district.
3.3 Biotic characteristics
3.3.1 Characteristics of vegetation
From the ancient time, Kurigram is a land of agriculture and produces rice, jute, wheat,
tobacco, potato, vegetables etc. for driving the economy of the Kurigram district. During
winter season the ground water level usually goes down, farmers use the Brahmaputra river
water in irrigation to cultivate high yielding varieties of rice and other crops to keep
economy sustainable. Several cold storages add value to the economy of this district by
preserving agricultural produces during summer season.
3.4 Sampling Period
Soil samples were collected from the selected plot during the period from July, 2018 to
November, 2017.

18
3.5 Sampling design
Approximately 30 cm deep pits were dug for burnt and unburnt natural soils at a distance
of about 35-45 m from the brick kilns where the soil had usually been collected. From the
agronomic point of view, the topsoil to a depth of 100 cm are very important in terms of
nutrient dynamics and degradation of soil fertility. Accordingly, the soils in each profile
were sampled and analyzed at intervals of 0 to a depth of 30 cm. The bulk samples obtained
from each section were stored in the field moist conditions by putting the soil samples into
polyethylene bags in an airtight box immediately prior to laboratory analysis.
3.6 Sample Collection
Twelve man-made profiles of burnt soil obtained by staking the soils in open air at the
boundary or periphery of each brick kilns were studied. They consisted of remnants in the
brickfields and had been subjected to heating at 400 to 1000 °C temperatures. The studied
twelve unburnt soils profiles nearby the boundary of the above mentioned brick kilns
consisted mostly soils in agricultural lands. The studies were carried out during the dry
seasons of 2017 to 2018. A total of 24 samples were randomly collected from ten different
points of the study area. Twelve samples were from area which was close to the brick kiln
(named as burnt soil in the manuscript). Another Twelve samples were collected from far
area of the brick kiln where, apparently no change in crop production was observed as said
by the local farmers (named as unburnt soil in our all discussions). The samples were
collected from the depth of 0-15 cm and 15-30 cm by auger from each point and mixed
thoroughly to make composite sample. Samples were placed in sealed polythene bags and
then transported to the laboratory for preparation and analysis.

19
(a) (b)
(c) (d)
Plate 1: Plate a, b, c, d showing the overview of a brick field and soil collection from the brick kiln and adjacent field
20
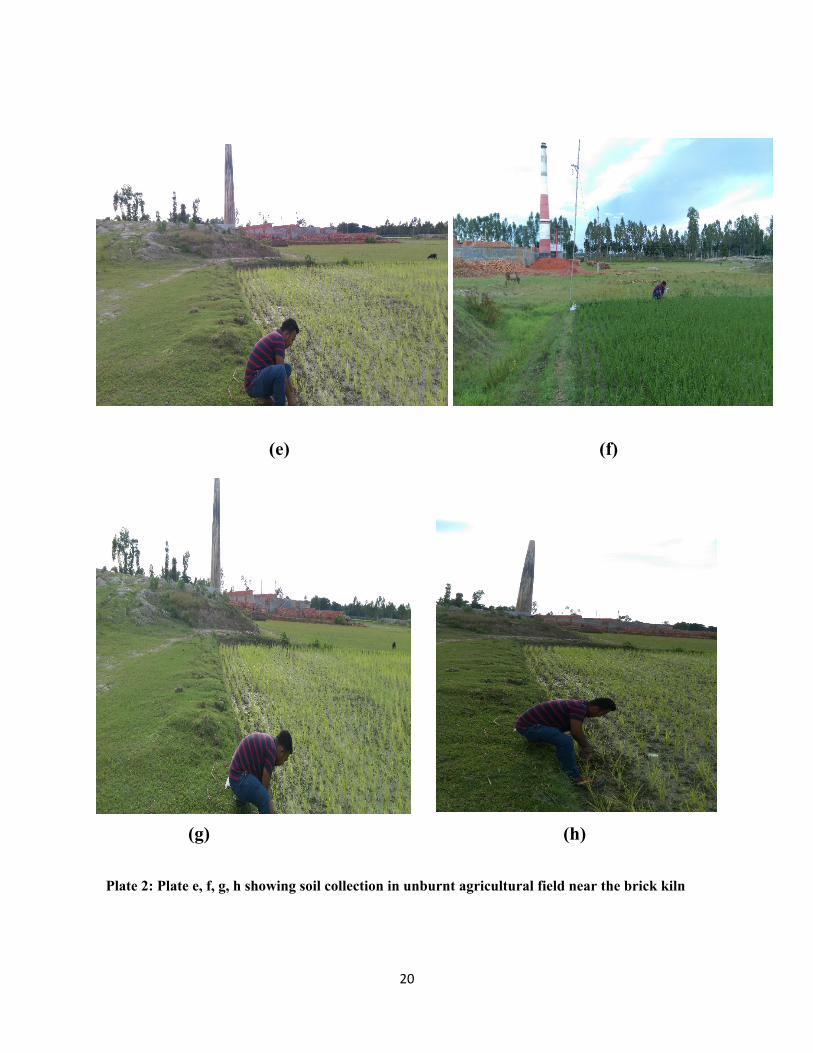
(e) (f)
(g) (h)
Plate 2: Plate e, f, g, h showing soil collection in unburnt agricultural field near the brick kiln

21
3.7 Sample Preparation
The composite samples were air dried and sieved through a 2 mm sieve and then 500 gm
each sample were stored for chemical analysis. There were three replication for each
sample.
3.8 Soil Sample Analysis
Collected soil samples were analyzed for both physical and chemical properties and the
soil sample were analyzed using the standard techniques as follows:
3.8.1 Textural class
Mechanical analysis of soil samples was done by hydrometer method (Bouyoucos, 1926)
and the textural class was determined by plotting the values for % sand, % silt and % clay
to the Marshall’s triangular co-ordinate following USDA system (Marshall, 1962)
3.8.2 Soil pH
The soil pH was determined by glass electrode pH meter at a soil: water ratio of 1:2.5 as
described by Jackson (1985).
22
3.8.3 Soil Organic matter (OM) content
The organic carbon (OC) of the soil samples was determined by Walkley and Black’s wet
oxidation method as outlined by Jackson (1985). The (OM) content was calculated by
multiplying the content of organic carbon by Van Bemmelen’s factor 1.73 (Piper, 1950).
3.8.4 Determination of Nitrogen (N) in soil sample
Total N in the soil was determined by semi-micro Kjeldahl method by digesting soil sample
with concentrated H2SO4 and catalyst mixture (K2SO4: CuSO4.5H2O: Se = 10:1:0.1). The
N in the digest was estimated by distillation with 40% NaOH followed by titration of the
distillate trapped in boric acid with 0.01N H2SO4 (Page et al., 1982).
3.8.5 Determination of Phosphorus (P) in soil sample
Available P was extracted by Olsen’s method SnCl2 as reducing agent. The extract was
estimated colorimetrically following the blue color method and was analyzed by a
spectrophotometer at 660 nm wavelength (Black et al., 1965)

23
3.8.6 Determination of potassium (K)
Extracted by neutral ammonium acetate and determined directly by flame photometer
(Black, 1965) at the wave length of 766.5 to 769.5 nm.
3.8.7 Electrical Conductivity (EC)
The EC was measured by digital EC meter, HM digital meter (Model 831E) in 1:5 of soil
water suspension (Biswas and Mukherjee, 1987).
3.8.8 Zinc (Zn) and Cupper (Cu) determination
The Zn and Cu were measured with the help of Atomic Absorption Spectrophotometer
(AAS) followed the procedure of McLaren et al. (1984).
3.9 Statistical Analysis
After laboratory analysis of the samples, data were analyzed using Statistical Package for
Social Sciences (SPSS 14.0) and Microsoft office excel 2010.

24
CHAPTER IV
RESULTS AND DISCUSSION
The results of the status of different physical and chemical component of soil collected
from different areas of Kurigram district have been discussed in the following headlines in
this chapter. Soil pH, OM (organic matter), available nitrogen, phosphorus, potassium, EC
(electrical conductivity) etc. were studied. The following headlines are the results and
discussion:
4.1 Soil pH
The pH values of the samples of surface soil (0-15 cm) ranged from 5.10 to 5.53 in the
burnt soils and from 5.57 to 5.97 in the unburnt soils (Figure 2). All kinds of crops are
grown well in the range of 5.6-7.3, because all types of essential nutrients are available in
this range (SRDI, 2009). The study found that the unburnt soil pH is suitable for crop
cultivation. The brick kiln operation decreases the pH of surrounding soil (Khan et al.,
2007), the study found the comparatively lesser burnt soil pH than the unburnt soil in the
surface soil. The pH in 15-30 cm depth ranged from 4.19 to 5.35 in the burnt soil near brick
kiln and 4.59 to 5.79 in unburnt soil near agricultural field.
25
5.1
5.535.4 5.32
5.145.25
5.685.57
5.74 5.85.97
5.6
4.44.64.8
55.25.45.65.8
66.26.4
MMB SAB MJHB GMB MBU SFU
Burnt Unburnt
Different location
pH v
alue
s
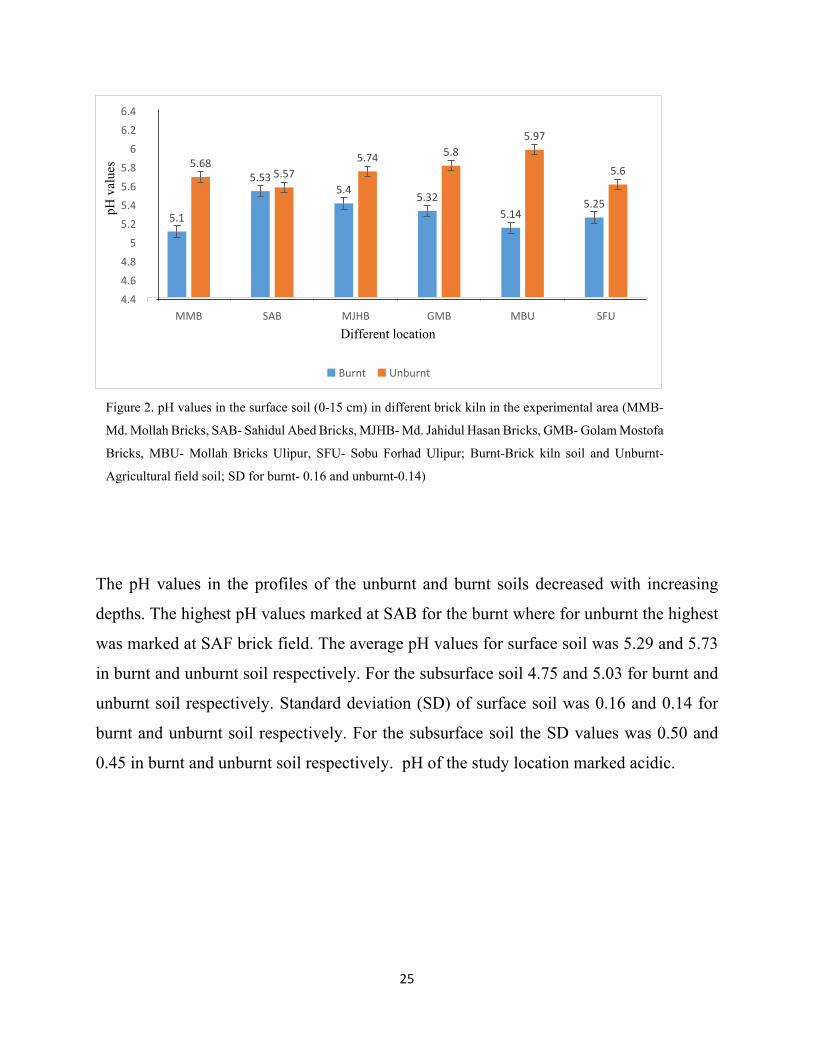
The pH values in the profiles of the unburnt and burnt soils decreased with increasing
depths. The highest pH values marked at SAB for the burnt where for unburnt the highest
was marked at SAF brick field. The average pH values for surface soil was 5.29 and 5.73
in burnt and unburnt soil respectively. For the subsurface soil 4.75 and 5.03 for burnt and
unburnt soil respectively. Standard deviation (SD) of surface soil was 0.16 and 0.14 for
burnt and unburnt soil respectively. For the subsurface soil the SD values was 0.50 and
0.45 in burnt and unburnt soil respectively. pH of the study location marked acidic.
Figure 2. pH values in the surface soil (0-15 cm) in different brick kiln in the experimental area (MMB-
Md. Mollah Bricks, SAB- Sahidul Abed Bricks, MJHB- Md. Jahidul Hasan Bricks, GMB- Golam Mostofa
Bricks, MBU- Mollah Bricks Ulipur, SFU- Sobu Forhad Ulipur; Burnt-Brick kiln soil and Unburnt-
Agricultural field soil; SD for burnt- 0.16 and unburnt-0.14)
26
4.23 4.19
5.14.53
5.35 5.14.83 4.59 4.71 4.92
5.795.35
0
1
2
3
4
5
6
7
MMB SAB MJHB GMB MBU SFU
Burnt Uburnt
Different location
pH v
alue
s
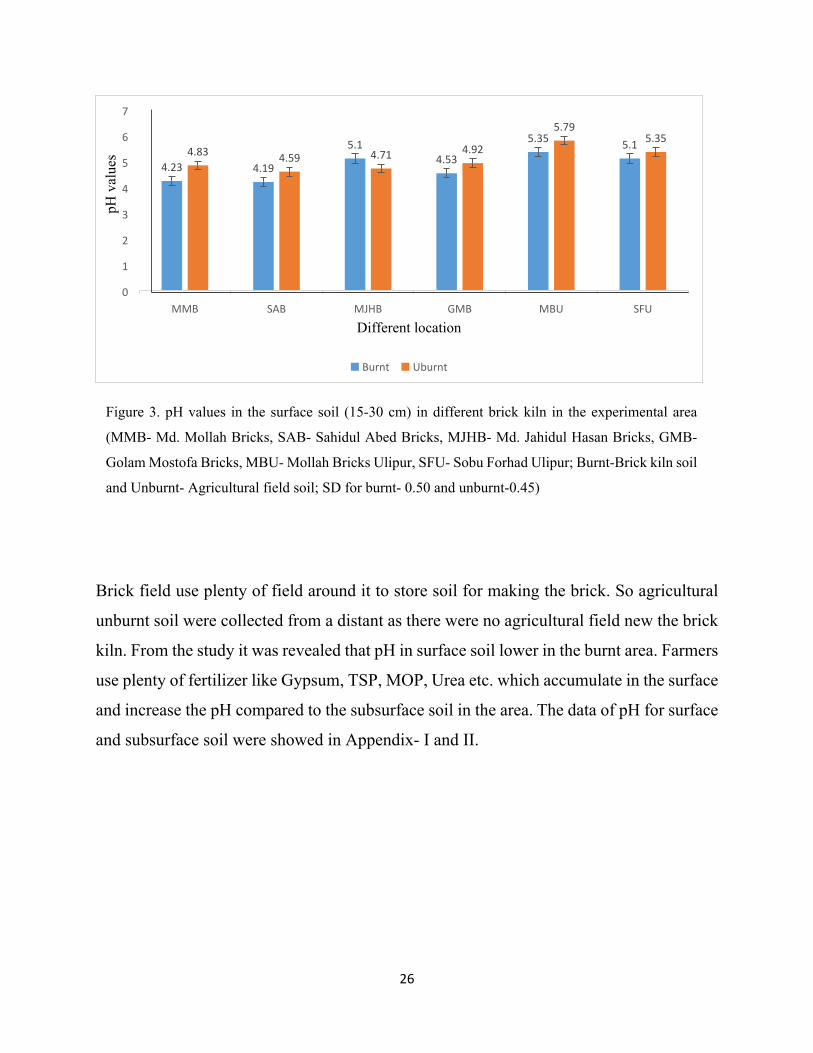
Brick field use plenty of field around it to store soil for making the brick. So agricultural
unburnt soil were collected from a distant as there were no agricultural field new the brick
kiln. From the study it was revealed that pH in surface soil lower in the burnt area. Farmers
use plenty of fertilizer like Gypsum, TSP, MOP, Urea etc. which accumulate in the surface
and increase the pH compared to the subsurface soil in the area. The data of pH for surface
and subsurface soil were showed in Appendix- I and II.
Figure 3. pH values in the surface soil (15-30 cm) in different brick kiln in the experimental area
(MMB- Md. Mollah Bricks, SAB- Sahidul Abed Bricks, MJHB- Md. Jahidul Hasan Bricks, GMB-
Golam Mostofa Bricks, MBU- Mollah Bricks Ulipur, SFU- Sobu Forhad Ulipur; Burnt-Brick kiln soil
and Unburnt- Agricultural field soil; SD for burnt- 0.50 and unburnt-0.45)

27
4.2 Organic matter (OM)
Organic matter values from burnt and unburnt soil in surface and subsurface soil are shown
in (Figure 4 and 5). Highest OM value was observed in surface soil (0-15cm) and lower in
the subsurface soil (15-30cm) for both burnt and unburnt soil. Similar result was also
observed by Sood and Kanwar (1986), Mondal (1998) and Fakir (1998). The OM content
of the samples recorded from 0.250 to 0.920 % in the burnt soil and from 0.290 to 1.055%
in the unburnt soil for surface soil (0-15 cm) and for subsurface soil 0.210 to 0.740 and
0.206 to 0.705 in burnt and unburnt soil respectively. Highest OM value for burnt and
unburnt soil was observed in MBU brick field and lowest in SAB for both surface and
subsurface soil. The Higher organic carbon value for surface soil in unburnt area near the
brick kiln was (1.055%) observed in MBU location and lowest (0.290%) was observed in
SAB bricl kiln. Total highest value also found in this MAB brick field for the surface soil.
For the subsurface soil highest (0.705%) was found in MBU location and lowest (0.206%)
was observed in the SAB brick kiln. Standard deviation (SD) of surface soil was 0.27%
and 0.30% for burnt and unburnt soil respectively. For the subsurface soil the SD values
was 0.19% and 0.18% in burnt and unburnt soil respectively. Soil OM is a reservoir for
plant nutrients, enhances water holding capacity, protects soil structure against compaction
and erosion, and thus determines soil productivity (Martius et al., 2001). The study found
that the OM content of the agricultural land around the brick field area was decreasing day
by day due to the burning of surface and subsurface soil. Similar result was also observed
by Khan et al. (2007). Higher organic matter was found in unburnt soil near the brick kiln
for both surface and subsurface soil. May be decrease of OM content in the brick kiln soil
was due to the head and deposition of brick waste. Also soil, crop, and the management
practice was different from farmer to farmer in different experimental location. This OM
content variation might be for different management parctice and different soil texture in
different location.

28
Table 2. OM Values (%) in the surface soil (0-15 cm) in different brick kiln in the
experimental area
Table 3. OM Values (%) in the surface soil (15-30 cm) in different brick kiln in the
experimental area
Sampling point Burnt Unburnt
MMB 0.465 0.490
SAB 0.250 0.290
MJHB 0.560 0.610
GMB 0.395 0.410
MBU 0.920 1.055
SFU 0.890 0.930
Mean 0.58 0.63
SD 0.27 0.30
Sampling point Burnt Unburnt
MMB 0.340 0.335
SAB 0.210 0.206
MJHB 0.530 0.520
GMB 0.450 0.445
MBU 0.740 0.705
SFU 0.630 0.625
Mean 0.483 0.473
SD 0.192 0.184

29
4.3 Nitrogen contents (N)
The total N content in the surface soil (0-15 cm) ranged from 0.023 to 0.100% and 0.029
to 0.123% in the burnt and unburnt soil, respectively. In case of subsurface soil (15-30 cm),
the nitrogen content in burnt and unburnt soil ranged from 0.020% to 0.068% and 0.023%
to 0.073% respectively (Table 4 and 5). Highest (0.123%) Nitrogen content observed in
SAF location at unburnt surface soil and lowest (0.020%) nitrogen content observed in
location MJHB at burnt subsurface soil. The average total N content for surface soil was
found 0.06% in the burnt and 0.07% in the unburnt soils. For the subsurface soil the average
value is 0.04% for burnt soil and 0.05%for unburnt soil. Standard deviation (SD) of surface
soil was 0.03% and 0.03% for burnt and unburnt soil respectively. For the subsurface soil
the SD values was 0.017% and 0.018% in burnt and unburnt soil respectively. According
to BARC (1997), the standard level of total N in soil is 0.32%. Regarding the report of
SRDI (2009), the N values of Kurigram agricultural soil ranged from 0.013 to 0.150%. The
nitrogen content decreased in lower depth. It was observed that nitrogen content was higher
in surface soil the subsurface soil for both burnt and unburnt soil. In the study area the
range of total nitrogen was far below the critical range of nitrogen. Low organic matter
content and burning of soil by heat was the reason for that. Lower value of N is due to loss
of organic carbon which contains nitrogen and nitrogen fixing micro-organisms in soil (Rai
et al., 2009). Most of the soil of Bangladesh contained nitrogen below critical level stated
by Portach and Islam (1984).
It is found from the result that nitrogen content decreased in subsurface soil. Hossain et al.
(2003) also found the similar result that all the soil were deficient in nitrogen content.

30
Table 4. N Values (%) in the surface soil (0-15 cm) in different brick kiln in the
experimental area
Table 5. N Values (%) in the surface soil (15-30 cm) in different brick kiln in the
experimental area
Sampling point Burnt soil Unburnt soil
MMB 0.037 0.040
SAB 0.045 0.049
MJHB 0.023 0.029
GMB 0.087 0.090
MBU 0.095 0.099
SFU 0.100 0.123
Mean 0.064 0.072
SD 0.033 0.037
Sampling point Burnt soil Unburnt soil
MMB 0.054 0.059
SAB 0.035 0.038
MJHB 0.020 0.023
GMB 0.060 0.065
MBU 0.048 0.050
SFU 0.068 0.073
Mean 0.047 0.051
SD 0.017 0.018

31
4.4 Phosphorus availability (P)
The available P content of the samples in surface soil (0-15 cm) were within the range of
9.85 to 10.10 ppm in the burnt soil and of 17.40 to 21.90 ppm in the unburnt soil. In
subsurface soil (15-30 cm) the range were from 8.60 to 13.10 for burnt soil and from 11.00
to 19.00 ppm for unburnt soil (Figure 4 and 5). The highest value of phosphorus were found
21.90 ppm and 19.00 ppm for surface and subsurface soil in burnt and unburnt soil
respectively. The lowest phosphorus content at surface and subsurface soil were found 9.85
ppm and 8.60 ppm at MMB brick field. The lower amount (8.60) of P was found in burnt
soil than the unburnt soil, suggested the negative impact of brick burning on the surface
and subsurface soil P content. It will be reported on the standard level of P for crop
cultivation that is 21 ppm (BARC, 1997). The SRDI (2009) reported that the available P
values of Kurigram district agricultural soil ranged from 0.90 to 1.67 ppm. Thus, the study
revealed that the P content in the study area was relatively higher than the finding of SRDI.
The research found that phosphorus content were higher in surface soil then subsurface
soil. Higher (21.90 ppm) phosphorus value was found in surface soil then those of
subsurface soil at the location GMB. The lowest phosphorus value was recorded (8.60
ppm) at subsurface soil.
Average phosphorus content for surface were 15.26 ppm and 19.26 ppm at burnt and
unburnt soil respectively. For the subsurface soil 10.85 ppm for burnt and 16.45 ppm for
unburnt soil. Standard deviation (SD) of surface soil was 0.111 meq100g-1 and 0.120
meq100g-1 for burnt and unburnt soil respectively. For the subsurface soil the SD values
was 0.010 meq100g-1 and 0.107 meq100g-1 in burnt and unburnt soil respectively.

32
9.8512.35
14.54
19.117.19
18.5417.4
19.9518.32
21.920.45
17.55
0
5
10
15
20
25
MMB SAB MJHB GMB MBU SFU
Burnt soil Unburnt soil
Different location
Ava
ilabl
e ph
osph
orus
(ppm
)
8.6 9.1
12.45 13.1
10.43 11.4311
15.5317.97 19
16.3518.85
0
5
10
15
20
25
MMB SAB MJHB GMB MBU SFU
Burnt soil Unburnt soil
Different location
Ava
ilabl
e ph
osph
orus
(ppm
)
Figure 4. P values in the surface soil (0-15 cm) in different brick kiln in the experimental area.; Burnt-Brick kiln soil and Unburnt- Agricultural field soil; SD for burnt- 0.111 meq100g-1 and unburnt- 0.120 meq100g-1)
Figure 5. P values in the surface soil (15-30 cm) in different brick kiln in the experimental area. Burnt-Brick kiln soil and Unburnt- Agricultural field soil; SD for burnt- 0.010 meq100g-1 and unburnt- 0.107 meq100g-1)
33
4.5 Exchangeable potassium (K)
The results on exchangeable potassium content in burnt and unburnt soil are shown in
(Figure 6 and 7). The level of exchangeable potassium content in burnt soil ranged from
0.092 to 0.363 meq100g-1 in surface soil and 0.083 to 0.113 meq100g-1 in subsurface soil.
In case of unburnt soil near the brick field the range is from 0.190 to 0.518 meq100g-1 in
the surface soil and from 0.102 to 0.412 meq100g-1 in subsurface soil. The maximum
potassium value at surface and subsurface soil were found to be 0.518 meq100g-1 and 0.412
meq100g-1 at SFU brick field. The lowest potassium value at surface and subsurface soils
were recorded to 0.092 meq100g-1 at MJHB brick field and 0.097 meq100g-1 at GMB brick
field respectively.
The potassium value in unburnt soil ranged from 0.190 to o.518 meq100g-1 at surface soil
and from 0.102 to 0.412 meq100g-1 at subsurface soil. The maximum 0.518 meq100g-1
were found at location SAF for surface soil and for the subsurface soil the maximum 0.412
found at SAF brick field also. The average K values for surface soil was 0.213 meq100g-1
and 0.343 meq100g-1 in burnt and unburnt soil respectively. For the subsurface soil 0.098
meq100g-1 and 0.272 meq100g-1 for burnt and unburnt soil respectively. Standard deviation
(SD) of surface soil was 0.111 meq100g-1 and 0.120 meq100g-1 for burnt and unburnt soil
respectively. For the subsurface soil the SD values was 0.010 meq100g-1 and 0.107
meq100g-1 in burnt and unburnt soil respectively.
From the study it was revealed that the potassium content was high in unburnt soil then in
the burnt soil. The exchangeable potassium was found to be higher in surface soil than that
of subsurface soil. Eaqub and Zaman (1987), Hossain et al. (2003) and Zaman and
Nuruzzaman (1995) also found the similar result.

34
0.136
0.235
0.093
0.321
0.132
0.3630.325
0.432
0.190.243
0.354
0.518
0
0.1
0.2
0.3
0.4
0.5
0.6
MMB SAB MJHB GMB MBU SFU
Burnt soil Unburnt soil
Different location
K V
alue
s (m
eq10
0g-1
)
0.094 0.103 0.083 0.097 0.101 0.113
0.213
0.324
0.102
0.256
0.324
0.412
00.05
0.10.15
0.20.25
0.30.35
0.40.45
0.5
MMB SAB MJHB GMB MBU SFU
Burnt soil Unburnt soil
Different location
K le
vels
(meq
100g
-1 )
Figure 6. K values in the surface soil (0-15 cm) in different brick kiln in the experimental area. Burnt-Brick kiln soil and Unburnt- Agricultural field soil; SD, burnt- 0.111 meq100g-1 and unburnt- 0.120 meq100g-1)
Figure 7. K values in the surface soil (15-30 cm) in different brick kiln in the experimental area. Burnt-Brick kiln soil and Unburnt- Agricultural field soil; SD, burnt- 0.010 meq100g-1 ,unburnt-0.107 meq100g-1)

35
4.6 Electrical conductivity (EC)
The electrical conductivity (EC) of both surface and subsurface soil are showed in Figure
8 and 9. The EC of burnt soil were ranged from 9.8 to 36.1 dsm-1 for surface soil (0-15
cm) and from 5.3 to 13.2 dsm-1 for subsurface soil (15-30 cm). For the unburnt soil near
brick field were from 13.4 to 36.1 dsm-1 for surface soil and from 8.5 to 24.6 dsm-1 for
subsurface soil. Highest EC values were found 34.2 dsm-1 at SFU brick field for unburnt
soil in surface soil. The maximum EC value for burnt soil were 32.2 dsm-1 at SFU brick
field in surface soil and the minimum value were 5.3 dsm-1 at SAB brick field in subsurface
soil. Average EC values of surface soil were 21.62 dsm-1 and 24.68 dsm-1 for burnt and
unburnt soil respectively. For subsurface soil the average EC value were 9.467 dsm-1 and
14.017 dsm-1 for burnt and unburnt soil respectively. The Standard deviation value for burnt
soil was 8.409 dsm-1 and 3.054 dsm-1 for surface and subsurface soils, respectively. In
unburnt agricultural field soil the Standard deviation value for EC was 9.169 dsm-1 for
surface and 6.519 dsm-1 for subsurface soil.
Management practices like irrigation, fertilizer etc. were responsible for the Ec values of
unburnt agricultural field. These practices helped soil to get higher accumulation of
cations(+) in unburnt agricultural field. In burnt brick field soil no practices like these were
happened and also the brick field contain low cation(+) bearing substances like dust, sand,
brick etc. mixed with soil. Those were cause of low Ec values in burnt soils of brick field.
The data of Ec for surface and subsurface soil were showed in Appendix- VII and VIII.

36
24.3
9.8
17.6 17.9
29.732.2
21.917
8.409
26.7
13.4
18.7 19
34.236.1
24.683
9.169
0
5
10
15
20
25
30
35
40
MMB SAB MJHB GMB MBU SFU Mean SD
Burnt soil Unburnt soil
Different location
EC v
alue
s (ds
/m)
7.65.3
8.39.7
13.2 12.7
9.467
3.054
8.5 8.7 9.8
13.6
18.9
24.6
14.017
6.519
0
5
10
15
20
25
30
MMB SAB MJHB GMB MBU SFU Mean SD
Burnt soil (EC) Unburnt soil (EC)
Different location
EC v
alue
s (ds
/m)
Figure 8. EC values in the surface soil (0-15 cm) in different brick kiln in the experimental area. Burnt-Brick kiln soil and Unburnt- Agricultural field soil; SD for burnt-8.409 dsm-1 and unburnt-9.169 dsm-1)
Figure 9. EC values in the surface soil (15-30 cm) in different brick kiln in the experimental area. Burnt-Brick kiln soil and Unburnt- Agricultural field soil; SD for burnt- 3.054 dsm-1 and unburnt- 6.519 dsm-1)
37
4.7 Available Copper (Cu)
The total Cu content for surface soil (0-15 cm) was recorded ranging from 0.082 to 0.088
ppm in the burnt soil and from 0.090 to 0.098 ppm in the unburnt soils. For subsurface soil
the range was from 0.071 to 0.079 ppm for burnt soil and from 0.080 to 0.089 ppm for the
unburnt agricultural field (Table 6 and 7). Maximum Cu 0.098 ppm was found at MBU
brick field for surface soil in unburnt agricultural field. For subsurface soil the maximum
Cu 0.089 ppm was found at MBU location. In burnt soil maximum Cu content was 0.088
ppm in surface soil and 0.079 ppm was at subsurface soil in the location MBU brick field.
Minimum Copper value 0.071 ppm was found at MMB location for the subsurface soil.
For the surface soil the minimum Cu value 0.082 was found at MMB brick field in burnt
soil.
The mean value of total Cu contents for surface soil was found 0.085 and 0.094 ppm in the
burnt and unburnt soils, respectively. For subsurface soil the mean value was 0.075 and
0.084 ppm for burnt and unburnt soils, respectively. The Standard deviation value for burnt
soil was 0.002 and 0.003 for surface and subsurface soils, respectively. For the unburnt
agricultural soil the SD value was 0.003 for both surface and subsurface soil.
The study found that Cu contents decreased with increased depth. Lower Cu value was
found in burnt brick field soil than the unburnt agricultural soil. The nutrient loss was due
to the heat developed for brick burning the brick kiln operation.

38
Table 6. Cu Values (ppm) in the subsurface soil (0-15 cm) in different brick kiln in the experimental area
Table 7. Cu Values (ppm) in the subsurface soil (15-30 cm) in different brick kiln in
the experimental area
4.8 Available Zinc (Zn)
Sampling point Burnt soil (Cu) Unburnt soil (Cu)
MMB 0.082 0.090
SAB 0.087 0.094
MJHB 0.085 0.097
GMB 0.083 0.093
MBU 0.088 0.098
SFU 0.086 0.092
Mean 0.085 0.094
SD 0.002 0.003
Sampling point Burnt soil (Cu) Unburnt soil (Cu)
MMB 0.071 0.080
SAB 0.077 0.084
MJHB 0.075 0.087
GMB 0.073 0.083
MBU 0.079 0.089
SFU 0.076 0.082
Mean 0.075 0.084
SD 0.003 0.003

39
The total Zn content for surface soil ranged from 2.031 to 2.090 ppm in the burnt and from
2.113 to 2.992 ppm in the unburnt soil in the study area. For the subsurface soil available
Zn ranged from 2.011 to 2.070 ppm and from 2.102 to 2.537 ppm for burnt and unburnt
soils, respectively (Table 8 and 9). Highest Zn content 2.090 ppm for burnt and 2.992 ppm
for unburnt found at SFU location in surface soil. Maximum Zn value for subsurface soil
was 2.070 ppm and 2.527 ppm for burnt and unburnt soils, respectively. For burnt soil
minimum Zn value 2.011 ppm was found at SAB brick field in subsurface soil. For the
surface soil the minimum Zn value was 2.031 for burnt soil. In unburnt agricultural field
the lowest Zn content was 2.102 ppm at SAB location in subsurface soil.
The mean value of total Zn content for surface soil was found 2.063 and 2.59 ppm in the
burnt and unburnt soils, respectively. For subsurface soil the mean value for Zn content
was 2.045 and 2.295 ppm in burnt and unburnt soils, respectively. The SD value for burnt
soil was 0.023 and 0.022 ppm for surface and subsurface soils, respectively. For the
unburnt agricultural field soil, the SD value was 0.37 for surface soil and 0.152 ppm for
subsurface soil.
In this experiment it was revealed that available Zn values lower in the burnt brick field
soil than in the unburnt agricultural soil. It was due to the heat accumulate from the brick
burning operation. Zn values also decreased with increasing depth.
Table 8. Zn values (ppm) in the subsurface soil (0-15 cm) in different brick kiln in the experimental area

40
Table 9. Zn values (ppm) in the subsurface soil (15-30 cm) in different brick kiln in
the experimental area
CHAPTER V
SUMMARY, CONCLUSSION AND RECOMMENDATION
Sampling point Burnt soil (Zn) Unburnt soil (Zn)
MMB 2.042 2.245
SAB 2.031 2.113
MJHB 2.057 2.453
GMB 2.085 2.784
MBU 2.074 2.951
SFU 2.090 2.992
Mean 2.063 2.59
SD 0.023 0.37
Sampling point Burnt soil (Zn) Unburnt soil (Zn)
MMB 2.052 2.345
SAB 2.011 2.102
MJHB 2.027 2.353
GMB 2.045 2.184
MBU 2.064 2.251
SFU 2.070 2.537
Mean 2.045 2.295
SD 0.022 0.152

41
SUMMARY
The study was conducted to show the chemical and physical properties of soil in the six
selected brick kiln and the agricultural field (35-45 m) adjacent to the brick kiln, for both
surface (0-15 cm) and subsurface (15-30 cm) at Kurigram district. The samples were
collected from the study area and analysed in the Laboratory of Soil Science, Department
of Soil Science, Sher-e-Bangla Agricultural University, Dhaka. The comparative results of
chemical and physical properties are summarized below:
The average pH values for surface soil was 5.29 and 5.73 in burnt and unburnt soil
respectively. For the subsurface soil 4.75 and 5.03 for burnt and unburnt soil respectively.
Standard deviation (SD) of surface soil was 0.16 and 0.14 for burnt and unburnt soil
respectively. For the subsurface soil the SD values was 0.50 and 0.45 in burnt and unburnt
soil respectively. pH of the study location marked acidic.
The average OM values for surface soil was 0.58% and 0.63% in burnt and unburnt soil
respectively. For the subsurface soil 0.63% and 0.47% for burnt and unburnt soil
respectively. Standard deviation (SD) of surface soil was 0.27% and 0.30% for burnt and
unburnt soil respectively. For the subsurface soil the SD values was 0.19% and 0.18% in
burnt and unburnt soil respectively. The unburnt soil contain more organic matter than the
burnt soil. The OM level decreased with increased soil depth.
The average total N content for surface soil was found 0.06% in the burnt and 0.07% in the
unburnt soils. For the subsurface soil the average value is 0.04% for burnt soil and 0.05%for
unburnt soil. Standard deviation (SD) of surface soil was 0.03% and 0.03% for burnt and
unburnt soil respectively. For the subsurface soil the SD values was 0.017% and 0.018%

42
in burnt and unburnt soil respectively. Total Nitrogen content in the study area were below
the critical level and gradually decreased with increased depth. The unburnt agricultural
field contain more N than the burnt soil of the brick kiln.
The average P values for surface soil was 15.54 ppm and 19.26 ppm in burnt and unburnt
soil respectively. For the subsurface soil 10.85 ppm and 16.45 ppm for burnt and unburnt
soil respectively. Standard deviation (SD) of surface soil was 3.67 ppm and 1.80 ppm for
burnt and unburnt soil respectively. For the subsurface soil the SD values was 1.80 ppm
and 3.00 ppm in burnt and unburnt soil respectively. The lowest phosphorus content at
surface and subsurface soil were found 9.85 ppm and 8.60 ppm at MMB brick field. The
lower amount (8.60) of P was found in burnt soil than the unburnt soil shown the negative
impact of brick burning on the surface and subsurface soil P content. P values also
decreased with increased depth.
The average K values for surface soil was 0.213 meq100g-1 and 0.343 meq100g-1 in burnt
and unburnt soil respectively. For the subsurface soil 0.098 meq100g-1 and 0.272 meq100g-
1 for burnt and unburnt soil respectively. Standard deviation (SD) of surface soil was 0.111
meq100g-1 and 0.120 meq100g-1 for burnt and unburnt soil respectively. For the subsurface
soil the SD values was 0.010 meq100g-1 and 0.107 meq100g-1 in burnt and unburnt soil
respectively. More exchangeable K were found in unburnt agricultural soil than burnt brick
kiln soil.
Average EC values of surface soil were 21.62 dsm-1 and 24.68 dsm-1 for burnt and unburnt
soil respectively. For subsurface soil the average EC value were 9.467 dsm-1 and 14.017
dsm-1 for burnt and unburnt soil respectively. The EC values decreased with increased

43
depth for both burnt and unburnt soil. Higher soil salinity caused for higher EC in
agricultural field.
The mean value of total Cu contents for surface soil was found 0.085 and 0.094 ppm in the
burnt and unburnt soils, respectively. For subsurface soil the mean value was 0.075 and
0.084 ppm for burnt and unburnt soils, respectively. The SD value for burnt soil was 0.002
and 0.003 for surface and subsurface soils, respectively. For the unburnt agricultural soil
the SD value was 0.003 for both surface and subsurface soil. It was revealed that Cu values
lower in the burnt soil than the unburnt agricultural soil due to the heat developed for brick
burning.
The mean value of total Zn content for surface soil was found 2.063 and 2.59 ppm in the
burnt and unburnt soils, respectively. For subsurface soil the mean value for Zn content
was 2.045 and 2.295 ppm in burnt and unburnt soils, respectively. The SD value for burnt
soil was 0.023 and 0.022 ppm for surface and subsurface soils, respectively. For the
unburnt agricultural field soil, the SD value was 0.37 for surface soil and 0.152 ppm for
subsurface soil. In this study it was seen that Zn content in lower in the burnt soil than the
unburnt soil. It also decreased with the increasing depth
CONCLUSION
44
Brick kilns are not only destroying large areas of lands, but also the organic material and
nutrients in the soil. In the study area, the values of OM (0.58%) and nutrients were found
very low in the burnt soil compared to the unburnt soil, while the soil pH and EC were
relatively higher. The study clearly depicted that the brick kiln operation decreases the OM
and essential nutrients by degrading the soil quality. From the result of this study, it can be
concluded that chemical properties of soil was lower in burnt soil of brick kiln than the
unburnt agricultural soil.
RECOMMENDATION

45
The present investigation increases awareness about the status of soil degradation and
environmental pollution induced by the brick kilns operation. To minimize soil nutrients
loss and soil quality degradation, the study recommends:
(i) brick fields should be built away from the productive agricultural land;
(ii) restoring organic material and nutrient status so as to offset the negative impact
of brick burning operation; and
(iii) rules and regulations for the brick field management must be developed by the
government and related authorities.
CHAPTER VI

46
REFERENCES
Achakzai, K., Khalid, S., and Bibi, A. (2017). Determination of heavy metals in agricultural soil adjacent to functional Brick Kilns: a case study of Rawalpindi. Sci. Tech. and Dev. 34(3): 122-129.
Banerjee, A. K. (1980). 5'-terminal cap structure in eucaryotic messenger ribonucleic acids. Microbiological reviews, 44(2), 175.
Bangladesh Population Census (2001), Bangladesh Bureau of Statistics; Cultural survey report of Upazilas of Kurigram District 2007. pp. 23-47
BARC. (1997). Fertilizer recommendation guide. Bangladesh Agricultural Research Council. BARC Publications. Farmgate, Dhaka. Bangladesh. pp. 196.
Bhuiyan, M. M. H. (2000). Effects of forms and timing of fertilizer on the performance of the transplant aman rice cv. BINASHAIL. M. S. Thesis, Department of Agronomy., BAU, Mymensing. p. 86
Bhuiyan, N. I. (1988). Co-ordinated Project on Potassium Studies. Progress Report. BARI, Joydebpur Gazipur. pp. 1-45
Bisht, G. and Neupane, S. (2015). Impact of Brick Kilns’ Emission on Soil Quality of Agriculture Fields in the Vicinity of Selected Bhaktapur Area of Nepal. Applied and Envir. Soil Sci. 90(1): 43-67.
Biswas, D., Gurley, E. S., Rutherford, S., and Luby, S. P. (2018). The Drivers and Impacts of Selling Soil for Brick Making in Bangladesh. Environmental management, 1-11.
Biswas, N.K. and S.I. Mukherjee. (1987). Soil chemical analysis. Oaretic Hall of India Private Ltd. New Delhi, India.
Black, C. A. (1965). Methods of Soil Analysis. Part 1 and Part 2. Amar. Soc. Agron. Inc. Pub. Madison. Wiscosin. USA.
Bouyoucos, G. J. 1926. Hydrometer method improved for making particle size analysis of soils. J. of Agronomy. 54: 4661-4665.
Brunel, I. (2011). The life of Isambard Kingdom Brunel, civil engineer. Cambridge University Press.
Brunekreef, B., and Holgate, S. T. (2002). Air pollution and health. The lancet, 360(9341), 1233-1242.

47
Chowdhury, M. M. U. (1990). To study the physical and chemical properties of four soil series of Mymensingh district. M. S. Thesis. Dept. Soil Science, BAU, Mymensingh. pp. 37-71
Croitoru, L., and Sarraf, M. (2012). Benefits and costs of the informal sector: the case of brick kilns in Bangladesh. J. of Environ Protection, 3(06), 476.
Cohen, A. D. (2005). Strategies for learning and performing L2 speech acts. Intercultural pragmatics, 2(3): 275-301.
Das, R. (2015). Causes and consequences of land degradation in and around the brick kilns of khejuri CD blocks over Coastal Medinipur in West Bengal. Int. J. of Innovative Resch and Devment, 4(2): 257-265
Eaqub, M. and Zaman, M.W. (1987). Soil test crop response stidies for fertilizer recommendation (BAU Component) Ann. Rep. BARC. Coord. Reo. Project. P. 5.
Eswaran, H., R. Lal and P.F. Reich. (2001). Land degradation: An overview. In: Responses to land degradation. E.M. Bridges, I.D. Hannam, L.R. Oldeman, F.W.T. Pening de Vries, S.J. Scherr, and S. Sompatpanit (eds.). Proceedings of the 2nd international conference on land degra-dation and desertification.KhonKaen, Thailand. Oxford Press. New Delhi, India. pp. 9.
Fakir, M. S. A. (1998) Comparative studies of physical-chemical properties of hill soils and floodplain soil of Bangladesh. M. S. Thesis, Dept. Soil. Science BAU. Mymensing.
GEFONT (2007) Nepal: Labour Under the Chimney—A Study on the Brick Kilns of Nepal. Putalisadak, Kathmandu, Nepal: General Federation of Nepalese Trade Unions (GEFONT), Man Mohan Labour Building, GEFONT Plaza.
Gupta, S. and R. Narayan. (2010). Brick kiln industry in long-term impacts biomass and diversity structure of plant communities. Curr. Sci. India. 99(1): 72-79.
Guttikunda, S. K. and Khaliquzzaman, M. (2014). Health benefits of adapting cleaner brick manufacturing technologies in Dhaka, Bangladesh. Air Quality, Atmosphere and Health. 7(1): 103-112.
Hossain, C. F., Kim, Y. P., Baerson, S. R., Zhang, L., Bruick, R. K., Mohammed, K. A., and Zhou, Y. D. (2005). Saururus cernuus lignans—Potent small molecule inhibitors of hypoxia-inducible factor-1. Biochemical and biophysical resch communications, 333(3): 1026-1033.
Hossain, A., Hossain, A.K.M.M., Rahman, M.S., Rahman, M.M. Chowdhury, M.A.M. and Khan, M.S.H. (2003). Effect of tillage Practices on Soil Properties under different Cropping Patterns. J. Sci. Tech. 1: 44-48
48
Ismail, M., Mihammad, D., Khan, F. U., Munsif, F., Ahmad, T., Ali, S. and Ahmad, M. (2012). Effect of brick kiln’s emissions on heavy metal (CD and CR) content of contiguous soil and plants. Sarhad J. of Agril. 28(3): 276-328
IUSS. (2002). Soil and the environment. IUSS commission VIII. Int. Union of Soil Sci. World Congress of Soil Sci. Thailand. pp. 6.
Imtiaz, M., A. Rashid, P., Khan, M.Y. and Aslam, M. 2010. The role of micro-nutrients in crop production and human health. Pak. J. Bot. 42 (4): 2565-2578.
Islam, M. S., Al Mamun, S., Muliadi, M., Rana, S., Tusher, T. R. and Roy, S. (2015). The impact of brick kiln operation to the degradation of topsoil quality of agricultural land. AGRIVITA, J. of Agril. Sci.. 37(3): 204-209.
Jerin, M. F., Mondol, S. K., Sarker, B. C., Rimi, R. H. and Aktar, S. (2016). Impacts of Brick Fields on Environment and Social Economy at Bagatipara, Natore, Bangladesh. J. of Env. Sci. and Natural Resources. 9(2): 31-34.
Jackson, M.L., (1985). Soil Chemical Analysis. Prentic Hall of India Pvt. Ltd., New Delhi. pp. 41-330.
Kathuria, V. (2007). Utilization of fly-ash by brick manufacturers - environmental costs vs. benefits. Research Report. Ministry of Environment and Forests. India.
Khan, H.R., Rahman, K., Rouf, A.J.M.A., Sattar, G.S., Oki, Y. and Adachi, T. (2007). Assessment of degradation of agricultural soils arising from brick burning in selected soil profiles. Int. J. Environ. Sci. Tech. 4 (4): 471-480.
Karne, K., and Kumar, V. Role of Soil Brick Industry in the Degradation of Land and Environment-A Case Study of Mallaram in Nizamabad, Telangana State.
Martius, C. and Tiessen, H. and Vlek, P. (2001). Managing organic matter in tropical soils: scope and limitations. Proceedings of a Workshop. Plant and Soil Sci. Development Research Center. University of Bonn (ZEF Bonn). Germany, 7–10 June, 1999. Springer. Netherlands. pp. 236.
McLaren, R.G., R.S. Swift and B.F. Quin. (1984). EDTA extractable copper, zinc, iron and manganese in soils of the Canterbury plains. New Zeal. J. Agr. Res. 27: 207-217.
Mukherjee, P., Biswas, G., and Nag, P. K. (1987). Second-law analysis of heat transfer in swirling flow through a cylindrical duct. J. of heat transfer, 109(2): 308-313.
Mondol, M. Y. A. (1998) Studies on the physical properties of BAU farm soil. M. S. Thesis, Dept. Soil. Science BAU, Mymensingh.
Monga, V., Singh, L. P., Bhardwaj, A., & Singh, H. (2012). Respiratory health in brick kiln workers. Int. J. Phys. Soc. Sci. 2(4): 226-44.

49
Mukherjee, S. and Chakraborty, D. (2013). Environmental cost of using topsoil for brick-making. In Environmental Scenario in India, Routledge. pp. 143-158.
Marshall, T. J. (1962). Mechanical composition of soils in relation to field description of texture. Commonwealth Aust. Council. Sci. Ind. Res. Melbourne, Australia, Bull. 224. P. 20.
Ostro, Bart, and World Health Organization. "Outdoor air pollution: assessing the environmental burden of disease at national and local levels." (2004).
Page, A. L., Miller, R. H., and Keeney, D. R. (1982). Methods of soil analysis, part 2. Chemical and microbiological properties, 2.
Piper, C. S. (1950). Soil and Plant Analysis (The University of Adelaide.). Inter. Sci. Pub., New York, USA.
Pokhrel, R., and Lee, H. (2011). Estimation of the effective zone of sea/land breeze in a coastal area. Atmospheric Pollution Research, 2(1), 106-115.
Pope, K. L. (2002). U.S. Patent Application 29/141,525.
Portch, S. and Islam, M. S. (1984). Nutrient status of some important agricultural soils of Bangladesh. In proc. Of the Int. Symp. On soil test crop response correlation studies, BARK, Dhaka. pp. 98-107
Rai, A.K., B. Paul and Singh, G. (2009). Assessment of soil quality in the vicinity of subsided area in the south eastern part of Jharia Coalfield, Jharkhand, India. Int. J. Report Opinion. 1 (6): 18-23.
Rahman, M.K. and Khan, H. R. (2001). Impacts of brick kiln on topsoil degradation and environmental pollution. Research Project Report. Ministry of Science, Information and Communication Technology. Bangladesh. pp. 210.
Rahman, M. 2012. Brickfield. Banglapedia. National Encyclopedia of Bangladesh.Asiatic Society of Bangladesh. http://en. banglapedia.org/index.php?title=Brickfield.
Rahman, M. K. and Khan, H. R. (2015). Impacts of brick kiln on topsoil degradation and environmental pollution. Project report submitted to the Ministry of Science and Information and Communication Technology, Bangladesh Secretariat (Dhaka), 210.
Rajonee, A. A. and Uddin, M. J. (2018). Changes in Soil Properties with Distance in Brick Kiln Areas around Barisal. Open J. of Soil Sci. 8(03): 118.
Sanders, C. S. (1995). Collected papers of charles sanders peirce. Harvard University Press.
Skinder, B. M., Pandit, A. K., Sheikh, A. Q. and Ganai, B. A. (2014). Brick kilns: cause of atmospheric pollution. J. Pollut. Eff. Cont. 2: 110.

50
Skinder, B. M., Sheikh, A. Q., Pandit, A. K. and Ganai, B. A. (2014). Brick kiln emissions and its environmental impact: A Review. J. of Eco. and The Natural Env. 6(1): 1-11.
SRDI. (1991). Land and Soil Utilization Guide. Upazila Nirdeshika Series Sadar Upazilla of Kurigram. SRDI, Dhaka, Bangladesh. pp. 50-55.
SRDI. (2001). Land and Soil Utilization Guide. Upazila Nirdeshika Series- Ulipur Upazilla . SRDI, Dhaka, Bangladesh. pp. 43-60.
SRDI. (2001). Land and Soil Utilization Guide. Upazila Nirdeshika Series Sadar Upazilla of Kurigram. SRDI, Dhaka, Bangladesh. pp. 35-52
SRDI. (2009). Land and Soil Utilization Guide. Upazila Nirdeshika Series- Ulipur Upazilla SRDI, Dhaka, Bangladesh. pp. 56-62.
Tucker, M.R., J.K. Messick and C. Stokes. 1995. Soil fertility note 14: Topsoil. North Carolina Department of Agriculture and Consumer Services (NCDA and CS).NCDA and CS Agronomic division. USA. pp. 1-2.
Warkentin, B.P. (2002). Soil and the environment, commission VIII. In: Bulletin of the International Union of Soil Science, No. 101, World Congress of Soil Science, 14-21 August. Thailand. pp. 29-32.
Zaman, M.W. and Nuruzzaman, M. (1995). Effect of long term ground water irrigation on the fertility status of Madhupur Upazilla soil in Bangladesh. Thai J. Agril. Sci. 28: 64-77
http://www.myweather2.com

51
APPENDICES
Appendix I. pH values in the surface soil (0-15 cm) in different brick kiln in the
experimental area
Appendix II. pH values in the surface soil (15-30 cm) in different brick kiln in the experimental area
Sampling point Burnt soil Unburnt soil
MMB 5.10 5.68SAB 5.53 5.57MJHB 5.40 5.74GMB 5.32 5.83MBU 5.14 5.97SFU 5.25 5.69Mean 5.29 5.73
SD 0.16 0.15
Sampling point Burnt soil Unburnt soil
MMB 4.23 4.83SAB 4.19 4.59MJHB 5.1 4.71GMB 4.53 4.92MBU 5.35 5.79SFU 5.1 5.35Mean 4.75 5.03SD 0.50 0.45
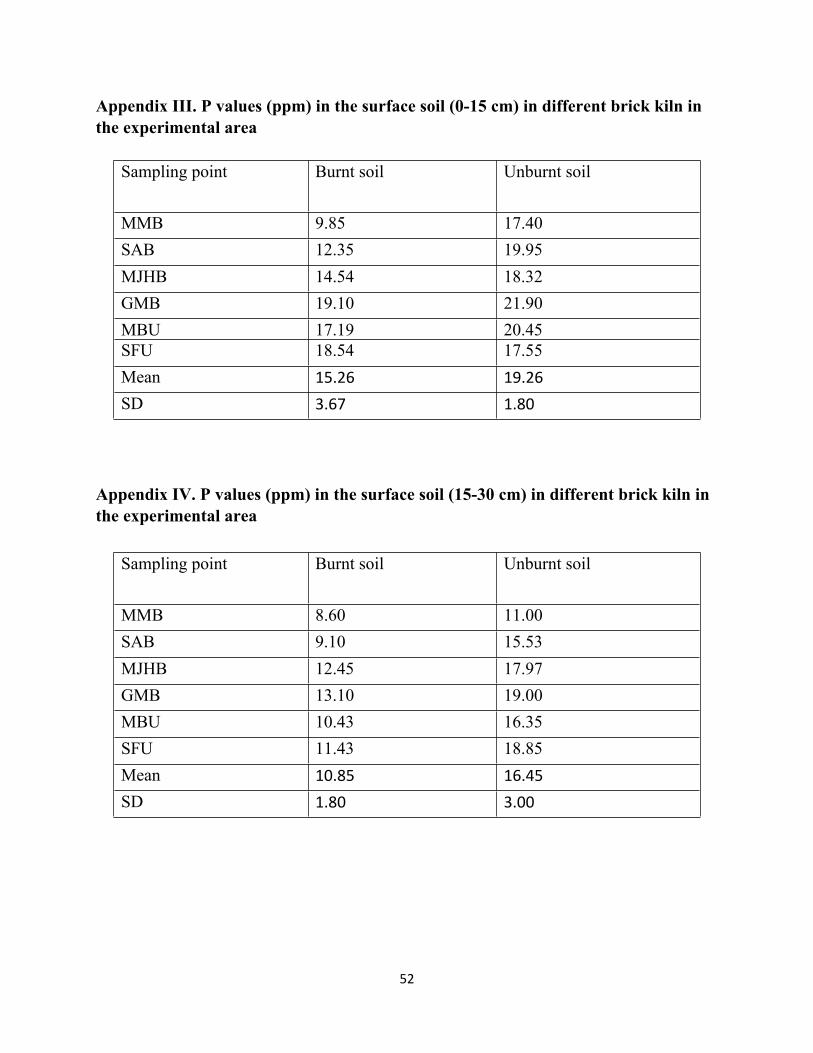
52
Appendix III. P values (ppm) in the surface soil (0-15 cm) in different brick kiln in the experimental area
Appendix IV. P values (ppm) in the surface soil (15-30 cm) in different brick kiln in the experimental area
Sampling point Burnt soil Unburnt soil
MMB 9.85 17.40SAB 12.35 19.95MJHB 14.54 18.32GMB 19.10 21.90MBU 17.19 20.45SFU 18.54 17.55Mean 15.26 19.26SD 3.67 1.80
Sampling point Burnt soil Unburnt soil
MMB 8.60 11.00SAB 9.10 15.53MJHB 12.45 17.97GMB 13.10 19.00MBU 10.43 16.35SFU 11.43 18.85Mean 10.85 16.45SD 1.80 3.00
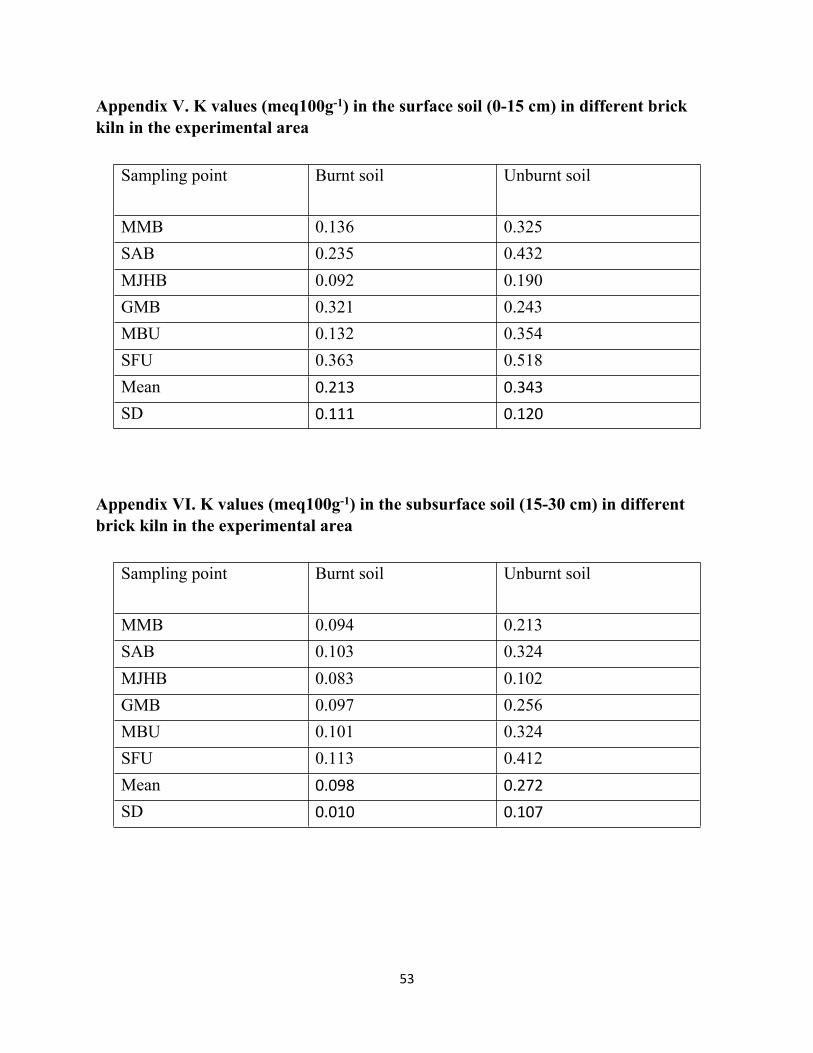
53
Appendix V. K values (meq100g-1) in the surface soil (0-15 cm) in different brick kiln in the experimental area
Appendix VI. K values (meq100g-1) in the subsurface soil (15-30 cm) in different brick kiln in the experimental area
Sampling point Burnt soil Unburnt soil
MMB 0.136 0.325SAB 0.235 0.432MJHB 0.092 0.190GMB 0.321 0.243MBU 0.132 0.354SFU 0.363 0.518Mean 0.213 0.343SD 0.111 0.120
Sampling point Burnt soil Unburnt soil
MMB 0.094 0.213SAB 0.103 0.324MJHB 0.083 0.102GMB 0.097 0.256MBU 0.101 0.324SFU 0.113 0.412Mean 0.098 0.272SD 0.010 0.107

54
Appendix VII. EC values (dsm-1) in the surface soil (0-15 cm) in different brick kiln in the experimental area
Appendix VIII. EC values (dsm-1) in the subsurface soil (15-30 cm) in different brick kiln in the experimental area
Sampling point Burnt soil Unburnt soil
MMB 24.3 26.7SAB 9.8 13.4MJHB 17.6 18.7GMB 17.9 19.0MBU 29.7 34.2SFU 32.2 36.1Mean 21.917 24.683SD 8.409 9.169
Sampling point Burnt soil (EC) Unburnt soil (EC)
MMB 7.6 8.5SAB 5.3 8.7MJHB 8.3 9.8GMB 9.7 13.6MBU 13.2 18.9SFU 12.7 24.6Mean 9.467 14.017SD 3.054 6.519