Impact of BAT and NAFTA Reforms on the U.S. Motor Vehicle ... MEMA BAT NAFTA Study... · The U.S....
24
Do Not Reproduce More Than Three Slides Without Permission Impact of BAT and NAFTA Reforms on the U.S. Motor Vehicle Industry Summary of analysis and key findings July 2017
Transcript of Impact of BAT and NAFTA Reforms on the U.S. Motor Vehicle ... MEMA BAT NAFTA Study... · The U.S....

Do Not Reproduce More Than Three Slides Without Permission
Impact of BAT and NAFTA Reforms on the
U.S. Motor Vehicle Industry Summary of analysis and key findings
July 2017
1
Do Not Reproduce More Than Three Slides Without Permission
Copyr
ight
© 2
017 b
y T
he B
osto
n C
onsultin
g G
roup,
Inc.
All
rights
reserv
ed.
Study was commissioned by MEMA and conducted
independently by BCG in the spring of 2017
Steve Handschuh
President and CEO of the
Motor & Equipment
Manufacturers
Association (MEMA)
Raleigh-Durham, NC
+1 919 406 8840
Xavier Mosquet
Senior Partner & Managing
Director at BCG, founder of
the firm's Detroit office, and
lead author of the study
BCG Detroit
+1 248 688 3456
Ann Wilson
Senior Vice President of
Government Affairs for
MEMA
Washington DC
+1 202 312 9246

2
Do Not Reproduce More Than Three Slides Without Permission
Copyr
ight
© 2
017 b
y T
he B
osto
n C
onsultin
g G
roup,
Inc.
All
rights
reserv
ed.
Key findings
The U.S. motor vehicle (MV) industry relies on a complex global supply chain built over the last several
decades. Mexico and Canada are the largest trade partners.
Under current market conditions, the economics of reshoring are not favorable for most MV products
• Production in Mexico still more economical in the event of a BAT
• OEMs and suppliers have enough capacity in North America given stable markets
On average, the cost of production would rise across the MV industry due to a BAT or the introduction
of tariffs
• A 15% BAT would result in ~$1,000 in added production costs per vehicle for automotive OEMs
• Withdrawal from NAFTA with a 35% tariff would result in an increase of ~$1,200 per vehicle
• The range of cost impact could result in the creation of winners and losers among both foreign and
domestic OEMs
• Long term, currency fluctuations may compensate for part of the cost increase
Short-term cost increases could impact up to 50,000 U.S. motor vehicle supplier jobs as customers
buy less contented vehicles to offset the cost increase
Access to NAFTA low-cost production is critical to compete in the global market
• Germany relies on low-cost production in nearby Eastern Europe to keep costs down

3
Do Not Reproduce More Than Three Slides Without Permission
Copyr
ight
© 2
017 b
y T
he B
osto
n C
onsultin
g G
roup,
Inc.
All
rights
reserv
ed.
A border tax and NAFTA withdrawal continue to surface as
potential elements in tax and trade reform discussions
Changes under
consideration Factors studied
Border Adjustment Tax
(BAT)
• Introduction of a border
adjustment tax
• Reduction of corporate tax
rate to between 15% and
20%
• Changes to treatment of
capital expenses and interest
deductibility
• Repatriation holiday for
foreign profits
Trade flows
Motor vehicle industry
baseline
Mechanics and monetary
impacts of tax and trade
reforms
Potential actions for motor
vehicle industry
North America Free
Trade Agreement
(NAFTA)
• Full withdrawal from NAFTA
• Updates to existing elements
including rules or origin,
intellectual property
protection, environmental
health and safety standards
4
Do Not Reproduce More Than Three Slides Without Permission
Copyr
ight
© 2
017 b
y T
he B
osto
n C
onsultin
g G
roup,
Inc.
All
rights
reserv
ed.
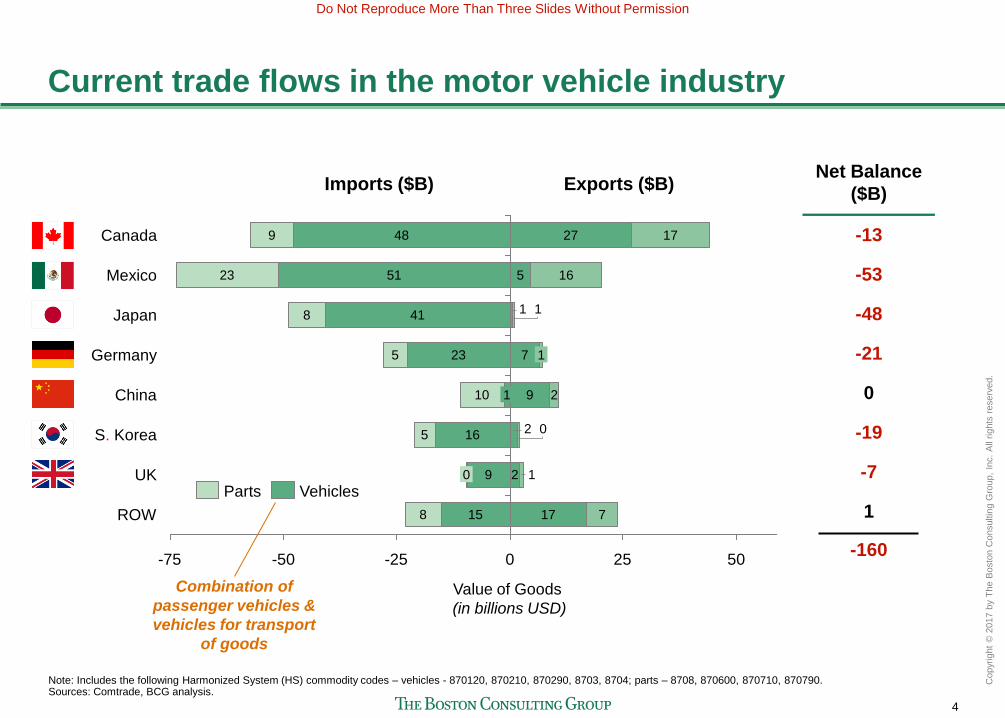
Current trade flows in the motor vehicle industry
-25 -75 50 0 -50 75 25
UK
ROW
16
1
27
5
1
48
51
41
1 7 23
Mexico
5
0
8
9 1
0 2 16
1 2 9
7 17
9
23
8
5
10
Germany
2 China
Value of Goods
(in billions USD)
Canada
Japan
17
S. Korea
15
Vehicles Parts
Imports ($B) Exports ($B) Net Balance
($B)
-13
1
-7
-19
0
-21
-48
-53
-160
Note: Includes the following Harmonized System (HS) commodity codes – vehicles - 870120, 870210, 870290, 8703, 8704; parts – 8708, 870600, 870710, 870790. Sources: Comtrade, BCG analysis.
Combination of
passenger vehicles &
vehicles for transport
of goods

5
Do Not Reproduce More Than Three Slides Without Permission
Copyr
ight
© 2
017 b
y T
he B
osto
n C
onsultin
g G
roup,
Inc.
All
rights
reserv
ed.
Breakdown of NAFTA trade flows
-50 -75 50 25 0 -25
23 27
17 15
Value of Goods
(in billions USD)
24 1
9 1 46
4 16
12
Imports ($B) Exports ($B)
Passenger vehicles
Heavy-duty trucks
Parts
Note: Includes the following HS commodity codes – passenger vehicles - 870210, 870290, 8703; heavy duty trucks: 870210, 8704; parts – 8708, 870600, 870710, 870790. Sources: Comtrade, BCG analysis.

6
Do Not Reproduce More Than Three Slides Without Permission
Copyr
ight
© 2
017 b
y T
he B
osto
n C
onsultin
g G
roup,
Inc.
All
rights
reserv
ed.
The economics of reshoring are not favorable for most
motor vehicle products
15.015.0100
0
Total
US Cost
103.7
BAT
Avoidance
Freight
1.9
Indirect
Labor
2.8
Direct
Labor
2.9
Total
MX Cost
114.8
99.8
Per unit
impact Change in cost of reshoring from MEX to US
Payback on $50M
investment at 500K
units / year volume
~-$11/unit ~9 years
~+$2/unit n/a
2.33.6
2.3
20
0
19.5
Total
US Cost
BAT
Avoidance
Freight
1.3
Indirect
Labor
1.9
Direct
Labor
17.6
15.3
Total
MX Cost
Vehicle
Interior Part 2
(direct labor =
3% as % of MX
TLC1)
Vehicle
Interior Part 1
(direct labor =
20% as % of MX
TLC1)
1. Percentage of Pre-BAT total landed cost (TLC) to make in Mexico. TLC is the sum of all costs associated with making and delivering products to the point where they produce revenue. Note: Calculated with 15% BAT. Sources: BCG analysis, sanitized company data.
Part Type
$ / Part
$ / Part
Original MX cost
BAT impact
Original MX cost
BAT impact
BAT
Compared to
typical payback
period of ~3 years

7
Do Not Reproduce More Than Three Slides Without Permission
Copyr
ight
© 2
017 b
y T
he B
osto
n C
onsultin
g G
roup,
Inc.
All
rights
reserv
ed.
U.S. sales volume at its peak
15
20
10
5
0
U.S. Light-Vehicle Sales
(in millions)
+8%
25 24 23 22 21 20 19 18 17 16
17.6
15 14 13 12 11 10 09 08 07 06 05 04 03 02 01 00
June SAAR at
~16.8M1
1. Per Ward's Automotive. SAAR stands for seasonally adjusted annual rate. Sources: IHS, BCG analysis.
Forecasted
Actuals
8
Do Not Reproduce More Than Three Slides Without Permission
Copyr
ight
© 2
017 b
y T
he B
osto
n C
onsultin
g G
roup,
Inc.
All
rights
reserv
ed.
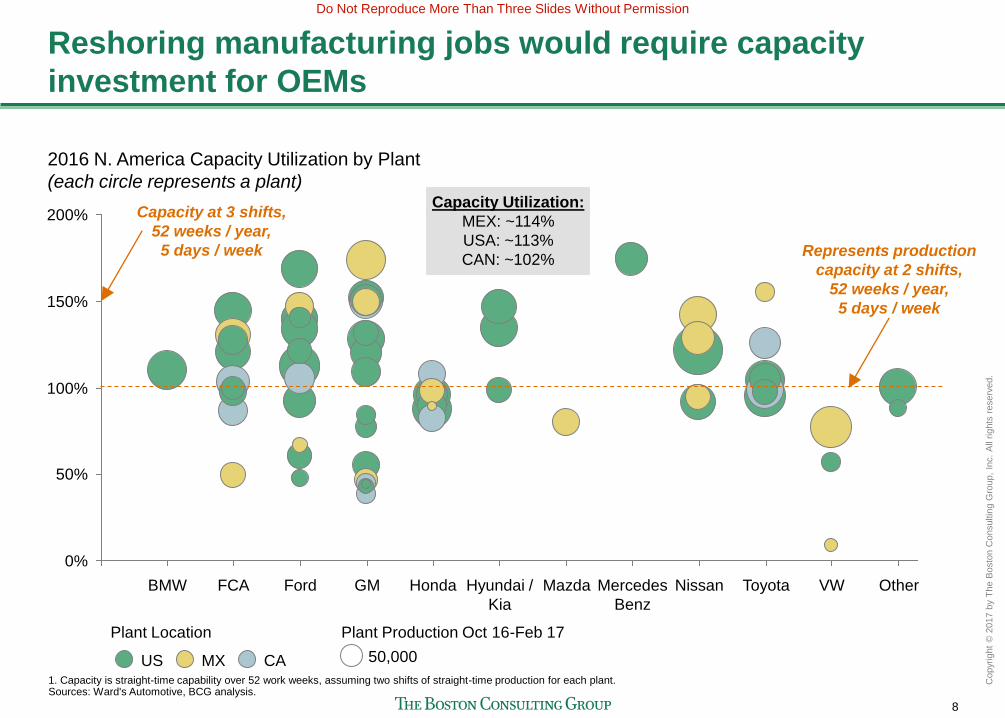
Reshoring manufacturing jobs would require capacity
investment for OEMs
0%
50%
100%
150%
200%
Other VW Toyota Nissan Mercedes
Benz
Mazda Hyundai /
Kia
Honda GM Ford FCA BMW
2016 N. America Capacity Utilization by Plant
(each circle represents a plant)
50,000 CA MX US
Plant Location Plant Production Oct 16-Feb 17
1. Capacity is straight-time capability over 52 work weeks, assuming two shifts of straight-time production for each plant. Sources: Ward's Automotive, BCG analysis.
Represents production
capacity at 2 shifts,
52 weeks / year,
5 days / week
Capacity at 3 shifts,
52 weeks / year,
5 days / week
Capacity Utilization:
MEX: ~114%
USA: ~113%
CAN: ~102%

9
Do Not Reproduce More Than Three Slides Without Permission
Copyr
ight
© 2
017 b
y T
he B
osto
n C
onsultin
g G
roup,
Inc.
All
rights
reserv
ed.
Global
recession
Automotive suppliers face similar capacity constraints
Note: In July 2015, the Federal Reserve published an annual revision to the CU index incorporating new benchmark data for 2012, 2013, and 2014. In addition, the base year for IP was changed from 2007 to 2012, moving IP from 96.1 in January 2015 to 100 in July 2015. Sources: Original Equipment Suppliers Association Automotive Supplier Barometer, U.S. Federal Reserve Board, BCG analysis.
Significant
tightening since
recession
0%
25%
50%
75%
100%
+36%
16 15 14 13 12 11 10 09 08 07 06 05 04 03 02 01 00
U.S. supplier capacity utilization
10
Do Not Reproduce More Than Three Slides Without Permission
Copyr
ight
© 2
017 b
y T
he B
osto
n C
onsultin
g G
roup,
Inc.
All
rights
reserv
ed.
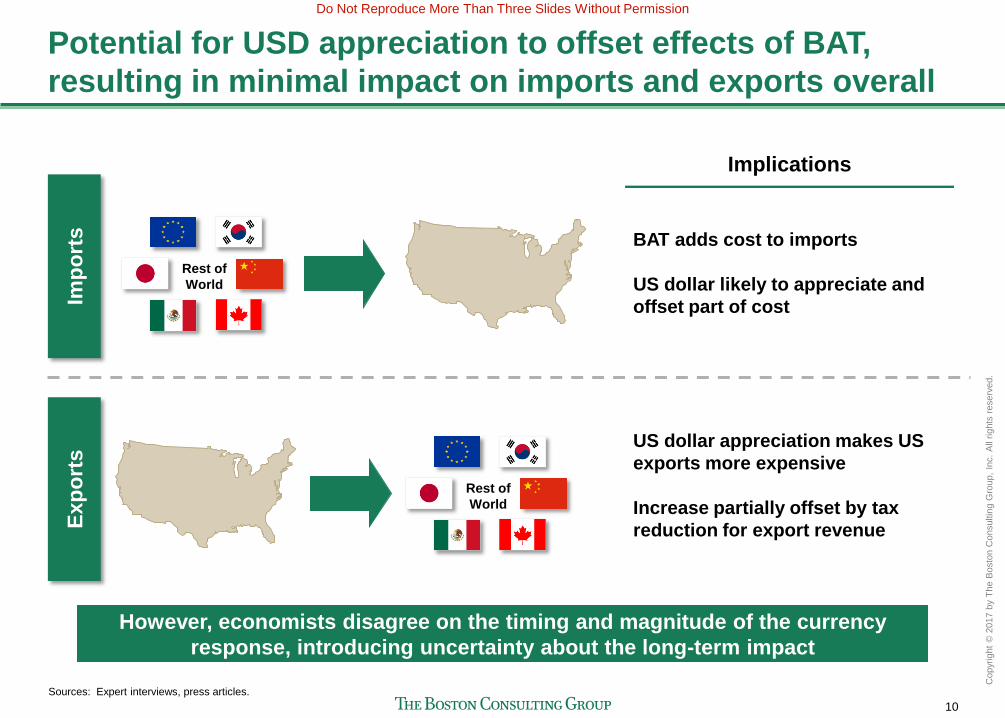
Potential for USD appreciation to offset effects of BAT,
resulting in minimal impact on imports and exports overall Im
po
rts
Ex
po
rts
Implications
BAT adds cost to imports
US dollar likely to appreciate and
offset part of cost
Rest of
World
Rest of
World
Sources: Expert interviews, press articles.
US dollar appreciation makes US
exports more expensive
Increase partially offset by tax
reduction for export revenue
However, economists disagree on the timing and magnitude of the currency
response, introducing uncertainty about the long-term impact

11
Do Not Reproduce More Than Three Slides Without Permission
Copyr
ight
© 2
017 b
y T
he B
osto
n C
onsultin
g G
roup,
Inc.
All
rights
reserv
ed.
-100
400
-300
1,000
0
5,000
4,000
3,000
2,000
2,600
2,500
4,400
3,000
-500
$ / vehicle impact
(in USD)
OE
M 1
300
OE
M 1
0
800
OE
M 1
1
1,000
OE
M 8
~1,0251
OE
M 1
2
~1,8002
1,700
OE
M 7
1,300
700
OE
M 6
1,600
1,000
OE
M 5
OE
M 2
1,500
OE
M 4
2,400
1,600
OE
M 3
500
OE
M 9
1,400
400
3,800
2,400
Impact of BAT on production costs varies by OEM
1. 15% BAT average. 2. 20% BAT average. Sources: BCG analysis, JD Power, IHS, UBS, Baum & Associates, Barclays.
Increased vehicle costs create two likely
responses from consumers buying new vehicle
BAT adds ~$1,0001 - $1,8002 on average to
vehicle production costs across OEMs
A
B
Make and model transfer: Consumers
may consider switching to makes and
models less affected by BAT
"De-content" vehicle: Reduced consumer
spending power leads to removal of vehicle
features, potentially including advanced
safety and driver-assist technology
Rear-view Camera Parking Assist
Illustrative examples
20% BAT
15% BAT

12
Do Not Reproduce More Than Three Slides Without Permission
Copyr
ight
© 2
017 b
y T
he B
osto
n C
onsultin
g G
roup,
Inc.
All
rights
reserv
ed.
Tariff within NAFTA would result in increased production
costs across all OEMs
900 900800 700 700
600 500 500400 400
0
500
1,000
1,500
2,000
1,100
OE
M 6
OE
M 1
0
700
OE
M 9
1,200
OE
M 5
1,300
100
200
OE
M 4
1,400
900
OE
M 8
900
6502
1,1451
OE
M 1
2
1,600
700
1,600
OE
M 1
2,000
1,100
OE
M 3
Incremental cost per vehicle for OEMs
OE
M 1
1
OE
M 7
OE
M 2
35% Tariff 20% Tariff
1. 35% tariff. 2. 20% tariff. Note: Analysis reflects implementation of tariff on Mexican goods. Source: BCG analysis.

13
Do Not Reproduce More Than Three Slides Without Permission
Copyr
ight
© 2
017 b
y T
he B
osto
n C
onsultin
g G
roup,
Inc.
All
rights
reserv
ed.
BAT-induced shift to less affected make and model could
create winners and losers among OEMs and suppliers
Note: Calculated with 15% BAT. Sources: BCG analysis, OEM websites, JD Power.
Production
Location
Current
MSRP
BAT Impact
New Price
$22,640
~$1,500
$24,140
$31,640
~$4,000
$35,640
$23,640
~$2,700
$26,340
$29,693
~$450
$30,140
Financial Impact of BAT
Vehicle 1
Domestic OEM
Vehicle 2
Foreign OEM
Vehicle 3
Foreign OEM
Vehicle 4
Domestic OEM
14
Do Not Reproduce More Than Three Slides Without Permission
Copyr
ight
© 2
017 b
y T
he B
osto
n C
onsultin
g G
roup,
Inc.
All
rights
reserv
ed.
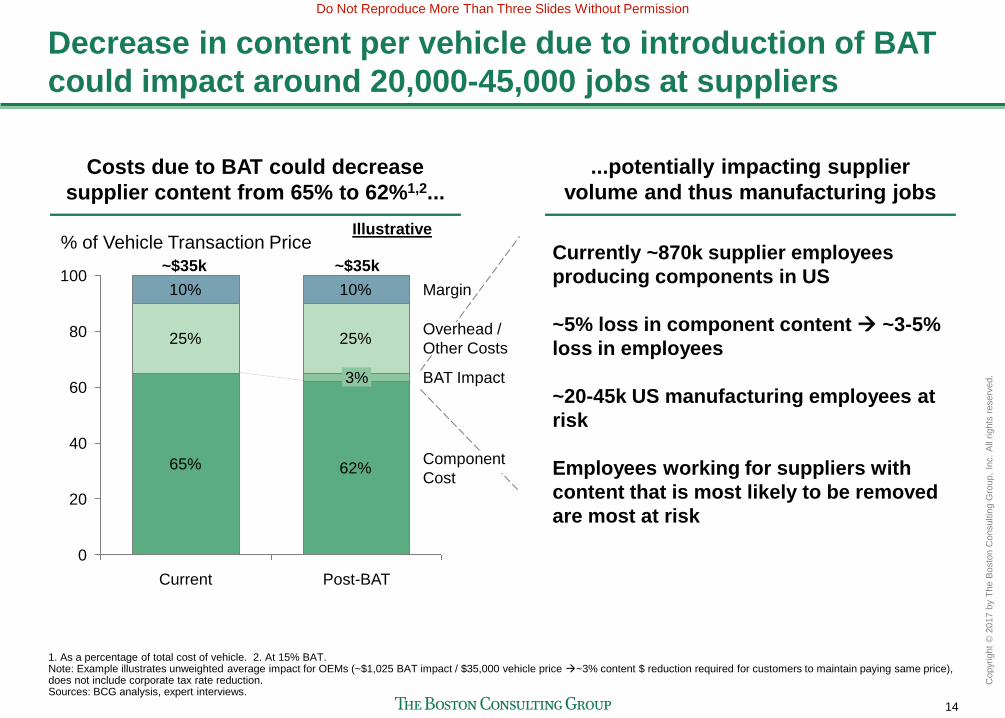
Decrease in content per vehicle due to introduction of BAT
could impact around 20,000-45,000 jobs at suppliers
65% 62%
25% 25%
10% 10%
60
40
100
80
20
0
% of Vehicle Transaction Price
Component
Cost
BAT Impact
Overhead /
Other Costs
Margin
Post-BAT
3%
Current
Costs due to BAT could decrease
supplier content from 65% to 62%1,2...
...potentially impacting supplier
volume and thus manufacturing jobs
Currently ~870k supplier employees
producing components in US
~5% loss in component content ~3-5%
loss in employees
~20-45k US manufacturing employees at
risk
Employees working for suppliers with
content that is most likely to be removed
are most at risk
Illustrative
1. As a percentage of total cost of vehicle. 2. At 15% BAT. Note: Example illustrates unweighted average impact for OEMs (~$1,025 BAT impact / $35,000 vehicle price ~3% content $ reduction required for customers to maintain paying same price), does not include corporate tax rate reduction. Sources: BCG analysis, expert interviews.
~$35k ~$35k

15
Do Not Reproduce More Than Three Slides Without Permission
Copyr
ight
© 2
017 b
y T
he B
osto
n C
onsultin
g G
roup,
Inc.
All
rights
reserv
ed.
Similarly, tariff from leaving NAFTA could impact around 25-
50,000 suppliers' jobs as a result of content decrease
65.0% 61.5%
25.0% 25.0%
10.0% 10.0%
20
0
80
60
100
40
% of Vehicle Transaction Price
Margin
Overhead /
Other Costs
Tariff Impact
Component
Cost
Current Post-tariff
3.5%
Costs due to a 35% tariff could decrease
supplier content from 65% to ~61.5%1...
...potentially impacting supplier
volume and thus manufacturing jobs
Currently ~870k supplier employees
producing components in US
~6% loss in component content ~3-6%
loss in employees
~25-50k US manufacturing employees at
risk
Employees working for suppliers with
content that is most likely to be removed
are most at risk
Illustrative
1. As a % of total cost of vehicle. Note: Example illustrates unweighted average impact for OEMs (~$1,150 tariff impact / $35,000 vehicle price ~3.5% content $ reduction required for customers to maintain paying same price Sources: BCG analysis, expert interviews.
~$35k ~$35k

16
Do Not Reproduce More Than Three Slides Without Permission
Copyr
ight
© 2
017 b
y T
he B
osto
n C
onsultin
g G
roup,
Inc.
All
rights
reserv
ed.
0
2,000
4,000
6,000
Germany
$ per vehicle
of imported parts
6,297
3,450
(55%)
USA
5,557
1,890
(34%)
1,589
(29%)
Both the U.S. and Germany rely heavily on imported parts
from low-cost countries
$ of parts imported
from low-cost country
per vehicle
~$3,480 ~$3,450
U.S. and Germany are equally reliant on imported
parts from low-cost countries
Sources: Comtrade, BCG analysis.
Mexico an important
source of low-cost
production for U.S.
Parts imported
from Mexico
Parts imported from
low-cost country
Parts imported from
non-low-cost country
Germany reliant on
low-cost Eastern
EU countries

17
Do Not Reproduce More Than Three Slides Without Permission
Copyr
ight
© 2
017 b
y T
he B
osto
n C
onsultin
g G
roup,
Inc.
All
rights
reserv
ed.
Other policy actions that could be pursued to enhance U.S.
competitiveness in the motor vehicle industry
Infrastructure: Invest to overhaul and modernize the nation’s highways, bridges, and ports
Trade: Provide tougher enforcement of "fair trade" policies and enhanced protection of US
intellectual property abroad
Tax Policy: Increase the attractiveness of repatriation accumulated foreign earnings
Workforce Development: Invest in building a workforce equipped with the skills needed for
the manufacturing jobs of tomorrow
Corporate Average Fuel Economy (CAFE)/Greenhouse Gas Emissions: Harmonize standards
across agencies and retain and grow off-cycle technology credits
Safety Standards: Update the New Car Assessment Program (NCAP) to include information
about crash avoidance and pedestrian protection as part of its 5-star ratings

18
Do Not Reproduce More Than Three Slides Without Permission
Copyr
ight
© 2
017 b
y T
he B
osto
n C
onsultin
g G
roup,
Inc.
All
rights
reserv
ed.
MEMA's organization
19
Do Not Reproduce More Than Three Slides Without Permission
Copyr
ight
© 2
017 b
y T
he B
osto
n C
onsultin
g G
roup,
Inc.
All
rights
reserv
ed.
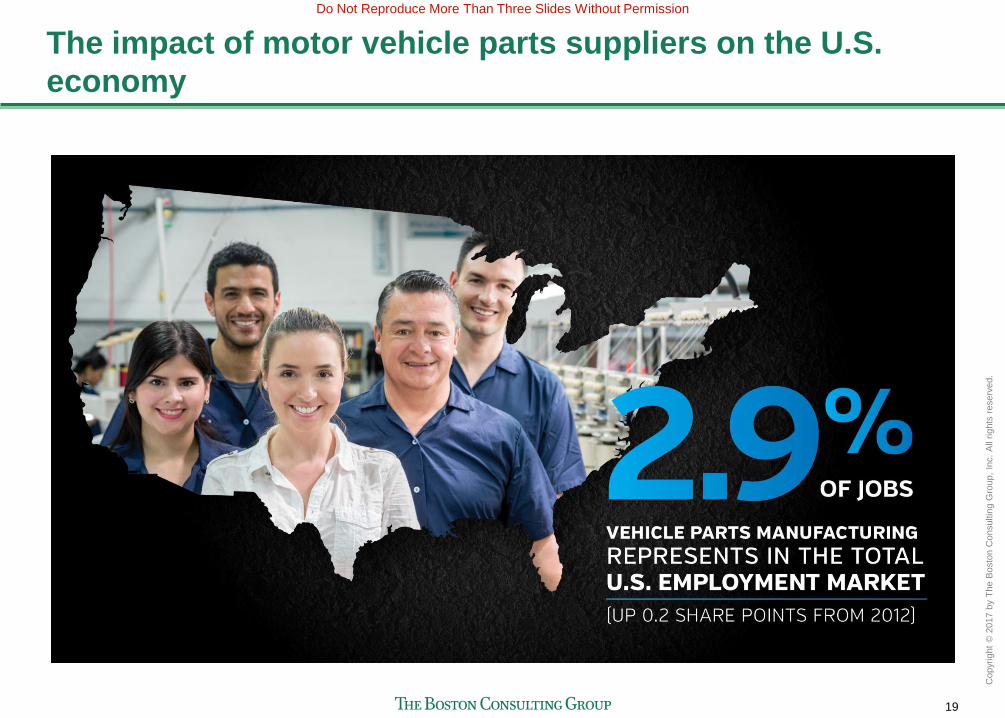
The impact of motor vehicle parts suppliers on the U.S.
economy
20
Do Not Reproduce More Than Three Slides Without Permission
Copyr
ight
© 2
017 b
y T
he B
osto
n C
onsultin
g G
roup,
Inc.
All
rights
reserv
ed.
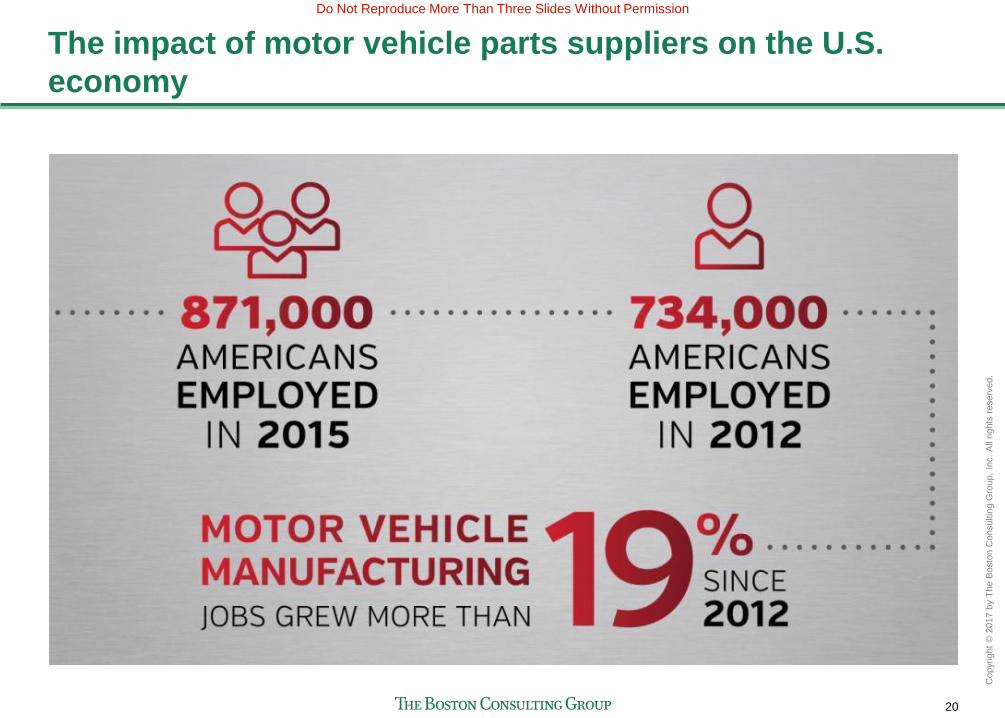
The impact of motor vehicle parts suppliers on the U.S.
economy

21
Do Not Reproduce More Than Three Slides Without Permission
Copyr
ight
© 2
017 b
y T
he B
osto
n C
onsultin
g G
roup,
Inc.
All
rights
reserv
ed.
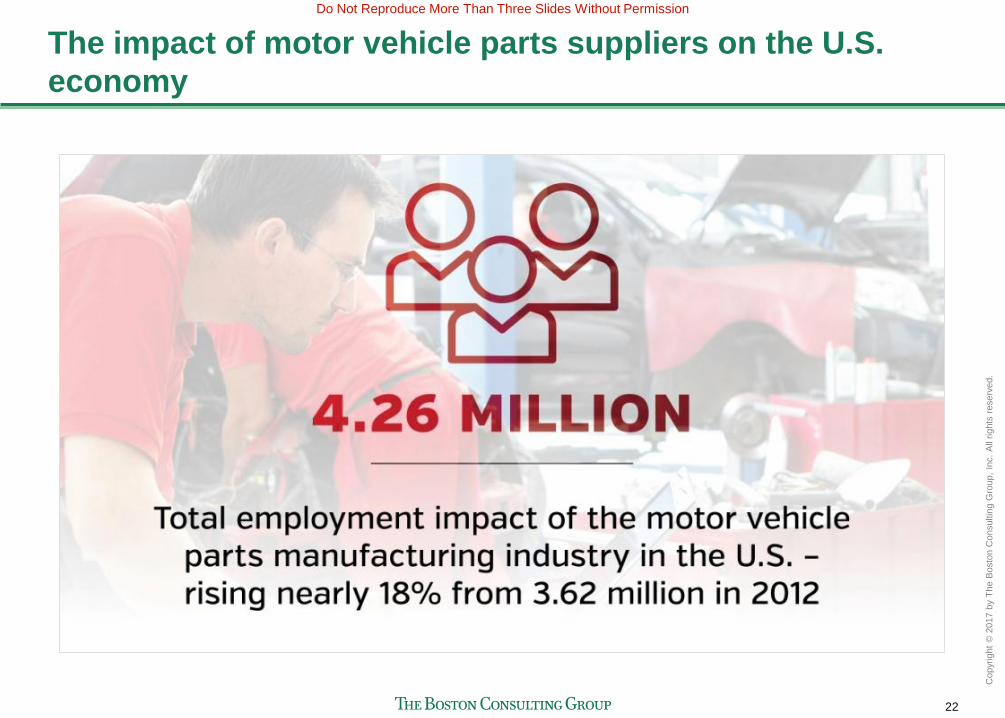
The impact of motor vehicle parts suppliers on the U.S.
economy
22
Do Not Reproduce More Than Three Slides Without Permission
Copyr
ight
© 2
017 b
y T
he B
osto
n C
onsultin
g G
roup,
Inc.
All
rights
reserv
ed.
The impact of motor vehicle parts suppliers on the U.S.
economy

23
Do Not Reproduce More Than Three Slides Without Permission
Copyr
ight
© 2
017 b
y T
he B
osto
n C
onsultin
g G
roup,
Inc.
All
rights
reserv
ed.
Contacts for further information
For media inquiries:
To arrange an interview with a BCG author of the study, please contact Dave Fondiller at +1 212 446 32576
To arrange an interview with a MEMA executive, please contact Cindy Sebrell at +1 202 658 9487 (cell) or
+1 202 312 9250 (office) or [email protected].
For non-media inquiries:
To discuss the findings with a MEMA executive, please contact Ann Wilson at +1 202 312 9246 or

![INDIRECT EXPROPRIATION UNDER NAFTA AND DR-CAFTA: … · 2006] INDIRECT EXPROPRIATION UNDER NAFTA AND DR-CAFTA 933 NAFTA and DR-CAFTA. Part II explains how three earlier NAFTA tribunals](https://static.fdocuments.in/doc/165x107/5ec6d30ffb2475648e7b2fba/indirect-expropriation-under-nafta-and-dr-cafta-2006-indirect-expropriation-under.jpg)