
Impact of Baltic Synchronization on the Nordic Power ... · Impact of Baltic Synchronization on the...
36
IMPACT OF BALTIC SYNCHRONIZATION ON THE NORDIC POWER SYSTEM STABILITY
Transcript of Impact of Baltic Synchronization on the Nordic Power ... · Impact of Baltic Synchronization on the...
IMPACT OF BALTIC SYNCHRONIZATION ON THE
NORDIC POWER SYSTEM STABILITY
Impact of Baltic Synchronization on the Nordic Power System Stability
Abstract ....................................................................................................................................... 2
1 Introduction .......................................................................................................................... 4
2 Models and Methods ........................................................................................................... 4
2.1 Simulation Models ........................................................................................................... 4
2.2 Description of the AC Connection between the Nordic and Baltic Systems ..................... 4
2.3 Power Flow Cases .......................................................................................................... 5
2.3.1 Oscillation Cases ..................................................................................................... 5
2.3.2 Voltage Stability Case .............................................................................................. 8
2.4 Executed Studies .......................................................................................................... 10
3 Results ................................................................................................................................ 11
3.1 Dynamic Stability .......................................................................................................... 11
3.1.1 Comparison between Faults ................................................................................... 11
3.1.2 Comparison between Cases without Visaginas ...................................................... 13
3.1.3 Impact of the Baltic Synchronization on the Severity of Critical Faults .................... 17
3.1.4 Case Visaginas ...................................................................................................... 18
3.1.5 Effect of the Baltic Stabilizers in the Most Critical Case .......................................... 22
3.1.6 Conclusions on Dynamic Stability .......................................................................... 25
3.2 Voltage Stability ............................................................................................................ 26
3.2.1 Results with Different Faults ................................................................................... 26
3.2.2 Conclusions on Voltage Stability ............................................................................ 27
3.3 Inertia and Frequency Stability ...................................................................................... 27
3.3.1 Simulated Frequency Behaviour ............................................................................ 27
3.3.2 Estimation of Inertia based on the Market Simulation Results ................................ 29
3.4 Conclusions on Inertia and Frequency Stability ............................................................. 31
4 Cost Estimate ..................................................................................................................... 32
5 Conclusions and Recommendations ............................................................................... 33
References ................................................................................................................................. 35
Impact of Baltic Synchronization on the Nordic Power System Stability 2 (35)
16.11.2016
Abstract
The Nordic power system stability properties are affected by the proposed synchronization of the Baltic system. This Nordic report presents a screening study pinpointing the main impacts of the synchronization on the stability of the both systems, and in this way complements the European Commission JRC study from the stability point of view. It also supports in the decision making when considering the different options for future operation of the Baltic system. However, further and more detailed analyses are needed to investigate all the details. The study has been done given the assumption in the European study, that no additional market capacity will be available to the markets from the AC cables between Finland and Estonia, and the cables would only be used for synchronization. Considering additional capacity to the markets would require a completely new study.
The main emphasis is on the dynamic stability, but the voltage and frequency stabilities are also briefly analysed. The study is carried out with simulation analyses in some of the most critical scenarios during the year 2025 that is a possible target year of the synchronization.
Synchronization of the Baltic system affects the characteristics of the main ("0.3 Hz") inter-area electromechanical oscillation mode that currently occurs between South Finland and South Sweden and Norway. After synchronization, the Baltic system participates in the oscillations in phase with the Finnish generators. The mode frequency and damping decreases due to the synchronization if no necessary measures are taken to tune controllers of the generators in the Baltic countries. A new oscillation mode between Baltic and Finland is also introduced at about 0.5 Hz frequency when the synchronous connection is established.
If the Visaginas nuclear plant is constructed in Lithuania, its dynamic behaviour is significant for damping of the oscillations. In addition, the severity of the faults, that are critical when transferring power from Finland to Sweden, changes. Especially the synchronization affects the severity of the NordBalt and Estlink faults because they connect oscillating areas of the system after the synchronization.
The synchronization would also require successful re-tuning, retrofitting, or installation of power system stabilizers in the Baltic generators to restore damping of the main inter-area mode on the same level than before synchronization. In addition, it might be necessary, or at least beneficial, to add or take in use power oscillation damping controllers on the NordBalt, Fenno-Skan, and possibly on the Estlink HVDC links, and even add SVCs with damping controls.
A critical fault in terms of voltage stability is tripping of the NordBalt HVDC link at full import to the Baltics. The power flow simulations indicate voltage issues mainly in Southern Finland, and especially in the Helsinki region, in this case. However, these voltage stability issues, without the Visaginas plant, could very likely be solved with additional shunt compensation, such as SVCs.
If the Visaginas plant is included, its tripping at full power causes voltage instability in the grid. Therefore, in case the plant is constructed, reinforcements in the Baltic and/or Finnish grid and/or special system protection schemes have to be applied to secure the voltage stability in case of tripping the plant at full power.
The inertia analysis shows that connection of the Baltics would increase the total system inertia slightly, and in this way support in maintaining frequency stability of the combined system. However, the added inertia from the Baltic system could be nearly insignificant in some of the minimum inertia situations, which are the most critical situations.
In summary, the study shows that if realising the possible Nordic-Baltic synchronization, system damping decreases if the necessary corrective actions are not carried out, and some voltage stability issues have to be solved with additional reactive compensation, on the other hand frequency stability is slightly improved. Therefore, the synchronization could have a major impact on the system stability if the
Impact of Baltic Synchronization on the Nordic Power System Stability 3 (35)
16.11.2016
corrective actions are not carried out. The synchronization evidently will bring consequences and costs for both the Nordic and Baltic systems, for example in the form of the new equipment, studies, and work to tune, in particular, the Baltic generator controllers. The synchronization process takes time, and resources are needed for the needed investigations and system upgrades. It is essential that these initial results are followed up by more detailed investigations and system upgrades if the Baltic system is planned to be synchronized with the Nordic system. In addition, the impact of the issues identified in the Nordic Challenges report (Statnett, Fingrid, Energinet.dk, Svenska Kraftnät, 2016) should also be taken into account and further analyzed. However, this is outside of the scope of this study, except the analysis of the effect on inertia.
In conclusion, if de-synchronizing from the big and stable Russian system, the second best option for the Baltic system is to synchronize with another big and stable system, i.e. continental Europe. As shown in this report, synchronizing with the smaller Nordic system is also possible but poses different challenges that have to be addressed. The first rough cost estimate is also shown in the report.

Impact of Baltic Synchronization on the Nordic Power System Stability 4 (35)
16.11.2016
1 Introduction
The target of the study is to increase knowledge about impact of the possible synchronisation of the Baltic power system with the Nordic power system on the dynamic behaviour of the both systems. The study concentrates on the change in inter-area oscillation modes, and especially damping of these modes. In addition, impact on the voltage and frequency stability will be briefly analysed. The report complements the European Commission JRC study from the dynamic impact point of view.
The study does not aim to be a comprehensive analysis of all the system planning and operation issues related to the synchronisation. Rather, it is a screening study pinpointing the main issues related to stability phenomena in case of the Baltic synchronization with the Nordic system. In this way, the study supports in the decision making when considering the different options for future operation of the Baltic system.
2 Models and Methods
2.1 Simulation Models
A combined Nordic and Baltic simulation model is used in the study; it is based on the 2025 scenario. The simulations are carried out with PSS/E power system simulator.
2.2 Description of the AC Connection between the Nordic and Baltic Systems
The Nordic and Baltic systems are connected in this study with three 220 kV AC cables having a capacity of around 250 MVA each. The connection points are Harku (330 kV) in Estonia and Espoo (400 kV) in Finland. All the three cables are connected to the same connection points to avoid loop flows. A more detailed analysis regarding the connection points is out of the scope of this study because for the purpose of this investigation it is sufficient to connect the cables to the same terminals.
For reactive power compensation, there are 360 Mvar reactors at both ends of the cables. The connection transformers between the cables and the transmission grids of Estonia and Finland have reactance of 0.15 pu on 1000 MVA base. A summary of the connection equipment and their parameters is below.
Cables (ABB, 2010):
- 3 x 220 kV
- ~250 MVA capacity each
- Impedance: R = 3.2 ohms, X = 10 ohms, B = 16 microfarads
Transformers:
- Impedance: X = 0.15 pu on 1000 MVA base
Reactors:
- 360 Mvar at both ends (assumed not in service during import to Baltics situation)

Impact of Baltic Synchronization on the Nordic Power System Stability 5 (35)
16.11.2016
2.3 Power Flow Cases
2.3.1 Oscillation Cases
In the Nordic power system, damping of the inter-area oscillations is the limiting factor when transferring power from Finland to Sweden. Based on the year 2025 market simulations, these situations occur normally only during winter nights. Even then, the AC flows from southern Finland up to southern Sweden are not on a high level on the same hour. Therefore, the studied oscillation cases have been heavily modified to create a situation where damping of the inter-area oscillations is critical. To be on the pessimistic side, the Baltic production is higher (about 10 % of the Nordic production) than in normal situations observed in the market simulation results (< 8 %). Hence, the load is also at a quite high level in the Baltics in order to allow high amount of synchronous generation in the Baltics. Several oscillation cases are studied, and the main findings are presented in the report.
2.3.1.1 Cases without Visaginas
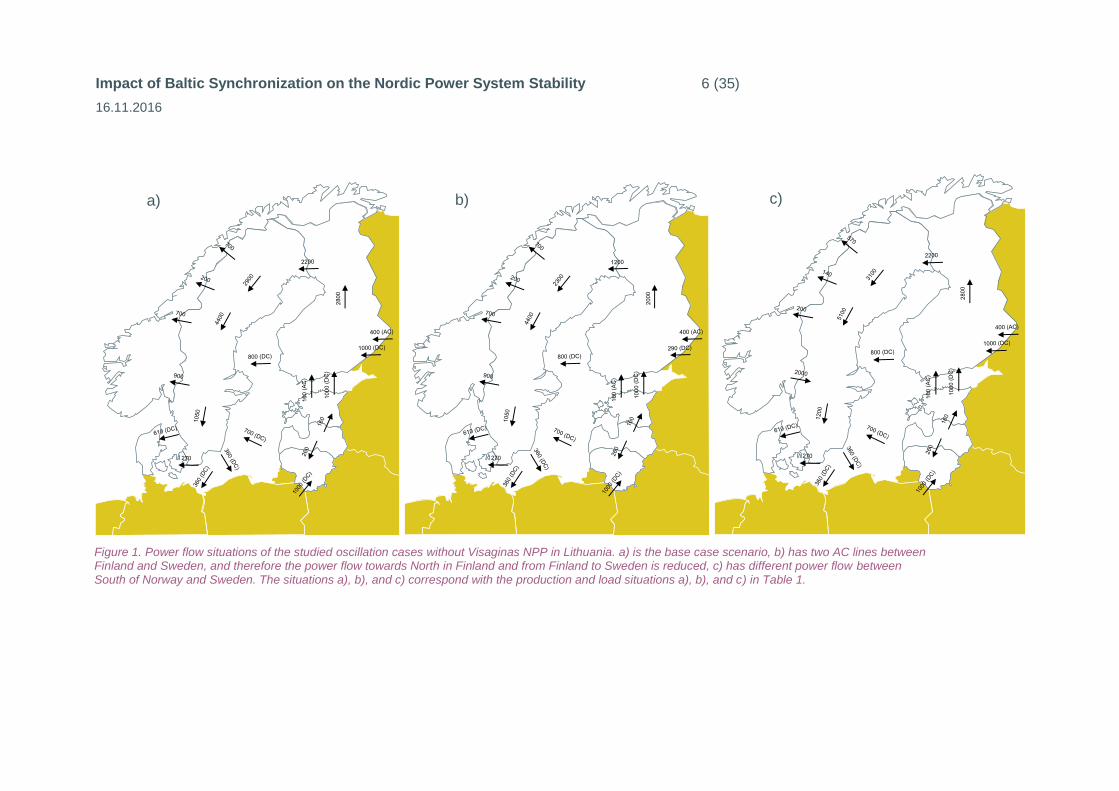
Three power flow situations are used in the oscillation studies without the Visaginas nuclear power plant (NPP) in Lithuania; they are presented in Figure 1 and Table 1. The situation a) is the base case scenario with high power transfer from South to North in Finland and from Finland to Sweden. This scenario represents a situation where damping of the inter-area oscillations is the limiting factor when transferring power from Finland to Sweden. The aim is to study whether the situation is still acceptable after connecting the Baltic system. In the situation b) there are only two AC lines (three in the base case) between Finland and Sweden, and therefore the power flows are adjusted to reflect the transfer limits in this situation. The power flows are reduced mainly by decreasing the power import from Russia, and increasing the production in North of Sweden. In the case c) the power flow direction between South of Norway and Sweden is reversed. The aim with this case is to study the sensitivity of the main inter-area oscillation mode (about 0.3 Hz) on this power flow in association with the Baltic synchronisation. The power flow is changed by increasing production in South of Norway and load in South of Sweden.
Impact of Baltic Synchronization on the Nordic Power System Stability 6 (35)
16.11.2016
Figure 1. Power flow situations of the studied oscillation cases without Visaginas NPP in Lithuania. a) is the base case scenario, b) has two AC lines between Finland and Sweden, and therefore the power flow towards North in Finland and from Finland to Sweden is reduced, c) has different power flow between South of Norway and Sweden. The situations a), b), and c) correspond with the production and load situations a), b), and c) in Table 1.
DK1 DK1DK1
a) b) c)

Impact of Baltic Synchronization on the Nordic Power System Stability 7 (35)
16.11.2016
Table 1. Production and load situations in the studied oscillation cases without Visaginas NPP in Lithuania. The situations a), b), and c) correspond with the power flow situations a), b), and c) in Figure 1.
2.3.1.2 Case with Visaginas and the Effect of Baltic Stabilizers
The case with the Visaginas NPP in Lithuania, and the effect of Baltic stabilizers on the main inter-area mode (about 0.3 Hz) damping is studied in a power flow case presented in Figure 2 and Table 2. There is more production and load and higher transfer towards North in the Baltic grid in this case compared with the base case scenario presented in Section 2.3.1.1. The aim with the case is to study whether the oscillatory situation in the combined Nordic and Baltic system is acceptable if the Visaginas plant will be constructed in Lithuania, and to study how critical the Baltic stabilizers are for the system stability. When the effect of the stabilizers is studied, the Visaginas plant is turned off, and replaced with the Kruonis hydro pump plant. The idea is to study the effect of the stabilizers in the most critical case but with no Visaginas due to the high impact of the plant and its selected model in the main inter-area mode damping, as can be observed later in Section 3.1.4.
Area Production (MW) Load (MW)
Baltics 5100 4200
EST 2200 1200
LV 1700 1300
LT 1200 1700
Nordic 42400 40900
FI 10600 9700
SE 16100 14700
NO 14400 15100
DK2 1300 1400
Area Production (MW) Load (MW)
Baltics 5100 4200
EST 2200 1200
LV 1700 1300
LT 1200 1700
Nordic 43000 40900
FI 10300 9700
SE 17000 14700
NO 14400 15100
DK2 1300 1400
Area Production (MW) Load (MW)
Baltics 5100 4200
EST 2200 1200
LV 1700 1300
LT 1200 1700
Nordic 46300 44700
FI 10600 9700
SE 16100 18500
NO 18300 15100
DK2 1300 1400
a) b) c)

Impact of Baltic Synchronization on the Nordic Power System Stability 8 (35)
16.11.2016
Figure 2. Power flow situation of the studied oscillation case with Visaginas NPP in Lithuania.
Table 2. Production and load situation in the studied oscillation case with Visaginas NPP in Lithuania.
2.3.2 Voltage Stability Case
The voltage stability is the limiting factor in the Nordic power system when transferring power from Sweden to Finland. The voltage stability case is presented in Figure 3 and Table 3, and it is modified from the oscillation case with the following assumptions:
All thermal power (except industrial) from Southern Finland off
Higher hydro power production in Sweden and Norway
Higher load in Southern Finland
Lower production in Baltics
Reversed power flow in NordBalt, Estlink, and Fenno-Skan links
DK1
Area Production (MW) Load (MW)
Baltics 6500 5600
EST 2200 1600
LV 1700 1700
LT 2600 2300
Nordic 42400 40900
FI 10600 9700
SE 16100 14700
NO 14400 15100
DK2 1300 1400

Impact of Baltic Synchronization on the Nordic Power System Stability 9 (35)
16.11.2016
The aim with this case is to study the voltage stability of the combined Nordic and Baltic system in case of the critical faults in the system. Essentially the same case is used to study both the situation without and with Visaginas plant. In case Visaginas is included, the same amount of other production, especially wind, in Baltics is turned off.
Figure 3. Power flow situation of the studied voltage stability case.
Table 3. Production and load situation in the studied voltage stability case.
DK1
Area Production (MW) Load (MW)
Baltics 3700 4200
EST 1600 1200
LV 1300 1300
LT 800 1700
Nordic 48500 43500
FI 9200 12000
SE 18100 14700
NO 19900 15400
DK2 1300 1400

Impact of Baltic Synchronization on the Nordic Power System Stability 10 (35)
16.11.2016
2.4 Executed Studies
In the oscillation cases, dynamic simulations of critical faults are carried out in the different situations, and the results are presented mainly in the time domain plots. In addition, a modal decomposition with the Prony method is carried out for the selected signals in the different cases to gain numerical information of the modal properties.
In case of voltage stability, the analysis is mainly done with power flow simulations, but also some dynamic simulations are executed. The power flow simulations are carried out first with tap changers and switched shunts locked (representing the situation right after the fault), and then with these controls enabled (representing the steady-state situation after the fault). The situation is considered generally acceptable if the voltages at all buses in the main transmission grid stay above 0.925 pu after the fault. In the dynamics simulation, the low voltage limit in the main transmission grid during a power swing is considered to be 0.8 pu.
Impact of Baltic Synchronization on the Nordic Power System Stability 11 (35)
16.11.2016
3 Results
3.1 Dynamic Stability
The dynamic stability is the limiting factor in the Nordic power system when transferring power from Finland to Sweden. Connecting the Baltics would impact the dynamic behaviour of the system. The main findings of these effects are summarized in this section.
An essential factor affecting the dynamic stability of the system is the power system stabilizers (PSS) of the generators. They are supplementary controllers of the generator voltage regulators in order to damp electromechanical oscillations in the power system. However, in most cases of this study, the PSSs of the Baltic generators are turned off. Disabling the stabilizers is a conservative assumption and made in order to have a conservative estimate of the impact of the Baltic synchronization on the dynamic stability of the combined system. The effect of enabling and disabling the stabilizers is illustrated in Section 3.1.5. Even in that case, the stabilizers are not specifically tuned to damp the critical modes in the combined system.
3.1.1 Comparison between Faults
In this section, a comparison between the critical faults are presented in the base case scenario where the power flow situation a) in Section 2.3.1.1 is used, and the power system stabilizers (PSS) of the Baltic generators are turned off. Disabling the stabilizers is a conservative assumption and made in order to have a conservative estimate of the effect of the Baltic synchronization on dynamic stability of the combined system. The effect of enabling and disabling the stabilizers (as they are in the current model) is studied in Section 3.1.5.
The signals presented are the AC power flows between Finland and Sweden (FI-SE AC) and Estonia and Finland (EST-FI AC). The FI-SE AC signal has a good observability of the 0.3 Hz inter-area mode, and the EST-FI AC has good observability of the new 0.5 Hz mode between the Baltics and Finland.
The studied critical faults are the HVDC link faults: tripping of the NordBalt, Fenno-Skan, and Estlink HVDC links with and without a 100 ms short circuit on the Baltic side terminal of the NordBalt and Estlink and Finnish side terminal of the Fenno-Skan. The results of the comparison in terms of the FI-SE AC and EST-FI AC signals are presented in Figure 4 and Figure 5, respectively. As can be observed, the NordBalt fault and trip (and just the trip) is a critical fault in terms of damping of the oscillations, modal analysis of the FI-SE AC signal shows damping ratio of 3.5 % for the main inter-area mode in case of the fault. In case of the Fenno-Skan fault and trip, the respective damping is 5.7 %. In case of the NordBalt and Estlink there is no big difference in the response whether there is a fault in the beginning (fault and trip) or just tripping of the link (trip). However, in case of the Fenno-Skan the response is much larger if there is the fault in the beginning.
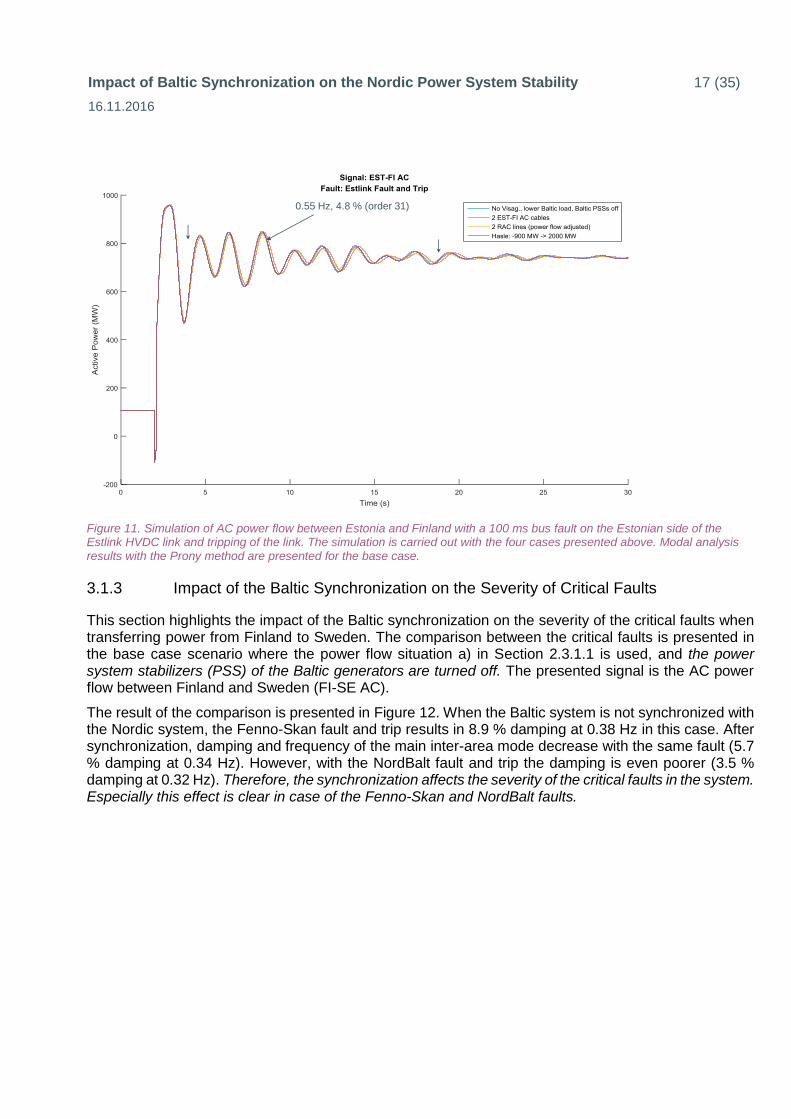
The response in case of the Estlink fault is much smaller but it excites most the new mode between the Baltics and Finland as can be seen in the EST-FI AC signal in Figure 5. The mode frequency is 0.55 Hz and damping is 4.8 % in this case.

Impact of Baltic Synchronization on the Nordic Power System Stability 12 (35)
16.11.2016
Figure 4. Simulation of AC power flow between Finland and Sweden in the base oscillation case with the six different faults presented above. Modal analysis results with the Prony method are presented for the NordBalt and Fenno-Skan fault and trip.
Figure 5. Simulation of AC power flow between Estonia and Finland in the base oscillation case with the six different faults presented above. Modal analysis results with the Prony method are presented for the Estlink fault and trip.
0.32 Hz, 3.5 %
0.34 Hz, 5.7 %
0.55 Hz, 4.8 %
Impact of Baltic Synchronization on the Nordic Power System Stability 13 (35)
16.11.2016
3.1.2 Comparison between Cases without Visaginas
In this section, the dynamic simulation results of five cases are presented with the critical faults in the combined Nordic and Baltic system. Brief descriptions of the cases are the following:
Case 1:
Case name: No Visag., lower Baltic load, Baltic PSSs off.
Case description: The base case scenario. Power flow situation a) in Section 2.3.1.1.
Case 2:
Case name: 2 EST-FI AC cables.
Case description: Two AC cables between Estonia and Finland, instead of three (as in the base case scenario). Power flow situation a) in Section 2.3.1.1.
Case 3:
Case name: 2 RAC lines (power flow adjusted).
Case description: Two AC lines between Finland and Sweden, instead of three (as in the base case scenario). Power flow situation b) in Section 2.3.1.1.
Case 4:
Case name: Hasle: -900 MW -> 2000 MW.
Case description: Hasle power flow from South Norway to Sweden 2000 MW, instead of -900 MW (as in the base case scenario). Power flow situation c) in Section 2.3.1.1.
Case 5:
Case name: Baltic disconnected.
Case description: Baltic disconnected from the Nordic system. Reference case when comparing the effect of synchronizing the Baltic grid with the Nordic system. Power flow situation a) in Section 2.3.1.1 in the Nordic system. The original AC flow between Estonia and Finland is added to the Estlink DC flow.
As justified in the previous section, the power system stabilizers (PSS) of the Baltic generators are turned off in all the cases in this section. The studied faults are tripping of the NordBalt, Fenno-Skan, and Estlink HVDC links with and without a 100 ms short circuit on the Baltic side terminal of the NordBalt and Estlink and Finnish side terminal of the Fenno-Skan. The signals presented are the AC power flows between Finland and Sweden (FI-SE AC) and Estonia and Finland (EST-FI AC).
Figure 6 and Figure 7 present the response of the system to the NordBalt fault and trip as measured in the AC lines between Finland and Sweden, and AC cables between Estonia and Finland, respectively. Figure 8 and Figure 9 present the results in case of the Fenno-Skan fault and trip, and Figure 10 and Figure 11 in case of the Estlink. The results are shown for all the cases presented above. When Baltic is disconnected, the EST-FI AC signal is not shown because it is zero.
The results indicate that the oscillations have clearly positive damping in all the cases, meaning that they are acceptable in terms of damping. In the base case and in case of the NordBalt fault and trip, the damping ratio of the main inter-area mode is around 3.5 %, which is acceptable. However, when comparing the effect of synchronizing the Baltic grid with the Nordic grid, it can be seen in case of the Fenno-Skan fault in Figure 8 that the synchronization makes the damping somewhat weaker (8.9 % → 5.7 %) and the frequency lower (0.38 Hz → 0.34 Hz). It is emphasized that this is the result with the Baltic stabilizers turned off. In case of the NordBalt and Estlink faults the results between the Baltic connected and disconnected are not similarly comparable because the links are connected to an external system if the Baltic is not synchronized to the Nordic system.
Impact of Baltic Synchronization on the Nordic Power System Stability 14 (35)
16.11.2016
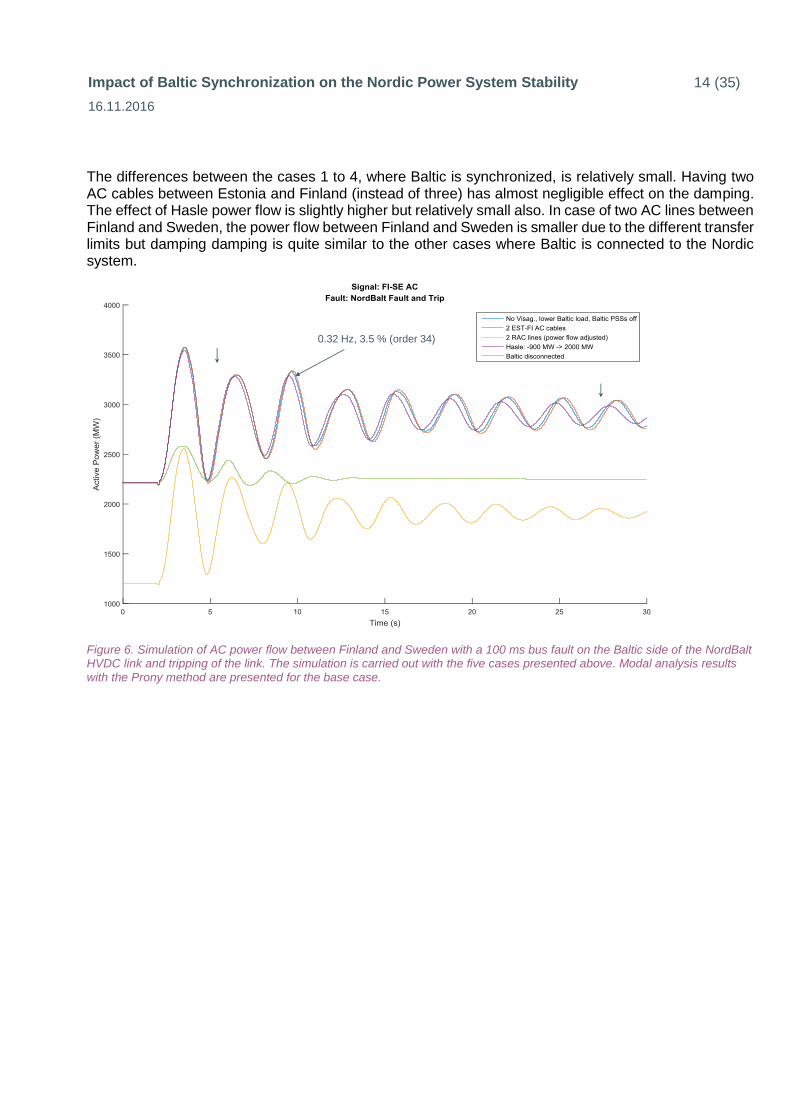
The differences between the cases 1 to 4, where Baltic is synchronized, is relatively small. Having two AC cables between Estonia and Finland (instead of three) has almost negligible effect on the damping. The effect of Hasle power flow is slightly higher but relatively small also. In case of two AC lines between Finland and Sweden, the power flow between Finland and Sweden is smaller due to the different transfer limits but damping damping is quite similar to the other cases where Baltic is connected to the Nordic system.
Figure 6. Simulation of AC power flow between Finland and Sweden with a 100 ms bus fault on the Baltic side of the NordBalt HVDC link and tripping of the link. The simulation is carried out with the five cases presented above. Modal analysis results with the Prony method are presented for the base case.
0.32 Hz, 3.5 % (order 34)

Impact of Baltic Synchronization on the Nordic Power System Stability 15 (35)
16.11.2016
Figure 7. Simulation of AC power flow between Estonia and Finland with a 100 ms bus fault on the Baltic side of the NordBalt HVDC link and tripping of the link. The simulation is carried out with the four cases presented above.
Figure 8. Simulation of AC power flow between Finland and Sweden with a 100 ms bus fault on the Finnish side of the Fenno-Skan HVDC link and tripping of the link. The simulation is carried out with the five cases presented above. Modal analysis results with the Prony method are presented for the base case and for the reference case where Baltic is disconnected from the Nordic system.
0.34 Hz, 5.7 % (order 14)
0.38 Hz, 8.9 % (order 20)

Impact of Baltic Synchronization on the Nordic Power System Stability 16 (35)
16.11.2016
Figure 9. Simulation of AC power flow between Estonia and Finland with a 100 ms bus fault on the Finnish side of the Fenno-Skan HVDC link and tripping of the link. The simulation is carried out with the four cases presented above.
Figure 10. Simulation of AC power flow between Finland and Sweden with a 100 ms bus fault on the Estonian side of the Estlink HVDC link and tripping of the link. The simulation is carried out with the five cases presented above.
Impact of Baltic Synchronization on the Nordic Power System Stability 17 (35)
16.11.2016
Figure 11. Simulation of AC power flow between Estonia and Finland with a 100 ms bus fault on the Estonian side of the Estlink HVDC link and tripping of the link. The simulation is carried out with the four cases presented above. Modal analysis results with the Prony method are presented for the base case.
3.1.3 Impact of the Baltic Synchronization on the Severity of Critical Faults
This section highlights the impact of the Baltic synchronization on the severity of the critical faults when transferring power from Finland to Sweden. The comparison between the critical faults is presented in the base case scenario where the power flow situation a) in Section 2.3.1.1 is used, and the power system stabilizers (PSS) of the Baltic generators are turned off. The presented signal is the AC power flow between Finland and Sweden (FI-SE AC).
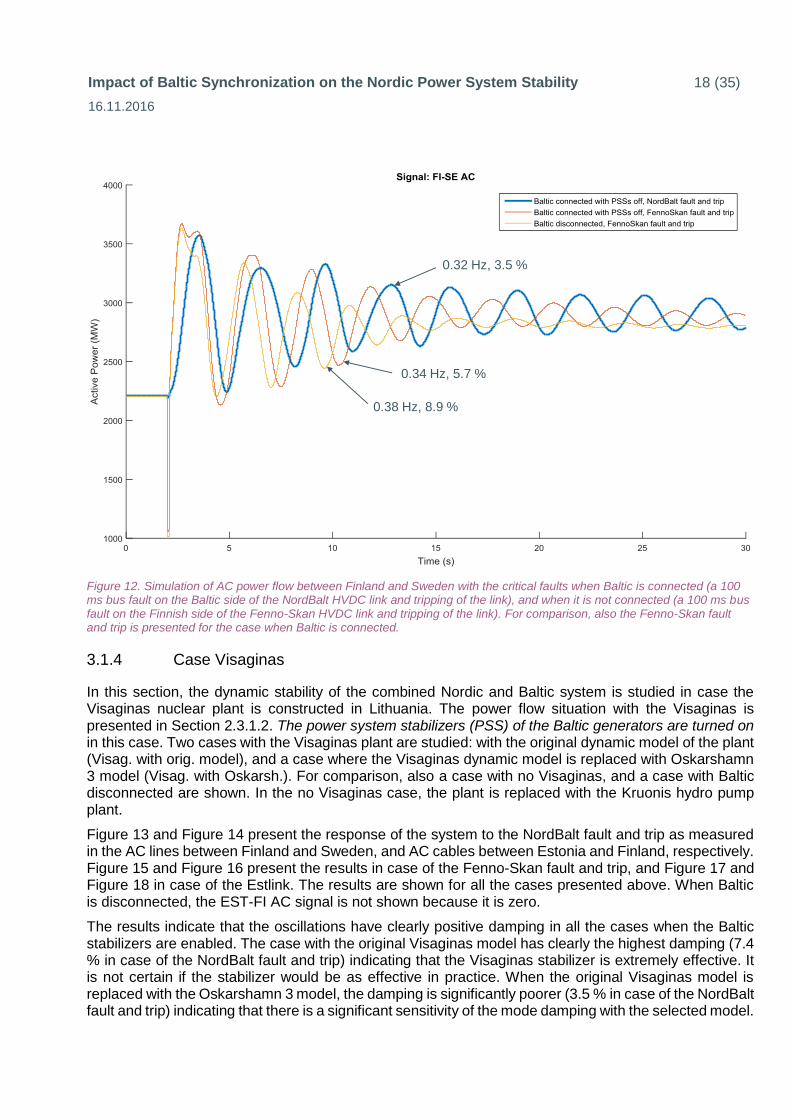
The result of the comparison is presented in Figure 12. When the Baltic system is not synchronized with the Nordic system, the Fenno-Skan fault and trip results in 8.9 % damping at 0.38 Hz in this case. After synchronization, damping and frequency of the main inter-area mode decrease with the same fault (5.7 % damping at 0.34 Hz). However, with the NordBalt fault and trip the damping is even poorer (3.5 % damping at 0.32 Hz). Therefore, the synchronization affects the severity of the critical faults in the system. Especially this effect is clear in case of the Fenno-Skan and NordBalt faults.
0.55 Hz, 4.8 % (order 31)
Impact of Baltic Synchronization on the Nordic Power System Stability 18 (35)
16.11.2016
Figure 12. Simulation of AC power flow between Finland and Sweden with the critical faults when Baltic is connected (a 100 ms bus fault on the Baltic side of the NordBalt HVDC link and tripping of the link), and when it is not connected (a 100 ms bus fault on the Finnish side of the Fenno-Skan HVDC link and tripping of the link). For comparison, also the Fenno-Skan fault and trip is presented for the case when Baltic is connected.
3.1.4 Case Visaginas
In this section, the dynamic stability of the combined Nordic and Baltic system is studied in case the Visaginas nuclear plant is constructed in Lithuania. The power flow situation with the Visaginas is presented in Section 2.3.1.2. The power system stabilizers (PSS) of the Baltic generators are turned on in this case. Two cases with the Visaginas plant are studied: with the original dynamic model of the plant (Visag. with orig. model), and a case where the Visaginas dynamic model is replaced with Oskarshamn 3 model (Visag. with Oskarsh.). For comparison, also a case with no Visaginas, and a case with Baltic disconnected are shown. In the no Visaginas case, the plant is replaced with the Kruonis hydro pump plant.
Figure 13 and Figure 14 present the response of the system to the NordBalt fault and trip as measured in the AC lines between Finland and Sweden, and AC cables between Estonia and Finland, respectively. Figure 15 and Figure 16 present the results in case of the Fenno-Skan fault and trip, and Figure 17 and Figure 18 in case of the Estlink. The results are shown for all the cases presented above. When Baltic is disconnected, the EST-FI AC signal is not shown because it is zero.
The results indicate that the oscillations have clearly positive damping in all the cases when the Baltic stabilizers are enabled. The case with the original Visaginas model has clearly the highest damping (7.4 % in case of the NordBalt fault and trip) indicating that the Visaginas stabilizer is extremely effective. It is not certain if the stabilizer would be as effective in practice. When the original Visaginas model is replaced with the Oskarshamn 3 model, the damping is significantly poorer (3.5 % in case of the NordBalt fault and trip) indicating that there is a significant sensitivity of the mode damping with the selected model.
0.38 Hz, 8.9 %
0.32 Hz, 3.5 %
0.34 Hz, 5.7 %

Impact of Baltic Synchronization on the Nordic Power System Stability 19 (35)
16.11.2016
The case with no Visaginas has quite similar damping (4.3 % in case of the NordBalt fault and trip) than the case where Visaginas is modelled similarly than Oskarshamn 3, indicating that it could be more realistic to model the plant somewhat similar as Oskarshamn 3, instead of the original model. For a more detailed analysis, the model tuning would have to be done properly, taking into account the local properties of the grid.
If the Baltic grid is disconnected, the NordBalt fault and trip excites only rather minor oscillations because the fault is of a completely different nature depending on whether the Baltic grid is synchronized with the Nordic grid or not. Instead, in case of the Fenno-Skan fault and trip (Figure 15), the results with the Baltic disconnected can be reasonably compared with the other results. In this case, damping is the highest when the Baltic is disconnected (8.8 %), and the value is close to the case where Visaginas is modelled with its original model. Frequency of the oscillations is clearly higher when the Baltic is disconnected (0.38 Hz) compared with the cases where the Baltic is connected. In conclusion, damping and frequency of the main inter-area mode (about 0.3 Hz) becomes somewhat lower in case the Baltic is synchronized with the Nordic grid, and the Visaginas plant is in operation. However, all the studied cases are stable when the Baltic PSSs are in operation.
Figure 13. Simulation of AC power flow between Finland and Sweden with a 100 ms bus fault on the Baltic side of the NordBalt HVDC link and tripping of the link. The simulation is carried out with the four cases presented above. Modal analysis results with the Prony method are presented for the cases where Baltic is connected with the Nordic system.
0.30 Hz, 4.3 %
0.29 Hz, 3.5 %
0.30 Hz, 7.4 %
Impact of Baltic Synchronization on the Nordic Power System Stability 20 (35)
16.11.2016
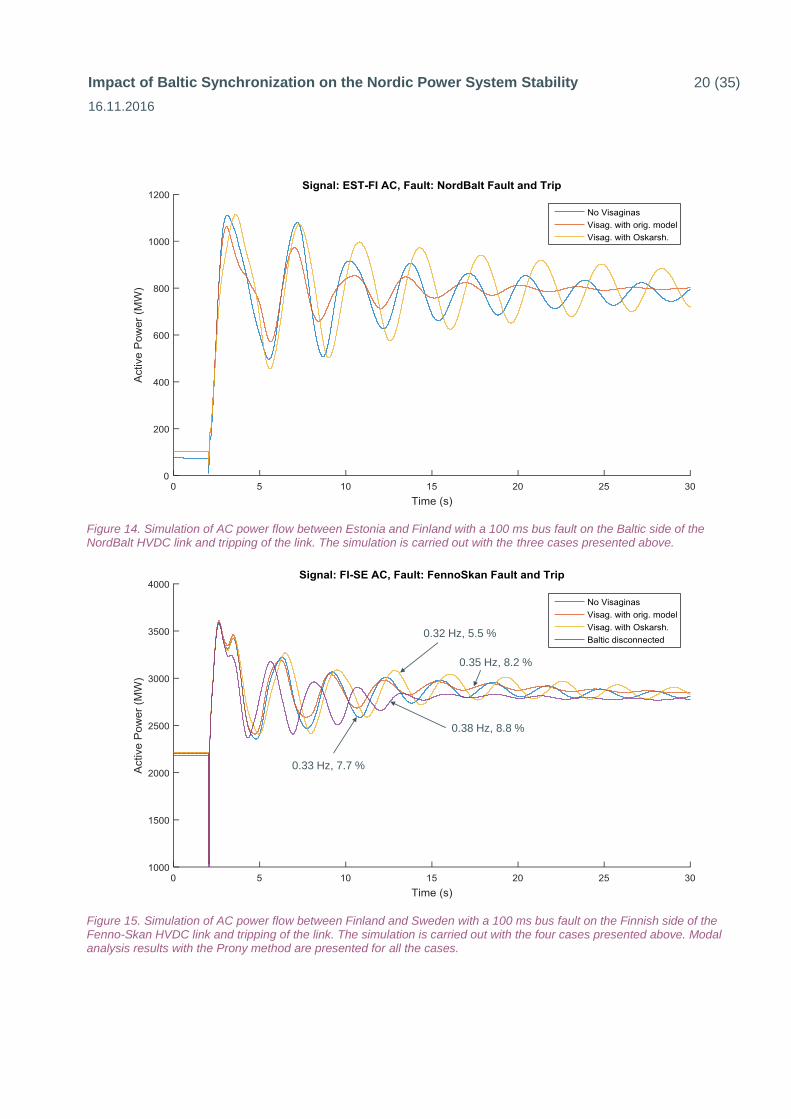
Figure 14. Simulation of AC power flow between Estonia and Finland with a 100 ms bus fault on the Baltic side of the NordBalt HVDC link and tripping of the link. The simulation is carried out with the three cases presented above.
Figure 15. Simulation of AC power flow between Finland and Sweden with a 100 ms bus fault on the Finnish side of the Fenno-Skan HVDC link and tripping of the link. The simulation is carried out with the four cases presented above. Modal analysis results with the Prony method are presented for all the cases.
0.33 Hz, 7.7 %
0.32 Hz, 5.5 %
0.35 Hz, 8.2 %
0.38 Hz, 8.8 %

Impact of Baltic Synchronization on the Nordic Power System Stability 21 (35)
16.11.2016
Figure 16. Simulation of AC power flow between Estonia and Finland with a 100 ms bus fault on the Finnish side of the Fenno-Skan HVDC link and tripping of the link. The simulation is carried out with the three cases presented above.
Figure 17. Simulation of AC power flow between Finland and Sweden with a 100 ms bus fault on the Estonian side of the Estlink HVDC link and tripping of the link. The simulation is carried out with the four cases presented above.

Impact of Baltic Synchronization on the Nordic Power System Stability 22 (35)
16.11.2016
Figure 18. Simulation of AC power flow between Estonia and Finland with a 100 ms bus fault on the Estonian side of the Estlink HVDC link and tripping of the link. The simulation is carried out with the three cases presented above. Modal analysis results with the Prony method are presented for all the cases.
3.1.5 Effect of the Baltic Stabilizers in the Most Critical Case
In this section, the effect of the Baltic stabilizers on the dynamic stability of the combined Nordic and Baltic system is studied in an extreme case where the power flow situation is the same as with the Visaginas plant, but the Visaginas plant is not in operation and it is replaced with the Kruonis hydro pump plant. The power flow case is presented in Section 2.3.1.2. As mentioned, the idea is to study the effect of the stabilizers in the most critical case but with no Visaginas due to the high impact of the plant and its selected model in the main inter-area mode damping, as observed in Section 3.1.4. It should be noted that in the earlier sections 3.1.1 – 3.1.3 the Baltic PSSs were off, similarly as in this section, but the power flow case was different.
Figure 19 and Figure 20 present the response of the system to the NordBalt fault and trip as measured in the AC lines between Finland and Sweden, and AC cables between Estonia and Finland, respectively. Figure 21 and Figure 22 present the results in case of the Fenno-Skan fault and trip, and Figure 23 and Figure 24 in case of the Estlink. The results are shown for the case where all the Baltic stabilizers are turned on, and for the case where they are turned off.
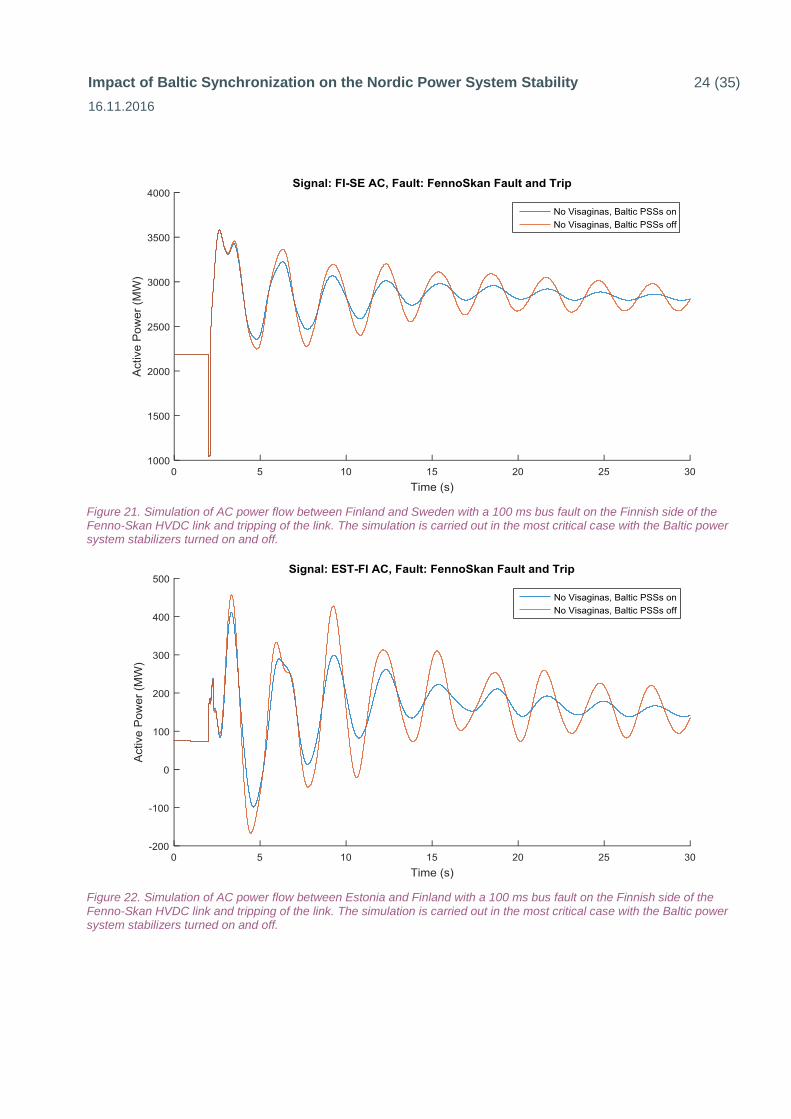
The results indicate that the oscillations have clearly positive damping in all the cases when the Baltic stabilizers are enabled. However, when the stabilizers are turned off, the NordBalt fault and trip causes oscillations with slightly negative damping, implying that the system is marginally unstable in this case. The other faults excite oscillations with positive damping but the difference is quite large whether the Baltic stabilizers are enabled or not. Altogether the results imply that the Baltic stabilizers, their qualities and tuning, play a significant role in terms of dynamic stability if the Baltic system would be synchronized with the Nordic system.
0.49 Hz, 7.4 %
0.36 Hz, 6.6 %0.50 Hz, 5.1 %

Impact of Baltic Synchronization on the Nordic Power System Stability 23 (35)
16.11.2016
Figure 19. Simulation of AC power flow between Finland and Sweden with a 100 ms bus fault on the Baltic side of the NordBalt HVDC link and tripping of the link. The simulation is carried out in the most critical case with the Baltic power system stabilizers turned on and off.
Figure 20. Simulation of AC power flow between Estonia and Finland with a 100 ms bus fault on the Baltic side of the NordBalt HVDC link and tripping of the link. The simulation is carried out in the most critical case with the Baltic power system stabilizers turned on and off.
Impact of Baltic Synchronization on the Nordic Power System Stability 24 (35)
16.11.2016
Figure 21. Simulation of AC power flow between Finland and Sweden with a 100 ms bus fault on the Finnish side of the Fenno-Skan HVDC link and tripping of the link. The simulation is carried out in the most critical case with the Baltic power system stabilizers turned on and off.
Figure 22. Simulation of AC power flow between Estonia and Finland with a 100 ms bus fault on the Finnish side of the Fenno-Skan HVDC link and tripping of the link. The simulation is carried out in the most critical case with the Baltic power system stabilizers turned on and off.

Impact of Baltic Synchronization on the Nordic Power System Stability 25 (35)
16.11.2016
Figure 23. Simulation of AC power flow between Finland and Sweden with a 100 ms bus fault on the Estonian side of the Estlink HVDC link and tripping of the link. The simulation is carried out in the most critical case with the Baltic power system stabilizers turned on and off.
Figure 24. Simulation of AC power flow between Estonia and Finland with a 100 ms bus fault on the Estonian side of the Estlink HVDC link and tripping of the link. The simulation is carried out in the most critical case with the Baltic power system stabilizers turned on and off.
3.1.6 Conclusions on Dynamic Stability
Synchronization of the Baltic system affects the characteristics of the main ("0.3 Hz") inter-area electromechanical oscillation mode, observed earlier between South Finland and South

Impact of Baltic Synchronization on the Nordic Power System Stability 26 (35)
16.11.2016
Sweden/Norway. After synchronization, the Baltic system participates in the oscillations in phase with the Finnish generators, lowering the oscillation frequency back to around 0.3 Hz from above 0.35 Hz observed before synchronization. In addition, damping of the mode decreases, at least in case there are no stabilizers in the Baltic generators and no power oscillation dampers in the Baltic HVDC links. The worst case with the Baltic stabilizers turned off indicate even unstable oscillations. Therefore, the characteristics and tuning of the Baltic stabilizers play a significant role in securing the dynamic stability in the combined Nordic and Baltic system. The synchronization would also affect the severity of the faults that are critical when transferring power from Finland to Sweden. The effect is especially large in case of the NordBalt fault, but it has effect on the Fenno-Skan fault too.
A new mode between Baltic and Finland is introduced with a frequency of around 0.5 Hz. The mode is excited especially by the Estlink 2 fault and trip, because the link connects the oscillating areas. However, this mode seems to be relatively well-damped.
If the Visaginas nuclear plant is constructed in Lithuania, its behaviour and modelling, especially in case of the stabilizer, is important for decent damping of the oscillations. However, all the studied cases with the Visaginas plant and with the Baltic stabilizers enabled were stable.
Sensitivity of the mode characteristics, and especially the damping, was also studied in terms of some key parameters of the grid. These were: the number of cables between Estonia and Finland (two instead of three), the number of AC lines between Finland and Sweden (two instead of three), and the Hasle power flow. However, the results indicated only minor sensitivities in terms of these parameters.
3.2 Voltage Stability
In this section, the voltage stability simulation results with critical faults in the combined Nordic and Baltic system are presented. The simulations are done in the power flow situation where power is transferred from Sweden to Finland, and further to Baltic. The situation is presented in Section 2.3.2.
3.2.1 Results with Different Faults
3.2.1.1 Case Visaginas
The case with the Visaginas NPP in terms of voltage stability is such that if the plant trips at full power, the simulation does not converge either in power flow or dynamics due to voltage instability. This indicates that the system would not withstand tripping of the plant in the studied power flow situation. Significant reinforcements in the grid would probably be needed in case the Visaginas plant is constructed. However, studying the required reinforcements is out of scope of this study. Alternatively, for example, the plant could be run at lower power output in critical situations, or a system protection scheme could be considered.
3.2.1.2 NordBalt 700 MW
When tripping the NordBalt HVDC link at full power (700 MW), the power flow simulation with switched shunts and tap changers locked (representing the situation right after the trip) does not converge due to voltage instability. Enabling the switched shunts and tap changers improves the reactive power balance in such a way that the simulation converges. This indicates that tripping of the NordBalt at full power is on the limit of voltage instability in this case. In the studied case, the voltages already before the trip are on a low level, especially in South Finland, due to the assumptions in modifying the case (Section 2.3.2). Due to this, the case is closer to voltage instability than a case where the voltages are higher. According to the dynamic simulation results, tripping of the link is stable and the voltage minimum is over 0.875 pu.
Impact of Baltic Synchronization on the Nordic Power System Stability 27 (35)
16.11.2016
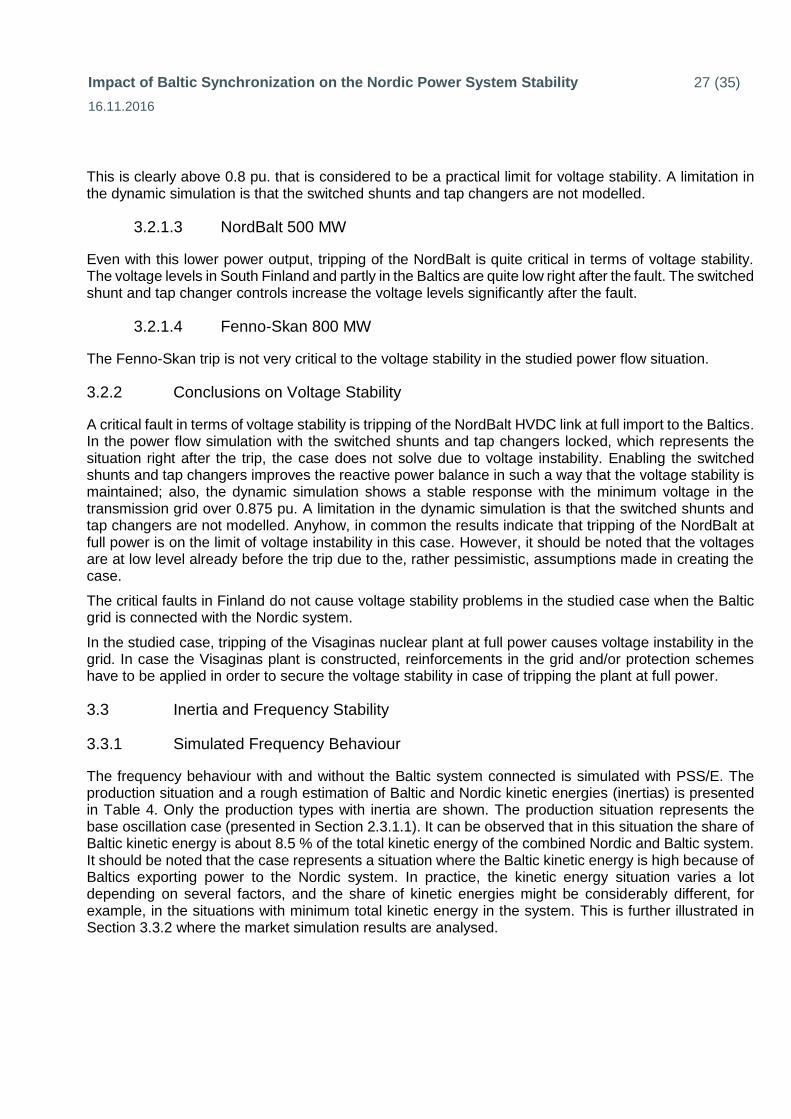
This is clearly above 0.8 pu. that is considered to be a practical limit for voltage stability. A limitation in the dynamic simulation is that the switched shunts and tap changers are not modelled.
3.2.1.3 NordBalt 500 MW
Even with this lower power output, tripping of the NordBalt is quite critical in terms of voltage stability. The voltage levels in South Finland and partly in the Baltics are quite low right after the fault. The switched shunt and tap changer controls increase the voltage levels significantly after the fault.
3.2.1.4 Fenno-Skan 800 MW
The Fenno-Skan trip is not very critical to the voltage stability in the studied power flow situation.
3.2.2 Conclusions on Voltage Stability
A critical fault in terms of voltage stability is tripping of the NordBalt HVDC link at full import to the Baltics. In the power flow simulation with the switched shunts and tap changers locked, which represents the situation right after the trip, the case does not solve due to voltage instability. Enabling the switched shunts and tap changers improves the reactive power balance in such a way that the voltage stability is maintained; also, the dynamic simulation shows a stable response with the minimum voltage in the transmission grid over 0.875 pu. A limitation in the dynamic simulation is that the switched shunts and tap changers are not modelled. Anyhow, in common the results indicate that tripping of the NordBalt at full power is on the limit of voltage instability in this case. However, it should be noted that the voltages are at low level already before the trip due to the, rather pessimistic, assumptions made in creating the case.
The critical faults in Finland do not cause voltage stability problems in the studied case when the Baltic grid is connected with the Nordic system.
In the studied case, tripping of the Visaginas nuclear plant at full power causes voltage instability in the grid. In case the Visaginas plant is constructed, reinforcements in the grid and/or protection schemes have to be applied in order to secure the voltage stability in case of tripping the plant at full power.
3.3 Inertia and Frequency Stability
3.3.1 Simulated Frequency Behaviour
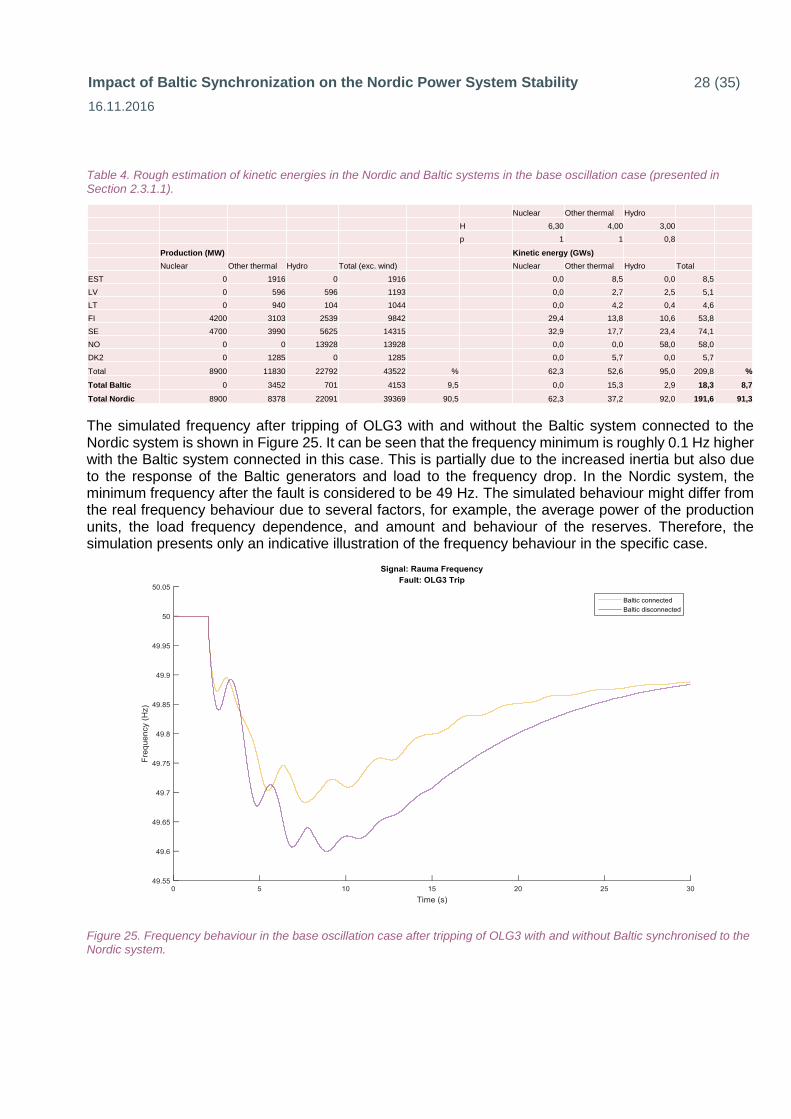
The frequency behaviour with and without the Baltic system connected is simulated with PSS/E. The production situation and a rough estimation of Baltic and Nordic kinetic energies (inertias) is presented in Table 4. Only the production types with inertia are shown. The production situation represents the base oscillation case (presented in Section 2.3.1.1). It can be observed that in this situation the share of Baltic kinetic energy is about 8.5 % of the total kinetic energy of the combined Nordic and Baltic system. It should be noted that the case represents a situation where the Baltic kinetic energy is high because of Baltics exporting power to the Nordic system. In practice, the kinetic energy situation varies a lot depending on several factors, and the share of kinetic energies might be considerably different, for example, in the situations with minimum total kinetic energy in the system. This is further illustrated in Section 3.3.2 where the market simulation results are analysed.
Impact of Baltic Synchronization on the Nordic Power System Stability 28 (35)
16.11.2016
Table 4. Rough estimation of kinetic energies in the Nordic and Baltic systems in the base oscillation case (presented in Section 2.3.1.1).
The simulated frequency after tripping of OLG3 with and without the Baltic system connected to the Nordic system is shown in Figure 25. It can be seen that the frequency minimum is roughly 0.1 Hz higher with the Baltic system connected in this case. This is partially due to the increased inertia but also due to the response of the Baltic generators and load to the frequency drop. In the Nordic system, the minimum frequency after the fault is considered to be 49 Hz. The simulated behaviour might differ from the real frequency behaviour due to several factors, for example, the average power of the production units, the load frequency dependence, and amount and behaviour of the reserves. Therefore, the simulation presents only an indicative illustration of the frequency behaviour in the specific case.
Figure 25. Frequency behaviour in the base oscillation case after tripping of OLG3 with and without Baltic synchronised to the Nordic system.
Nuclear Other thermal Hydro
H 6,30 4,00 3,00
p 1 1 0,8
Production (MW) Kinetic energy (GWs)
Nuclear Other thermal Hydro Total (exc. wind) Nuclear Other thermal Hydro Total
EST 0 1916 0 1916 0,0 8,5 0,0 8,5
LV 0 596 596 1193 0,0 2,7 2,5 5,1
LT 0 940 104 1044 0,0 4,2 0,4 4,6
FI 4200 3103 2539 9842 29,4 13,8 10,6 53,8
SE 4700 3990 5625 14315 32,9 17,7 23,4 74,1
NO 0 0 13928 13928 0,0 0,0 58,0 58,0
DK2 0 1285 0 1285 0,0 5,7 0,0 5,7
Total 8900 11830 22792 43522 % 62,3 52,6 95,0 209,8 %
Total Baltic 0 3452 701 4153 9,5 0,0 15,3 2,9 18,3 8,7
Total Nordic 8900 8378 22091 39369 90,5 62,3 37,2 92,0 191,6 91,3

Impact of Baltic Synchronization on the Nordic Power System Stability 29 (35)
16.11.2016
3.3.2 Estimation of Inertia based on the Market Simulation Results
3.3.2.1 Description of the Market Simulation
The utilized market model is the "EFI’s Multi-area Power-market Simulator (EMPS)" (SINTEF, 2016). The simulation year is 2025, and 51 historical weather years ranging from 1962 to 2012 are utilized to capture possible variation of hydro inflow, wind and temperature. In the EMPS model, each week is divided into ten non-sequential price periods.
The scenario for 2025 was constructed by combining estimates of future development, as well as data collected in Baltic Sea Market Modelling Group and the Baltic Sea Green Vision (BSGV) scenario created within ENTSO-E.
In the scenario, electricity demand in the Nordic countries grows moderately and the Nordic wind output more than doubles between 2013 and 2025. No new nuclear plants are built in Finland or Sweden after completion of Olkiluoto 3 and Hanhikivi 1. Oskarshamn 1 and 2 as well as Ringhals 1 and 2 are decommissioned by 2020, while the remaining six units are operational in 2025.
3.3.2.2 Description of the Inertia Calculation
Power productions of the different production types in the different areas are used in estimating kinetic energy during each price period of the target year (2025) for each production type and area. The equation:
coskin
p
HPW
is used in the estimation. Wkin is the kinetic energy in GWs, P is aggregate active power production of the production type in the specific area, and H is average inertia constant of the production type in seconds. p is the average ratio of actual power production divided by the sum of rated power values (
iPP R ) of the production type in the specific area, and cos is the average power factor (PR/SR). The
power productions are variable, and they come from the market simulation. The other parameters are assumed constant.
The categorization of the power production types and the corresponding average inertia constants (in parenthesis) are:
- nuclear (H = 6.3 s)
- other thermal (H = 4 s)
- hydro (H = 3 s)
- wind and solar (H = 0) => no kinetic energy
The inertia constants come from ENTSO-E's Nordic report on Future system inertia (ENTSO-E, 2015).
For p, the value of 1 is used for other production categories except for hydro a value of 0.8 is used. This means that rated power production of each unit for other production types is assumed (conservative estimate). For hydro, 80 % production of their rated capacity is assumed on average because the efficiency of a hydro generator is usually at maximum around 80 % production (Björnstedt, 2012). For
the power factor (cosan average value of 0.9 is assumed for each production type.
Impact of Baltic Synchronization on the Nordic Power System Stability 30 (35)
16.11.2016
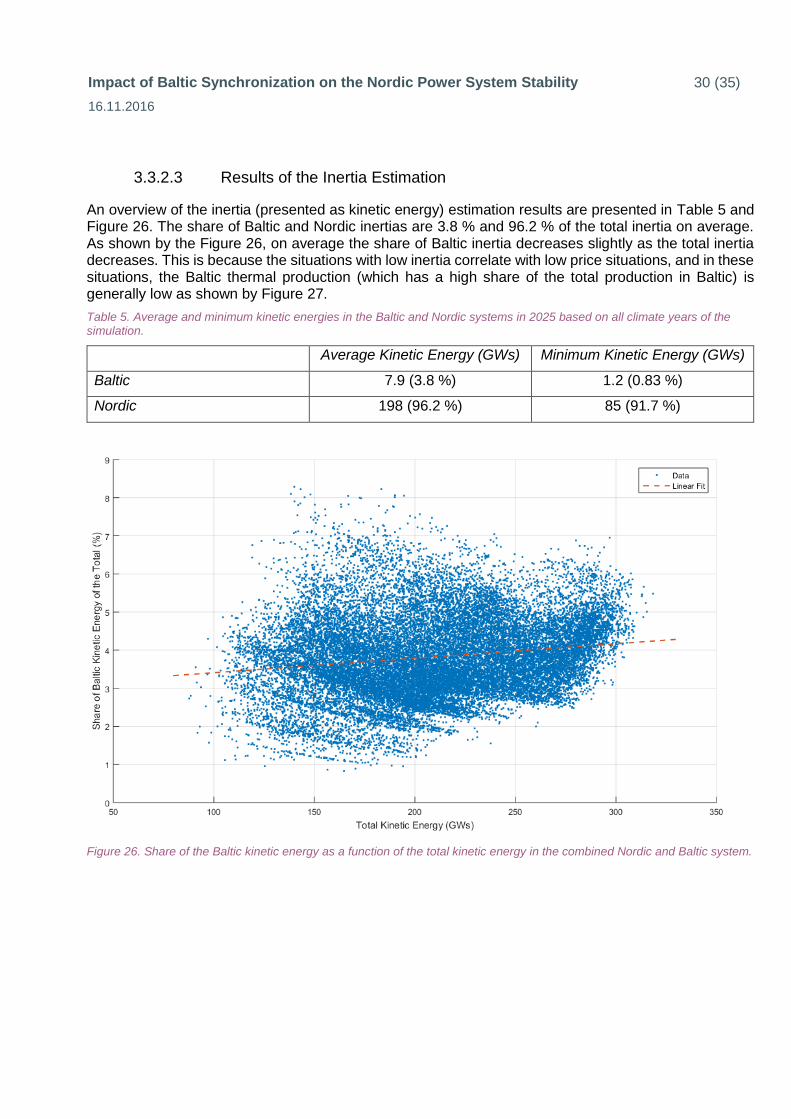
3.3.2.3 Results of the Inertia Estimation
An overview of the inertia (presented as kinetic energy) estimation results are presented in Table 5 and Figure 26. The share of Baltic and Nordic inertias are 3.8 % and 96.2 % of the total inertia on average. As shown by the Figure 26, on average the share of Baltic inertia decreases slightly as the total inertia decreases. This is because the situations with low inertia correlate with low price situations, and in these situations, the Baltic thermal production (which has a high share of the total production in Baltic) is generally low as shown by Figure 27.
Table 5. Average and minimum kinetic energies in the Baltic and Nordic systems in 2025 based on all climate years of the simulation.
Average Kinetic Energy (GWs) Minimum Kinetic Energy (GWs)
Baltic 7.9 (3.8 %) 1.2 (0.83 %)
Nordic 198 (96.2 %) 85 (91.7 %)
Figure 26. Share of the Baltic kinetic energy as a function of the total kinetic energy in the combined Nordic and Baltic system.

Impact of Baltic Synchronization on the Nordic Power System Stability 31 (35)
16.11.2016
Figure 27. Baltic thermal production as a function of the total kinetic energy in the combined Nordic and Baltic system.
3.4 Conclusions on Inertia and Frequency Stability
On average, the share of Baltic inertia would be around 4 % of the total inertia of the combined Nordic and Baltic system. Therefore, the Baltic synchronization could improve the frequency stability of the combined system slightly. However, during some of the minimum inertia situations in the system (the most critical situations), the share of Baltic inertia could be only around 1 % of the total. Therefore, the added inertia from the Baltic grid could be nearly insignificant in some of the minimum inertia situations in the system. The main reason for the especially low Baltic inertia, during some of the low inertia situations, is the relatively large share of thermal production in the Baltics, which is mostly out of service during the minimum inertia situations.

Impact of Baltic Synchronization on the Nordic Power System Stability 32 (35)
16.11.2016
4 Cost Estimate
Dynamic Stability
The number of Baltic generators that have a stabilizer model, and which need retuning or retrofitting in case of synchronization with the Nordic grid is about 60. In addition, there are about 20 generators that are not equipped with the PSS in the simulation model.
Retuning of a PSS costs about 20−100 k€. Installation of a PSS and the associated renovation of the excitation system in case it is needed costs about 100−500 k€.
Therefore, the minimum estimate of the associated costs consists of 60 generators with retuning, and 20 generators with installation. The total cost in this case would then be about 5−20 M€. The maximum estimate consists of retrofitting or installation at each generator. This case would cost about 10−50 M€. The cost estimate does not include any indirect costs such as the lost production during the controls upgrade and testing, which might be incurred.
Voltage Stability
It is estimated that one 200−400 Mvar SVC is required in South Finland and possibly in the Baltics if the Baltic grid is synchronized with the Nordic system, and the Visaginas plant is not constructed. The cost of one SVC is about 10−30 M€. The cost estimate does not include the grid reinforcements that would be needed in case the Visaginas is constructed.
Conclusions on the Cost Estimate
A very rough cost estimate, including only the direct costs, was sketched in this section. The main point in the calculation is to serve as an approximation of the costs related to securing the dynamic stability and voltage stability in case of the Baltic synchronization. These costs are relatively small compared to the costs of building the actual connections, but still noteworthy and need to be considered as part of the decision-making. As mentioned, the cost estimate includes only the direct costs related to securing the dynamic and voltage stability. Therefore, no indirect costs, like the possible lost production during the controls upgrade, are included. The first rough cost-estimate indicates a direct cost of about 550-600 M€ of the Nordic alternative, in where the offshore AC-interconnectors represent about 500 M€. This cost estimate does not include costs related to possible needed grid reinforcements in the Baltic countries and additional reserves needed in the Baltic countries, which are analysed in the JRC study.

Impact of Baltic Synchronization on the Nordic Power System Stability 33 (35)
16.11.2016
5 Conclusions and Recommendations
General Conclusions
This Nordic report presented a dynamic screening study pinpointing the main impacts of the Baltic synchronization with the Nordic system on the stability of the both systems. However, further and more detailed analyses are needed to investigate all the details. The study has been done given the assumption in the European study, that no additional market capacity will be available to the markets from the AC cables between Finland and Estonia, and the cables would only be used for synchronization. Considering additional capacity to the markets would require a completely new study.
The study shows that if realising the possible Nordic-Baltic synchronization, system damping decreases if the necessary corrective actions are not carried out, and some voltage stability issues have to be solved with additional reactive compensation, on the other hand frequency stability is slightly improved. Therefore, the synchronization could have a major impact on the system stability if the corrective actions are not carried out. The synchronization evidently will bring consequences and costs for both the Nordic and Baltic systems, for example in the form of the new equipment, studies, and work to tune, in particular, the Baltic generator controllers. The synchronization process takes time, and resources are needed for the needed investigations and system upgrades.
If de-synchronizing from the big and stable Russian system, the second best option for the Baltic system is to synchronize with another big and stable system, i.e. continental Europe. As shown in this report, synchronizing with the smaller Nordic system is also possible but poses different challenges that have to be addressed. The first rough cost estimate is shown in the report.
More detailed conclusions related to the different stability types, and areas of future work are presented below.
Dynamic Stability
Synchronization of the Baltic system affects the characteristics of the main ("0.3 Hz") inter-area electromechanical oscillation mode that currently occurs between South Finland and South Sweden and Norway. After synchronization, the Baltic system participates in the oscillations in phase with the Finnish generators. The mode frequency in the Nordics has been increasing from 0.3 Hz towards 0.4 Hz due to e.g. new transmission lines, series compensation, and changing generation mix and allocation in the grid. Connecting the Baltics through the 220 kV AC cables between Estonia and Finland decreases the frequency back towards 0.3 Hz due to the increased oscillating mass and long power transmission distances. Hence, the synchronization does not seem to have a negative impact on tuning of the stability controllers in the Nordics, which have been tuned to damp the 0.3 Hz oscillations.
However, damping of the mode decreases due to the synchronization, at least in case there are no stabilizers in the Baltic generators and no power oscillation dampers in the Baltic HVDC links. The decrease in the damping is very dependent on the modelling of the Baltic generators, and especially the stabilizers. The worst case with the Baltic stabilizers turned off indicate even unstable oscillations in an extreme power flow situation. Therefore, the characteristics and tuning of the Baltic stabilizers play a significant role in securing the dynamic stability in the combined Nordic and Baltic system.
The severity of the faults, that are critical when transferring power from Finland to Sweden, would also change. Especially the synchronization affects the severity of the NordBalt and Estlink faults, but it has effect on the Fenno-Skan fault too.
A new mode between Baltic and Finland is introduced when the synchronous connection is established. The mode has a frequency of around 0.5 Hz. It is excited especially by the Estlink fault, because the link connects the oscillating areas. However, this mode seems to be relatively well-damped in the studied

Impact of Baltic Synchronization on the Nordic Power System Stability 34 (35)
16.11.2016
situations. Anyhow, its properties should be further analyzed if the Nordic alternative is selected for the synchronization.
If the Visaginas nuclear plant is constructed in Lithuania, its dynamic behaviour is significant for damping of the oscillations. Therefore, the behaviour and modelling, especially in case of the stabilizer, is important for securing damping of the oscillations. However, all the studied cases with the Visaginas plant were stable when the Baltic stabilizers were enabled.
Sensitivity of the mode characteristics, and especially the damping, was also studied in terms of some key parameters of the grid. These were: the number of AC cables between Estonia and Finland (two instead of three), the number of AC lines between Finland and Sweden (two instead of three), and the Hasle power flow. However, the results indicated only minor sensitivities in terms of these parameters.
The study indicates that connection of the Baltic grid to the Nordic synchronous system would require re-tuning, retrofitting, or installation of power system stabilizers in the Baltic generators to maintain damping of the main inter-area mode on the same level than before synchronization. In addition, it is recommended to add or take in use power oscillation damping controllers on the NordBalt, Fenno-Skan, and possibly on the Estlink HVDC links, and even add SVCs with damping controls if required.
Voltage Stability
A critical fault in terms of voltage stability is tripping of the NordBalt HVDC link at full import to the Baltics. The power flow simulations indicate voltage issues mainly in Southern Finland, and especially in the Helsinki region, in this case. However, it should be noted that the voltages are at low level already before the trip due to the, rather pessimistic, assumptions made in creating the case. Therefore, the voltage stability issues, without the Visaginas plant, could very likely be solved with additional shunt compensation, such as SVCs.
If the Visaginas plant is included, its tripping at full power causes voltage instability in the grid. Therefore, in case the plant is constructed, reinforcements in the Baltic and Finnish grid and/or special system protection schemes have to be applied to secure the voltage stability in case of tripping the plant at full power.
Inertia and Frequency Stability
The inertia analysis shows that connection of the Baltics would increase the total system inertia slightly, and in this way support in maintaining frequency stability of the combined system. The calculation based on the market simulation scenario indicates that on average, the share of Baltic inertia would be around 4 % of the total. However, during some of the minimum inertia situations, which are the most critical situations, the Baltic share could be only around 1 % of the total inertia. Therefore, the added inertia from the Baltic system could be nearly insignificant in some of the minimum inertia situations in the system. The main reason for the especially low Baltic inertia during some of the low inertia situations is the relatively large share of thermal production in the Baltics, which is mostly out of service during the minimum inertia situations.
Future Work
If the Baltic system would be synchronized with the Nordic system, it is essential that these initial results are followed up by more detailed investigations and system upgrades. This comprises:
1) Detailed models of the excitation systems and governors of the main generators in the Baltics. The models have to be validated from field measurements.
2) Upgrading and retuning of power system stabilizers and other damping measures. 3) Characteristics of the new 0.5 Hz mode between the Baltics and Finland need to be studied in
more detail. 4) Needed actions to secure the voltage stability of the system.
Impact of Baltic Synchronization on the Nordic Power System Stability 35 (35)
16.11.2016
5) Protection selectivity study. The Baltic separation from the IPS/UPS system will significantly change the short circuit level which may affect the critical fault clearing time and the grid protection selectivity.
6) Establishment of continuous data streams of time synchronized measurements from selected generators and important corridors. This is required to give important insight into the dynamic response and give confidence in the models, both under the existing system configuration (during test of island operation) as well as after synchronization.
7) Design and implementation of a system protection scheme that will trigger if the system enters into an unintended operational state.
8) Review of all technical and operational procedures in the Baltic states in order to assure that they fulfill the conditions in the Nordic system operation agreement, connection codes and system operation guidelines.
9) Aspects related to the Nordic Challenges report (Statnett, Fingrid, Energinet.dk, Svenska Kraftnät, 2016), such as the system flexibility, need to be taken into account and further evaluated for the larger system including the Baltics.
During the entire process, it is important that a team of qualified experts in system dynamics is allocated for system studies, and to monitor the implementation of the required system upgrades.
References
ABB (2010). XLPE Submarine Cable Systems. Attachment to XLPE Land Cable Systems – User's Guide. http://new.abb.com/docs/default-source/ewea-doc/xlpe-submarine-cable-systems-2gm5007.pdf
Björnstedt, J. (2012). Integration of Non-synchronous Generation - Frequency Dynamics. A doctoral dissertation, Department of Measurement Technology and Industrial Electrical Engineering. Lund University.
ENTSO-E (2015). Nordic Report on Future System Inertia. ENTSO-E. https://www.entsoe.eu/Documents/Publications/SOC/Nordic/Nordic_report_Future_System_Inertia.pdf
SINTEF (2016). EMPS - multi area power-market simulator. https://www.sintef.no/en/software/emps-multi-area-power-market-simulator/


