Impact of Ball-Milling Pretreatment on Pyrolysis … PAPER Impact of Ball-Milling Pretreatment on...
11
ORIGINAL PAPER Impact of Ball-Milling Pretreatment on Pyrolysis Behavior and Kinetics of Crystalline Cellulose Amir Sada Khan 1,2 • Zakaria Man 1 • Mohammad Azmi Bustam 1 • Chong Fai Kait 4 • Muhammad Irfan Khan 1 • Nawshad Muhammad 3 • Asma Nasrullah 4 • Zahoor Ullah 1 • Pervaiz Ahmad 5 Received: 22 July 2015 / Accepted: 8 December 2015 / Published online: 30 December 2015 Ó Springer Science+Business Media Dordrecht 2015 Abstract Effect of ball-milling pretreatment on pyrolysis characteristics of cellulose was studied by thermogravi- metric analysis (TGA) at four different heating rates; 5, 10, 20, and 40 K/min. Variation in the thermal stability and activation energy of cellulose with ball-milling were cal- culated by TGA Kinetics using Kissinger, Kissinger– Akahira–Sunose, Flynn–Wall–Ozawa and Starink model free methods. Results demonstrated that ball-milling reduced the thermal stability and activation energy of cellulose. The original and ball-milled cellulose were thoroughly characterized by Fourier-transform infrared spectroscopy, X-ray diffraction, and Scanning electron microscopy. X-ray diffraction analysis revealed that ball- milling decreased the crystallinity of cellulose from 93 to 51 %. The results suggested that ball-milling pretreatment led to effective disruption of crystalline cellulose to amorphous cellulose. It is, therefore, concluded that the ball-milled cellulose can easily become a useful source of chemicals and energy than crystalline cellulose. Keywords Cellulose Ball-milling Crystallinity index Thermokinetics Activation energy Abbreviations TGA Thermogravimetric analysis KAS Kissinger–Akahira–Sunose FTIR Fourier-transform infrared spectroscopy XRD X-ray diffraction NMR Nuclear magnetic resonance spectroscopy CV Calorific values CC Crystalline cellulose BMC Ball-milled cellulose b Heating rates T max Temperature of the peak Ea Activation energy cm -1 Wavenumber CI Crystallinity index a Conversion factor n Reaction order A Pre-exponential factor R Ideal gas constant Introduction Industrial revolution is largely dependent on energy resources, and existing natural energy resources such as natural gas, oils, and coal are exhaustible. Besides the rapid consumption of fossil fuel, these conventional energy Electronic supplementary material The online version of this article (doi:10.1007/s12649-015-9460-6) contains supplementary material, which is available to authorized users. & Amir Sada Khan [email protected] & Nawshad Muhammad [email protected] 1 Centre of Research in Ionic Liquid, Department of Chemical Engineering, Universiti Teknologi PETRONAS, 31750 Tronoh, Malaysia 2 Department of Chemistry, University of Science and Technology, Bannu 28100, Khyber Pakhtunkhwa, Pakistan 3 Interdisciplinary Research Centre in Biomedical Materials, COMSATS Institute of Information Technology, Lahore, Pakistan 4 Fundamental and Applied Science Department, Universiti Teknologi PETRONAS (UTP), 31750 Tronoh, Perak, Malaysia 5 Department of Physics, Faculty of Science, University of Malaya, 50603 Kuala Lumpur, Malaysia 123 Waste Biomass Valor (2016) 7:571–581 DOI 10.1007/s12649-015-9460-6
Transcript of Impact of Ball-Milling Pretreatment on Pyrolysis … PAPER Impact of Ball-Milling Pretreatment on...
ORIGINAL PAPER
Impact of Ball-Milling Pretreatment on Pyrolysis Behaviorand Kinetics of Crystalline Cellulose
Amir Sada Khan1,2 • Zakaria Man1 • Mohammad Azmi Bustam1•
Chong Fai Kait4 • Muhammad Irfan Khan1 • Nawshad Muhammad3 •
Asma Nasrullah4 • Zahoor Ullah1 • Pervaiz Ahmad5
Received: 22 July 2015 / Accepted: 8 December 2015 / Published online: 30 December 2015
� Springer Science+Business Media Dordrecht 2015
Abstract Effect of ball-milling pretreatment on pyrolysis
characteristics of cellulose was studied by thermogravi-
metric analysis (TGA) at four different heating rates; 5, 10,
20, and 40 K/min. Variation in the thermal stability and
activation energy of cellulose with ball-milling were cal-
culated by TGA Kinetics using Kissinger, Kissinger–
Akahira–Sunose, Flynn–Wall–Ozawa and Starink model
free methods. Results demonstrated that ball-milling
reduced the thermal stability and activation energy of
cellulose. The original and ball-milled cellulose were
thoroughly characterized by Fourier-transform infrared
spectroscopy, X-ray diffraction, and Scanning electron
microscopy. X-ray diffraction analysis revealed that ball-
milling decreased the crystallinity of cellulose from 93 to
51 %. The results suggested that ball-milling pretreatment
led to effective disruption of crystalline cellulose to
amorphous cellulose. It is, therefore, concluded that the
ball-milled cellulose can easily become a useful source of
chemicals and energy than crystalline cellulose.
Keywords Cellulose � Ball-milling � Crystallinity index �Thermokinetics � Activation energy
Abbreviations
TGA Thermogravimetric analysis
KAS Kissinger–Akahira–Sunose
FTIR Fourier-transform infrared spectroscopy
XRD X-ray diffraction
NMR Nuclear magnetic resonance spectroscopy
CV Calorific values
CC Crystalline cellulose
BMC Ball-milled cellulose
b Heating rates
Tmax Temperature of the peak
Ea Activation energy
cm-1 Wavenumber
CI Crystallinity index
a Conversion factor
n Reaction order
A Pre-exponential factor
R Ideal gas constant
Introduction
Industrial revolution is largely dependent on energy
resources, and existing natural energy resources such as
natural gas, oils, and coal are exhaustible. Besides the rapid
consumption of fossil fuel, these conventional energy
Electronic supplementary material The online version of thisarticle (doi:10.1007/s12649-015-9460-6) contains supplementarymaterial, which is available to authorized users.
& Amir Sada Khan
& Nawshad Muhammad
1 Centre of Research in Ionic Liquid, Department of Chemical
Engineering, Universiti Teknologi PETRONAS,
31750 Tronoh, Malaysia
2 Department of Chemistry, University of Science and
Technology, Bannu 28100, Khyber Pakhtunkhwa, Pakistan
3 Interdisciplinary Research Centre in Biomedical Materials,
COMSATS Institute of Information Technology, Lahore,
Pakistan
4 Fundamental and Applied Science Department, Universiti
Teknologi PETRONAS (UTP), 31750 Tronoh, Perak,
Malaysia
5 Department of Physics, Faculty of Science, University of
Malaya, 50603 Kuala Lumpur, Malaysia
123
Waste Biomass Valor (2016) 7:571–581
DOI 10.1007/s12649-015-9460-6
resources also threaten our ecosystem by emitting haz-
ardous gases during their combustion. Thus, the demand
and search for alternative energy resources are important to
meet vast energy requirements [1, 2]. Recently, lignocel-
lulosic biomass is mainly composed of cellulose, has been
introduced as an alternative to fossil fuel because of its
abundance, environmental friendliness, and sustainability.
Therefore, cellulose which is most abundant component of
biomass can contribute to energy and chemical demands in
the future [3–6].
Cellulose is the homo-polymer consists of glucopyra-
nose repeating unit. The repeating units are linking toge-
ther by b-(1?4) glycosidic bonds formed between C-1 and
C-4 of the adjacent glucose. The chemical formula of
cellulose is (C6H10O5) n and structurally it consists of long
straight chains without branching. The long-chains are
interlinked through hydrogen bonding (results from inter-
action of hydrogen atom of one chain with hydroxide group
of another chain) and van der Waals forces, which cause
the cellulose to be packed into microfibrils [5, 7]. These
close packing of chains via intermolecular and
intramolecular hydrogen bonding limit the solubility and
conversion/hydrolysis of cellulose into energy and chemi-
cals [8]. Cellulose is containing both crystalline and
amorphous components. The amorphous component is
more important than the crystalline region because of its
easy degradation and conversion into chemicals and fuels.
The higher reactivity of amorphous cellulose than crys-
talline cellulose (CC) can be attributed to the lower cohe-
sive energy density of the former than the latter [4].
In the last few years, various chemical and physical
methods have been applied to decrease the crystallinity
and molecular weight of cellulose for efficient conversion/
hydrolysis to glucose and others chemicals. In chemical
methods, strong acids [9–12] and ionic liquids [13–15] are
usually used to decrease the crystallinity of cellulose and
ultimately its hydrolysis to chemicals. Acid and ionic
liquid treatments decrease the crystallinity and facilitate
the conversion of cellulose. However, the applications of
such treatments are limited by the high cost, toxicity,
corrosive nature, and environmental pollution of ionic
liquids. Physical treatments are more environmental
friendly than chemical treatments because the former does
not need any solvent. Ball-milling is a powerful physical
technique used to modify the structure of cellulose [16–
18].
Pyrolysis is one of the most efficient methods in con-
verting cellulose into valuable chemicals and fuels. It is
thermal process and conducted in the absence of oxygen.
During pyrolysis, the molecules of cellulose are broken
down to low molecular weight gases (volatiles), liquids
(tars) and solid char. The volatile gases and liquids are both
very important from energy point of view because of their
high calorific value (CV). Thermogravimetric analysis
(TGA) is a rapid and effective quantitative method used to
understand the pyrolysis under nonisothermal and isother-
mal conditions, and to determine the kinetic parameters of
the thermal decomposition of cellulose. These kinetic
parameters include activation energy (Ea), reaction order
(n), and pre-exponential factor (A). The activation energy is
a dominant factor that gives considerable information
about cellulose reactivity. Determining kinetic parameters
via TGA is essential to design and establish efficient, safe,
and reasonable processes. Kissinger [19], Ozawa [20],
Flynn–Wall [21], and Friedman [22] proposed model free
kinetics methods. The model-free methods are extensively
used because of their simplicity and low error risk. The
model free kinetics methods are used to evaluate simple
and complex kinetic reactions without prior knowledge of
the reaction mechanism [18]. These all models are based
on the following general expression;
dadt
¼ Ae �EaRTð Þf að Þ ð1Þ
To the best of our knowledge, there is a very little
information available on the effect of mechanical treatment
on the pyrolysis process of cellulose. This study is the first
systematic study to investigate the effect of a mechanical
treatment (i.e., ball-milling) on the kinetics of thermal
decomposition of cellulose. Kinetic parameters were
determined by using Kissinger, Kissinger–Akahira–Sunose
(KAS), Flynn–Wall–Ozawa (FWO) and Starink methods.
The effect of ball-milling on the crystallinity and mor-
phology of cellulose was thoroughly characterized by
Fourier-transform infrared spectroscopy (FTIR), X-ray
diffraction (XRD, and scanning electron microscopy
(SEM). The calorific values (CVs) of the cellulose sample
before and after ball-milling were determined. Investigat-
ing the effect of ball-milling on the crystallinity and ther-
mal decomposition kinetics of cellulose using various
model free methods is a significant contribution.
Experimental
Ball-Milling of Cellulose
The crystalline cellulose (CC) was supplied by Merck
Malaysia. The cellulose was milled using planetary ball
mill (Fristch, Germany, S. No: 05.6000/00594) for 2 h with
a milling frequency 600 rpm. A 20 g cellulose sample was
placed in a zirconium oxide bowl (500 mL) with 25 zir-
conium oxide balls (1 cm diameter) during milling. To
prevent overheating of cellulose, 5 min of interval was
provided between every 30 min of milling. This ball-milled
cellulose (BMC) was used for further analysis.
572 Waste Biomass Valor (2016) 7:571–581
123
Characterizations of Cellulose
The FTIR spectra of crystalline and ball-milled cellulose
were recorded using FTIR spectroscopy (Perkin–Elmer
spectrum one, US). FTIR spectra were recorded within the
wavenumber range of 4000–450 cm-1 with a resolution of
5 cm-1. The CV of cellulose samples was determined by
using a bomb calorimeter (Ika-Werke of Gmbh& Co Kg).
XRD analysis of untreated and BMC samples was carried
out with a Philips powder diffractometer using a Ni-filtered
Cupper K-alpha radiation (wavelength 1.5418 A). The
diffracted intensities were measured within the range of 5�to 40� (2h). The thermal characteristics or weight-loss
profiles of CC and BMC were investigated using a ther-
mogravimetric analyzer (Perkin Elmer, STA 6000) over the
temperature range of 373–723 K at various heating rates of
5, 10, 20, and 40 K/min. The analysis was conducted using
N2 gas with a flow rate of 50 mL/min and sample weight of
5–7 mg.
Kinetic Study
Kissinger Kinetic Method
This method allows to obtain the value of activation energy
from a plot of ln(b/Tmax2 ) against 1000/Tmax for experiments
performed at different heating rates (b), where Tmax is the
temperature of the peak of the DTG curve, representing the
maximum decomposition point. The equation can be
expressed as
lnb
T2max
� �¼ ln
A � REa � g að Þ
� �� E
RTmaxð2Þ
Using this equation, the activation energy (Ea) can be
calculated from the slope of the plot of ln bT2max
� �against
1000/Tmax, which is equal to � Ea
R.
Ozawa Method
The simple mathematical form of the Ozawa method can
be expressed as
ln bð Þ ¼ lnAE
Rg
� �� 5:331 � 1:052
E
RTð3Þ
where g(a) represents mechanism and is considered as a
unity and constant at a given value of conversion. The
subscript a denotes the value of conversion. The activation
energy Ea can be calculated from the slope (-1.052Ea/R)
of plot of ln(b) against 1000/Tm at different heating rates
[20].
Kissinger–Akahira–Sunose Method (KAS)
The KAS method is also called the generalized Kissinger
method [19] and is based on the following expression:
lnbiT2ai
� �¼ ln
AaR
Eaga
� �� Ea
RTaið4Þ
where the subscript i denotes the ordinal number of a non-
isothermal experiment conducted at the heating rate bi and
the subscript a denotes the quantity evaluated at a specific
conversion fraction. This method allows us to calculate the
apparent activation energy from a plot of ln(bi/Ta,i2 ) versus
1000/Ta,I for a given value of conversion, a, where the
slope is equal to -Ea/R.
Starink Method
In Starink method [23], both FWO method and KAS
method can be transferred into the following formula.
lnb
T1:92
� �¼ Const � 1:0008
E
RTð5Þ
where b is the heating rate, R is the universal gas constant
and T is the absolute temperature. In 1996 Starink devel-
oped new method by adjusting the value of s and B used in
FWO and KAS methods. In Starink method the apparent
activation energy calculated from the slope of each line by
plotting ln bT1:92
� �versus 1000/T.
Results and Discussion
Energy Transfer During Ball Milling
During ball-milling, the energy is transferred to materials.
The transfer of energy can be explained by considering a
simple collision theory; that is, the mechanical energy of
planetary ball mill is transferred via vial wall–ball and
ball–ball collision [24–27]. This transfer of energy depends
on various variables, such milling time, ball weight ratio,
ball number, and angular velocity of the ball mill plate. The
transfer of kinetics energy to the powder occurs when the
powder comes between the balls, converting cellulose into
small pieces [28–30].
FTIR Analysis
To study the effect of ball-milling on the crystallinity of
cellulose, FTIR spectra were recorded before and after ball-
milling (supplementary Fig. 1). The spectra show that ball-
Waste Biomass Valor (2016) 7:571–581 573
123
milling can affect the spectra of cellulose. The changes in
spectra were observed in the 1190–850, 1520–1190, and
3700–2800 cm-1 regions. Various FTIR-based methods
can be used to determine the ratio of crystalline and
amorphous celluloses in samples. The ratio between
absorbance values of bands centered at approximately 1430
and 895 cm-1 (A1430/A895), and at 1372 and 2900 cm-1
(A1372/A2900) has been used to evaluate the crystallinity
index [31, 32]. The broad band in the 3600–3100 cm-1
region is due to the OH-stretching vibration. The change in
this peak position gives considerable information about
hydrogen bonding and ultimately cellulose crystallinity. In
amorphous cellulose, this peak became sharper and shifts
toward higher wavenumber [33]. The increase in the
amorphous domain with ball-milling can also be confirmed
by the shifting of the band at 2900 cm-1 (corresponding to
C–H vibration) to high number and decrease in its inten-
sity. Similarly, the band at the 1500–899 cm-1 region
greatly reduced with ball-milling. The increase in the
intensity of band occurred at 898 cm-1 [C–O–C stretching,
b-(1,4) glycosidic linkages] in amorphous cellulose as
compared with the un milled cellulose [4, 33, 34].
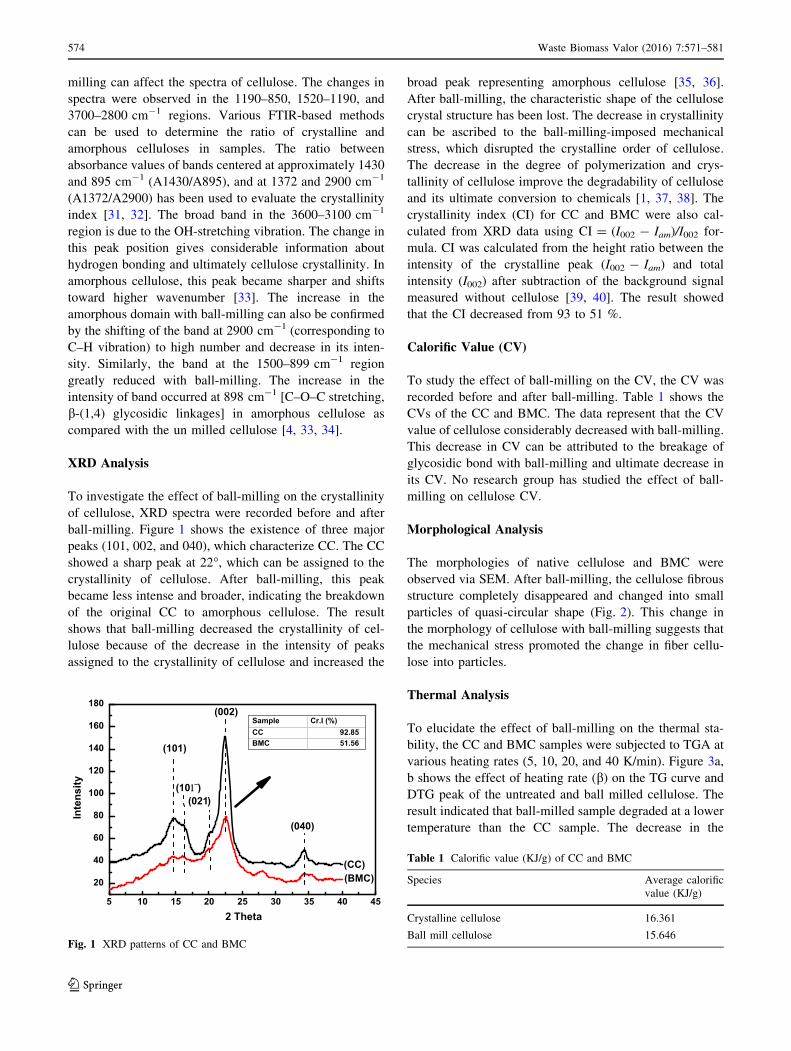
XRD Analysis
To investigate the effect of ball-milling on the crystallinity
of cellulose, XRD spectra were recorded before and after
ball-milling. Figure 1 shows the existence of three major
peaks (101, 002, and 040), which characterize CC. The CC
showed a sharp peak at 22�, which can be assigned to the
crystallinity of cellulose. After ball-milling, this peak
became less intense and broader, indicating the breakdown
of the original CC to amorphous cellulose. The result
shows that ball-milling decreased the crystallinity of cel-
lulose because of the decrease in the intensity of peaks
assigned to the crystallinity of cellulose and increased the
broad peak representing amorphous cellulose [35, 36].
After ball-milling, the characteristic shape of the cellulose
crystal structure has been lost. The decrease in crystallinity
can be ascribed to the ball-milling-imposed mechanical
stress, which disrupted the crystalline order of cellulose.
The decrease in the degree of polymerization and crys-
tallinity of cellulose improve the degradability of cellulose
and its ultimate conversion to chemicals [1, 37, 38]. The
crystallinity index (CI) for CC and BMC were also cal-
culated from XRD data using CI = (I002 - Iam)/I002 for-
mula. CI was calculated from the height ratio between the
intensity of the crystalline peak (I002 - Iam) and total
intensity (I002) after subtraction of the background signal
measured without cellulose [39, 40]. The result showed
that the CI decreased from 93 to 51 %.
Calorific Value (CV)
To study the effect of ball-milling on the CV, the CV was
recorded before and after ball-milling. Table 1 shows the
CVs of the CC and BMC. The data represent that the CV
value of cellulose considerably decreased with ball-milling.
This decrease in CV can be attributed to the breakage of
glycosidic bond with ball-milling and ultimate decrease in
its CV. No research group has studied the effect of ball-
milling on cellulose CV.
Morphological Analysis
The morphologies of native cellulose and BMC were
observed via SEM. After ball-milling, the cellulose fibrous
structure completely disappeared and changed into small
particles of quasi-circular shape (Fig. 2). This change in
the morphology of cellulose with ball-milling suggests that
the mechanical stress promoted the change in fiber cellu-
lose into particles.
Thermal Analysis
To elucidate the effect of ball-milling on the thermal sta-
bility, the CC and BMC samples were subjected to TGA at
various heating rates (5, 10, 20, and 40 K/min). Figure 3a,
b shows the effect of heating rate (b) on the TG curve and
DTG peak of the untreated and ball milled cellulose. The
result indicated that ball-milled sample degraded at a lower
temperature than the CC sample. The decrease in the
5 10 15 20 25 30 35 40 45
20
40
60
80
100
120
140
160
180
(021)
(040)
(002)
(101 )
Inte
nsity
2 Theta
(101)
(CC)(BMC)
Sample Cr.I (%)CC 92.85BMC 51.56
Fig. 1 XRD patterns of CC and BMC
Table 1 Calorific value (KJ/g) of CC and BMC
Species Average calorific
value (KJ/g)
Crystalline cellulose 16.361
Ball mill cellulose 15.646
574 Waste Biomass Valor (2016) 7:571–581
123
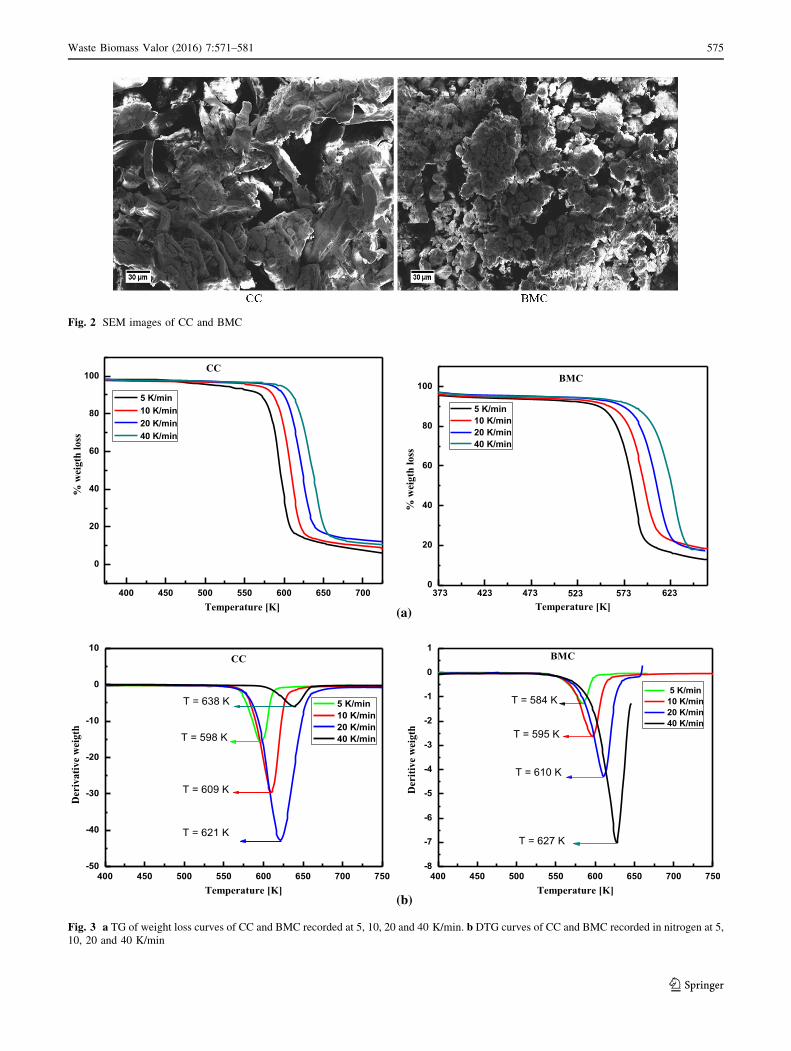
Fig. 2 SEM images of CC and BMC
(a)
(b)
Fig. 3 a TG of weight loss curves of CC and BMC recorded at 5, 10, 20 and 40 K/min. b DTG curves of CC and BMC recorded in nitrogen at 5,
10, 20 and 40 K/min
Waste Biomass Valor (2016) 7:571–581 575
123
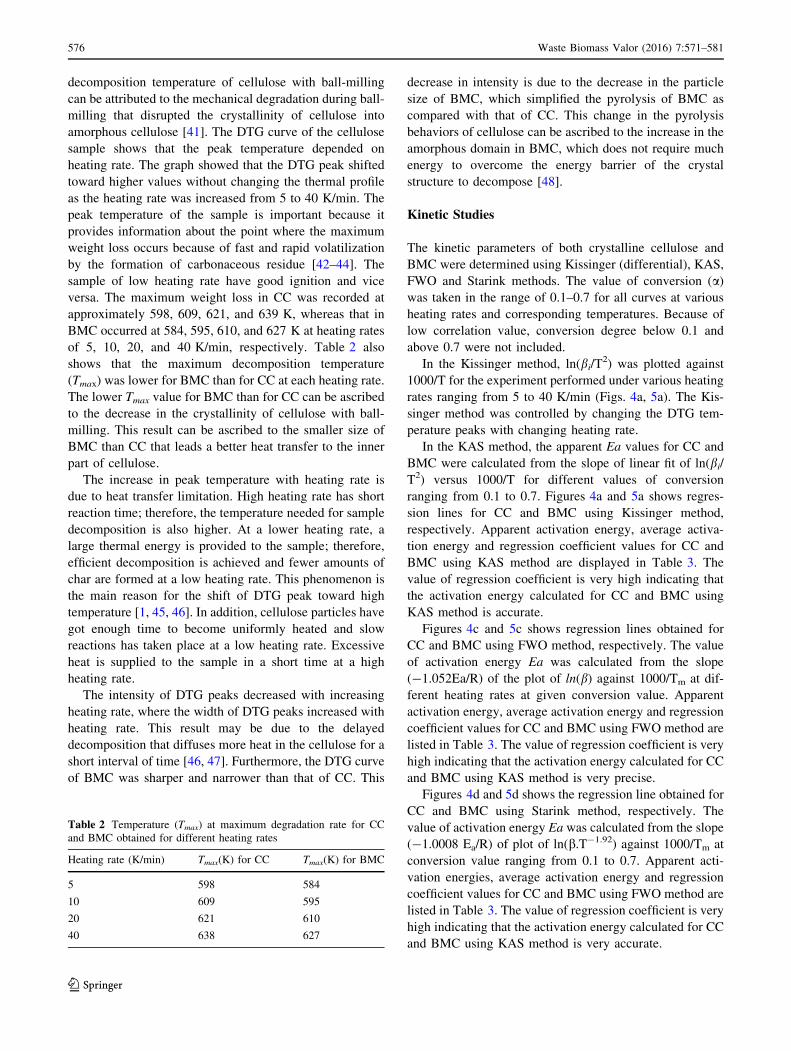
decomposition temperature of cellulose with ball-milling
can be attributed to the mechanical degradation during ball-
milling that disrupted the crystallinity of cellulose into
amorphous cellulose [41]. The DTG curve of the cellulose
sample shows that the peak temperature depended on
heating rate. The graph showed that the DTG peak shifted
toward higher values without changing the thermal profile
as the heating rate was increased from 5 to 40 K/min. The
peak temperature of the sample is important because it
provides information about the point where the maximum
weight loss occurs because of fast and rapid volatilization
by the formation of carbonaceous residue [42–44]. The
sample of low heating rate have good ignition and vice
versa. The maximum weight loss in CC was recorded at
approximately 598, 609, 621, and 639 K, whereas that in
BMC occurred at 584, 595, 610, and 627 K at heating rates
of 5, 10, 20, and 40 K/min, respectively. Table 2 also
shows that the maximum decomposition temperature
(Tmax) was lower for BMC than for CC at each heating rate.
The lower Tmax value for BMC than for CC can be ascribed
to the decrease in the crystallinity of cellulose with ball-
milling. This result can be ascribed to the smaller size of
BMC than CC that leads a better heat transfer to the inner
part of cellulose.
The increase in peak temperature with heating rate is
due to heat transfer limitation. High heating rate has short
reaction time; therefore, the temperature needed for sample
decomposition is also higher. At a lower heating rate, a
large thermal energy is provided to the sample; therefore,
efficient decomposition is achieved and fewer amounts of
char are formed at a low heating rate. This phenomenon is
the main reason for the shift of DTG peak toward high
temperature [1, 45, 46]. In addition, cellulose particles have
got enough time to become uniformly heated and slow
reactions has taken place at a low heating rate. Excessive
heat is supplied to the sample in a short time at a high
heating rate.
The intensity of DTG peaks decreased with increasing
heating rate, where the width of DTG peaks increased with
heating rate. This result may be due to the delayed
decomposition that diffuses more heat in the cellulose for a
short interval of time [46, 47]. Furthermore, the DTG curve
of BMC was sharper and narrower than that of CC. This
decrease in intensity is due to the decrease in the particle
size of BMC, which simplified the pyrolysis of BMC as
compared with that of CC. This change in the pyrolysis
behaviors of cellulose can be ascribed to the increase in the
amorphous domain in BMC, which does not require much
energy to overcome the energy barrier of the crystal
structure to decompose [48].
Kinetic Studies
The kinetic parameters of both crystalline cellulose and
BMC were determined using Kissinger (differential), KAS,
FWO and Starink methods. The value of conversion (a)
was taken in the range of 0.1–0.7 for all curves at various
heating rates and corresponding temperatures. Because of
low correlation value, conversion degree below 0.1 and
above 0.7 were not included.
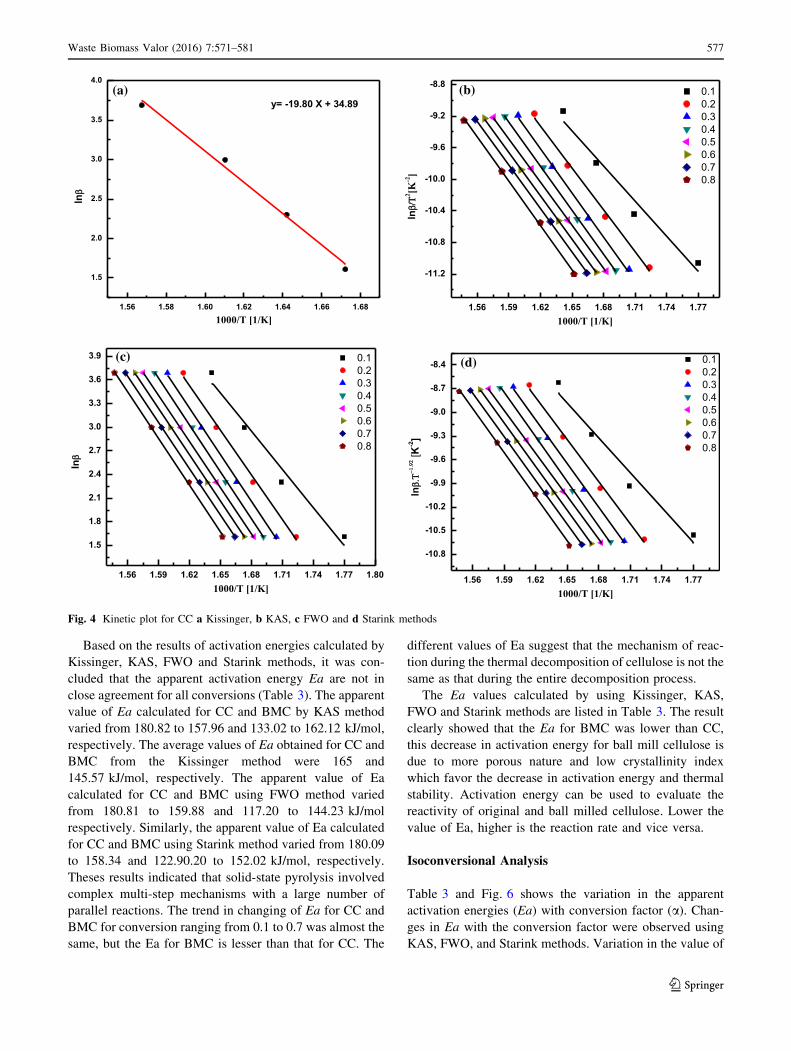
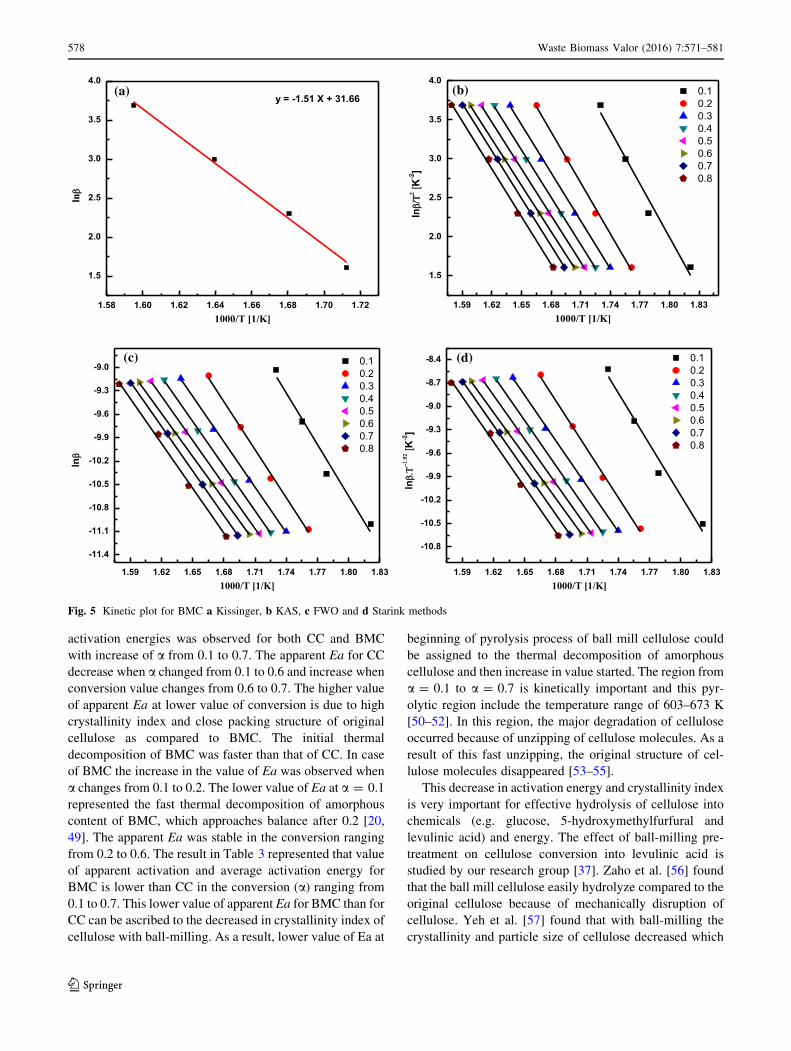
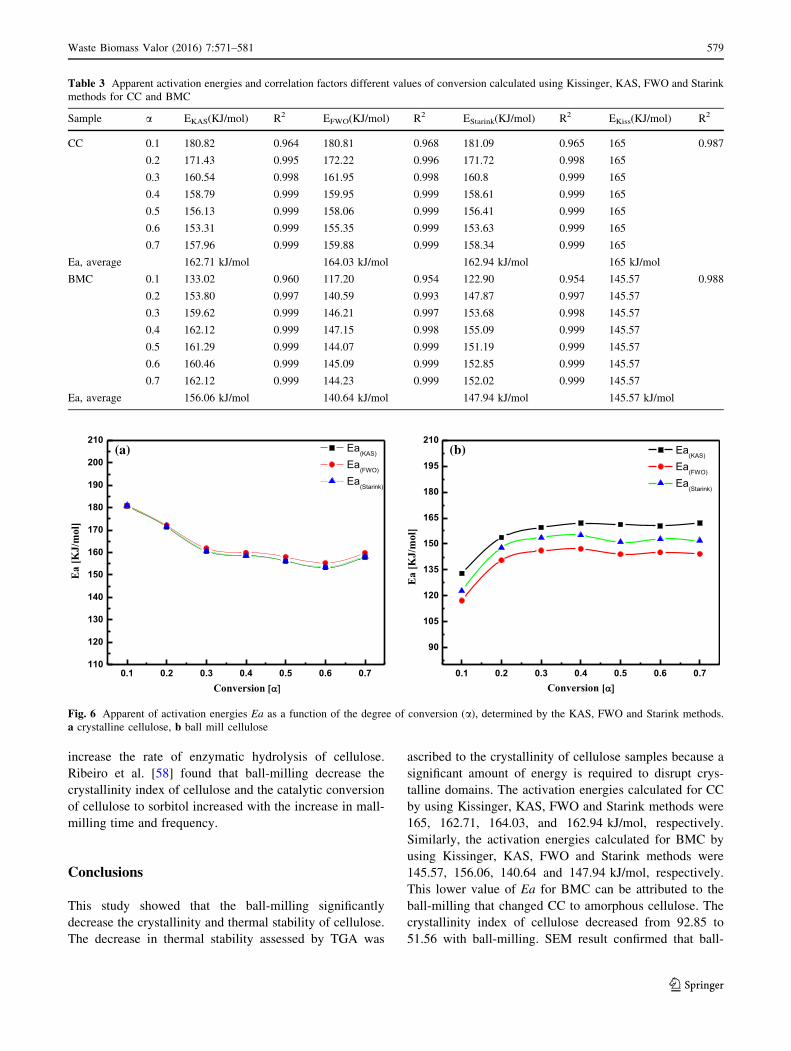
In the Kissinger method, ln(bi/T2) was plotted against
1000/T for the experiment performed under various heating
rates ranging from 5 to 40 K/min (Figs. 4a, 5a). The Kis-
singer method was controlled by changing the DTG tem-
perature peaks with changing heating rate.
In the KAS method, the apparent Ea values for CC and
BMC were calculated from the slope of linear fit of ln(bi/T2) versus 1000/T for different values of conversion
ranging from 0.1 to 0.7. Figures 4a and 5a shows regres-
sion lines for CC and BMC using Kissinger method,
respectively. Apparent activation energy, average activa-
tion energy and regression coefficient values for CC and
BMC using KAS method are displayed in Table 3. The
value of regression coefficient is very high indicating that
the activation energy calculated for CC and BMC using
KAS method is accurate.
Figures 4c and 5c shows regression lines obtained for
CC and BMC using FWO method, respectively. The value
of activation energy Ea was calculated from the slope
(-1.052Ea/R) of the plot of ln(b) against 1000/Tm at dif-
ferent heating rates at given conversion value. Apparent
activation energy, average activation energy and regression
coefficient values for CC and BMC using FWO method are
listed in Table 3. The value of regression coefficient is very
high indicating that the activation energy calculated for CC
and BMC using KAS method is very precise.
Figures 4d and 5d shows the regression line obtained for
CC and BMC using Starink method, respectively. The
value of activation energy Ea was calculated from the slope
(-1.0008 Ea/R) of plot of ln(b.T-1.92) against 1000/Tm at
conversion value ranging from 0.1 to 0.7. Apparent acti-
vation energies, average activation energy and regression
coefficient values for CC and BMC using FWO method are
listed in Table 3. The value of regression coefficient is very
high indicating that the activation energy calculated for CC
and BMC using KAS method is very accurate.
Table 2 Temperature (Tmax) at maximum degradation rate for CC
and BMC obtained for different heating rates
Heating rate (K/min) Tmax(K) for CC Tmax(K) for BMC
5 598 584
10 609 595
20 621 610
40 638 627
576 Waste Biomass Valor (2016) 7:571–581
123
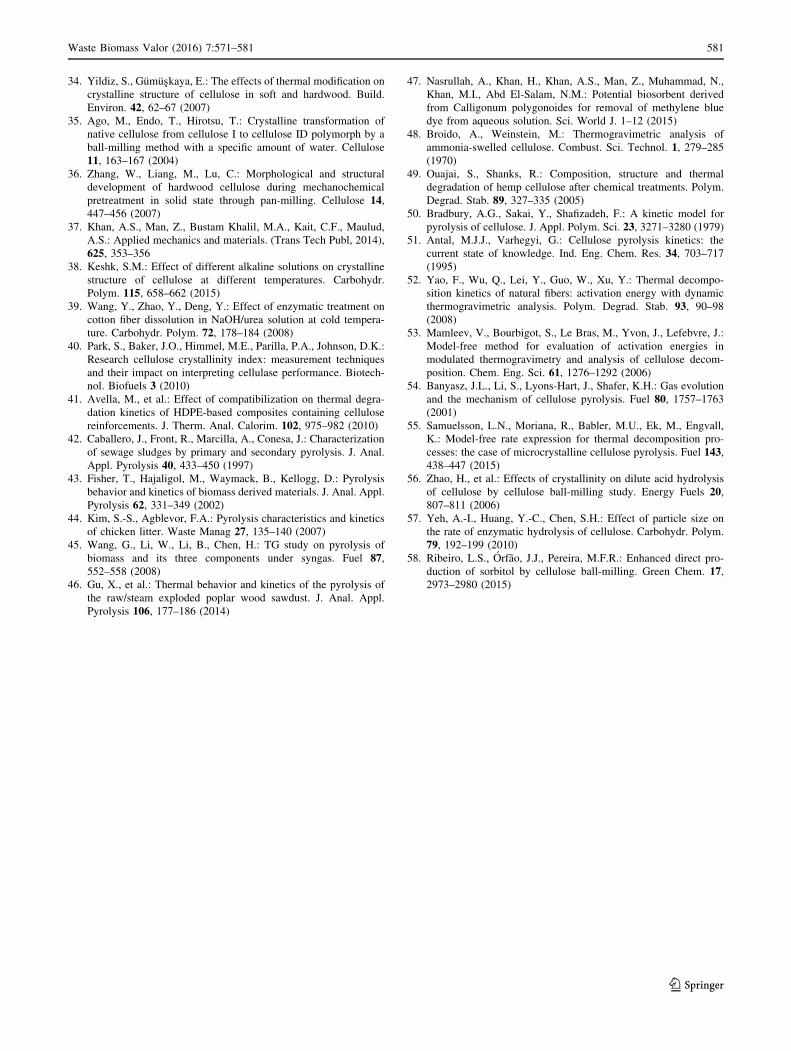
Based on the results of activation energies calculated by
Kissinger, KAS, FWO and Starink methods, it was con-
cluded that the apparent activation energy Ea are not in
close agreement for all conversions (Table 3). The apparent
value of Ea calculated for CC and BMC by KAS method
varied from 180.82 to 157.96 and 133.02 to 162.12 kJ/mol,
respectively. The average values of Ea obtained for CC and
BMC from the Kissinger method were 165 and
145.57 kJ/mol, respectively. The apparent value of Ea
calculated for CC and BMC using FWO method varied
from 180.81 to 159.88 and 117.20 to 144.23 kJ/mol
respectively. Similarly, the apparent value of Ea calculated
for CC and BMC using Starink method varied from 180.09
to 158.34 and 122.90.20 to 152.02 kJ/mol, respectively.
Theses results indicated that solid-state pyrolysis involved
complex multi-step mechanisms with a large number of
parallel reactions. The trend in changing of Ea for CC and
BMC for conversion ranging from 0.1 to 0.7 was almost the
same, but the Ea for BMC is lesser than that for CC. The
different values of Ea suggest that the mechanism of reac-
tion during the thermal decomposition of cellulose is not the
same as that during the entire decomposition process.
The Ea values calculated by using Kissinger, KAS,
FWO and Starink methods are listed in Table 3. The result
clearly showed that the Ea for BMC was lower than CC,
this decrease in activation energy for ball mill cellulose is
due to more porous nature and low crystallinity index
which favor the decrease in activation energy and thermal
stability. Activation energy can be used to evaluate the
reactivity of original and ball milled cellulose. Lower the
value of Ea, higher is the reaction rate and vice versa.
Isoconversional Analysis
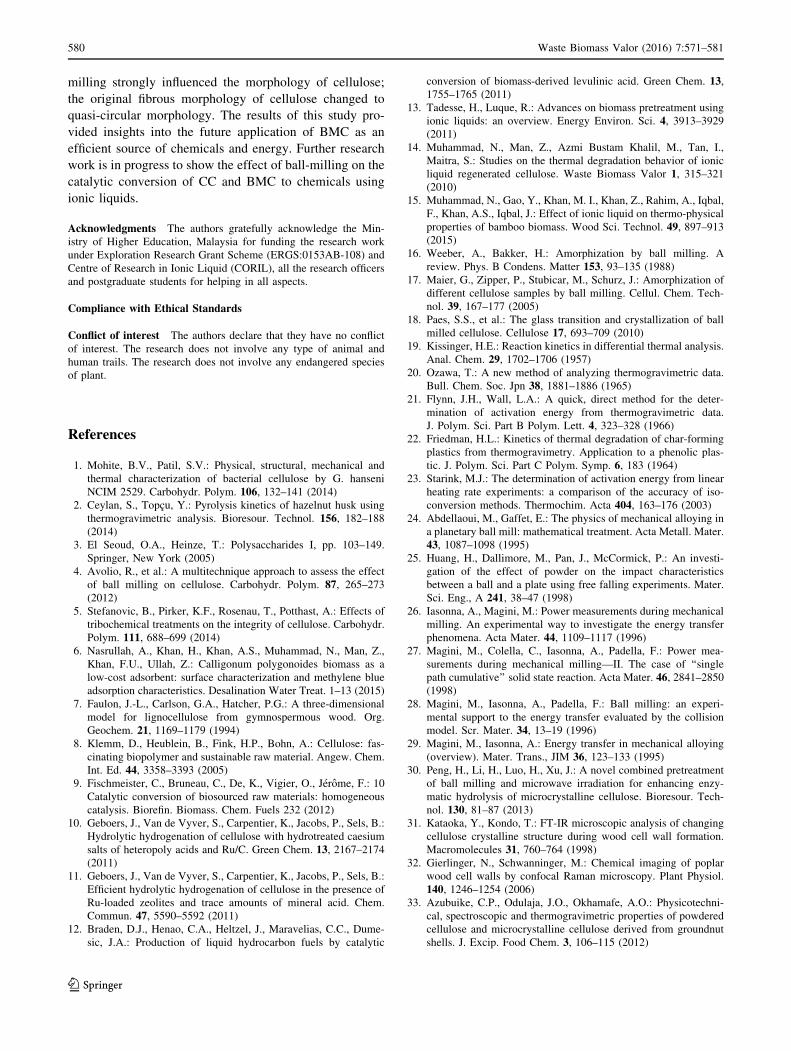
Table 3 and Fig. 6 shows the variation in the apparent
activation energies (Ea) with conversion factor (a). Chan-
ges in Ea with the conversion factor were observed using
KAS, FWO, and Starink methods. Variation in the value of
(a) (b)
(c) (d)
Fig. 4 Kinetic plot for CC a Kissinger, b KAS, c FWO and d Starink methods
Waste Biomass Valor (2016) 7:571–581 577
123
activation energies was observed for both CC and BMC
with increase of a from 0.1 to 0.7. The apparent Ea for CC
decrease when a changed from 0.1 to 0.6 and increase when
conversion value changes from 0.6 to 0.7. The higher value
of apparent Ea at lower value of conversion is due to high
crystallinity index and close packing structure of original
cellulose as compared to BMC. The initial thermal
decomposition of BMC was faster than that of CC. In case
of BMC the increase in the value of Ea was observed when
a changes from 0.1 to 0.2. The lower value of Ea at a = 0.1
represented the fast thermal decomposition of amorphous
content of BMC, which approaches balance after 0.2 [20,
49]. The apparent Ea was stable in the conversion ranging
from 0.2 to 0.6. The result in Table 3 represented that value
of apparent activation and average activation energy for
BMC is lower than CC in the conversion (a) ranging from
0.1 to 0.7. This lower value of apparent Ea for BMC than for
CC can be ascribed to the decreased in crystallinity index of
cellulose with ball-milling. As a result, lower value of Ea at
beginning of pyrolysis process of ball mill cellulose could
be assigned to the thermal decomposition of amorphous
cellulose and then increase in value started. The region from
a = 0.1 to a = 0.7 is kinetically important and this pyr-
olytic region include the temperature range of 603–673 K
[50–52]. In this region, the major degradation of cellulose
occurred because of unzipping of cellulose molecules. As a
result of this fast unzipping, the original structure of cel-
lulose molecules disappeared [53–55].
This decrease in activation energy and crystallinity index
is very important for effective hydrolysis of cellulose into
chemicals (e.g. glucose, 5-hydroxymethylfurfural and
levulinic acid) and energy. The effect of ball-milling pre-
treatment on cellulose conversion into levulinic acid is
studied by our research group [37]. Zaho et al. [56] found
that the ball mill cellulose easily hydrolyze compared to the
original cellulose because of mechanically disruption of
cellulose. Yeh et al. [57] found that with ball-milling the
crystallinity and particle size of cellulose decreased which
(a) (b)
(c) (d)
Fig. 5 Kinetic plot for BMC a Kissinger, b KAS, c FWO and d Starink methods
578 Waste Biomass Valor (2016) 7:571–581
123
increase the rate of enzymatic hydrolysis of cellulose.
Ribeiro et al. [58] found that ball-milling decrease the
crystallinity index of cellulose and the catalytic conversion
of cellulose to sorbitol increased with the increase in mall-
milling time and frequency.
Conclusions
This study showed that the ball-milling significantly
decrease the crystallinity and thermal stability of cellulose.
The decrease in thermal stability assessed by TGA was
ascribed to the crystallinity of cellulose samples because a
significant amount of energy is required to disrupt crys-
talline domains. The activation energies calculated for CC
by using Kissinger, KAS, FWO and Starink methods were
165, 162.71, 164.03, and 162.94 kJ/mol, respectively.
Similarly, the activation energies calculated for BMC by
using Kissinger, KAS, FWO and Starink methods were
145.57, 156.06, 140.64 and 147.94 kJ/mol, respectively.
This lower value of Ea for BMC can be attributed to the
ball-milling that changed CC to amorphous cellulose. The
crystallinity index of cellulose decreased from 92.85 to
51.56 with ball-milling. SEM result confirmed that ball-
Table 3 Apparent activation energies and correlation factors different values of conversion calculated using Kissinger, KAS, FWO and Starink
methods for CC and BMC
Sample a EKAS(KJ/mol) R2 EFWO(KJ/mol) R2 EStarink(KJ/mol) R2 EKiss(KJ/mol) R2
CC 0.1 180.82 0.964 180.81 0.968 181.09 0.965 165 0.987
0.2 171.43 0.995 172.22 0.996 171.72 0.998 165
0.3 160.54 0.998 161.95 0.998 160.8 0.999 165
0.4 158.79 0.999 159.95 0.999 158.61 0.999 165
0.5 156.13 0.999 158.06 0.999 156.41 0.999 165
0.6 153.31 0.999 155.35 0.999 153.63 0.999 165
0.7 157.96 0.999 159.88 0.999 158.34 0.999 165
Ea, average 162.71 kJ/mol 164.03 kJ/mol 162.94 kJ/mol 165 kJ/mol
BMC 0.1 133.02 0.960 117.20 0.954 122.90 0.954 145.57 0.988
0.2 153.80 0.997 140.59 0.993 147.87 0.997 145.57
0.3 159.62 0.999 146.21 0.997 153.68 0.998 145.57
0.4 162.12 0.999 147.15 0.998 155.09 0.999 145.57
0.5 161.29 0.999 144.07 0.999 151.19 0.999 145.57
0.6 160.46 0.999 145.09 0.999 152.85 0.999 145.57
0.7 162.12 0.999 144.23 0.999 152.02 0.999 145.57
Ea, average 156.06 kJ/mol 140.64 kJ/mol 147.94 kJ/mol 145.57 kJ/mol
(a) (b)
Fig. 6 Apparent of activation energies Ea as a function of the degree of conversion (a), determined by the KAS, FWO and Starink methods.
a crystalline cellulose, b ball mill cellulose
Waste Biomass Valor (2016) 7:571–581 579
123
milling strongly influenced the morphology of cellulose;
the original fibrous morphology of cellulose changed to
quasi-circular morphology. The results of this study pro-
vided insights into the future application of BMC as an
efficient source of chemicals and energy. Further research
work is in progress to show the effect of ball-milling on the
catalytic conversion of CC and BMC to chemicals using
ionic liquids.
Acknowledgments The authors gratefully acknowledge the Min-
istry of Higher Education, Malaysia for funding the research work
under Exploration Research Grant Scheme (ERGS:0153AB-108) and
Centre of Research in Ionic Liquid (CORIL), all the research officers
and postgraduate students for helping in all aspects.
Compliance with Ethical Standards
Conflict of interest The authors declare that they have no conflict
of interest. The research does not involve any type of animal and
human trails. The research does not involve any endangered species
of plant.
References
1. Mohite, B.V., Patil, S.V.: Physical, structural, mechanical and
thermal characterization of bacterial cellulose by G. hanseni
NCIM 2529. Carbohydr. Polym. 106, 132–141 (2014)
2. Ceylan, S., Topcu, Y.: Pyrolysis kinetics of hazelnut husk using
thermogravimetric analysis. Bioresour. Technol. 156, 182–188
(2014)
3. El Seoud, O.A., Heinze, T.: Polysaccharides I, pp. 103–149.
Springer, New York (2005)
4. Avolio, R., et al.: A multitechnique approach to assess the effect
of ball milling on cellulose. Carbohydr. Polym. 87, 265–273
(2012)
5. Stefanovic, B., Pirker, K.F., Rosenau, T., Potthast, A.: Effects of
tribochemical treatments on the integrity of cellulose. Carbohydr.
Polym. 111, 688–699 (2014)
6. Nasrullah, A., Khan, H., Khan, A.S., Muhammad, N., Man, Z.,
Khan, F.U., Ullah, Z.: Calligonum polygonoides biomass as a
low-cost adsorbent: surface characterization and methylene blue
adsorption characteristics. Desalination Water Treat. 1–13 (2015)
7. Faulon, J.-L., Carlson, G.A., Hatcher, P.G.: A three-dimensional
model for lignocellulose from gymnospermous wood. Org.
Geochem. 21, 1169–1179 (1994)
8. Klemm, D., Heublein, B., Fink, H.P., Bohn, A.: Cellulose: fas-
cinating biopolymer and sustainable raw material. Angew. Chem.
Int. Ed. 44, 3358–3393 (2005)
9. Fischmeister, C., Bruneau, C., De, K., Vigier, O., Jerome, F.: 10
Catalytic conversion of biosourced raw materials: homogeneous
catalysis. Biorefin. Biomass. Chem. Fuels 232 (2012)
10. Geboers, J., Van de Vyver, S., Carpentier, K., Jacobs, P., Sels, B.:
Hydrolytic hydrogenation of cellulose with hydrotreated caesium
salts of heteropoly acids and Ru/C. Green Chem. 13, 2167–2174
(2011)
11. Geboers, J., Van de Vyver, S., Carpentier, K., Jacobs, P., Sels, B.:
Efficient hydrolytic hydrogenation of cellulose in the presence of
Ru-loaded zeolites and trace amounts of mineral acid. Chem.
Commun. 47, 5590–5592 (2011)
12. Braden, D.J., Henao, C.A., Heltzel, J., Maravelias, C.C., Dume-
sic, J.A.: Production of liquid hydrocarbon fuels by catalytic
conversion of biomass-derived levulinic acid. Green Chem. 13,
1755–1765 (2011)
13. Tadesse, H., Luque, R.: Advances on biomass pretreatment using
ionic liquids: an overview. Energy Environ. Sci. 4, 3913–3929
(2011)
14. Muhammad, N., Man, Z., Azmi Bustam Khalil, M., Tan, I.,
Maitra, S.: Studies on the thermal degradation behavior of ionic
liquid regenerated cellulose. Waste Biomass Valor 1, 315–321
(2010)
15. Muhammad, N., Gao, Y., Khan, M. I., Khan, Z., Rahim, A., Iqbal,
F., Khan, A.S., Iqbal, J.: Effect of ionic liquid on thermo-physical
properties of bamboo biomass. Wood Sci. Technol. 49, 897–913
(2015)
16. Weeber, A., Bakker, H.: Amorphization by ball milling. A
review. Phys. B Condens. Matter 153, 93–135 (1988)
17. Maier, G., Zipper, P., Stubicar, M., Schurz, J.: Amorphization of
different cellulose samples by ball milling. Cellul. Chem. Tech-
nol. 39, 167–177 (2005)
18. Paes, S.S., et al.: The glass transition and crystallization of ball
milled cellulose. Cellulose 17, 693–709 (2010)
19. Kissinger, H.E.: Reaction kinetics in differential thermal analysis.
Anal. Chem. 29, 1702–1706 (1957)
20. Ozawa, T.: A new method of analyzing thermogravimetric data.
Bull. Chem. Soc. Jpn 38, 1881–1886 (1965)
21. Flynn, J.H., Wall, L.A.: A quick, direct method for the deter-
mination of activation energy from thermogravimetric data.
J. Polym. Sci. Part B Polym. Lett. 4, 323–328 (1966)
22. Friedman, H.L.: Kinetics of thermal degradation of char-forming
plastics from thermogravimetry. Application to a phenolic plas-
tic. J. Polym. Sci. Part C Polym. Symp. 6, 183 (1964)
23. Starink, M.J.: The determination of activation energy from linear
heating rate experiments: a comparison of the accuracy of iso-
conversion methods. Thermochim. Acta 404, 163–176 (2003)
24. Abdellaoui, M., Gaffet, E.: The physics of mechanical alloying in
a planetary ball mill: mathematical treatment. Acta Metall. Mater.
43, 1087–1098 (1995)
25. Huang, H., Dallimore, M., Pan, J., McCormick, P.: An investi-
gation of the effect of powder on the impact characteristics
between a ball and a plate using free falling experiments. Mater.
Sci. Eng., A 241, 38–47 (1998)
26. Iasonna, A., Magini, M.: Power measurements during mechanical
milling. An experimental way to investigate the energy transfer
phenomena. Acta Mater. 44, 1109–1117 (1996)
27. Magini, M., Colella, C., Iasonna, A., Padella, F.: Power mea-
surements during mechanical milling—II. The case of ‘‘single
path cumulative’’ solid state reaction. Acta Mater. 46, 2841–2850
(1998)
28. Magini, M., Iasonna, A., Padella, F.: Ball milling: an experi-
mental support to the energy transfer evaluated by the collision
model. Scr. Mater. 34, 13–19 (1996)
29. Magini, M., Iasonna, A.: Energy transfer in mechanical alloying
(overview). Mater. Trans., JIM 36, 123–133 (1995)
30. Peng, H., Li, H., Luo, H., Xu, J.: A novel combined pretreatment
of ball milling and microwave irradiation for enhancing enzy-
matic hydrolysis of microcrystalline cellulose. Bioresour. Tech-
nol. 130, 81–87 (2013)
31. Kataoka, Y., Kondo, T.: FT-IR microscopic analysis of changing
cellulose crystalline structure during wood cell wall formation.
Macromolecules 31, 760–764 (1998)
32. Gierlinger, N., Schwanninger, M.: Chemical imaging of poplar
wood cell walls by confocal Raman microscopy. Plant Physiol.
140, 1246–1254 (2006)
33. Azubuike, C.P., Odulaja, J.O., Okhamafe, A.O.: Physicotechni-
cal, spectroscopic and thermogravimetric properties of powdered
cellulose and microcrystalline cellulose derived from groundnut
shells. J. Excip. Food Chem. 3, 106–115 (2012)
580 Waste Biomass Valor (2016) 7:571–581
123
34. Yildiz, S., Gumuskaya, E.: The effects of thermal modification on
crystalline structure of cellulose in soft and hardwood. Build.
Environ. 42, 62–67 (2007)
35. Ago, M., Endo, T., Hirotsu, T.: Crystalline transformation of
native cellulose from cellulose I to cellulose ID polymorph by a
ball-milling method with a specific amount of water. Cellulose
11, 163–167 (2004)
36. Zhang, W., Liang, M., Lu, C.: Morphological and structural
development of hardwood cellulose during mechanochemical
pretreatment in solid state through pan-milling. Cellulose 14,
447–456 (2007)
37. Khan, A.S., Man, Z., Bustam Khalil, M.A., Kait, C.F., Maulud,
A.S.: Applied mechanics and materials. (Trans Tech Publ, 2014),
625, 353–356
38. Keshk, S.M.: Effect of different alkaline solutions on crystalline
structure of cellulose at different temperatures. Carbohydr.
Polym. 115, 658–662 (2015)
39. Wang, Y., Zhao, Y., Deng, Y.: Effect of enzymatic treatment on
cotton fiber dissolution in NaOH/urea solution at cold tempera-
ture. Carbohydr. Polym. 72, 178–184 (2008)
40. Park, S., Baker, J.O., Himmel, M.E., Parilla, P.A., Johnson, D.K.:
Research cellulose crystallinity index: measurement techniques
and their impact on interpreting cellulase performance. Biotech-
nol. Biofuels 3 (2010)
41. Avella, M., et al.: Effect of compatibilization on thermal degra-
dation kinetics of HDPE-based composites containing cellulose
reinforcements. J. Therm. Anal. Calorim. 102, 975–982 (2010)
42. Caballero, J., Front, R., Marcilla, A., Conesa, J.: Characterization
of sewage sludges by primary and secondary pyrolysis. J. Anal.
Appl. Pyrolysis 40, 433–450 (1997)
43. Fisher, T., Hajaligol, M., Waymack, B., Kellogg, D.: Pyrolysis
behavior and kinetics of biomass derived materials. J. Anal. Appl.
Pyrolysis 62, 331–349 (2002)
44. Kim, S.-S., Agblevor, F.A.: Pyrolysis characteristics and kinetics
of chicken litter. Waste Manag 27, 135–140 (2007)
45. Wang, G., Li, W., Li, B., Chen, H.: TG study on pyrolysis of
biomass and its three components under syngas. Fuel 87,
552–558 (2008)
46. Gu, X., et al.: Thermal behavior and kinetics of the pyrolysis of
the raw/steam exploded poplar wood sawdust. J. Anal. Appl.
Pyrolysis 106, 177–186 (2014)
47. Nasrullah, A., Khan, H., Khan, A.S., Man, Z., Muhammad, N.,
Khan, M.I., Abd El-Salam, N.M.: Potential biosorbent derived
from Calligonum polygonoides for removal of methylene blue
dye from aqueous solution. Sci. World J. 1–12 (2015)
48. Broido, A., Weinstein, M.: Thermogravimetric analysis of
ammonia-swelled cellulose. Combust. Sci. Technol. 1, 279–285
(1970)
49. Ouajai, S., Shanks, R.: Composition, structure and thermal
degradation of hemp cellulose after chemical treatments. Polym.
Degrad. Stab. 89, 327–335 (2005)
50. Bradbury, A.G., Sakai, Y., Shafizadeh, F.: A kinetic model for
pyrolysis of cellulose. J. Appl. Polym. Sci. 23, 3271–3280 (1979)
51. Antal, M.J.J., Varhegyi, G.: Cellulose pyrolysis kinetics: the
current state of knowledge. Ind. Eng. Chem. Res. 34, 703–717
(1995)
52. Yao, F., Wu, Q., Lei, Y., Guo, W., Xu, Y.: Thermal decompo-
sition kinetics of natural fibers: activation energy with dynamic
thermogravimetric analysis. Polym. Degrad. Stab. 93, 90–98
(2008)
53. Mamleev, V., Bourbigot, S., Le Bras, M., Yvon, J., Lefebvre, J.:
Model-free method for evaluation of activation energies in
modulated thermogravimetry and analysis of cellulose decom-
position. Chem. Eng. Sci. 61, 1276–1292 (2006)
54. Banyasz, J.L., Li, S., Lyons-Hart, J., Shafer, K.H.: Gas evolution
and the mechanism of cellulose pyrolysis. Fuel 80, 1757–1763
(2001)
55. Samuelsson, L.N., Moriana, R., Babler, M.U., Ek, M., Engvall,
K.: Model-free rate expression for thermal decomposition pro-
cesses: the case of microcrystalline cellulose pyrolysis. Fuel 143,
438–447 (2015)
56. Zhao, H., et al.: Effects of crystallinity on dilute acid hydrolysis
of cellulose by cellulose ball-milling study. Energy Fuels 20,
807–811 (2006)
57. Yeh, A.-I., Huang, Y.-C., Chen, S.H.: Effect of particle size on
the rate of enzymatic hydrolysis of cellulose. Carbohydr. Polym.
79, 192–199 (2010)
58. Ribeiro, L.S., Orfao, J.J., Pereira, M.F.R.: Enhanced direct pro-
duction of sorbitol by cellulose ball-milling. Green Chem. 17,
2973–2980 (2015)
Waste Biomass Valor (2016) 7:571–581 581
123