Impact of alternative fuels and hydrogen-enriched gaseous fuel on combustion and emissions in
167
i IMPACT OF ALTERNATIVE FUELS AND HYDROGEN – ENRICHED GASEOUS FUEL ON COMBUSTION AND EMISSIONS IN DIESEL ENGINES By Hendry Sakke Tira A thesis submitted to The University of Birmingham For the degree of DOCTOR OF PHILOSOPHY School of Mechanical Engineering The University of Birmingham March 2013
Transcript of Impact of alternative fuels and hydrogen-enriched gaseous fuel on combustion and emissions in
i
IMPACT OF ALTERNATIVE FUELS AND HYDROGEN – ENRICHED
GASEOUS FUEL ON COMBUSTION AND EMISSIONS IN DIESEL
ENGINES
By
Hendry Sakke Tira
A thesis submitted to
The University of Birmingham
For the degree of
DOCTOR OF PHILOSOPHY
School of Mechanical Engineering
The University of Birmingham
March 2013
University of Birmingham Research Archive
e-theses repository This unpublished thesis/dissertation is copyright of the author and/or third parties. The intellectual property rights of the author or third parties in respect of this work are as defined by The Copyright Designs and Patents Act 1988 or as modified by any successor legislation. Any use made of information contained in this thesis/dissertation must be in accordance with that legislation and must be properly acknowledged. Further distribution or reproduction in any format is prohibited without the permission of the copyright holder.
ii
ABSTRACT
The dependence on fossil fuels in transportation and other sectors, e.g. power
generation, has increased concerns for their availability in the future. Therefore, the
introduction of various alternative fuels for vehicles is necessary. However, the utilisation of
alternative fuels, specifically gaseous fuel, in diesel engines has some disadvantages such as
reduced engine thermal efficiency and increased exhaust gas emissions, although showing
good results in reducing soot and NOX, simultaneously. Therefore, the effect of the hydrogen
– enriched gaseous fuel (i.e. assuming conversion of part of the gaseous fuel into hydrogen –
enriched gas in a fuel reforming process) in the dual fuelled combustion process was studied
as a mean of improving further the combustion process and control emissions.
The hydrogen addition was very effective in overcoming the penalty of the biogas or
LPG-diesel dual fuelled engine operation. Under hydrogen addition and high engine load, in
the case of biogas-diesel dual fuelling, the HC and CO emissions decreased up to 59.3% and
49.6% respectively and thermal efficiency increased by 9.1%. However, NOX increased by
21.2%. In LPG-diesel dual fuelling, the HC and CO reduced by 32.6% and 48% respectively,
thermal efficiency increased by 7.4%, but NOX increased by 16%.
The implementation of exhaust gas recirculation (EGR) and advanced injection timing
showed great potential for dual fuelled engine. The utilisation of EGR at high LPG
concentration further improved soot – NOX trade-off through low in-cylinder temperatures
and reduced amount of liquid fuel used for combustion. At low load and under EGR
application, soot and NOX emissions reduced by 58.9% and 18.4% respectively. In addition,
the increased in-cylinder temperature with advanced injection timing improved dual fuelled
iii
combustion process hence reducing both HC and CO by 7.5% and increased engine brake
thermal efficiency by 3.6%.
Moreover, the properties of the injected diesel fuels (ULSD, RME and GTL) as a pilot
fuel have been shown to significantly affect the combustion process, rate of heat release, and
emissions formation and oxidation in the dual fuelling system. Oxygenated fuel like RME
contributed to the reduction of emissions, except NOX, while a high cetane number fuel like
GTL showed better tolerance to EGR addition and soot – NOX trade-off.

iv
ACKNOWLEDGEMENTS
I thank, first and foremost, Dr Athanasios Tsolakis for all his help as supervisor, and
Professor Miroslaw L. Wyszynski as co-supervisor, for their useful advice towards my
studies.
My gratitude goes to the Department of National Education of Republic of Indonesia for
providing a PhD scholarship and maintenance grants during my studies at the University of
Birmingham.
I would also like to thank all the technical staff at the University of Birmingham for
their help, with a special mention going to Carl Hingley and Peter Thornton in the Future
Power System laboratory for all the ordering and support.
Special thanks go to all my friends in the FPS group for their support and friendship
throughout my studies.
Finally I thank my beloved wife and children in Indonesia for their love, patience and
support throughout my studies over the past few years.
Hendry Sakke Tira
March 2013
v
TABLE OF CONTENTS
LIST OF FIGURES ................................................................................................................ viii
LIST OF TABLES .................................................................................................................. xii
LIST OF NOTATIONS .......................................................................................................... xiii
LIST OF ABBREVIATIONS ................................................................................................ xiv
CHAPTER 1 INTRODUCTION........................................................................................1
1.1 Background .................................................................................................................... 1
1.2 Objectives of the Research ............................................................................................ 3
1.3 Thesis Outline ................................................................................................................ 4
CHAPTER 2 LITERATURE REVIEW.............................................................................6
2.1 Diesel Engine Operation ................................................................................................ 6
2.2 Diesel Engine-out Emissions ......................................................................................... 8
2.2.1 Carbon Dioxide (CO2) ............................................................................................ 8
2.2.2 Hydrocarbons (HCs) ............................................................................................. 10
2.2.3 Carbon Monoxide (CO) ........................................................................................ 12
2.2.4 Nitrogen Oxides (NOX) ........................................................................................ 13
2.2.5 Particulate Matter (PM) ........................................................................................ 15
2.2.6 Unregulated Emissions ......................................................................................... 16
2.3 Strategy for Fuel Security and Sustainability .............................................................. 19
2.3.1 Gaseous Fuels Utilisation ..................................................................................... 19
2.3.1.1 Biogas ............................................................................................................. 19
2.3.1.2 Liquefied Petroleum Gas (LPG) ..................................................................... 21
2.3.1.3 Hydrogen ........................................................................................................ 23
2.3.2 Alternative Liquid Fuels Utilisation ................................................................... ..25
2.3.2.1 Biodiesel ......................................................................................................... 26
2.3.2.2 Gas-to-Liquid (GTL) ...................................................................................... 27
2.3.3 Engine Technology through Dual Fuel System .................................................... 29
2.4 Engine-Related Strategies for Emissions Reduction ................................................... 32
2.4.1 Exhaust Gas Recirculation (EGR) ........................................................................ 32
2.4.2 Diesel Fuel Injection Timing ................................................................................ 34
vi
2.5 Hydrogen Production from Fuel Reforming ................................................................ 36
2.6 Current Method of Alternatives Fuels Utilisation in Dual Fuelled Diesel Engines .... 37
CHAPTER 3 EXPERIMENTAL SETUP........................................................................41
3.1 Test Engine .................................................................................................................. 41
3.2 Dual Fuel System Setup ............................................................................................... 42
3.3 Engine Instrumentation ................................................................................................ 43
3.4 Engine-out Emissions Measurement ........................................................................... 44
3.5 Fuels ............................................................................................................................. 45
3.6 Equations ..................................................................................................................... 47
CHAPTER 4 COMBUSTION AND EMISSIONS CHARACTERISTICS OF BIOGAS-
DIESEL DUAL FUELLED ENGINE.........................................................49
4.1 Introduction .................................................................................................................. 49
4.2 Biogas-ULSD Combustion and Emissions .................................................................. 52
4.3 Effects of Diesel Fuel Properties (ULSD, GD30 and GTL) on Biogas-Diesel
Combustion .................................................................................................................. 59
4.4 Effects of Hydrogen and Reformate on Biogas-Diesel Combustion ........................... 65
4.5 Summary ...................................................................................................................... 72
CHAPTER 5 CHARACTERISTICS OF LPG-DIESEL DUAL FUELLED ENGINE
OPERATED WITH RAPESEED METHYL ESTER AND GAS-TO-LIQUID
DIESEL FUELS.........................................................................................74
5.1 Introduction .................................................................................................................. 74
5.2 Effect of LPG and EGR for ULSD .............................................................................. 75
5.3 Effect of Liquid Fuels .................................................................................................. 84
5.4 Effect of Advanced Injection Timing .......................................................................... 93
5.5 Summary ...................................................................................................................... 99
CHAPTER 6 UNDERSTANDING THE INFLUENCE OF THE REFORMATE AND THE
PROPERTIES OF DIESEL FUEL IN LPG-DIESEL DUAL FUELLED
COMBUSTION........................................................................................101
6.1 Introduction ................................................................................................................ 101
6.2 Effect of Reformate and Hydrogen ............................................................................ 103
6.3 Effect of Liquid Fuels ................................................................................................ 114
6.4 Summary .................................................................................................................... 123
vii
CHAPTER 7 CONCLUSIONS......................................................................................125
7.1 Concluding Remarks ................................................................................................. 125
7.1.1 Gaseous Fuel Effect ............................................................................................ 125
7.1.2 Liquid (pilot) Fuel Effect .................................................................................... 126
7.1.3 Fuel Injection Timing Effect .............................................................................. 127
7.1.4 Hydrogen and Reformate Effect ......................................................................... 128
7.2 Future Work ............................................................................................................... 129
APPENDICES.. ..................................................................................................................... 131
PUBLICATIONS .................................................................................................................. 135
LIST OF REFERENCES ...................................................................................................... 136
viii
LIST OF FIGURES
Figure 1. The world fuel price from 2003-2010 (Arze del Granado et al., 2012).................. 2
Figure 2. Typical combustion phase of direct injection diesel engine (Tira et al., 2012) ...... 7
Figure 3. Sources of CO2 emissions in 2009 (IEA, 2011) ..................................................... 9
Figure 4. CO2 emissions associated to type of fuel in 2009 (IEA, 2011) ............................ 10
Figure 5. Characteristic of engine-out emissions from biodiesel and its blend (McCormick,
2005). .................................................................................................................... 26
Figure 6. Schematic diagram of FT diesel fuel production stages (Forest and Muzzell, 2005)
.............................................................................................................................. 28
Figure 7. H-Process dual fuel engine method (Shah et al., 2011) ........................................ 31
Figure 8. A schematic diagram of exhaust gas recirculation ............................................... 32
Figure 9. The change of spray flame volume due to EGR (Abd-Alla, 2002) ...................... 33
Figure 10. The Lister Petter TR1 diesel engine test cell ........................................................ 41
Figure 11. Schematic diagram of experimental setup ............................................................ 43
Figure 12. Schematic diagram of experimental setup for biogas-diesel combustion ............ 51
Figure 13. In-cylinder pressure and ROHR for biogas-ULSD combustion. (a) 1200 rpm 2
bar, (b) 1200 rpm 4 bar, (c) 1500 rpm 2 bar, (d) 1500 rpm 4 bar. ........................ 53
Figure 14. COV for biogas-ULSD combustion. (a) COV of IMEP, (b) COV of peak pressure.
.............................................................................................................................. 54
Figure 15. Liquid fuel replacement (%Wt) and thermal efficiency for biogas-ULSD
combustion. ........................................................................................................... 55
Figure 16. Emissions for biogas-ULSD combustion. (a) CO, (b) HC, (c) NOX, (d) smoke, (e)
CO2 ....................................................................................................................... 57
Figure 17. Particulate size distribution for biogas-ULSD combustion. (a) 1200 rpm 2 bar, (b)
1200 rpm 4 bar, (c) 1500 rpm 2 bar, (d) 1500 rpm 4 bar. .................................... 58
Figure 18. Total particulate mass and number biogas-ULSD combustion. (a) 1200 rpm 2 bar,
(b) 1200 rpm 4 bar, (c) 1500 rpm 2 bar, (d) 1500 rpm 4 bar. ............................... 59
Figure 19. In-cylinder pressure and ROHR for biogas-Diesel (ULSD, GD30, GTL) at 1500
rpm 4 bar. (a) GD30, (b) GTL, (c) ULSD, GD30 and GTL at 2% biogas addition,
(d) ULSD, GD30 and GTL at 4% biogas addition. .............................................. 60
Figure 20. COV for biogas-Diesel (ULSD, GD30, GTL) combustion at 1500 rpm 4 bar. (a)
COV of IMEP, (b) COV of peak pressure. ........................................................... 61
ix
Figure 21. Liquid fuel replacement (%Wt) and thermal efficiency for biogas-Diesel (ULSD,
GD30, GTL) at 1500 rpm 4 bar. ........................................................................... 62
Figure 22. Emissions for biogas-Diesel (ULSD, GD30, GTL) combustion at 1500 rpm 4 bar.
(a) CO, (b) HC, (c) NOX, (d) smoke, (e) CO2. ..................................................... 63
Figure 23. Particulate size distribution for biogas-Diesel (ULSD, GD30, GTL) combustion at
1500 rpm 4 bar. (a) GD30, (b) GTL, (c) ULSD, GD30 and GTL at 2% biogas
addition (d) ULSD, GD30 and GTL at 4% biogas addition. ................................ 64
Figure 24. Total particulate mass and number for biogas-Diesel (ULSD, GD30, GTL)
combustion at 1500 rpm 4 bar. (a) GD30, (b) GTL, (c) ULSD, GD30 and GTL at
2% biogas addition, (d) ULSD, GD30 and GTL at 4% biogas addition. ............. 65
Figure 25. In-cylinder pressure and ROHR for biogas-Diesel (ULSD, GD30, GTL) with
hydrogen and reformate addition at 1500 rpm 4 bar. (a) ULSD, (b) GD30, (c)
GTL....................................................................................................................... 66
Figure 26. COV for biogas-Diesel (ULSD, GD30, GTL) combustion with hydrogen and
reformate addition at 1500 rpm 4 bar. (a) COV of IMEP, (b) COV of peak
pressure. ................................................................................................................ 67
Figure 27. Liquid fuel replacement (%Wt) and thermal efficiency for biogas-Diesel (ULSD,
GD30, GTL) combustion with hydrogen and reformate addition at 1500 rpm 4
bar. ........................................................................................................................ 68
Figure 28. Emissions for biogas-Diesel (ULSD, GD30, GTL) combustion with hydrogen and
reformate addition at 1500 rpm 4 bar. (a) CO, (b) HC, (c) NOX, (d) smoke, (e)
CO2. ...................................................................................................................... 70
Figure 29. Particulate size distribution for biogas-Diesel (ULSD, GD30, GTL) combustion
with hydrogen and reformate addition at 1500 rpm 4 bar. (a) ULSD, (b) GD30, (c)
GTL....................................................................................................................... 71
Figure 30. Total particulate mass and number for biogas-Diesel (ULSD, GD30, GTL)
combustion with hydrogen and reformate addition at 1500 rpm 4 bar. (a) ULSD,
(b) GD30, (c) GTL. ............................................................................................... 72
Figure 31. In-cylinder pressure and ROHR for ULSD-LPG combustion. (a) 3 bar, (b) 5 bar,
(c) effect of EGR at 3 bar, (d) effect of EGR at 5 bar. ......................................... 76
Figure 32. Liquid fuel replacement (%Wt) and COV of IMEP for ULSD-LPG combustion.78
Figure 33. Thermal efficiency for ULSD-LPG combustion. ................................................. 79
Figure 34. Emissions for ULSD-LPG combustion. (a) HC, (b) CO, (c) CO2. ....................... 80
Figure 35. Soot-NOX trade-off for ULSD-LPG combustion. ................................................ 82
Figure 36. SOM emission and HC-SOM correlation for ULSD-LPG combustion. .............. 83
Figure 37. SOF emission for ULSD-LPG combustion. ......................................................... 84
x
Figure 38. In-cylinder pressure and ROHR for Diesel (ULSD, RME, GTL)-LPG combustion.
(a) effect of different liquid fuels at 3 bar, (b) effect of different liquid fuels at 5
bar, (c) effect of EGR on RME-LPG combustion, (d) effect of EGR on GTL-LPG
combustion. ........................................................................................................... 85
Figure 39. Liquid fuel replacement (%Wt) and COV of IMEP at different liquid fuels for
Diesel-LPG combustion........................................................................................ 87
Figure 40. Thermal efficiency at different liquid fuels for Diesel-LPG combustion............. 88
Figure 41. Emission at different liquid fuels for Diesel-LPG combustion. (a) HC, (b) CO, (c)
CO2. ...................................................................................................................... 89
Figure 42. Soot-NOX trade-off at different liquid fuels for Diesel-LPG combustion. (a) 0%
EGR, (b) 20% EGR .............................................................................................. 91
Figure 43. SOM emission and HC-SOM correlation at different liquid fuels for Diesel-LPG
combustion. ........................................................................................................... 92
Figure 44. SOF emission at different liquid fuels for Diesel-LPG combustion. ................... 93
Figure 45. In-cylinder pressure and ROHR with advanced injection timing for GTL-LPG
combustion. (a) 3 bar, (b) 5 bar. ........................................................................... 94
Figure 46. COV of IMEP with advanced injection timing for GTL-LPG combustion. ........ 95
Figure 47. Thermal efficiency with advanced injection timing for GTL-LPG combustion. . 96
Figure 48. Emission with effect of advanced injection timing for GTL-LPG combustion. (a).
HC, (b) CO, (c) CO2. ............................................................................................ 97
Figure 49. NOX and soot emission with effect of advanced injection timing for GTL-LPG
combustion ............................................................................................................ 98
Figure 50. SOM and SOF emissions with effect of advanced injection timing for GTL-LPG
combustion. ........................................................................................................... 99
Figure 51. Schematic diagram of experimental setup for LPG-diesel combustion. ............ 103
Figure 52. In-cylinder pressure and ROHR for ULSD-LPG combustion with hydrogen and
reformate addition. (a) 3 bar, (b) 5 bar. .............................................................. 104
Figure 53. Combustion duration according to 10-90% mass fraction burnt for ULSD-LPG
combustion with hydrogen and reformate addition. ........................................... 104
Figure 54. Liquid fuel replacement (%Wt) for ULSD-LPG combustion with hydrogen and
reformate addition. .............................................................................................. 105
Figure 55. Thermal efficiency for ULSD-LPG combustion with hydrogen and reformate
addition ............................................................................................................... 106
Figure 56. Regulated gaseous emissions and FSN for ULSD-LPG combustion with hydrogen
and reformate addition. (a) HC, (b) CO, (c) FSN-NOX trade-off. ...................... 108
xi
Figure 57. Hydrocarbons species and formaldehyde emissions for ULSD-LPG combustion
with hydrogen and reformate addition. ............................................................... 110
Figure 58. Particulate size distributions for ULSD-LPG combustion with hydrogen and
reformate addition. (a) 0.2% LPG, (b) 1% LPG. ................................................ 113
Figure 59. In-cylinder pressure and ROHR for different liquid fuels with hydrogen and
reformate addition. (a) RME-LPG combustion, (b) GTL-LPG combustion. ..... 115
Figure 60. Thermal efficiency for different liquid fuels with hydrogen and reformate
addition. .............................................................................................................. 116
Figure 61. Regulated gaseous emissions and FSN for different liquid fuels with hydrogen
and reformate addition. (a) HC, (b) CO, (c) FSN-NOX trade-off at 3 bar, (d) FSN-
NOX trade-off at 5 bar. ........................................................................................ 118
Figure 62. HC species and formaldehyde at baseline condition for different liquid fuels... 119
Figure 63. Hydrocarbon species and formaldehyde emissions for 1% LPG addition with
hydrogen and reformate addition. ....................................................................... 121
Figure 64. Particulate size distributions for RME and GTL-LPG combustion with hydrogen
and reformate addition. ....................................................................................... 123
Figure C.1. In-cylinder pressure and ROHR for ULSD-LPG combustion with hydrogen and
reformate at 3 bar IMEP. (a) 0.2% LPG, (b) 0.5% LPG. ................................... 133
Figure C.2. In-cylinder pressure and ROHR for ULSD-LPG combustion with hydrogen and
reformate at 5 bar IMEP. (a) 0.2% LPG, (b) 0.5% LPG. ................................... 134
xii
LIST OF TABLES
Table 1. Variations of biogas constituents (Rahmouni et al., 2002) ................................... 20
Table 2. Test engine specifications (Theinnoi et al., 2009, Chong et al., 2010) ................ 42
Table 3. Liquid fuel properties (Abu-Jrai et al., 2009, Rounce et al., 2012) ...................... 46
Table 4. Gaseous fuel properties (Verhelst and Wallner, 2009, Abd Alla et al., 2002, Qi et
al., 2007, Sahoo et al., 2012, Reiter and Kong, 2011) .......................................... 46
Table 5. Engine operating conditions (biogas-diesel dual fuelling with biogas reformed) 51
Table 6. Engine operating conditions (LPG-diesel dual fuelling) ...................................... 75
Table 7. Engine operating conditions (LPG-diesel dual fuelling with LPG reformed) .... 102
Table A.1. Technical data and performance of Horiba Mexa 7100-DEGR ......................... 131
Table A.2. Technical data and performance of Horiba Mexa-1230PM ............................... 131
Table B.1. Gaseous fuels flow rate at 1200 rpm, 2 and 4 bar IMEP under biogas-Diesel dual
fuelling ................................................................................................................ 132
Table B.2. Gaseous fuels flow rate at 1500 rpm, 2 and 4 bar IMEP under biogas-Diesel dual
fuelling ................................................................................................................ 132
Table B.3. Gaseous fuels flow rate at 1500 rpm, 3 and 5 bar IMEP under LPG-Diesel dual
fuelling ................................................................................................................ 132
xiii
LIST OF NOTATIONS
Symbol Unit
cp J/kgK Specific heat at constant pressure
cv J/kgK Specific heat at constant volume
LCV MJ/kg Lower calorific value
kg/s Fuel mass flow rate
N rpm Engine speed
p MPa pressure
Pb kW Engine brake power
Q J Heat transfer (Energy)
Tb Nm Engine brake torque
V cm3 Instantaneous volume of the engine cylinde
cm3 Displaced volume
m3/s Volumetric flow rate of measured air with EGR
m3/s Volumetric flow rate of measured air without EGR
γ Specific heat ratio
% Brake engine thermal efficiency
θ degree Crank angle
λ Relative air-fuel ratio
Φ Relative fuel-air ratio
rad/s Angular speed
xiv
LIST OF ABBREVIATIONS
ASTM American Society for Testing and Materials
ATDC After top dead centre
ATR Autothermal reforming
BMEP Brake mean effective pressure
BS British standard
BTDC Before top dead centre
BTEX Benzene, toluene, ethylbenzene and m-/p-/o-xylenes
BTL Biomass-to-liquid
C/H Carbon to hydrogen ratio
C2H2 Ethylene
C2H4 Ethylene
C2H6 Ethane
C3H6 Propylene/Cyclopropane
C3H8 Propane
C4H8 Butylene/Cyclobutane
C5H10 Cyclopentane
C6H10 3,3 dimethyl-1-butyne
C8H18 2,2,4-trimethylpentana or n-octane
CAD Crank angle degree
CH Carbogen
CH2 Methylene
CH2O Formaldehyde
CH4 Methane
CI Compression ignition
CLD Chemiluminescence detection
CN Cetane number
CO Carbon monoxide
CO2 Carbon dioxide
COV Coefficient of variation
CPC Condensation particle number
CTL Coal-to-liquid
DC Diffusion charging
DMA Differential mobility analyzer
DOC Diesel oxidation catalyst
EC Electrostatic classifier
EGR Exhaust gas recirculation
EOI End of injection
FID Flame ionization detection
FSN Filter smoke number
xv
FT Fischer -Tropsch
FTIR Fourier transform infrared spectroscopy
GC-FID Gas chromatograph-flame ionization detector
GD30 Ultra low sulphur diesel and gas to liquid diesel blends
Gt Giga ton
GTL Gas-to-liquid
H Hydrogen atom
H/C Hydrogen to carbon ratio
H2 Hydrogen
H2O Water
HC Hydrocarbon
HCCI Homogeneous charge compression ignition
HCN Hydrogen cyanide
HCs Hydrocarbons
HC-SCR Hydrocarbon selective catalytic reduction
HFID Heated flame ionization defectors
HSDI High speed direct injection
IC Internal combustion
IEA International Energy Agency
IMEP Indicated mean effective pressure
LHV Lower heating value
LPG Liquefied petroleum gas
MIR Maximum incremental reactivity
MPA Magneto pneumatic
MULINBUMP Multi-pulse fuel injection in bump combustion chamber
N Nitrogen atom
N2 Nitrogen
NDIR Non disperse infrared
NH Nitrogen monohydride
NH3 Ammonia
NMHC Non-methane hydrocarbon
NO Nitrogen oxide
NO2 Nitrogen dioxide
NOX Nitrogen oxides
O Oxygen atom
O2 Oxygen
OECD Organisation for Economic Co-operation and Development
OH Hydroxyl
PAH Polycyclic aromatic hydrocarbon
PFI Port fuel injection
PM Particulate matter
POX Partial oxidation
xvi
PREDIC Premixed lean diesel combustion
PREMIER Premixed mixture ignition in the end-gas region
R-CHO Aldehyde
REGR Reformed exhaust gas recirculation
RME Rapeseed methyl ester
ROHR Rate of heat released
SCR Selective catalytic reduction
SI Spark ignition
SMPS Scanning mobility particle sizer
SOC Start of combustion
SOF Soluble organic fraction
SOI Start of injection
SOM Soluble organic material
SR Steam reforming
TDC Top dead centre
TPES Total primary energy supply
ULSD Ultra low sulphur diesel
VOC Volatile organic compound
WGSR Water-gas shift reaction
CHAPTER 1
INTRODUCTION
1.1 Background
Issues related to the fossil fuels shortage have been recognised for a long time. A heavy
dependence upon this energy source as being the main if not the only energy carrier in
transportation and power generation for many decades has generated concerns and triggered
extensive research into alternative fuels. The concern of the low fossil fuel reserves started a
long time ago when a theory about peak oil production was introduced. Although the
indicators considered to predict the peak oil production have been improved significantly by
considering many new factors, most scientists and organisations agree that the peak oil
production date will be before 2020 (de Almeida and Silva, 2009).
In addition, the recently ease of accessibility and availability has made fossil fuels the
largest share of fuel for transportation. The International Energy Agency (IEA), in a report
published in 2007, states that fossil energy contributes of about 81% of the total world
commercial energy while about 98% of it is used for transportation (de Almeida and Silva,
2009). This is a consequence of the increased demand and number of vehicles all over the
world and is also triggered by high economic growth of some countries which is followed by
the considerable increase in energy utilisation.
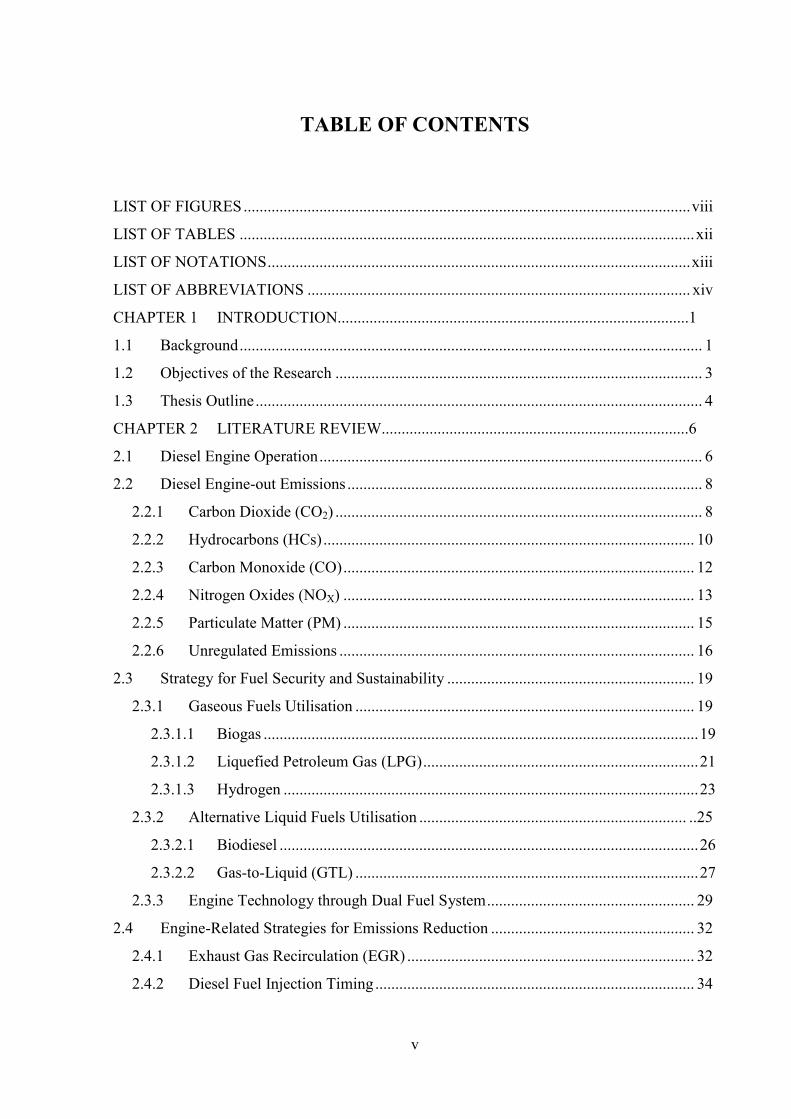
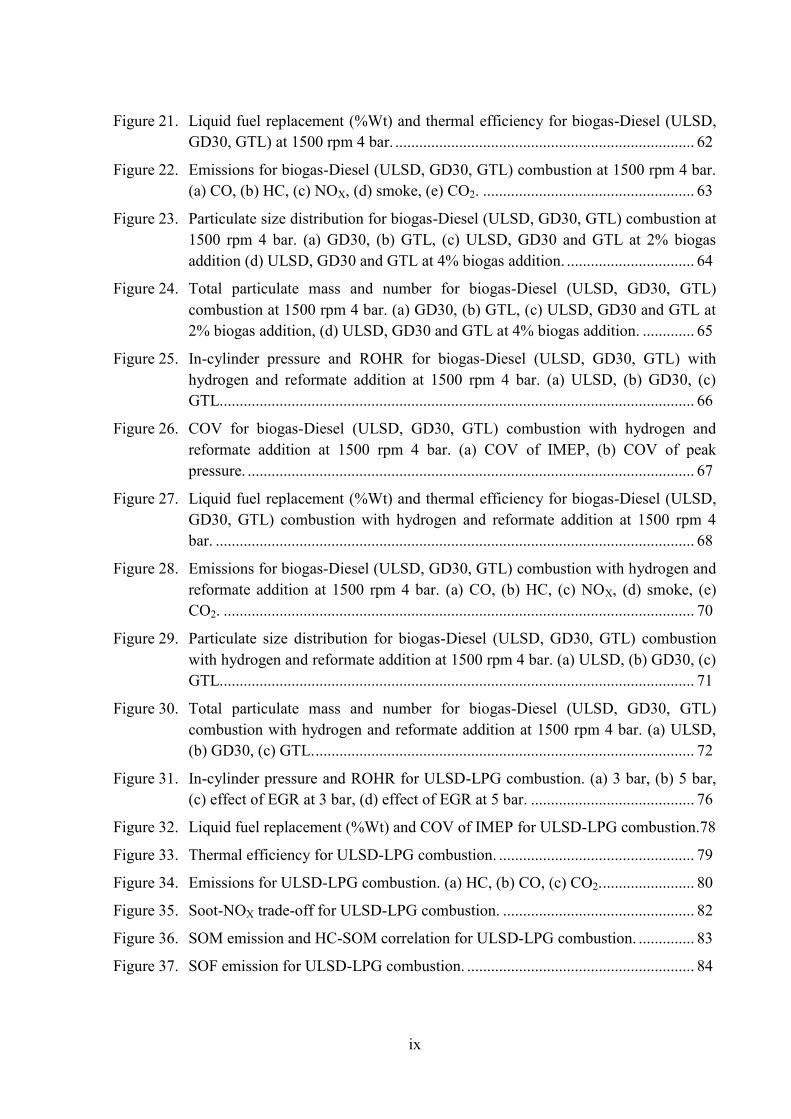
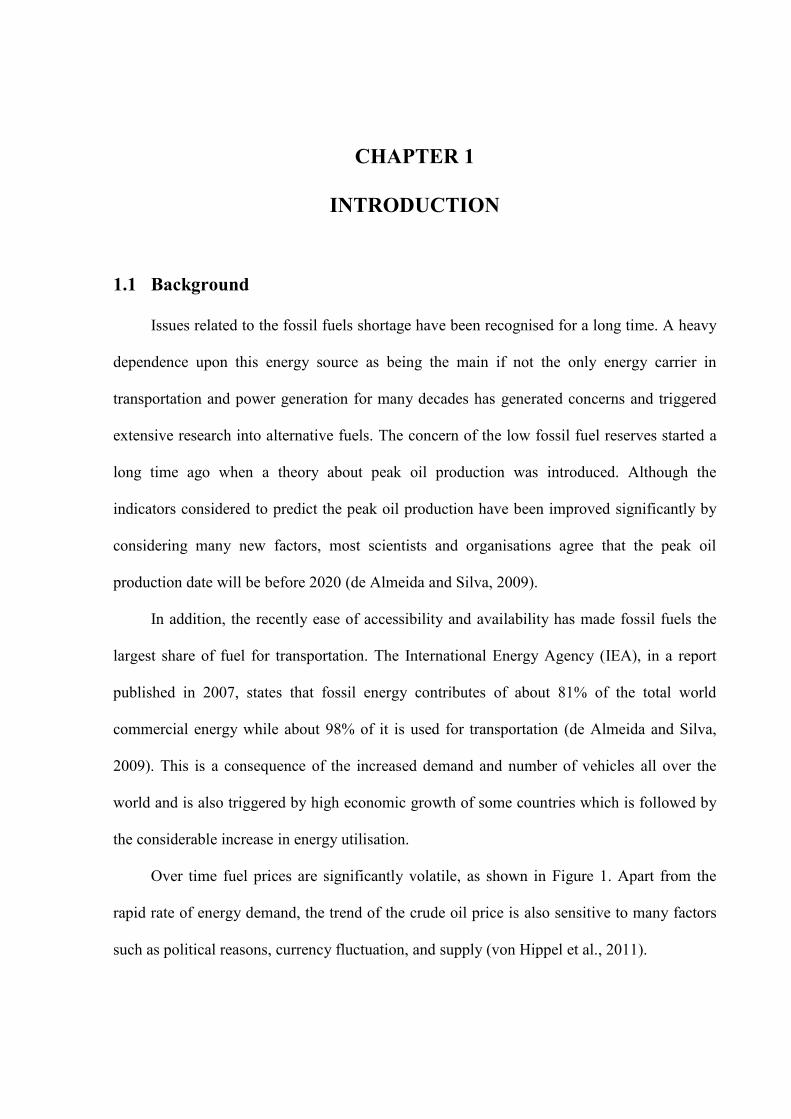
Over time fuel prices are significantly volatile, as shown in Figure 1. Apart from the
rapid rate of energy demand, the trend of the crude oil price is also sensitive to many factors
such as political reasons, currency fluctuation, and supply (von Hippel et al., 2011).
Chapter 1. Introduction
2
Figure 1. The world fuel price from 2003-2010 (Arze del Granado et al., 2012)
In addition to fuel security, there is another factor that has encouraged an attempt to
replace the whole or part of conventional fossil fuels used in motor vehicles. This is because
burning fossil fuel produces harmful emissions (including CO2) for the public and causes
adverse effects on the environment. Emissions of CO2 produced from the fossil fuels
combustion even contribute significantly to global warming.
Therefore, sustainable fuels development and fuel security can be improved with the
substitution of fossil fuels with renewable and other alternative fuels, both gaseous and liquid
fuels. In addition, further fuel savings in transportation should be improved by enhancing
engine technology in order to also be able to utilise gaseous fuels. However, their utilisation
in diesel engines still has drawbacks in terms of engine performance and engine-out emissions
(Papagiannakis and Hountalas, 2004, Papagiannakis et al., 2007). This is a result of the low
energy content and low cetane number (CN) of most gaseous fuels.
To address the challenges described above, research work has been done which aims to
explore some alternative fuels (renewable and non-renewable), both gaseous and liquid fuels,
to replace part or all of conventional fuels to be used in diesel engines. It also investigates the
Chapter 1. Introduction
3
potential of using hydrogen, a good energy carrier resource which has high energy content, as
a supplement combined with the gaseous fuels.
1.2 Objectives of the Research
The main objective of the research is to investigate the utilisation of some alternative
fuels which also involve strategies to improve engine thermal efficiency and engine-out
emissions. In order to achieve the objective, a modification has been carried out to facilitate a
dual fuel combustion mode. In addition, different pilot fuels, engine modes of operation, and
hydrogen addition were employed where the hydrogen used for this work was obtained from
hydrocarbon gaseous fuel (biogas and LPG) reforming. Furthermore, the objectives are
described as follows:
Analyse the effect and feasibility of the induction of biogas and LPG at different
concentration levels and engine operating conditions (i.e. engine load) on
combustion and exhaust emissions characteristics of a Diesel engine.
Understand the pilot fuels effect (ULSD, RME and GTL) which have different
properties and their combination with gaseous fuels on combustion and exhaust
emissions characteristics.
Investigate the feasibility of advanced pilot fuel injection timing and EGR (exhaust
gas recirculation) addition on LPG-diesel dual fuelled engine operation.
Analyse and understand the effect of reformate addition (both H2 + CO and H2
only) in the biogas and LPG-diesel dual fuelling on combustion and emissions
characteristics.
Chapter 1. Introduction
4
1.3 Thesis Outline
This introduction makes up the first chapter which describes a general and brief outline
about the background and the aim of the research. Chapter 2 gives a general introduction and
reviews the relevant literature on diesel emissions, strategies which can be done to alleviate
dependence on oil-based fossil fuel, and a brief explanation of dual fuelled engine combustion
mode and how to improve the engine-out emissions. Chapter 3 presents the fuels used and
experimental facilities in this research work. These include the diesel engine test bench,
exhaust emissions measurement equipment and modifications made to the engine for dual
fuelling system purposes. Chapter 4 describes the experimental results from biogas-diesel
dual fuelling. It also discusses the effects of the combustion of different injected diesel fuels
(conventional diesel fuel, ULSD and alternative fuel, GTL) and their blending (GD30, ULSD-
GTL blends 70/30 by volume). This chapter also covers the hydrogen and reformate (H2 and
CO) effects on the engine thermal efficiency and emissions. Chapter 5 focuses on the other
gaseous fuel but non-renewable, LPG, on the LPG-diesel dual fuelling with the effect of
advanced injection timing and EGR (exhaust gas recirculation). This chapter explains the
experimental results that were carried out with two alternative diesel fuels, RME and GTL,
compared with ULSD as a baseline condition. Apart from gaseous emissions, soot emission,
including soluble organic material (SOM), was investigated and discussed in correlation to
gaseous HC. Chapter 6 is an extension of the previous work on LPG-diesel dual fuelling.
Gaseous fuel (H2 and CO) from propane reforming was added along with LPG (propane).
Soot formation in hydrogen combustion with relatively high H/C ratio gaseous fuel (propane)
was analyzed. This chapter also includes the analysis of some HC species that have lower
than three carbon atoms (mainly derived from propane). The last chapter, Chapter 7,
summarizes all the research works and the feasibility of gaseous and alternative liquid fuels

Chapter 1. Introduction
5
on dual fuel combustion. It also offers recommendations for dual fuel systems. Future areas
are proposed to obtain a better understanding of dual fuelled engine operation.
CHAPTER 2
LITERATURE REVIEW
2.1 Diesel Engine Operation
Invented by Rudolf Diesel in 1892, compression ignition (CI) engines have higher
thermal efficiency compared with spark ignition (SI) engines. The engine usually operates on
a 4-stroke cycle and the basics of conventional diesel combustion are briefly explained as
follows.
In diesel engines, the combustion air is inducted into the combustion chamber through
intake manifold. This induction process occurs as the piston moves down while the intake
valve opens. The amount of inducted fresh air charge depends on engine speed being higher at
high engine speed. The piston then moves up from bottom dead centre to compress air charge
where at the same time both intake and exhaust valves are closed. A few crank angle degrees
before the piston reaches top dead centre, the fuel is injected at high velocity through small
orifices or nozzles in the injector tip and atomises the fuel. The high pressure and temperature
of the in-cylinder air then mixes with the vaporised fuel. When the air-fuel mixture
temperature is higher than fuel’s self ignition temperature, a series of spontaneous chemical
reactions occurs leading to rapid self-ignition (Heywood, 1988). The in-cylinder pressure and
temperature then rises to a much higher level. As the expansion process takes place, where the
piston moves downward, the remaining injected fuel still undergoes atomisation and
evaporation due to the high combustion temperature. The combustion process continues for a
further few crank angle degrees after the end of injection (EOI).
Chapter 2. Literature Review
7
Just as the piston reaches the bottom dead centre, the exhaust valve opens. The
difference in pressure between the in-cylinder and exhaust manifold allows the burned gases
to escape the cylinder. The burned gas is pushed out by the piston in the exhaust stroke into
the exhaust manifold then the next cycle starts again.
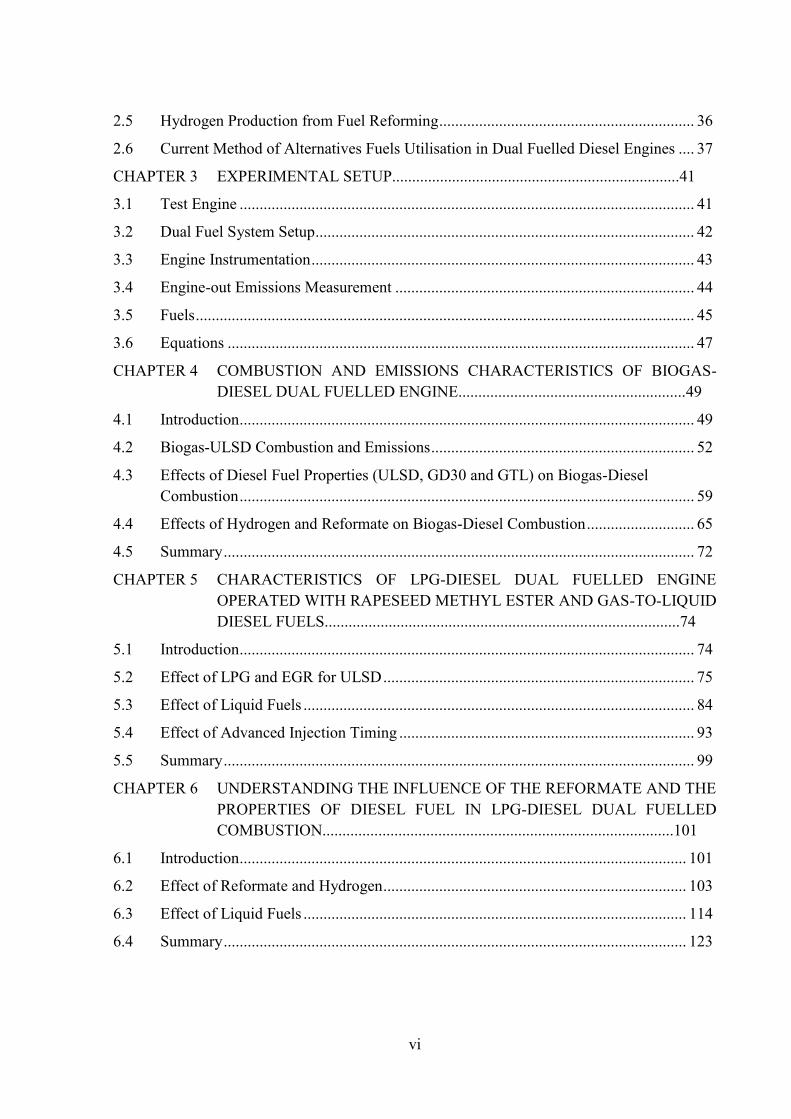
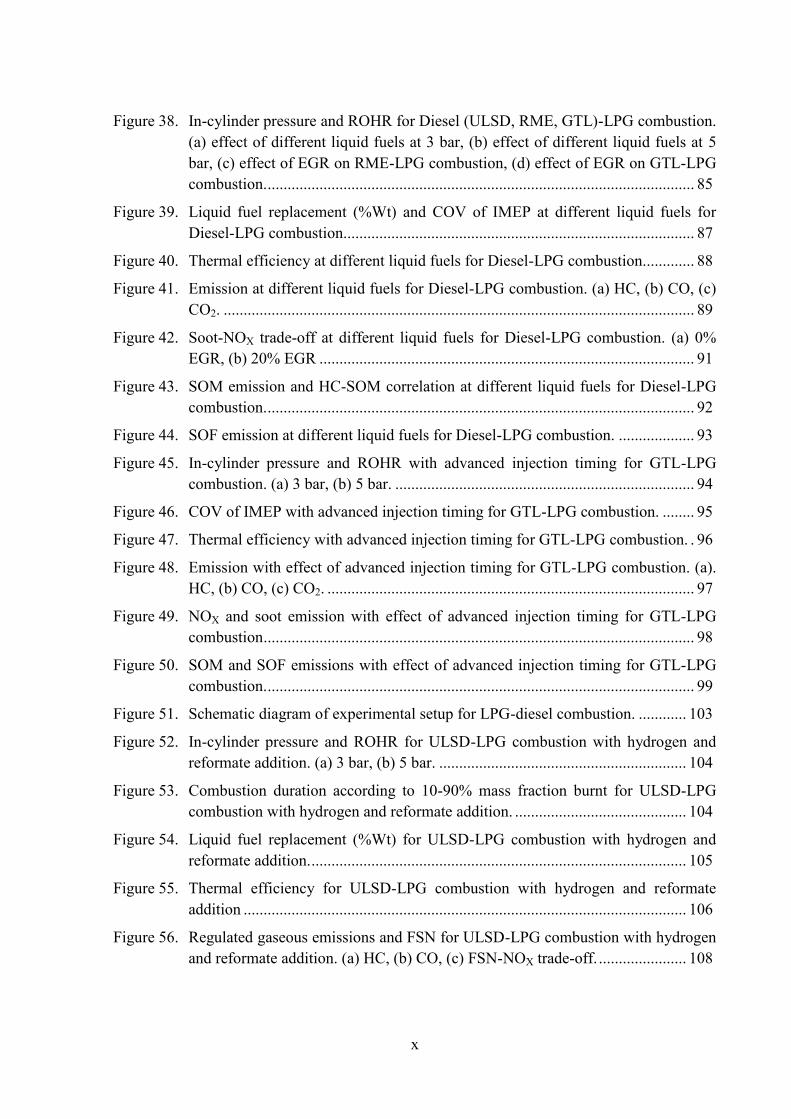
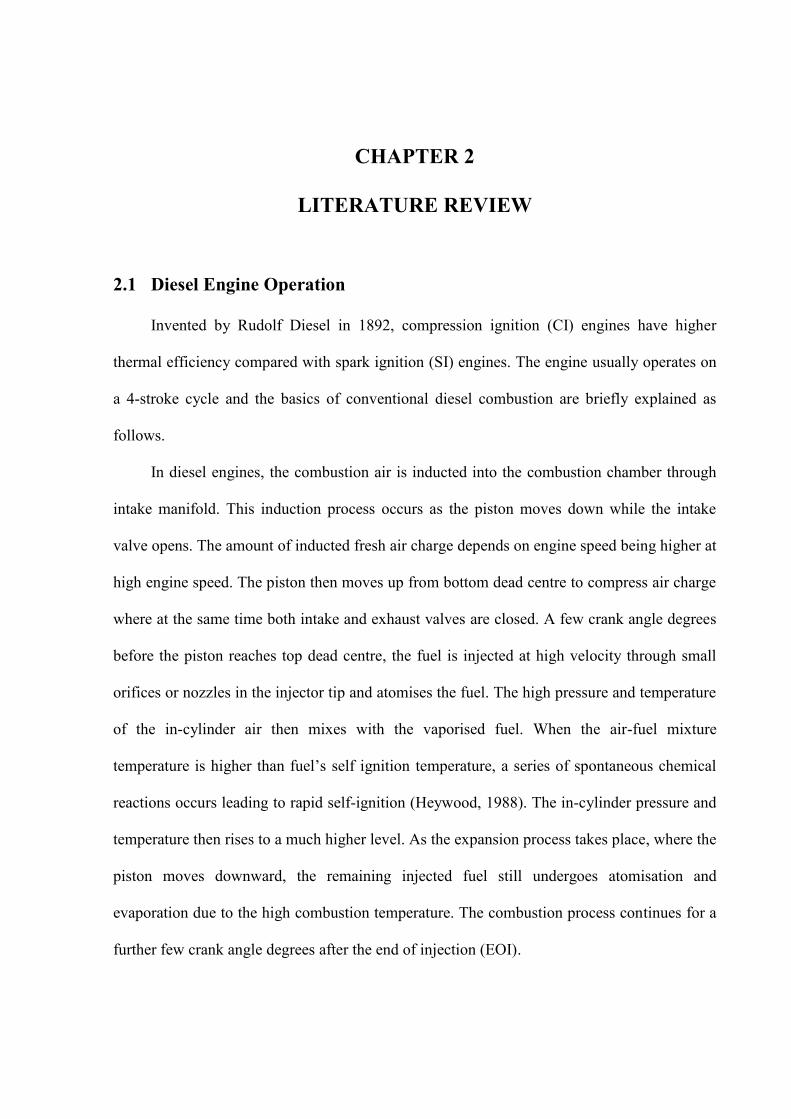
The overall combustion process includes four phases; ignition delay, premixed
combustion, diffusion combustion and late combustion, which is associated with the rate of
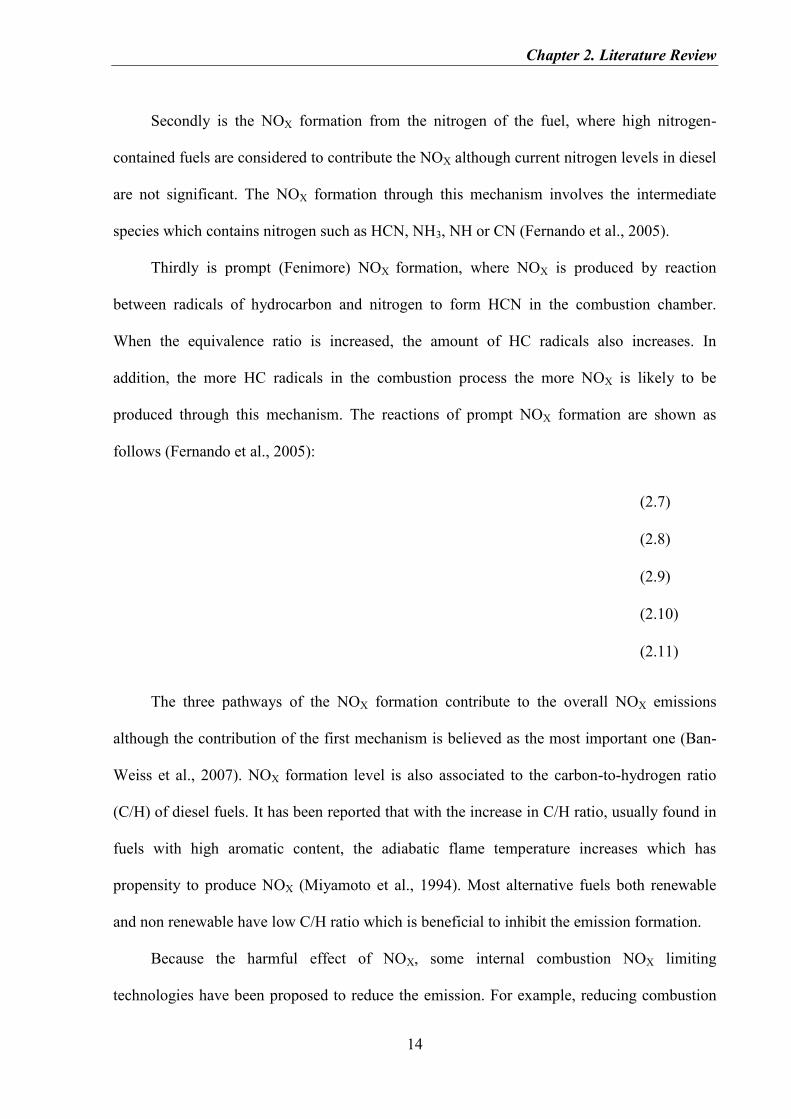
heat release diagram as depicted in Figure 2.
Figure 2. Typical combustion phase of direct injection diesel engine (Tira et al., 2012)
Ignition delay phase is a time lag between the start of fuel injection (SOI) and start of
combustion (SOC). This phase is affected not only by in-cylinder conditions such as
temperature, pressure, concentration of charge, oxygen availability but also fuel chemical and
physical characteristics (Lata and Misra, 2011). Premixed combustion phase is identified by
the increase of heat released in the cylinder due to the combustion of premixed air-fuel
mixture within the flammability limit of the fuel. Following this phase is the diffusion
combustion phase which is controlled by the rate at which mixture becomes available for
-10
0
10
20
30
40
50
-20 -10 0 10 20 30
Crank angle degree
Rat
e of
hea
t re
leas
e (J
/CA
D) Ignition
delay Premixed
combustion
Diffussion
combustion
Late
combustion
SOI SOC EOI
Chapter 2. Literature Review
8
burning. The last phase is late combustion which is generated in the expansion stroke and is
determined by the remaining unburned fuel. The heat released at this phase is at lower rate
due to the scarcity of air-fuel mixture and in-cylinder temperature drops.
2.2 Diesel Engine-out Emissions
One of the major sources to air pollutant is diesel engines. The concentration of the
diesel combustion harmful by-products depends on factors such as engine speed and load, fuel
physical and chemical properties, air-fuel ratio, injection timing, and engine design. An
understanding in formation and oxidation mechanism of the diesel engine emissions is
important as it can lead towards finding solutions to control them.
2.2.1 Carbon Dioxide (CO2)
Carbon dioxide is the main product of carbon-contained fuel combustion. It is one of the
primary emissions of greenhouse gases with nitrous oxide, methane, perfluorocarbons,
sulphur hexafluoride and hydrofluorocarbons (Kaewmai et al., 2012). Indeed, CO2 is already
present in the atmosphere but in very low concentration. Unfortunately, the amount has
increased over the years at an alarming rate. According to the IEA (International Energy
Agency) report, in 1870 the total CO2 concentration from combustion of fuel is almost zero
but in 2009 is measured to be around 29 Gt CO2. The human activities have changed the
balance and cannot compensate the naturally ability of the forest (plants) to remove CO2.
Globally massive utilisation of fossil fuels (i.e. natural gas, coal and oil), exacerbated by
deforestation and long lifetime of CO2 in the atmosphere, impacts adversely to the climate
change and makes a serious concern for all nations (IEA, 2011).
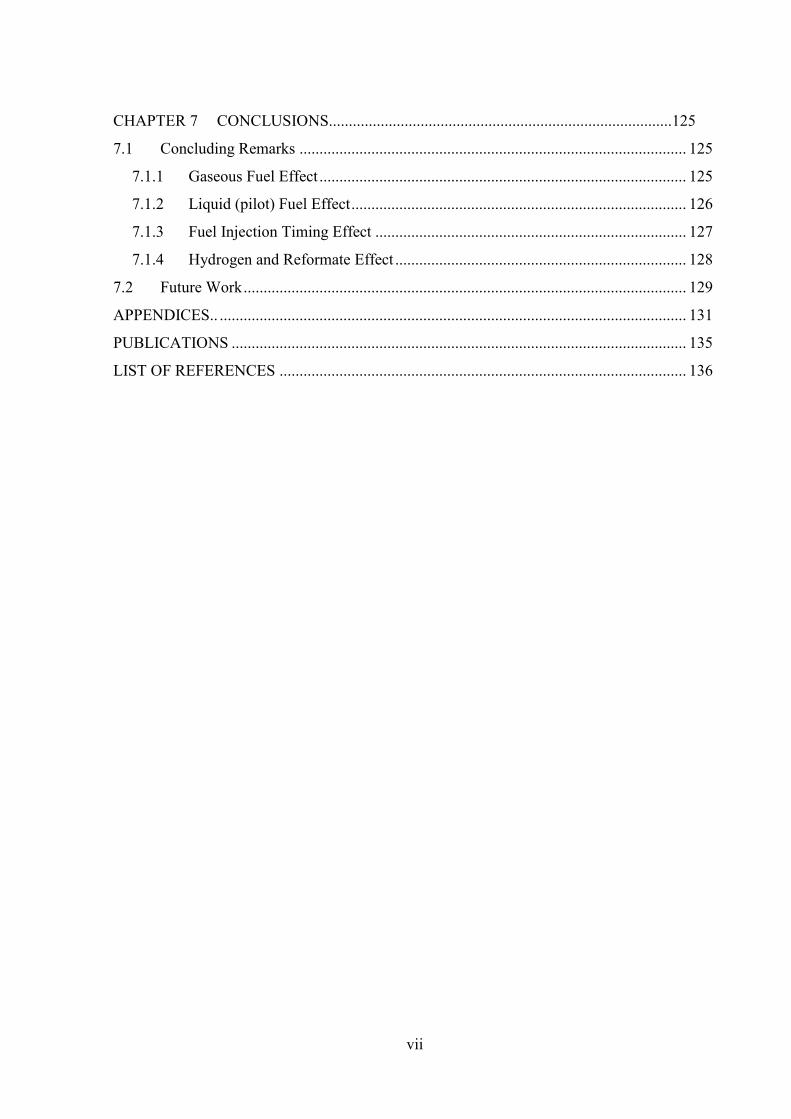
Majority of the CO2 emission in the atmosphere is contributed by activities which
heavily use carbon-contained fossil fuels. Those sectors or activities are electricity and heat
Chapter 2. Literature Review
9
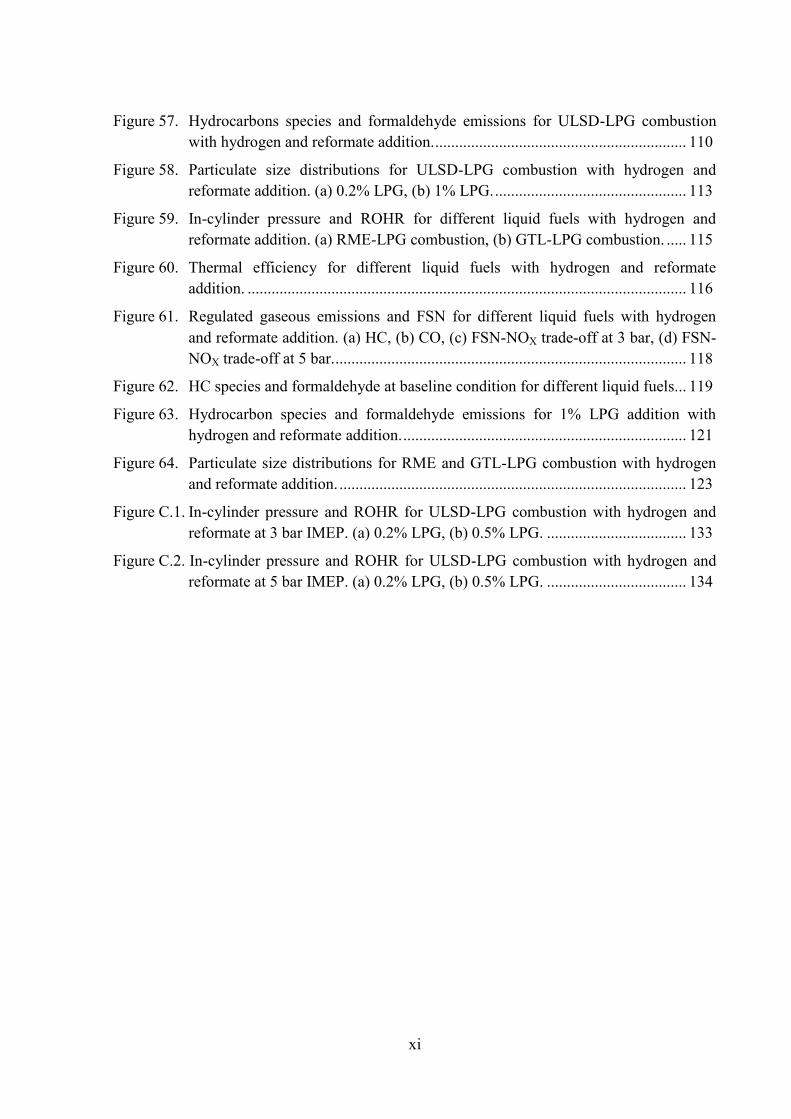
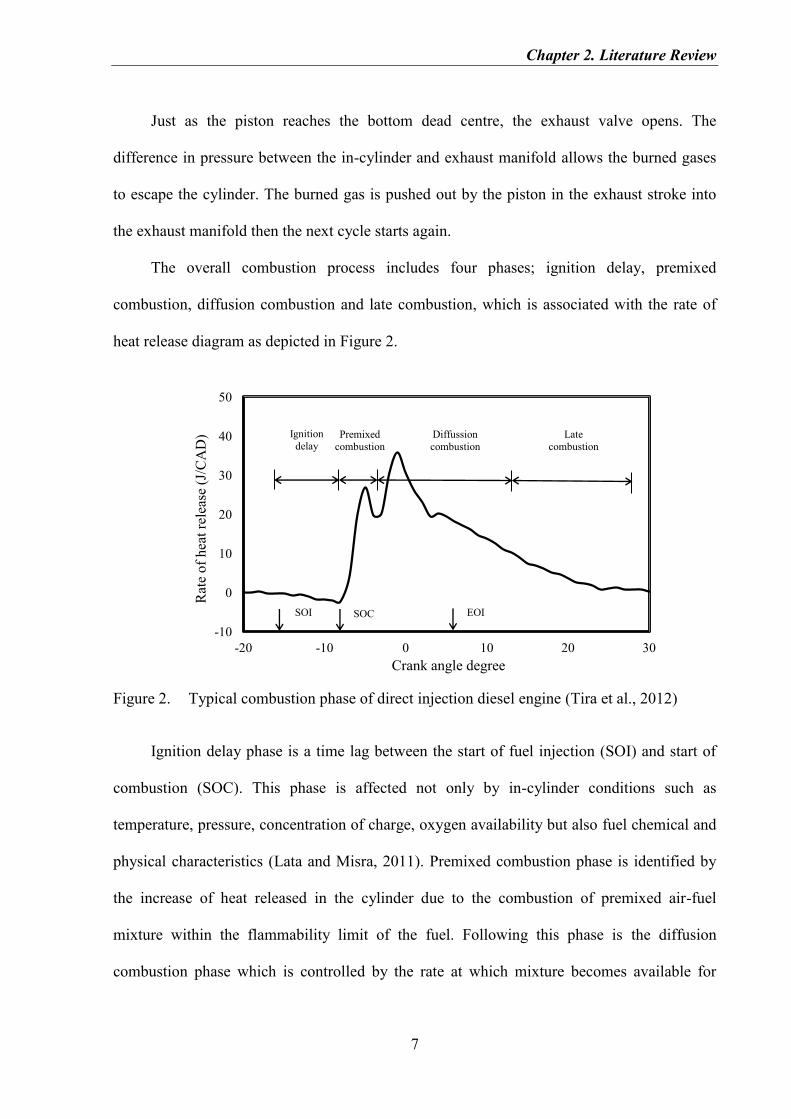
generation, transportation and industry. All the sectors account for more than three-quarters of
global CO2 concentration as described in Figure 3 (Ellis and Tréanton, 1998). The increase in
population and economic growth of many nations have led to the increased CO2 emissions
concentration (Johansson et al., 1996).
Figure 3. Sources of CO2 emissions in 2009 (IEA, 2011)
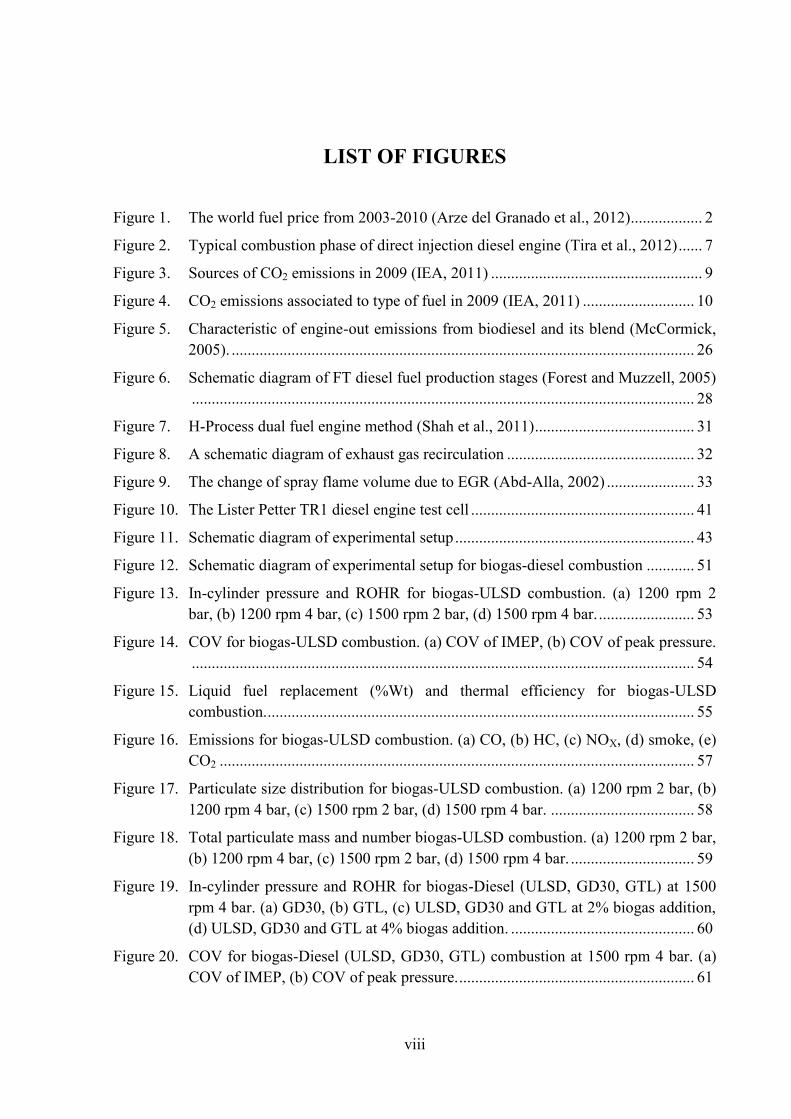
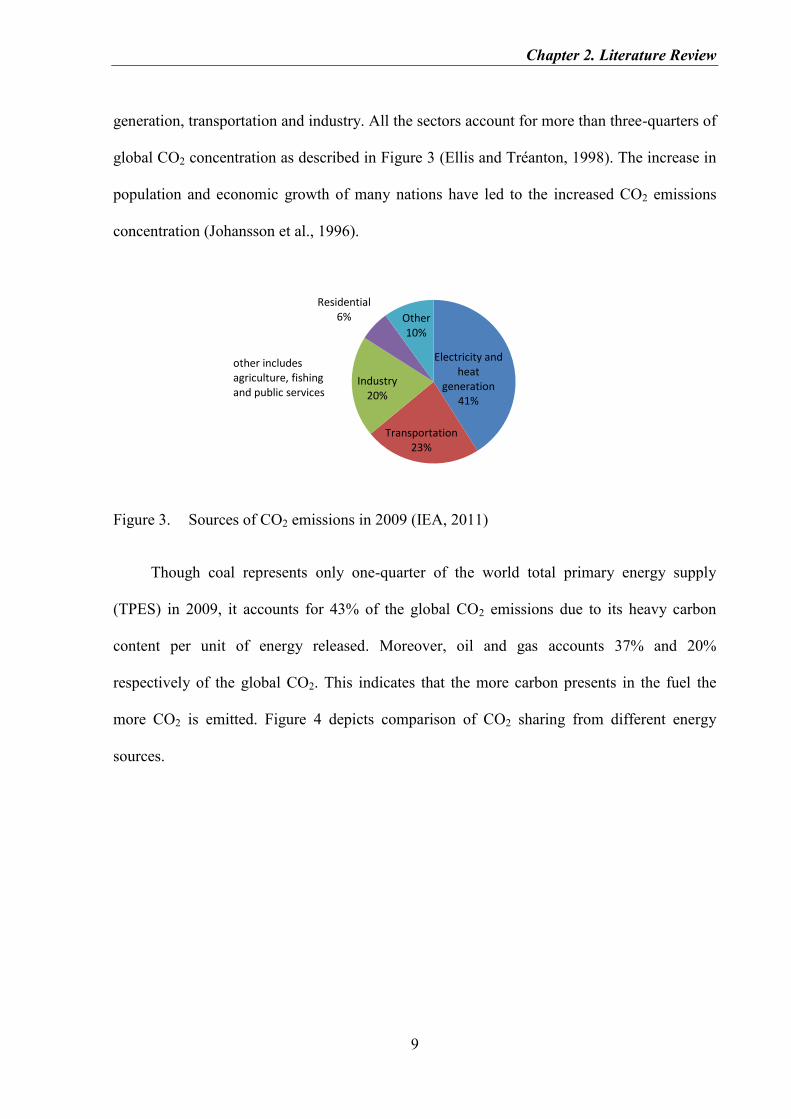
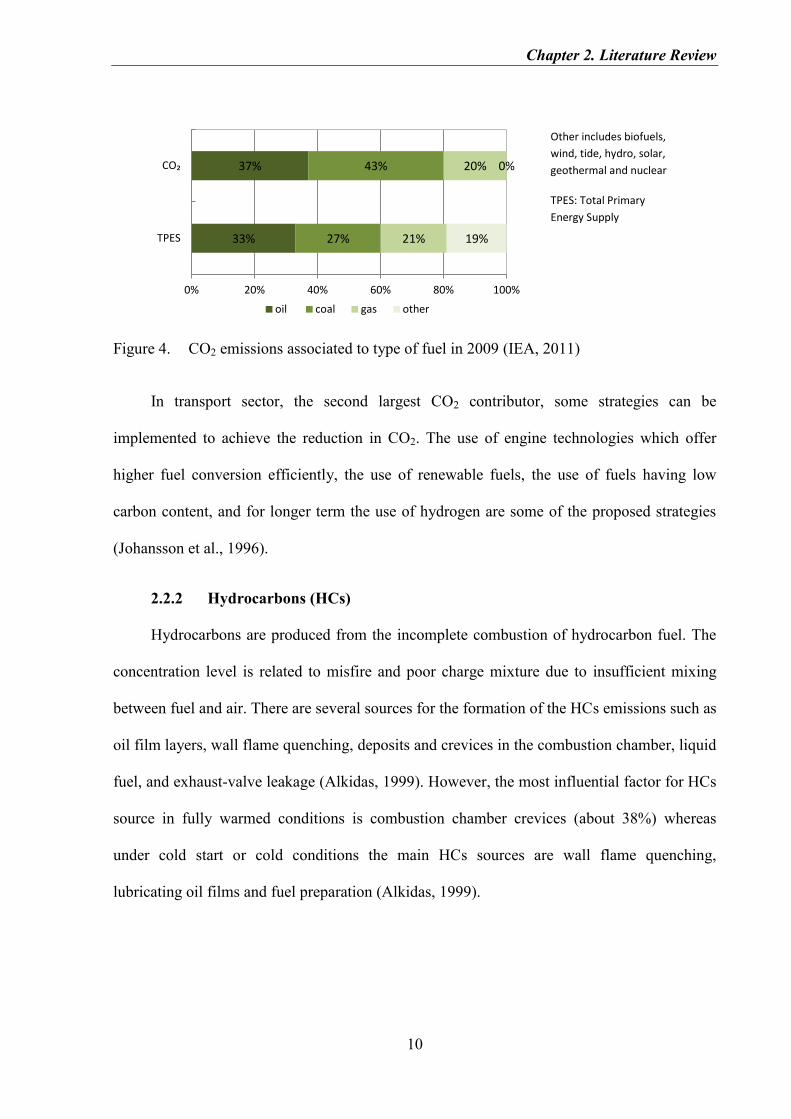
Though coal represents only one-quarter of the world total primary energy supply
(TPES) in 2009, it accounts for 43% of the global CO2 emissions due to its heavy carbon
content per unit of energy released. Moreover, oil and gas accounts 37% and 20%
respectively of the global CO2. This indicates that the more carbon presents in the fuel the
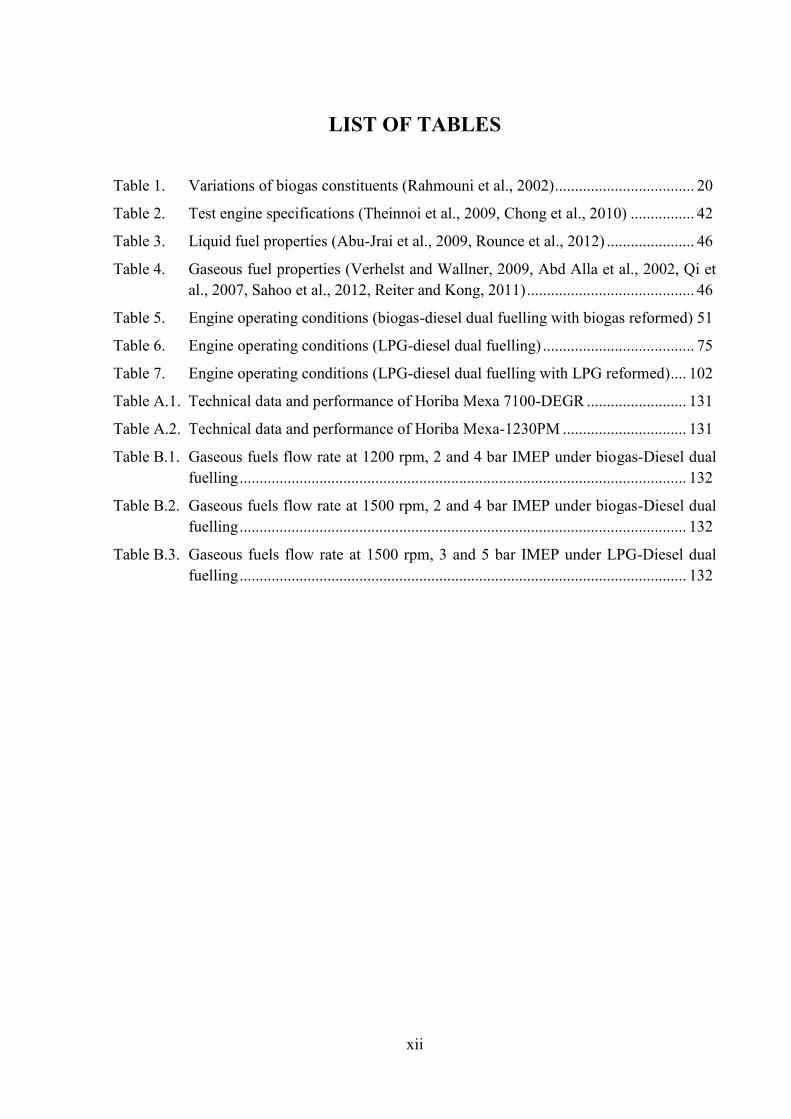
more CO2 is emitted. Figure 4 depicts comparison of CO2 sharing from different energy
sources.
Electricity and heat
generation 41%
Transportation 23%
Industry 20%
Residential 6% Other
10%
other includes agriculture, fishing and public services
Chapter 2. Literature Review
10
Figure 4. CO2 emissions associated to type of fuel in 2009 (IEA, 2011)
In transport sector, the second largest CO2 contributor, some strategies can be
implemented to achieve the reduction in CO2. The use of engine technologies which offer
higher fuel conversion efficiently, the use of renewable fuels, the use of fuels having low
carbon content, and for longer term the use of hydrogen are some of the proposed strategies
(Johansson et al., 1996).
2.2.2 Hydrocarbons (HCs)
Hydrocarbons are produced from the incomplete combustion of hydrocarbon fuel. The
concentration level is related to misfire and poor charge mixture due to insufficient mixing
between fuel and air. There are several sources for the formation of the HCs emissions such as
oil film layers, wall flame quenching, deposits and crevices in the combustion chamber, liquid
fuel, and exhaust-valve leakage (Alkidas, 1999). However, the most influential factor for HCs
source in fully warmed conditions is combustion chamber crevices (about 38%) whereas
under cold start or cold conditions the main HCs sources are wall flame quenching,
lubricating oil films and fuel preparation (Alkidas, 1999).
33%
37%
27%
43%
21%
20%
19%
0%
0% 20% 40% 60% 80% 100%
TPES
CO₂
oil coal gas other
Other includes biofuels,
wind, tide, hydro, solar,
geothermal and nuclear
TPES: Total Primary
Energy Supply
Chapter 2. Literature Review
11
Combustion chamber crevices act as the main place for HCs sources because the very
small space available causes flame quenching. The crevices in the cylinder can be head gasket
and valve-seat crevices, and piston-ring-pack (Heywood, 1988).
The occurrence of wall flame quenching is when the propagation of flame reaches the
cylinder wall forming a thin layer on the surface without oxidation. This layer then is called
quenching distance. In this case the cylinder wall can act as an interrupt mechanism of the
oxidation reaction and the heat sink results in an in-cylinder temperature drop. Therefore, the
cylinder wall temperature is very important in terms of determining the HCs emission level.
Moreover, oil used for lubrication between piston rings and cylinder liner also can
contribute to the HCs emission. The oil thin film absorbs fuel thus prevents fuel taking part in
the combustion process, and escapes the combustion chamber unburned. In addition, fuel used
also affects the HCs emission. Fuels which contain aromatics and olefins generally produce
higher concentration of hydrocarbon.
In dual fuel operation, the lower air-fuel ratio due to air replacement results in high HCs
emission compared with normal diesel operation. The high heat capacity and lack of oxygen
in the combustion chamber leads to a temperature reduction in in-cylinder as a result of
misfiring and poor mixing, and hence resulting in slower combustion rate allowing unburned
mixture to leave the combustion chamber (Sahoo et al., 2009).
In order to reduce the HCs emission, some techniques are introduced to enhance the
mixing time and intensity such as varying the fuel injection timing, increasing fuel injection
pressure, and modifying the piston head. The high measured HCs emission concentration can
give indication of high cyclic variability as results of partial burning or misfiring cycles
(Heywood, 1988).
Chapter 2. Literature Review
12
2.2.3 Carbon Monoxide (CO)
Carbon monoxide is an odorless, tasteless and colorless, and non-corrosive gas that can
be poisonous to humans. It is an intermediate product from incomplete combustion of carbon-
contained fuels.
The formation process of CO is started by reaction between oxygen and gaseous or
liquid hydrocarbon fuel. The CO produced then can react either with oxygen or hydroxyl
(OH) radicals to produce carbon dioxide. However, the oxidation rate of CO is slower than
those of hydrocarbon species because CO still can be produced although there is enough
oxygen (Bagal et al., 2009). Therefore, it is required appropriate in-cylinder conditions in
order to minimise the CO formation. The mechanism of the production and oxidation of CO
from fuel is described as follows (Adomeit et al., 2006, Bagal et al., 2009).
(2.1)
(2.2)
(2.3)
In diesel engines there are two main sources for the CO formation: over mixing and
under mixing between air and fuel (Bagal et al., 2009). Lean combustion during ignition delay
period and low temperature combustion are associated to over mixing. In this condition CO
cannot be fully oxidised even though there is abundant oxygen. Under mixing condition is
associated to the rich premixed combustion where fuel does not mix with air properly hence
the CO produced cannot be fully oxidised by OH or oxygen thus leaving high CO level. Dual
fuel combustion mode is related to this under mixing condition.
Therefore, it can be summarised that the level of CO produced in the combustion
chamber is affected by some factors such as in-cylinder temperature, oxygen concentration,
Chapter 2. Literature Review
13
gas residence time, and charge mixture turbulence. The OH radical presence is very
significant in reducing the emission due to complete combustion. The OH production strongly
depends on combustion temperature and it is a product of chain reactions involving oxygen
(Heywood, 1988). Therefore, the availability of sufficient oxygen and also high temperature
in the combustion chamber are necessary to oxidise CO. However, those two factors are
difficult to be achieved in dual fuel combustion which needs to be addressed.
Some efforts have been performed to control the emission to achieve an acceptable
level. They include improvements in engine design and engine operating conditions such as
the application of fuel injection timing, combustion chamber geometry, and diameter of
combustion cavities to obtain uniform air-fuel mixing, and also utilisation of oxygenated
diesel fuels (Chen and Iwashina, 2009, Lapuerta et al., 2008a).
2.2.4 Nitrogen Oxides (NOX)
NOX is one of the important air pollutants and one of the major diesel emissions which
mainly consist of NO and NO2. However, NO is the predominant compound. The propensity
of NOX formation in the combustion chamber can be described generally by three methods.
The first method is thermal NOX, where the formation depends on the molar concentration of
nitrogen and oxygen and high temperature in the combustion chamber. The mechanism of
thermal NOX formation is described by Zeldovich equations. The Zeldovich equations are
expressed below:
(2.4)
(2.5)
(2.6)
Chapter 2. Literature Review
14
Secondly is the NOX formation from the nitrogen of the fuel, where high nitrogen-
contained fuels are considered to contribute the NOX although current nitrogen levels in diesel
are not significant. The NOX formation through this mechanism involves the intermediate
species which contains nitrogen such as HCN, NH3, NH or CN (Fernando et al., 2005).
Thirdly is prompt (Fenimore) NOX formation, where NOX is produced by reaction
between radicals of hydrocarbon and nitrogen to form HCN in the combustion chamber.
When the equivalence ratio is increased, the amount of HC radicals also increases. In
addition, the more HC radicals in the combustion process the more NOX is likely to be
produced through this mechanism. The reactions of prompt NOX formation are shown as
follows (Fernando et al., 2005):
(2.7)
(2.8)
(2.9)
(2.10)
(2.11)
The three pathways of the NOX formation contribute to the overall NOX emissions
although the contribution of the first mechanism is believed as the most important one (Ban-
Weiss et al., 2007). NOX formation level is also associated to the carbon-to-hydrogen ratio
(C/H) of diesel fuels. It has been reported that with the increase in C/H ratio, usually found in
fuels with high aromatic content, the adiabatic flame temperature increases which has
propensity to produce NOX (Miyamoto et al., 1994). Most alternative fuels both renewable
and non renewable have low C/H ratio which is beneficial to inhibit the emission formation.
Because the harmful effect of NOX, some internal combustion NOX limiting
technologies have been proposed to reduce the emission. For example, reducing combustion
Chapter 2. Literature Review
15
temperature through steam/water injection or less excess air, denitrogenation of the fuel,
reducing the residence time at high in-cylinder temperature through ignition or injection
timing adjustment, catalytic combustion or aftertreatment system including the use of
selective catalytic reduction (SCR), and premixed or homogeneous intake charge application
where dual fuel combustion is categorized in this method. As NOX emissions are much related
to the high in-cylinder temperature, a diluted intake charge by either air or exhaust gas
recirculation (EGR) can effectively reduce the emission level.
2.2.5 Particulate Matter (PM)
Particulate Matter (PM) is a typical engine-out emission of diesel engines and much
higher than in the case of SI engines. This is caused by a non-homogeneous combustion
process in the cylinder. PM concentration increases in line as the engine load increases. At
this engine condition the combustion temperature is high thus can reduce the PM formation
but a significant high fuel concentration in the combustion chamber generates the PM
emission. In addition, the scarcity of oxygen also substantially influences the PM formation
by hampering the emission oxidation. Therefore, the air-fuel ratio is considered important in
PM emission formation rate.
The aromatic content in fuel also contributes to the emitted PM (Xinling and Zhen,
2009). Therefore, a low aromatic content in a fuel potentially reduces the PM concentration.
In addition, Miyamoto et al. (Miyamoto et al., 1996) also has proven that increasing oxygen
content and reducing the number of molecular C-C bonds in a fuel substantially reduce PM
emission. The sulphur content of injected fuel also affects PM emission. Tan et al. (Tan et al.,
2009) has found that PM is decreased as sulphur content in the fuel decreases in the same
engine operating conditions. Additionally, the effect of sulphur content to PM emission is
more obvious at low engine load conditions. Therefore, modifications on in-cylinder
Chapter 2. Literature Review
16
conditions through dual fuel combustion and changes in fuel properties through the use of
oxygenated and free-aromatics fuels are expected to control the PM formation.
Diesel PM shows a bimodal size distribution and lognormal in form. One of the size
distributions is called nuclei mode, ranging from 0.005 to 0.05 μm. Due to its smaller size,
particles in this mode have little effect on the total mass but have significant impact on total
number of particulate. The accumulation mode particles, having larger size, are in the size
range from 0.05 to 1.0 μm and dominate the mass of diesel particle.
The structure of PM of diesel combustion mainly consists of ash, solid carbonaceous
material (mainly soot), volatile organic and sulphur compound (Graskow et al., 1999). The
formation of soot occurs in locally fuel rich region where the ratio of carbon to oxygen atoms
is high. In addition, the volatile or soluble organic compounds (SOM/soluble organic
material) are formed from atomized and evaporated lube oil and fuel which escapes and is not
involved in oxidation process (Cromas and Ghandhi, 2005). The sulphur content in the fuel
influences the particulate size and distribution by the formation of volatile compound which is
adsorbed onto the soot. However, most of the currently available fuel in the automotive
market has relatively low sulphur content which is below the regulated level.
2.2.6 Unregulated Emissions
Apart from the major engine pollutants such as HC, CO, NOX and PM, CI engines also
emit various emissions which are not yet regulated. Some of the unregulated emissions come
from HCs species. The following are some of the emissions.
Aldehydes
Aldehydes, member of carbonyl group, are simple compounds which can be identified
by a carbon-oxygen double bond with R-CHO structure. Acetaldehyde and formaldehyde are
two main aldehydes species emitted from motor vehicles (Zhu et al., 2011b). Aldehydes are
Chapter 2. Literature Review
17
the intermediate compounds which mainly originate from incomplete combustion of saturated
aliphatic hydrocarbons (Magnusson et al., 2002, Takada et al., 2003). Concentration of the
emitted emission is affected by fuel composition (Zervas et al., 2002). Some experimental
results show that the emission increases with biodiesel (Turrio-Baldassarri et al., 2004,
Machado Corrêa and Arbilla, 2008) but another show an opposite trend (Krahl et al., 2009).
Therefore, it can be suggested that there are multiple sources of parameters which affect the
emission when using biodiesel. They are conditions and type of engine, origin of biodiesel,
and modes of operation (Machado Corrêa and Arbilla, 2008, Peng et al., 2008a, Zervas et al.,
2002).
Alkyl compounds
They are organic chemical compounds that contain only hydrogen and carbon either
straight or cyclic chains. Based on the structure, the compounds can be classified into two
classes: aliphatics and aromatics. Moreover, aliphatic hydrocarbons are divided into paraffins,
cycloparaffins, olefins and acetylenes (Heywood, 1988).
Paraffins (CnH2n+2): saturated hydrocarbon molecules with single bond open-chain. Examples
of the group are methane (CH4), ethane (C2H6), 2,2,4-trimethylpentana (C8H18).
Cycloparaffins (CnH2n): unsaturated hydrocarbon molecules with single bond ring chain.
Examples of the group are cyclopropane (C3H6), cyclobutane (C4H8), cyclopentane (C5H10).
Olefins (CnH2n): open-chain unsaturated hydrocarbons containing a double bond. Examples of
the group are ethylene (C2H4), propylene (C3H6), butylene (C4H8).
Acetylenes (CnH2n-2): open-chain unsaturated hydrocarbons containing one C-C triple bond.
Examples of the group are acetylene (C2H2) and 3,3 dimethyl-1-butyne (C6H10).
Meanwhile aromatics are hydrocarbons that contain one or more benzene rings.
Chapter 2. Literature Review
18
Benzene, toluene, ethylbenzene and m-/p-/o-xylenes (BTEX) compounds
The emissions are characterised by highly flammable and strong odour. They are
volatile organic compounds (VOCs) which are emitted by petrol and diesel engines and
potentially contribute to ozone formation. The formation of the emissions is affected by
conditions of combustion such as high temperature and local stoichiometric which improve
fuel thermal pyrolysis (Takada et al., 2003, Nelson et al., 2008). Moreover, the major source
for the production of benzene and toluene is from fuel fragments which are produced from
oxidative pyrolysis of fuel (Nelson et al., 2008), meanwhile xylene formation is associated to
aromatic content in fuel (Zhu et al., 2011b). BTEX is one of the important fractions of non-
methane hydrocarbons (NMHC) which are classified as hazardous air pollutants as can
actively participate in photochemical reactions (Rappenglück et al., 1998).
Soluble organic material (SOM)
SOM is part of PM which is formed by the unburned fuel or oil which then undergoes
the phase change from gas to particulate phase and is adsorbed onto the soot. The
concentration of SOM is related to various factors such as engine operating conditions, type
of fuel, and sampling technique. At high engine load, the total mass of SOM is lower
compared with low engine load even much higher at idle (Stanmore et al., 2001). Moreover,
in HCCI or dual fuel engine operation SOM is relatively high compared to that of
conventional CI engines. This is caused by unburned low volatile component in fuel which
can be adhered on the cylinder wall (Kawano et al., 2004).
It is widely accepted that biodiesel has higher SOM. It is mainly due to lower volatility
and higher viscosity which has high propensity to be condensed and adsorbed onto the
particles surface, which is more obvious in the cold conditions or low engine load (Lapuerta
Chapter 2. Literature Review
19
et al., 2008a). SOM contains polycyclic aromatic hydrocarbons (PAH) which are toxic and
harmful to human and environment.
2.3 Strategy for Fuel Security and Sustainability
The security of fuels availability as energy carrier should be maintained and becomes a
priority goal both for short and long term. The indicators for fuel security have evolved not
only a physical availability of fuel but also considering various aspects. The oil crisis in 1970
and 1980 has formatted the energy policy and affordability was included for the fuel security
as economical aspect. Concern on environmental deterioration and climate change has driven
to formulate stringent emissions legislations. Therefore, acceptability of fuel combustion to
meet the emission legislations was also taken into consideration. The globally uneven of oil
reserves and consumption, Middle East countries have 62% of the global oil reserves while
the OECD (Organisation for Economic Co-operation and Development) countries only have
9% but consume 50% of global oil (Lefèvre, 2010), has put accessibility as another indicator
for fuel security (Kruyt et al., 2009).
The discussion in this section will focus on the use of gaseous and alternative liquid
fuels as diversification of fuel for transport sector in dual fuel engine mode. Dual fuelled
engine and the use of alternative fuels principally are means to simultaneously reduce fossil
fuel consumption, thus keeping the fuel security, and air pollution or greenhouse gases.
2.3.1 Gaseous Fuels Utilisation
2.3.1.1 Biogas
Biogas, a combustible gaseous fuel, is produced by anaerobic fermentation of organic
matter by a consortium of microorganism. Biogas can be made from organic residue of
agriculture, and by-product of ethanol or biodiesel production. It also can be made from
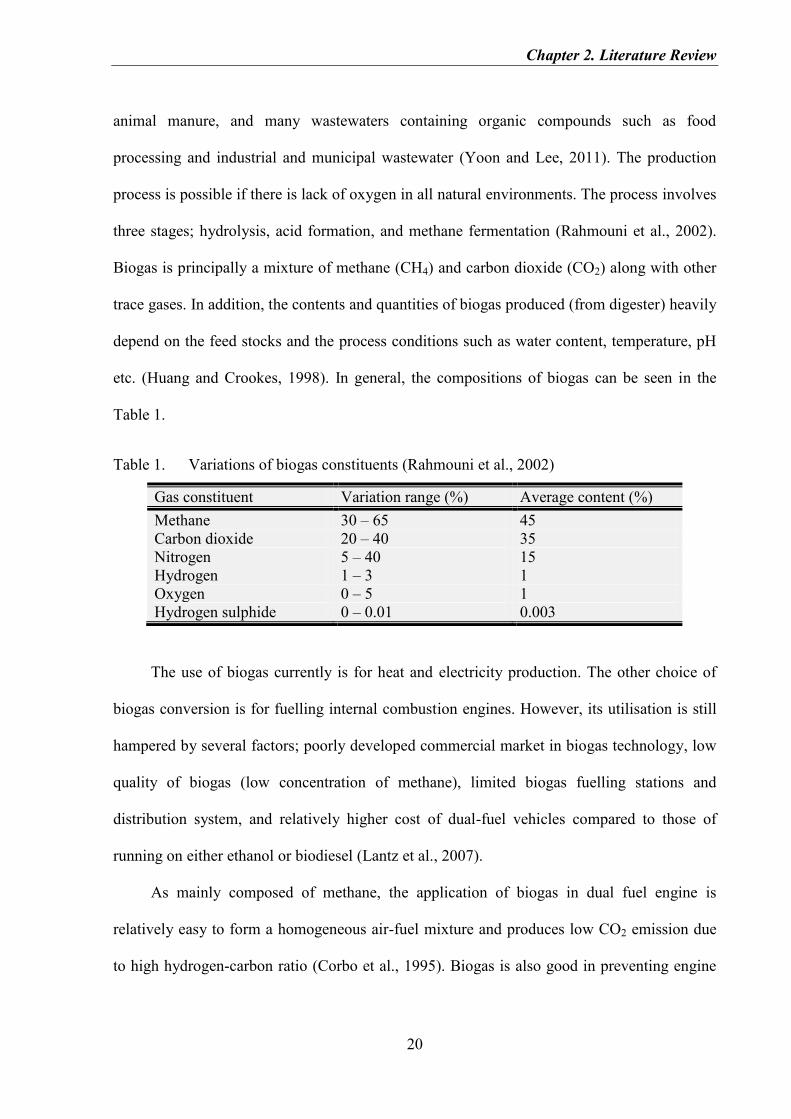
Chapter 2. Literature Review
20
animal manure, and many wastewaters containing organic compounds such as food
processing and industrial and municipal wastewater (Yoon and Lee, 2011). The production
process is possible if there is lack of oxygen in all natural environments. The process involves
three stages; hydrolysis, acid formation, and methane fermentation (Rahmouni et al., 2002).
Biogas is principally a mixture of methane (CH4) and carbon dioxide (CO2) along with other
trace gases. In addition, the contents and quantities of biogas produced (from digester) heavily
depend on the feed stocks and the process conditions such as water content, temperature, pH
etc. (Huang and Crookes, 1998). In general, the compositions of biogas can be seen in the
Table 1.
Table 1. Variations of biogas constituents (Rahmouni et al., 2002)
Gas constituent Variation range (%) Average content (%)
Methane 30 – 65 45
Carbon dioxide 20 – 40 35
Nitrogen 5 – 40 15
Hydrogen 1 – 3 1
Oxygen 0 – 5 1
Hydrogen sulphide 0 – 0.01 0.003
The use of biogas currently is for heat and electricity production. The other choice of
biogas conversion is for fuelling internal combustion engines. However, its utilisation is still
hampered by several factors; poorly developed commercial market in biogas technology, low
quality of biogas (low concentration of methane), limited biogas fuelling stations and
distribution system, and relatively higher cost of dual-fuel vehicles compared to those of
running on either ethanol or biodiesel (Lantz et al., 2007).
As mainly composed of methane, the application of biogas in dual fuel engine is
relatively easy to form a homogeneous air-fuel mixture and produces low CO2 emission due
to high hydrogen-carbon ratio (Corbo et al., 1995). Biogas is also good in preventing engine
Chapter 2. Literature Review
21
knock due to methane which has a high research octane number (about 120). However, the
presence of CO2 potentially reduces the flammability range resulting in deterioration in
combustion process such as increasing cyclic combustion variation, lowering the flame
temperature, and prolonging ignition delay (Sahoo et al., 2009).
In addition, the presence of CO2 in biogas leads to a lower volumetric energy density
and fuel conversion efficiency because laminar flame speed and combustion enthalpy is
reduced. The high self-ignition temperature of biogas also resists autoignition. However, with
the use of improved engine design such as prechamber ignition and higher compression ratio,
the engine operating conditions can be optimised through reduction in HC and CO without
sacrificing the engine thermal efficiency (Roubaud and Favrat, 2005). The addition or
combination with high heating value gases such as hydrogen also can be an option to improve
the combustion characteristics. Reducing the content of CO2 and other inert gases from biogas
can improve the flame velocity and calorific value. A process to gain hydrogen and to reduce
CO2 from one source at the same time for application in CI engines will increase the energy
content and thus fuel economy.
2.3.1.2 Liquefied Petroleum Gas (LPG)
LPG refers to a group of hydrocarbon-based gases obtained mostly from gas wells and
by-product of crude oil refining processes. The predominant constituents of LPG are mainly
butane and propane, but the actual composition of commercially available LPG varies widely
among countries and depends on season, properties of the crude oil/gas supply used, refining
process and cost (Masi, 2012). In cold countries such as UK, propane is the most abundant
component of LPG in order to provide adequate vapour pressure in winter, whilst in the
warmer countries butane has higher percentage (Price et al., 2004). In the UK, the quality
Chapter 2. Literature Review
22
specifications of LPG are conformed to BS 4250 which is specified for commercial butane
and propane.
The emissions of LPG-driven vehicles are low and LPG is commercially available in
most places (Johnson, 2003). It has been proven that LPG-operated vehicles have benefit in
reducing emissions compared to that of gasoline. A decrease in main emissions such as HC,
CO, NOX, PM and CO2 is obtained mainly due to high hydrogen-carbon ratio and no aromatic
hydrocarbons of LPG. This is supposed to encourage the utilisation for transportation.
However, its utilisation both for heating system and motor vehicle is still limited. Therefore,
the UK government has encouraged the utilisation by giving financial advantages to those
converting vehicles to operate on LPG (Price, 2004).
Apart from emissions benefit, the LPG-driven engines also have low maintenance,
operational cost, and high thermal efficiency. The high thermal efficiency obtained is due to
LPG has high flame speed and octane number thus suitable for high compression ratio
(Karamangil, 2007, Masi, 2012). Those characteristics lead to the increased heat released and
thus increasing in-cylinder pressure which elevates the indicated work (Masi, 2012). LPG also
has benefit in storage property when compared with biogas where it can be liquefied in
relatively low pressure range of 0.7-0.8 MPa at atmospheric temperature. This makes it easy
to be stored in pressurised steel tanks, and hence LPG provides more energy content on mass
basis compared to other gaseous fuels.
The characteristic of high octane number but low cetane number makes LPG widely
used in SI engines. However, it has been desirable to utilize LPG on the CI engines for
gaining both better engine thermal efficiency and emissions. High research octane number
enables LPG or propane to be run at high compression ratio like diesel engines with less
possibility to detonation.
Chapter 2. Literature Review
23
LPG has low molecular weight due to its simple chemical compound and high vapour
pressure compared to conventional diesel fuels. Therefore, in dual fuel application,
homogeneous air-fuel mixture followed by premixed combustion can be easily attained. Thus,
significantly lower soot and CO2 emissions from diesel engines operated by LPG are possible
(Alam et al., 2001, Campbell et al., 2004). In addition, when the quantity of LPG increases in
dual fuel system the premixed combustion rapidly increases. This is because LPG is a reactive
hydrocarbon gas fuel (Stewart et al., 2007). However, the ignition delay may increase with the
increase in the amount of LPG because of low CN of LPG. A readjust of injection timing may
restore the SOC (start of combustion) point while keeping the combustion benefit.
LPG has lower diffusivity (0.12 cm2/s) compared to hydrogen (0.61 cm
2/s) (Lata et al.,
2012). This characteristic may lead to the formation of bigger unburned LPG-air mixture area
and hence dissipating the available energy which potentially could reduce the thermal
efficiency. Mixing the LPG and hydrogen together is expected to improve the drawback of
LPG in dual fuel combustion.
2.3.1.3 Hydrogen
The decrease of primary energy sources (i.e. fossil fuels), the pollutant emissions
associated to the combustion of fossil fuel, and the need to maintain the energy supply
security has encouraged the use of hydrogen as one of the alternative fuels both for
transportation and powertrains systems.
Apart from motor vehicles can run well with hydrogen, the hydrogen emission benefits
(no presence of carbon) and its inherent benefits such as high calorific value in terms of mass,
wide flammability limits, and flame propagation speed allows better efficiency improvement
favouring its application in automotive (Verhelst and Sierens, 2001).
Chapter 2. Literature Review
24
It has been shown that hydrogen is a good substitute fuel for gasoline as hydrogen has
high octane number. Therefore, it can resist knock under SI engine operation (Korakianitis et
al., 2010). It also offers other advantages such as low pollution, controllability and safety.
Hydrogen-fuelled vehicles can operate at low equivalence ratio as hydrogen is able to burn at
lean mixture allowing stability combustion at lean operation. Therefore, it is possible to
produce low NOX at this condition. However, at high engine load the hydrogen-fuelled
internal combustion engine has a possibility to produce NOX. This is because the ignition
energy of hydrogen is very low which enables hydrogen-air mixture to be ignited even with
the presence of hot spots or gases. This can promote advanced start of combustion which then
simultaneously increases the heat released and high in-cylinder pressure/temperature. Other
issue that may arise is premature ignition and backfire which can cause engine knocking
(White et al., 2006).
Hydrogen has high mass specific LHV (lower heating value) compared to other gaseous
fuel (such as methane) or liquid fuel. However, its energy density is much lower compared to
those fuels as a result from its low density. For stoichiometric combustion, hydrogen requires
high mass of combustion air. It requires an air-hydrogen ratio of about 34:1 by mass for
complete combustion which is much higher than that of gasoline which has air-fuel ratio
about 14.6. However, hydrogen displaces more of the combustion chamber compared with
other fuels. This leads to less air in the combustion chamber but at the same time improve
energy content of the stoichiometric mixture of air and hydrogen.
The utilisation of hydrogen is expanded to compression ignition engines to capitalise
the benefit of hydrogen combustion characteristics. In a recent research, Boretti (Boretti,
2011) modified the combustion chamber through pre-chamber injection of hydrogen with a
glow plug unit. In this novel combustion system, the combustion of hydrogen-air mixture will
Chapter 2. Literature Review
25
experience both premixed gasoline and diffusion diesel-like combustion. It is found that the
engine thermal efficiency is improved at the same BMEP (brake mean effective pressure)
output compared with diesel fuel only operation.
The utilisation of hydrogen is also applied to dual fuel system. Hydrogen as the main
fuel can be injected either in the intake port or into the combustion chamber directly.
Compared with the port fuel injection (PFI), directly hydrogen injection into the combustion
chamber will improve the volumetric efficiency and thus power density (White et al., 2006).
However, providing a car with on-board hydrogen is still a technical challenge. A feasibility
study on hydrogen utilisation which is obtained from stoichiometric gaseous fuel reforming is
required to enhance the gaseous-diesel fuel operation.
2.3.2 Alternative Liquid Fuels Utilisation
The use of ‘carbon neutral’ fuel like biodiesel is necessary for mitigation of global CO2
concentration. On the other hand, the limited oil resources while relatively large amount of
natural gas resources has encouraged the utilisation of another alternative fuel, GTL, as a new
diesel fuel.
In addition, the liquid or pilot fuel used is one of dominant factors in the dual fuelled
engine operation. Type and quantity of the pilot fuel have great impact to the engine
performance and emissions. Although the amount of the pilot fuel used can be very small, the
function in the combustion process is very relevant as it acts as ignition source. Apart from
the engine operating conditions (load and speed) and pilot fuel injection system, a good
control and selection of the pilot fuel is expected to ensure a stable ignition, well flame
distribution and the burning of air-gaseous fuel mixture throughout the combustion chamber
and hence leading to minimum cycle-to-cycle variation. This section discusses two
alternatives fuels which can be used for pilot fuel.
Chapter 2. Literature Review
26
2.3.2.1 Biodiesel
Biodiesel is one of the alternative fuels that have been gaining a growing interest which
is produced from renewable sources such as waste cooking oils, animal fats, and vegetable
oils. The utilisation has been started long time ago when diesel engine was invented by
Rudolf Diesel. However, due to low cost of diesel and gasoline the utilisation of biodiesel for
motor vehicles decreases. As the global crude oil price increases due to its gradually declining
sources and the concern for the environmental problem, the attention for its utilisation arise
again. In addition, the main raw materials for biodiesel production are abundant,
biodegradable and relatively easy to find and hence can reduce the dependency on petroleum
(Demirbas, 2007).
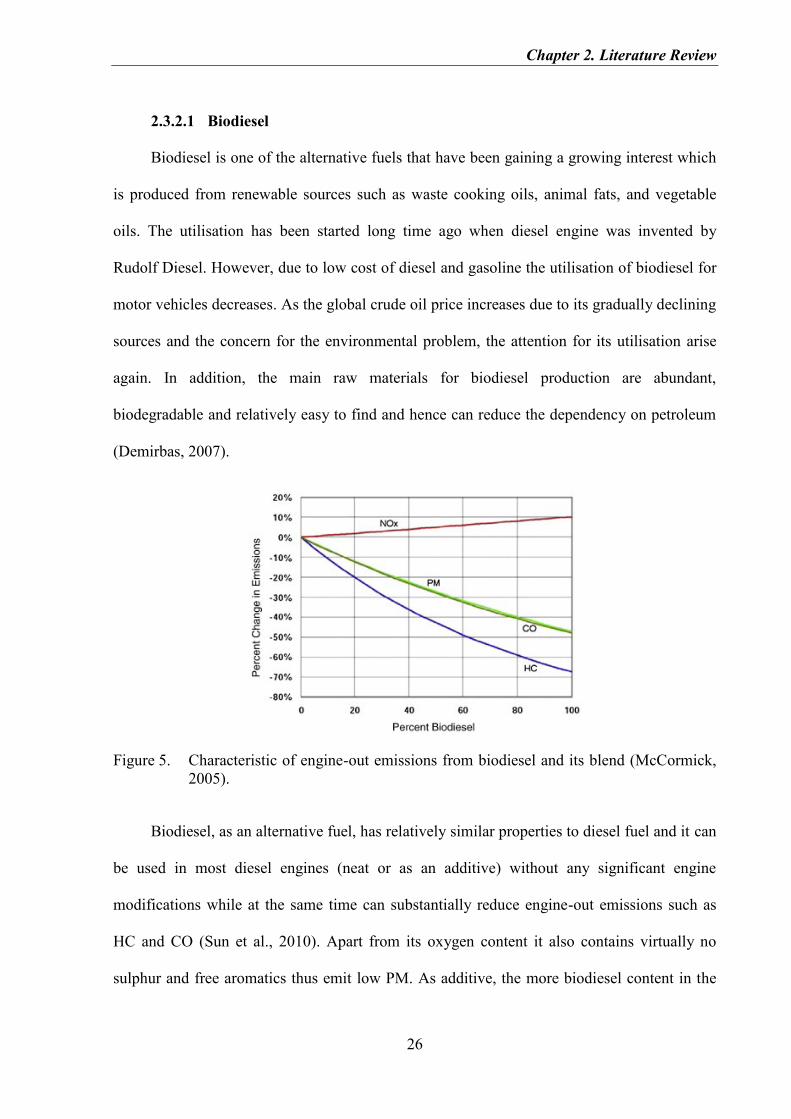
Figure 5. Characteristic of engine-out emissions from biodiesel and its blend (McCormick,
2005).
Biodiesel, as an alternative fuel, has relatively similar properties to diesel fuel and it can
be used in most diesel engines (neat or as an additive) without any significant engine
modifications while at the same time can substantially reduce engine-out emissions such as
HC and CO (Sun et al., 2010). Apart from its oxygen content it also contains virtually no
sulphur and free aromatics thus emit low PM. As additive, the more biodiesel content in the
Chapter 2. Literature Review
27
fuel blend the more emission advantages as depicted in Figure 5. It is also a nontoxic and
biodegradable fuel and hence minimizing the risk to environment and ground water (Shahid
and Jamal, 2008). Because of all the advantages biodiesel has been used widely as a vehicular
fuel.
However, biodiesel has some limitations which need to be addressed. Some major
properties that can affect the engine performance and emissions are higher viscosity, less
favorable cold flow properties, and lower heating value and volatility. In addition, its high
bulk modulus of compressibility can lead to the advanced fuel injection timing which can
increase NOX emissions. The lower heating value results in an increase in fuel consumption
while its cold flow property results in difficulty to start the engine in cold weather. However,
its high viscosity improves engine lubricity thus can lengthen the engine life (Shahid and
Jamal, 2008, Boehman et al., 2005). In addition, it is suggested that the combination of
biodiesel and gaseous fuels with their specific characteristics in dual fuel engine may become
a solution for dual fuelling system to overcome the emission issues (Selim et al., 2008).
Biodiesel can be produced through transesterification which aims to reduce the
viscosity, improve cold flow properties and cetane number of the raw material. In this process
ethanol and methanol are usually used due to their relatively low price, and chemical and
physical advantages (Ramadhas et al., 2004). The production process and technique used has
great influence to the biodiesel chemical and physical properties. Maintaining the quality of
the product is important to obtain acceptable biodiesel commercially. All biodiesel should
meet the standard of ASTM 6571-3 or EN 14214 for US and Europe respectively.
2.3.2.2 Gas-to-Liquid (GTL)
Gas-to-liquid is a next generation fuel which is created from a Fischer-Tropsch process
which was discovered by Franz Fischer and Hans Tropsch, German scientists, in 1920s as a
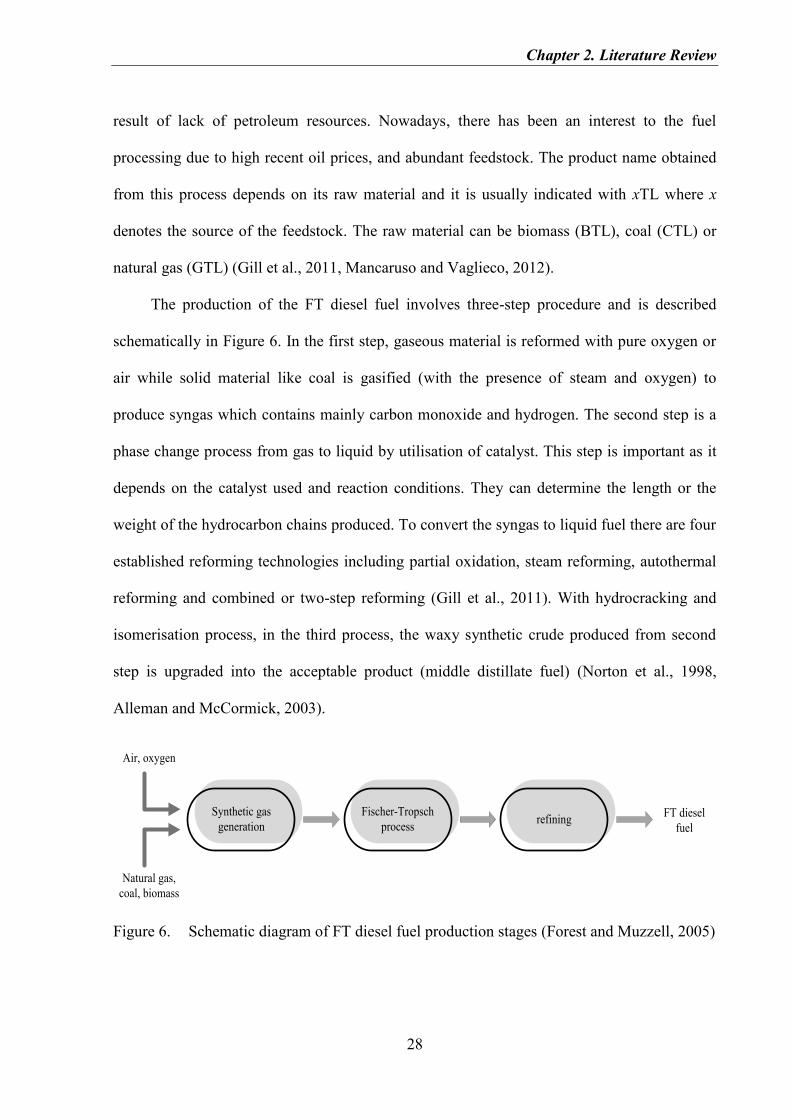
Chapter 2. Literature Review
28
result of lack of petroleum resources. Nowadays, there has been an interest to the fuel
processing due to high recent oil prices, and abundant feedstock. The product name obtained
from this process depends on its raw material and it is usually indicated with xTL where x
denotes the source of the feedstock. The raw material can be biomass (BTL), coal (CTL) or
natural gas (GTL) (Gill et al., 2011, Mancaruso and Vaglieco, 2012).
The production of the FT diesel fuel involves three-step procedure and is described
schematically in Figure 6. In the first step, gaseous material is reformed with pure oxygen or
air while solid material like coal is gasified (with the presence of steam and oxygen) to
produce syngas which contains mainly carbon monoxide and hydrogen. The second step is a
phase change process from gas to liquid by utilisation of catalyst. This step is important as it
depends on the catalyst used and reaction conditions. They can determine the length or the
weight of the hydrocarbon chains produced. To convert the syngas to liquid fuel there are four
established reforming technologies including partial oxidation, steam reforming, autothermal
reforming and combined or two-step reforming (Gill et al., 2011). With hydrocracking and
isomerisation process, in the third process, the waxy synthetic crude produced from second
step is upgraded into the acceptable product (middle distillate fuel) (Norton et al., 1998,
Alleman and McCormick, 2003).
Synthetic gas
generation
Fischer-Tropsch
processrefining
Air, oxygen
Natural gas,
coal, biomass
FT diesel
fuel
Figure 6. Schematic diagram of FT diesel fuel production stages (Forest and Muzzell, 2005)
Chapter 2. Literature Review
29
GTL virtually is an ultra-clean fuel, colorless, odorless, low in toxicity, aromatics,
sulfur content, and has high cetane number (Gill et al., 2011). The advantageous properties
give benefits in reducing HC, CO NOX, and PM emissions. However, GTL has lower density
because of higher H/C ratio compared with the standard European specifications for diesel.
Therefore, strategy of fuel injection needs to be reconfigured/modified (Rounce et al., 2009,
Larsson and Denbratt, 2007). In addition, GTL also has poor lubricity because of its low
aromatic and sulphur content. However, driven by increasingly stringent emissions
regulations the use of a ‘clean’ alternative fuel is an inevitable choice. Therefore, the poor
lubricity of GTL can be overcome by addition of biodiesel or additives (Alleman and
McCormick, 2003).
2.3.3 Engine Technology through Dual Fuel System
The utilisation of gaseous fuel and diesel-like fuel at the same time is called dual fuel
engine. Driven by the fossil fuel depletion, the utilisation of gaseous fuel in IC engines has
got more positive response as a possible method, and at the same time can reduce engine
emissions (Xu et al., 2010). In addition, dual fuel operating strategy has economic benefits
because various alternative fuels can be used which typically has lower cost than that of
conventional fossil fuel and requires no major hardware modifications. It also can be operated
on any combinations of gaseous and liquid fuel. Moreover, the engine operation can be
switched to normal operation when the availability of gaseous fuel has run out. Generally,
gaseous fuels have high octane number which is appropriate for engines with high
compression ratio. This is particularly advantageous because can resist knock.
Dual fuelled engine concept combines the type of combustion CI engines and SI
engines. The admission of gaseous fuels can be performed in several ways such as
carburetion, intake manifold injection, intake port injection, and direct in-cylinder injection
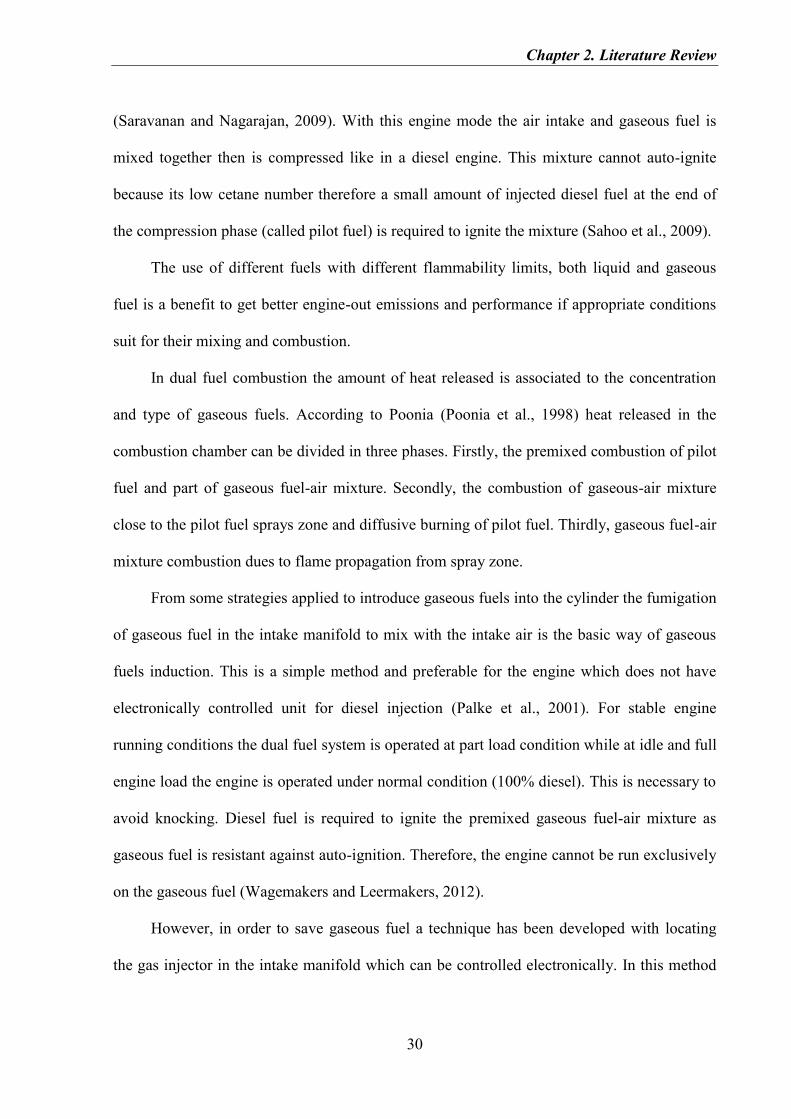
Chapter 2. Literature Review
30
(Saravanan and Nagarajan, 2009). With this engine mode the air intake and gaseous fuel is
mixed together then is compressed like in a diesel engine. This mixture cannot auto-ignite
because its low cetane number therefore a small amount of injected diesel fuel at the end of
the compression phase (called pilot fuel) is required to ignite the mixture (Sahoo et al., 2009).
The use of different fuels with different flammability limits, both liquid and gaseous
fuel is a benefit to get better engine-out emissions and performance if appropriate conditions
suit for their mixing and combustion.
In dual fuel combustion the amount of heat released is associated to the concentration
and type of gaseous fuels. According to Poonia (Poonia et al., 1998) heat released in the
combustion chamber can be divided in three phases. Firstly, the premixed combustion of pilot
fuel and part of gaseous fuel-air mixture. Secondly, the combustion of gaseous-air mixture
close to the pilot fuel sprays zone and diffusive burning of pilot fuel. Thirdly, gaseous fuel-air
mixture combustion dues to flame propagation from spray zone.
From some strategies applied to introduce gaseous fuels into the cylinder the fumigation
of gaseous fuel in the intake manifold to mix with the intake air is the basic way of gaseous
fuels induction. This is a simple method and preferable for the engine which does not have
electronically controlled unit for diesel injection (Palke et al., 2001). For stable engine
running conditions the dual fuel system is operated at part load condition while at idle and full
engine load the engine is operated under normal condition (100% diesel). This is necessary to
avoid knocking. Diesel fuel is required to ignite the premixed gaseous fuel-air mixture as
gaseous fuel is resistant against auto-ignition. Therefore, the engine cannot be run exclusively
on the gaseous fuel (Wagemakers and Leermakers, 2012).
However, in order to save gaseous fuel a technique has been developed with locating
the gas injector in the intake manifold which can be controlled electronically. In this method
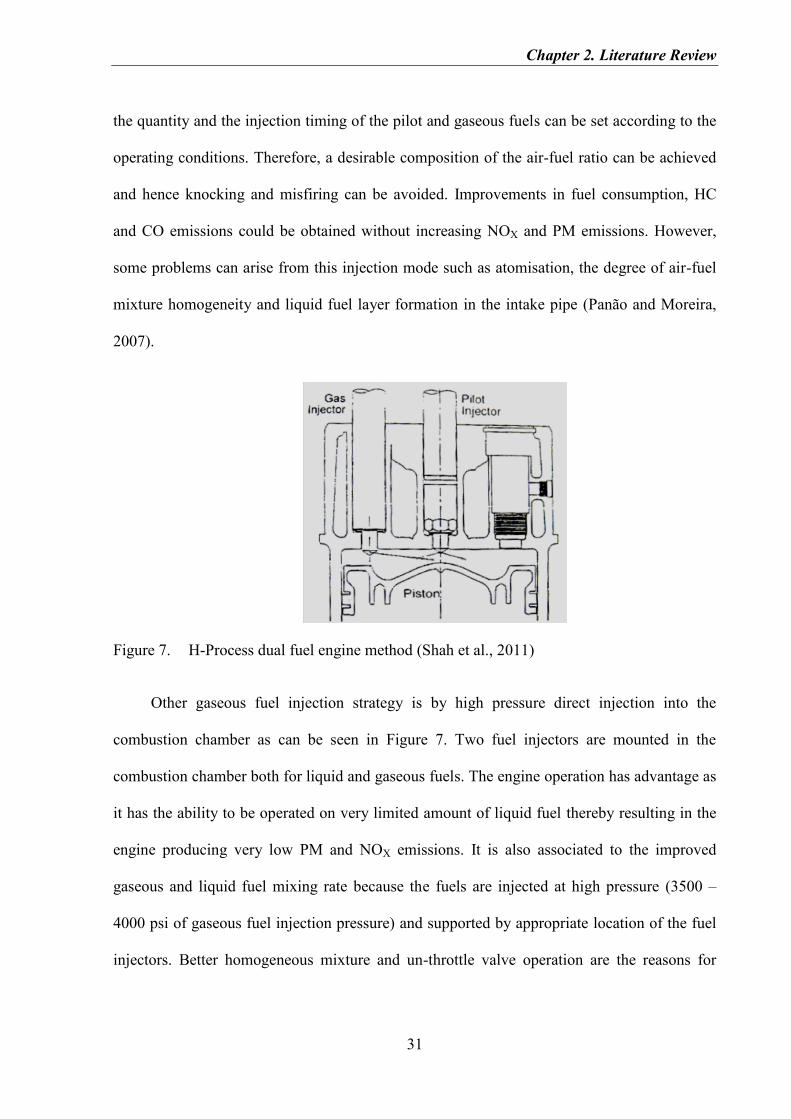
Chapter 2. Literature Review
31
the quantity and the injection timing of the pilot and gaseous fuels can be set according to the
operating conditions. Therefore, a desirable composition of the air-fuel ratio can be achieved
and hence knocking and misfiring can be avoided. Improvements in fuel consumption, HC
and CO emissions could be obtained without increasing NOX and PM emissions. However,
some problems can arise from this injection mode such as atomisation, the degree of air-fuel
mixture homogeneity and liquid fuel layer formation in the intake pipe (Panão and Moreira,
2007).
Figure 7. H-Process dual fuel engine method (Shah et al., 2011)
Other gaseous fuel injection strategy is by high pressure direct injection into the
combustion chamber as can be seen in Figure 7. Two fuel injectors are mounted in the
combustion chamber both for liquid and gaseous fuels. The engine operation has advantage as
it has the ability to be operated on very limited amount of liquid fuel thereby resulting in the
engine producing very low PM and NOX emissions. It is also associated to the improved
gaseous and liquid fuel mixing rate because the fuels are injected at high pressure (3500 –
4000 psi of gaseous fuel injection pressure) and supported by appropriate location of the fuel
injectors. Better homogeneous mixture and un-throttle valve operation are the reasons for
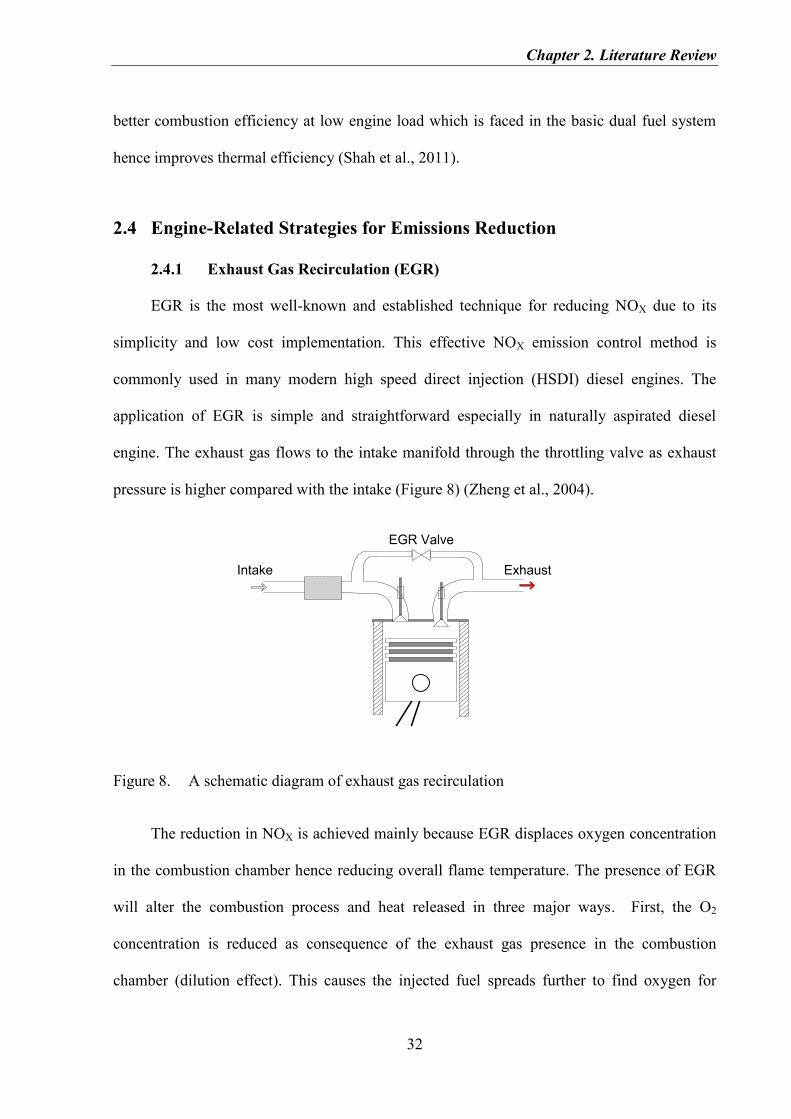
Chapter 2. Literature Review
32
better combustion efficiency at low engine load which is faced in the basic dual fuel system
hence improves thermal efficiency (Shah et al., 2011).
2.4 Engine-Related Strategies for Emissions Reduction
2.4.1 Exhaust Gas Recirculation (EGR)
EGR is the most well-known and established technique for reducing NOX due to its
simplicity and low cost implementation. This effective NOX emission control method is
commonly used in many modern high speed direct injection (HSDI) diesel engines. The
application of EGR is simple and straightforward especially in naturally aspirated diesel
engine. The exhaust gas flows to the intake manifold through the throttling valve as exhaust
pressure is higher compared with the intake (Figure 8) (Zheng et al., 2004).
Exhaust Intake
EGR Valve
Figure 8. A schematic diagram of exhaust gas recirculation
The reduction in NOX is achieved mainly because EGR displaces oxygen concentration
in the combustion chamber hence reducing overall flame temperature. The presence of EGR
will alter the combustion process and heat released in three major ways. First, the O2
concentration is reduced as consequence of the exhaust gas presence in the combustion
chamber (dilution effect). This causes the injected fuel spreads further to find oxygen for
Chapter 2. Literature Review
33
stoichiometric combustion. Therefore, the flammable region is extended as can be seen in
Figure 9. Apart from stoichiometric mixture the region also includes portion which contains
CO2, H2O, and N2 from exhaust gas. The reduced oxygen concentration also lowers the
oxygen partial pressure affecting the kinetics of NOX formation reactions (Ghazikhani et al.,
2010, Maiboom et al., 2008, Abd-Alla, 2002).
The second effect of EGR is thermal effect. CO2 and H2O as the inherent components of
EGR have higher specific heat capacity compared to those of substances from ambient air
such as O2 and N2. Consequently, the overall heat capacity on the cylinder charge is reduced
and hence lowering flame temperature and propensity in NOX production.
No EGR
spraynozzle
rich
region
flame
region
Lean region
= 1
With EGR
spraynozzle
rich
region
Lean region
flame
region
= 1
Figure 9. The change of spray flame volume due to EGR (Abd-Alla, 2002)
The third effect is chemical effect. The combustion process occurred in the combustion
chamber is altered because of the presence of H2O and CO2. Supported by high temperature
these substances undergo dissociation during combustion period modifying both the
chemistry of the combustion process and formation of NOX. Particularly, the flame
temperature is reduced by the endothermic dissociation of H2O (Ghazikhani et al., 2010,
Maiboom et al., 2008).
Chapter 2. Literature Review
34
The modification of in-cylinder temperature and composition of the inlet charge (the
addition of CO2 and H2O) due to the application of EGR also affects the start of ignition. It is
generally observed that the ignition delay increases. However, the main problem caused by
the EGR application is the significantly increased particulate matter (PM) formation. The
reduced in-cylinder temperature and pronounced diffusion combustion are main reasons for
decreased oxidation ability of the combustion product. Other adverse effects of the utilisation
of EGR include increase in the specific fuel consumption and deterioration of engine
durability, lubricant oil quality, while the engine may suffer high cycle-to-cycle variations and
power loss (Cadman and Johnson, 1986, Zhao et al., 2000).
2.4.2 Diesel Fuel Injection Timing
One major factor affecting the engine-out emissions is fuel injection timing. Two types
of injection timing commonly applied in diesel engines are briefly described below.
Advanced injection timing
Longer ignition delay is a result of the advanced injection timing. Under longer ignition
delay the time for air and fuel to mix is increased hence provides a better combustible mixture
quality. This is considered as a cause for the increase in the in-cylinder temperature and
pressure. The greater heat available at this condition will speed up the chemical reaction
within the mixture and thus oxidise well the combustion product decreasing CO and HC
emissions. For dual fuel combustion mode, it is generally obtained that the start of
combustion is retarded thus increasing the ignition delay. Therefore, advancing fuel injection
is one method to minimise the combustion alteration due to the presence of gaseous fuel.
Chapter 2. Literature Review
35
Retarded injection timing
This type of injection is used mainly to reduce NOX emissions. A late injection causes a
short ignition delay. The improper mixing between air and fuel due to less time for mixing
leads to non-homogeneous mixture and reduces maximum in-cylinder temperature. This also
affects the combustion process rate becoming slower which in turn minimises the capability
of combustion product oxidation. As a result HC and CO emissions might increase. The end
of combustion is also extended as the process of combustion is shifted to the expansion
stroke. The combustion behaviour describes that majority of combustion is located after TDC
and hence reducing the effective work cycle. In dual fuel combustion the retarded injection
timing is not a proper option due to a retarded start of combustion in the combustion mode.
In addition, the quality and effectiveness of the mixture formation in the combustion
chamber is also affected by the fuel injection system. In general, the fuel injection system can
be divided into pump-line-nozzle and common-rail system which is discussed briefly below.
Pump-line-nozzle system is a ‘classic’ fuel injection system technology which has been
used for decades. This injection system is categorised as a low pressure injection (injection
levels ranging from 140 – 1350 bar) when compared with the common-rail system. The fuel
injection pump transfers fuel to the injector through a high-pressure fuel line and then
spraying fuel via nozzle into the combustion chamber. Engine load determines the quantity of
the injected fuel. The inherent advantage such as high durability and relatively easy
maintenance make this injection system still used in many heavy duty truck and marine
engines (DieselNet, 2010).
Common-rail system is developed to meet the demand of the diesel engines with has
low emissions, low fuel consumption, low combustion noise but more specific engine power
output. The injection system has flexibility in injecting fuel therefore it can adapt well to the
Chapter 2. Literature Review
36
engine operating conditions and engine design. Higher injection pressure (about 1500 – 3000
bar) including variable injection pressure in accordance with engine operating conditions,
variable injection timing, multiple injection capability including pre and post injection phase
are benefits of the injection system (Stone, 1999).
2.5 Hydrogen Production from Fuel Reforming
One of the mechanisms to obtain hydrogen is through reforming of the hydrocarbon
fuel. The fuel reforming process for hydrogen production can be performed by either non-
catalytic or catalytic processes. However, the hydrogen production catalytically is promising
as the process requires less residence time and relatively low operating temperature (Chaniotis
and Poulikakos, 2005).
Exhaust gas fuel reforming is an on-board technique for providing the engine with
hydrogen-rich gaseous fuel. Hydrogen production is carried out by catalytic interaction of
hydrocarbon fuel directly assisted by exhaust gas in a reforming reactor. The reformed gas
then is recirculated into the engine. Therefore, the method is also known as reformed EGR
(REGR) (Tsolakis et al., 2005b). The production of hydrogen via reforming of hydrocarbon
fuels involves all basic reforming processes. Those techniques are explained briefly as
follows.
Steam reforming (SR) is a process using high-temperature steam to yield hydrogen and
carbon monoxide. The process is highly endothermic requiring high level of heat input
(Tsolakis and Megaritis, 2004). To eliminate the CO produced in the reaction, a further water-
gas shift reaction (WGSR) may be involved. With this reaction more hydrogen can be
produced.
Chapter 2. Literature Review
37
Partial oxidation (POX) is another process to produce hydrogen. In this process
hydrocarbon fuel is burned using lower stoichiometric oxygen. The advantages of this process
are: is able to be started quickly, is appropriate in a small system and is an exothermic
reaction. With this process syngas produced contains less calorific value than that of steam
reforming (less hydrogen content in the syngas) (Tsolakis et al., 2003). Complete oxidation
may take place depending on the condition of the reactor. This is undesirable as there is no
hydrogen produced. If the reaction occurred at relatively high temperature (> 800 oC) where
the availability of steam is limited, the endothermic dry reforming can take place.
Autothermal reforming (ATR) is a process which combines steam reforming and partial
oxidation in a reactor. The process requires no external heat (unlike SR) and reaction
temperature is lower compared to that of POX. In this process partial oxidation reaction
generates heat which is used to drive the steam reforming reaction. Therefore, the production
of hydrogen with this process is possible using simple and small reactor with relatively high
efficiency. Moreover, the hydrogen yield is higher than that produced by POX (Park et al.,
2010). Hydrogen-rich gas production assisted by exhaust gas has an advantage as the source
of oxygen (from water and air) is already available abundantly from diesel exhaust thus
requires no additional equipment. Furthermore, the liquid fuel in the reactor is evaporated by
heat from exhaust while water is already provided in the form of steam.
2.6 Current Method of Alternatives Fuels Utilisation in Dual Fuelled
Diesel Engines
Researches of the utilisation of gaseous fuels and other alternative liquid fuels on dual
fuel combustion process have been carried out extensively in order to improve its engine out
Chapter 2. Literature Review
38
emissions and performance. Various solutions have been proposed and the researches on the
combustion process can be grouped in three main areas as described briefly as follows.
a. Increasing the initial temperature. A slight pre-heating of the inlet air in the intake
manifold can lead to a higher combustion temperature (Karim and Wierzba, 1992).
Under this technique the flammability limits of the gaseous fuels can be extended
resulting in a reduction of unreacted gas in the cylinder. Therefore, HC and CO
emissions can be significantly reduced. However, engine knock problem can occur
when this method is applied at high engine load.
b. Methods involving the pilot fuel. Increasing the quantity of pilot fuel in dual fuelled
engine gives benefits for better combustion of charge mixture leading to the reduction
of engine exhaust emissions. This is due to bigger ignition centres, a larger reaction
zone and greater energy release can be created with higher pilot fuel quantity (Karim
and Wierzba, 1992, Gatts et al., 2012). Moreover, advancing injection timing increases
the residence time and activity of the partial oxidation reactions, increases the charge
temperature, and so extends the flammability boundary (Abd Alla et al., 2002).
Moreover, various new methods of fuel injection timing have been developed and
investigated. Some of them will be discussed briefly in this section.
PREDIC (Premixed lean diesel combustion). PREDIC is a direct injection dual
fuel engine where is achieved by application of various fuel injection strategies. This
technique is introduced as an attempt to minimize wall wetting and improves mixture
level and homogeneity, power densities, and to produce lean premixed mixture. The
fuel injection mechanisms can be three injections (one at the centre and two on the
sides) (Takeda et al., 1996), implementation of second fuel injection near TDC
injection (Hashizume et al., 1998), and multiple injections (Nishijima et al., 2002).
Chapter 2. Literature Review
39
MULINBUMP (Multi-pulse fuel injection in bump combustion chamber). The fuel
injection technique applies multi fuel injection but basically it can be divided into two
separate injection timings. The first fuel injection, injected on BTDC, contains a multi-
pulse injection where the number of injection, the start of injection, the period of each
injection, and the dwell time between the injections are managed. The main fuel
injection is injected around TDC (Su et al., 2005). Under the injection strategy, the fuel
and air mixing rate is much higher compared to the conventional CI engines.
PREMIER (Premixed Mixture Ignition in the End-gas Region). This combustion
process is different from the above mentioned as the combustion involves synthetic gas
apart from liquid fuel which acts as a pilot fuel. Rather than two or multi fuel injections,
this combustion method is divided in mainly two stages of heat released. The first rate
of heat release is generated by the ignition of pilot fuel which is injected on BTDC. The
pilot combustion then increases the in-cylinder temperature to initiate the development
of synthetic gas flame. The second rate of heat release, higher and faster compared to
the first one, is generated by the autoignition of synthetic gas-air mixture where occurs
in the compression stroke (Azimov et al., 2011).
c. The utilisation of hydrogen. Due to its burning characteristics and better performance
drives more interest in hydrogen utilisation in dual fuel combustion process (Saravanan
et al., 2008). The use of hydrogen combined with Diethyl Ether as ignition source has
shown improvement in carbonaceous emissions and thermal efficiency (Hashimoto et
al., 2008). Hydrogen dual fuelled engine using solenoid in-cylinder injection and
external fuel injection technique is another method which increases thermal efficiency
by about 22% (Lee et al., 2000). Under this injection method, the stability and
maximum power could be obtained by direct injection of hydrogen. In addition, an
Chapter 2. Literature Review
40
experiment with an electronic injector for hydrogen has been carried out to be operated
under high engine speed conditions in order to eliminate problems such as backfire and
pre ignition (Bailey et al., 1997). The addition of hydrogen into other gaseous fuel like
natural gas can improve the exhaust gas emissions and combustion characteristics
(Akansu et al., 2004). It has been shown that hydrogen addition in a natural gas
combustion with turbo-charging and exhaust gas recirculation can improved lean
combustion capability and HC, CO, and CO2 emissions (Bauer and Forest, 2001).
Despite the works have shown that the use of hydrogen can improve thermal efficiency
and reduce carbonaceous emissions however, the supply of hydrogen is from a compressed
gas from a storage cylinder. This indicates that the utilisation of hydrogen as an energy carrier
in motor vehicle still has technical and economical challenges. In this work, the hydrogen is
provided from the biogas and propane reforming to produce reformate (H2 and CO). The
reformate then is fed back into the engine and known as reformed exhaust gas recirculation
(REGR). In addition, other novelties of this work are the combustion of combination of
gaseous and liquid renewable fuels with hydrogen, the measurement of soluble organic
material (SOM) and HC species in dual fuelled engine combustion which are less well
investigated.
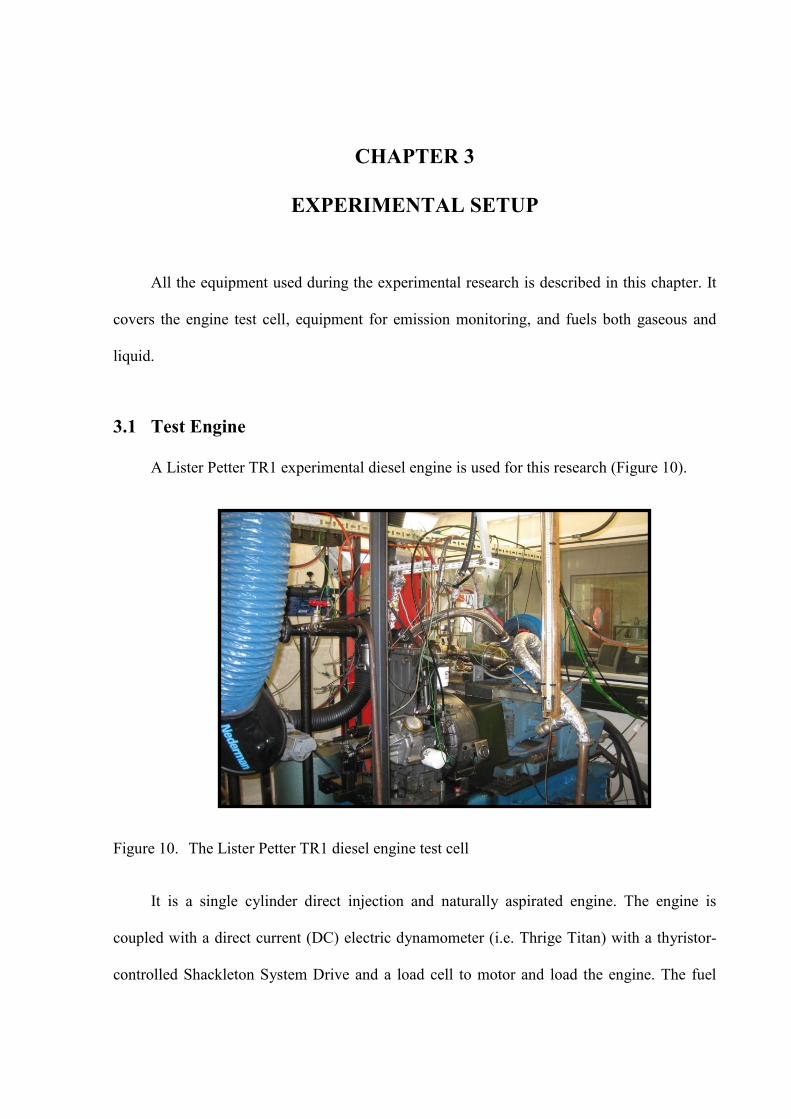
CHAPTER 3
EXPERIMENTAL SETUP
All the equipment used during the experimental research is described in this chapter. It
covers the engine test cell, equipment for emission monitoring, and fuels both gaseous and
liquid.
3.1 Test Engine
A Lister Petter TR1 experimental diesel engine is used for this research (Figure 10).
Figure 10. The Lister Petter TR1 diesel engine test cell
It is a single cylinder direct injection and naturally aspirated engine. The engine is
coupled with a direct current (DC) electric dynamometer (i.e. Thrige Titan) with a thyristor-
controlled Shackleton System Drive and a load cell to motor and load the engine. The fuel
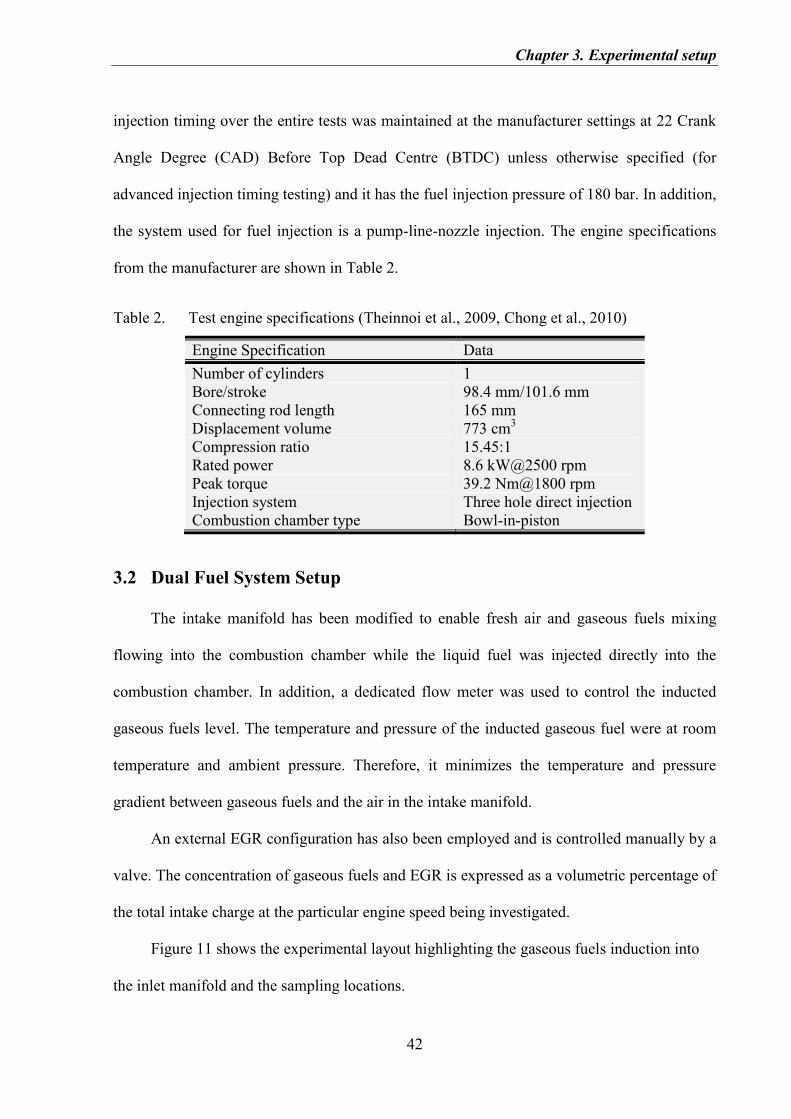
Chapter 3. Experimental setup
42
injection timing over the entire tests was maintained at the manufacturer settings at 22 Crank
Angle Degree (CAD) Before Top Dead Centre (BTDC) unless otherwise specified (for
advanced injection timing testing) and it has the fuel injection pressure of 180 bar. In addition,
the system used for fuel injection is a pump-line-nozzle injection. The engine specifications
from the manufacturer are shown in Table 2.
Table 2. Test engine specifications (Theinnoi et al., 2009, Chong et al., 2010)
Engine Specification Data
Number of cylinders 1
Bore/stroke 98.4 mm/101.6 mm
Connecting rod length 165 mm
Displacement volume 773 cm3
Compression ratio 15.45:1
Rated power 8.6 kW@2500 rpm
Peak torque 39.2 Nm@1800 rpm
Injection system Three hole direct injection
Combustion chamber type Bowl-in-piston
3.2 Dual Fuel System Setup
The intake manifold has been modified to enable fresh air and gaseous fuels mixing
flowing into the combustion chamber while the liquid fuel was injected directly into the
combustion chamber. In addition, a dedicated flow meter was used to control the inducted
gaseous fuels level. The temperature and pressure of the inducted gaseous fuel were at room
temperature and ambient pressure. Therefore, it minimizes the temperature and pressure
gradient between gaseous fuels and the air in the intake manifold.
An external EGR configuration has also been employed and is controlled manually by a
valve. The concentration of gaseous fuels and EGR is expressed as a volumetric percentage of
the total intake charge at the particular engine speed being investigated.
Figure 11 shows the experimental layout highlighting the gaseous fuels induction into
the inlet manifold and the sampling locations.
Chapter 3. Experimental setup
43
2 U
3 U 5 U
5 U
Charge
amplifier
Horiba
7100DEGRHoriba
MEXA 1230
PM Analyser
Flow meter
Fuel injector
EGR valve
In-cylinder pressure
transducer
Shaft
encoder
Fresh air inlet
Biogas/
propaneH2 CO
2 U
SMPS
AVL smoke
meter FTIR
Figure 11. Schematic diagram of experimental setup
3.3 Engine Instrumentation
To measure in-cylinder pressure a pressure transducer (i.e. Kistler 6125B) was used.
Mounted flush at the cylinder head it was connected to a National Instruments data
acquisition board (National Instruments PCI-MIO-16E-4) via a Kistler 5011 charge amplifier.
The position of crankshaft was recorded by a digital shaft encoder. In-house developed
LabVIEW-based software was used to carry out data acquisition and combustion analysis.
The test rig was equipped with other standard engine apparatus. Inlet manifold, exhaust,
air and oil temperatures were measured using thermocouple. During the tests the atmospheric
conditions such as pressure, temperature and humidity were monitored. In addition, safety
features of standard engine test bed were also included. Output from the analysis of
consecutive engine cycles (from a minimum of 200 cycles) included rate of heat release
(ROHR), values of indicated mean effective pressure (IMEP), peak in-cylinder pressure,
Chapter 3. Experimental setup
44
average values and percentage of COV of peak cylinder pressure and percentage coefficient
of variation of IMEP and other standard combustion parameters.
3.4 Engine-out Emissions Measurement
An Horiba MEXA-7100DEGR emissions analyser was used to measure carbon dioxide
and carbon monoxide by Non-Disperse Infrared (NDIR), oxygen using a magneto-pneumatic
detection, oxides of nitrogen (NOX = NO + NO2) by chemiluminescence detection (CLD), and
hydrocarbons (HC) by flame ionization detector (FID). The engine-out emissions were sent to
the analyser through a temperature controlled heated line (190 oC) to avoid condensation.
Appendix A shows the range of measurement and accuracy of the equipment.
An HORIBA MEXA-1230PM analyser was used to measure soot, SOM, and total PM.
With the equipment soot and SOM are measured separately and continuously where soot is
measured by a diffusion-charging (DC) detector with a dilution device. The air line for
dilution is heated at about 200 oC to prevent condensation. Two heated flame ionization
detectors (HFID) are used for SOM measurement. One of the FID is controlled at 191 oC and
the other one is controlled at 47 oC. The amount of Hydrocarbons vaporised after passing
through the detectors is indicated by the signal from the FIDs and the difference is used to
determine SOM component. In this study the dilution ratio was 40 part of air to 1 exhaust.
Smoke was evaluated by an AVL 415SG002 Smoke Meter. The exhaust gas passes
through the filter paper and the result was displayed as a filter smoke number (FSN)
conforming to ISO 10054. The analyser is equipped with a reflectometer to measure a
blackened filter paper which is scaled from 0 to 10 and indicates the soot content (0=low, 10=
high smoke). The sampling line is purged by clean air after taking measurement to ensure no
Chapter 3. Experimental setup
45
particles left in the dead volume for next measurement. The dead volume is the volume of
lines from sampling point to filter paper (AVL, 2005).
The particle size distribution and concentration was measured using an SMPS (scanning
mobility particle sizer) unit by classifying particles based on their electrical mobility which is
related to particle size. It consists of a condensation particle number (CPC) series 3775, an
electrostatic classifier (EC) series 3080, and a differential mobility analyzer (DMA) series
3081. The sample was diluted using a TSI 379020 thermodiluter (dilution ratio 200:1 and
dilution temperature 150 ºC). The equipment has capability to measure particle size
distributions in the range of 0.01 µm – 1 µm (Sitshebo, 2010).
A MultiGas 2030, FTIR (Fourier transform infrared spectroscopy) analyser was also
used for measurement of different hydrocarbon species. The measurement is performed by
passing a beam of infrared through the exhaust gas. Each sample or compound has different
wavelength and the amount of energy absorbed from the infrared beam by each sample is
measured. The differences in spectral frequencies absorbed and their intensity are resulted
from the chemical bond and the strength of the bond of each compound. The spectra are
measured at ambient pressure and temperature of 150 oC. All the emissions measurement
equipment was calibrated before taking any data measurements.
3.5 Fuels
The fuels used in this research work are divided into gaseous and liquid diesel fuels.
Bottled gaseous fuels are biogas, propane, hydrogen and carbon monoxide which are supplied
by BOC (British Oxygen Company). Hydrogen and carbon monoxide are used to form and
simulate reformate from stoichiometric biogas and propane reforming. The composition of
biogas was 60% methane and 40% carbon dioxide.
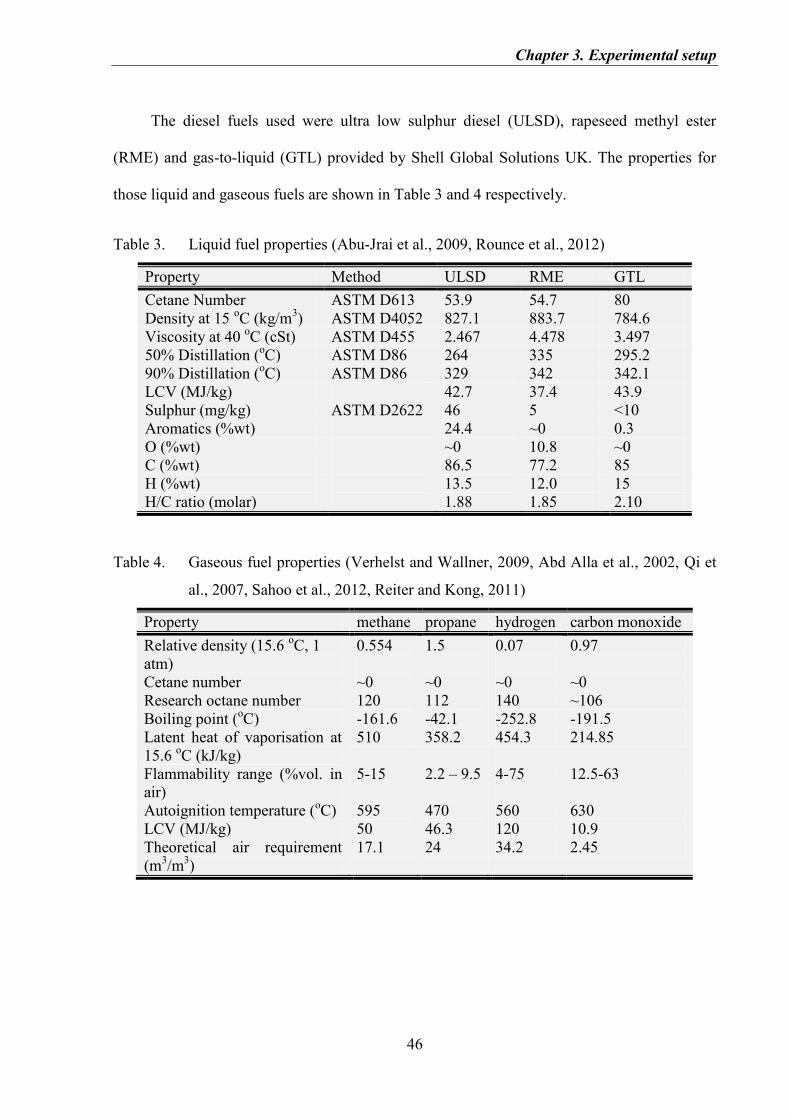
Chapter 3. Experimental setup
46
The diesel fuels used were ultra low sulphur diesel (ULSD), rapeseed methyl ester
(RME) and gas-to-liquid (GTL) provided by Shell Global Solutions UK. The properties for
those liquid and gaseous fuels are shown in Table 3 and 4 respectively.
Table 3. Liquid fuel properties (Abu-Jrai et al., 2009, Rounce et al., 2012)
Property Method ULSD RME GTL
Cetane Number ASTM D613 53.9 54.7 80
Density at 15 oC (kg/m
3) ASTM D4052 827.1 883.7 784.6
Viscosity at 40 oC (cSt) ASTM D455 2.467 4.478 3.497
50% Distillation (oC) ASTM D86 264 335 295.2
90% Distillation (oC) ASTM D86 329 342 342.1
LCV (MJ/kg) 42.7 37.4 43.9
Sulphur (mg/kg) ASTM D2622 46 5 <10
Aromatics (%wt) 24.4 ~0 0.3
O (%wt) ~0 10.8 ~0
C (%wt) 86.5 77.2 85
H (%wt) 13.5 12.0 15
H/C ratio (molar) 1.88 1.85 2.10
Table 4. Gaseous fuel properties (Verhelst and Wallner, 2009, Abd Alla et al., 2002, Qi et
al., 2007, Sahoo et al., 2012, Reiter and Kong, 2011)
Property methane propane hydrogen carbon monoxide
Relative density (15.6 oC, 1
atm)
Cetane number
Research octane number
0.554
~0
120
1.5
~0
112
0.07
~0
140
0.97
~0
~106
Boiling point (oC) -161.6 -42.1 -252.8 -191.5
Latent heat of vaporisation at
15.6 oC (kJ/kg)
510 358.2 454.3 214.85
Flammability range (%vol. in
air)
5-15 2.2 – 9.5 4-75 12.5-63
Autoignition temperature (oC) 595 470 560 630
LCV (MJ/kg) 50 46.3 120 10.9
Theoretical air requirement
(m3/m
3)
17.1 24 34.2 2.45
Chapter 3. Experimental setup
47
3.6 Equations
Below are the equations used to calculate different combustion and performance
parameters. Indicated mean effective pressure (IMEP (bar)) is calculated by using the
following equation:
(3.1)
where p (MPa) is in-cylinder pressure and Vd (cm3) is displaced cylinder volume.
Exhaust gas recirculation (EGR) applied was flow rate of exhaust in volumetric
according to reduction in the volumetric air flow rate. The equation is expressed as follow:
(3.2)
where and (m3/s) are volumetric flow rates of the measured intake air without and with
EGR respectively.
The brake power Pb (kW) delivered by the engine was determined by:
(3.3)
Where ω (rad/s), N (rps), and Tb (Nm) are angular speed, engine speed and engine brake
torque respectively.
Brake specific fuel consumption (BSFC (g/kWh)) is fuel mass flow rate per unit power
output and defined as:
(3.4)
where (kg/s) is the fuel mass flow rate. For fuel blend is expressed as:
(3.5)
Where , (kg/s) are the ULSD and GTL mass flow rate respectively.
Chapter 3. Experimental setup
48
To calculate the engine thermal efficiency (ηth) the following equation is used:
(3.6)
Where LCV (MJ/kg) is lower calorific value of the fuel used. For fuel blend
is determined by equation:
(3.7)
The rate of heat release (J/CAD) was calculated using the equation below
(Heywood, 1998):
(3.8)
Where γ is the ratio of specific heats (cp/cv), p (bar) is the instantaneous cylinder pressure, and
V (cm3) is the instantaneous volume of the cylinder. The γ value was calculated for each
crank angle degree (CAD) by interpolating between the values of γ1 for a specific point before
the start of combustion in the compression stroke (30 CAD BTDC) and γ2 for a specific point
after the end of combustion in he expansion stroke (50 CAD ATDC) (Tsolakis, 2004).
C H A P T E R 4
COMBUSTION AND EMISSIONS CHARACTERISTICS OF
BIOGAS-DIESEL DUAL FUELLED ENGINE
4.1 Introduction
This chapter discusses about combination between a renewable gaseous fuel and
alternative liquid fuel. Under dual-fuelled engine operation, the inducted gaseous fuel and
injected diesel fuel properties are critical parameters that influence combustion patterns and
thus the engine-out emissions. The gaseous fuel used is biogas which contains 60% CH4 and
40% CO2. CO2 in biogas acts as diluents and decreases the flame temperature and thus
formation of NOX. Depending on the engine speed and load conditions (i.e. low in-cylinder
temperatures), engine thermal efficiency may be reduced with simultaneous increases in CO
and total HC emissions as a result of the incomplete combustion due to CO2 presence. To
avoid the decrease in engine power and severe running engine problems, the amount of CO2
content in biogas should be limited. Therefore, 40% CO2 by volume is chosen as the highest
acceptable level for smooth running (Bari, 1996). The volumes of the biogas added to the
engine intake were 2% and 4% expressed as volumetric percentages of the intake air
volumetric flow rate at the particular engine speed being investigated. The discussion of the
combustion and emissions characteristics of dual fuelled engine mode run by biogas is
presented in first section.
The injected diesel fuels effect is also studied. Ultra Low Sulphur Diesel (ULSD) was
used as the base engine fuel. Synthetic gas-to-liquid (GTL) and a blend (v/v%) of 30% of
Chapter 4. Combustion and emissions characteristics of biogas-diesel dual fuelled engine
50
GTL and 70% ULSD (referred to as GD30) were also examined. The discussion of the effect
is presented in the second section.
To improve the limitations of the biogas combustion in diesel engines, H2 and reformate
(H2 and CO) addition may act as a CH4 combustion enhancer. Hydrogen combustion
properties are supposed to enhance methane combustion and reduce exhaust emissions.
Hydrogen and reformate concentrations were selected, assuming complete fuel reforming of
biogas to the syngas as shown in the dry reforming equation below. Dry reforming was
chosen due to CO2 amount produced with this process was lower compared to that of steam
reforming. In addition, with this process the energy content of biogas can be improved (Lau et
al., 2011).
(4.1)
The CO production can be limited by changing the thermodynamic conditions to help
promote the water-gas shift reaction (WGSR), an exothermic reaction as shown in the
equation below.
(4.2)
Third section will discuss the effect of H2 and reformate addition on biogas-diesel duel
fuel engine. The engine operating conditions used are described in Table 5. 30 tests were
carried out during the experiment, and the volumetric flow rate of the hydrogen and reformate
added are shown in Appendix B. GD30 was chosen because the fuel blend properties such as
cetane number and density were improved without any significant different in combustion
traces. In addition, the influence of engine speed and low load gave relatively similar affect on
the combustion and exhaust emissions among the fuels used. Therefore, the study of engine
speed and low load was carried out on ULSD combustion only as the baseline fuel. The
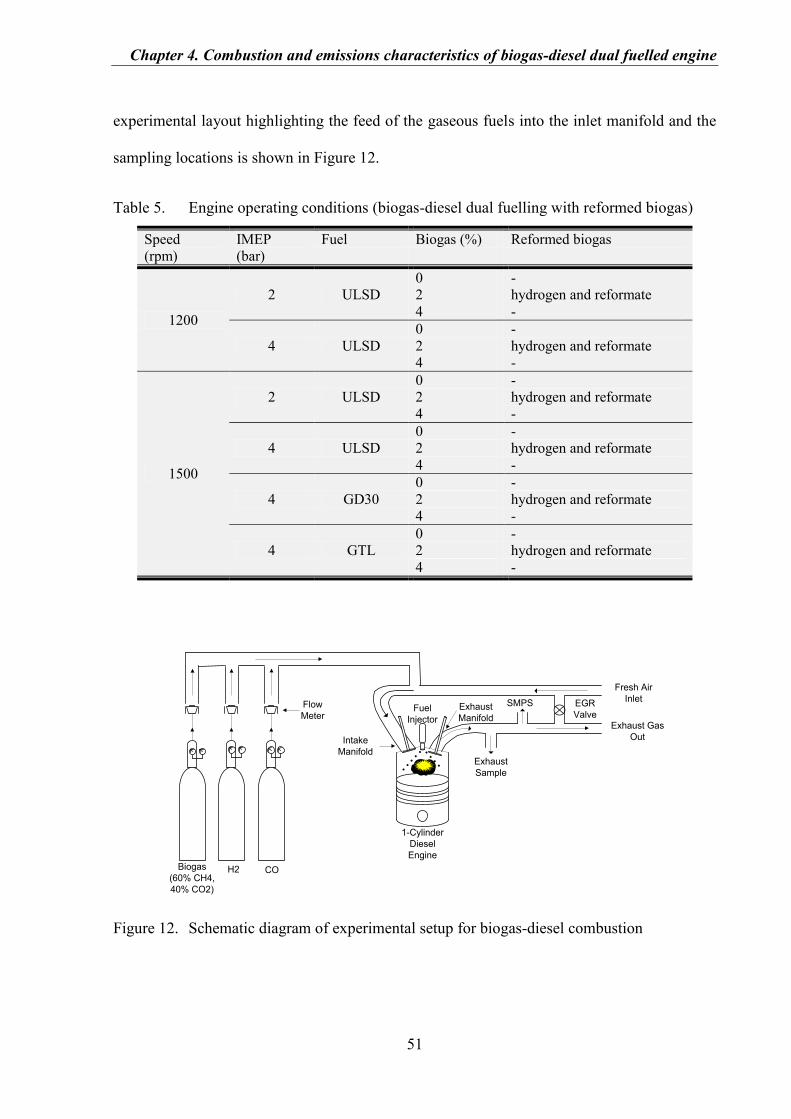
Chapter 4. Combustion and emissions characteristics of biogas-diesel dual fuelled engine
51
experimental layout highlighting the feed of the gaseous fuels into the inlet manifold and the
sampling locations is shown in Figure 12.
Table 5. Engine operating conditions (biogas-diesel dual fuelling with reformed biogas)
Speed
(rpm)
IMEP
(bar)
Fuel Biogas (%) Reformed biogas
1200
2 ULSD
0 -
2 hydrogen and reformate
4 -
4 ULSD
0 -
2 hydrogen and reformate
4 -
1500
2 ULSD
0 -
2 hydrogen and reformate
4 -
4 ULSD
0 -
2 hydrogen and reformate
4 -
4 GD30
0 -
2 hydrogen and reformate
4 -
4 GTL
0 -
2 hydrogen and reformate
4 -
Figure 12. Schematic diagram of experimental setup for biogas-diesel combustion
Fuel
Injector
Fresh Air
Inlet
Exhaust Gas
Out
Exhaust
Sample
1-Cylinder
Diesel
Engine
SMPSExhaust
Manifold
EGR
Valve
Intake
Manifold
Biogas
(60% CH4,
40% CO2)
H2 CO
Flow
Meter
Chapter 4. Combustion and emissions characteristics of biogas-diesel dual fuelled engine
52
4.2 Biogas-ULSD Combustion and Emissions
Combustion and engine performance characteristics. Dual-fuelled engine operation
was shown to alter the rate of heat release and in-cylinder pressure traces from the baseline
standard diesel combustion. In all low load engine conditions (e.g. Figure 13), the pressure
rise and peak pressure of dual-fuel mode is lower compared to that of the diesel fuel. This is
due to:
i) The lower energy available to efficiently oxidise the gaseous fuel and
ii) The increased diluents in the combustion chamber (i.e. high CO2 concentration) which
increases the ignition delay significantly (Papagiannakis and Hountalas, 2004). The
prolonged ignition delay in dual-fuel mode shifts the combustion process closer to top
dead centre (TDC).
As the engine load increased to 4 bar IMEP, the combustion of the gaseous fuel was
improved due to an increase of in-cylinder temperatures, which in turn promotes combustion.
When biogas was added into the cylinder, the volumetric efficiency was reduced with
part of the fresh air being displaced by the biogas. The reduced air or oxygen for combustion
initiation inhibited the pre-ignition reaction activity which resulted in longer ignition delay
where in turn provided longer time for the air to mix with in-cylinder injected diesel and thus
burn in premixed combustion.
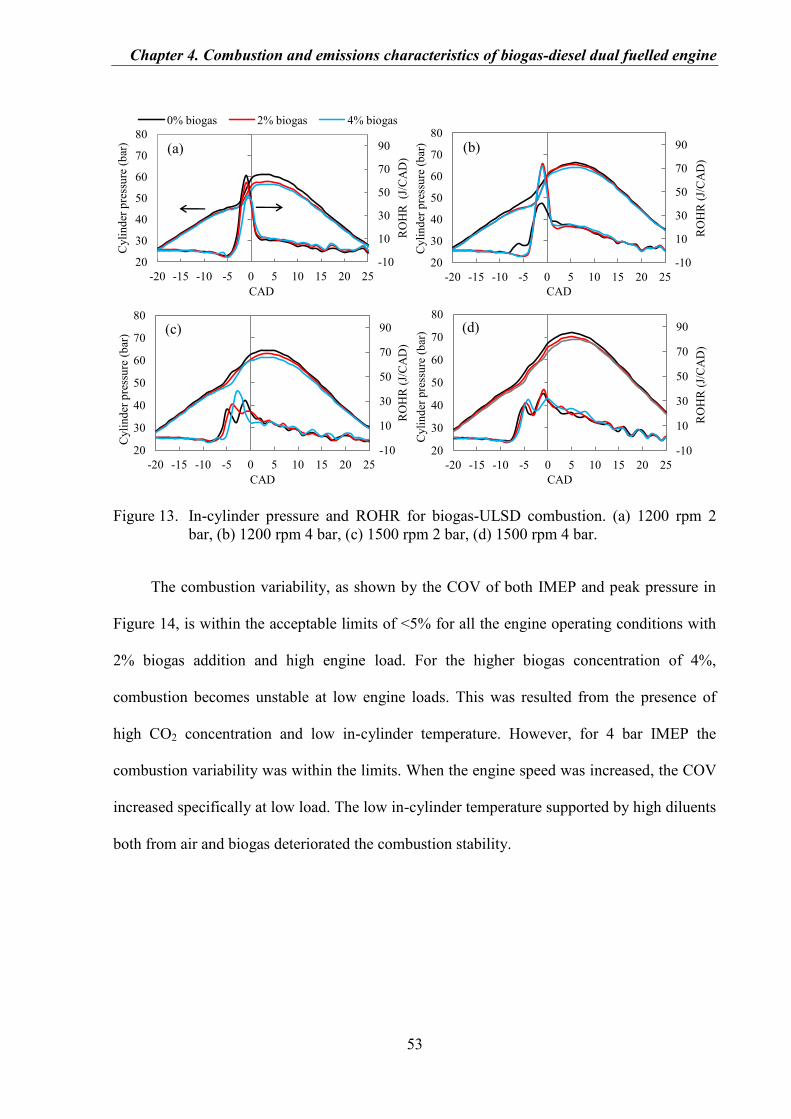
Chapter 4. Combustion and emissions characteristics of biogas-diesel dual fuelled engine
53
Figure 13. In-cylinder pressure and ROHR for biogas-ULSD combustion. (a) 1200 rpm 2
bar, (b) 1200 rpm 4 bar, (c) 1500 rpm 2 bar, (d) 1500 rpm 4 bar.
The combustion variability, as shown by the COV of both IMEP and peak pressure in
Figure 14, is within the acceptable limits of <5% for all the engine operating conditions with
2% biogas addition and high engine load. For the higher biogas concentration of 4%,
combustion becomes unstable at low engine loads. This was resulted from the presence of
high CO2 concentration and low in-cylinder temperature. However, for 4 bar IMEP the
combustion variability was within the limits. When the engine speed was increased, the COV
increased specifically at low load. The low in-cylinder temperature supported by high diluents
both from air and biogas deteriorated the combustion stability.
-10
10
30
50
70
90
20
30
40
50
60
70
80
-20 -15 -10 -5 0 5 10 15 20 25
RO
HR
(J
/CA
D)
Cyli
nd
er p
ress
ure
(b
ar)
CAD
0% biogas 2% biogas 4% biogas
(a)
-10
10
30
50
70
90
20
30
40
50
60
70
80
-20 -15 -10 -5 0 5 10 15 20 25
RO
HR
(J/
CA
D)
Cyli
nd
er p
ress
ure
(b
ar)
CAD
(b)
-10
10
30
50
70
90
20
30
40
50
60
70
80
-20 -15 -10 -5 0 5 10 15 20 25
RO
HR
(J/
CA
D)
CAD
Cyli
nd
er p
ress
ure
(b
ar) (c)
-10
10
30
50
70
90
20
30
40
50
60
70
80
-20 -15 -10 -5 0 5 10 15 20 25
RO
HR
(J/
CA
D)
Cyli
nd
er p
ress
ure
(b
ar)
CAD
(d)
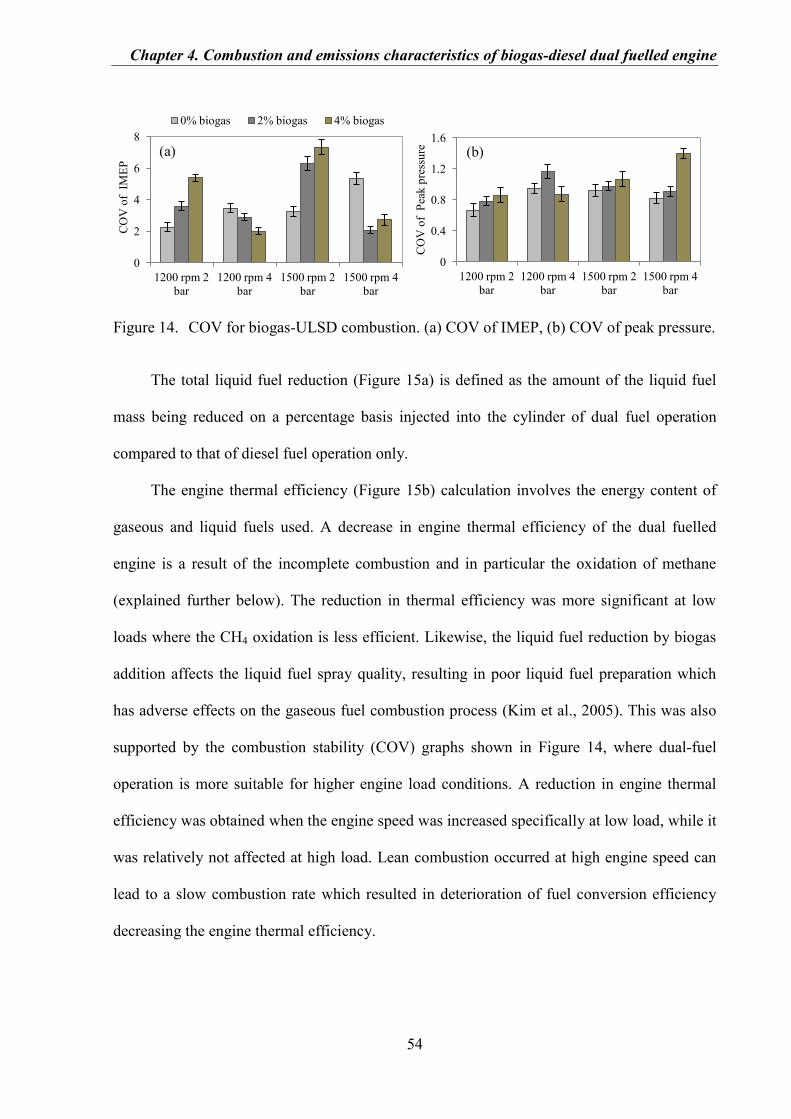
Chapter 4. Combustion and emissions characteristics of biogas-diesel dual fuelled engine
54
Figure 14. COV for biogas-ULSD combustion. (a) COV of IMEP, (b) COV of peak pressure.
The total liquid fuel reduction (Figure 15a) is defined as the amount of the liquid fuel
mass being reduced on a percentage basis injected into the cylinder of dual fuel operation
compared to that of diesel fuel operation only.
The engine thermal efficiency (Figure 15b) calculation involves the energy content of
gaseous and liquid fuels used. A decrease in engine thermal efficiency of the dual fuelled
engine is a result of the incomplete combustion and in particular the oxidation of methane
(explained further below). The reduction in thermal efficiency was more significant at low
loads where the CH4 oxidation is less efficient. Likewise, the liquid fuel reduction by biogas
addition affects the liquid fuel spray quality, resulting in poor liquid fuel preparation which
has adverse effects on the gaseous fuel combustion process (Kim et al., 2005). This was also
supported by the combustion stability (COV) graphs shown in Figure 14, where dual-fuel
operation is more suitable for higher engine load conditions. A reduction in engine thermal
efficiency was obtained when the engine speed was increased specifically at low load, while it
was relatively not affected at high load. Lean combustion occurred at high engine speed can
lead to a slow combustion rate which resulted in deterioration of fuel conversion efficiency
decreasing the engine thermal efficiency.
0
2
4
6
8
1200 rpm 2
bar
1200 rpm 4
bar
1500 rpm 2
bar
1500 rpm 4
bar
CO
V o
f I
ME
P
0% biogas 2% biogas 4% biogas
(a)
0
0.4
0.8
1.2
1.6
1200 rpm 2
bar
1200 rpm 4
bar
1500 rpm 2
bar
1500 rpm 4
bar
CO
V o
f P
eak p
ress
ure
(b)
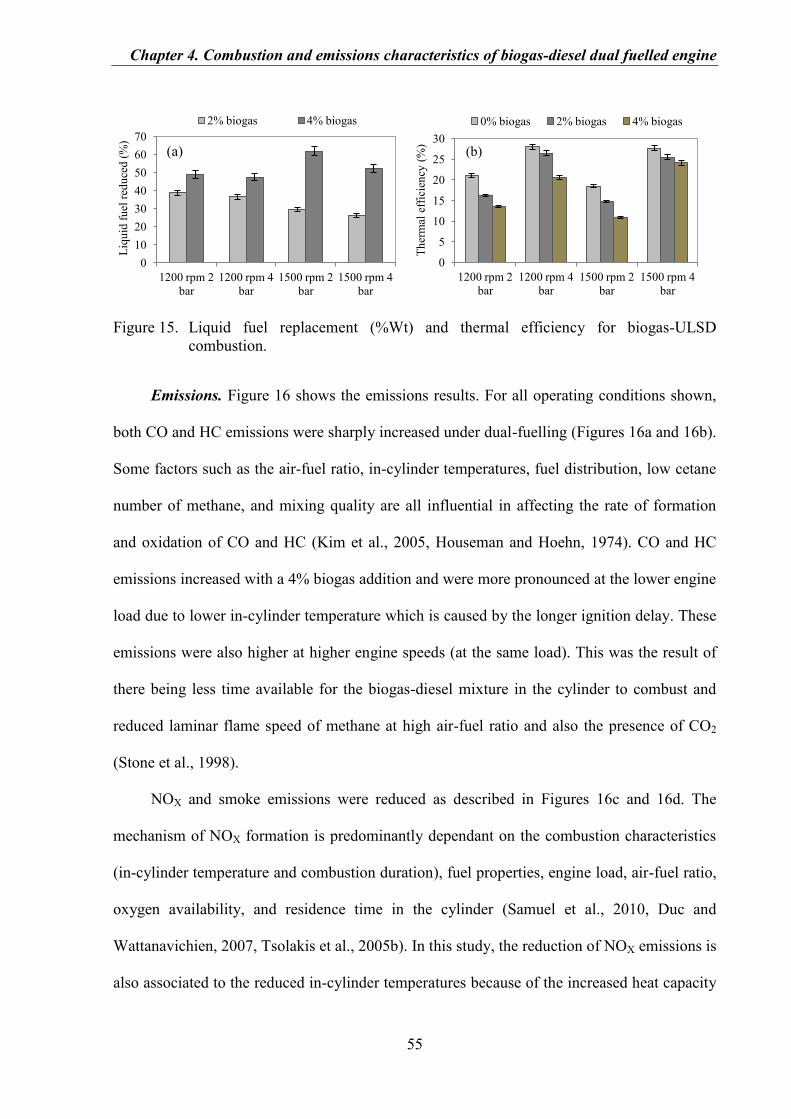
Chapter 4. Combustion and emissions characteristics of biogas-diesel dual fuelled engine
55
Figure 15. Liquid fuel replacement (%Wt) and thermal efficiency for biogas-ULSD
combustion.
Emissions. Figure 16 shows the emissions results. For all operating conditions shown,
both CO and HC emissions were sharply increased under dual-fuelling (Figures 16a and 16b).
Some factors such as the air-fuel ratio, in-cylinder temperatures, fuel distribution, low cetane
number of methane, and mixing quality are all influential in affecting the rate of formation
and oxidation of CO and HC (Kim et al., 2005, Houseman and Hoehn, 1974). CO and HC
emissions increased with a 4% biogas addition and were more pronounced at the lower engine
load due to lower in-cylinder temperature which is caused by the longer ignition delay. These
emissions were also higher at higher engine speeds (at the same load). This was the result of
there being less time available for the biogas-diesel mixture in the cylinder to combust and
reduced laminar flame speed of methane at high air-fuel ratio and also the presence of CO2
(Stone et al., 1998).
NOX and smoke emissions were reduced as described in Figures 16c and 16d. The
mechanism of NOX formation is predominantly dependant on the combustion characteristics
(in-cylinder temperature and combustion duration), fuel properties, engine load, air-fuel ratio,
oxygen availability, and residence time in the cylinder (Samuel et al., 2010, Duc and
Wattanavichien, 2007, Tsolakis et al., 2005b). In this study, the reduction of NOX emissions is
also associated to the reduced in-cylinder temperatures because of the increased heat capacity
0
10
20
30
40
50
60
70
1200 rpm 2
bar
1200 rpm 4
bar
1500 rpm 2
bar
1500 rpm 4
bar
Liq
uid
fu
el r
edu
ced
(%
) 2% biogas 4% biogas
(a)
0
5
10
15
20
25
30
1200 rpm 2
bar
1200 rpm 4
bar
1500 rpm 2
bar
1500 rpm 4
bar
Th
erm
al e
ffic
ien
cy (
%)
0% biogas 2% biogas 4% biogas
(b)
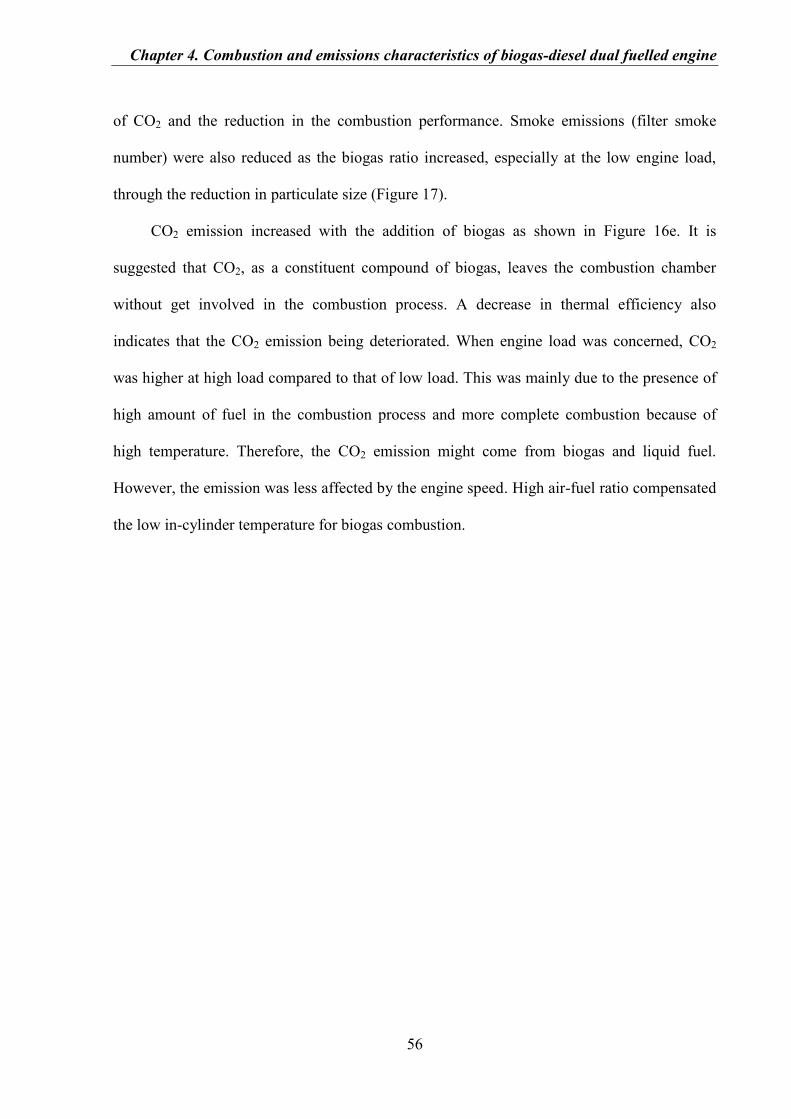
Chapter 4. Combustion and emissions characteristics of biogas-diesel dual fuelled engine
56
of CO2 and the reduction in the combustion performance. Smoke emissions (filter smoke
number) were also reduced as the biogas ratio increased, especially at the low engine load,
through the reduction in particulate size (Figure 17).
CO2 emission increased with the addition of biogas as shown in Figure 16e. It is
suggested that CO2, as a constituent compound of biogas, leaves the combustion chamber
without get involved in the combustion process. A decrease in thermal efficiency also
indicates that the CO2 emission being deteriorated. When engine load was concerned, CO2
was higher at high load compared to that of low load. This was mainly due to the presence of
high amount of fuel in the combustion process and more complete combustion because of
high temperature. Therefore, the CO2 emission might come from biogas and liquid fuel.
However, the emission was less affected by the engine speed. High air-fuel ratio compensated
the low in-cylinder temperature for biogas combustion.
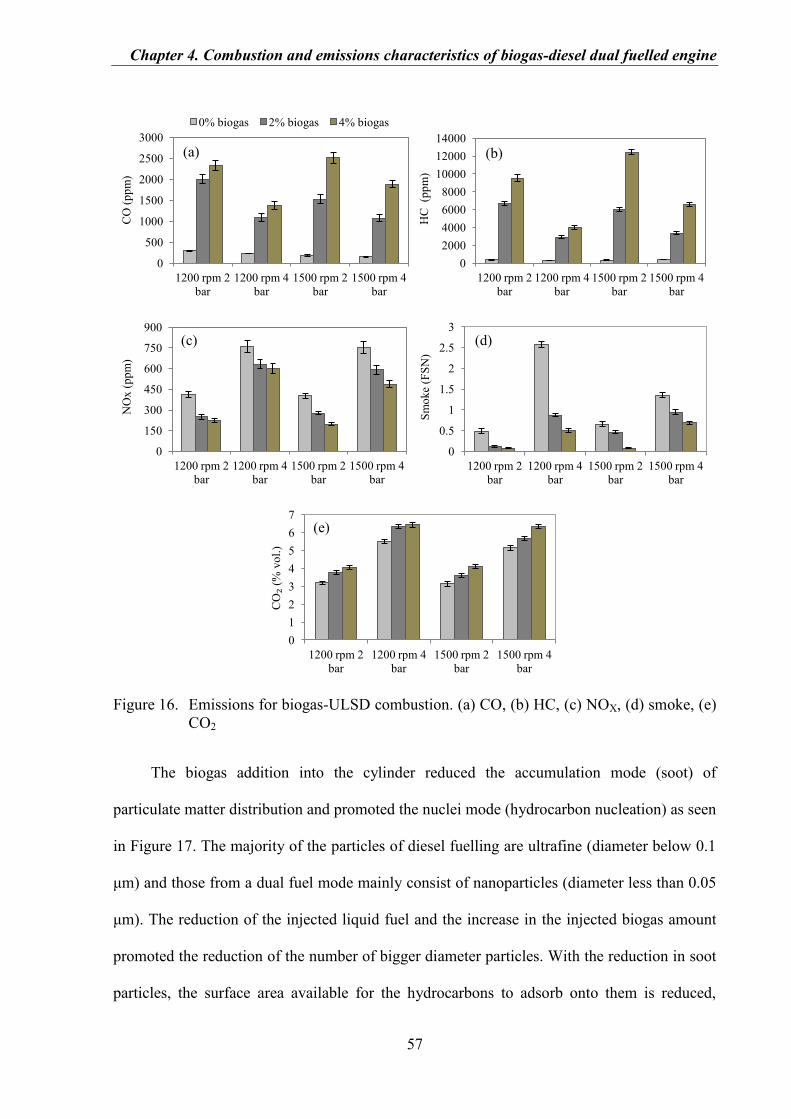
Chapter 4. Combustion and emissions characteristics of biogas-diesel dual fuelled engine
57
Figure 16. Emissions for biogas-ULSD combustion. (a) CO, (b) HC, (c) NOX, (d) smoke, (e)
CO2
The biogas addition into the cylinder reduced the accumulation mode (soot) of
particulate matter distribution and promoted the nuclei mode (hydrocarbon nucleation) as seen
in Figure 17. The majority of the particles of diesel fuelling are ultrafine (diameter below 0.1
μm) and those from a dual fuel mode mainly consist of nanoparticles (diameter less than 0.05
μm). The reduction of the injected liquid fuel and the increase in the injected biogas amount
promoted the reduction of the number of bigger diameter particles. With the reduction in soot
particles, the surface area available for the hydrocarbons to adsorb onto them is reduced,
0
500
1000
1500
2000
2500
3000
1200 rpm 2
bar
1200 rpm 4
bar
1500 rpm 2
bar
1500 rpm 4
bar
CO
(p
pm
) 0% biogas 2% biogas 4% biogas
(a)
0
2000
4000
6000
8000
10000
12000
14000
1200 rpm 2
bar
1200 rpm 4
bar
1500 rpm 2
bar
1500 rpm 4
bar
HC
(p
pm
)
(b)
0
150
300
450
600
750
900
1200 rpm 2
bar
1200 rpm 4
bar
1500 rpm 2
bar
1500 rpm 4
bar
NO
x (
pp
m)
(c)
0
0.5
1
1.5
2
2.5
3
1200 rpm 2
bar
1200 rpm 4
bar
1500 rpm 2
bar
1500 rpm 4
bar
Sm
oke
(FS
N)
(d)
0
1
2
3
4
5
6
7
1200 rpm 2
bar
1200 rpm 4
bar
1500 rpm 2
bar
1500 rpm 4
bar
CO₂
(% v
ol.
)
(e)
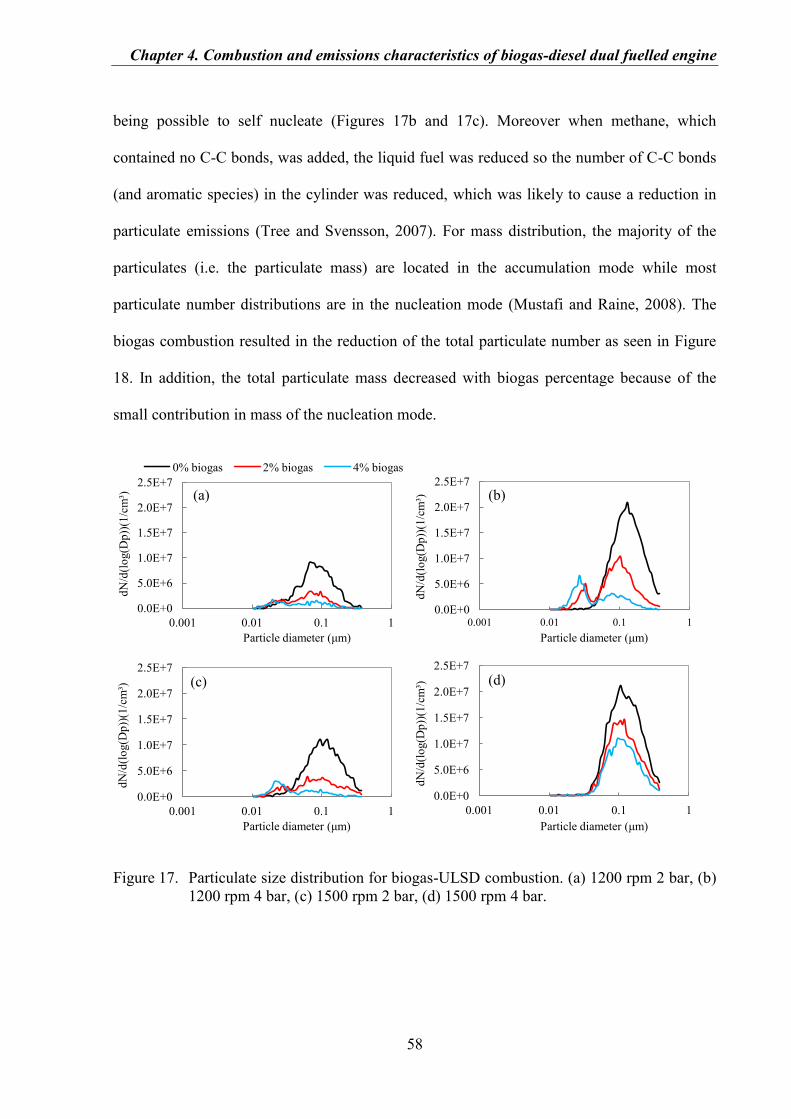
Chapter 4. Combustion and emissions characteristics of biogas-diesel dual fuelled engine
58
being possible to self nucleate (Figures 17b and 17c). Moreover when methane, which
contained no C-C bonds, was added, the liquid fuel was reduced so the number of C-C bonds
(and aromatic species) in the cylinder was reduced, which was likely to cause a reduction in
particulate emissions (Tree and Svensson, 2007). For mass distribution, the majority of the
particulates (i.e. the particulate mass) are located in the accumulation mode while most
particulate number distributions are in the nucleation mode (Mustafi and Raine, 2008). The
biogas combustion resulted in the reduction of the total particulate number as seen in Figure
18. In addition, the total particulate mass decreased with biogas percentage because of the
small contribution in mass of the nucleation mode.
Figure 17. Particulate size distribution for biogas-ULSD combustion. (a) 1200 rpm 2 bar, (b)
1200 rpm 4 bar, (c) 1500 rpm 2 bar, (d) 1500 rpm 4 bar.
0.0E+0
5.0E+6
1.0E+7
1.5E+7
2.0E+7
2.5E+7
0.001 0.01 0.1 1
dN
/d(l
og(D
p))
(1/c
m³)
Particle diameter (μm)
0% biogas 2% biogas 4% biogas
(a)
0.0E+0
5.0E+6
1.0E+7
1.5E+7
2.0E+7
2.5E+7
0.001 0.01 0.1 1
dN
/d(l
og(D
p))
(1/c
m³)
Particle diameter (μm)
(b)
0.0E+0
5.0E+6
1.0E+7
1.5E+7
2.0E+7
2.5E+7
0.001 0.01 0.1 1
dN
/d(l
og(D
p))
(1/c
m³)
Particle diameter (μm)
(c)
0.0E+0
5.0E+6
1.0E+7
1.5E+7
2.0E+7
2.5E+7
0.001 0.01 0.1 1
dN
/d(l
og(D
p))
(1/c
m³)
Particle diameter (μm)
(d)
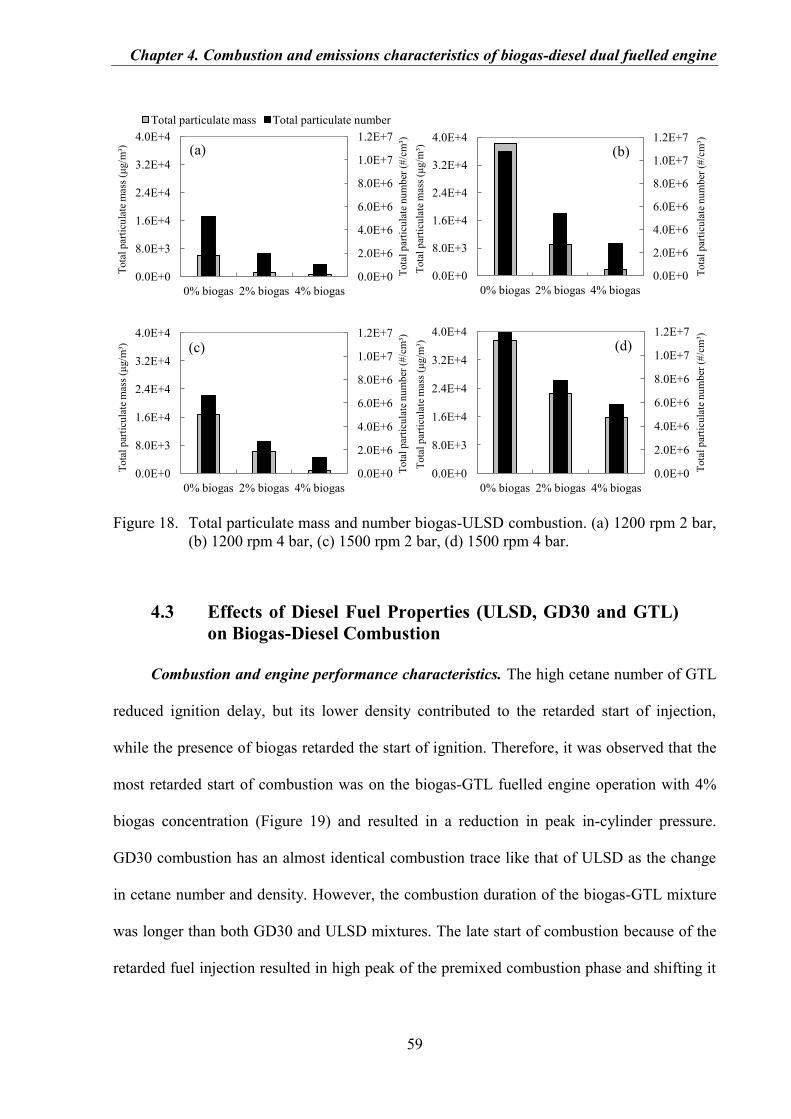
Chapter 4. Combustion and emissions characteristics of biogas-diesel dual fuelled engine
59
Figure 18. Total particulate mass and number biogas-ULSD combustion. (a) 1200 rpm 2 bar,
(b) 1200 rpm 4 bar, (c) 1500 rpm 2 bar, (d) 1500 rpm 4 bar.
4.3 Effects of Diesel Fuel Properties (ULSD, GD30 and GTL)
on Biogas-Diesel Combustion
Combustion and engine performance characteristics. The high cetane number of GTL
reduced ignition delay, but its lower density contributed to the retarded start of injection,
while the presence of biogas retarded the start of ignition. Therefore, it was observed that the
most retarded start of combustion was on the biogas-GTL fuelled engine operation with 4%
biogas concentration (Figure 19) and resulted in a reduction in peak in-cylinder pressure.
GD30 combustion has an almost identical combustion trace like that of ULSD as the change
in cetane number and density. However, the combustion duration of the biogas-GTL mixture
was longer than both GD30 and ULSD mixtures. The late start of combustion because of the
retarded fuel injection resulted in high peak of the premixed combustion phase and shifting it
0.0E+0
2.0E+6
4.0E+6
6.0E+6
8.0E+6
1.0E+7
1.2E+7
0.0E+0
8.0E+3
1.6E+4
2.4E+4
3.2E+4
4.0E+4
0% biogas 2% biogas 4% biogas
Tota
l p
arti
cula
te n
um
ber
(#
/cm
³)
Tota
l p
arti
cula
te m
ass
(μg/m
³)
Total particulate mass Total particulate number
(a)
0.0E+0
2.0E+6
4.0E+6
6.0E+6
8.0E+6
1.0E+7
1.2E+7
0.0E+0
8.0E+3
1.6E+4
2.4E+4
3.2E+4
4.0E+4
0% biogas 2% biogas 4% biogas
Tota
l p
arti
cula
te n
um
ber
(#
/cm
³)
Tota
l p
arti
cula
te m
ass
(μg/m
³)
(b)
0.0E+0
2.0E+6
4.0E+6
6.0E+6
8.0E+6
1.0E+7
1.2E+7
0.0E+0
8.0E+3
1.6E+4
2.4E+4
3.2E+4
4.0E+4
0% biogas 2% biogas 4% biogas
Tota
l p
arti
cula
te n
um
ber
(#
/cm
³)
Tota
l p
arti
cula
te m
ass
(μg/m
³)
(c)
0.0E+0
2.0E+6
4.0E+6
6.0E+6
8.0E+6
1.0E+7
1.2E+7
0.0E+0
8.0E+3
1.6E+4
2.4E+4
3.2E+4
4.0E+4
0% biogas 2% biogas 4% biogas
Tota
l p
arti
cula
te n
um
ber
(#
/cm
³)
Tota
l p
arti
cula
te m
ass
(μg/m
³)
(d)
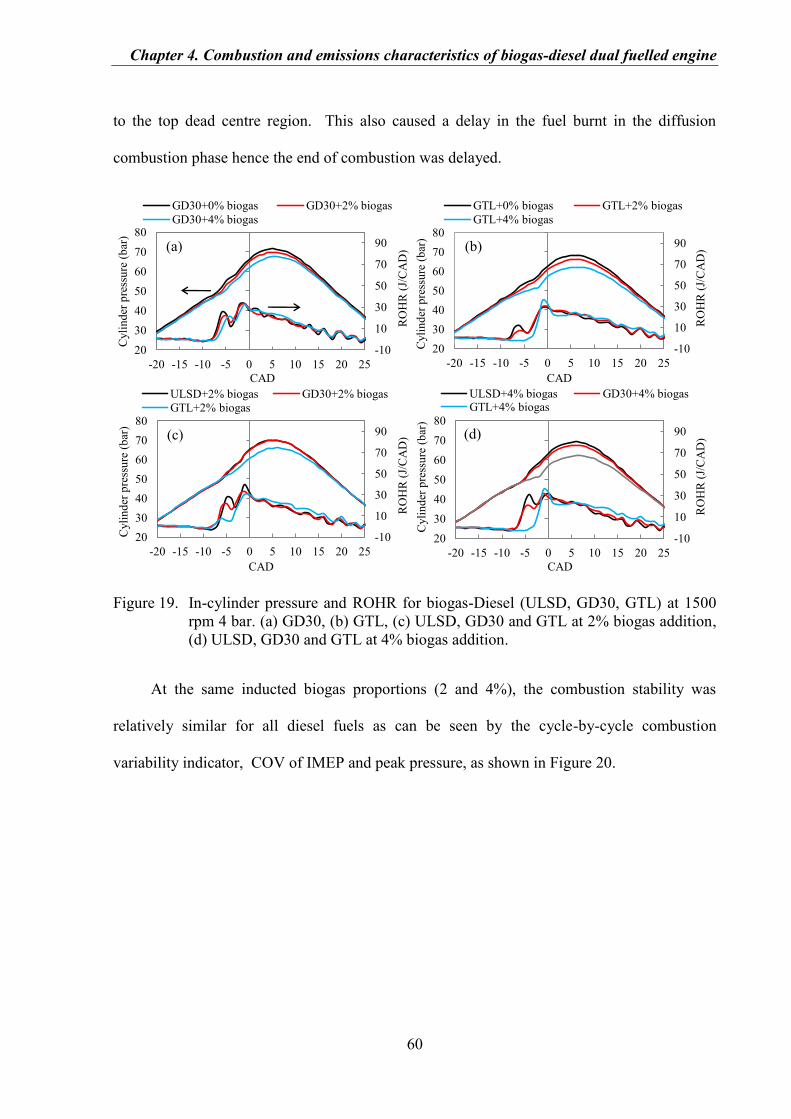
Chapter 4. Combustion and emissions characteristics of biogas-diesel dual fuelled engine
60
to the top dead centre region. This also caused a delay in the fuel burnt in the diffusion
combustion phase hence the end of combustion was delayed.
Figure 19. In-cylinder pressure and ROHR for biogas-Diesel (ULSD, GD30, GTL) at 1500
rpm 4 bar. (a) GD30, (b) GTL, (c) ULSD, GD30 and GTL at 2% biogas addition,
(d) ULSD, GD30 and GTL at 4% biogas addition.
At the same inducted biogas proportions (2 and 4%), the combustion stability was
relatively similar for all diesel fuels as can be seen by the cycle-by-cycle combustion
variability indicator, COV of IMEP and peak pressure, as shown in Figure 20.
-10
10
30
50
70
90
20
30
40
50
60
70
80
-20 -15 -10 -5 0 5 10 15 20 25
RO
HR
(J/
CA
D)
Cyli
nd
er p
ress
ure
(b
ar)
CAD
GD30+0% biogas GD30+2% biogas
GD30+4% biogas
(a)
-10
10
30
50
70
90
20
30
40
50
60
70
80
-20 -15 -10 -5 0 5 10 15 20 25
RO
HR
(J/
CA
D)
Cyli
nd
er p
ress
ure
(b
ar)
CAD
GTL+0% biogas GTL+2% biogas
GTL+4% biogas
(b)
-10
10
30
50
70
90
20
30
40
50
60
70
80
-20 -15 -10 -5 0 5 10 15 20 25
RO
HR
(J/
CA
D)
Cyli
nd
er p
ress
ure
(b
ar)
CAD
ULSD+2% biogas GD30+2% biogas
GTL+2% biogas
(c)
-10
10
30
50
70
90
20
30
40
50
60
70
80
-20 -15 -10 -5 0 5 10 15 20 25
RO
HR
(J/
CA
D)
Cyli
nd
er p
ress
ure
(b
ar)
CAD
ULSD+4% biogas GD30+4% biogas GTL+4% biogas
(d)
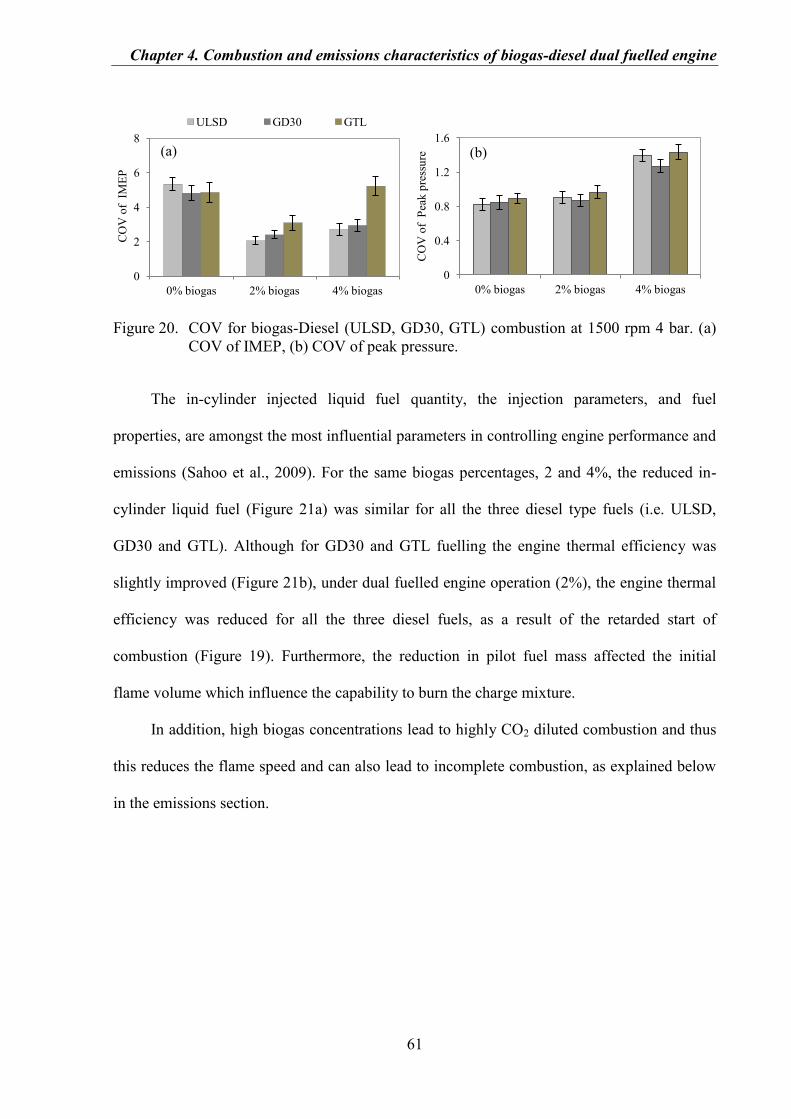
Chapter 4. Combustion and emissions characteristics of biogas-diesel dual fuelled engine
61
Figure 20. COV for biogas-Diesel (ULSD, GD30, GTL) combustion at 1500 rpm 4 bar. (a)
COV of IMEP, (b) COV of peak pressure.
The in-cylinder injected liquid fuel quantity, the injection parameters, and fuel
properties, are amongst the most influential parameters in controlling engine performance and
emissions (Sahoo et al., 2009). For the same biogas percentages, 2 and 4%, the reduced in-
cylinder liquid fuel (Figure 21a) was similar for all the three diesel type fuels (i.e. ULSD,
GD30 and GTL). Although for GD30 and GTL fuelling the engine thermal efficiency was
slightly improved (Figure 21b), under dual fuelled engine operation (2%), the engine thermal
efficiency was reduced for all the three diesel fuels, as a result of the retarded start of
combustion (Figure 19). Furthermore, the reduction in pilot fuel mass affected the initial
flame volume which influence the capability to burn the charge mixture.
In addition, high biogas concentrations lead to highly CO2 diluted combustion and thus
this reduces the flame speed and can also lead to incomplete combustion, as explained below
in the emissions section.
0
2
4
6
8
0% biogas 2% biogas 4% biogas
CO
V o
f I
ME
P
ULSD GD30 GTL
(a)
0
0.4
0.8
1.2
1.6
0% biogas 2% biogas 4% biogas
CO
V o
f P
eak p
ress
ure
(b)
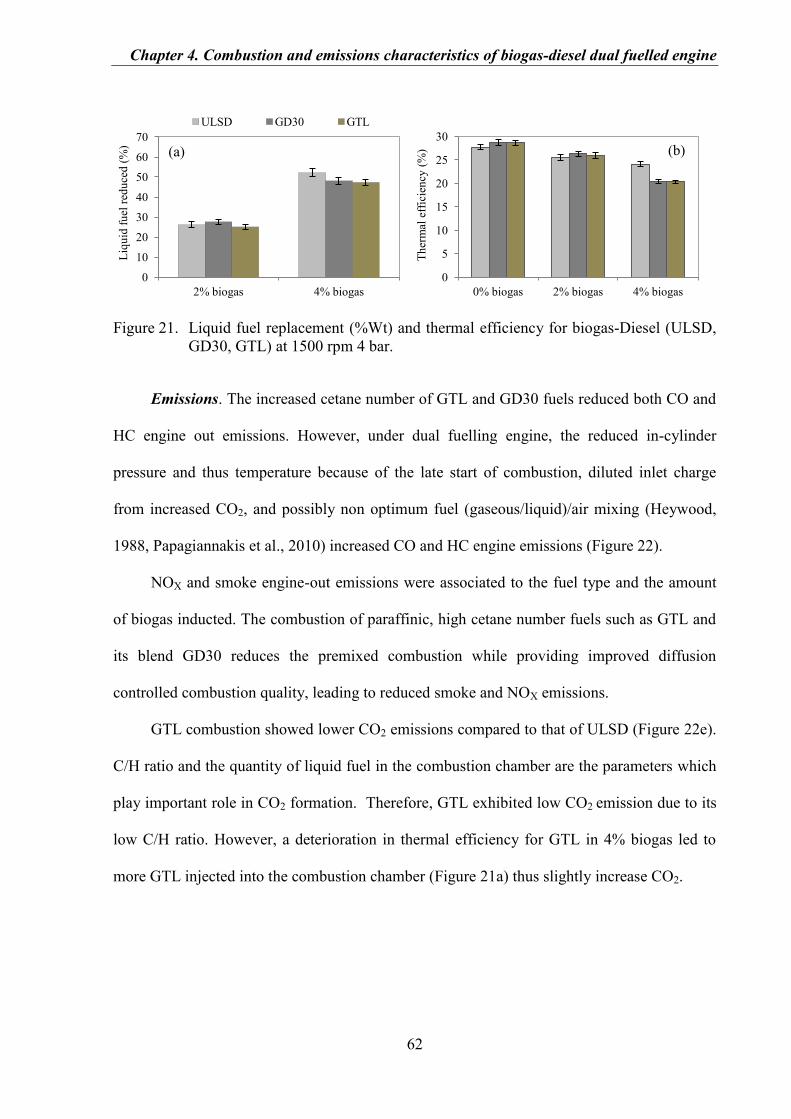
Chapter 4. Combustion and emissions characteristics of biogas-diesel dual fuelled engine
62
Figure 21. Liquid fuel replacement (%Wt) and thermal efficiency for biogas-Diesel (ULSD,
GD30, GTL) at 1500 rpm 4 bar.
Emissions. The increased cetane number of GTL and GD30 fuels reduced both CO and
HC engine out emissions. However, under dual fuelling engine, the reduced in-cylinder
pressure and thus temperature because of the late start of combustion, diluted inlet charge
from increased CO2, and possibly non optimum fuel (gaseous/liquid)/air mixing (Heywood,
1988, Papagiannakis et al., 2010) increased CO and HC engine emissions (Figure 22).
NOX and smoke engine-out emissions were associated to the fuel type and the amount
of biogas inducted. The combustion of paraffinic, high cetane number fuels such as GTL and
its blend GD30 reduces the premixed combustion while providing improved diffusion
controlled combustion quality, leading to reduced smoke and NOX emissions.
GTL combustion showed lower CO2 emissions compared to that of ULSD (Figure 22e).
C/H ratio and the quantity of liquid fuel in the combustion chamber are the parameters which
play important role in CO2 formation. Therefore, GTL exhibited low CO2 emission due to its
low C/H ratio. However, a deterioration in thermal efficiency for GTL in 4% biogas led to
more GTL injected into the combustion chamber (Figure 21a) thus slightly increase CO2.
0
10
20
30
40
50
60
70
2% biogas 4% biogas
Liq
uid
fu
el r
edu
ced
(%
) ULSD GD30 GTL
(a)
0
5
10
15
20
25
30
0% biogas 2% biogas 4% biogas
Th
erm
al e
ffic
ien
cy (
%) (b)
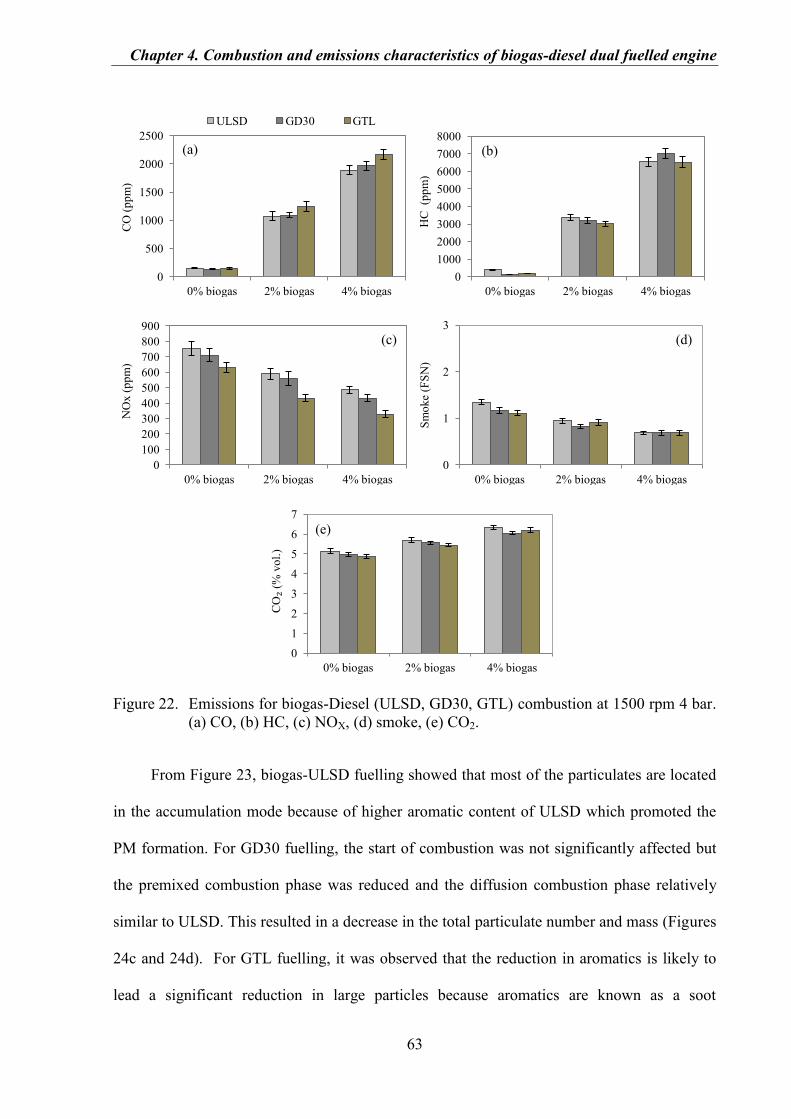
Chapter 4. Combustion and emissions characteristics of biogas-diesel dual fuelled engine
63
Figure 22. Emissions for biogas-Diesel (ULSD, GD30, GTL) combustion at 1500 rpm 4 bar.
(a) CO, (b) HC, (c) NOX, (d) smoke, (e) CO2.
From Figure 23, biogas-ULSD fuelling showed that most of the particulates are located
in the accumulation mode because of higher aromatic content of ULSD which promoted the
PM formation. For GD30 fuelling, the start of combustion was not significantly affected but
the premixed combustion phase was reduced and the diffusion combustion phase relatively
similar to ULSD. This resulted in a decrease in the total particulate number and mass (Figures
24c and 24d). For GTL fuelling, it was observed that the reduction in aromatics is likely to
lead a significant reduction in large particles because aromatics are known as a soot
0
500
1000
1500
2000
2500
0% biogas 2% biogas 4% biogas
CO
(p
pm
) ULSD GD30 GTL
(a)
0
1000
2000
3000
4000
5000
6000
7000
8000
0% biogas 2% biogas 4% biogas
HC
(p
pm
)
(b)
0
100
200
300
400
500
600
700
800
900
0% biogas 2% biogas 4% biogas
NO
x (
pp
m)
(c)
0
1
2
3
0% biogas 2% biogas 4% biogas
Sm
oke
(FS
N)
(d)
0
1
2
3
4
5
6
7
0% biogas 2% biogas 4% biogas
CO₂
(% v
ol.
)
(e)
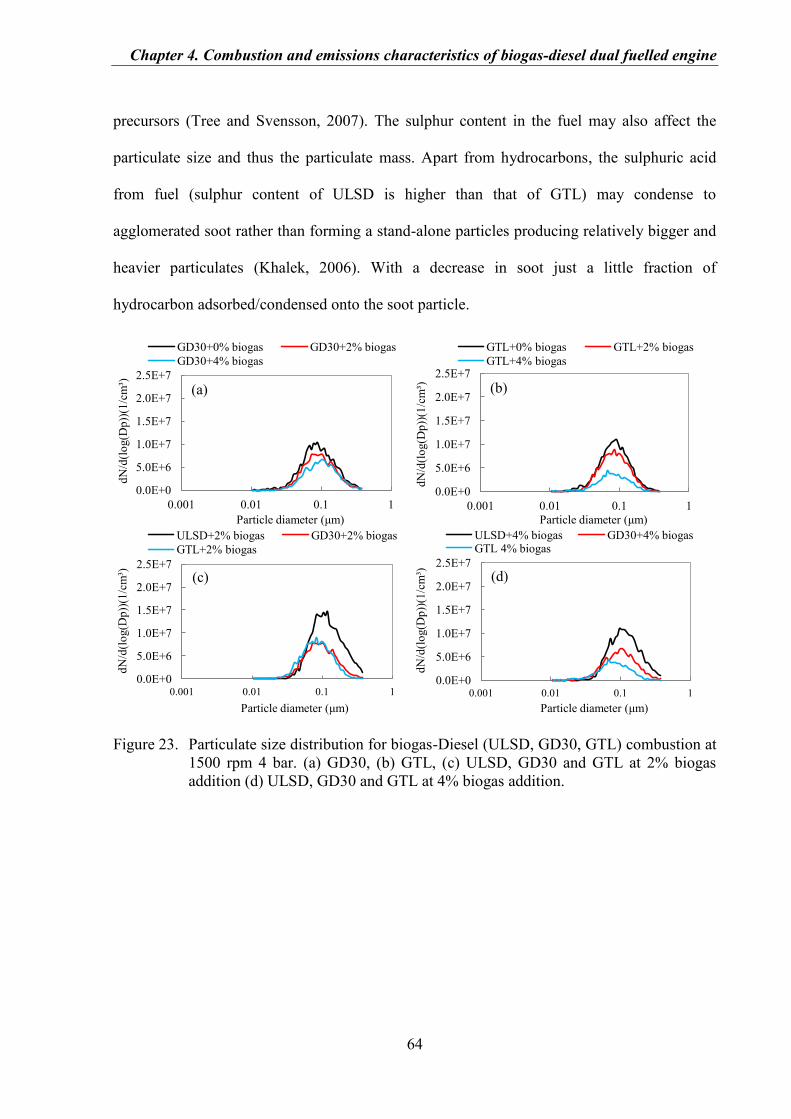
Chapter 4. Combustion and emissions characteristics of biogas-diesel dual fuelled engine
64
precursors (Tree and Svensson, 2007). The sulphur content in the fuel may also affect the
particulate size and thus the particulate mass. Apart from hydrocarbons, the sulphuric acid
from fuel (sulphur content of ULSD is higher than that of GTL) may condense to
agglomerated soot rather than forming a stand-alone particles producing relatively bigger and
heavier particulates (Khalek, 2006). With a decrease in soot just a little fraction of
hydrocarbon adsorbed/condensed onto the soot particle.
Figure 23. Particulate size distribution for biogas-Diesel (ULSD, GD30, GTL) combustion at
1500 rpm 4 bar. (a) GD30, (b) GTL, (c) ULSD, GD30 and GTL at 2% biogas
addition (d) ULSD, GD30 and GTL at 4% biogas addition.
0.0E+0
5.0E+6
1.0E+7
1.5E+7
2.0E+7
2.5E+7
0.001 0.01 0.1 1
dN
/d(l
og(D
p))
(1/c
m³)
Particle diameter (μm)
GD30+0% biogas GD30+2% biogas
GD30+4% biogas
(a)
0.0E+0
5.0E+6
1.0E+7
1.5E+7
2.0E+7
2.5E+7
0.001 0.01 0.1 1
dN
/d(l
og(D
p))
(1/c
m³)
Particle diameter (μm)
GTL+0% biogas GTL+2% biogas
GTL+4% biogas
(b)
0.0E+0
5.0E+6
1.0E+7
1.5E+7
2.0E+7
2.5E+7
0.001 0.01 0.1 1
dN
/d(l
og(D
p))
(1/c
m³)
Particle diameter (μm)
ULSD+2% biogas GD30+2% biogas
GTL+2% biogas
(c)
0.0E+0
5.0E+6
1.0E+7
1.5E+7
2.0E+7
2.5E+7
0.001 0.01 0.1 1
dN
/d(l
og(D
p))
(1/c
m³)
Particle diameter (μm)
ULSD+4% biogas GD30+4% biogas GTL 4% biogas
(d)
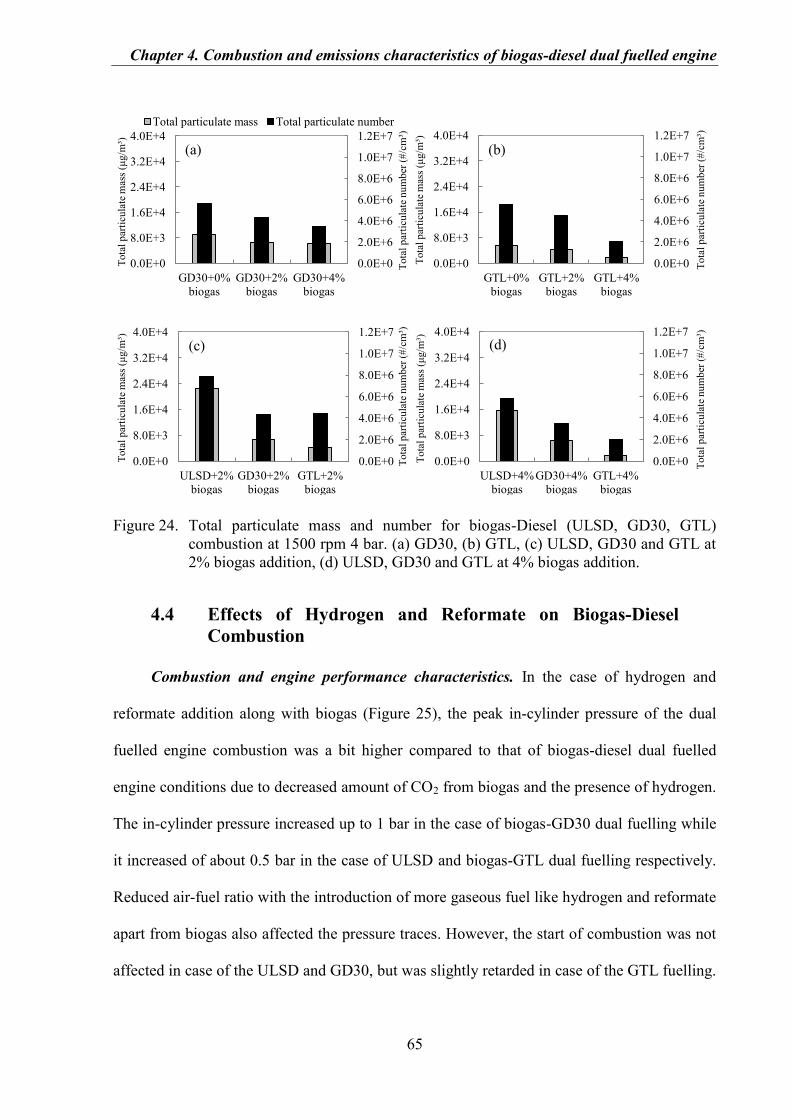
Chapter 4. Combustion and emissions characteristics of biogas-diesel dual fuelled engine
65
Figure 24. Total particulate mass and number for biogas-Diesel (ULSD, GD30, GTL)
combustion at 1500 rpm 4 bar. (a) GD30, (b) GTL, (c) ULSD, GD30 and GTL at
2% biogas addition, (d) ULSD, GD30 and GTL at 4% biogas addition.
4.4 Effects of Hydrogen and Reformate on Biogas-Diesel
Combustion
Combustion and engine performance characteristics. In the case of hydrogen and
reformate addition along with biogas (Figure 25), the peak in-cylinder pressure of the dual
fuelled engine combustion was a bit higher compared to that of biogas-diesel dual fuelled
engine conditions due to decreased amount of CO2 from biogas and the presence of hydrogen.
The in-cylinder pressure increased up to 1 bar in the case of biogas-GD30 dual fuelling while
it increased of about 0.5 bar in the case of ULSD and biogas-GTL dual fuelling respectively.
Reduced air-fuel ratio with the introduction of more gaseous fuel like hydrogen and reformate
apart from biogas also affected the pressure traces. However, the start of combustion was not
affected in case of the ULSD and GD30, but was slightly retarded in case of the GTL fuelling.
0.0E+0
2.0E+6
4.0E+6
6.0E+6
8.0E+6
1.0E+7
1.2E+7
0.0E+0
8.0E+3
1.6E+4
2.4E+4
3.2E+4
4.0E+4
GD30+0%
biogas
GD30+2%
biogas
GD30+4%
biogas
Tota
l p
arti
cula
te n
um
ber
(#
/cm
³)
Tota
l p
arti
cula
te m
ass
(μg/m
³)
Total particulate mass Total particulate number
(a)
0.0E+0
2.0E+6
4.0E+6
6.0E+6
8.0E+6
1.0E+7
1.2E+7
0.0E+0
8.0E+3
1.6E+4
2.4E+4
3.2E+4
4.0E+4
GTL+0%
biogas
GTL+2%
biogas
GTL+4%
biogas
Tota
l p
arti
cula
te n
um
ber
(#
/cm
³)
Tota
l p
arti
cula
te m
ass
(μg/m
³)
(b)
0.0E+0
2.0E+6
4.0E+6
6.0E+6
8.0E+6
1.0E+7
1.2E+7
0.0E+0
8.0E+3
1.6E+4
2.4E+4
3.2E+4
4.0E+4
ULSD+2%
biogas
GD30+2%
biogas
GTL+2%
biogas
Tota
l p
arti
cula
te n
um
ber
(#
/cm
³)
Tota
l p
arti
cula
te m
ass
(μg/m
³)
(c)
0.0E+0
2.0E+6
4.0E+6
6.0E+6
8.0E+6
1.0E+7
1.2E+7
0.0E+0
8.0E+3
1.6E+4
2.4E+4
3.2E+4
4.0E+4
ULSD+4%
biogas
GD30+4%
biogas
GTL+4%
biogas
Tota
l p
arti
cula
te n
um
ber
(#
/cm
³)
Tota
l p
arti
cula
te m
ass
(μg/m
³)
(d)
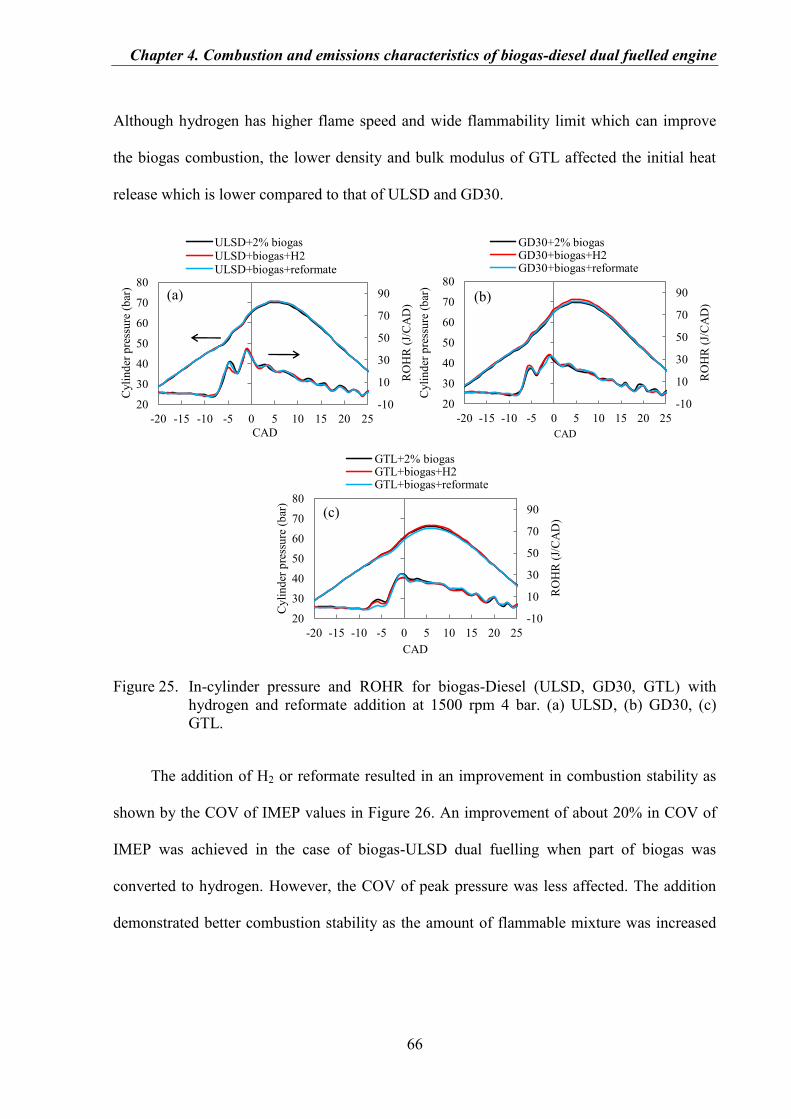
Chapter 4. Combustion and emissions characteristics of biogas-diesel dual fuelled engine
66
Although hydrogen has higher flame speed and wide flammability limit which can improve
the biogas combustion, the lower density and bulk modulus of GTL affected the initial heat
release which is lower compared to that of ULSD and GD30.
Figure 25. In-cylinder pressure and ROHR for biogas-Diesel (ULSD, GD30, GTL) with
hydrogen and reformate addition at 1500 rpm 4 bar. (a) ULSD, (b) GD30, (c)
GTL.
The addition of H2 or reformate resulted in an improvement in combustion stability as
shown by the COV of IMEP values in Figure 26. An improvement of about 20% in COV of
IMEP was achieved in the case of biogas-ULSD dual fuelling when part of biogas was
converted to hydrogen. However, the COV of peak pressure was less affected. The addition
demonstrated better combustion stability as the amount of flammable mixture was increased
-10
10
30
50
70
90
20
30
40
50
60
70
80
-20 -15 -10 -5 0 5 10 15 20 25
RO
HR
(J/
CA
D)
Cyli
nd
er p
ress
ure
(b
ar)
CAD
ULSD+2% biogas ULSD+biogas+H2 ULSD+biogas+reformate
(a)
-10
10
30
50
70
90
20
30
40
50
60
70
80
-20 -15 -10 -5 0 5 10 15 20 25
RO
HR
(J/
CA
D)
Cyli
nd
er p
ress
ure
(b
ar)
CAD
GD30+2% biogas GD30+biogas+H2 GD30+biogas+reformate
(b)
-10
10
30
50
70
90
20
30
40
50
60
70
80
-20 -15 -10 -5 0 5 10 15 20 25
RO
HR
(J/
CA
D)
Cyli
nd
er p
ress
ure
(b
ar)
CAD
GTL+2% biogas GTL+biogas+H2 GTL+biogas+reformate
(c)
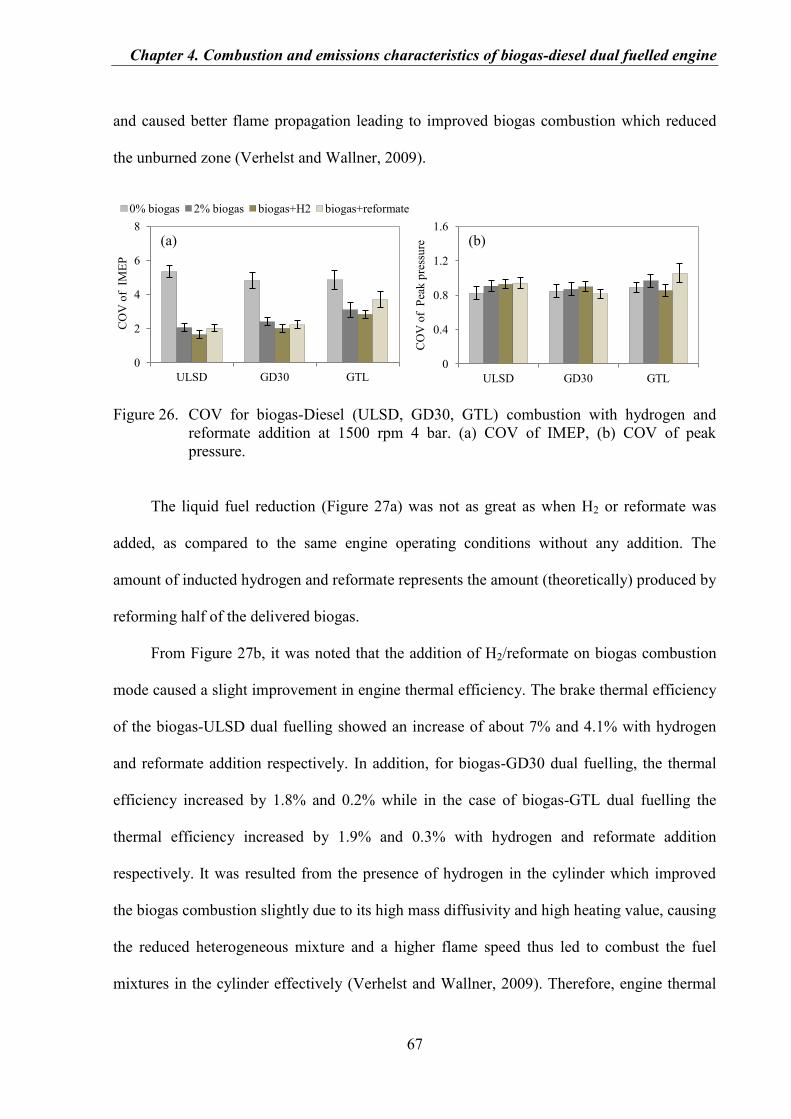
Chapter 4. Combustion and emissions characteristics of biogas-diesel dual fuelled engine
67
and caused better flame propagation leading to improved biogas combustion which reduced
the unburned zone (Verhelst and Wallner, 2009).
Figure 26. COV for biogas-Diesel (ULSD, GD30, GTL) combustion with hydrogen and
reformate addition at 1500 rpm 4 bar. (a) COV of IMEP, (b) COV of peak
pressure.
The liquid fuel reduction (Figure 27a) was not as great as when H2 or reformate was
added, as compared to the same engine operating conditions without any addition. The
amount of inducted hydrogen and reformate represents the amount (theoretically) produced by
reforming half of the delivered biogas.
From Figure 27b, it was noted that the addition of H2/reformate on biogas combustion
mode caused a slight improvement in engine thermal efficiency. The brake thermal efficiency
of the biogas-ULSD dual fuelling showed an increase of about 7% and 4.1% with hydrogen
and reformate addition respectively. In addition, for biogas-GD30 dual fuelling, the thermal
efficiency increased by 1.8% and 0.2% while in the case of biogas-GTL dual fuelling the
thermal efficiency increased by 1.9% and 0.3% with hydrogen and reformate addition
respectively. It was resulted from the presence of hydrogen in the cylinder which improved
the biogas combustion slightly due to its high mass diffusivity and high heating value, causing
the reduced heterogeneous mixture and a higher flame speed thus led to combust the fuel
mixtures in the cylinder effectively (Verhelst and Wallner, 2009). Therefore, engine thermal
0
2
4
6
8
ULSD GD30 GTL
CO
V o
f I
ME
P
0% biogas 2% biogas biogas+H2 biogas+reformate
(a)
0
0.4
0.8
1.2
1.6
ULSD GD30 GTL
CO
V o
f P
eak p
ress
ure
(b)
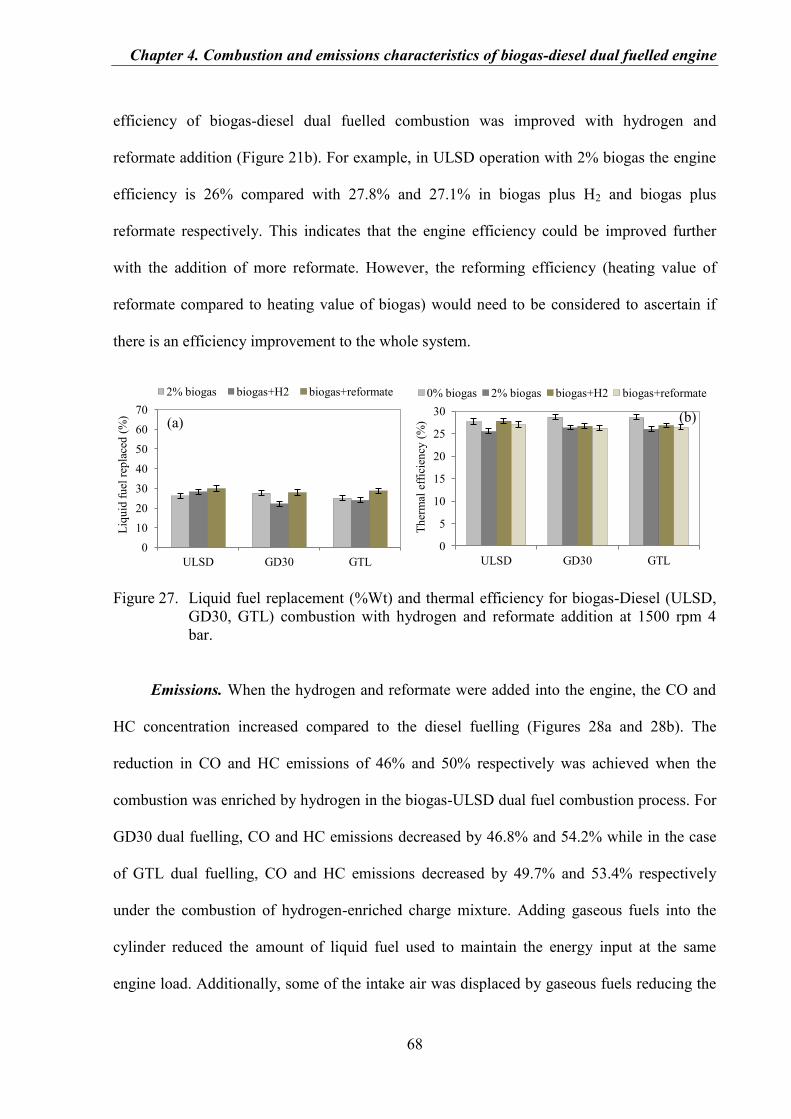
Chapter 4. Combustion and emissions characteristics of biogas-diesel dual fuelled engine
68
efficiency of biogas-diesel dual fuelled combustion was improved with hydrogen and
reformate addition (Figure 21b). For example, in ULSD operation with 2% biogas the engine
efficiency is 26% compared with 27.8% and 27.1% in biogas plus H2 and biogas plus
reformate respectively. This indicates that the engine efficiency could be improved further
with the addition of more reformate. However, the reforming efficiency (heating value of
reformate compared to heating value of biogas) would need to be considered to ascertain if
there is an efficiency improvement to the whole system.
Figure 27. Liquid fuel replacement (%Wt) and thermal efficiency for biogas-Diesel (ULSD,
GD30, GTL) combustion with hydrogen and reformate addition at 1500 rpm 4
bar.
Emissions. When the hydrogen and reformate were added into the engine, the CO and
HC concentration increased compared to the diesel fuelling (Figures 28a and 28b). The
reduction in CO and HC emissions of 46% and 50% respectively was achieved when the
combustion was enriched by hydrogen in the biogas-ULSD dual fuel combustion process. For
GD30 dual fuelling, CO and HC emissions decreased by 46.8% and 54.2% while in the case
of GTL dual fuelling, CO and HC emissions decreased by 49.7% and 53.4% respectively
under the combustion of hydrogen-enriched charge mixture. Adding gaseous fuels into the
cylinder reduced the amount of liquid fuel used to maintain the energy input at the same
engine load. Additionally, some of the intake air was displaced by gaseous fuels reducing the
0
10
20
30
40
50
60
70
ULSD GD30 GTL
Liq
uid
fu
el r
epla
ced
(%
)
2% biogas biogas+H2 biogas+reformate
(a)
0
5
10
15
20
25
30
ULSD GD30 GTL
Th
erm
al e
ffic
ien
cy (
%)
0% biogas 2% biogas biogas+H2 biogas+reformate
(b)
Chapter 4. Combustion and emissions characteristics of biogas-diesel dual fuelled engine
69
cylinder average air-fuel ratio. This condition favoured slower and incomplete combustion
and increased the engine exhaust hydrocarbon. However, hydrogen and reformate addition
improved the emissions achieved on the operation with biogas alone, and this improvement
was also obtained with GD30 and GTL. The improvement was resulted from the presence of
hydrogen and reformate which had high turbulent burning velocities, and hence promoted
higher burning intensity and better biogas-diesel fuel mixture combustion, and it was also
caused by the reduction in delivered biogas which contained CO2. On the other hand, engine
operation that contained reformate resulted in significant increase of CO emissions due to CO
addition in the intake manifold which resulted in reduced combustion efficiency, leading to
reduced in-cylinder temperature and hence CO oxidation rates.
On the other side, hydrogen and reformate addition increased the NOX emission due to
the increased in-cylinder temperature while smoke level did not change significantly
compared to biogas alone (Figures 28c and 28d). Lower minimum ignition energy, and the
higher adiabatic flame temperature of hydrogen compared to biogas which tended to
accelerate the development of flame point to high NOX emission but keeps the smoke levels
constant (Verhelst and Wallner, 2009, Rakopoulos et al., 2009).
As shown in Figure 28e, CO2 reduced significantly with the hydrogen addition even
lower compared to that of baseline condition (0% biogas). The reduction of 3.7%, 2.2%, and
2% was achieved for ULSD, GD30, and GTL respectively. The replacement of biogas and
ULSD with hydrogen is the main reason for the reduction. This is because hydrogen is a non
carbon compound. However, CO2 increased as CO is present in the reformate. Apart from the
deterioration in the combustion process as CO suppresses the benefit characteristics of
hydrogen, it also might be attributed to the reaction of CO with oxygen to produce CO2
according to the chemical reaction CO + 1/2O2 CO2.
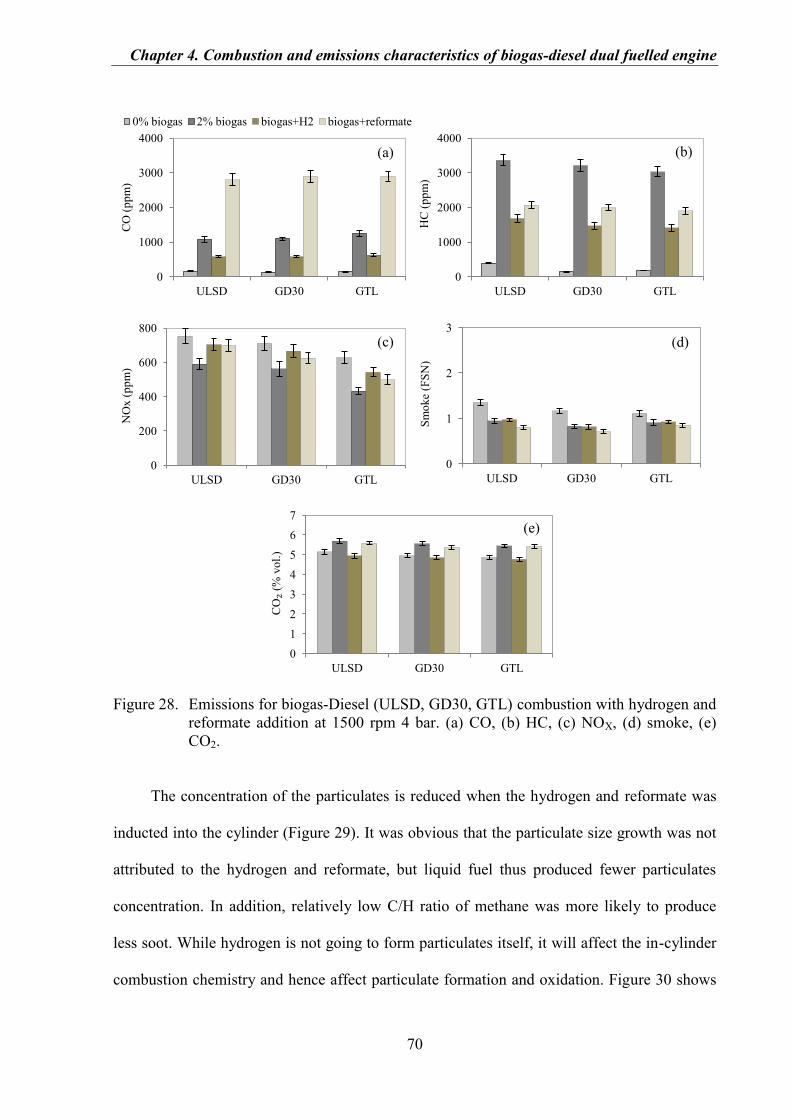
Chapter 4. Combustion and emissions characteristics of biogas-diesel dual fuelled engine
70
Figure 28. Emissions for biogas-Diesel (ULSD, GD30, GTL) combustion with hydrogen and
reformate addition at 1500 rpm 4 bar. (a) CO, (b) HC, (c) NOX, (d) smoke, (e)
CO2.
The concentration of the particulates is reduced when the hydrogen and reformate was
inducted into the cylinder (Figure 29). It was obvious that the particulate size growth was not
attributed to the hydrogen and reformate, but liquid fuel thus produced fewer particulates
concentration. In addition, relatively low C/H ratio of methane was more likely to produce
less soot. While hydrogen is not going to form particulates itself, it will affect the in-cylinder
combustion chemistry and hence affect particulate formation and oxidation. Figure 30 shows
0
1000
2000
3000
4000
ULSD GD30 GTL
CO
(p
pm
) 0% biogas 2% biogas biogas+H2 biogas+reformate
(a)
0
1000
2000
3000
4000
ULSD GD30 GTL
HC
(p
pm
)
(b)
0
200
400
600
800
ULSD GD30 GTL
NO
x (
pp
m)
(c)
0
1
2
3
ULSD GD30 GTL
Sm
oke
(FS
N)
(d)
0
1
2
3
4
5
6
7
ULSD GD30 GTL
CO₂
(% v
ol.
)
(e)
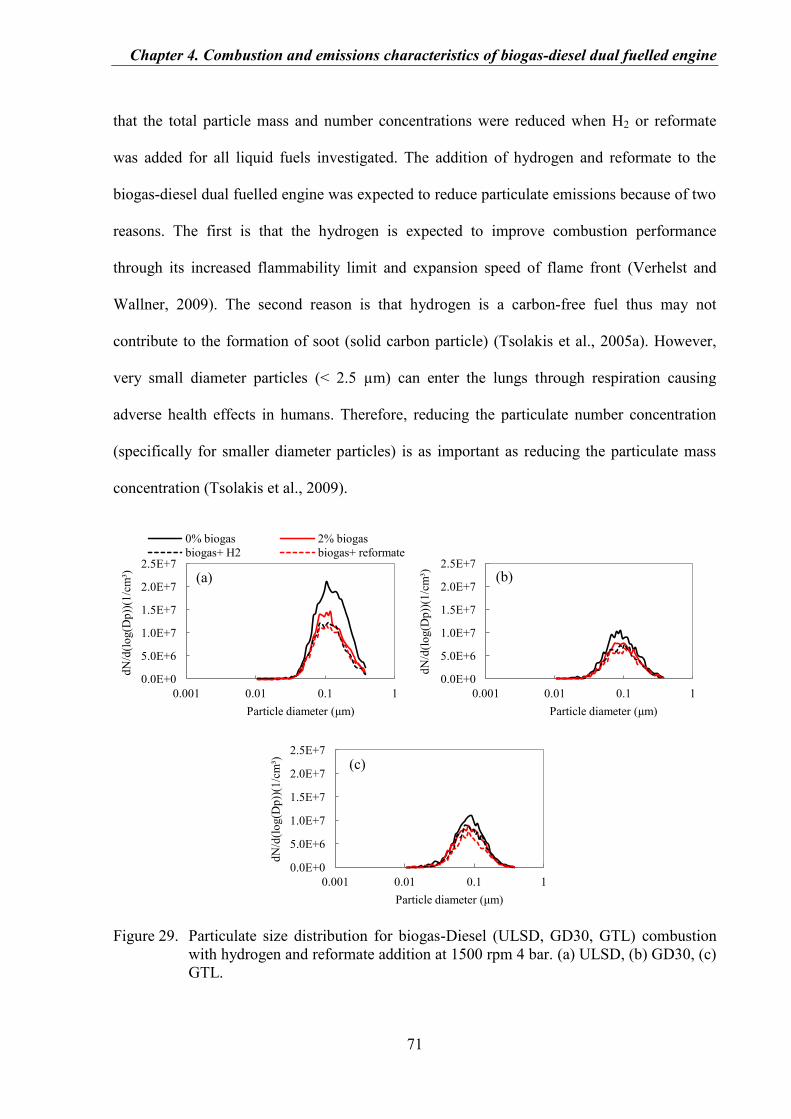
Chapter 4. Combustion and emissions characteristics of biogas-diesel dual fuelled engine
71
that the total particle mass and number concentrations were reduced when H2 or reformate
was added for all liquid fuels investigated. The addition of hydrogen and reformate to the
biogas-diesel dual fuelled engine was expected to reduce particulate emissions because of two
reasons. The first is that the hydrogen is expected to improve combustion performance
through its increased flammability limit and expansion speed of flame front (Verhelst and
Wallner, 2009). The second reason is that hydrogen is a carbon-free fuel thus may not
contribute to the formation of soot (solid carbon particle) (Tsolakis et al., 2005a). However,
very small diameter particles (< 2.5 µm) can enter the lungs through respiration causing
adverse health effects in humans. Therefore, reducing the particulate number concentration
(specifically for smaller diameter particles) is as important as reducing the particulate mass
concentration (Tsolakis et al., 2009).
Figure 29. Particulate size distribution for biogas-Diesel (ULSD, GD30, GTL) combustion
with hydrogen and reformate addition at 1500 rpm 4 bar. (a) ULSD, (b) GD30, (c)
GTL.
0.0E+0
5.0E+6
1.0E+7
1.5E+7
2.0E+7
2.5E+7
0.001 0.01 0.1 1
dN
/d(l
og(D
p))
(1/c
m³)
Particle diameter (μm)
0% biogas 2% biogas
biogas+ H2 biogas+ reformate
(a)
0.0E+0
5.0E+6
1.0E+7
1.5E+7
2.0E+7
2.5E+7
0.001 0.01 0.1 1
dN
/d(l
og(D
p))
(1/c
m³)
Particle diameter (μm)
(b)
0.0E+0
5.0E+6
1.0E+7
1.5E+7
2.0E+7
2.5E+7
0.001 0.01 0.1 1
dN
/d(l
og(D
p))
(1/c
m³)
Particle diameter (μm)
(c)
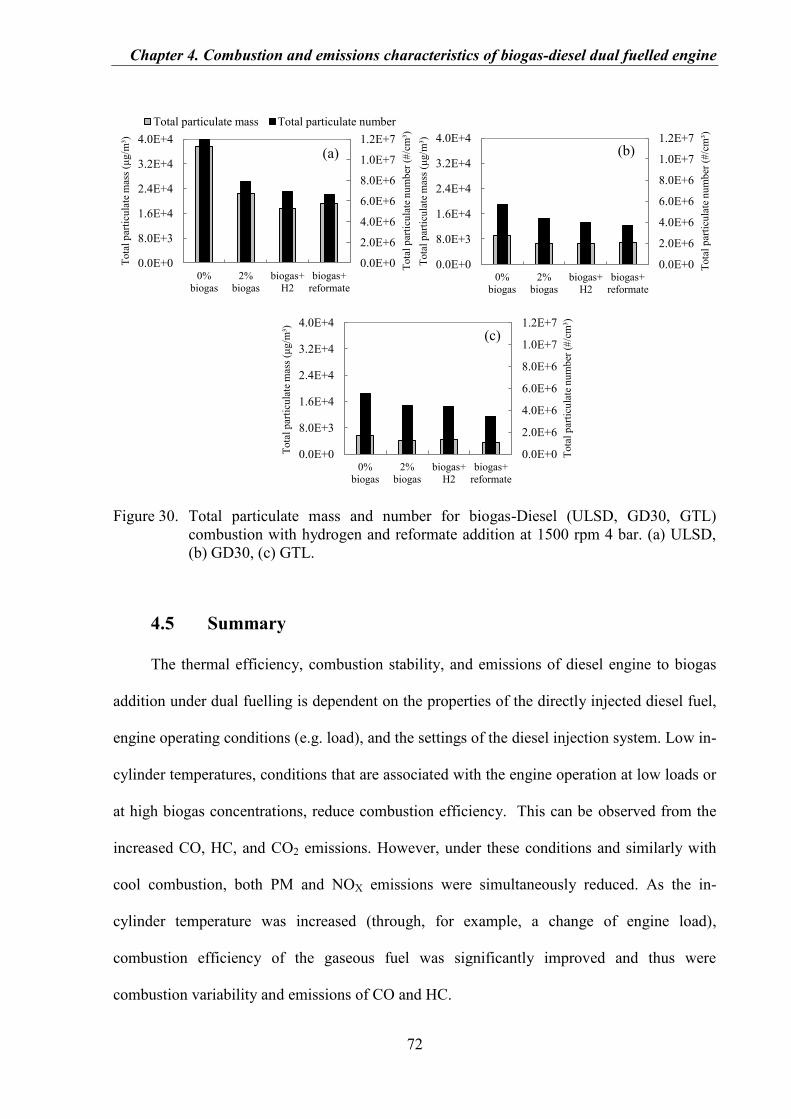
Chapter 4. Combustion and emissions characteristics of biogas-diesel dual fuelled engine
72
Figure 30. Total particulate mass and number for biogas-Diesel (ULSD, GD30, GTL)
combustion with hydrogen and reformate addition at 1500 rpm 4 bar. (a) ULSD,
(b) GD30, (c) GTL.
4.5 Summary
The thermal efficiency, combustion stability, and emissions of diesel engine to biogas
addition under dual fuelling is dependent on the properties of the directly injected diesel fuel,
engine operating conditions (e.g. load), and the settings of the diesel injection system. Low in-
cylinder temperatures, conditions that are associated with the engine operation at low loads or
at high biogas concentrations, reduce combustion efficiency. This can be observed from the
increased CO, HC, and CO2 emissions. However, under these conditions and similarly with
cool combustion, both PM and NOX emissions were simultaneously reduced. As the in-
cylinder temperature was increased (through, for example, a change of engine load),
combustion efficiency of the gaseous fuel was significantly improved and thus were
combustion variability and emissions of CO and HC.
0.0E+0
2.0E+6
4.0E+6
6.0E+6
8.0E+6
1.0E+7
1.2E+7
0.0E+0
8.0E+3
1.6E+4
2.4E+4
3.2E+4
4.0E+4
0%
biogas
2%
biogas
biogas+
H2
biogas+
reformate
Tota
l p
arti
cula
te n
um
ber
(#
/cm
³)
Tota
l p
arti
cula
te m
ass
(μg/m
³)
Total particulate mass Total particulate number
(a)
0.0E+0
2.0E+6
4.0E+6
6.0E+6
8.0E+6
1.0E+7
1.2E+7
0.0E+0
8.0E+3
1.6E+4
2.4E+4
3.2E+4
4.0E+4
0%
biogas
2%
biogas
biogas+
H2
biogas+
reformate
Tota
l p
arti
cula
te n
um
ber
(#
/cm
³)
Tota
l p
arti
cula
te m
ass
(μg/m
³)
(b)
0.0E+0
2.0E+6
4.0E+6
6.0E+6
8.0E+6
1.0E+7
1.2E+7
0.0E+0
8.0E+3
1.6E+4
2.4E+4
3.2E+4
4.0E+4
0%
biogas
2%
biogas
biogas+
H2
biogas+
reformate
Tota
l p
arti
cula
te n
um
ber
(#
/cm
³)
Tota
l p
arti
cula
te m
ass
(μg/m
³)
(c)
Chapter 4. Combustion and emissions characteristics of biogas-diesel dual fuelled engine
73
Under dual fuelling, the physical (e.g. density) and chemical (e.g. cetane number)
properties of the directly injected diesel fuel significantly altered the combustion patterns,
including the start of injection and ignition of diesel fuel, rate of heat release, and in-cylinder
pressure. Fuel injection setting adjustments (e.g. timing, injection pressure and rate) are
required in order to further explore the full potential of biogas-diesel fuelled combustion
systems. The addition of biogas caused a decrease in the thermal efficiency of diesel fuelling
due to an oxygen reduction but reformed biogas slightly increased the efficiency.
Hydrogen addition in biogas-diesel fuelling or substituting biogas with reformed biogas
(e.g. simulated H2 and CO gas, in this case) makes a small improvement in CO, HC, and CO2
emissions compared to a biogas-diesel dual fuelled engine. The lower combustion efficiency
and engine thermal efficiency of biogas-diesel dual fuelling was improved with the
application of reformed biogas. Apart from high hydrogen flame speed, the thermal efficiency
improvement was also attributed to the high diffusivity of hydrogen which allowed for a more
homogeneous air-fuel mixture.
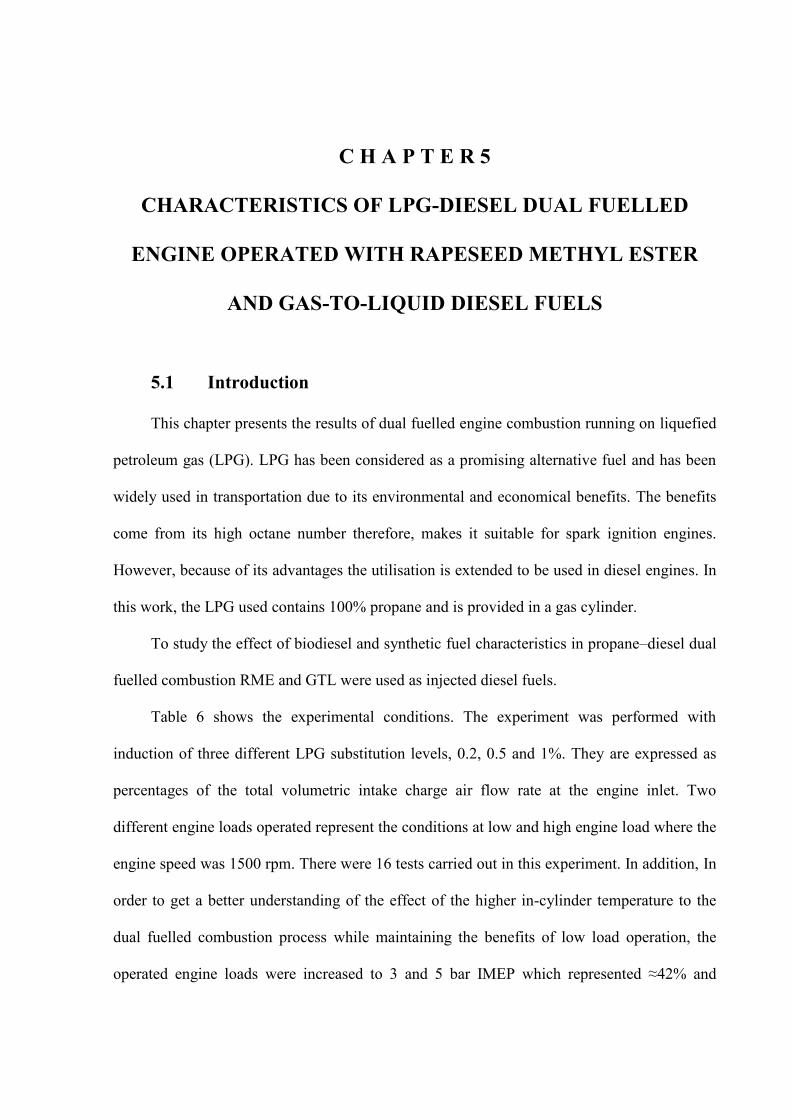
C H A P T E R 5
CHARACTERISTICS OF LPG-DIESEL DUAL FUELLED
ENGINE OPERATED WITH RAPESEED METHYL ESTER
AND GAS-TO-LIQUID DIESEL FUELS
5.1 Introduction
This chapter presents the results of dual fuelled engine combustion running on liquefied
petroleum gas (LPG). LPG has been considered as a promising alternative fuel and has been
widely used in transportation due to its environmental and economical benefits. The benefits
come from its high octane number therefore, makes it suitable for spark ignition engines.
However, because of its advantages the utilisation is extended to be used in diesel engines. In
this work, the LPG used contains 100% propane and is provided in a gas cylinder.
To study the effect of biodiesel and synthetic fuel characteristics in propane–diesel dual
fuelled combustion RME and GTL were used as injected diesel fuels.
Table 6 shows the experimental conditions. The experiment was performed with
induction of three different LPG substitution levels, 0.2, 0.5 and 1%. They are expressed as
percentages of the total volumetric intake charge air flow rate at the engine inlet. Two
different engine loads operated represent the conditions at low and high engine load where the
engine speed was 1500 rpm. There were 16 tests carried out in this experiment. In addition, In
order to get a better understanding of the effect of the higher in-cylinder temperature to the
dual fuelled combustion process while maintaining the benefits of low load operation, the
operated engine loads were increased to 3 and 5 bar IMEP which represented ≈42% and
Chapter 5. Characteristics of LPG-diesel dual fuelled engine operated with rapeseed methyl
ester and gas-to-liquid diesel fuels
75
≈71% of maximum load respectively. The experiment also was carried out to study the effect
of EGR (20% EGR). In addition, to study the change in fuel injection point, an advanced fuel
injection by 2 CAD of standard injection timing (22 CAD) was performed. Apart from soot,
SOM is also measured and the correlation with HC emission is evaluated.
Table 6. Engine operating conditions (LPG-diesel dual fuelling)
IMEP
(bar)
EGR
(%)
LPG concentration
(%)
3
0
20
0, 0.2, 0.5 and 1
0, 0.2, 0.5 and 1
5 0
20
0, 0.2, 0.5 and 1
0, 0.2, 0.5 and 1
5.2 Effect of LPG and EGR for ULSD
Combustion. Figure 31 shows the in-cylinder pressure and rate of heat release traces of
LPG-ULSD combustion for different percentages of LPG. As the LPG percentage was
increased, the start of combustion (SOC) was slightly delayed. The reasons for justifying this
delay include the low CN of LPG, the higher heat capacity of the mixture, and the lack of
oxygen, leading to a longer ignition delay (Sahoo et al., 2009). Moreover, the more LPG
concentration in the cylinder the more pronounced was the premixed combustion phase. As
LPG is inducted along with the air in the induction stroke, there is sufficient time to mix LPG
with air in the cylinder. This leads to the formation of a ready-combustible charge mixture,
which is burned in the premixed combustion phase. At low engine load, the premixed
combustion phase was dominant in dual fuel engine operation (Figure 31a). In addition, the
unburned LPG at this condition resulted in lower in-cylinder temperature. However, at high
engine load the ignition delay was shortened and the liquid fuel injection was extended
compared to the low engine load. The higher in-cylinder temperature at high engine load
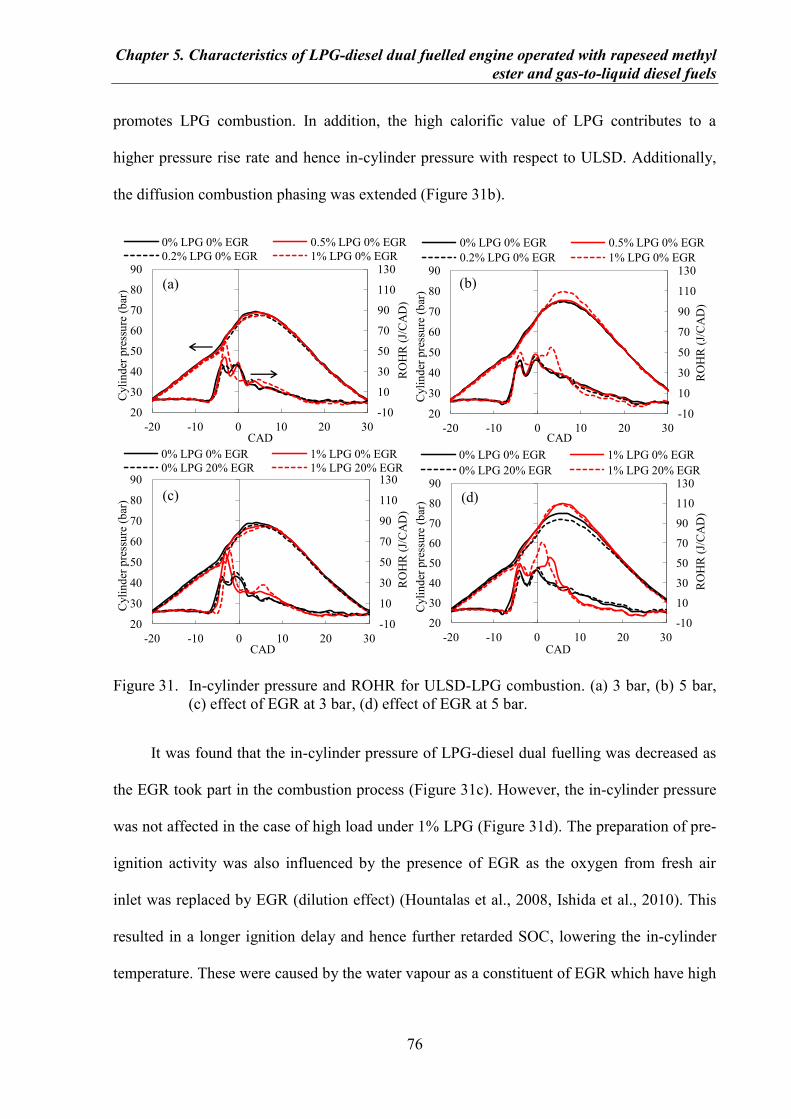
Chapter 5. Characteristics of LPG-diesel dual fuelled engine operated with rapeseed methyl
ester and gas-to-liquid diesel fuels
76
promotes LPG combustion. In addition, the high calorific value of LPG contributes to a
higher pressure rise rate and hence in-cylinder pressure with respect to ULSD. Additionally,
the diffusion combustion phasing was extended (Figure 31b).
Figure 31. In-cylinder pressure and ROHR for ULSD-LPG combustion. (a) 3 bar, (b) 5 bar,
(c) effect of EGR at 3 bar, (d) effect of EGR at 5 bar.
It was found that the in-cylinder pressure of LPG-diesel dual fuelling was decreased as
the EGR took part in the combustion process (Figure 31c). However, the in-cylinder pressure
was not affected in the case of high load under 1% LPG (Figure 31d). The preparation of pre-
ignition activity was also influenced by the presence of EGR as the oxygen from fresh air
inlet was replaced by EGR (dilution effect) (Hountalas et al., 2008, Ishida et al., 2010). This
resulted in a longer ignition delay and hence further retarded SOC, lowering the in-cylinder
temperature. These were caused by the water vapour as a constituent of EGR which have high
-10
10
30
50
70
90
110
130
20
30
40
50
60
70
80
90
-20 -10 0 10 20 30
RO
HR
(J/
CA
D)
Cyli
nd
er p
ress
ure
(b
ar)
CAD
0% LPG 0% EGR 0.5% LPG 0% EGR
0.2% LPG 0% EGR 1% LPG 0% EGR
(a)
-10
10
30
50
70
90
110
130
20
30
40
50
60
70
80
90
-20 -10 0 10 20 30
RO
HR
(J/
CA
D)
Cyli
nd
er p
ress
ure
(b
ar)
CAD
0% LPG 0% EGR 0.5% LPG 0% EGR
0.2% LPG 0% EGR 1% LPG 0% EGR
(b)
-10
10
30
50
70
90
110
130
20
30
40
50
60
70
80
90
-20 -10 0 10 20 30
RO
HR
(J/
CA
D)
Cyli
nd
er p
ress
ure
(b
ar)
CAD
0% LPG 0% EGR 1% LPG 0% EGR
0% LPG 20% EGR 1% LPG 20% EGR
(c)
-10
10
30
50
70
90
110
130
20
30
40
50
60
70
80
90
-20 -10 0 10 20 30
RO
HR
(J/
CA
D)
Cyli
nd
er p
ress
ure
(b
ar)
CAD
0% LPG 0% EGR 1% LPG 0% EGR
0% LPG 20% EGR 1% LPG 20% EGR
(d)
Chapter 5. Characteristics of LPG-diesel dual fuelled engine operated with rapeseed methyl
ester and gas-to-liquid diesel fuels
77
specific heat capacity thus acting as a heat-absorbing agent (thermal effect) (Zheng et al.,
2004, Choi et al., 2011). In addition, deterioration in combustion air availability in EGR
combined with low CN of LPG even led to longer ignition delay.
Figure 32a shows that the liquid fuel replacement increased linearly with the increase of
the inducted LPG. At low engine load and 1% LPG concentration, the amount of diesel
substituted was 60% on a mass basis. The maximum diesel substitution was achieved at low
load because the concentration of the inducted LPG was kept for the different engine loads
while the amount of injected liquid fuel was low. However, the high LPG and EGR addition
potentially raises the combustion variability and misfire as consequence of insufficient
oxidant and low CN of LPG, therefore, the concentration should be limited.
Combustion stability, which is indicated by the coefficient of variation (COV) of
indicated mean effective pressure (IMEP), was in the acceptable range (lower than 5%) in all
the tested conditions (Figure 32b) (Heywood, 1988). An increasing trend is observed with the
increase in LPG quantity, limiting the use of LPG-diesel dual fuel operation. A non-uniform
mixture may lead to unstable combustion under a high LPG fraction. A higher quantity of
LPG reduces the amount of combustion air and the in-cylinder injected diesel fuel, leading to
misfire which can produce relatively high cycle-by-cycle variation (Qi et al., 2007, Peng et
al., 2008b).
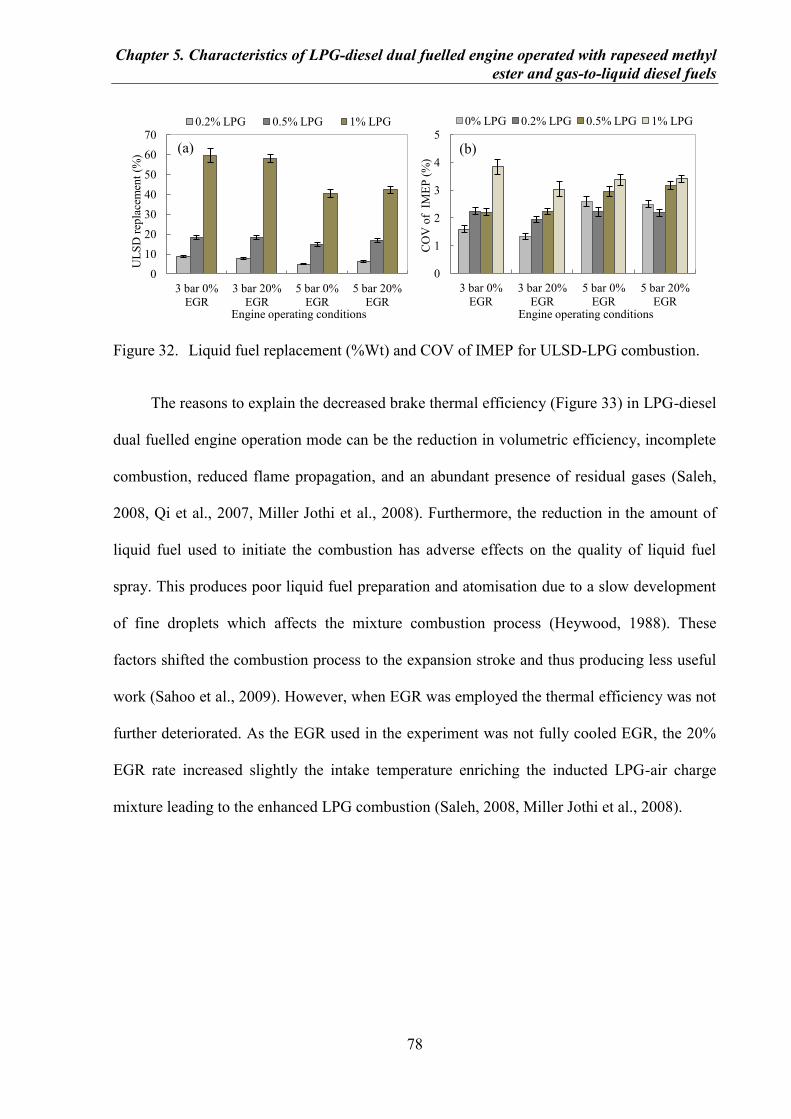
Chapter 5. Characteristics of LPG-diesel dual fuelled engine operated with rapeseed methyl
ester and gas-to-liquid diesel fuels
78
Figure 32. Liquid fuel replacement (%Wt) and COV of IMEP for ULSD-LPG combustion.
The reasons to explain the decreased brake thermal efficiency (Figure 33) in LPG-diesel
dual fuelled engine operation mode can be the reduction in volumetric efficiency, incomplete
combustion, reduced flame propagation, and an abundant presence of residual gases (Saleh,
2008, Qi et al., 2007, Miller Jothi et al., 2008). Furthermore, the reduction in the amount of
liquid fuel used to initiate the combustion has adverse effects on the quality of liquid fuel
spray. This produces poor liquid fuel preparation and atomisation due to a slow development
of fine droplets which affects the mixture combustion process (Heywood, 1988). These
factors shifted the combustion process to the expansion stroke and thus producing less useful
work (Sahoo et al., 2009). However, when EGR was employed the thermal efficiency was not
further deteriorated. As the EGR used in the experiment was not fully cooled EGR, the 20%
EGR rate increased slightly the intake temperature enriching the inducted LPG-air charge
mixture leading to the enhanced LPG combustion (Saleh, 2008, Miller Jothi et al., 2008).
0
10
20
30
40
50
60
70
3 bar 0%
EGR
3 bar 20%
EGR
5 bar 0%
EGR
5 bar 20%
EGR
UL
SD
rep
lace
men
t (%
)
Engine operating conditions
0.2% LPG 0.5% LPG 1% LPG
(a)
0
1
2
3
4
5
3 bar 0%
EGR
3 bar 20%
EGR
5 bar 0%
EGR
5 bar 20%
EGR
CO
V o
f I
ME
P (
%)
Engine operating conditions
0% LPG 0.2% LPG 0.5% LPG 1% LPG
(b)
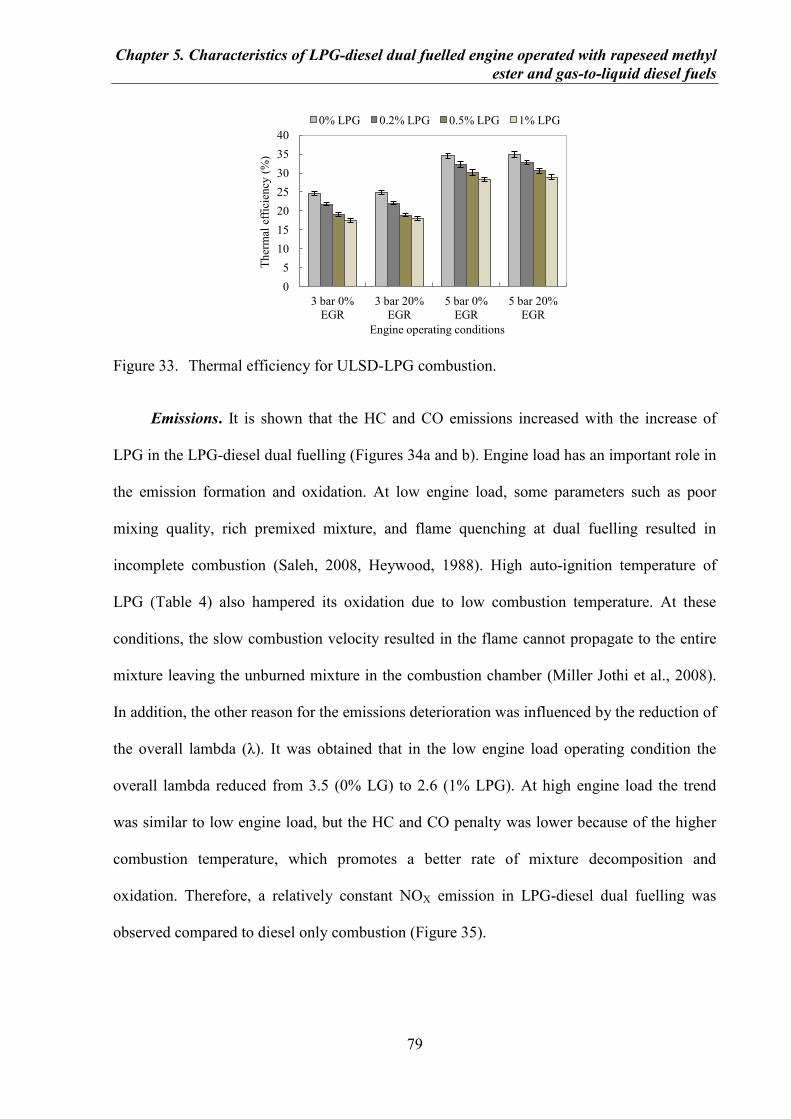
Chapter 5. Characteristics of LPG-diesel dual fuelled engine operated with rapeseed methyl
ester and gas-to-liquid diesel fuels
79
Figure 33. Thermal efficiency for ULSD-LPG combustion.
Emissions. It is shown that the HC and CO emissions increased with the increase of
LPG in the LPG-diesel dual fuelling (Figures 34a and b). Engine load has an important role in
the emission formation and oxidation. At low engine load, some parameters such as poor
mixing quality, rich premixed mixture, and flame quenching at dual fuelling resulted in
incomplete combustion (Saleh, 2008, Heywood, 1988). High auto-ignition temperature of
LPG (Table 4) also hampered its oxidation due to low combustion temperature. At these
conditions, the slow combustion velocity resulted in the flame cannot propagate to the entire
mixture leaving the unburned mixture in the combustion chamber (Miller Jothi et al., 2008).
In addition, the other reason for the emissions deterioration was influenced by the reduction of
the overall lambda (λ). It was obtained that in the low engine load operating condition the
overall lambda reduced from 3.5 (0% LG) to 2.6 (1% LPG). At high engine load the trend
was similar to low engine load, but the HC and CO penalty was lower because of the higher
combustion temperature, which promotes a better rate of mixture decomposition and
oxidation. Therefore, a relatively constant NOX emission in LPG-diesel dual fuelling was
observed compared to diesel only combustion (Figure 35).
0
5
10
15
20
25
30
35
40
3 bar 0%
EGR
3 bar 20%
EGR
5 bar 0%
EGR
5 bar 20%
EGR
Th
erm
al e
ffic
ien
cy (
%)
Engine operating conditions
0% LPG 0.2% LPG 0.5% LPG 1% LPG
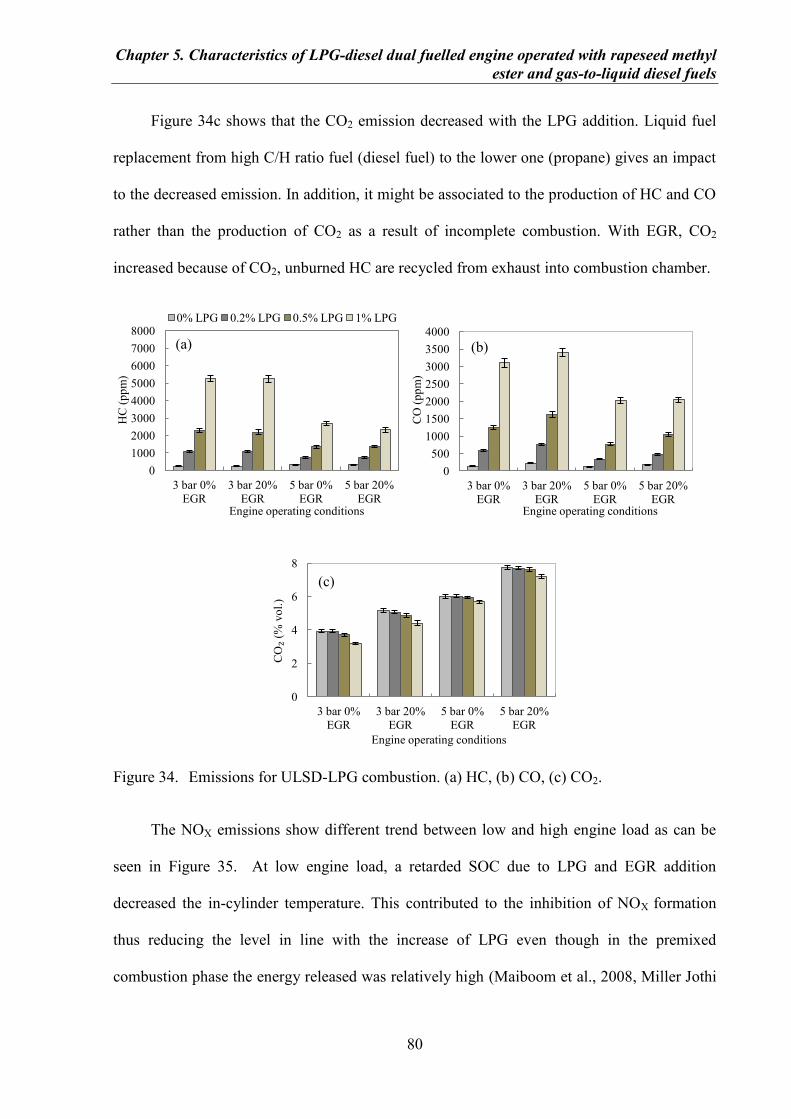
Chapter 5. Characteristics of LPG-diesel dual fuelled engine operated with rapeseed methyl
ester and gas-to-liquid diesel fuels
80
Figure 34c shows that the CO2 emission decreased with the LPG addition. Liquid fuel
replacement from high C/H ratio fuel (diesel fuel) to the lower one (propane) gives an impact
to the decreased emission. In addition, it might be associated to the production of HC and CO
rather than the production of CO2 as a result of incomplete combustion. With EGR, CO2
increased because of CO2, unburned HC are recycled from exhaust into combustion chamber.
Figure 34. Emissions for ULSD-LPG combustion. (a) HC, (b) CO, (c) CO2.
The NOX emissions show different trend between low and high engine load as can be
seen in Figure 35. At low engine load, a retarded SOC due to LPG and EGR addition
decreased the in-cylinder temperature. This contributed to the inhibition of NOX formation
thus reducing the level in line with the increase of LPG even though in the premixed
combustion phase the energy released was relatively high (Maiboom et al., 2008, Miller Jothi
0
1000
2000
3000
4000
5000
6000
7000
8000
3 bar 0%
EGR
3 bar 20%
EGR
5 bar 0%
EGR
5 bar 20%
EGR
HC
(p
pm
)
Engine operating conditions
0% LPG 0.2% LPG 0.5% LPG 1% LPG
(a)
0
500
1000
1500
2000
2500
3000
3500
4000
3 bar 0%
EGR
3 bar 20%
EGR
5 bar 0%
EGR
5 bar 20%
EGR
CO
(p
pm
)
Engine operating conditions
(b)
0
2
4
6
8
3 bar 0%
EGR
3 bar 20%
EGR
5 bar 0%
EGR
5 bar 20%
EGR
CO₂
(% v
ol.
)
Engine operating conditions
(c)
Chapter 5. Characteristics of LPG-diesel dual fuelled engine operated with rapeseed methyl
ester and gas-to-liquid diesel fuels
81
et al., 2008, Hountalas et al., 2008, Zheng et al., 2004). When EGR takes part in the
combustion process, the oxygen availability reduces and hence decelerating the mixing rate
between fuel and oxygen. Therefore, in order to access more oxygen the flame region grows
to a bigger size which in turn it absorbs heat from its surrounding and hence lowering the
flame temperature (Maiboom et al., 2008). The low in-cylinder temperature which is indicated
by low pressure (Figure 31c) is the result of thermal and dilution effect of EGR employment
suppresses the NOX formation.
At high engine load, the higher in-cylinder temperature favours NOX emissions
formation (Zheng et al., 2004). In addition, when 1% LPG was inducted, NOX emissions were
higher than those obtained with ULSD only combustion. It was obtained that NOX increased
by 0.2% when high LPG concentration (1% LPG addition) was added at high engine load.
This suggests that fuel injection modification and a limitation on LPG addition are required to
avoid this NOX penalty at high engine load.
A significant reduction in soot was seen in dual fuelled diesel engine at all engine
operating conditions (Figure 35). Increasing the fraction of LPG will be followed by the
increase in liquid fuel replacement. As soot is mainly produced in the locally liquid fuel rich
regions (Mueller et al., 2003, Tree and Svensson, 2007), the presence of LPG reduced the
number of the available regions hence producing less soot. This replacement also provided
less carbon-contained fuel in the combustion chamber, as LPG has less carbon compared to
that of diesel, suppressed the soot formation propensity. An advantage was obtained in the
case of LPG and EGR combination where NOX emissions were further improved while soot
was kept at low level especially at 1% LPG addition low engine load. It is suggested that at
this condition the local in-cylinder temperature is considerably reduced, hence inhibiting soot
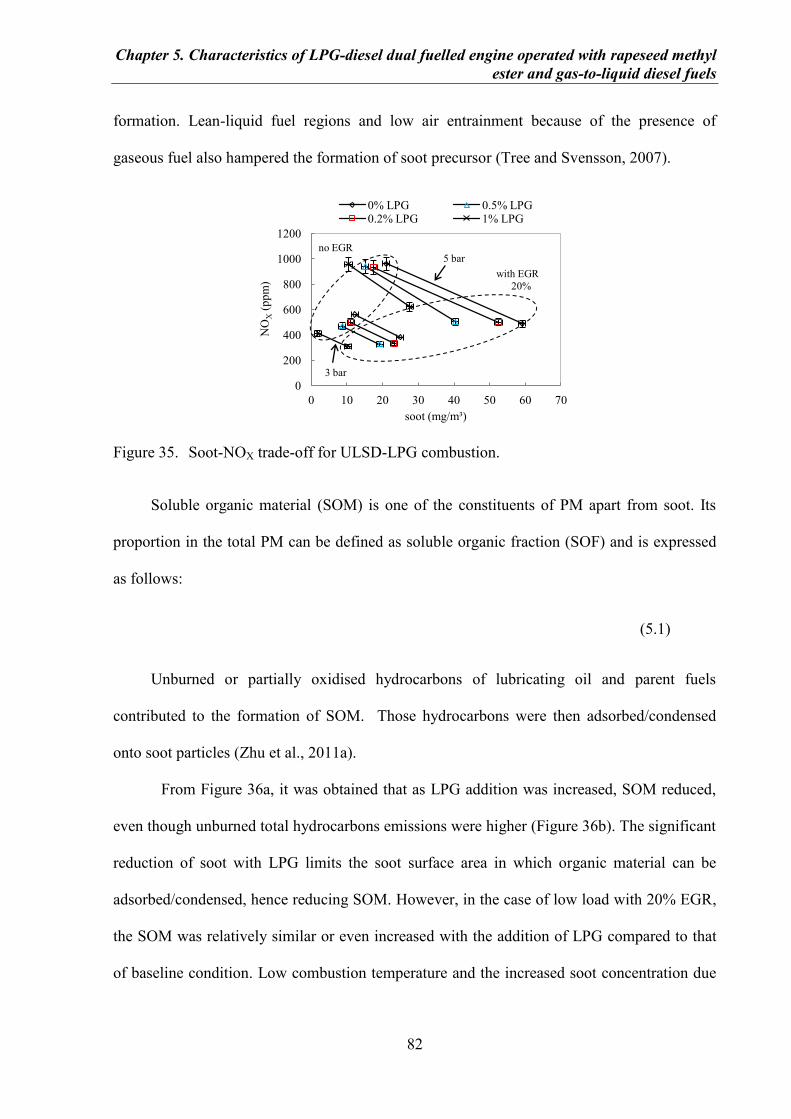
Chapter 5. Characteristics of LPG-diesel dual fuelled engine operated with rapeseed methyl
ester and gas-to-liquid diesel fuels
82
formation. Lean-liquid fuel regions and low air entrainment because of the presence of
gaseous fuel also hampered the formation of soot precursor (Tree and Svensson, 2007).
Figure 35. Soot-NOX trade-off for ULSD-LPG combustion.
Soluble organic material (SOM) is one of the constituents of PM apart from soot. Its
proportion in the total PM can be defined as soluble organic fraction (SOF) and is expressed
as follows:
(5.1)
Unburned or partially oxidised hydrocarbons of lubricating oil and parent fuels
contributed to the formation of SOM. Those hydrocarbons were then adsorbed/condensed
onto soot particles (Zhu et al., 2011a).
From Figure 36a, it was obtained that as LPG addition was increased, SOM reduced,
even though unburned total hydrocarbons emissions were higher (Figure 36b). The significant
reduction of soot with LPG limits the soot surface area in which organic material can be
adsorbed/condensed, hence reducing SOM. However, in the case of low load with 20% EGR,
the SOM was relatively similar or even increased with the addition of LPG compared to that
of baseline condition. Low combustion temperature and the increased soot concentration due
0
200
400
600
800
1000
1200
0 10 20 30 40 50 60 70
NO
X (
pp
m)
soot (mg/m³)
0% LPG 0.5% LPG 0.2% LPG 1% LPG
with EGR
20%
no EGR
5 bar
3 bar
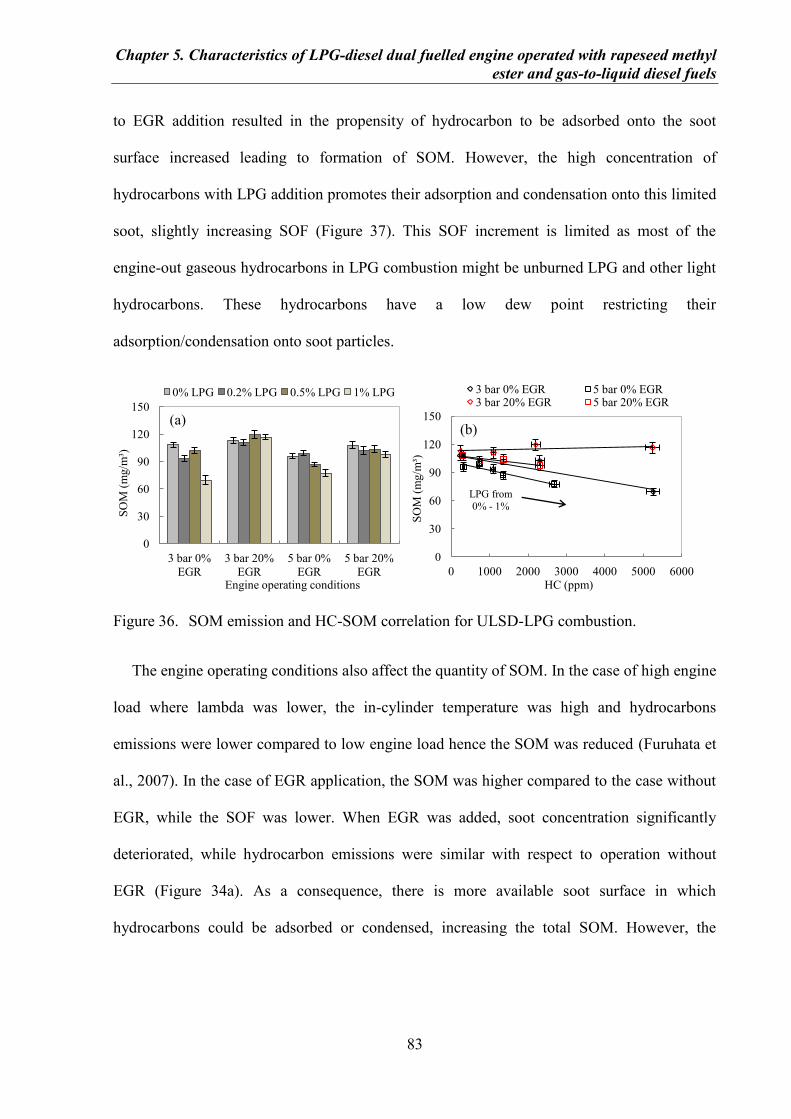
Chapter 5. Characteristics of LPG-diesel dual fuelled engine operated with rapeseed methyl
ester and gas-to-liquid diesel fuels
83
to EGR addition resulted in the propensity of hydrocarbon to be adsorbed onto the soot
surface increased leading to formation of SOM. However, the high concentration of
hydrocarbons with LPG addition promotes their adsorption and condensation onto this limited
soot, slightly increasing SOF (Figure 37). This SOF increment is limited as most of the
engine-out gaseous hydrocarbons in LPG combustion might be unburned LPG and other light
hydrocarbons. These hydrocarbons have a low dew point restricting their
adsorption/condensation onto soot particles.
Figure 36. SOM emission and HC-SOM correlation for ULSD-LPG combustion.
The engine operating conditions also affect the quantity of SOM. In the case of high engine
load where lambda was lower, the in-cylinder temperature was high and hydrocarbons
emissions were lower compared to low engine load hence the SOM was reduced (Furuhata et
al., 2007). In the case of EGR application, the SOM was higher compared to the case without
EGR, while the SOF was lower. When EGR was added, soot concentration significantly
deteriorated, while hydrocarbon emissions were similar with respect to operation without
EGR (Figure 34a). As a consequence, there is more available soot surface in which
hydrocarbons could be adsorbed or condensed, increasing the total SOM. However, the
0
30
60
90
120
150
3 bar 0%
EGR
3 bar 20%
EGR
5 bar 0%
EGR
5 bar 20%
EGR
SO
M (
mg/m
³)
Engine operating conditions
0% LPG 0.2% LPG 0.5% LPG 1% LPG
(a)
0
30
60
90
120
150
0 1000 2000 3000 4000 5000 6000
SO
M (
mg/m
³)
HC (ppm)
3 bar 0% EGR 5 bar 0% EGR 3 bar 20% EGR 5 bar 20% EGR
LPG from
0% - 1%
(b)
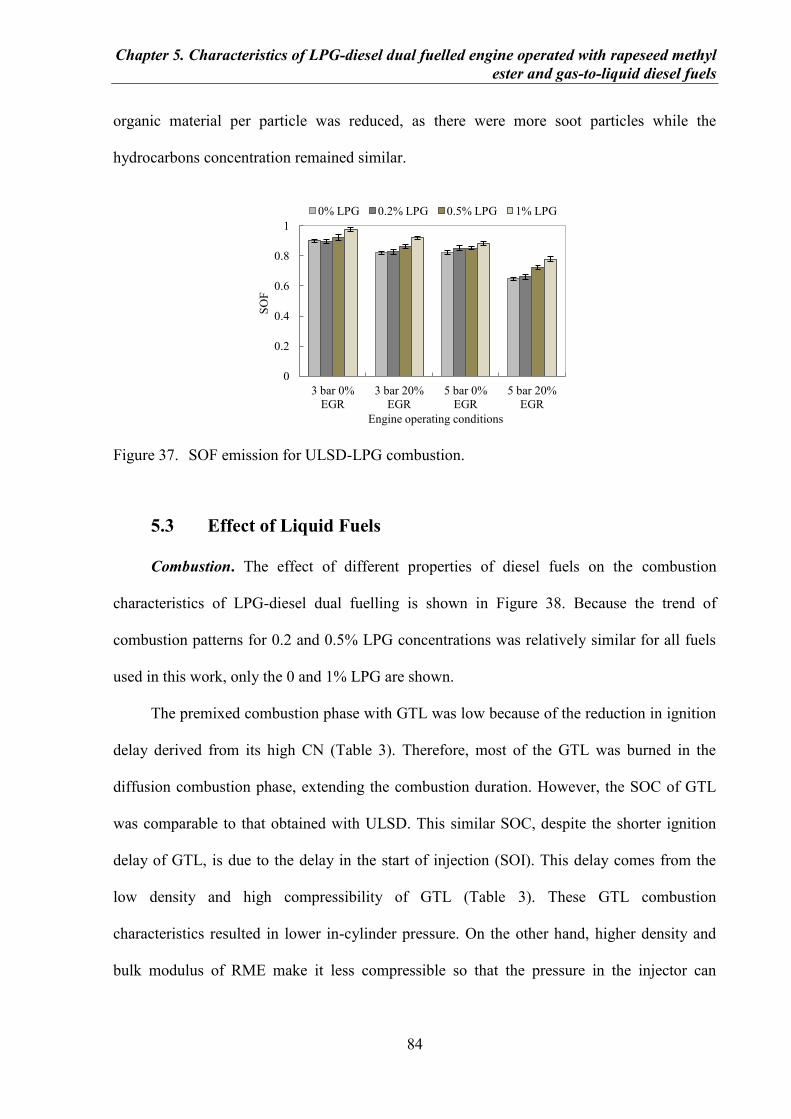
Chapter 5. Characteristics of LPG-diesel dual fuelled engine operated with rapeseed methyl
ester and gas-to-liquid diesel fuels
84
organic material per particle was reduced, as there were more soot particles while the
hydrocarbons concentration remained similar.
Figure 37. SOF emission for ULSD-LPG combustion.
5.3 Effect of Liquid Fuels
Combustion. The effect of different properties of diesel fuels on the combustion
characteristics of LPG-diesel dual fuelling is shown in Figure 38. Because the trend of
combustion patterns for 0.2 and 0.5% LPG concentrations was relatively similar for all fuels
used in this work, only the 0 and 1% LPG are shown.
The premixed combustion phase with GTL was low because of the reduction in ignition
delay derived from its high CN (Table 3). Therefore, most of the GTL was burned in the
diffusion combustion phase, extending the combustion duration. However, the SOC of GTL
was comparable to that obtained with ULSD. This similar SOC, despite the shorter ignition
delay of GTL, is due to the delay in the start of injection (SOI). This delay comes from the
low density and high compressibility of GTL (Table 3). These GTL combustion
characteristics resulted in lower in-cylinder pressure. On the other hand, higher density and
bulk modulus of RME make it less compressible so that the pressure in the injector can
0
0.2
0.4
0.6
0.8
1
3 bar 0%
EGR
3 bar 20%
EGR
5 bar 0%
EGR
5 bar 20%
EGR
SO
F
Engine operating conditions
0% LPG 0.2% LPG 0.5% LPG 1% LPG
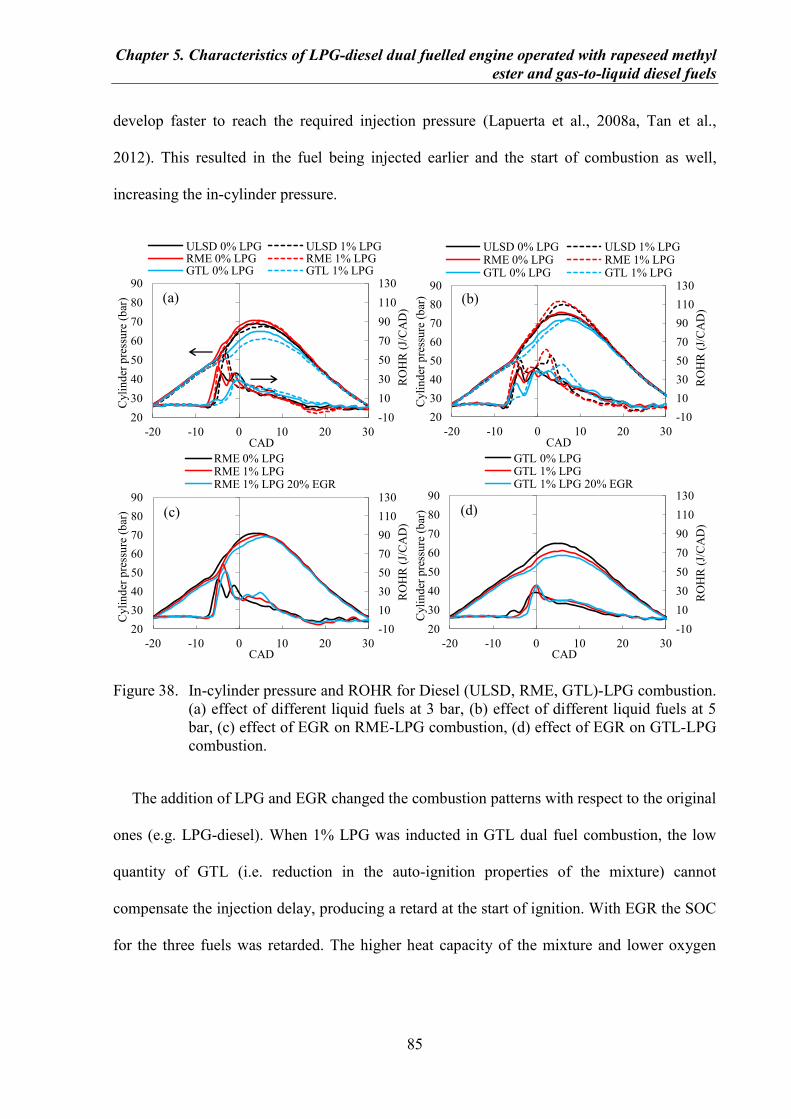
Chapter 5. Characteristics of LPG-diesel dual fuelled engine operated with rapeseed methyl
ester and gas-to-liquid diesel fuels
85
develop faster to reach the required injection pressure (Lapuerta et al., 2008a, Tan et al.,
2012). This resulted in the fuel being injected earlier and the start of combustion as well,
increasing the in-cylinder pressure.
Figure 38. In-cylinder pressure and ROHR for Diesel (ULSD, RME, GTL)-LPG combustion.
(a) effect of different liquid fuels at 3 bar, (b) effect of different liquid fuels at 5
bar, (c) effect of EGR on RME-LPG combustion, (d) effect of EGR on GTL-LPG
combustion.
The addition of LPG and EGR changed the combustion patterns with respect to the original
ones (e.g. LPG-diesel). When 1% LPG was inducted in GTL dual fuel combustion, the low
quantity of GTL (i.e. reduction in the auto-ignition properties of the mixture) cannot
compensate the injection delay, producing a retard at the start of ignition. With EGR the SOC
for the three fuels was retarded. The higher heat capacity of the mixture and lower oxygen
-10
10
30
50
70
90
110
130
20
30
40
50
60
70
80
90
-20 -10 0 10 20 30
RO
HR
(J/
CA
D)
Cyli
nd
er p
ress
ure
(b
ar)
CAD
ULSD 0% LPG ULSD 1% LPG RME 0% LPG RME 1% LPG GTL 0% LPG GTL 1% LPG
(a)
-10
10
30
50
70
90
110
130
20
30
40
50
60
70
80
90
-20 -10 0 10 20 30
RO
HR
(J/
CA
D)
Cyli
nd
er p
ress
ure
(b
ar)
CAD
ULSD 0% LPG ULSD 1% LPG RME 0% LPG RME 1% LPG GTL 0% LPG GTL 1% LPG
(b)
-10
10
30
50
70
90
110
130
20
30
40
50
60
70
80
90
-20 -10 0 10 20 30
RO
HR
(J/
CA
D)
Cyli
nd
er p
ress
ure
(b
ar)
CAD
RME 0% LPG RME 1% LPG RME 1% LPG 20% EGR
(c)
-10
10
30
50
70
90
110
130
20
30
40
50
60
70
80
90
-20 -10 0 10 20 30
RO
HR
(J/
CA
D)
Cyli
nd
er p
ress
ure
(b
ar)
CAD
GTL 0% LPG GTL 1% LPG GTL 1% LPG 20% EGR
(d)
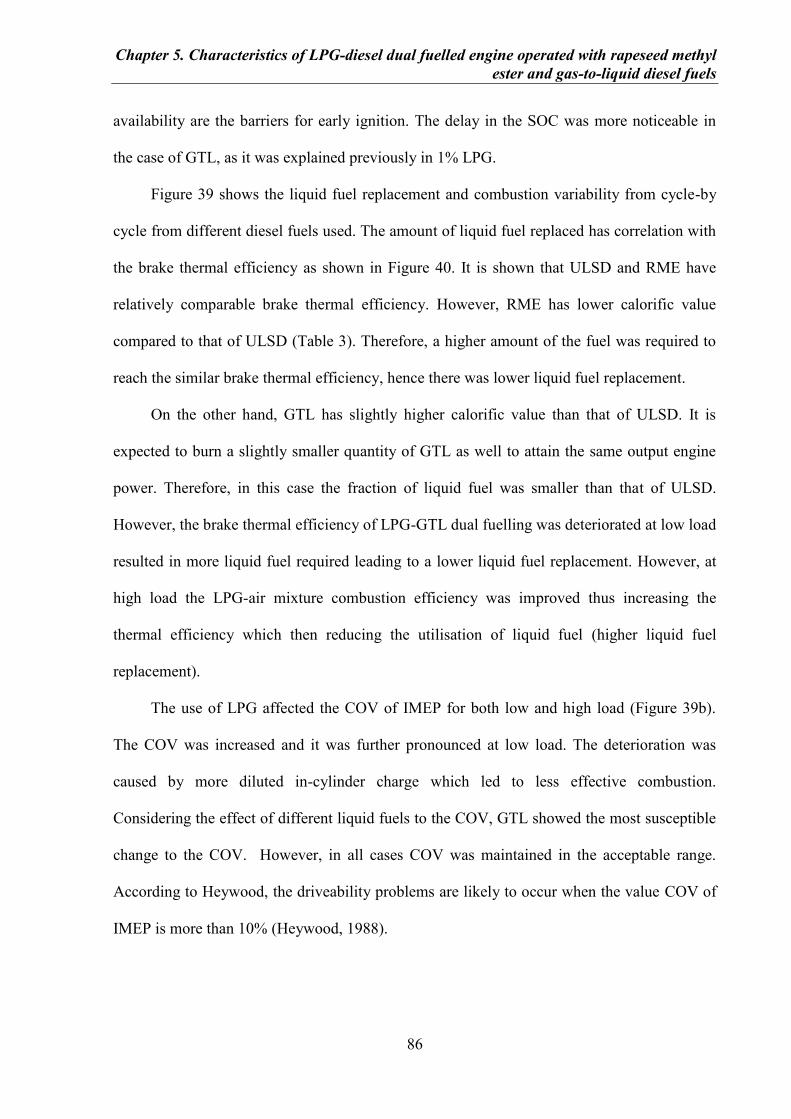
Chapter 5. Characteristics of LPG-diesel dual fuelled engine operated with rapeseed methyl
ester and gas-to-liquid diesel fuels
86
availability are the barriers for early ignition. The delay in the SOC was more noticeable in
the case of GTL, as it was explained previously in 1% LPG.
Figure 39 shows the liquid fuel replacement and combustion variability from cycle-by
cycle from different diesel fuels used. The amount of liquid fuel replaced has correlation with
the brake thermal efficiency as shown in Figure 40. It is shown that ULSD and RME have
relatively comparable brake thermal efficiency. However, RME has lower calorific value
compared to that of ULSD (Table 3). Therefore, a higher amount of the fuel was required to
reach the similar brake thermal efficiency, hence there was lower liquid fuel replacement.
On the other hand, GTL has slightly higher calorific value than that of ULSD. It is
expected to burn a slightly smaller quantity of GTL as well to attain the same output engine
power. Therefore, in this case the fraction of liquid fuel was smaller than that of ULSD.
However, the brake thermal efficiency of LPG-GTL dual fuelling was deteriorated at low load
resulted in more liquid fuel required leading to a lower liquid fuel replacement. However, at
high load the LPG-air mixture combustion efficiency was improved thus increasing the
thermal efficiency which then reducing the utilisation of liquid fuel (higher liquid fuel
replacement).
The use of LPG affected the COV of IMEP for both low and high load (Figure 39b).
The COV was increased and it was further pronounced at low load. The deterioration was
caused by more diluted in-cylinder charge which led to less effective combustion.
Considering the effect of different liquid fuels to the COV, GTL showed the most susceptible
change to the COV. However, in all cases COV was maintained in the acceptable range.
According to Heywood, the driveability problems are likely to occur when the value COV of
IMEP is more than 10% (Heywood, 1988).
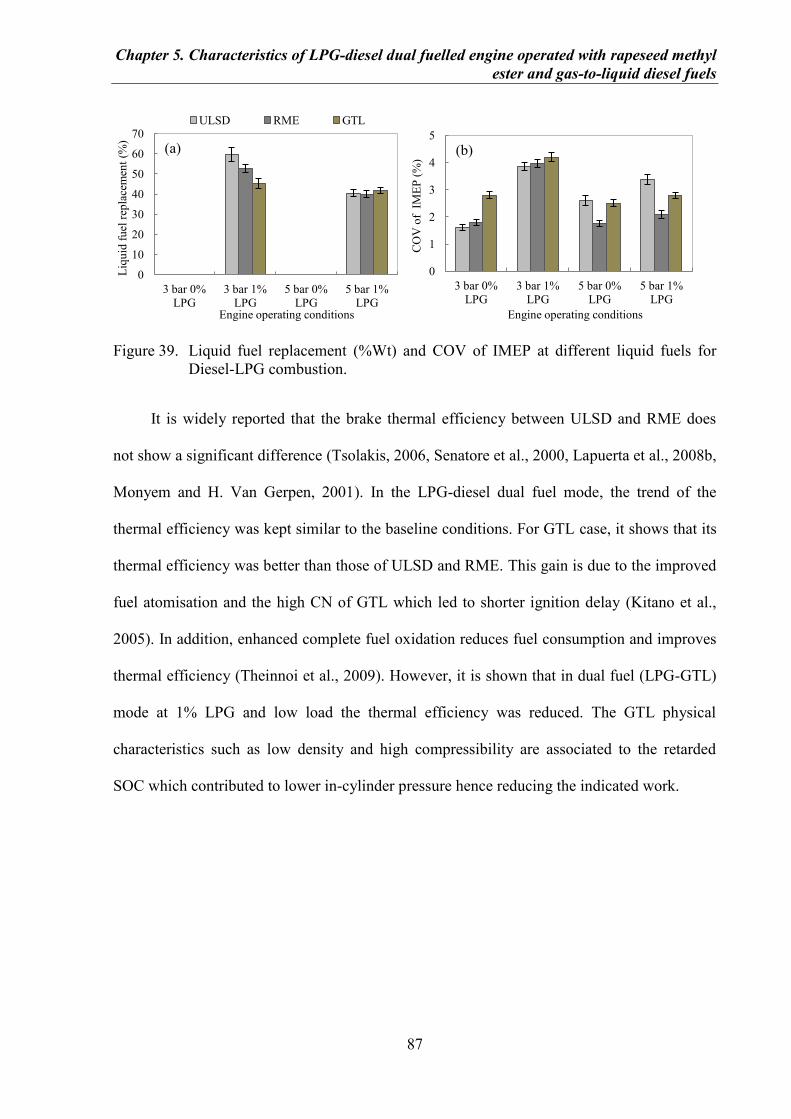
Chapter 5. Characteristics of LPG-diesel dual fuelled engine operated with rapeseed methyl
ester and gas-to-liquid diesel fuels
87
Figure 39. Liquid fuel replacement (%Wt) and COV of IMEP at different liquid fuels for
Diesel-LPG combustion.
It is widely reported that the brake thermal efficiency between ULSD and RME does
not show a significant difference (Tsolakis, 2006, Senatore et al., 2000, Lapuerta et al., 2008b,
Monyem and H. Van Gerpen, 2001). In the LPG-diesel dual fuel mode, the trend of the
thermal efficiency was kept similar to the baseline conditions. For GTL case, it shows that its
thermal efficiency was better than those of ULSD and RME. This gain is due to the improved
fuel atomisation and the high CN of GTL which led to shorter ignition delay (Kitano et al.,
2005). In addition, enhanced complete fuel oxidation reduces fuel consumption and improves
thermal efficiency (Theinnoi et al., 2009). However, it is shown that in dual fuel (LPG-GTL)
mode at 1% LPG and low load the thermal efficiency was reduced. The GTL physical
characteristics such as low density and high compressibility are associated to the retarded
SOC which contributed to lower in-cylinder pressure hence reducing the indicated work.
0
10
20
30
40
50
60
70
3 bar 0%
LPG
3 bar 1%
LPG
5 bar 0%
LPG
5 bar 1%
LPG
Liq
uid
fu
el r
epla
cem
ent
(%)
Engine operating conditions
ULSD RME GTL
(a)
0
1
2
3
4
5
3 bar 0%
LPG
3 bar 1%
LPG
5 bar 0%
LPG
5 bar 1%
LPG
CO
V o
f I
ME
P (
%)
Engine operating conditions
(b)
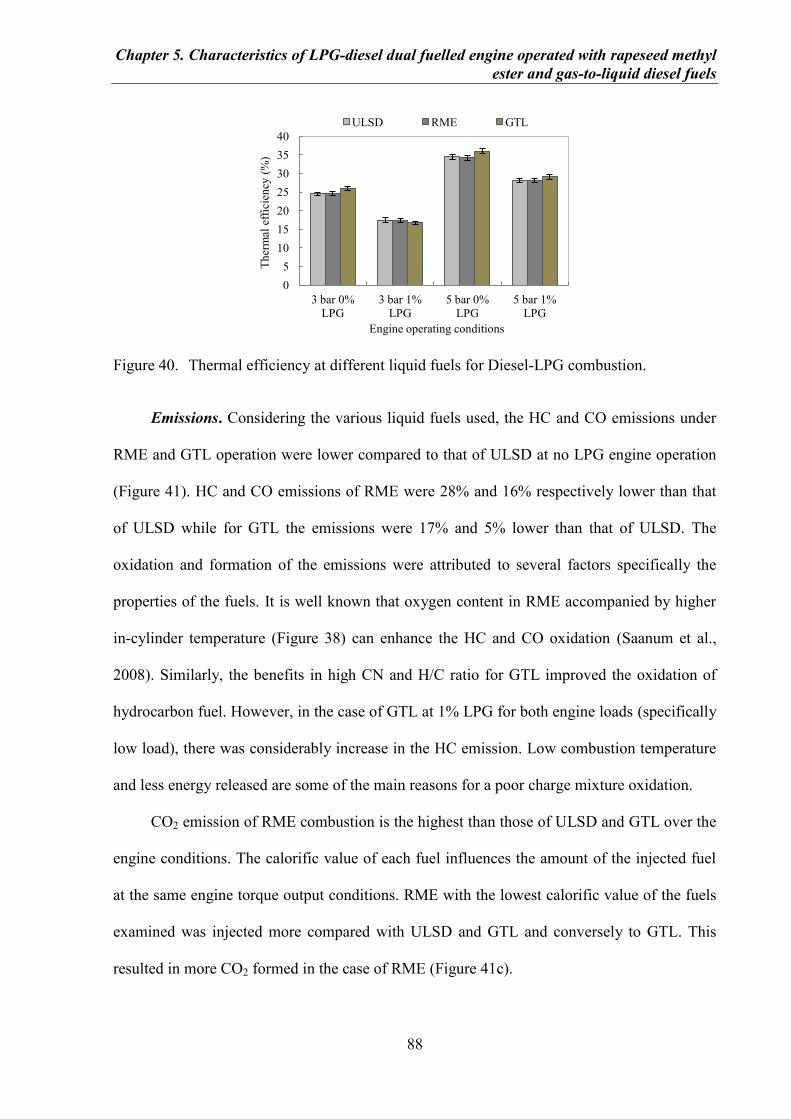
Chapter 5. Characteristics of LPG-diesel dual fuelled engine operated with rapeseed methyl
ester and gas-to-liquid diesel fuels
88
Figure 40. Thermal efficiency at different liquid fuels for Diesel-LPG combustion.
Emissions. Considering the various liquid fuels used, the HC and CO emissions under
RME and GTL operation were lower compared to that of ULSD at no LPG engine operation
(Figure 41). HC and CO emissions of RME were 28% and 16% respectively lower than that
of ULSD while for GTL the emissions were 17% and 5% lower than that of ULSD. The
oxidation and formation of the emissions were attributed to several factors specifically the
properties of the fuels. It is well known that oxygen content in RME accompanied by higher
in-cylinder temperature (Figure 38) can enhance the HC and CO oxidation (Saanum et al.,
2008). Similarly, the benefits in high CN and H/C ratio for GTL improved the oxidation of
hydrocarbon fuel. However, in the case of GTL at 1% LPG for both engine loads (specifically
low load), there was considerably increase in the HC emission. Low combustion temperature
and less energy released are some of the main reasons for a poor charge mixture oxidation.
CO2 emission of RME combustion is the highest than those of ULSD and GTL over the
engine conditions. The calorific value of each fuel influences the amount of the injected fuel
at the same engine torque output conditions. RME with the lowest calorific value of the fuels
examined was injected more compared with ULSD and GTL and conversely to GTL. This
resulted in more CO2 formed in the case of RME (Figure 41c).
0
5
10
15
20
25
30
35
40
3 bar 0%
LPG
3 bar 1%
LPG
5 bar 0%
LPG
5 bar 1%
LPG
Th
erm
al e
ffic
ien
cy (
%)
Engine operating conditions
ULSD RME GTL
Chapter 5. Characteristics of LPG-diesel dual fuelled engine operated with rapeseed methyl
ester and gas-to-liquid diesel fuels
89
Figure 41. Emission at different liquid fuels for Diesel-LPG combustion. (a) HC, (b) CO, (c)
CO2.
The advantage of LPG addition in reducing soot concentration was not only obtained in
ULSD but also in RME and GTL at all engine operating conditions. This was achieved
mainly due to the reduction in number of liquid fuel rich regions. High LPG concentration in
the combustion chamber resulted in less rich regions (less fuel droplets) leading to soot
reduction.
At low engine load and 0% EGR, NOX emissions also decreased when LPG was inducted,
breaking the soot-NOX trade-off for all the liquid fuels combustion (Figure 42a). In 20%
EGR, a simultaneous soot and NOX reduction with LPG application was also obtained (Figure
42b). GTL showed better soot-NOX trade-off lines with the application of EGR than in the
case of ULSD (i.e. lower NOX and comparable soot emissions) at each percentage of LPG
0
1000
2000
3000
4000
5000
6000
7000
8000
3 bar 0%
LPG
3 bar 1%
LPG
5 bar 0%
LPG
5 bar 1%
LPG
HC
(p
pm
)
Engine operating conditions
ULSD RME GTL
(a)
0
500
1000
1500
2000
2500
3000
3500
4000
3 bar 0%
LPG
3 bar 1%
LPG
5 bar 0%
LPG
5 bar 1%
LPG
CO
(p
pm
)
Engine operating conditions
(b)
0
2
4
6
8
3 bar 0%
LPG
3 bar 1%
LPG
5 bar 0%
LPG
5 bar 1%
LPG
CO₂
(% v
ol.
)
Engine operating conditions
(c)
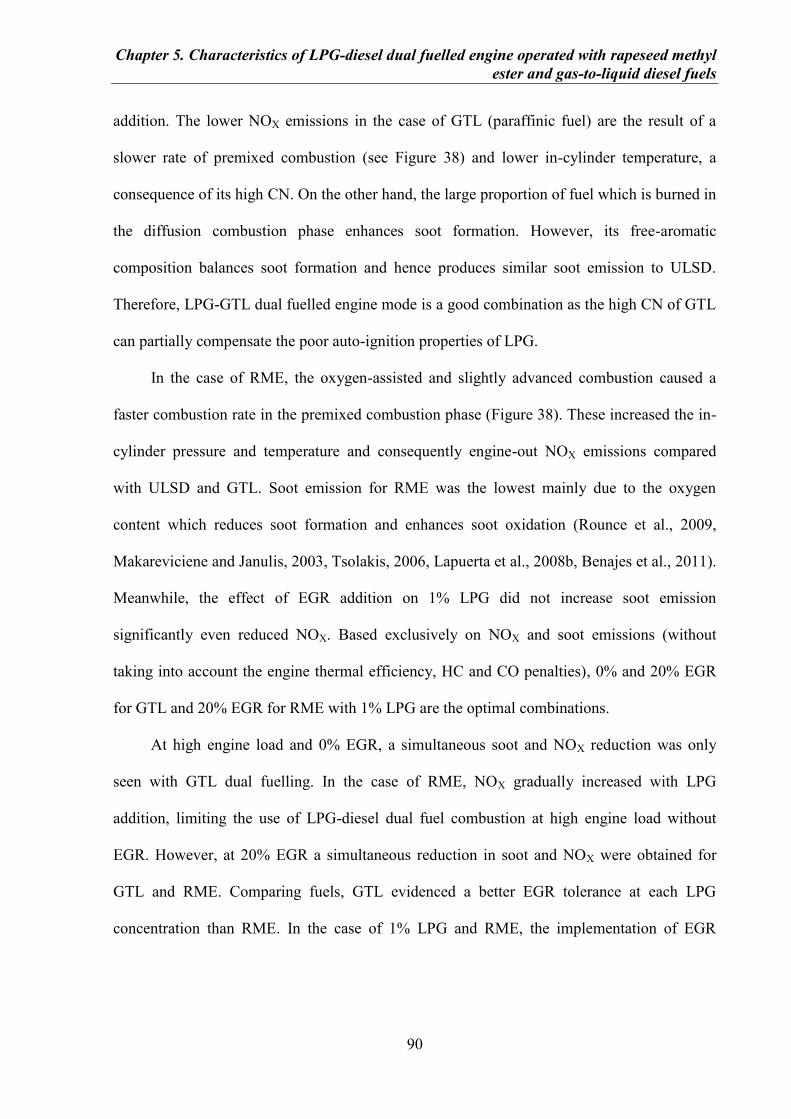
Chapter 5. Characteristics of LPG-diesel dual fuelled engine operated with rapeseed methyl
ester and gas-to-liquid diesel fuels
90
addition. The lower NOX emissions in the case of GTL (paraffinic fuel) are the result of a
slower rate of premixed combustion (see Figure 38) and lower in-cylinder temperature, a
consequence of its high CN. On the other hand, the large proportion of fuel which is burned in
the diffusion combustion phase enhances soot formation. However, its free-aromatic
composition balances soot formation and hence produces similar soot emission to ULSD.
Therefore, LPG-GTL dual fuelled engine mode is a good combination as the high CN of GTL
can partially compensate the poor auto-ignition properties of LPG.
In the case of RME, the oxygen-assisted and slightly advanced combustion caused a
faster combustion rate in the premixed combustion phase (Figure 38). These increased the in-
cylinder pressure and temperature and consequently engine-out NOX emissions compared
with ULSD and GTL. Soot emission for RME was the lowest mainly due to the oxygen
content which reduces soot formation and enhances soot oxidation (Rounce et al., 2009,
Makareviciene and Janulis, 2003, Tsolakis, 2006, Lapuerta et al., 2008b, Benajes et al., 2011).
Meanwhile, the effect of EGR addition on 1% LPG did not increase soot emission
significantly even reduced NOX. Based exclusively on NOX and soot emissions (without
taking into account the engine thermal efficiency, HC and CO penalties), 0% and 20% EGR
for GTL and 20% EGR for RME with 1% LPG are the optimal combinations.
At high engine load and 0% EGR, a simultaneous soot and NOX reduction was only
seen with GTL dual fuelling. In the case of RME, NOX gradually increased with LPG
addition, limiting the use of LPG-diesel dual fuel combustion at high engine load without
EGR. However, at 20% EGR a simultaneous reduction in soot and NOX were obtained for
GTL and RME. Comparing fuels, GTL evidenced a better EGR tolerance at each LPG
concentration than RME. In the case of 1% LPG and RME, the implementation of EGR
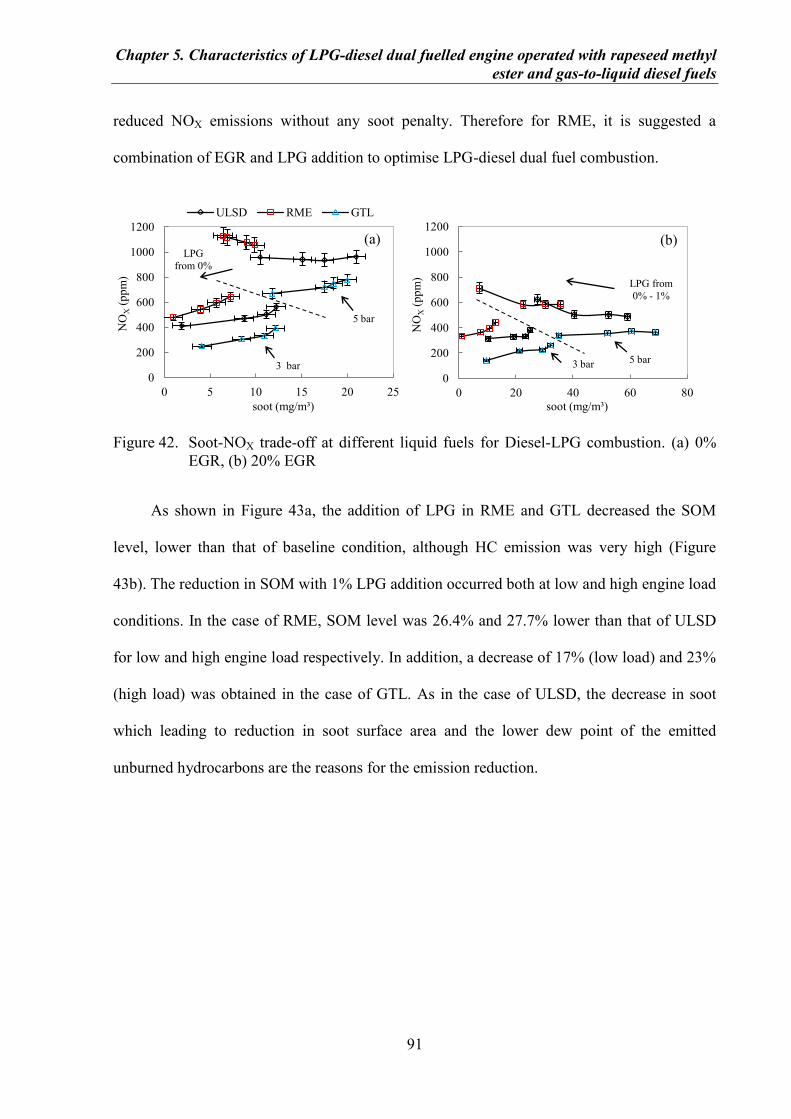
Chapter 5. Characteristics of LPG-diesel dual fuelled engine operated with rapeseed methyl
ester and gas-to-liquid diesel fuels
91
reduced NOX emissions without any soot penalty. Therefore for RME, it is suggested a
combination of EGR and LPG addition to optimise LPG-diesel dual fuel combustion.
Figure 42. Soot-NOX trade-off at different liquid fuels for Diesel-LPG combustion. (a) 0%
EGR, (b) 20% EGR
As shown in Figure 43a, the addition of LPG in RME and GTL decreased the SOM
level, lower than that of baseline condition, although HC emission was very high (Figure
43b). The reduction in SOM with 1% LPG addition occurred both at low and high engine load
conditions. In the case of RME, SOM level was 26.4% and 27.7% lower than that of ULSD
for low and high engine load respectively. In addition, a decrease of 17% (low load) and 23%
(high load) was obtained in the case of GTL. As in the case of ULSD, the decrease in soot
which leading to reduction in soot surface area and the lower dew point of the emitted
unburned hydrocarbons are the reasons for the emission reduction.
0
200
400
600
800
1000
1200
0 5 10 15 20 25
NO
X (
pp
m)
soot (mg/m³)
ULSD RME GTL
LPG
from 0%
5 bar
3 bar
(a)
0
200
400
600
800
1000
1200
0 20 40 60 80
NO
X (
pp
m)
soot (mg/m³)
LPG from
0% - 1%
5 bar 3 bar
(b)
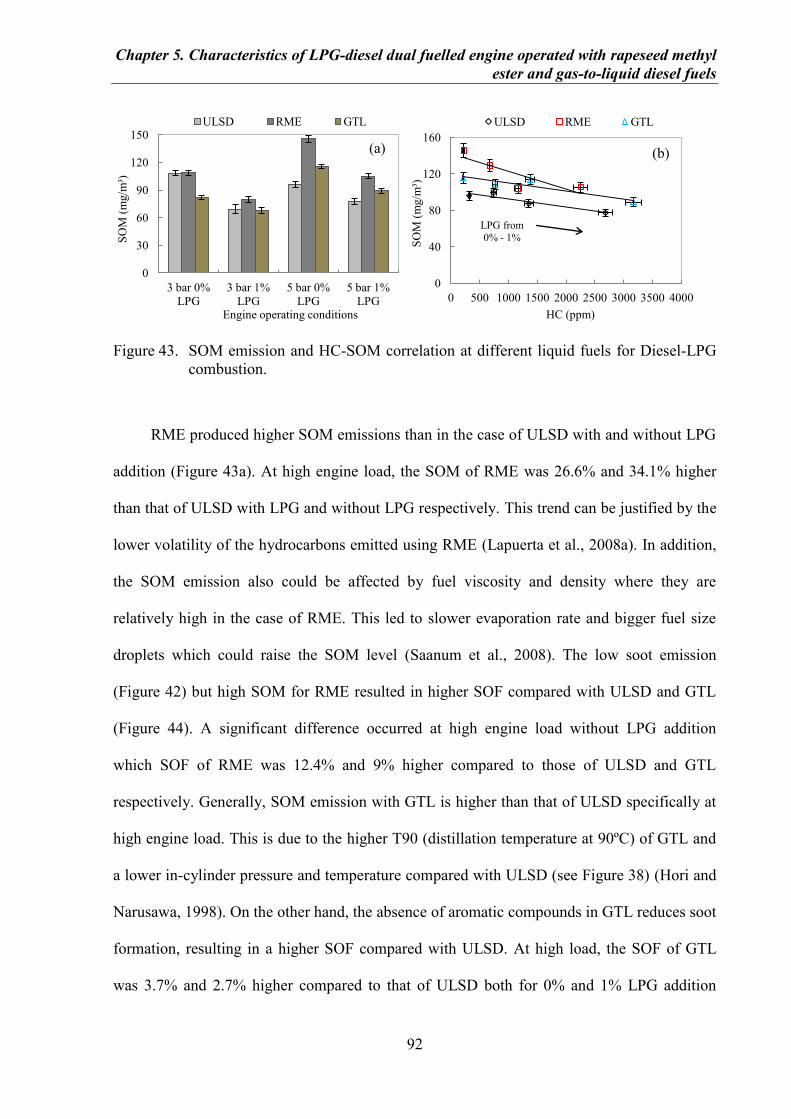
Chapter 5. Characteristics of LPG-diesel dual fuelled engine operated with rapeseed methyl
ester and gas-to-liquid diesel fuels
92
Figure 43. SOM emission and HC-SOM correlation at different liquid fuels for Diesel-LPG
combustion.
RME produced higher SOM emissions than in the case of ULSD with and without LPG
addition (Figure 43a). At high engine load, the SOM of RME was 26.6% and 34.1% higher
than that of ULSD with LPG and without LPG respectively. This trend can be justified by the
lower volatility of the hydrocarbons emitted using RME (Lapuerta et al., 2008a). In addition,
the SOM emission also could be affected by fuel viscosity and density where they are
relatively high in the case of RME. This led to slower evaporation rate and bigger fuel size
droplets which could raise the SOM level (Saanum et al., 2008). The low soot emission
(Figure 42) but high SOM for RME resulted in higher SOF compared with ULSD and GTL
(Figure 44). A significant difference occurred at high engine load without LPG addition
which SOF of RME was 12.4% and 9% higher compared to those of ULSD and GTL
respectively. Generally, SOM emission with GTL is higher than that of ULSD specifically at
high engine load. This is due to the higher T90 (distillation temperature at 90ºC) of GTL and
a lower in-cylinder pressure and temperature compared with ULSD (see Figure 38) (Hori and
Narusawa, 1998). On the other hand, the absence of aromatic compounds in GTL reduces soot
formation, resulting in a higher SOF compared with ULSD. At high load, the SOF of GTL
was 3.7% and 2.7% higher compared to that of ULSD both for 0% and 1% LPG addition
0
30
60
90
120
150
3 bar 0%
LPG
3 bar 1%
LPG
5 bar 0%
LPG
5 bar 1%
LPG
SO
M (
mg/m
³)
Engine operating conditions
ULSD RME GTL
(a)
0
40
80
120
160
0 500 1000 1500 2000 2500 3000 3500 4000
SO
M (
mg/m
³)
HC (ppm)
ULSD RME GTL
LPG from
0% - 1%
(b)
Chapter 5. Characteristics of LPG-diesel dual fuelled engine operated with rapeseed methyl
ester and gas-to-liquid diesel fuels
93
respectively. As in the case of ULSD, SOF increased for RME and GTL at low engine load
compared with high engine load, as it was previously explained.
Figure 44. SOF emission at different liquid fuels for Diesel-LPG combustion.
5.4 Effect of Advanced Injection Timing
This section specifically discusses the effect of the advanced fuel injection timing which
is applied to GTL. It has been explained in the previous section that dual fuel system on GTL
gave longer delay in SOC specifically at low load compared to those of ULSD and RME.
Therefore, the fuel injection was advanced as an effort to minimise the adverse effects caused
by retarded SOC. The engine has the original injection timing of 22 CAD (as set by
manufacturer) and for the experiment the injection was advanced by 2 CAD.
Figure 45 depicts the in-cylinder pressure and rate of heat release of LPG–GTL dual
fuel combustion at 3 and 5 bar IMEP with advanced injection timing. At 3 bar, advancing the
fuel injection timing did not show a significant impact on SOC because it still occurred later.
At low load, the in-cylinder environment could not trigger the initiation of combustion
effectively as the self ignition temperature of charge mixture cannot be reached even though
GTL relatively has high CN. However, the premixed combustion phase is pronounced as a
0
0.2
0.4
0.6
0.8
1
3 bar 0%
LPG
3 bar 1%
LPG
5 bar 0%
LPG
5 bar 1%
LPG
SO
F
Engine operating conditions
ULSD RME GTL
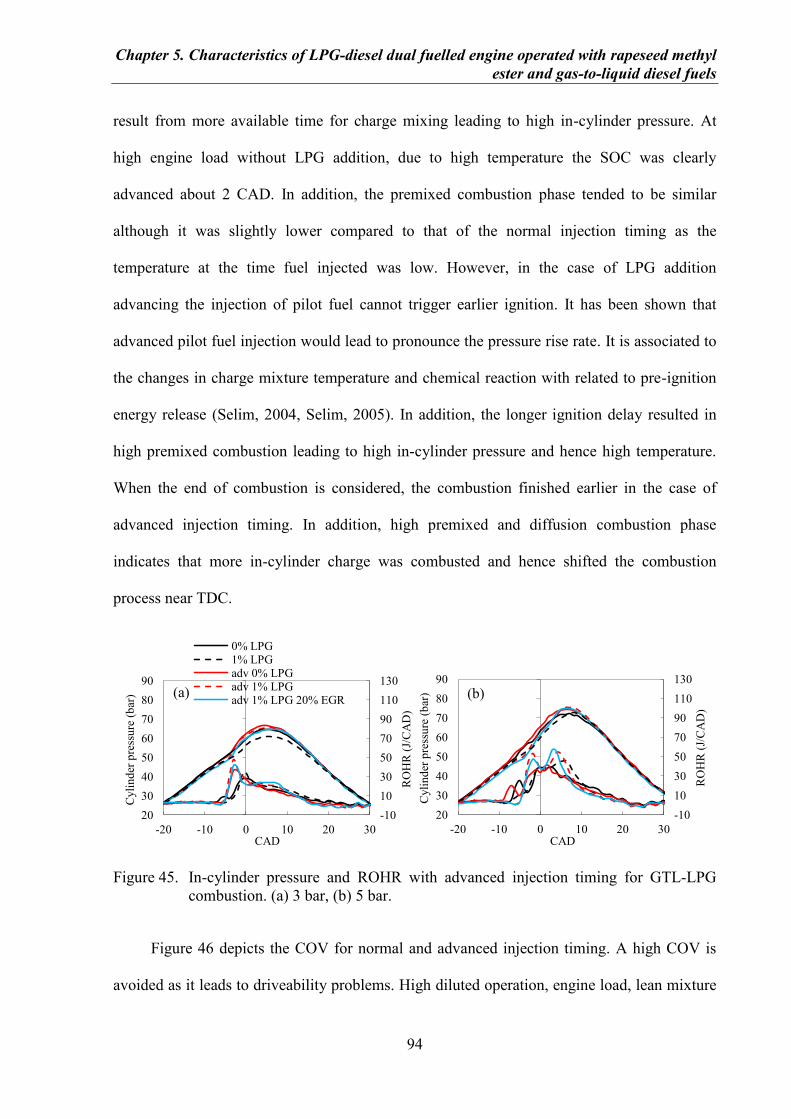
Chapter 5. Characteristics of LPG-diesel dual fuelled engine operated with rapeseed methyl
ester and gas-to-liquid diesel fuels
94
result from more available time for charge mixing leading to high in-cylinder pressure. At
high engine load without LPG addition, due to high temperature the SOC was clearly
advanced about 2 CAD. In addition, the premixed combustion phase tended to be similar
although it was slightly lower compared to that of the normal injection timing as the
temperature at the time fuel injected was low. However, in the case of LPG addition
advancing the injection of pilot fuel cannot trigger earlier ignition. It has been shown that
advanced pilot fuel injection would lead to pronounce the pressure rise rate. It is associated to
the changes in charge mixture temperature and chemical reaction with related to pre-ignition
energy release (Selim, 2004, Selim, 2005). In addition, the longer ignition delay resulted in
high premixed combustion leading to high in-cylinder pressure and hence high temperature.
When the end of combustion is considered, the combustion finished earlier in the case of
advanced injection timing. In addition, high premixed and diffusion combustion phase
indicates that more in-cylinder charge was combusted and hence shifted the combustion
process near TDC.
Figure 45. In-cylinder pressure and ROHR with advanced injection timing for GTL-LPG
combustion. (a) 3 bar, (b) 5 bar.
Figure 46 depicts the COV for normal and advanced injection timing. A high COV is
avoided as it leads to driveability problems. High diluted operation, engine load, lean mixture
-10
10
30
50
70
90
110
130
20
30
40
50
60
70
80
90
-20 -10 0 10 20 30
RO
HR
(J/
CA
D)
Cyli
nd
er p
ress
ure
(b
ar)
CAD
0% LPG 1% LPG adv 0% LPG adv 1% LPG adv 1% LPG 20% EGR
(a)
-10
10
30
50
70
90
110
130
20
30
40
50
60
70
80
90
-20 -10 0 10 20 30
RO
HR
(J/
CA
D)
Cyli
nd
er p
ress
ure
(b
ar)
CAD
(b)
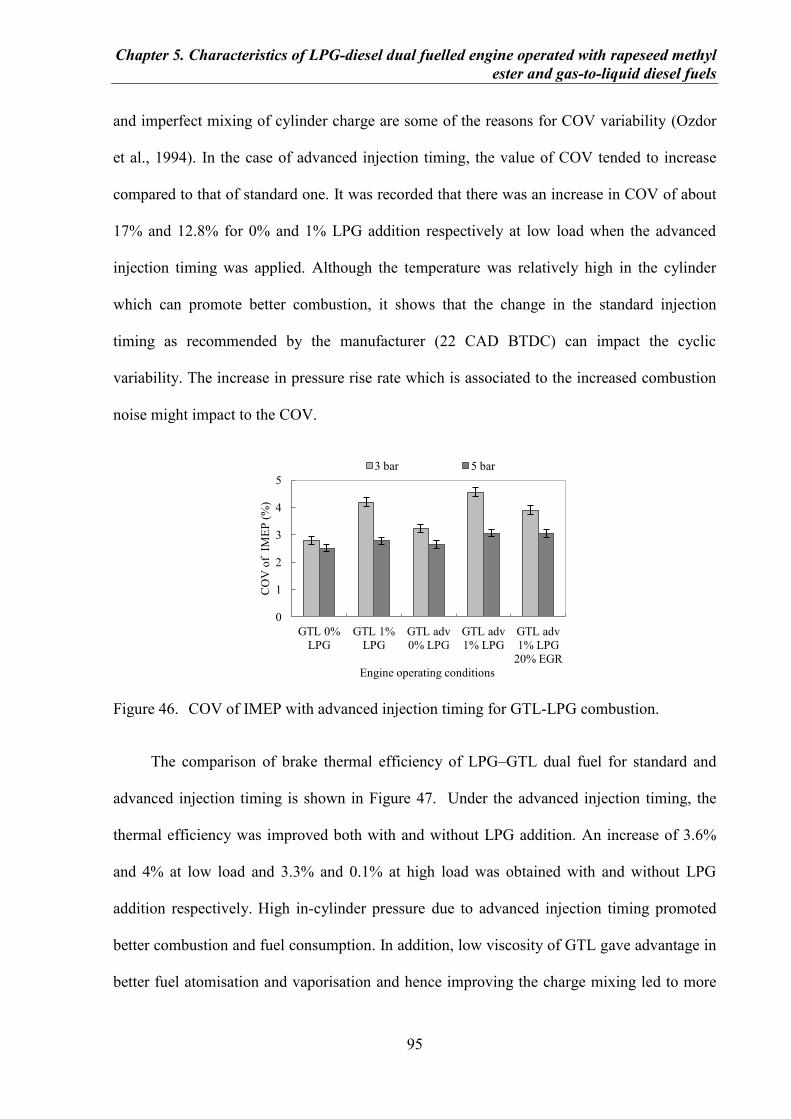
Chapter 5. Characteristics of LPG-diesel dual fuelled engine operated with rapeseed methyl
ester and gas-to-liquid diesel fuels
95
and imperfect mixing of cylinder charge are some of the reasons for COV variability (Ozdor
et al., 1994). In the case of advanced injection timing, the value of COV tended to increase
compared to that of standard one. It was recorded that there was an increase in COV of about
17% and 12.8% for 0% and 1% LPG addition respectively at low load when the advanced
injection timing was applied. Although the temperature was relatively high in the cylinder
which can promote better combustion, it shows that the change in the standard injection
timing as recommended by the manufacturer (22 CAD BTDC) can impact the cyclic
variability. The increase in pressure rise rate which is associated to the increased combustion
noise might impact to the COV.
Figure 46. COV of IMEP with advanced injection timing for GTL-LPG combustion.
The comparison of brake thermal efficiency of LPG–GTL dual fuel for standard and
advanced injection timing is shown in Figure 47. Under the advanced injection timing, the
thermal efficiency was improved both with and without LPG addition. An increase of 3.6%
and 4% at low load and 3.3% and 0.1% at high load was obtained with and without LPG
addition respectively. High in-cylinder pressure due to advanced injection timing promoted
better combustion and fuel consumption. In addition, low viscosity of GTL gave advantage in
better fuel atomisation and vaporisation and hence improving the charge mixing led to more
0
1
2
3
4
5
GTL 0%
LPG
GTL 1%
LPG
GTL adv
0% LPG
GTL adv
1% LPG
GTL adv
1% LPG
20% EGR
CO
V o
f I
ME
P (
%)
Engine operating conditions
3 bar 5 bar
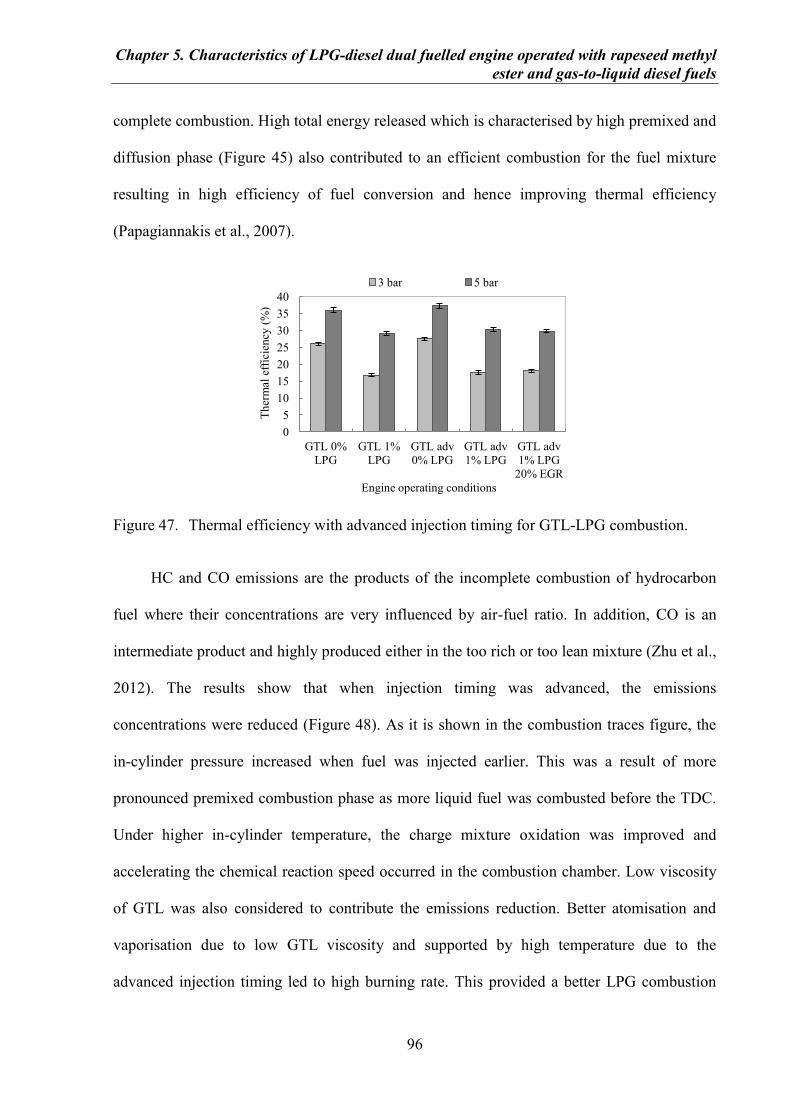
Chapter 5. Characteristics of LPG-diesel dual fuelled engine operated with rapeseed methyl
ester and gas-to-liquid diesel fuels
96
complete combustion. High total energy released which is characterised by high premixed and
diffusion phase (Figure 45) also contributed to an efficient combustion for the fuel mixture
resulting in high efficiency of fuel conversion and hence improving thermal efficiency
(Papagiannakis et al., 2007).
Figure 47. Thermal efficiency with advanced injection timing for GTL-LPG combustion.
HC and CO emissions are the products of the incomplete combustion of hydrocarbon
fuel where their concentrations are very influenced by air-fuel ratio. In addition, CO is an
intermediate product and highly produced either in the too rich or too lean mixture (Zhu et al.,
2012). The results show that when injection timing was advanced, the emissions
concentrations were reduced (Figure 48). As it is shown in the combustion traces figure, the
in-cylinder pressure increased when fuel was injected earlier. This was a result of more
pronounced premixed combustion phase as more liquid fuel was combusted before the TDC.
Under higher in-cylinder temperature, the charge mixture oxidation was improved and
accelerating the chemical reaction speed occurred in the combustion chamber. Low viscosity
of GTL was also considered to contribute the emissions reduction. Better atomisation and
vaporisation due to low GTL viscosity and supported by high temperature due to the
advanced injection timing led to high burning rate. This provided a better LPG combustion
0
5
10
15
20
25
30
35
40
GTL 0%
LPG
GTL 1%
LPG
GTL adv
0% LPG
GTL adv
1% LPG
GTL adv
1% LPG
20% EGR
Th
erm
al e
ffic
ien
cy (
%)
Engine operating conditions
3 bar 5 bar
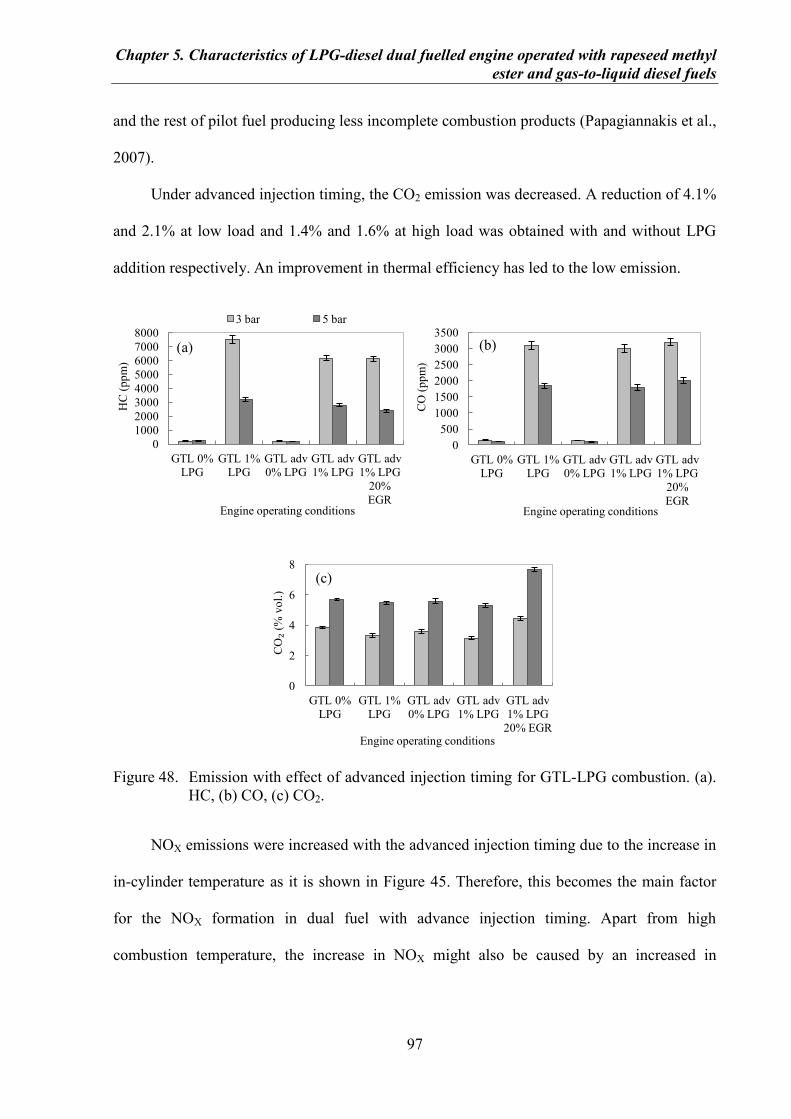
Chapter 5. Characteristics of LPG-diesel dual fuelled engine operated with rapeseed methyl
ester and gas-to-liquid diesel fuels
97
and the rest of pilot fuel producing less incomplete combustion products (Papagiannakis et al.,
2007).
Under advanced injection timing, the CO2 emission was decreased. A reduction of 4.1%
and 2.1% at low load and 1.4% and 1.6% at high load was obtained with and without LPG
addition respectively. An improvement in thermal efficiency has led to the low emission.
Figure 48. Emission with effect of advanced injection timing for GTL-LPG combustion. (a).
HC, (b) CO, (c) CO2.
NOX emissions were increased with the advanced injection timing due to the increase in
in-cylinder temperature as it is shown in Figure 45. Therefore, this becomes the main factor
for the NOX formation in dual fuel with advance injection timing. Apart from high
combustion temperature, the increase in NOX might also be caused by an increased in
0
1000
2000
3000
4000
5000
6000
7000
8000
GTL 0%
LPG
GTL 1%
LPG
GTL adv
0% LPG
GTL adv
1% LPG
GTL adv
1% LPG
20%
EGR
HC
(p
pm
)
Engine operating conditions
3 bar 5 bar
(a)
0
500
1000
1500
2000
2500
3000
3500
GTL 0%
LPG
GTL 1%
LPG
GTL adv
0% LPG
GTL adv
1% LPG
GTL adv
1% LPG
20%
EGR
CO
(p
pm
)
Engine operating conditions
(b)
0
2
4
6
8
GTL 0%
LPG
GTL 1%
LPG
GTL adv
0% LPG
GTL adv
1% LPG
GTL adv
1% LPG
20% EGR
CO₂
(% v
ol.
)
Engine operating conditions
(c)
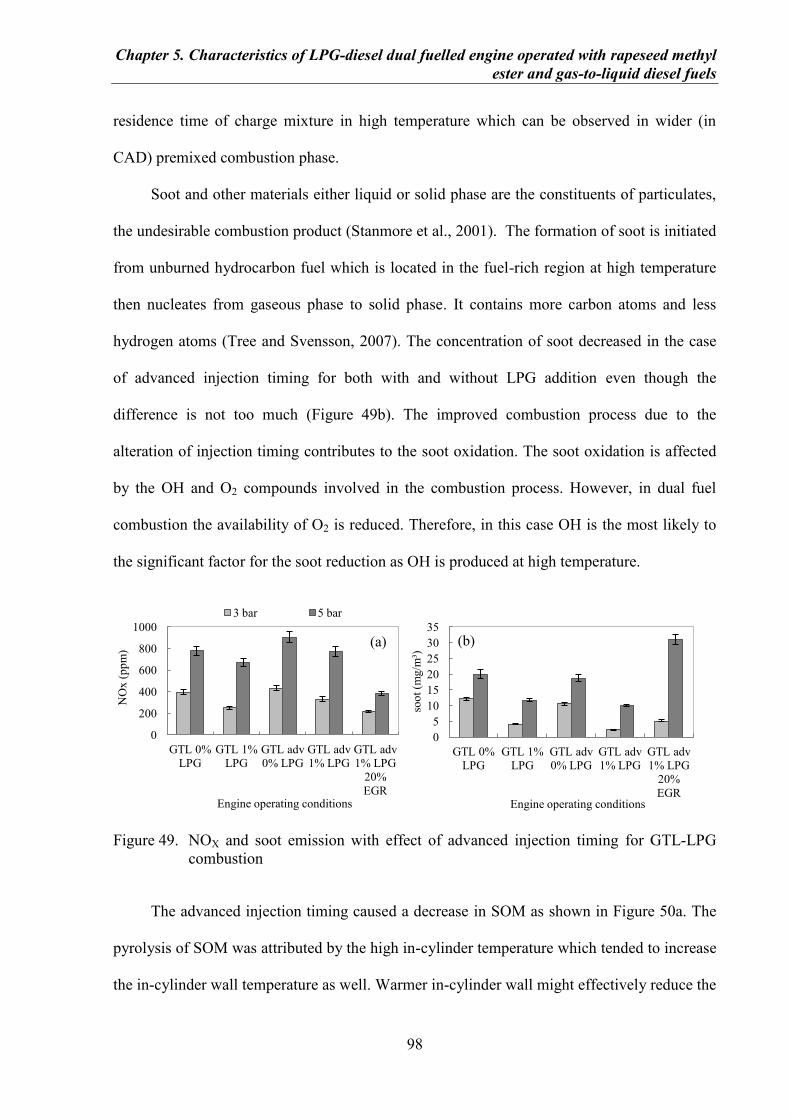
Chapter 5. Characteristics of LPG-diesel dual fuelled engine operated with rapeseed methyl
ester and gas-to-liquid diesel fuels
98
residence time of charge mixture in high temperature which can be observed in wider (in
CAD) premixed combustion phase.
Soot and other materials either liquid or solid phase are the constituents of particulates,
the undesirable combustion product (Stanmore et al., 2001). The formation of soot is initiated
from unburned hydrocarbon fuel which is located in the fuel-rich region at high temperature
then nucleates from gaseous phase to solid phase. It contains more carbon atoms and less
hydrogen atoms (Tree and Svensson, 2007). The concentration of soot decreased in the case
of advanced injection timing for both with and without LPG addition even though the
difference is not too much (Figure 49b). The improved combustion process due to the
alteration of injection timing contributes to the soot oxidation. The soot oxidation is affected
by the OH and O2 compounds involved in the combustion process. However, in dual fuel
combustion the availability of O2 is reduced. Therefore, in this case OH is the most likely to
the significant factor for the soot reduction as OH is produced at high temperature.
Figure 49. NOX and soot emission with effect of advanced injection timing for GTL-LPG
combustion
The advanced injection timing caused a decrease in SOM as shown in Figure 50a. The
pyrolysis of SOM was attributed by the high in-cylinder temperature which tended to increase
the in-cylinder wall temperature as well. Warmer in-cylinder wall might effectively reduce the
0
200
400
600
800
1000
GTL 0%
LPG
GTL 1%
LPG
GTL adv
0% LPG
GTL adv
1% LPG
GTL adv
1% LPG
20%
EGR
NO
x (
pp
m)
Engine operating conditions
3 bar 5 bar
(a)
0
5
10
15
20
25
30
35
GTL 0%
LPG
GTL 1%
LPG
GTL adv
0% LPG
GTL adv
1% LPG
GTL adv
1% LPG
20%
EGR
soo
t (m
g/m
³)
Engine operating conditions
(b)
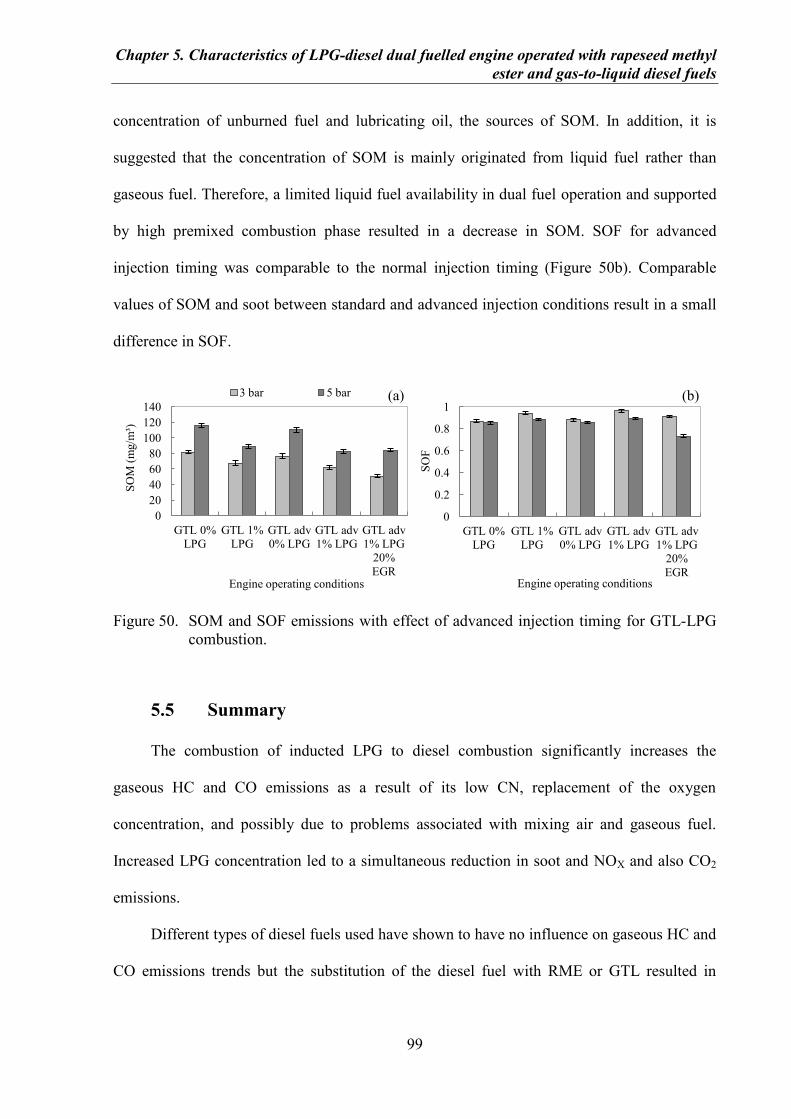
Chapter 5. Characteristics of LPG-diesel dual fuelled engine operated with rapeseed methyl
ester and gas-to-liquid diesel fuels
99
concentration of unburned fuel and lubricating oil, the sources of SOM. In addition, it is
suggested that the concentration of SOM is mainly originated from liquid fuel rather than
gaseous fuel. Therefore, a limited liquid fuel availability in dual fuel operation and supported
by high premixed combustion phase resulted in a decrease in SOM. SOF for advanced
injection timing was comparable to the normal injection timing (Figure 50b). Comparable
values of SOM and soot between standard and advanced injection conditions result in a small
difference in SOF.
Figure 50. SOM and SOF emissions with effect of advanced injection timing for GTL-LPG
combustion.
5.5 Summary
The combustion of inducted LPG to diesel combustion significantly increases the
gaseous HC and CO emissions as a result of its low CN, replacement of the oxygen
concentration, and possibly due to problems associated with mixing air and gaseous fuel.
Increased LPG concentration led to a simultaneous reduction in soot and NOX and also CO2
emissions.
Different types of diesel fuels used have shown to have no influence on gaseous HC and
CO emissions trends but the substitution of the diesel fuel with RME or GTL resulted in
0
20
40
60
80
100
120
140
GTL 0%
LPG
GTL 1%
LPG
GTL adv
0% LPG
GTL adv
1% LPG
GTL adv
1% LPG
20%
EGR
SO
M (
mg/m
³)
Engine operating conditions
3 bar 5 bar (a)
0
0.2
0.4
0.6
0.8
1
GTL 0%
LPG
GTL 1%
LPG
GTL adv
0% LPG
GTL adv
1% LPG
GTL adv
1% LPG
20%
EGR
SO
F
Engine operating conditions
(b)
Chapter 5. Characteristics of LPG-diesel dual fuelled engine operated with rapeseed methyl
ester and gas-to-liquid diesel fuels
100
significantly reduced NOX–Soot emissions trade-off line to lower values, with the reduction
following the order of GTL > RME > ULSD.
The results of the LPG–RME dual fuelling have shown that EGR would be beneficial at
high engine load conditions while in the LPG–GTL dual fuelling optimisation of the GTL fuel
injection characteristics can enhance further low engine load to keep the engine emission
benefits.
The readjustment of the fuel injection setting by advanced injection timing in the dual
fuel system has shown as one of the means for improvements in thermal efficiency and
engine-out emissions.
Overall, the study confirms that diesel fuel properties need to be optimised for the
different LPG additions in order to obtain the improved engine out emissions of LPG-diesel
dual fuelling.
C H A P T E R 6
UNDERSTANDING THE INFLUENCE OF THE REFORMATE
AND THE PROPERTIES OF DIESEL FUEL IN LPG-DIESEL
DUAL FUELLED COMBUSTION
6.1 Introduction
This chapter is an extended study from the previous chapter on LPG-dual fuelled
combustion. It has been proven that soot and NOX (at low engine load) were reduced but HC,
CO and engine thermal efficiency were deteriorated. It was observed also that there was an
ignition delay and potentially can produce a high proportion of unburned mixture in the
exhaust. Therefore, an approach to improve the above mentioned problems is required. The
use of hydrogen addition can be one of the solutions. Apart from CO, the hydrogen used in
the system can be produced from reformed exhaust gas recirculation (REGR) technique.
Hydrogen and carbon monoxide concentrations were selected, assuming complete fuel
reforming of half of the different flow rates of propane to the syngas by partial oxidation and
then followed by steam reforming reaction. The product then is called reformate (Ref.: H2 and
CO). The other half of the propane is also fed to the engine with the reformate (LPG+Ref.).
The combination of the reactions called auto-thermal reforming can be expressed as follows.
The exothermic reaction of partial oxidation that produces heat can be used to drive the steam
reforming that requires heat. Therefore, the reforming process can be carried out on a small
and compact reactor.
(6.1)
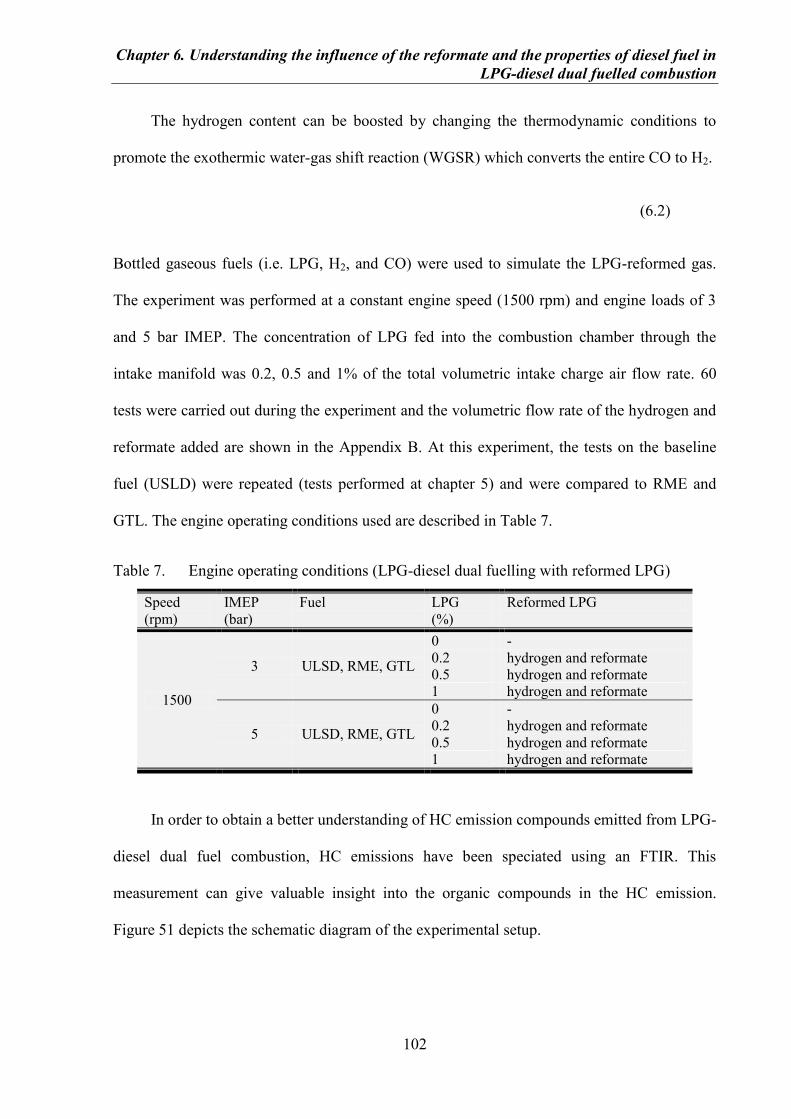
Chapter 6. Understanding the influence of the reformate and the properties of diesel fuel in
LPG-diesel dual fuelled combustion
102
The hydrogen content can be boosted by changing the thermodynamic conditions to
promote the exothermic water-gas shift reaction (WGSR) which converts the entire CO to H2.
(6.2)
Bottled gaseous fuels (i.e. LPG, H2, and CO) were used to simulate the LPG-reformed gas.
The experiment was performed at a constant engine speed (1500 rpm) and engine loads of 3
and 5 bar IMEP. The concentration of LPG fed into the combustion chamber through the
intake manifold was 0.2, 0.5 and 1% of the total volumetric intake charge air flow rate. 60
tests were carried out during the experiment and the volumetric flow rate of the hydrogen and
reformate added are shown in the Appendix B. At this experiment, the tests on the baseline
fuel (USLD) were repeated (tests performed at chapter 5) and were compared to RME and
GTL. The engine operating conditions used are described in Table 7.
Table 7. Engine operating conditions (LPG-diesel dual fuelling with reformed LPG)
Speed
(rpm)
IMEP
(bar)
Fuel LPG
(%)
Reformed LPG
1500
3 ULSD, RME, GTL
0 -
0.2 hydrogen and reformate
0.5 hydrogen and reformate
1 hydrogen and reformate
5 ULSD, RME, GTL
0 -
0.2 hydrogen and reformate
0.5 hydrogen and reformate
1 hydrogen and reformate
In order to obtain a better understanding of HC emission compounds emitted from LPG-
diesel dual fuel combustion, HC emissions have been speciated using an FTIR. This
measurement can give valuable insight into the organic compounds in the HC emission.
Figure 51 depicts the schematic diagram of the experimental setup.
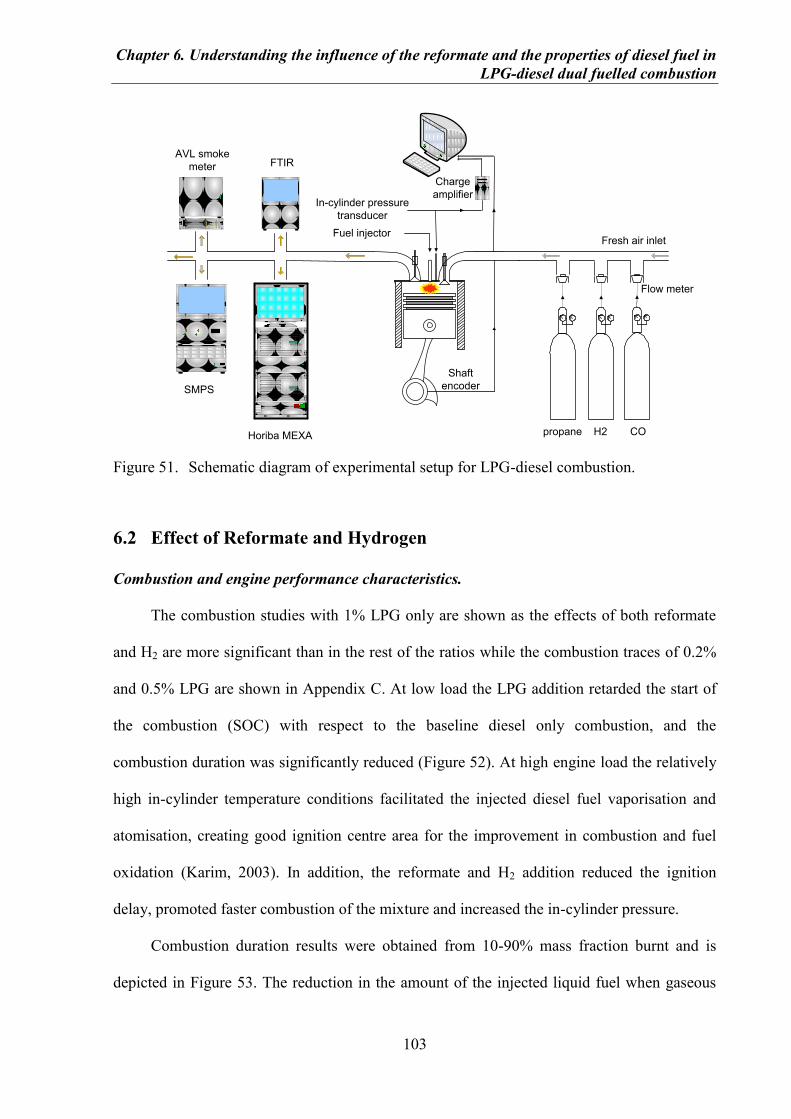
Chapter 6. Understanding the influence of the reformate and the properties of diesel fuel in
LPG-diesel dual fuelled combustion
103
5 U
5 U
Charge
amplifier
Horiba MEXA
Flow meter
Fuel injector
In-cylinder pressure
transducer
Shaft
encoder
Fresh air inlet
H2 CO
2 U
SMPS
AVL smoke
meter FTIR
propane
Figure 51. Schematic diagram of experimental setup for LPG-diesel combustion.
6.2 Effect of Reformate and Hydrogen
Combustion and engine performance characteristics.
The combustion studies with 1% LPG only are shown as the effects of both reformate
and H2 are more significant than in the rest of the ratios while the combustion traces of 0.2%
and 0.5% LPG are shown in Appendix C. At low load the LPG addition retarded the start of
the combustion (SOC) with respect to the baseline diesel only combustion, and the
combustion duration was significantly reduced (Figure 52). At high engine load the relatively
high in-cylinder temperature conditions facilitated the injected diesel fuel vaporisation and
atomisation, creating good ignition centre area for the improvement in combustion and fuel
oxidation (Karim, 2003). In addition, the reformate and H2 addition reduced the ignition
delay, promoted faster combustion of the mixture and increased the in-cylinder pressure.
Combustion duration results were obtained from 10-90% mass fraction burnt and is
depicted in Figure 53. The reduction in the amount of the injected liquid fuel when gaseous
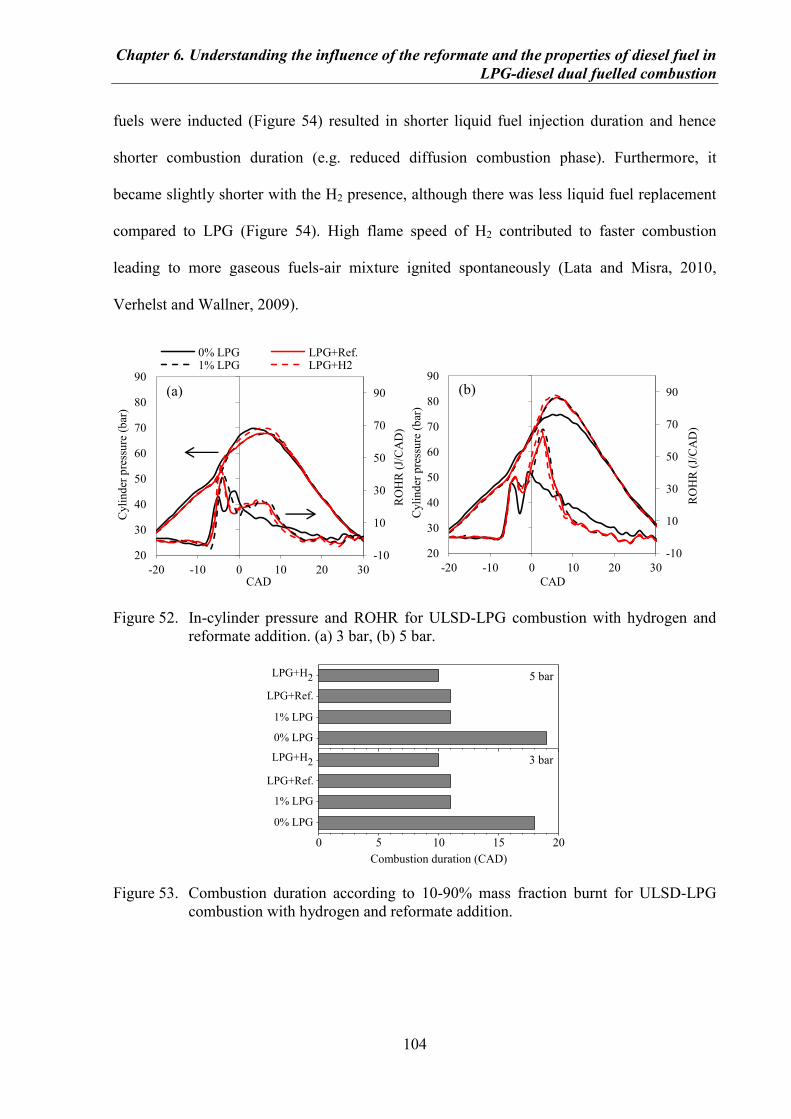
Chapter 6. Understanding the influence of the reformate and the properties of diesel fuel in
LPG-diesel dual fuelled combustion
104
fuels were inducted (Figure 54) resulted in shorter liquid fuel injection duration and hence
shorter combustion duration (e.g. reduced diffusion combustion phase). Furthermore, it
became slightly shorter with the H2 presence, although there was less liquid fuel replacement
compared to LPG (Figure 54). High flame speed of H2 contributed to faster combustion
leading to more gaseous fuels-air mixture ignited spontaneously (Lata and Misra, 2010,
Verhelst and Wallner, 2009).
Figure 52. In-cylinder pressure and ROHR for ULSD-LPG combustion with hydrogen and
reformate addition. (a) 3 bar, (b) 5 bar.
Figure 53. Combustion duration according to 10-90% mass fraction burnt for ULSD-LPG
combustion with hydrogen and reformate addition.
-10
10
30
50
70
90
20
30
40
50
60
70
80
90
-20 -10 0 10 20 30
RO
HR
(J/
CA
D)
Cyli
nd
er p
ress
ure
(b
ar)
CAD
0% LPG LPG+Ref. 1% LPG LPG+H2
(a)
-10
10
30
50
70
90
20
30
40
50
60
70
80
90
-20 -10 0 10 20 30
RO
HR
(J/
CA
D)
Cyli
nd
er p
ress
ure
(b
ar)
CAD
(b)
0 5 10 15 20
5 bar
3 barLPG+H2
LPG+Ref.
1% LPG
0% LPG
Combustion duration (CAD)
LPG+H2
LPG+Ref.
1% LPG
0% LPG
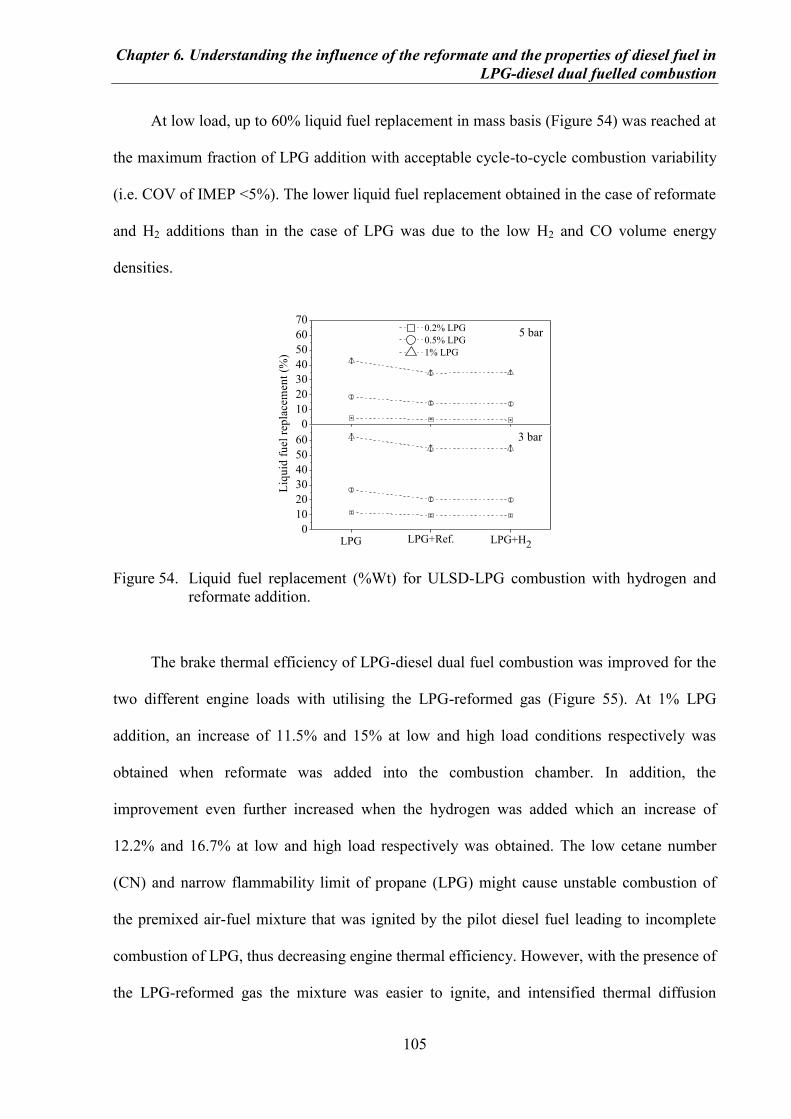
Chapter 6. Understanding the influence of the reformate and the properties of diesel fuel in
LPG-diesel dual fuelled combustion
105
At low load, up to 60% liquid fuel replacement in mass basis (Figure 54) was reached at
the maximum fraction of LPG addition with acceptable cycle-to-cycle combustion variability
(i.e. COV of IMEP <5%). The lower liquid fuel replacement obtained in the case of reformate
and H2 additions than in the case of LPG was due to the low H2 and CO volume energy
densities.
Figure 54. Liquid fuel replacement (%Wt) for ULSD-LPG combustion with hydrogen and
reformate addition.
The brake thermal efficiency of LPG-diesel dual fuel combustion was improved for the
two different engine loads with utilising the LPG-reformed gas (Figure 55). At 1% LPG
addition, an increase of 11.5% and 15% at low and high load conditions respectively was
obtained when reformate was added into the combustion chamber. In addition, the
improvement even further increased when the hydrogen was added which an increase of
12.2% and 16.7% at low and high load respectively was obtained. The low cetane number
(CN) and narrow flammability limit of propane (LPG) might cause unstable combustion of
the premixed air-fuel mixture that was ignited by the pilot diesel fuel leading to incomplete
combustion of LPG, thus decreasing engine thermal efficiency. However, with the presence of
the LPG-reformed gas the mixture was easier to ignite, and intensified thermal diffusion
0
10
20
30
40
50
60
5 bar
3 bar
LPG+H2LPG+Ref.
0.2% LPG
0.5% LPG
1% LPG
Liq
uid
fu
el
rep
lacem
en
t (%
)
0
10
20
30
40
50
60
70
LPG
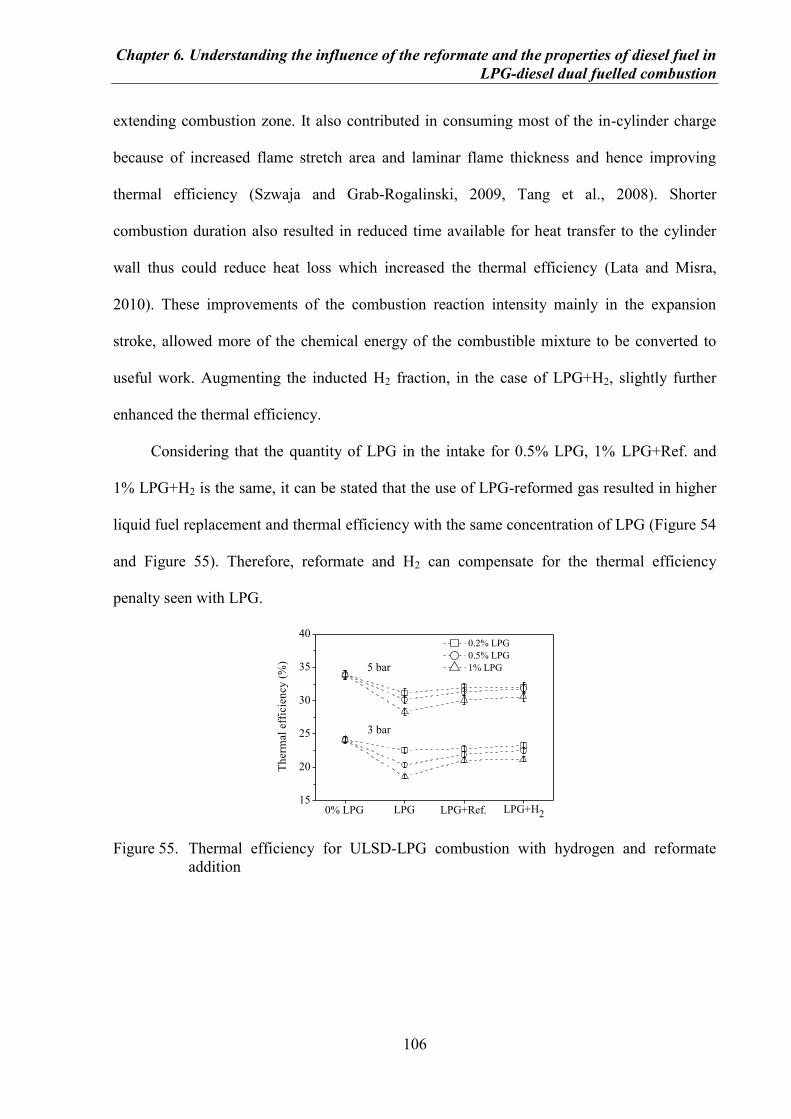
Chapter 6. Understanding the influence of the reformate and the properties of diesel fuel in
LPG-diesel dual fuelled combustion
106
extending combustion zone. It also contributed in consuming most of the in-cylinder charge
because of increased flame stretch area and laminar flame thickness and hence improving
thermal efficiency (Szwaja and Grab-Rogalinski, 2009, Tang et al., 2008). Shorter
combustion duration also resulted in reduced time available for heat transfer to the cylinder
wall thus could reduce heat loss which increased the thermal efficiency (Lata and Misra,
2010). These improvements of the combustion reaction intensity mainly in the expansion
stroke, allowed more of the chemical energy of the combustible mixture to be converted to
useful work. Augmenting the inducted H2 fraction, in the case of LPG+H2, slightly further
enhanced the thermal efficiency.
Considering that the quantity of LPG in the intake for 0.5% LPG, 1% LPG+Ref. and
1% LPG+H2 is the same, it can be stated that the use of LPG-reformed gas resulted in higher
liquid fuel replacement and thermal efficiency with the same concentration of LPG (Figure 54
and Figure 55). Therefore, reformate and H2 can compensate for the thermal efficiency
penalty seen with LPG.
Figure 55. Thermal efficiency for ULSD-LPG combustion with hydrogen and reformate
addition
15
20
25
30
35
40
3 bar
5 bar
0.2% LPG
0.5% LPG
1% LPG
LPG+H2LPG+Ref.LPG0% LPG
Th
erm
al e
ffic
ien
cy (
%)
Chapter 6. Understanding the influence of the reformate and the properties of diesel fuel in
LPG-diesel dual fuelled combustion
107
Regulated engine-out gaseous emissions.
The emissions of total HC and CO with LPG increased compared with the baseline
condition for all tested engine conditions (Figure 56). This could be resulted from non-
homogeneity in the in-cylinder mixture, the delay in the combustion, low temperature
combustion and insufficient oxygen which can lead to unburned propane and other gaseous
emissions formation (Goto et al., 1999, Jian et al., 2001).
However, the application of reformate and H2 as additional fuels to LPG-diesel
improved these emissions. Under reformate addition, HC and CO emissions respectively were
reduced up to 32.6% and 48% at high load while the emissions were reduced of about 34.2%
and 44.7% for HC and CO respectively at low load. This maximum improvement was
achieved at 1% LPG condition. With the H2 addition the H/C ratio of the mixture increased
and also enhanced the homogeneity of the mixture due to the high mass diffusivity of H2
leading to reduced HC and CO emissions (Verhelst and Wallner, 2009). The improved
combustion characteristics seen with the H2 presence as a result of it created in-cylinder
conditions (i.e. higher temperature) that enhanced the LPG combustion efficiency (Szwaja
and Grab-Rogalinski, 2009). However, the increase of CO emissions seen in the case of
reformate addition is due to the un-combusted CO part of the added reformate.
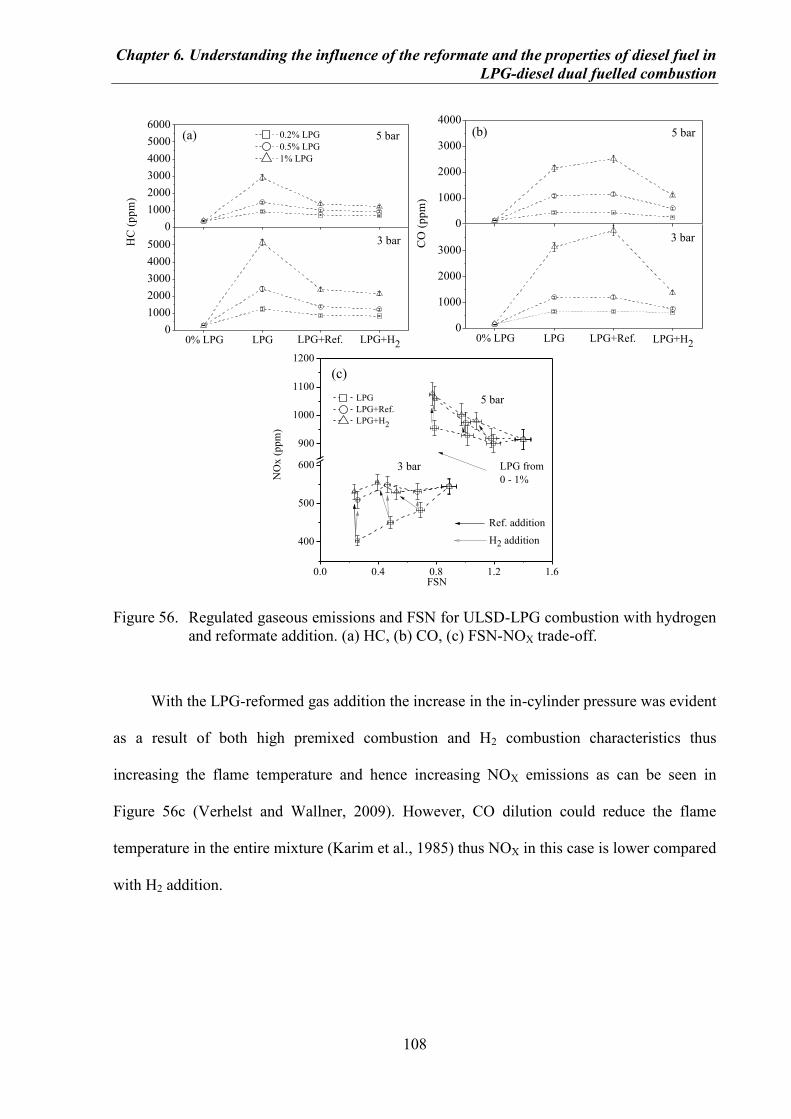
Chapter 6. Understanding the influence of the reformate and the properties of diesel fuel in
LPG-diesel dual fuelled combustion
108
Figure 56. Regulated gaseous emissions and FSN for ULSD-LPG combustion with hydrogen
and reformate addition. (a) HC, (b) CO, (c) FSN-NOX trade-off.
With the LPG-reformed gas addition the increase in the in-cylinder pressure was evident
as a result of both high premixed combustion and H2 combustion characteristics thus
increasing the flame temperature and hence increasing NOX emissions as can be seen in
Figure 56c (Verhelst and Wallner, 2009). However, CO dilution could reduce the flame
temperature in the entire mixture (Karim et al., 1985) thus NOX in this case is lower compared
with H2 addition.
0
1000
2000
3000
4000
5000
(a)
3 bar
5 bar 0.2% LPG
0.5% LPG
1% LPG
LPG+H2LPG+Ref.LPG0% LPG
HC
(p
pm
)
0
1000
2000
3000
4000
5000
6000
0
1000
2000
3000
CO
(p
pm
)
5 bar
3 bar
LPG+H2LPG+Ref.LPG0% LPG
0
1000
2000
3000
4000
(b)
0.0 0.4 0.8 1.2 1.6
400
500
600
900
1000
1100
1200
(c)
LPG
LPG+Ref.
LPG+H2
H2 addition
Ref. addition
LPG from
0 - 1%
5 bar
3 bar
FSN
N
Ox
(p
pm
)
Chapter 6. Understanding the influence of the reformate and the properties of diesel fuel in
LPG-diesel dual fuelled combustion
109
Unregulated engine-out hydrocarbon species.
The HC species produced during dual fuelling are derived from incomplete combustion
or thermal cracking of propane and they will contain three or less carbon atoms in their
molecule. Therefore, the studied species here are volatile hydrocarbons with three or less
atoms of carbon and those which have extensively been studied in standard diesel operation
such as olefin (ethylene, propylene), acetylene, and other short-chain paraffin (methane and
ethane) (Figure 57) (Zervas, 2008, Payri et al., 2009).
The concentration of all of these HC species increased with propane addition especially
at low load. At high load the rates of propane oxidation were improved and the HC species
concentration in the engine exhaust was reduced. This clearly indicates that the emissions are
heavily related to the in-cylinder temperature (thermal pyrolysis) (Flynn et al., 1999).
Among these species, propylene was studied because of its high tendency to generate
ozone (MIR: 11.66). Also, it is one of the first and most abundant compound produced during
the combustion of propane (Lindgren et al., 2011). As it is shown in Figure 57 the propylene
increasing rate in LPG-diesel dual fuel combustion is higher than other hydrocarbons species
with respect to the baseline condition. However, the concentration of these species was
reduced with the addition of the LPG-reformed gas. Beneficial effects of the hydrogen-
enriched gas addition to the emission improvement was more obvious at low load which a
reduction of 33% and 36.1% was achieved due to the reformate and hydrogen addition
respectively. The presence of H2 in the combustion chamber is associated with the improved
oxidation rates of propane due to higher in-cylinder temperatures (e.g. increases cylinder
pressure) compared with LPG addition only. However, the reduction of propylene, acetylene,
ethylene, ethane, and methane species was not proportional to the reduction seen with the
total HC. This could be attributed to the fact that with reformate and H2 propane was involved
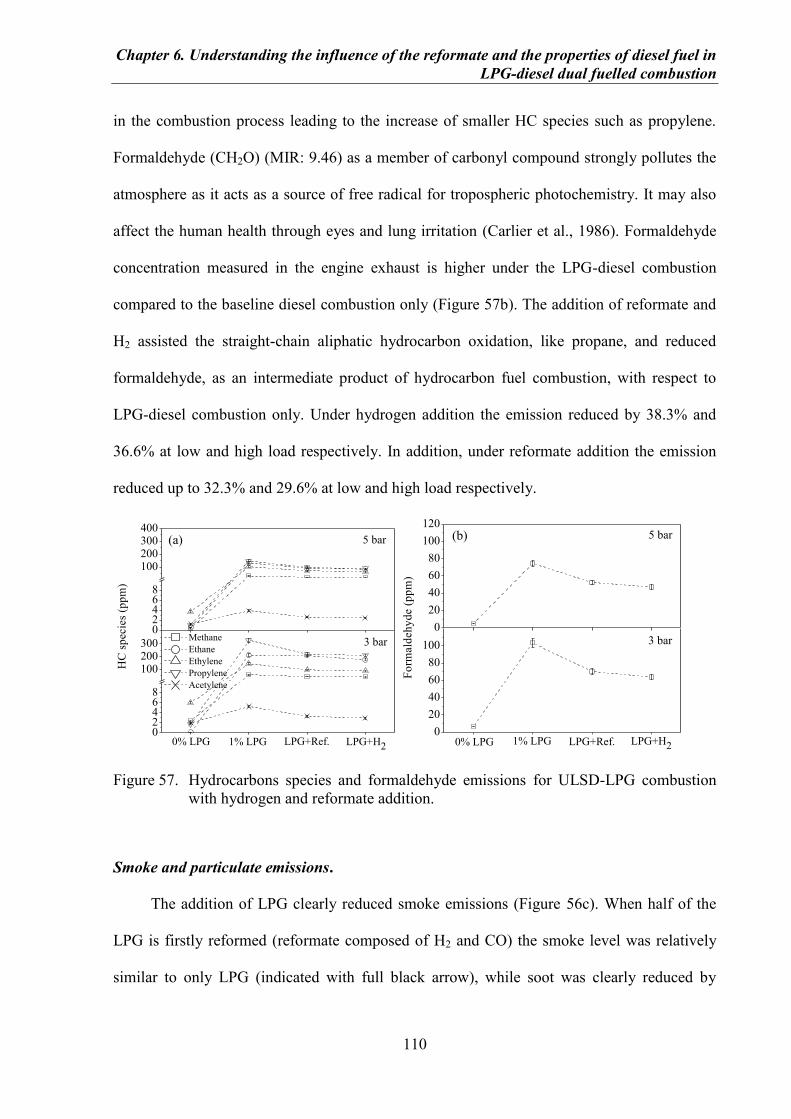
Chapter 6. Understanding the influence of the reformate and the properties of diesel fuel in
LPG-diesel dual fuelled combustion
110
in the combustion process leading to the increase of smaller HC species such as propylene.
Formaldehyde (CH2O) (MIR: 9.46) as a member of carbonyl compound strongly pollutes the
atmosphere as it acts as a source of free radical for tropospheric photochemistry. It may also
affect the human health through eyes and lung irritation (Carlier et al., 1986). Formaldehyde
concentration measured in the engine exhaust is higher under the LPG-diesel combustion
compared to the baseline diesel combustion only (Figure 57b). The addition of reformate and
H2 assisted the straight-chain aliphatic hydrocarbon oxidation, like propane, and reduced
formaldehyde, as an intermediate product of hydrocarbon fuel combustion, with respect to
LPG-diesel combustion only. Under hydrogen addition the emission reduced by 38.3% and
36.6% at low and high load respectively. In addition, under reformate addition the emission
reduced up to 32.3% and 29.6% at low and high load respectively.
Figure 57. Hydrocarbons species and formaldehyde emissions for ULSD-LPG combustion
with hydrogen and reformate addition.
Smoke and particulate emissions.
The addition of LPG clearly reduced smoke emissions (Figure 56c). When half of the
LPG is firstly reformed (reformate composed of H2 and CO) the smoke level was relatively
similar to only LPG (indicated with full black arrow), while soot was clearly reduced by
02468
100200300
Methane
Ethane
Ethylene
Propylene
Acetylene
(a) 5 bar
3 bar
LPG+H2LPG+Ref.1% LPG0% LPG
HC
sp
ecie
s (p
pm
)
02468
100200300400
0
20
40
60
80
100
(b) 5 bar
3 bar
LPG+H2LPG+Ref.1% LPG0% LPG
0
20
40
60
80
100
120
Fo
rmald
eh
yd
e (
pp
m)
Chapter 6. Understanding the influence of the reformate and the properties of diesel fuel in
LPG-diesel dual fuelled combustion
111
complete hydrogen production via the WGSR. This net effect of reformate and hydrogen is
the result of different factors which have been isolated.
Dilution effect (overall lambda). The induction of gaseous fuels replaced liquid fuel and
oxygen in the intake and modified the mixture oxygen stoichiometric requirements.
These effects resulted in a different overall lambda. In all the conditions the overall
lambda for reformate and hydrogen additions are higher than in the case of LPG leading
to lower soot emissions.
Local rich regions effect. It is suggested that the liquid fuel replacement influences not
only the overall lambda but also the local lambda. Gaseous fuels replaced part of the
liquid fuel reducing the formation of locally liquid fuel rich regions in the combustion
chamber, the region where for the most part of soot is produced. The replacement of
liquid fuel with reformate and hydrogen was lower than in the case of LPG (Figure 54).
Therefore, higher soot levels are expected in the case of hydrogen and reformate
compared to LPG due to this effect.
Chemical effects.
Inhibition of soot formation. According to Frenklach and Wang (Frenklach and Wang,
1991) it is suggested that soot formation increases with the increased H/H2 ratio.
Therefore, H2 addition will decrease this ratio and as a result will decrease soot
formation. In addition, it has been suggested that after certain hydrogen concentrations,
further hydrogen addition does not result in further soot reductions when the H/H2
reaches the saturation value (Schefer, 2001, Pandey et al., 2007). In contrast, the effect
of CO is opposite to the hydrogen. CO is oxidised by OH forming atomic hydrogen
thorough the reaction OH + CO = CO2 + H. This results in an increase of the atomic
hydrogen and as a consequence in an enhancement of soot growth.
Chapter 6. Understanding the influence of the reformate and the properties of diesel fuel in
LPG-diesel dual fuelled combustion
112
Enhancement of soot oxidation. Hydrogen addition promotes the formation of OH,
through the reactions H2 + O = OH + H and O2 + H = OH + O (Saxena and Williams,
2006). As the OH radical plays a significant role in the soot precursors and soot
oxidation processing, this could cause a decrease in the number of soot nuclei and the
particle surface area (Pandey et al., 2007). However, when the hydrogen concentration
is higher than the saturation level, there is no further OH promotion (Pandey et al.,
2007). Opposite with the addition of CO the concentration of oxygen and OH radical
are reduced and this could result in a reduction in the soot precursors and soot oxidation
rate.
Thermal effect. The OH production heavily depends on in-cylinder temperature (Dec
and Coy, 1996). As it was shown in the combustion plots, hydrogen increases in-
cylinder temperature and as a result, this could lead to a higher OH concentration
resulting in an enhancement in soot oxidation.
Therefore, it can be concluded that the soot benefit of the hydrogen contained in the
reformate was slowed down by the presence of CO. Coherently, when CO was substituted by
hydrogen a clear reduction in smoke was obtained as an overall result of the different factors
previously discussed. Considering different hydrogen additions, the soot benefits obtained
with hydrogen are lower in 1% LPG addition with respect to 0.2 and 0.5% approaching to the
hydrogen saturation value limit.
Particulate size distribution results are focused on 0.2 and 1% LPG addition as 0.5%
LPG gave an intermediate tendency in both engine loads (Figure 58). The addition of LPG
and the reformate made the concentration for every diameter decreased gradually with the
increase in the gaseous fuels concentration. Further hydrogen addition reduces more the
particle number concentration for each diameter. This trend is coincident to the obtained in
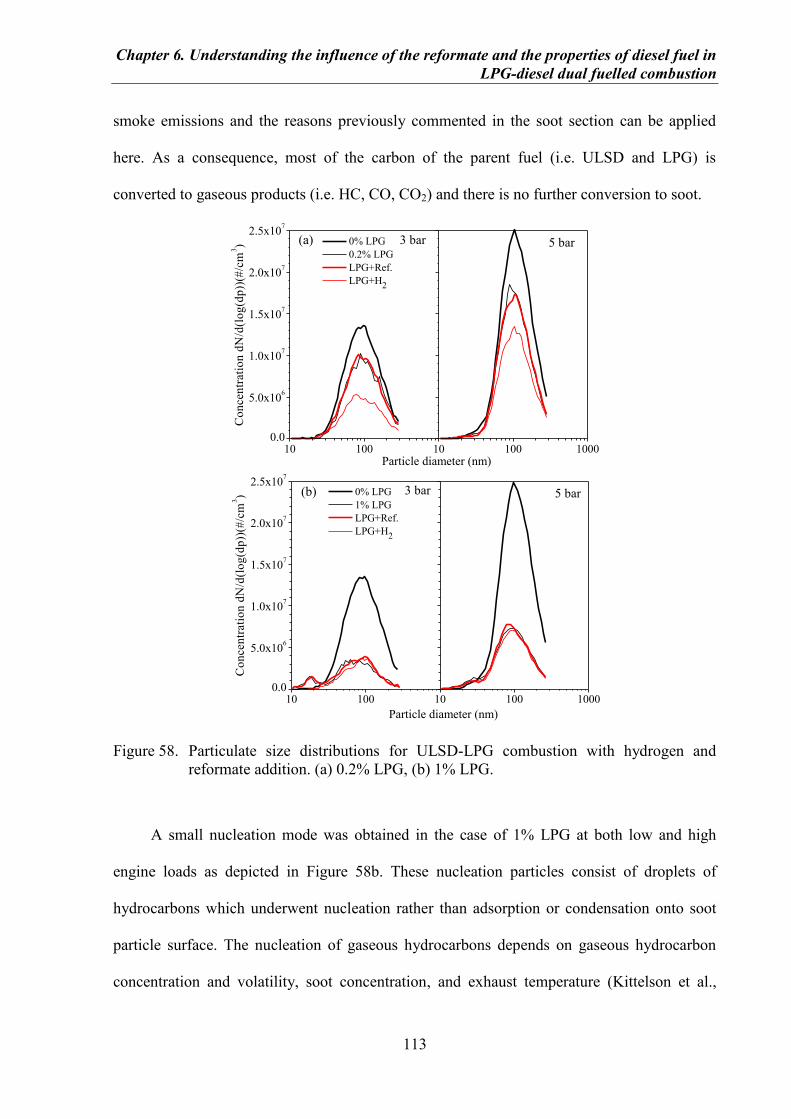
Chapter 6. Understanding the influence of the reformate and the properties of diesel fuel in
LPG-diesel dual fuelled combustion
113
smoke emissions and the reasons previously commented in the soot section can be applied
here. As a consequence, most of the carbon of the parent fuel (i.e. ULSD and LPG) is
converted to gaseous products (i.e. HC, CO, CO2) and there is no further conversion to soot.
Figure 58. Particulate size distributions for ULSD-LPG combustion with hydrogen and
reformate addition. (a) 0.2% LPG, (b) 1% LPG.
A small nucleation mode was obtained in the case of 1% LPG at both low and high
engine loads as depicted in Figure 58b. These nucleation particles consist of droplets of
hydrocarbons which underwent nucleation rather than adsorption or condensation onto soot
particle surface. The nucleation of gaseous hydrocarbons depends on gaseous hydrocarbon
concentration and volatility, soot concentration, and exhaust temperature (Kittelson et al.,
10 1000.0
5.0x10⁶
1.0x10⁷
1.5x10⁷
2.0x10⁷
2.5x10⁷
0% LPG
0.2% LPG
LPG+Ref.
LPG+H2
Co
ncen
trati
on
dN
/d(l
og
(dp
))(#
/cm
3) (a) 3 bar
10 100 1000Particle diameter (nm)
5 bar
10 1000.0
5.0x10⁶
1.0x10⁷
1.5x10⁷
2.0x10⁷
2.5x10⁷
0% LPG
1% LPG
LPG+Ref.
LPG+H2
Co
ncen
trati
on
dN
/d(l
og
(dp
))(#
/cm
3) 3 bar(b)
10 100 1000
Particle diameter (nm)
5 bar
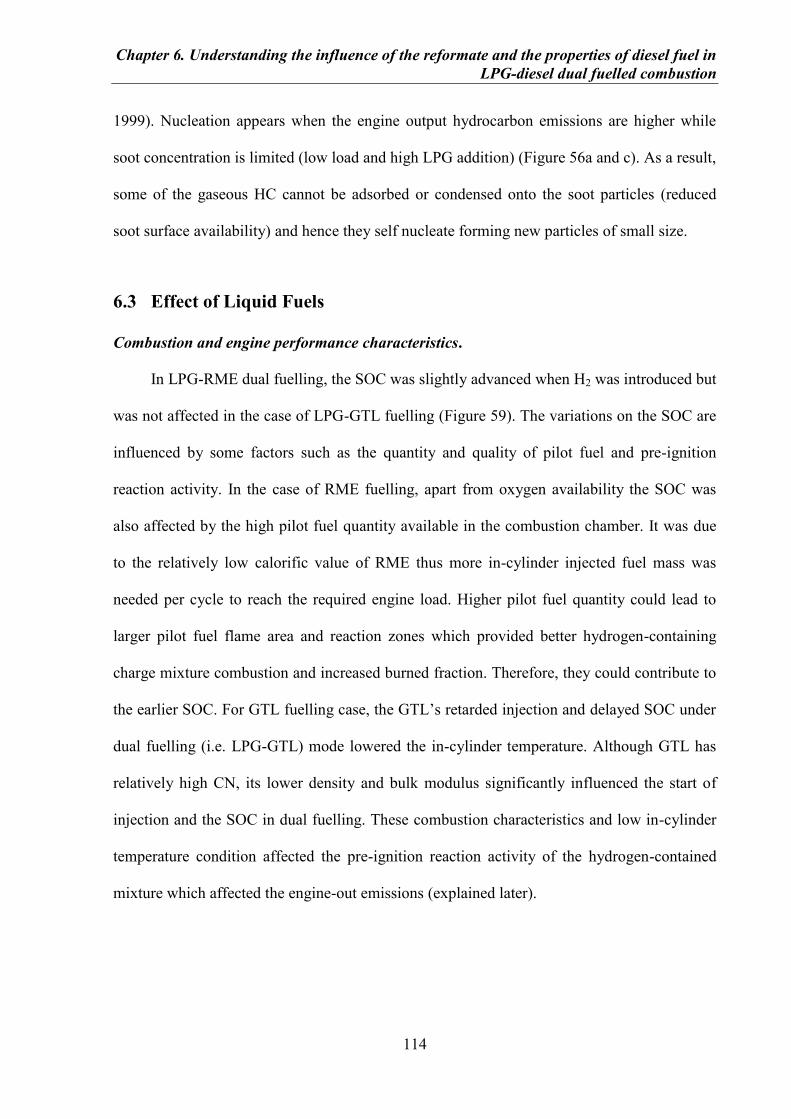
Chapter 6. Understanding the influence of the reformate and the properties of diesel fuel in
LPG-diesel dual fuelled combustion
114
1999). Nucleation appears when the engine output hydrocarbon emissions are higher while
soot concentration is limited (low load and high LPG addition) (Figure 56a and c). As a result,
some of the gaseous HC cannot be adsorbed or condensed onto the soot particles (reduced
soot surface availability) and hence they self nucleate forming new particles of small size.
6.3 Effect of Liquid Fuels
Combustion and engine performance characteristics.
In LPG-RME dual fuelling, the SOC was slightly advanced when H2 was introduced but
was not affected in the case of LPG-GTL fuelling (Figure 59). The variations on the SOC are
influenced by some factors such as the quantity and quality of pilot fuel and pre-ignition
reaction activity. In the case of RME fuelling, apart from oxygen availability the SOC was
also affected by the high pilot fuel quantity available in the combustion chamber. It was due
to the relatively low calorific value of RME thus more in-cylinder injected fuel mass was
needed per cycle to reach the required engine load. Higher pilot fuel quantity could lead to
larger pilot fuel flame area and reaction zones which provided better hydrogen-containing
charge mixture combustion and increased burned fraction. Therefore, they could contribute to
the earlier SOC. For GTL fuelling case, the GTL’s retarded injection and delayed SOC under
dual fuelling (i.e. LPG-GTL) mode lowered the in-cylinder temperature. Although GTL has
relatively high CN, its lower density and bulk modulus significantly influenced the start of
injection and the SOC in dual fuelling. These combustion characteristics and low in-cylinder
temperature condition affected the pre-ignition reaction activity of the hydrogen-contained
mixture which affected the engine-out emissions (explained later).
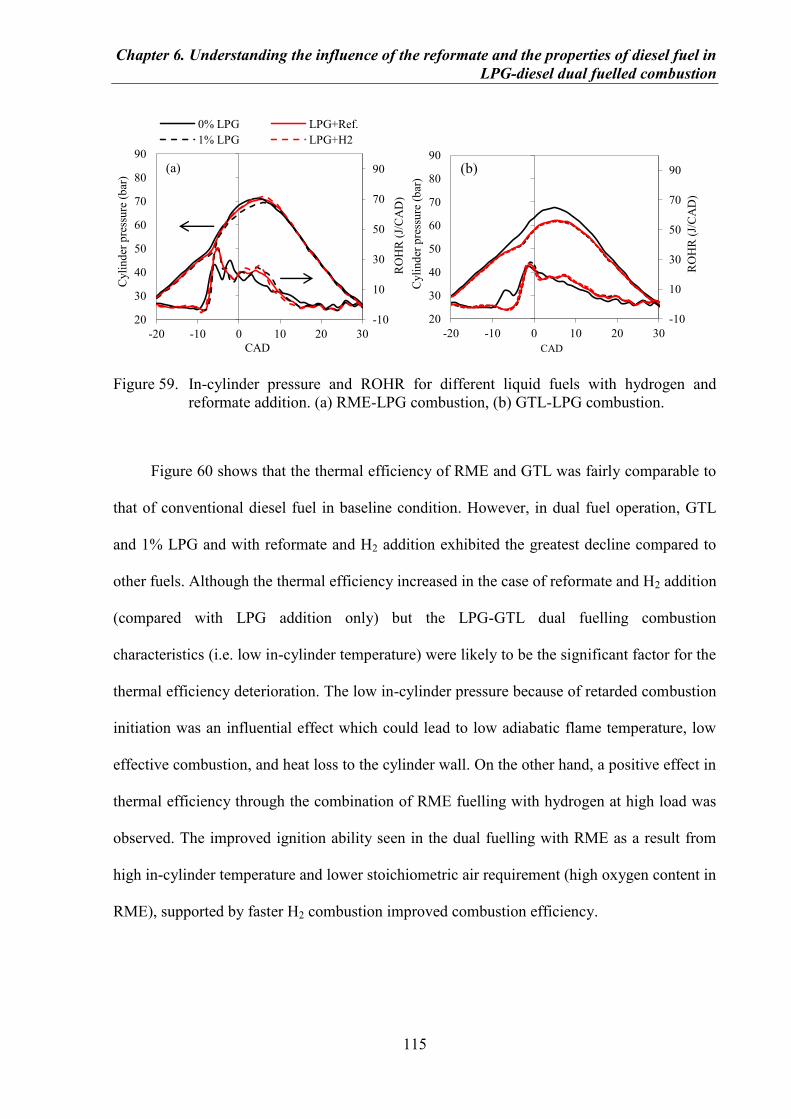
Chapter 6. Understanding the influence of the reformate and the properties of diesel fuel in
LPG-diesel dual fuelled combustion
115
Figure 59. In-cylinder pressure and ROHR for different liquid fuels with hydrogen and
reformate addition. (a) RME-LPG combustion, (b) GTL-LPG combustion.
Figure 60 shows that the thermal efficiency of RME and GTL was fairly comparable to
that of conventional diesel fuel in baseline condition. However, in dual fuel operation, GTL
and 1% LPG and with reformate and H2 addition exhibited the greatest decline compared to
other fuels. Although the thermal efficiency increased in the case of reformate and H2 addition
(compared with LPG addition only) but the LPG-GTL dual fuelling combustion
characteristics (i.e. low in-cylinder temperature) were likely to be the significant factor for the
thermal efficiency deterioration. The low in-cylinder pressure because of retarded combustion
initiation was an influential effect which could lead to low adiabatic flame temperature, low
effective combustion, and heat loss to the cylinder wall. On the other hand, a positive effect in
thermal efficiency through the combination of RME fuelling with hydrogen at high load was
observed. The improved ignition ability seen in the dual fuelling with RME as a result from
high in-cylinder temperature and lower stoichiometric air requirement (high oxygen content in
RME), supported by faster H2 combustion improved combustion efficiency.
-10
10
30
50
70
90
20
30
40
50
60
70
80
90
-20 -10 0 10 20 30
RO
HR
(J/
CA
D)
Cyli
nd
er p
ress
ure
(b
ar)
CAD
0% LPG LPG+Ref.
1% LPG LPG+H2
(a)
-10
10
30
50
70
90
20
30
40
50
60
70
80
90
-20 -10 0 10 20 30
RO
HR
(J/
CA
D)
Cyli
nd
er p
ress
ure
(b
ar)
CAD
(b)
Chapter 6. Understanding the influence of the reformate and the properties of diesel fuel in
LPG-diesel dual fuelled combustion
116
Figure 60. Thermal efficiency for different liquid fuels with hydrogen and reformate
addition.
Regulated engine-out gaseous emissions.
RME exhibited the lowest total HC and CO emission over all the engine operating
conditions (Figure 61). With the use of oxygenated fuel like RME, the oxygen availability in
the fuel spray improved the mixture oxidation. This can compensate the reduced oxygen
concentration in dual fuelling system and improved H2 combustion. In addition, the higher
density of RME also contributed in better in-cylinder charge mixing through better fuel
penetration associated in a non-common rail fuel system and hence released greater energy in
the premixed combustion stage, leading to reduced HC and CO emissions (Rounce et al.,
2010, Sun et al., 2010). It has also been suggested that a fuel with high density has larger
cone-shape spray (Yamane et al., 2001). Therefore, with these better fuel spray characteristics
of RME and diffusivity of H2 could improve mixture homogeneity, flame propagation, and
lead to increased oxidation rates. The low in-cylinder pressure as a result of the late SOC seen
with LPG-GTL fuelling directly impacted the HC and CO emission (Figure 59b). It has been
shown that GTL has advantages in reducing the regulated emissions as a result of its physical
and chemical characteristics. Its high H/C ratio and more volatile combined with H2 addition
were likely to enhance the mixture homogeneity which can result in the reduction in carbon-
15
20
25
30
35
40
3 bar
5 bar
LPG+H2LPG+Ref.1% LPG0% LPG
Th
erm
al e
ffic
ien
cy (
%)
ULSD
RME
GTL
Chapter 6. Understanding the influence of the reformate and the properties of diesel fuel in
LPG-diesel dual fuelled combustion
117
contained emissions. In addition, it was thought that the emissions reduction also supported
by its high ignitability due to GTL’s high CN. However, low in-cylinder temperature as seen
in the LPG-GTL dual fuel combustion characteristics significantly inhibited the HC and CO
oxidation rates. Under low in-cylinder temperature, the charge mixture cannot be completely
burned. Therefore, there was a possibility that part of H2 was not involved in the combustion
as a result of its high autoignition temperature.
NOX emissions were higher with RME and lower with GTL fuelling. It has been
suggested that in mechanical injection system, the high bulk modulus and speed of sound of
biodiesel advanced the start of injection (SOI) leading to advanced combustion pronounced
premixed combustion phase (Schönborn et al., 2009). As a result, an increase in the in-
cylinder temperature elevated the thermal NOX formation. Additionally, another theory
concludes that the low soot produced (explained later) with RME resulted in low soot
radiative heat transfer from flames hence increasing NOX (Schönborn et al., 2009). (Boehman
et al., 2004).
Meanwhile, the low bulk modulus of compressibility and high CN of GTL reduced the
peak of the premixed combustion rate thus hampered the NOX formation rate (Song et al.,
2002). In addition, the relatively lower C/H ratio of GTL than those of other fuels tended to
reduce the adiabatic flame temperature and thus the propensity to produce NOX (Miyamoto et
al., 1998). Under dual fuel mode, the trend of the NOX emissions was kept similar obtaining
the lowest NOX emissions for GTL. In all cases, NOX decreased with LPG addition but
slightly increased with the reformate and H2 addition as it was explained in the previous
section. However, GTL shows better trend where the increasing rate is lower compared to
other fuels and the emission levels are below to those in baseline condition even at high load.
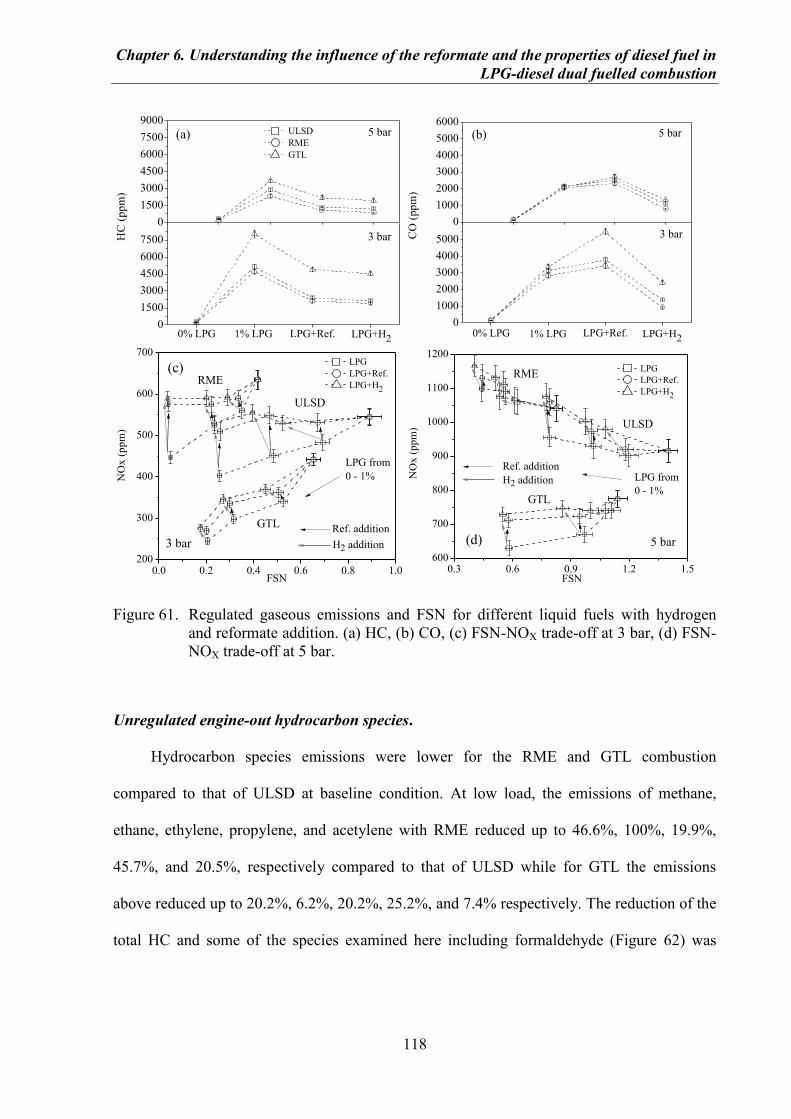
Chapter 6. Understanding the influence of the reformate and the properties of diesel fuel in
LPG-diesel dual fuelled combustion
118
Figure 61. Regulated gaseous emissions and FSN for different liquid fuels with hydrogen
and reformate addition. (a) HC, (b) CO, (c) FSN-NOX trade-off at 3 bar, (d) FSN-
NOX trade-off at 5 bar.
Unregulated engine-out hydrocarbon species.
Hydrocarbon species emissions were lower for the RME and GTL combustion
compared to that of ULSD at baseline condition. At low load, the emissions of methane,
ethane, ethylene, propylene, and acetylene with RME reduced up to 46.6%, 100%, 19.9%,
45.7%, and 20.5%, respectively compared to that of ULSD while for GTL the emissions
above reduced up to 20.2%, 6.2%, 20.2%, 25.2%, and 7.4% respectively. The reduction of the
total HC and some of the species examined here including formaldehyde (Figure 62) was
0
1500
3000
4500
6000
7500
LPG+H2LPG+Ref.1% LPG0% LPG
HC
(p
pm
)
0
1500
3000
4500
6000
7500
9000
(a) 5 bar
3 bar
ULSD
RME
GTL
0
1000
2000
3000
4000
5000CO
(p
pm
)
(b) 5 bar
3 bar
0
1000
2000
3000
4000
5000
6000
LPG+H2LPG+Ref.1% LPG0% LPG
0.0 0.2 0.4 0.6 0.8 1.0200
300
400
500
600
700
3 bar
FSN
LPG
LPG+Ref.
LPG+H2
(c)RME
ULSD
GTL
LPG from
0 - 1%
H2 addition
Ref. addition
NO
x (
pp
m)
0.3 0.6 0.9 1.2 1.5600
700
800
900
1000
1100
1200
(d) 5 bar
LPG
LPG+Ref.
LPG+H2
RME
ULSD
GTL
LPG from
0 - 1% H2 addition
Ref. addition
NO
x (
pp
m)
FSN
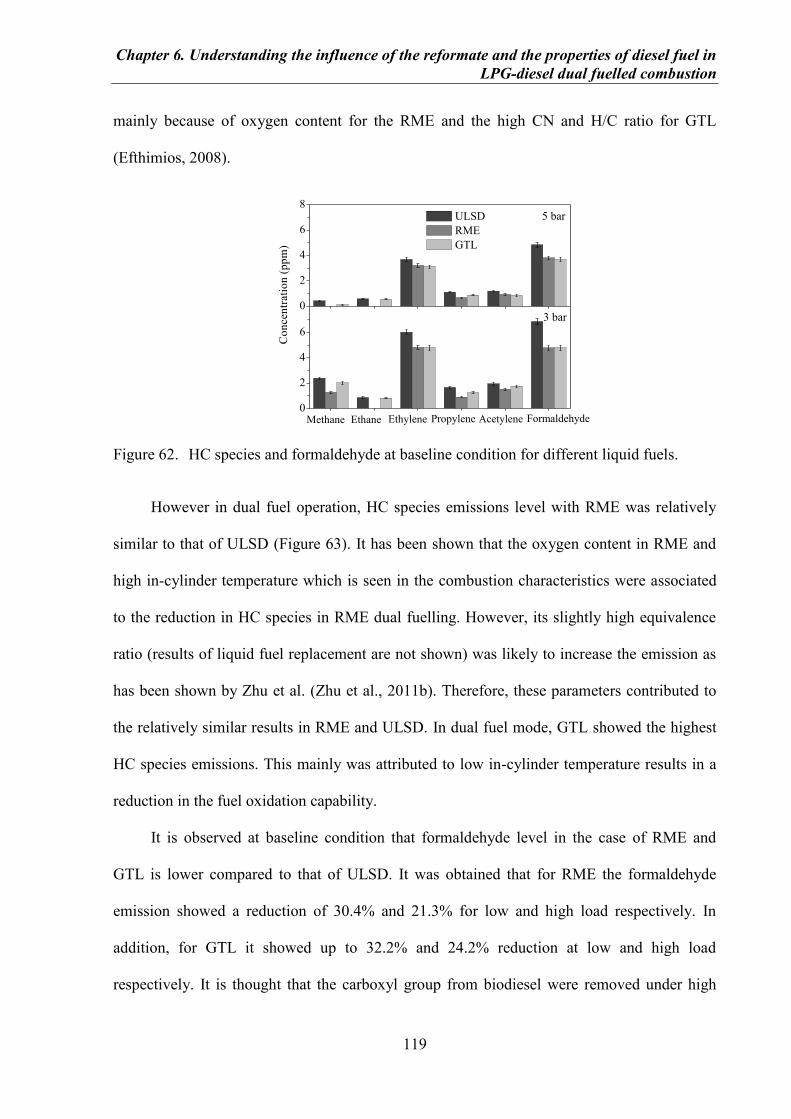
Chapter 6. Understanding the influence of the reformate and the properties of diesel fuel in
LPG-diesel dual fuelled combustion
119
mainly because of oxygen content for the RME and the high CN and H/C ratio for GTL
(Efthimios, 2008).
Figure 62. HC species and formaldehyde at baseline condition for different liquid fuels.
However in dual fuel operation, HC species emissions level with RME was relatively
similar to that of ULSD (Figure 63). It has been shown that the oxygen content in RME and
high in-cylinder temperature which is seen in the combustion characteristics were associated
to the reduction in HC species in RME dual fuelling. However, its slightly high equivalence
ratio (results of liquid fuel replacement are not shown) was likely to increase the emission as
has been shown by Zhu et al. (Zhu et al., 2011b). Therefore, these parameters contributed to
the relatively similar results in RME and ULSD. In dual fuel mode, GTL showed the highest
HC species emissions. This mainly was attributed to low in-cylinder temperature results in a
reduction in the fuel oxidation capability.
It is observed at baseline condition that formaldehyde level in the case of RME and
GTL is lower compared to that of ULSD. It was obtained that for RME the formaldehyde
emission showed a reduction of 30.4% and 21.3% for low and high load respectively. In
addition, for GTL it showed up to 32.2% and 24.2% reduction at low and high load
respectively. It is thought that the carboxyl group from biodiesel were removed under high
0
2
4
6
0
2
4
6
8
Co
ncen
trati
on
(p
pm
)
FormaldehydeAcetylenePropyleneEthyleneEthaneMethane
3 bar
5 bar ULSD
RME
GTL
Chapter 6. Understanding the influence of the reformate and the properties of diesel fuel in
LPG-diesel dual fuelled combustion
120
temperature, decarboxylation, reducing the propensity to form oxygenated compounds
(Lapuerta et al., 2008a). The decrease of formaldehyde also can be linked to the increased
H/C ratio hence we would expect a decrease of the emission with GTL fuelling (Zervas et al.,
2002). As in the case of the other HC species, the formaldehyde emission tends to increase in
dual fuel operation. It indicates that formaldehyde emissions not always associated to initial
pilot fuel composition but from multiple sources (like unburned propane) and species in the
combustion chamber (Zervas et al., 2002). However, the LPG-reformed gas addition reduced
the studied hydrocarbon species. The hydrogen combustion facilitated the thermal cracking
process of propane as a saturated hydrocarbon by removing the hydrogen and carbon atoms
from molecular structure became short-chain hydrocarbon molecules.
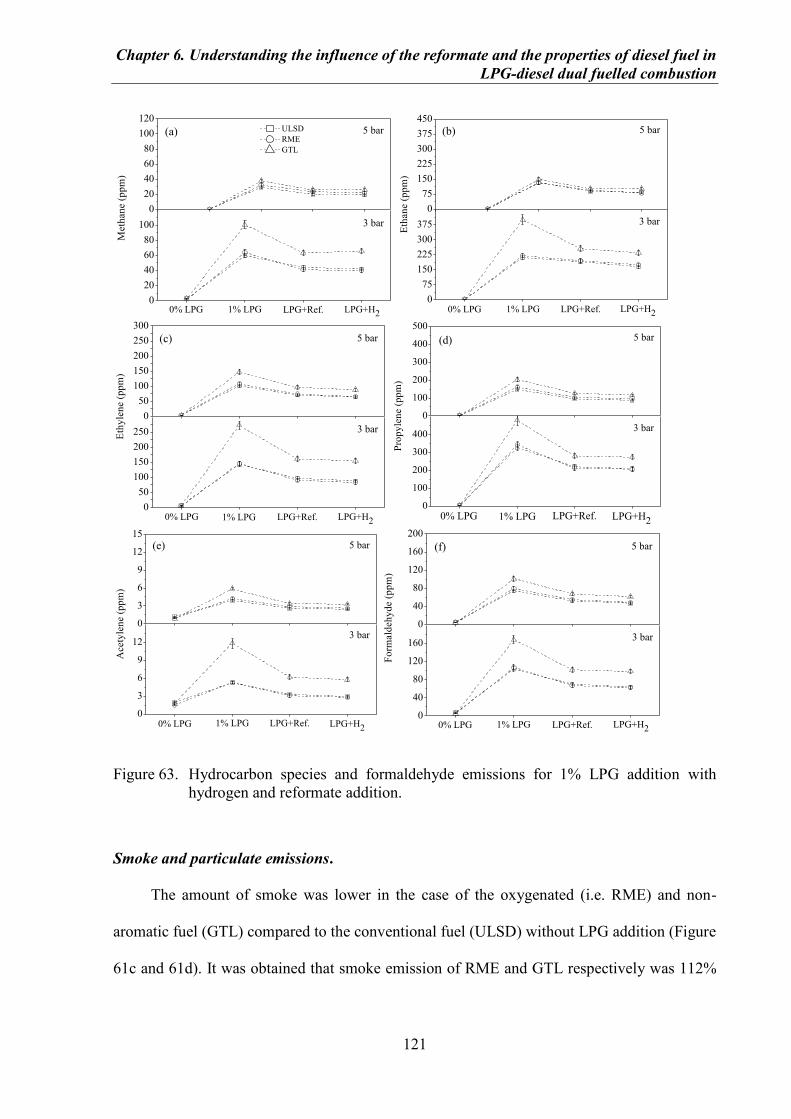
Chapter 6. Understanding the influence of the reformate and the properties of diesel fuel in
LPG-diesel dual fuelled combustion
121
Figure 63. Hydrocarbon species and formaldehyde emissions for 1% LPG addition with
hydrogen and reformate addition.
Smoke and particulate emissions.
The amount of smoke was lower in the case of the oxygenated (i.e. RME) and non-
aromatic fuel (GTL) compared to the conventional fuel (ULSD) without LPG addition (Figure
61c and 61d). It was obtained that smoke emission of RME and GTL respectively was 112%
0
20
40
60
80
100
LPG+H2LPG+Ref.1% LPG0% LPG
Meth
an
e (
pp
m)
0
20
40
60
80
100
120
3 bar
5 bar(a) ULSD
RME
GTL
0
75
150
225
300
375
(b) 5 bar
3 bar
0
75
150
225
300
375
450
LPG+H2LPG+Ref.1% LPG0% LPG
Eth
an
e (
pp
m)
0
50
100
150
200
250
0
50
100
150
200
250
300
LPG+H2LPG+Ref.1% LPG0% LPG
Eth
yle
ne (
pp
m)
3 bar
5 bar(c)
0
100
200
300
400
0
100
200
300
400
500
(d) 5 bar
3 bar
LPG+H2LPG+Ref.1% LPG0% LPG
Pro
py
len
e (
pp
m)
0
3
6
9
12
(e) 5 bar
3 bar
0
3
6
9
12
15
LPG+H2LPG+Ref.1% LPG0% LPG
Acety
len
e (
pp
m)
0
40
80
120
160
(f)
3 bar
5 bar
LPG+H2LPG+Ref.1% LPG0% LPG
Fo
rmald
eh
yd
e (
pp
m)
0
40
80
120
160
200
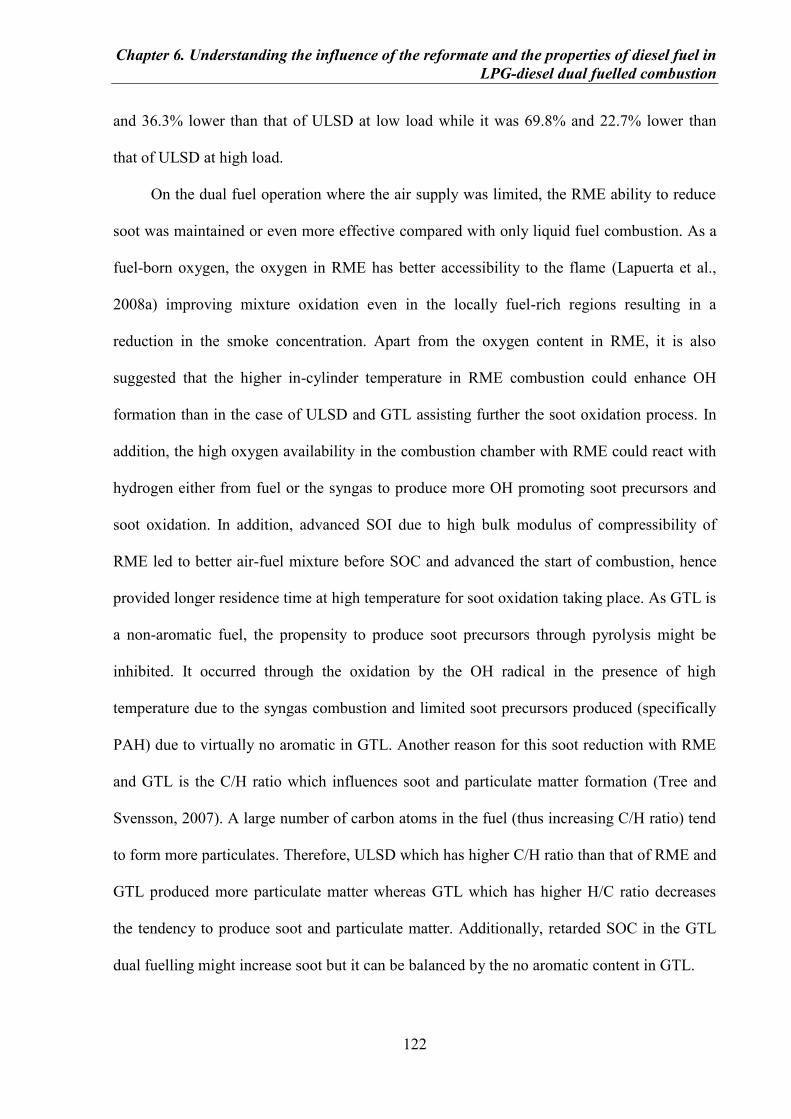
Chapter 6. Understanding the influence of the reformate and the properties of diesel fuel in
LPG-diesel dual fuelled combustion
122
and 36.3% lower than that of ULSD at low load while it was 69.8% and 22.7% lower than
that of ULSD at high load.
On the dual fuel operation where the air supply was limited, the RME ability to reduce
soot was maintained or even more effective compared with only liquid fuel combustion. As a
fuel-born oxygen, the oxygen in RME has better accessibility to the flame (Lapuerta et al.,
2008a) improving mixture oxidation even in the locally fuel-rich regions resulting in a
reduction in the smoke concentration. Apart from the oxygen content in RME, it is also
suggested that the higher in-cylinder temperature in RME combustion could enhance OH
formation than in the case of ULSD and GTL assisting further the soot oxidation process. In
addition, the high oxygen availability in the combustion chamber with RME could react with
hydrogen either from fuel or the syngas to produce more OH promoting soot precursors and
soot oxidation. In addition, advanced SOI due to high bulk modulus of compressibility of
RME led to better air-fuel mixture before SOC and advanced the start of combustion, hence
provided longer residence time at high temperature for soot oxidation taking place. As GTL is
a non-aromatic fuel, the propensity to produce soot precursors through pyrolysis might be
inhibited. It occurred through the oxidation by the OH radical in the presence of high
temperature due to the syngas combustion and limited soot precursors produced (specifically
PAH) due to virtually no aromatic in GTL. Another reason for this soot reduction with RME
and GTL is the C/H ratio which influences soot and particulate matter formation (Tree and
Svensson, 2007). A large number of carbon atoms in the fuel (thus increasing C/H ratio) tend
to form more particulates. Therefore, ULSD which has higher C/H ratio than that of RME and
GTL produced more particulate matter whereas GTL which has higher H/C ratio decreases
the tendency to produce soot and particulate matter. Additionally, retarded SOC in the GTL
dual fuelling might increase soot but it can be balanced by the no aromatic content in GTL.
Chapter 6. Understanding the influence of the reformate and the properties of diesel fuel in
LPG-diesel dual fuelled combustion
123
Figure 64. Particulate size distributions for RME and GTL-LPG combustion with hydrogen
and reformate addition.
It is clearly shown that the particulate number concentration (Figure 64) was reduced in
every diameter size with the application of dual fuel mode, and the level concentration trend
was kept similar to the baseline condition, and followed the general trend ULSD > GTL >
RME. Apart from the reduced fuelling levels and the reasons explained in the smoke section,
another argument for low PM can be the lower sulphate in RME and GTL compared with
ULSD (Table 3) which results in low contribution to the sulphate fraction.
6.4 Summary
Reformate and H2 combustion has shown to have the capability to increase the thermal
efficiency and reduce gaseous (both regulated and unregulated) and particulate emission with
respect to LPG-diesel dual fuel combustion. These benefits are heavily attributed to the
chemical and physical H2 characteristics contained in the LPG-reformed gas.
The formation and oxidation of soot through LPG-reformed gas was associated to
thermal, dilution and chemistry effects. Smoke and PM emissions under H2 addition was
lower than those of reformate addition. It was also obtained that smoke and PM was improved
10 1000.0
5.0x10⁶
1.0x10⁷
1.5x10⁷
2.0x10⁷
2.5x10⁷
0% LPG
1% LPG
LPG+Ref.
LPG+H2
Co
ncen
trati
on
dN
/d(l
og
(dp
))(#
/cm
3) RME, 3 bar
10 100 1000
Particle diameter (nm)
GTL, 3 bar
Chapter 6. Understanding the influence of the reformate and the properties of diesel fuel in
LPG-diesel dual fuelled combustion
124
especially in the case of 0.2 and 0.5%, while there were not significant further reductions in
1% LPG addition. Therefore, the amount of the inducted H2 can be optimised in order to get
the best compromise between NOX and soot.
RME as a pilot fuel in LPG-reformed diesel dual fuelling mode produced a synergistic
effect with H2 addition through better improvement in thermal efficiency and regulated
emissions excluding NOX than the rest of liquid fuels. These were achieved by high bulk
modulus and oxygen content. However, in the case of GTL dual fuelling deterioration in both
regulated (HC and CO) and unregulated emissions and also thermal efficiency were obtained
as a result of its properties which affected the combustion characteristics and thus engine
performance and emissions. The use of GTL in LPG-reformed dual fuel however, improved
the soot-NOX trade-off. It also showed a great potential where the increase of NOX under
reformate and H2 addition could be minimised with the use of GTL.
CHAPTER 7
CONCLUSIONS
7.1 Concluding Remarks
An experimental study in dual fuel combustion mode has been carried out in order to
explore the potential of alternative fuels, both gaseous and liquid fuels, in diesel engines with
various engine operating conditions. The work is also extended to improve the engine
performance and engine-out emissions by employing different approaches. This section
summarises the findings of the works and recommends some future work to extend the
knowledge in the dual fuelled engine operation.
7.1.1 Gaseous Fuel Effect
The introduction of gaseous fuels (biogas and LPG) in diesel engines (dual fuel
combustion mode) was feasible as it offered simultaneous advantages in improving the soot –
NOX trade-off, fuel flexibility, and reduction in the conventional liquid fuel utilisation. All the
benefits were achieved without employing significant additional devices or engine adaptation.
However, there should be a maximum limit to the inducted gaseous fuels concentration to
resist the deterioration in engine thermal efficiency and gaseous hydrocarbon emissions (HC,
CO). This work showed that LPG was more promising for fuel saving as less LPG was
required to replace a similar amount of liquid fuel compared to that of biogas. It indicated that
upgrading the biogas quality by reducing CO2 content might further improve its utilisation in
dual fuelled engine. In addition, differences in the gaseous fuel properties affected the
combustion characteristics differently (i.e. in-cylinder temperature) leading to a variation in
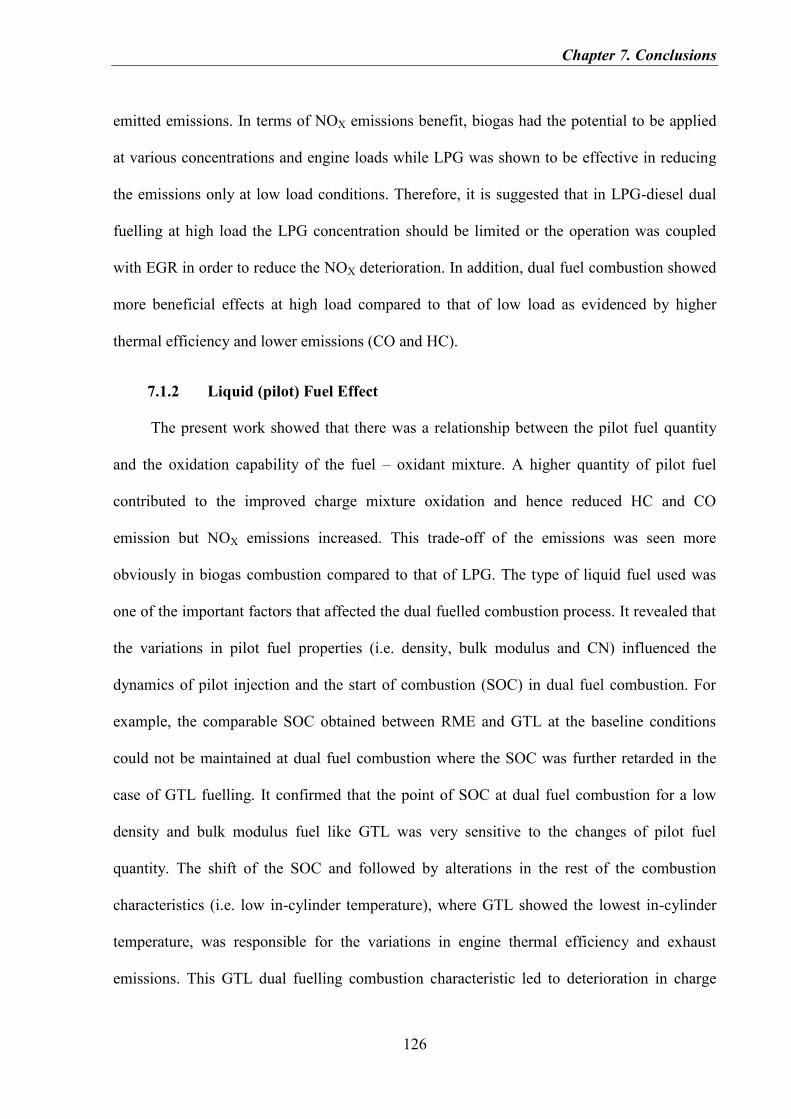
Chapter 7. Conclusions
126
emitted emissions. In terms of NOX emissions benefit, biogas had the potential to be applied
at various concentrations and engine loads while LPG was shown to be effective in reducing
the emissions only at low load conditions. Therefore, it is suggested that in LPG-diesel dual
fuelling at high load the LPG concentration should be limited or the operation was coupled
with EGR in order to reduce the NOX deterioration. In addition, dual fuel combustion showed
more beneficial effects at high load compared to that of low load as evidenced by higher
thermal efficiency and lower emissions (CO and HC).
7.1.2 Liquid (pilot) Fuel Effect
The present work showed that there was a relationship between the pilot fuel quantity
and the oxidation capability of the fuel – oxidant mixture. A higher quantity of pilot fuel
contributed to the improved charge mixture oxidation and hence reduced HC and CO
emission but NOX emissions increased. This trade-off of the emissions was seen more
obviously in biogas combustion compared to that of LPG. The type of liquid fuel used was
one of the important factors that affected the dual fuelled combustion process. It revealed that
the variations in pilot fuel properties (i.e. density, bulk modulus and CN) influenced the
dynamics of pilot injection and the start of combustion (SOC) in dual fuel combustion. For
example, the comparable SOC obtained between RME and GTL at the baseline conditions
could not be maintained at dual fuel combustion where the SOC was further retarded in the
case of GTL fuelling. It confirmed that the point of SOC at dual fuel combustion for a low
density and bulk modulus fuel like GTL was very sensitive to the changes of pilot fuel
quantity. The shift of the SOC and followed by alterations in the rest of the combustion
characteristics (i.e. low in-cylinder temperature), where GTL showed the lowest in-cylinder
temperature, was responsible for the variations in engine thermal efficiency and exhaust
emissions. This GTL dual fuelling combustion characteristic led to deterioration in charge
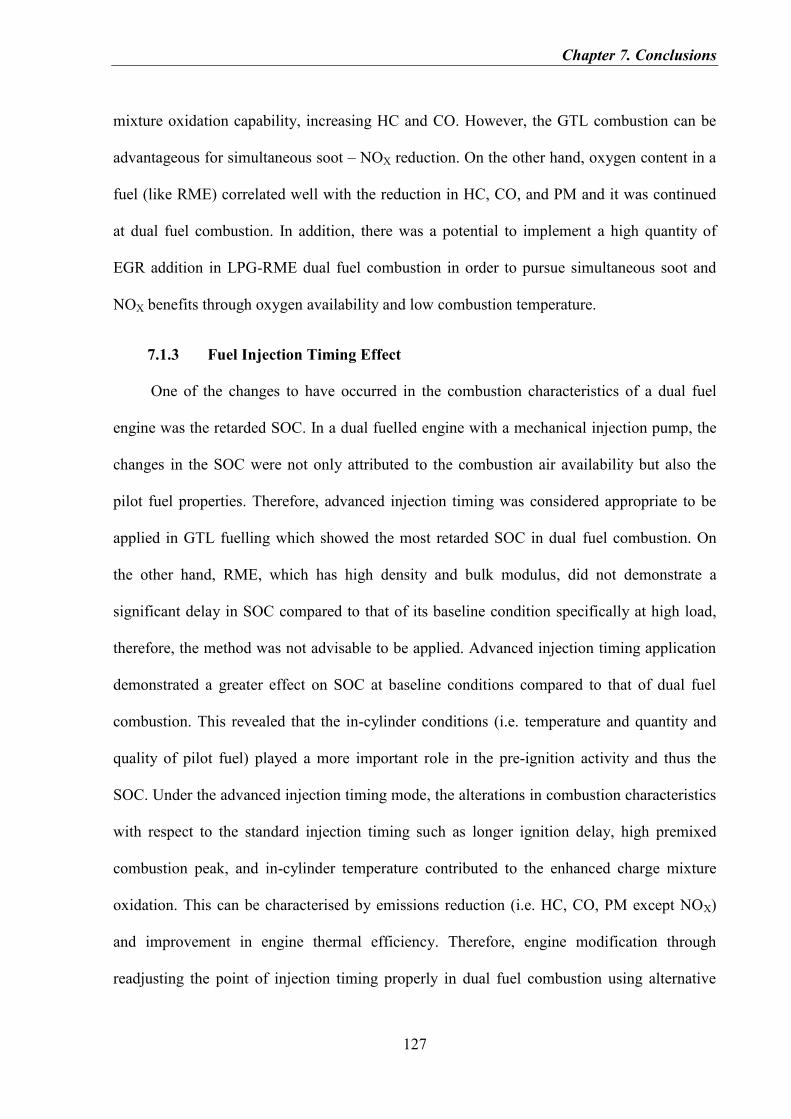
Chapter 7. Conclusions
127
mixture oxidation capability, increasing HC and CO. However, the GTL combustion can be
advantageous for simultaneous soot – NOX reduction. On the other hand, oxygen content in a
fuel (like RME) correlated well with the reduction in HC, CO, and PM and it was continued
at dual fuel combustion. In addition, there was a potential to implement a high quantity of
EGR addition in LPG-RME dual fuel combustion in order to pursue simultaneous soot and
NOX benefits through oxygen availability and low combustion temperature.
7.1.3 Fuel Injection Timing Effect
One of the changes to have occurred in the combustion characteristics of a dual fuel
engine was the retarded SOC. In a dual fuelled engine with a mechanical injection pump, the
changes in the SOC were not only attributed to the combustion air availability but also the
pilot fuel properties. Therefore, advanced injection timing was considered appropriate to be
applied in GTL fuelling which showed the most retarded SOC in dual fuel combustion. On
the other hand, RME, which has high density and bulk modulus, did not demonstrate a
significant delay in SOC compared to that of its baseline condition specifically at high load,
therefore, the method was not advisable to be applied. Advanced injection timing application
demonstrated a greater effect on SOC at baseline conditions compared to that of dual fuel
combustion. This revealed that the in-cylinder conditions (i.e. temperature and quantity and
quality of pilot fuel) played a more important role in the pre-ignition activity and thus the
SOC. Under the advanced injection timing mode, the alterations in combustion characteristics
with respect to the standard injection timing such as longer ignition delay, high premixed
combustion peak, and in-cylinder temperature contributed to the enhanced charge mixture
oxidation. This can be characterised by emissions reduction (i.e. HC, CO, PM except NOX)
and improvement in engine thermal efficiency. Therefore, engine modification through
readjusting the point of injection timing properly in dual fuel combustion using alternative
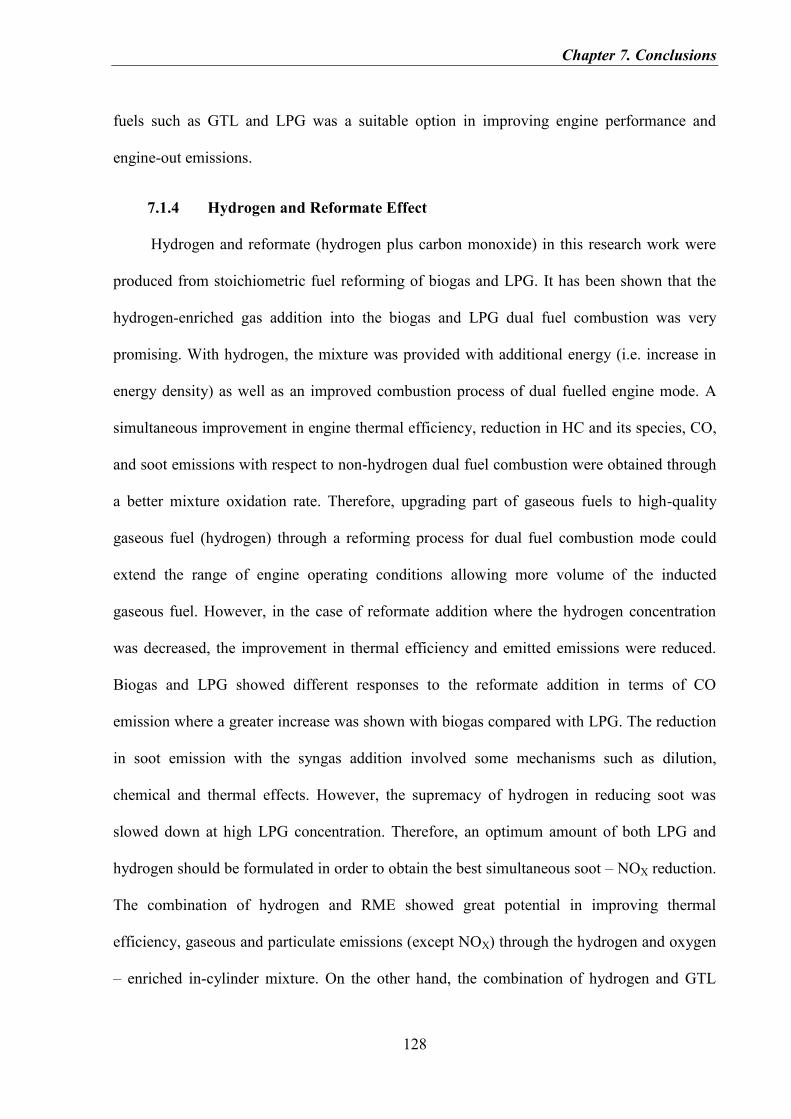
Chapter 7. Conclusions
128
fuels such as GTL and LPG was a suitable option in improving engine performance and
engine-out emissions.
7.1.4 Hydrogen and Reformate Effect
Hydrogen and reformate (hydrogen plus carbon monoxide) in this research work were
produced from stoichiometric fuel reforming of biogas and LPG. It has been shown that the
hydrogen-enriched gas addition into the biogas and LPG dual fuel combustion was very
promising. With hydrogen, the mixture was provided with additional energy (i.e. increase in
energy density) as well as an improved combustion process of dual fuelled engine mode. A
simultaneous improvement in engine thermal efficiency, reduction in HC and its species, CO,
and soot emissions with respect to non-hydrogen dual fuel combustion were obtained through
a better mixture oxidation rate. Therefore, upgrading part of gaseous fuels to high-quality
gaseous fuel (hydrogen) through a reforming process for dual fuel combustion mode could
extend the range of engine operating conditions allowing more volume of the inducted
gaseous fuel. However, in the case of reformate addition where the hydrogen concentration
was decreased, the improvement in thermal efficiency and emitted emissions were reduced.
Biogas and LPG showed different responses to the reformate addition in terms of CO
emission where a greater increase was shown with biogas compared with LPG. The reduction
in soot emission with the syngas addition involved some mechanisms such as dilution,
chemical and thermal effects. However, the supremacy of hydrogen in reducing soot was
slowed down at high LPG concentration. Therefore, an optimum amount of both LPG and
hydrogen should be formulated in order to obtain the best simultaneous soot – NOX reduction.
The combination of hydrogen and RME showed great potential in improving thermal
efficiency, gaseous and particulate emissions (except NOX) through the hydrogen and oxygen
– enriched in-cylinder mixture. On the other hand, the combination of hydrogen and GTL
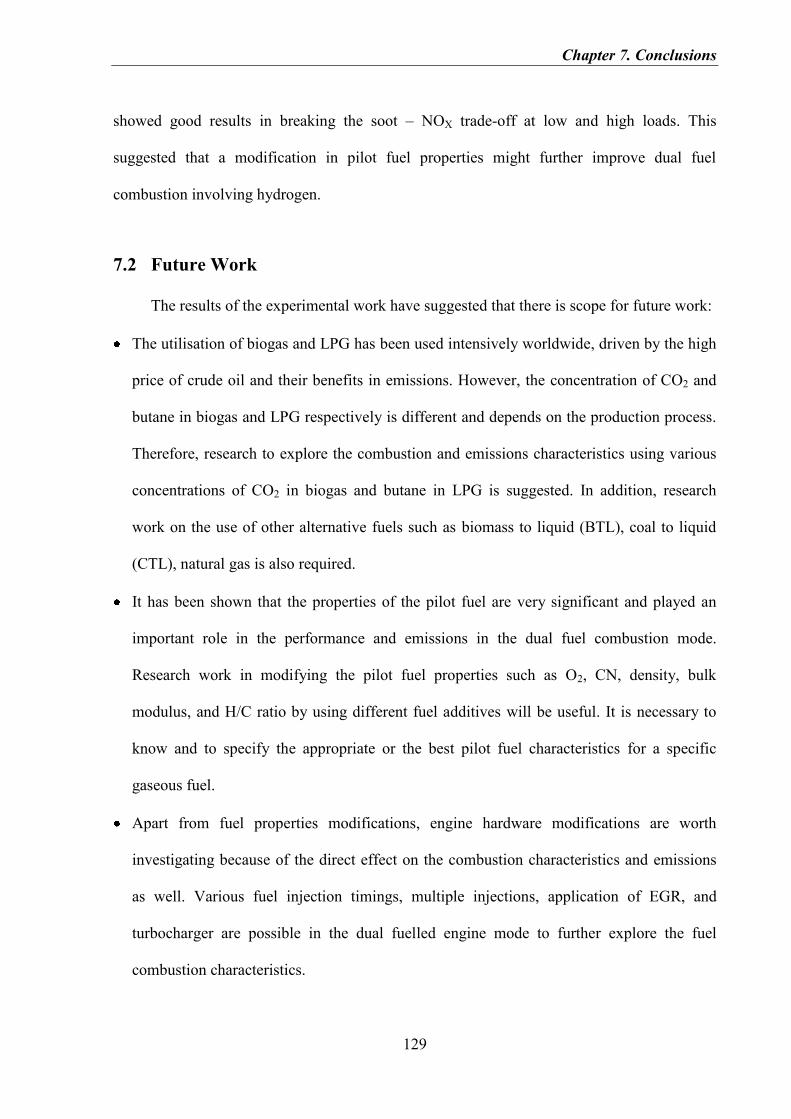
Chapter 7. Conclusions
129
showed good results in breaking the soot – NOX trade-off at low and high loads. This
suggested that a modification in pilot fuel properties might further improve dual fuel
combustion involving hydrogen.
7.2 Future Work
The results of the experimental work have suggested that there is scope for future work:
The utilisation of biogas and LPG has been used intensively worldwide, driven by the high
price of crude oil and their benefits in emissions. However, the concentration of CO2 and
butane in biogas and LPG respectively is different and depends on the production process.
Therefore, research to explore the combustion and emissions characteristics using various
concentrations of CO2 in biogas and butane in LPG is suggested. In addition, research
work on the use of other alternative fuels such as biomass to liquid (BTL), coal to liquid
(CTL), natural gas is also required.
It has been shown that the properties of the pilot fuel are very significant and played an
important role in the performance and emissions in the dual fuel combustion mode.
Research work in modifying the pilot fuel properties such as O2, CN, density, bulk
modulus, and H/C ratio by using different fuel additives will be useful. It is necessary to
know and to specify the appropriate or the best pilot fuel characteristics for a specific
gaseous fuel.
Apart from fuel properties modifications, engine hardware modifications are worth
investigating because of the direct effect on the combustion characteristics and emissions
as well. Various fuel injection timings, multiple injections, application of EGR, and
turbocharger are possible in the dual fuelled engine mode to further explore the fuel
combustion characteristics.
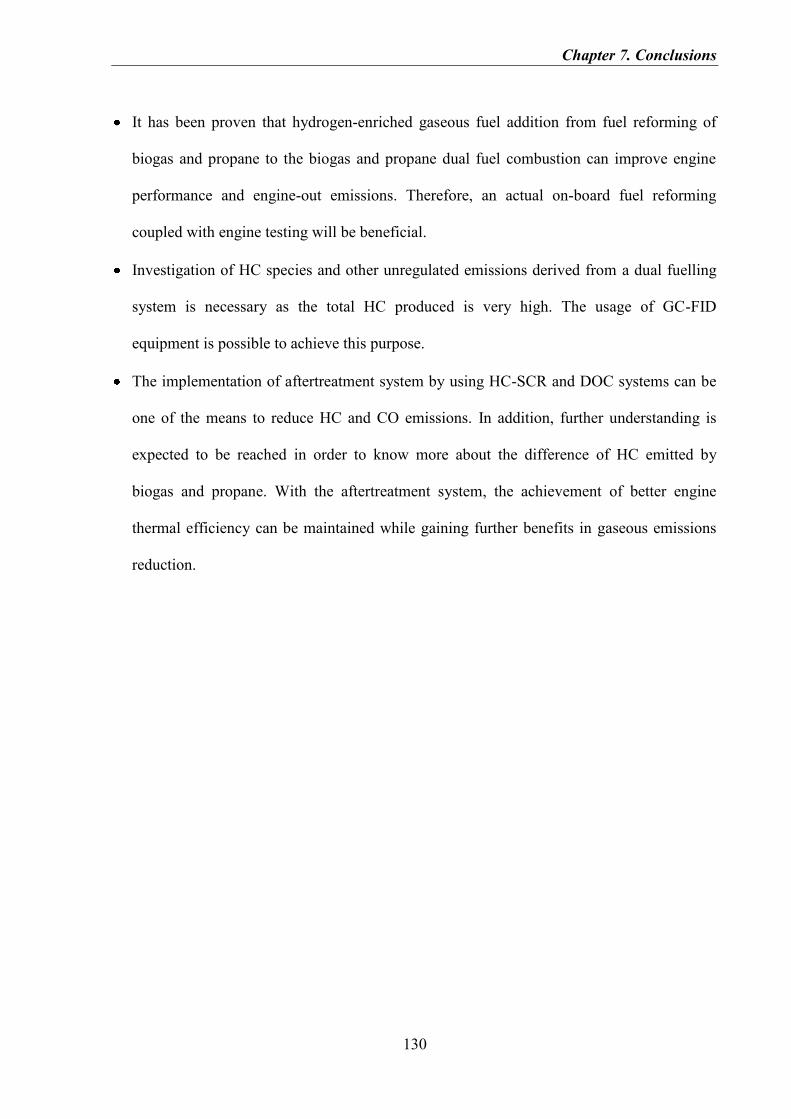
Chapter 7. Conclusions
130
It has been proven that hydrogen-enriched gaseous fuel addition from fuel reforming of
biogas and propane to the biogas and propane dual fuel combustion can improve engine
performance and engine-out emissions. Therefore, an actual on-board fuel reforming
coupled with engine testing will be beneficial.
Investigation of HC species and other unregulated emissions derived from a dual fuelling
system is necessary as the total HC produced is very high. The usage of GC-FID
equipment is possible to achieve this purpose.
The implementation of aftertreatment system by using HC-SCR and DOC systems can be
one of the means to reduce HC and CO emissions. In addition, further understanding is
expected to be reached in order to know more about the difference of HC emitted by
biogas and propane. With the aftertreatment system, the achievement of better engine
thermal efficiency can be maintained while gaining further benefits in gaseous emissions
reduction.
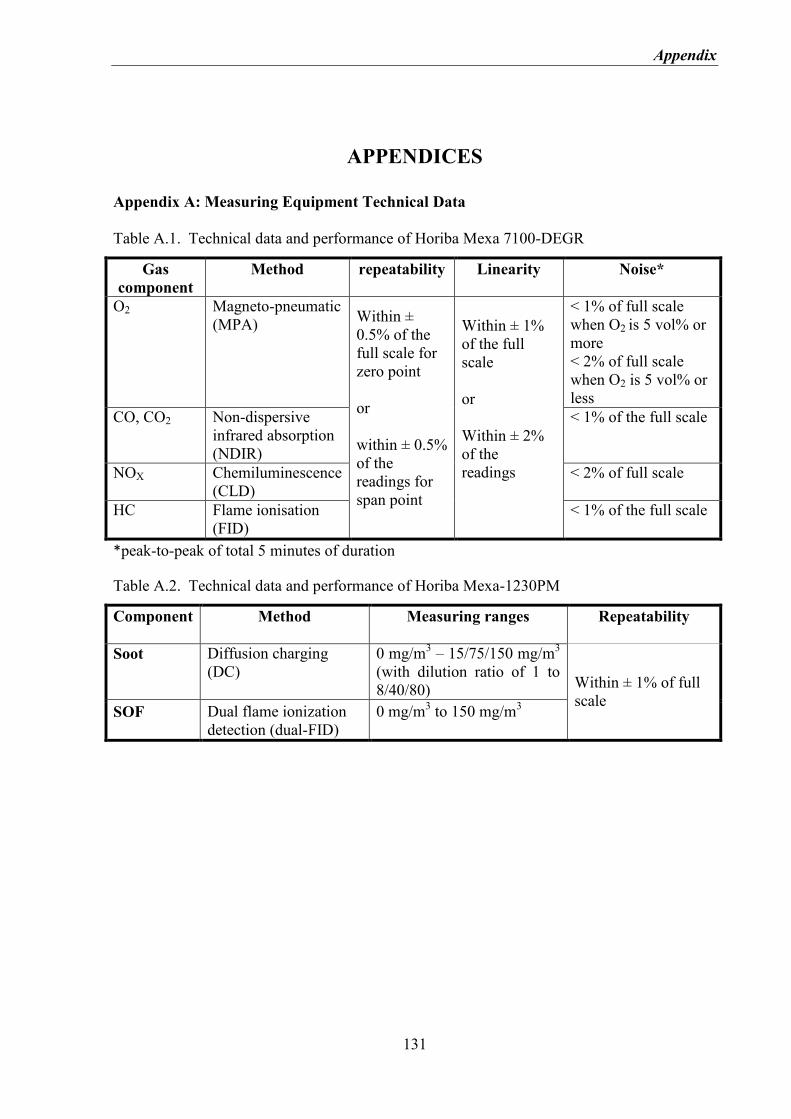
Appendix
131
APPENDICES
Appendix A: Measuring Equipment Technical Data
Table A.1. Technical data and performance of Horiba Mexa 7100-DEGR
Gas
component
Method repeatability Linearity Noise*
O2 Magneto-pneumatic
(MPA) Within ±
0.5% of the
full scale for
zero point
or
within ± 0.5%
of the
readings for
span point
Within ± 1%
of the full
scale
or
Within ± 2%
of the
readings
< 1% of full scale
when O2 is 5 vol% or
more
< 2% of full scale
when O2 is 5 vol% or
less
CO, CO2 Non-dispersive
infrared absorption
(NDIR)
< 1% of the full scale
NOX Chemiluminescence
(CLD)
< 2% of full scale
HC Flame ionisation
(FID)
< 1% of the full scale
*peak-to-peak of total 5 minutes of duration
Table A.2. Technical data and performance of Horiba Mexa-1230PM
Component Method Measuring ranges Repeatability
Soot Diffusion charging
(DC)
0 mg/m3 – 15/75/150 mg/m
3
(with dilution ratio of 1 to
8/40/80) Within ± 1% of full
scale SOF Dual flame ionization
detection (dual-FID)
0 mg/m3 to 150 mg/m
3
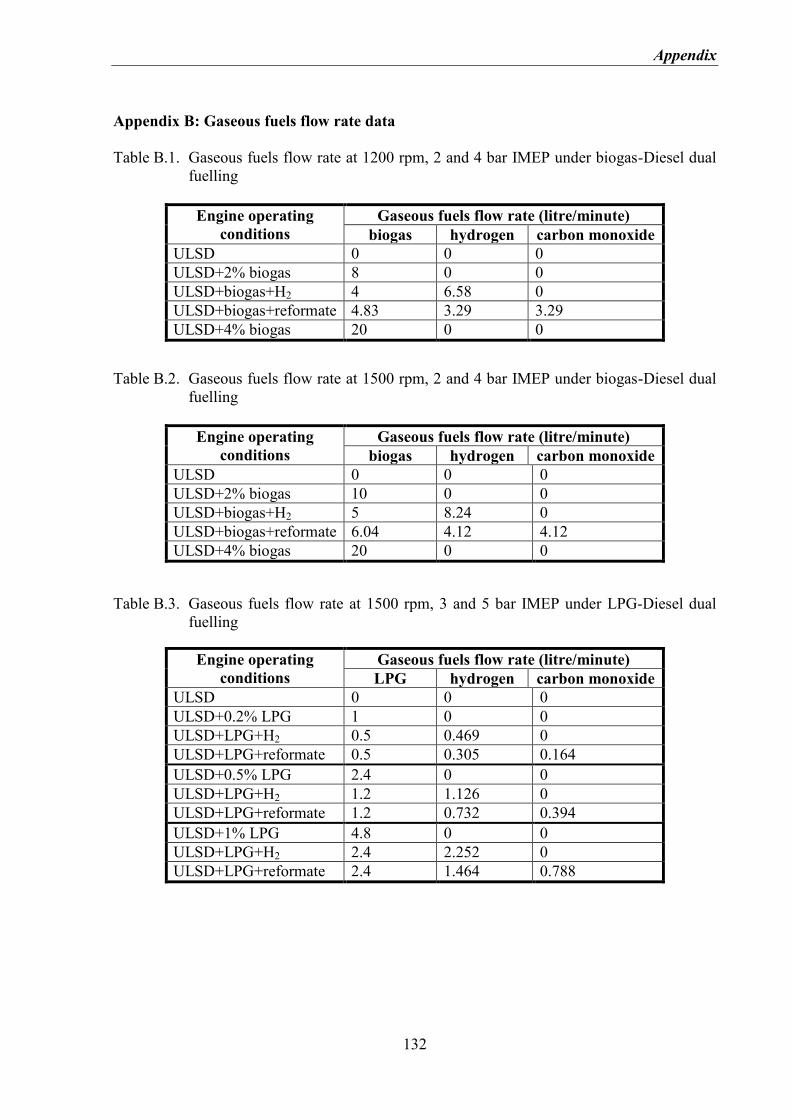
Appendix
132
Appendix B: Gaseous fuels flow rate data
Table B.1. Gaseous fuels flow rate at 1200 rpm, 2 and 4 bar IMEP under biogas-Diesel dual
fuelling
Engine operating
conditions
Gaseous fuels flow rate (litre/minute)
biogas hydrogen carbon monoxide
ULSD 0 0 0
ULSD+2% biogas 8 0 0
ULSD+biogas+H2 4 6.58 0
ULSD+biogas+reformate 4.83 3.29 3.29
ULSD+4% biogas 20 0 0
Table B.2. Gaseous fuels flow rate at 1500 rpm, 2 and 4 bar IMEP under biogas-Diesel dual
fuelling
Engine operating
conditions
Gaseous fuels flow rate (litre/minute)
biogas hydrogen carbon monoxide
ULSD 0 0 0
ULSD+2% biogas 10 0 0
ULSD+biogas+H2 5 8.24 0
ULSD+biogas+reformate 6.04 4.12 4.12
ULSD+4% biogas 20 0 0
Table B.3. Gaseous fuels flow rate at 1500 rpm, 3 and 5 bar IMEP under LPG-Diesel dual
fuelling
Engine operating
conditions
Gaseous fuels flow rate (litre/minute)
LPG hydrogen carbon monoxide
ULSD 0 0 0
ULSD+0.2% LPG 1 0 0
ULSD+LPG+H2 0.5 0.469 0
ULSD+LPG+reformate 0.5 0.305 0.164
ULSD+0.5% LPG 2.4 0 0
ULSD+LPG+H2 1.2 1.126 0
ULSD+LPG+reformate 1.2 0.732 0.394
ULSD+1% LPG 4.8 0 0
ULSD+LPG+H2 2.4 2.252 0
ULSD+LPG+reformate 2.4 1.464 0.788
Appendix
133
Appendix C: In-cylinder pressure and ROHR of ULSD-LPG dual fuelled combustion
Figure C.1. In-cylinder pressure and ROHR for ULSD-LPG combustion with hydrogen
and reformate at 3 bar IMEP. (a) 0.2% LPG, (b) 0.5% LPG.
-10
10
30
50
70
90
20
30
40
50
60
70
80
90
-20 -10 0 10 20 30
RO
HR
(J/
CA
D)
Cyli
nd
er p
ress
ure
(b
ar)
CAD
0% LPG LPG+Ref. 0.2% LPG LPG+H2
3 bar (a)
-10
10
30
50
70
90
20
30
40
50
60
70
80
90
-20 -10 0 10 20 30
RO
HR
(J/
CA
D)
Cyli
nd
er p
ress
ure
(b
ar)
CAD
0% LPG LPG+Ref.
0.5% LPG LPG+H2
3 bar (b)
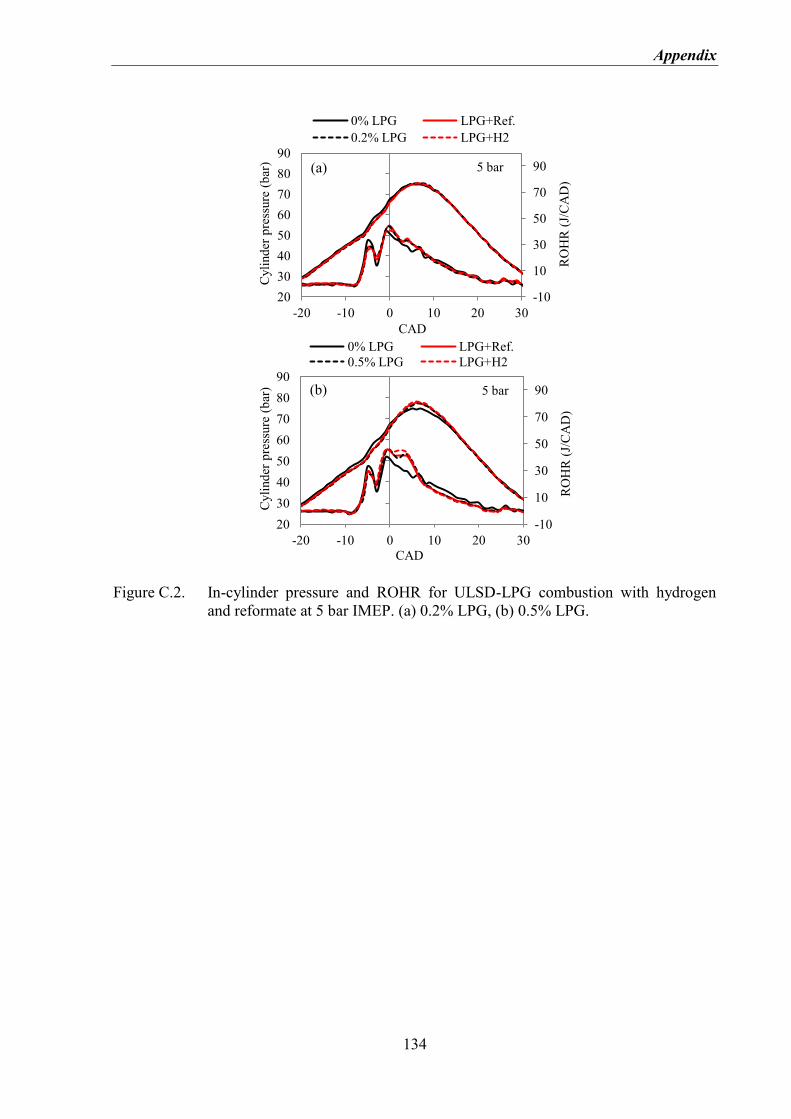
Appendix
134
Figure C.2. In-cylinder pressure and ROHR for ULSD-LPG combustion with hydrogen
and reformate at 5 bar IMEP. (a) 0.2% LPG, (b) 0.5% LPG.
-10
10
30
50
70
90
20
30
40
50
60
70
80
90
-20 -10 0 10 20 30
RO
HR
(J/
CA
D)
Cyli
nd
er p
ress
ure
(b
ar)
CAD
0% LPG LPG+Ref.
0.2% LPG LPG+H2
5 bar (a)
-10
10
30
50
70
90
20
30
40
50
60
70
80
90
-20 -10 0 10 20 30
RO
HR
(J/
CA
D)
Cyli
nd
er p
ress
ure
(b
ar)
CAD
0% LPG LPG+Ref.
0.5% LPG LPG+H2
5 bar (b)
Publications
135
PUBLICATIONS
1. Tira, H.S., Herreros, J.M., Tsolakis, A., Wyszynski, M.L. (2012) Characteristics of
LPG-diesel dual fuelled engine operated with rapeseed methyl ester and gas-to-liquid.
Energy, 47(1): 620-629.
2. Tira, H.S., Gill, S.S., Theinnoi, K., Shenker, J., Lau, C.S., Tsolakis, A., Dearn, K.,
Turner, D., Wyszynski, M.L. (2010) The study of simulated biogas on combustion and
emission characteristics in compression ignition engines. Presented by the author at
VIIIth International Scientific Conference GAS ENGINES – construction – research –
exploitation – renewable fuels Poland 2010.
3. Tira, H.S. (2012) Combustion and exhaust gas emissions characteristics of LPG-diesel
dual fuelled engine. Presented by the author at Mechanical Engineering Symposium at
School of Mechanical and Manufacturing Engineering University of Birmingham 2012.
4. Shenker, J., Sukjit, E., Gill, S.S., Tira, H.S., Herreros, J.M., Dearn, K., Tsolakis, A.
(2012) Fuel and lubrication for next generation engines UnICEG meeting at
Loughborough University 2012.
5. Tira, H.S., Herreros, J.M., Tsolakis, A., Wyszynski, M.L. (2013) Understanding the
influence of the reformate and the properties of diesel fuel in LPG-Diesel dual fuelled
combustion. (Submitted to Journal of Fuel).
6. Tira, H.S., Tsolakis, A., Turner, D., Herreros, J.M., Dearn, K.D., Theinnoi, K.,
Wyszynski, M.L. (2013) Influence of diesel fuel properties, hydrogen and reformate
additions on diesel-biogas dual fuelled diesel engine combustion and emissions
characteristics. (Submitted to Special issue of Journal of Energy Engineering (ASCE)
for Combustion of Biofuels in Engines)
References
136
LIST OF REFERENCES
ABD-ALLA, G. H. 2002. Using exhaust gas recirculation in internal combustion engines: a
review. Energy Conversion and Management, 43, 1027-1042.
ABD ALLA, G. H., SOLIMAN, H. A., BADR, O. A. & ABD RABBO, M. F. 2002. Effect of
injection timing on the performance of a dual fuel engine. Energy Conversion and
Management, 43, 269-277.
ABU-JRAI, A., RODRÍGUEZ-FERNÁNDEZ, J., TSOLAKIS, A., MEGARITIS, A.,
THEINNOI, K., CRACKNELL, R. F. & CLARK, R. H. 2009. Performance,
combustion and emissions of a diesel engine operated with reformed EGR.
Comparison of diesel and GTL fuelling. Fuel, 88, 1031-1041.
ADOMEIT, P., BECKER, M., ROHS, H., PISCHINGER, S., GREIS, A. & GRÜNEFELD,
G. 2006. Potential Soot and CO Reduction for HSDI Diesel Combustion Systems.
SAE Paper. 2006-01-1417.
AKANSU, S. O., DULGER, Z., KAHRAMAN, N. & VEZIROǦLU, T. N. 2004. Internal
combustion engines fueled by natural gas—hydrogen mixtures. International Journal
of Hydrogen Energy, 29, 1527-1539.
ALAM, M., GOTO, S., SUGIYAMA, K., KAJIWARA, M., MORI, M., KONNO, M.,
MOTOHASHI, M. & OYAMA, K. 2001. Performance and Emissions of a DI Diesel
Engine Operated with LPG and Ignition Improving Additives. SAE Paper. 2001-01-
3680.
ALKIDAS, A. C. 1999. Combustion-chamber crevices: the major source of engine-out
hydrocarbon emissions under fully warmed conditions. Progress in Energy and
Combustion Science, 25, 253-273.
ALLEMAN, T. L. & MCCORMICK, R. L. 2003. Fischer-Tropsch Diesel Fuels - Properties
and Exhaust Emissions: A Literature Review. SAE Paper. 2003-01-0763.
ARZE DEL GRANADO, F. J., COADY, D. & GILLINGHAM, R. 2012. The Unequal
Benefits of Fuel Subsidies: A Review of Evidence for Developing Countries. World
Development, 40, 2234-2248.
AVL. 2005. Smoke value measurement with the filter-paper-method [Online].
https://www.avl.com/c/document_library/get_file?uuid=2b39210c-6937-43e4-b223-
b5c2c11f91ac&groupId=10138. [Accessed 15/07/2012].
References
137
AZIMOV, U., TOMITA, E., KAWAHARA, N. & HARADA, Y. 2011. Effect of syngas
composition on combustion and exhaust emission characteristics in a pilot-ignited
dual-fuel engine operated in PREMIER combustion mode. International Journal of
Hydrogen Energy, 36, 11985-11996.
BAGAL, N. L., RUTLAND, C. J., FOSTER, D. E., NARAYANASWAMY, K. & HE, Y.
2009. CO Emission Model for an Integrated Diesel Engine, Emissions, and Exhaust
Aftertreatment System Level Model. SAE Paper. 2009-01-1511, 2, 1460-1472.
BAILEY, B., EBERHARDT, J., GOGUEN, S. & ERWIN, J. 1997. Diethyl Ether (DEE) as a
Renewable Diesel Fuel. SAE Paper, 972978.
BAN-WEISS, G. A., CHEN, J. Y., BUCHHOLZ, B. A. & DIBBLE, R. W. 2007. A numerical
investigation into the anomalous slight NOx increase when burning biodiesel; A new
(old) theory. Fuel Processing Technology, 88, 659-667.
BARI, S. 1996. Effect of carbon dioxide on the performance of biogas/diesel duel-fuel engine.
Renewable Energy, 9, 1007-1010.
BAUER, C. G. & FOREST, T. W. 2001. Effect of hydrogen addition on the performance of
methane-fueled vehicles. Part II: driving cycle simulations. International Journal of
Hydrogen Energy, 26, 71-90.
BENAJES, J., NOVELLA, R., GARCÍA, A. & ARTHOZOUL, S. 2011. The role of in-
cylinder gas density and oxygen concentration on late spray mixing and soot oxidation
processes. Energy, 36, 1599-1611.
BOEHMAN, A. L., MORRIS, D., SZYBIST, J. & ESEN, E. 2004. The Impact of the Bulk
Modulus of Diesel Fuels on Fuel Injection Timing. Energy & Fuels, 18, 1877-1882.
BOEHMAN, A. L., SONG, J. & ALAM, M. 2005. Impact of Biodiesel Blending on Diesel
Soot and the Regeneration of Particulate Filters. Energy & Fuels, 19, 1857-1864.
BORETTI, A. 2011. Advances in hydrogen compression ignition internal combustion
engines. International Journal of Hydrogen Energy, 36, 12601-12606.
CADMAN, W. & JOHNSON, J. H. 1986. The Study of the Effect of Exhaust Gas
Recirculation on Engine Wear in a Heavy-Duty Diesel Engine Using Analytical
Ferrography. SAE Paper, 860378.
CAMPBELL, M., WYSZYŃSKI, Ł. P. & STONE, R. 2004. Combustion of LPG in a Spark-
Ignition Engine. SAE Paper, 2004-01-0974.
CARLIER, P., HANNACHI, H. & MOUVIER, G. 1986. The chemistry of carbonyl
compounds in the atmosphere—A review. Atmospheric Environment (1967), 20,
2079-2099.
References
138
CHANIOTIS, A. K. & POULIKAKOS, D. 2005. Modeling and optimization of catalytic
partial oxidation methane reforming for fuel cells. Journal of Power Sources, 142,
184-193.
CHEN, Z. & IWASHINA, T. 2009. HC and CO Formation Factors in a PCI Engine. SAE
Paper, 2009-01-1889.
CHOI, S., PARK, W., LEE, S., MIN, K. & CHOI, H. 2011. Methods for in-cylinder EGR
stratification and its effects on combustion and emission characteristics in a diesel
engine. Energy, 36, 6948-6959.
CHONG, J. J., TSOLAKIS, A., GILL, S. S., THEINNOI, K. & GOLUNSKI, S. E. 2010.
Enhancing the NO2/NOx ratio in compression ignition engines by hydrogen and
reformate combustion, for improved aftertreatment performance. International
Journal of Hydrogen Energy, 35, 8723-8732.
CORBO, P., GAMBINO, M., IANNACCONE, S. & UNICH, A. 1995. Comparison Between
Lean-Burn and Stoichiometric Technologies for CNG Heavy-Duty Engines. SAE
Paper, 950057.
CROMAS, J. & GHANDHI, J. B. 2005. Particulate Emissions from a Direct-Injection Spark-
Ignition Engine. SAE Paper, 2005-01-0103.
DE ALMEIDA, P. & SILVA, P. D. 2009. The peak of oil production—Timings and market
recognition. Energy Policy, 37, 1267-1276.
DEC, J. E. & COY, E. B. 1996. OH Radical Imaging in a DI Diesel Engine and the Structure
of the Early Diffusion Flame. SAE Paper, 960831.
DEMIRBAS, A. 2007. Importance of biodiesel as transportation fuel. Energy Policy, 35,
4661-4670.
DIESELNET. 2010. Pump-Line-Nozzle Injection System [Online].
http://www.dieselnet.com/tech/diesel_fi_pln.php. [Accessed 05/06/2012].
DUC, P. M. & WATTANAVICHIEN, K. 2007. Study on biogas premixed charge diesel dual
fuelled engine. Energy Conversion and Management, 48, 2286-2308.
EFTHIMIOS, Z. 2008. Regulated and non-regulated pollutants emitted from two aliphatic and
a commercial diesel fuel. Fuel, 87, 1141-1147.
ELLIS, J. & TRÉANTON, K. 1998. Recent trends in energy-related CO2 emissions. Energy
Policy, 26, 159-166.
FERNANDO, S., HALL, C. & JHA, S. 2005. NOx Reduction from Biodiesel Fuels. Energy
& Fuels, 20, 376-382.
References
139
FLYNN, P. F., DURRETT, R. P., HUNTER, G. L., ZUR LOYE, A. O., AKINYEMI, O. C.,
DEC, J. E. & WESTBROOK, C. K. 1999. Diesel Combustion: An Integrated View
Combining Laser Diagnostics, Chemical Kinetics, And Empirical Validation. SAE
Paper, 1999-01-0509.
FOREST, C. A. & MUZZELL, P. A. 2005. Fischer-Tropsch Fuels: Why Are They of Interest
to the United States Military? SAE Paper, 2005-01-1807.
FRENKLACH, M. & WANG, H. 1991. Detailed modeling of soot particle nucleation and
growth. Symposium (International) on Combustion, 23, 1559-1566.
FURUHATA, T., ARAI, M., YAGA, M., LEE, J. H. & CHUN, K. M. 2007. Effect of Fuel
Properties on Diesel PM Components. SAE Paper, 2007-01-1941.
GATTS, T., LIU, S., LIEW, C., RALSTON, B., BELL, C. & LI, H. 2012. An experimental
investigation of incomplete combustion of gaseous fuels of a heavy-duty diesel engine
supplemented with hydrogen and natural gas. International Journal of Hydrogen
Energy, 37, 7848-7859.
GHAZIKHANI, M., FEYZ, M. E. & JOHARCHI, A. 2010. Experimental investigation of the
Exhaust Gas Recirculation effects on irreversibility and Brake Specific Fuel
Consumption of indirect injection diesel engines. Applied Thermal Engineering, 30,
1711-1718.
GILL, S. S., TSOLAKIS, A., DEARN, K. D. & RODRÍGUEZ-FERNÁNDEZ, J. 2011.
Combustion characteristics and emissions of Fischer–Tropsch diesel fuels in IC
engines. Progress in Energy and Combustion Science, 37, 503-523.
GOTO, S., LEE, D., SHAKAL, J., HARAYAMA, N., HONJYO, F. & UENO, H. 1999.
Performance and Emissions of an LPG Lean-Burn Engine for Heavy Duty Vehicles.
SAE Paper, 1999-01-1513.
GRASKOW, B. R., KITTELSON, D. B., AHMADI, M. R. & MORRIS, J. E. 1999. Exhaust
Particulate Emissions from Two Port Fuel Injected Spark Ignition Engines. SAE
Paper, 1999-01-1144.
HASHIMOTO, N., OZAWA, Y., MORI, N., YURI, I. & HISAMATSU, T. 2008.
Fundamental combustion characteristics of palm methyl ester (PME) as alternative
fuel for gas turbines. Fuel, 87, 3373-3378.
HASHIZUME, T., MIYAMOTO, T., HISASHI, A. & TSUJIMURA, K. 1998. Combustion
and Emission Characteristics of Multiple Stage Diesel Combustion. SAE Paper,
980505.
HEYWOOD, J. B. 1988. Internal Combustion Engine Fundamentals, New York, McGraw-
Hill Book Co.
References
140
HORI, S. & NARUSAWA, K. 1998. Fuel Composition Effects on SOF and PAH Exhaust
Emissions from DI Diesel Engines. SAE Paper, 980507.
HOUNTALAS, D. T., MAVROPOULOS, G. C. & BINDER, K. B. 2008. Effect of exhaust
gas recirculation (EGR) temperature for various EGR rates on heavy duty DI diesel
engine performance and emissions. Energy, 33, 272-283.
HOUSEMAN, J. & HOEHN, F. W. 1974. A Two-Charge Engine Concept: Hydrogen
Enrichment. SAE Paper, 741169.
HUANG, J. & CROOKES, R. J. 1998. Assessment of simulated biogas as a fuel for the spark
ignition engine. Fuel, 77, 1793-1801.
IEA. 2011. International Energy Agency (IEA) Statistics - CO2 Emissions from Fuel
Combustion-Highlights (2011) [Online].
http://www.iea.org/co2highlights/co2highlights.pdf [Accessed 15/09/2012].
ISHIDA, M., YAMAMOTO, S., UEKI, H. & SAKAGUCHI, D. 2010. Remarkable
improvement of NOx–PM trade-off in a diesel engine by means of bioethanol and
EGR. Energy, 35, 4572-4581.
JIAN, D., XIAOHONG, G., GESHENG, L. & XINTANG, Z. 2001. Study on Diesel-LPG
Dual Fuel Engines. SAE Paper, 2001-01-3679.
JOHANSSON, T. B., WILLIAMS, R. H., ISHITANI, H. & EDMONDS, J. A. 1996. Options
for reducing CO2 emissions from the energy supply sector. Energy Policy, 24, 985-
1003.
JOHNSON, E. 2003. LPG: a secure, cleaner transport fuel? A policy recommendation for
Europe. Energy Policy, 31, 1573-1577.
KAEWMAI, R., H-KITTIKUN, A. & MUSIKAVONG, C. 2012. Greenhouse gas emissions
of palm oil mills in Thailand. International Journal of Greenhouse Gas Control, 11,
141-151.
KARAMANGIL, M. I. 2007. Development of the auto gas and LPG-powered vehicle sector
in Turkey: A statistical case study of the sector for Bursa. Energy Policy, 35, 640-649.
KARIM, G. A. 2003. Combustion in Gas Fueled Compression: Ignition Engines of the Dual
Fuel Type. Journal of Engineering for Gas Turbines and Power, 125, 827-836.
KARIM, G. A. & WIERZBA, I. 1992. Safety measures associated with the operation of
engines on various alternative fuels. Reliability Engineering & System Safety, 37, 93-
98.
References
141
KARIM, G. A., WIERZBA, I. & BOON, S. 1985. Some considerations of the lean
flammability limits of mixtures involving hydrogen. International Journal of
Hydrogen Energy, 10, 117-123.
KAWANO, D., NAITO, H., SUZUKI, H., ISHII, H., HORI, S., GOTO, Y. & ODAKA, M.
2004. Effects of Fuel Properties on Combustion and Exhaust Emissions of
Homogeneous Charge Compression Ignition (HCCI) Engine. SAE Paper, 2004-01-
1966.
KHALEK, I. A. 2006. The Particulars of Diesel Particle Emissions; New Research Looks at
Particle Numbers and Size as well as mass [Online].
http://www.swri.org/3pubs/ttoday/spring06/PDFs/Particulars.pdf. [Accessed
08/05/2012].
KIM, J. M., HAN, S. B. & RAINE, R. R. 2005. Combustion Stability of Natural Gas Engine
Operating at Idle. SAE Paper, 2005-01-3446.
KITANO, K., SAKATA, I. & CLARK, R. 2005. Effects of GTL Fuel Properties on DI Diesel
Combustion. SAE Paper, 2005-01-3763.
KITTELSON, D., ARNOLD, M. & WATTS, W. 1999. Review of diesel particulate matter
sampling methods, Final report. University of Meinnesota Center for Diesel Research.
KORAKIANITIS, T., NAMASIVAYAM, A. M. & CROOKES, R. J. 2010. Hydrogen dual-
fuelling of compression ignition engines with emulsified biodiesel as pilot fuel.
International Journal of Hydrogen Energy, 35, 13329-13344.
KRAHL, J., MUNACK, A., SCHRODER, O., RUSCHEL, Y. & BÜNGER, J. 2009. Ultrafine
Particles from a Heavy Duty Diesel Engine Running on Rapeseed Oil Methyl Ester.
SAE Int. J. Fuels Lubr., 2, 132-146.
KRUYT, B., VAN VUUREN, D. P., DE VRIES, H. J. M. & GROENENBERG, H. 2009.
Indicators for energy security. Energy Policy, 37, 2166-2181.
LANTZ, M., SVENSSON, M., BJÖRNSSON, L. & BÖRJESSON, P. 2007. The prospects for
an expansion of biogas systems in Sweden—Incentives, barriers and potentials.
Energy Policy, 35, 1830-1843.
LAPUERTA, M., ARMAS, O. & RODRÍGUEZ-FERNÁNDEZ, J. 2008a. Effect of biodiesel
fuels on diesel engine emissions. Progress in Energy and Combustion Science, 34,
198-223.
LAPUERTA, M., RODRÍGUEZ-FERNÁNDEZ, J. & AGUDELO, J. R. 2008b. Diesel
particulate emissions from used cooking oil biodiesel. Bioresource Technology, 99,
731-740.
References
142
LARSSON, M. & DENBRATT, I. 2007. An Experimental Investigation of Fischer-Tropsch
Fuels in a Light-Duty Diesel Engine. SAE Paper, 2007-01-0030.
LATA, D. B. & MISRA, A. 2010. Theoretical and experimental investigations on the
performance of dual fuel diesel engine with hydrogen and LPG as secondary fuels.
International Journal of Hydrogen Energy, 35, 11918-11931.
LATA, D. B. & MISRA, A. 2011. Analysis of ignition delay period of a dual fuel diesel
engine with hydrogen and LPG as secondary fuels. International Journal of Hydrogen
Energy, 36, 3746-3756.
LATA, D. B., MISRA, A. & MEDHEKAR, S. 2012. Effect of hydrogen and LPG addition on
the efficiency and emissions of a dual fuel diesel engine. International Journal of
Hydrogen Energy, 37, 6084-6096.
LAU, C. S., TSOLAKIS, A. & WYSZYNSKI, M. L. 2011. Biogas upgrade to syn-gas (H2–
CO) via dry and oxidative reforming. International Journal of Hydrogen Energy, 36,
397-404.
LEE, J. T., KIM, Y. Y., LEE, C. W. & CATON, J. A. 2000. An Investigation of a Cause of
Backfire and Its Control Due to Crevice Volumes in a Hydrogen Fueled Engine.
Journal of Engineering for Gas Turbines and Power, 123, 204-210.
LEFÈVRE, N. 2010. Measuring the energy security implications of fossil fuel resource
concentration. Energy Policy, 38, 1635-1644.
LINDGREN, M., ARRHENIUS, K., LARSSON, G., BÄFVER, L., ARVIDSSON, H.,
WETTERBERG, C., HANSSON, P.-A. & ROSELL, L. 2011. Analysis of unregulated
emissions from an off-road diesel engine during realistic work operations.
Atmospheric Environment, 45, 5394-5398.
MACHADO CORRÊA, S. & ARBILLA, G. 2008. Carbonyl emissions in diesel and biodiesel
exhaust. Atmospheric Environment, 42, 769-775.
MAGNUSSON, R., NILSSON, C. & ANDERSSON, B. 2002. Emissions of Aldehydes and
Ketones from a Two-Stroke Engine Using Ethanol and Ethanol-Blended Gasoline as
Fuel. Environmental Science & Technology, 36, 1656-1664.
MAIBOOM, A., TAUZIA, X. & HÉTET, J.-F. 2008. Experimental study of various effects of
exhaust gas recirculation (EGR) on combustion and emissions of an automotive direct
injection diesel engine. Energy, 33, 22-34.
MAKAREVICIENE, V. & JANULIS, P. 2003. Environmental effect of rapeseed oil ethyl
ester. Renewable Energy, 28, 2395-2403.
References
143
MANCARUSO, E. & VAGLIECO, B. M. 2012. Premixed combustion of GTL and RME
fuels in a single cylinder research engine. Applied Energy, 91, 385-394.
MASI, M. 2012. Experimental analysis on a spark ignition petrol engine fuelled with LPG
(liquefied petroleum gas). Energy, 41, 252-260.
MCCORMICK, B. 2005. National Renewable Energy Laboratory - Effects of biodiesel on
NOx emissions [Online]. http://www.nrel.gov/vehiclesandfuels/npbf/pdfs/38296.pdf.
[Accessed 12/08/2012].
MILLER JOTHI, N. K., NAGARAJAN, G. & RENGANARAYANAN, S. 2008. LPG fueled
diesel engine using diethyl ether with exhaust gas recirculation. International Journal
of Thermal Sciences, 47, 450-457.
MIYAMOTO, N., OGAWA, H., ARIMA, T. & MIYAKAWA, K. 1996. Improvement of
Diesel Combustion and Emissions with Various oxygenated Fuel Additives. SAE
Paper.
MIYAMOTO, N., OGAWA, H., NURUN, N. M., OBATA, K. & ARIMA, T. 1998.
Smokeless, Low NOx, High Thermal Efficiency, and Low Noise Diesel Combustion
with Oxygenated Agents as Main Fuel. SAE Paper, 980506.
MIYAMOTO, N., OGAWA, H., SHIBUYA, M., ARAI, K. & ESMILAIRE, O. 1994.
Influence of the Molecular Structure of Hydrocarbon Fuels on Diesel Exhaust
Emissions SAE Paper, 940676.
MONYEM, A. & H. VAN GERPEN, J. 2001. The effect of biodiesel oxidation on engine
performance and emissions. Biomass and Bioenergy, 20, 317-325.
MUELLER, C. J., PITZ, W. J., PICKETT, L. M., MARTIN, G. C., SIEBERS, D. L. &
WESTBROOK, C. K. 2003. Effects of Oxygenates on Soot Processes in DI Diesel
Engines: Experiments and Numerical Simulations. SAE Paper, 2003-01-1791.
MUSTAFI, N. N. & RAINE, R. R. 2008. A Study of the Emissions of a Dual Fuel Engine
Operating with Alternative Gaseous Fuels. SAE Paper, 2008-01-1394.
NELSON, P. F., TIBBETT, A. R. & DAY, S. J. 2008. Effects of vehicle type and fuel quality
on real world toxic emissions from diesel vehicles. Atmospheric Environment, 42,
5291-5303.
NISHIJIMA, Y., ASAUMI, Y. & AOYAGI, Y. 2002. Impingement Spray System with Direct
Water Injection for Premixed Lean Diesel Comnustion Control. SAE Paper, 2002-01-
0109.
References
144
NORTON, P., VERTIN, K., BAILEY, B., CLARK, N. N., LYONS, D. W., GOGUEN, S. &
EBERHARDT, J. 1998. Emissions from Trucks Using Fischer-Tropsch Diesel Fuel.
SAE Paper, 982526.
OZDOR, N., DULGER, M. & SHER, E. 1994. Cyclic Variability in Spark Ignition Engines A
Literature Survey. SAE Paper, 940987.
PALKE, D. R., DILLON, J. E. & WASON, A. 2001. The Use of Catalytic Aftertreatment to
Meet Advanced Emissions Standards for Indian 2-Wheel Vehicles. SAE Paper, 2001-
26-0001.
PANÃO, M. R. O. & MOREIRA, A. L. N. 2007. Interpreting the influence of fuel spray
impact on mixture preparation for HCCI combustion with port-fuel injection.
Proceedings of the Combustion Institute, 31, 2205-2213.
PANDEY, P., PUNDIR, B. P. & PANIGRAHI, P. K. 2007. Hydrogen addition to acetylene–
air laminar diffusion flames: Studies on soot formation under different flow
arrangements. Combustion and Flame, 148, 249-262.
PAPAGIANNAKIS, R. G. & HOUNTALAS, D. T. 2004. Combustion and exhaust emission
characteristics of a dual fuel compression ignition engine operated with pilot Diesel
fuel and natural gas. Energy Conversion and Management, 45, 2971-2987.
PAPAGIANNAKIS, R. G., HOUNTALAS, D. T. & RAKOPOULOS, C. D. 2007.
Theoretical study of the effects of pilot fuel quantity and its injection timing on the
performance and emissions of a dual fuel diesel engine. Energy Conversion and
Management, 48, 2951-2961.
PAPAGIANNAKIS, R. G., RAKOPOULOS, C. D., HOUNTALAS, D. T. &
RAKOPOULOS, D. C. 2010. Emission characteristics of high speed, dual fuel,
compression ignition engine operating in a wide range of natural gas/diesel fuel
proportions. Fuel, 89, 1397-1406.
PARK, C., CHOI, Y., KIM, C., OH, S., LIM, G. & MORIYOSHI, Y. 2010. Performance and
exhaust emission characteristics of a spark ignition engine using ethanol and ethanol-
reformed gas. Fuel, 89, 2118-2125.
PAYRI, F., BERMÚDEZ, V. R., TORMOS, B. & LINARES, W. G. 2009. Hydrocarbon
emissions speciation in diesel and biodiesel exhausts. Atmospheric Environment, 43,
1273-1279.
PENG, C.-Y., YANG, H.-H., LAN, C.-H. & CHIEN, S.-M. 2008a. Effects of the biodiesel
blend fuel on aldehyde emissions from diesel engine exhaust. Atmospheric
Environment, 42, 906-915.
References
145
PENG, H., CUI, Y., SHI, L. & DENG, K. 2008b. Effects of exhaust gas recirculation (EGR)
on combustion and emissions during cold start of direct injection (DI) diesel engine.
Energy, 33, 471-479.
POONIA, M. P., RAMESH, A. & GAUR, R. R. 1998. Effect of Intake Air Temperature and
Pilot Fuel Quantity on the Combustion Characteristics of a LPG Diesel Dual Fuel
Engine. SAE Paper, 982455.
PRICE, P., GUO, S. & HIRSCHMANN, M. 2004. Performance of an evaporator for a LPG
powered vehicle. Applied Thermal Engineering, 24, 1179-1194.
QI, D. H., BIAN, Y. Z., MA, Z. Y., ZHANG, C. H. & LIU, S. Q. 2007. Combustion and
exhaust emission characteristics of a compression ignition engine using liquefied
petroleum gas–Diesel blended fuel. Energy Conversion and Management, 48, 500-
509.
RAHMOUNI, C., TAZEROUT, M. & LE CORRE, O. 2002. A Method to Determine Biogas
Composition for Combustion Control. SAE Paper, 2002-01-1708.
RAKOPOULOS, C. D., MICHOS, C. N. & GIAKOUMIS, E. G. 2009. Thermodynamic
Analysis of SI Engine Operation on Variable Composition Biogas-Hydrogen Blends
Using a Quasi-Dimensional, Multi-Zone Combustion Model. SAE Paper, 2009-01-
0931., 880-910.
RAMADHAS, A. S., JAYARAJ, S. & MURALEEDHARAN, C. 2004. Use of vegetable oils
as I.C. engine fuels—A review. Renewable Energy, 29, 727-742.
RAPPENGLÜCK, B., FABIAN, P., KALABOKAS, P., VIRAS, L. G. & ZIOMAS, I. C.
1998. Quasi-continuous measurements of non-methane hydrocarbons (NMHC) in the
Greater Athens area during medcaphot-trace. Atmospheric Environment, 32, 2103-
2121.
REITER, A. J. & KONG, S.-C. 2011. Combustion and emissions characteristics of
compression-ignition engine using dual ammonia-diesel fuel. Fuel, 90, 87-97.
ROUBAUD, A. & FAVRAT, D. 2005. Improving performances of a lean burn cogeneration
biogas engine equipped with combustion prechambers. Fuel, 84, 2001-2007.
ROUNCE, P., TSOLAKIS, A., LEUNG, P. & YORK, A. P. E. 2010. A Comparison of Diesel
and Biodiesel Emissions Using Dimethyl Carbonate as an Oxygenated Additive.
Energy & Fuels, 24, 4812-4819.
ROUNCE, P., TSOLAKIS, A., RODRÍGUEZ-FERNÁNDEZ, J., YORK, A. P. E.,
CRACKNELL, R. F. & CLARK, R. H. 2009. Diesel Engine Performance and
Emissions when First Generation Meets Next Generation Biodiesel. SAE Paper, 2009-
01-1935.
References
146
ROUNCE, P., TSOLAKIS, A. & YORK, A. P. E. 2012. Speciation of particulate matter and
hydrocarbon emissions from biodiesel combustion and its reduction by aftertreatment.
Fuel, 96, 90-99.
SAANUM, I., BYSVEEN, M. & HUSTAD, J. E. 2008. Study of Particulate Matter-, NOx-
and Hydrocarbon Emissions from a Diesel Engine Fueled with Diesel Oil and
Biodiesel with Fumigation of Hydrogen, Methane and Propane. SAE Paper, 2008-01-
1809.
SAHOO, B. B., SAHOO, N. & SAHA, U. K. 2009. Effect of engine parameters and type of
gaseous fuel on the performance of dual-fuel gas diesel engines—A critical review.
Renewable and Sustainable Energy Reviews, 13, 1151-1184.
SAHOO, B. B., SAHOO, N. & SAHA, U. K. 2012. Effect of H2:CO ratio in syngas on the
performance of a dual fuel diesel engine operation. Applied Thermal Engineering, 49,
139-146.
SALEH, H. E. 2008. Effect of variation in LPG composition on emissions and performance in
a dual fuel diesel engine. Fuel, 87, 3031-3039.
SAMUEL, S., MORREY, D., WHELAN, I. & HASSANEEN, A. 2010. Combustion
Characteristics and Cycle-By-Cycle Variation in a Turbocharged-Intercooled Gasoline
Direct-Injected Engine. SAE Paper, 2010-01-0348.
SARAVANAN, N. & NAGARAJAN, G. 2009. An insight on hydrogen fuel injection
techniques with SCR system for NOX reduction in a hydrogen–diesel dual fuel
engine. International Journal of Hydrogen Energy, 34, 9019-9032.
SARAVANAN, N., NAGARAJAN, G., SANJAY, G., DHANASEKARAN, C. &
KALAISELVAN, K. M. 2008. Combustion analysis on a DI diesel engine with
hydrogen in dual fuel mode. Fuel, 87, 3591-3599.
SAXENA, P. & WILLIAMS, F. A. 2006. Testing a small detailed chemical-kinetic
mechanism for the combustion of hydrogen and carbon monoxide. Combustion and
Flame, 145, 316-323.
SCHEFER, R. W. 2001. Combustion of hydrogen-enriched methane in a lean premixed swirl
burner. Proceedings of the 2001 DOE Hydrogen Program Review NREL/CP-570-
30535.
SCHÖNBORN, A., LADOMMATOS, N., WILLIAMS, J., ALLAN, R. & ROGERSON, J.
2009. The influence of molecular structure of fatty acid monoalkyl esters on diesel
combustion. Combustion and Flame, 156, 1396-1412.
SELIM, M. Y. E. 2004. Sensitivity of dual fuel engine combustion and knocking limits to
gaseous fuel composition. Energy Conversion and Management, 45, 411-425.
References
147
SELIM, M. Y. E. 2005. Effect of engine parameters and gaseous fuel type on the cyclic
variability of dual fuel engines. Fuel, 84, 961-971.
SELIM, M. Y. E., RADWAN, M. S. & SALEH, H. E. 2008. Improving the performance of
dual fuel engines running on natural gas/LPG by using pilot fuel derived from jojoba
seeds. Renewable Energy, 33, 1173-1185.
SENATORE, A., CARDONE, M., ROCCO, V. & PRATI, M. V. 2000. A Comparative
Analysis of Combustion Process in D.I. Diesel Engine Fueled with Biodiesel and
Diesel Fuel. SAE Paper, 2000-01-0691.
SHAH, A., THIPSE, S. S., TYAGI, A., RAIRIKAR, S. D., KAVTHEKAR, K. P.,
MARATHE, N. V. & MANDLOI, P. 2011. Literature Review and Simulation of Dual
Fuel Diesel-CNG Engines. SAE Paper, 2011-26-0001.
SHAHID, E. M. & JAMAL, Y. 2008. A review of biodiesel as vehicular fuel. Renewable and
Sustainable Energy Reviews, 12, 2484-2494.
SITSHEBO, S. 2010. HC-SCR of NOx Emissions Over Ag-Al2O3 Catalysts Using Diesel
Fuel As a Reductant. PhD Thesis, University of Birmingham.
SONG, J., CHEENKACHORN, K., WANG, J., PEREZ, J., BOEHMAN, A. L., YOUNG, P.
J. & WALLER, F. J. 2002. Effect of Oxygenated Fuel on Combustion and Emissions
in a Light-Duty Turbo Diesel Engine. Energy & Fuels, 16, 294-301.
STANMORE, B. R., BRILHAC, J. F. & GILOT, P. 2001. The oxidation of soot: a review of
experiments, mechanisms and models. Carbon, 39, 2247-2268.
STEWART, J., CLARKE, A. & CHEN, R. 2007. An Experimental Study of the Dual-fuel
Performance of A Small Compression Ignition Diesel Engine Operating with Three
Gaseous Fuels. Proceedings of the Institution of Mechanical Engineers, Part D:
Journal of Automobile Engineering, 943-956.
STONE, R. 1999. Introduction to Internal Combustion Engines, London, MacMillan Press
Ltd.
STONE, R., CLARKE, A. & BECKWITH, P. 1998. Correlations for the Laminar-Burning
Velocity of Methane/Diluent/Air Mixtures Obtained in Free-Fall Experiments.
Combustion and Flame, 114, 546-555.
SU, W., WANG, H. & LIU, B. 2005. Injection Mode Modulation for HCCI Diesel
Combustion. SAE Paper, 2005-01-0117.
SUN, J., CATON, J. A. & JACOBS, T. J. 2010. Oxides of nitrogen emissions from biodiesel-
fuelled diesel engines. Progress in Energy and Combustion Science, 36, 677-695.
References
148
SZWAJA, S. & GRAB-ROGALINSKI, K. 2009. Hydrogen combustion in a compression
ignition diesel engine. International Journal of Hydrogen Energy, 34, 4413-4421.
TAKADA, K., YOSHIMURA, F., OHGA, Y., KUSAKA, J. & DAISHO, Y. 2003.
Experimental Study on Unregulated Emission Characteristics of Turbocharged DI
Diesel Engine with Common Rail Fuel Injection System. SAE Paper, 2003-01-3158.
TAKEDA, Y., KEIICHI, N. & KEIICHI, N. 1996. Emission Characteristics of Premixed
Lean Diesel Combustion with Extremely Early Staged Fuel Injection. SAE Paper,
961163.
TAN, P.-Q., HU, Z.-Y. & LOU, D.-M. 2009. Regulated and unregulated emissions from a
light-duty diesel engine with different sulfur content fuels. Fuel, 88, 1086-1091.
TAN, P.-Q., HU, Z.-Y., LOU, D.-M. & LI, Z.-J. 2012. Exhaust emissions from a light-duty
diesel engine with Jatropha biodiesel fuel. Energy, 39, 356-362.
TANG, C., HE, J., HUANG, Z., JIN, C., WANG, J., WANG, X. & MIAO, H. 2008.
Measurements of laminar burning velocities and Markstein lengths of propane–
hydrogen–air mixtures at elevated pressures and temperatures. International Journal
of Hydrogen Energy, 33, 7274-7285.
THEINNOI, K., TSOLAKIS, A., CHUEPENG, S., YORK, A. P. E., CRACKNELL, R. &
CLARK, R. 2009. Engine performance and emissions from the combustion of low-
temperature Fischer-Tropsch synthetic diesel fuel and biodiesel rapeseed methyl ester
blends. International Journal of Vehicle Design, 50, 196-212.
TIRA, H. S., HERREROS, J. M., TSOLAKIS, A. & WYSZYNSKI, M. L. 2012.
Characteristics of LPG-diesel dual fuelled engine operated with rapeseed methyl ester
and gas-to-liquid diesel fuels. Energy, 47, 620-629.
TREE, D. R. & SVENSSON, K. I. 2007. Soot processes in compression ignition engines.
Progress in Energy and Combustion Science, 33, 272-309.
TSOLAKIS, A. 2004. Exhaust gas fuel reforming for CI engines fuelled by diesel and
biodiesel. PhD Thesis, University of Birmingham.
TSOLAKIS, A. 2006. Effects on Particle Size Distribution from the Diesel Engine Operating
on RME-Biodiesel with EGR. Energy & Fuels, 20, 1418-1424.
TSOLAKIS, A., HERNANDEZ, J. J., MEGARITIS, A. & CRAMPTON, M. 2005a. Dual
Fuel Diesel Engine Operation Using H2. Effect on Particulate Emissions. Energy &
Fuels, 19, 418-425.
TSOLAKIS, A. & MEGARITIS, A. 2004. Catalytic exhaust gas fuel reforming for diesel
engines—effects of water addition on hydrogen production and fuel conversion
efficiency. International Journal of Hydrogen Energy, 29, 1409-1419.
References
149
TSOLAKIS, A., MEGARITIS, A. & WYSZYNSKI, M. L. 2003. Application of Exhaust Gas
Fuel Reforming in Compression Ignition Engines Fueled by Diesel and Biodiesel Fuel
Mixtures. Energy & Fuels, 17, 1464-1473.
TSOLAKIS, A., MEGARITIS, A., YAP, D. & ABU-JRAI, A. 2005b. Combustion
Characteristics and Exhaust Gas Emissions of a Diesel Engine Supplied with
Reformed EGR. SAE Paper, 2005-01-2087.
TSOLAKIS, A., TORBATI, R., MEGARITIS, A. & ABU-JRAI, A. 2009. Low-Load Dual-
Fuel Compression Ignition (CI) Engine Operation with an On-Board Reformer and a
Diesel Oxidation Catalyst: Effects on Engine Performance and Emissions. Energy &
Fuels, 24, 302-308.
TURRIO-BALDASSARRI, L., BATTISTELLI, C. L., CONTI, L., CREBELLI, R., DE
BERARDIS, B., IAMICELI, A. L., GAMBINO, M. & IANNACCONE, S. 2004.
Emission comparison of urban bus engine fueled with diesel oil and ‘biodiesel’ blend.
Science of The Total Environment, 327, 147-162.
VERHELST, S. & SIERENS, R. 2001. Hydrogen engine-specific properties. International
Journal of Hydrogen Energy, 26, 987-990.
VERHELST, S. & WALLNER, T. 2009. Hydrogen-fueled internal combustion engines.
Progress in Energy and Combustion Science, 35, 490-527.
VON HIPPEL, D., SUZUKI, T., WILLIAMS, J. H., SAVAGE, T. & HAYES, P. 2011.
Energy security and sustainability in Northeast Asia. Energy Policy, 39, 6719-6730.
WAGEMAKERS, A. M. L. M. & LEERMAKERS, C. A. J. 2012. Review on the Effects of
Dual-Fuel Operation, Using Diesel and Gaseous Fuels, on Emissions and
Performance. SAE Paper, 2012-01-0869.
WHITE, C. M., STEEPER, R. R. & LUTZ, A. E. 2006. The hydrogen-fueled internal
combustion engine: a technical review. International Journal of Hydrogen Energy, 31,
1292-1305.
XINLING, L. & ZHEN, H. 2009. Emission reduction potential of using gas-to-liquid and
dimethyl ether fuels on a turbocharged diesel engine. Science of The Total
Environment, 407, 2234-2244.
XU, J., ZHANG, X., LIU, J. & FAN, L. 2010. Experimental study of a single-cylinder engine
fueled with natural gas–hydrogen mixtures. International Journal of Hydrogen
Energy, 35, 2909-2914.
References
150
YAMANE, K., UETA, A. & SHIMAMOTO, Y. 2001. Influence of physical and chemical
properties of biodiesel fuels on injection, combustin and exhaust emission
characteristics in a direct injection compression ignition engine. International Journal
of Engine Research, 2, 249-261.
YOON, S. H. & LEE, C. S. 2011. Experimental investigation on the combustion and exhaust
emission characteristics of biogas–biodiesel dual-fuel combustion in a CI engine. Fuel
Processing Technology, 92, 992-1000.
ZERVAS, E. 2008. Regulated and non-regulated pollutants emitted from two aliphatic and a
commercial diesel fuel. Fuel, 87, 1141-1147.
ZERVAS, E., MONTAGNE, X. & LAHAYE, J. 2002. Emission of Alcohols and Carbonyl
Compounds from a Spark Ignition Engine. Influence of Fuel and Air/Fuel Equivalence
Ratio. Environmental Science & Technology, 36, 2414-2421.
ZHAO, H., HU, J. & LADOMMATOS, N. 2000. In-cylinder studies of the effects of CO2 in
exhaust gas recirculation on diesel combustion and emissions. Proceedings of the
Institution of Mechanical Engineers, Part D: Journal of Automobile Engineering, 214,
405-419.
ZHENG, M., READER, G. T. & HAWLEY, J. G. 2004. Diesel engine exhaust gas
recirculation––a review on advanced and novel concepts. Energy Conversion and
Management, 45, 883-900.
ZHU, R., CHEUNG, C. S., HUANG, Z. & WANG, X. 2011a. Experimental investigation on
particulate emissions of a direct injection diesel engine fueled with diesel–diethyl
adipate blends. Journal of Aerosol Science, 42, 264-276.
ZHU, R., CHEUNG, C. S., HUANG, Z. & WANG, X. 2011b. Regulated and unregulated
emissions from a diesel engine fueled with diesel fuel blended with diethyl adipate.
Atmospheric Environment, 45, 2174-2181.
ZHU, Z., LI, D. K., LIU, J., WEI, Y. J. & LIU, S. H. 2012. Investigation on the regulated and
unregulated emissions of a DME engine under different injection timing. Applied
Thermal Engineering, 35, 9-14.