![Index [] · 1 Index Company profile Company profile Air filter Urethane air filter / Mini collection Air filter Carburetor air filter Carbon fiber light-weight filter](https://static.fdocuments.in/doc/165x107/5adceab27f8b9aeb668c2bf7/index-index-company-profile-company-profile-air-filter-urethane-air-filter-.jpg)
Impact of Air-Filter Condition on HVAC Equipment · IMPACT OF AIR-FILTER CONDITION ... IMPACT OF...
56
Impact on ORNL/TM-9894 of Air-Filter Condition HVAC Equipment L. Jung
Transcript of Impact of Air-Filter Condition on HVAC Equipment · IMPACT OF AIR-FILTER CONDITION ... IMPACT OF...
Impact on
ORNL/TM-9894
of Air-Filter Condition HVAC Equipment
L. Jung

1

,
ORNL/TM-9894
Engineering Technology Division
IMPACT OF AIR-FILTER CONDITION ON HVAC EQUIPMENT
L. Jung
Date Published - September 1987
Prepared for the U.S. ARMY FACILITIES ENGINEERING SUPPORT AGENCY
Fort Belvoir,, Virginia 22060
ARMY CONSERVATION EQUIPMENT TESTING PROGRAM TASK ORDER/WORK DIRECTIVE NO. 0003
Prepared by the OAK RIDGE NATIONAL LABORATORY
Oak Ridge, Tennessee 37831 operated by
MARTIN MARIETTA ENERGY SYSTEMS, INC. for the
U.S. DEPARTMENT OF ENERGY under Contract No. DE-AC05-840R21400

iii
CONTENTS
Page
1.
.
2.
EXECUTIVE SUMMARY ................................................
ABSTRACT .........................................................
l
3.
4.
5.
INTRODUCTION .................................................
1.1 Purpose .................................................
1.2 Scope ...................................................
1.3 Background and Methodology ..............................
AIR-FILTER PURPOSE, TESTING, TYPES, AND SELECTION ............
2.1 Air-Filter Purpose ......................................
2.2 Air-Filter Testing ......................................
2.3 Filter Types ............................................
2.4 Air-Filter Selection ....................................
FUNDAMENTALS OF HVAC SYSTEMS .................................
3.1 Refrigeration Cycle .....................................
3.2 Other Cooling Systems ...................................
3.3 Heat Pump ...............................................
3.4 Furnace .................................................
3.5 Air Handler .............................................
3.5.1 Blower assembly and motors ....................... 3.5.2 Dampers ..........................................
EFFECTS ON HVAC SYSTEMS' PERFORMANCES ........................
4.1 Refrigeration Systems ...................................
4.1.1 Self-contained refrigeration-unit correlation .... 4.1.2 Air-conditioner performance evaluation ........... 4.1.3 Other cooling systems ............................
4.2 Heat Pumps ..............................................
4.3 Furnace .................................................
4.4 Air Handler .............................................
4.4.1 Blower assembly and motors ....................... 4.4.2 Dampers ..........................................
ENERGY SAVINGS VS FILTER-REPLACEMENT SCHEDULING OPTIONS ......
5.1 General .................................................
5.2 Assumptions and Constraints .............................
V
1
1
1
1
2
4
4
4
5
9
10
10
11
11
12
13
13 14
16
16
18 19 25
26
27
28
28 28
29
29
30
iV
Page
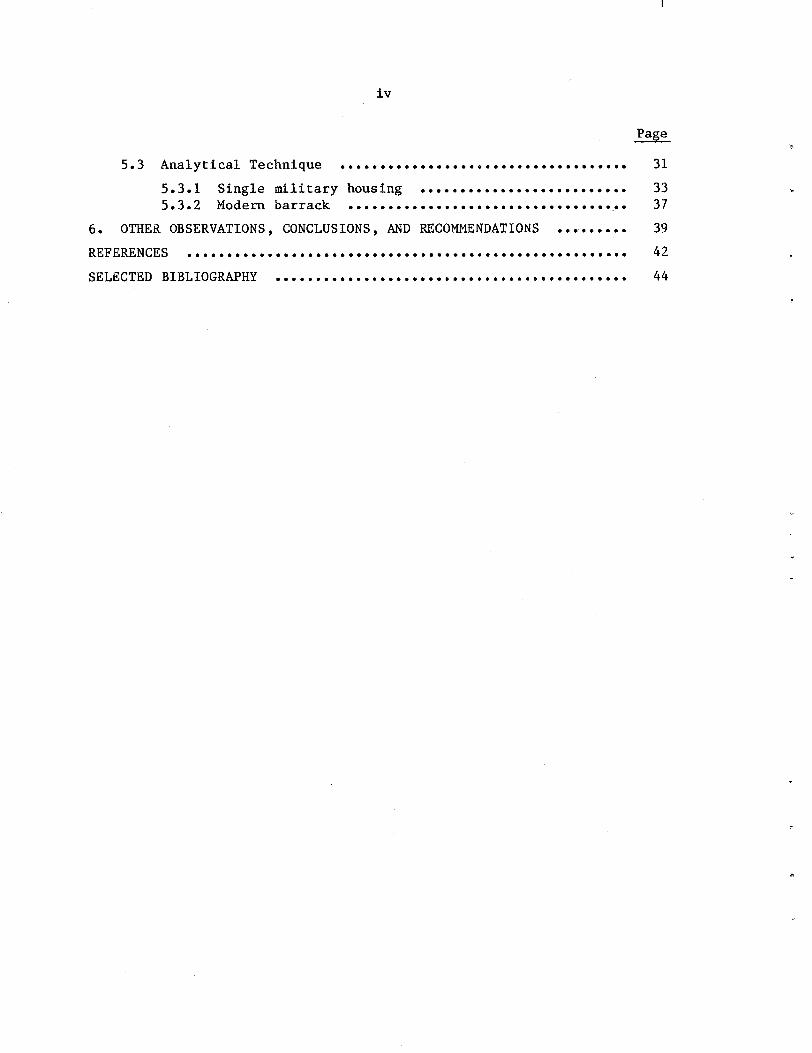
5.3 Analytical Technique .................................... 31
5.3.1 Single military housing .......................... 33 5.3.2 Modern barrack ................................... 37
6. OTHER OBSERVATIONS, CONCLUSIONS, AND RECOMMENDATIONS ......... 39
REFERENCES ....................................................... 42
SELECTED BIBLIOGRAPHY ............................................ 44
.

V
EXECUTIVE SUMMARY
Air filters are primarily used in heating, ventilation, and air-
conditioning (HVAC) systems to remove from the airstream those particu-
lates that can cause fouling of the heat-transfer surfaces. However, the
reduction of the amount of particulates in occupied areas is becoming an
increasingly important concern for all air-filtration systems. The in-
expensive, common, throwaway filter (which is suitable for the majority
of applications) is designed to remove large-size particles. The removal
of smaller-size particles, however, requires a more-efficient or special-
purpose filter.
This analysis examines the effect of air-filter fouling on HVAC
systems based on the characteristics of several components, the condition
of the heat-transfer surfaces, and the cooling or heating cycle (vapor-
compression refrigeration for air conditioners and gas-fired for fur-
naces). The performance of the air conditioner is estimated at various
filter conditions. Energy consumption and filter replacement costs were
calculated for a single-family military housing unit and for a modern
barracks, using different filter replacement schedules during a typical
heating and cooling season.
For military housing, the optimum schedule was to replace the filter
monthly; there was, however, only a slight difference in the cost savings
from this schedule when compared with the other schedules examined.
Although the energy cost savings are slight, filter replacement is an
important part of any preventive maintenance program. Also, an operating
condition that can lead to a premature compressor failure was identified:
clogged filter combined with a high outdoor temperature, beginning at
about 105'F, for units having a capillary tube as the expansion device.
Regular filter replacement can contribute to a longer life for compres-
sors and motors and can be very cost-effective if early failure is
prevented. Further, the filters should be replaced before they become
clogged and dirt begins to accumulate on the evaporator coils. Replacing
the filter is quick and easy ; cleaning the evaporator coil is time con-
suming and tedious.

Vi
For the type of modern barracks chosen, a quite different situation
exists. One hundred and fifty small room filters and eight larger fil-
ters in the air handler were considered. To determine an optimal filter-
changing schedule, the maximum possible energy-cost savings were esti-
mated by using the difference between all the filters being clogged and
being clean. Because of the large number of filters involved and the
associated labor cost to replace these filters, the estimated maximum
energy-cost savings is easily offset by a few complete filter changes.
If the room-filters' lifetimes can be extended by more effective use of
the air-handler filters that already act as prefilters, the filter
replacement cost can be minimized. Experience will be necessary to
determine when the room filters will need changing. However, filters
should be changed before becoming clogged.
For the modern military barracks and large buildings that use an air
handler for circulating air for heating or cooling, damper adjustment and
proper operation are important to energy conservation. As much as 30% of
the annual energy cost can be saved, and the lifetimes of the filters in
the air handler can be extended.
Inexpensive filters may suffice for most general purpose uses. This
unconfirmed speculation arises from several small-sample-size observations
of filter and evaporator coil conditions in air conditioners. For units
located in areas with moderate humidities and air-infiltration rates,
evaporator coils were found to be shiny clean. The dripping condensate
may be the reason; a simple monitoring program could confirm this obser-
vation. If valid, there are savings to be realized, particularly in the
purchase price of filters and in energy consumption. Inexpensive filters
that remove the large-size particulates may be sufficient.
The condenser coils should be checked, especially in the fall and
spring, for accumulation of leaves, seed pods from trees, or pine
needles. Single-layered condenser coils are not prone to get dirty if
properly installed. Multilayered condenser coils, however, are more
likely to clog because of debris becoming trapped between the coils.
Units in a high-dust area with heavy particles, such as those near a
coal-fired plant or in an arid area, should be checked periodically.

Vii
Y Mowers should be cautioned not to blow grass clippings into the coils.
If the condenser coils become dirty or clogged with debris, the
discharge temperature and pressure will rise. Unless protected by a
high-pressure limit switch, the compressor can be damaged.
Motors that are not permanently lubricated should be lubricated
annually. The two most common causes of motor failures are motors
operating at high temperatures and with a lack of lubrication.

t

9
IMPACT OF AIR-FILTER CONDITION ON HVAC EQUIPMENT
L. Jung
ABSTRACT
An analysis was performed of changes in energy consumption caused by dirty filters for heating, ventilation, and air- conditioning systems during both heating and cooling cycles. Basic heat-transfer fundamentals and the vapor-compression refrigeration cycle for air conditioners were used. The energy cost savings between a dirty and a clean filter were small and were mainly offset by the filter cost. However, the conse- quences of deferring filter replacement could be very costly because of early equipment failures.
1. INTRODUCTION
1.1 Purpose
The purpose of this study is to determine (1) the impact that
varying degrees of air-filter fouling have upon energy consumption in
occupied buildings for various types of heating, ventilation, and air-
conditioning (HVAC) equipment and (2) the energy savings that may be
expected based upon filter conditions and a replacement schedule.
1.2 Scope
The impact of varying degrees of fouled filters on the energy con-
sumption of HVAC equipment (air conditioners, air-handling units, heat
pumps, fan coil units, and furnaces) is discussed. Different types 0;.
air filters are described. Recommendations are made concerning the in-
stallation, maintenance, and replacement of air filters on U.S. Army
facilities. Although detailed coverage of maintenance for HVAC systems
is beyond the scope of this report, some simple maintenance actions that
can improve efficiency have been identified. The economic and energy-
saving aspects of regular air-filter replacement are discussed.
To appreciate fully the importance of air filters in HVAC systems, a
brief discussion about various air filters and some basic fundamentals
2
involved in cooling and/or heating systems will be presented. This
information will aid in understanding the interactions among different
components of the HVAC system.
1.3 Background and Methodology
The U.S. Army Facilities Engineering Support Agency (USAFESA), Fort
Belvoir, Virginia, issued Task Order No. 0003 on April 22, 1985, request-
ing that the impact of air-filter condition on HVAC equipment energy
consumption be eva1uated.l Visits to two Army installations were speci-
fied as part of this task. Fort Bragg in Fayetteville, North Carolina,
was designated as one of the sites because it has initiated a filter
evaluation program. The other site selected was, in fact, two sites:
Fort McNair and Fort Myer in the Military District of Washington were
combined because of their close proximity and relatively small sizes.
The last two forts did not have a planned filter-change program other
than routine, scheduled maintenance of the HVAC systems.
This task specified that a literature search be performed to deter-
mine whether any previously completed work or study would satisfy
USAFESA's requirement for information on air filters and energy conser-
vation. Thus, a computerized literature search was conducted in the
DXALOG, Compendex, DOE Energy, and DTIC data bases. Because only a
limited amount of material was uncovered, a manual literature search was
also conducted. In addition, many independent testing organizations and
product manufacturers were contacted for related information.
Only a single document2 that had as one of its goals the measure-
ment and calculation of the effects of clogged filters in a warm-air fur-
nace and in a central air conditioner was found. Because the calculated
values were not supported by the measured values, a careful evaluation
was made. The desired effects were not simulated in the experimental
procedure. .The calculation seems reasonable, but in some cases, the
assumption did not describe realistic situations. However, some of the
computation relating to furnaces is believed valid and will be
incorporated.
3
* Lacking experimental data, this analysis will rely upon basic effects
and behavioral fundamentals of componetits. The discussion will be limited
P to only what is thought necessary to understand the effects that filters
and improper maintenances have on HVAC systems. Because- the basic funda-
mentals of HVAC systems are well understood, supplemental testing is not
recommended.
4
2. AIR-FILTER PURPOSE, TESTING, TYPES, AND SELECTION
2.1 Air-Filter Purpose
Air filters are used to remove from the upstream air particulate
matters that can cause fouling of the heat-transfer surfaces, fans,
motors, and duct interiors in the HVAC system. A side benefit that has
become increasingly more important is the reduction of particulates -
such as fly ash, pollen, carbon, oil, soot, lint, hair, bacteria, and
metallic oxides - to occupied areas. The largest-size particles, in the
range of 1 to 150 urn in diameter, are dusts thrown into the air by
mechanical agencies, such as in grinding, crushing, drilling, and blast-
ing. These particles can be abrasive and can damage motors in the HVAC
system. Fortunately, because of their sizes and weights, these particles
do not travel great distances from their sources. The medium-size parti-
cles, in the range of 0.2 to 1 urn in diameter, are fumes as a result of,
for example, reactions from distillation, oxidation of metal fumes, and
chemicals; the most prevalent example would be sulphuric acid mist.
Particles <0.3 urn in diameter are the smallest and usually come from in-
complete combustions of coal, oil, tar, and tobacco; the smoke from these
reactions can travel great distances. Of the total, >99% of the parti-
cles are 1 urn or less; a few particles in excess of 30 urn are found.
Also, there may be up to 10 million particles/ft3 of air, and air
sampling studies indicate that urban areas can have up to ten times more
suspended particulate matter than rural locations. The particulate
concentrations vary within the same location depending on the height
above street level, day of the week, activity, and season. Because of
the many particles of varying types, sizes, and concentration levels, no
single air-filter type is suitable for every condition.
2.2 Air-Filter Testing
Some considerations for comparing air-filter performance are (1) how
thoroughly a filter removes particulates from the airstream, (2) how much
dust a filter can hold, (3) h ow much resistance to airflow the filter

5
presents, and (4) how frequently the filter must be replaced or cleaned.
To answer these questions, testing procedures have been developed. The
most commonly accepted testing technique uses the American Society of
Heating, Refrigerating and Air-Conditioning Engineers (ASHRAE) standard
52-76, Method of Testing AirM'Zsaning Devices Used in General Ventila-
tion for Removing Particulate Mattere3
"Arrestance" and "efficiency" are expressions used to define an air
cleaner's performance. Arrestance is a measure of the ability of a fil-
ter to remove large-size particles but is not an indication of the fil-
ter's ability to remove small-size particles. Because of this short-
coming, the dust-spot efficiency test was developed and is a measure of
the ability of the filter to remove smaller particles that can discolor
the interior surfaces of the occupied space. Both measurements are nor-
mally performed whenever a filter is tested. However, if the manufac-
turer states that the dust-spot efficiency for a given air filter is
<20X, the filter need not be subjected to this test. Usually, ordinary
filters have a high arrestance and a low efficiency. Special filters
have a high arrestance with the efficiency varying from 20 to X99%. The
dust-holding capacity that is measured during the arrestance test for a
disposable or non-self-renewable filter is the weight of dust held by
the filter when the maximum operating resistance or pressure drop across
the filter, as set forth by the manufacturer, is reached. The dust-
holding capacity does not indicate the life of a filter but does give a
comparison guide to determine which type of filter will last longer
under the same operational conditions.
2.3 Filter Types
The throwaway filter [Fig. l(a)] is the most common. If the filter
medium is contained in a fiberboard frame, the complete unit is thrown
away when it becomes dirty. If a permanent holding frame is used, the
filter medium - often fiberglass or some other high-porosity, coarse-
woven fiber - is replaced. To improve on dust retention, the medium is
coated with a viscous adhesive substance and is effective on the larger
(>5 u> dust particles. A technique to increase the dust-holding capacity

6
ORNL PHOTO 3310-87
Fig. 1. Various filter types (courtesy of American Air ,Til,ter Company).

7
il . +
x
and arrestance is to construct the medium of progressive density. The
open-weave fiber pattern is on the upstream side of the airflow and is
normally colored to aid in correct installation. The fiber diameters
become smaller and the weave progressively tighter toward the air-leaving
side. If the wrong side is turned to the airflow, the efficiency is not
reduced; the usable lifetime, however, is shortened.
A permanent filter [Fig. l(b)] is constructed of metal and can be
cleaned and reused. The filter medium, a viscous, adhesive-coated, metal
mesh, is overlapped to eliminate any direct airflow through the mesh.
After being washed with a warm detergent solution, the mesh must be
recoated. Because a washing facility with warm water must be available
and if there is any labor cost associated with cleaning these filters,
replacement with a throwaway type is more cost-effective.
A semipermanent filter is the thin, polyfoam medium often found in
window air conditioners or residential heating/cooling units. The medium
can be permanently attached to a frame, inserted into a permanent frame,
or cut from a larger piece to fit a filter opening. If the latter is the
case, some support is provided to hold the medium in position. The
polyfoam is washable, and a special filter spray can be used to improve
the dust collection capability. Age and use will eventually cause the
medium to disintegrate. The medium replacement can be the same type or
the thin, viscous-coated medium.
The dry, or "straining," filter has a higher dust-spot efficiency
and can be considered as another throwaway type; Cotton and synthetic
fibers are the medium for filters with an average dust-spot efficiency of
15 to 40%. To obtain efficiencies up to 90 to 95%, ultrafine fiberglass
is used. These higher efficiencies result in higher initial and final
pressure drops across the medium. For longer life and a greater surface
area, the medium is either contour pleated [Fig. l(c)] or shaped into
inflatable bags, which are collapsed for shipment and storage space
reduction. The filter medium can be fitted into a supporting frame or
basket or can come supplied with its own frame. Because of this medium's
relatively higher cost, prefiltering with a low-efficiency, cheaper
filter is recommended.
8
In the special filter category are the high-efficiency, particulate
air filters (HEPA) and the ultra-low-penetration air filters (ULPA), both
of interest to those concerned with clean rooms and nuclear power plant
operations. Slightly less efficient than these two types are those
designed to remove airborne biological contaminants in hospital critical
areas and food and pharmaceutical processing plants. These special
filters are beyond the scope of this report and will not be discussed.
Also not covered are electronic air cleaners.
All of the filters discussed above can be classified as unit filters
and come packaged individually or have a discrete replacement piece of
medium. For large air volumes, rows of these filters can be installed
in the air-handling portion of the HVAC system. For still larger air
volumes, the filters are installed on a wall of a room devoted to hand-
ling the filters; there may be more than one of these rooms. All of the
filters in the room are usually changed at the same time.
Another method for filtering large quantities of air is the use of
roll filters [Fig. l(d)]. The medium is a large, bulk roll of filter
material that forms a curtain in a frame. Similar to the unit filters,
as many frames as necessary in the filter room can be used to handle the
airflow. The choice of medium is determined by the amount of filtration
required. When the medium becomes dirty, fresh medium is unrolled. The
used medium is rolled at the bottom if the frame is vertically mounted
(horizontal mounting is sometimes employed). The medium can be intermit-
tently fed manually or automatically by some predetermined criterion. By
small incremental feeding of the medium, the dust-holding capacity is
almost doubled over that obtained by feeding the medium !a full sheet at a
time. Some criteria used to roll the medium are visual inspection, a
preset time interval, a preset pressure drop across the filter, and a
measured light attenuation level through the dirty medium. The least-
reliable method is the visual inspection because a clogged filter may not
appear dirty and a seemingly dirty filter may not be clogged. The timer
method is not much better because of the many variations in the pollutant
levels and the fact that the timer does not allow full use of the first
sheet of medium. The pressure drop across the medium should be the best
criterion, but in actual practice there have been some problems with the

9
*
I
pressure switches causing troublesome operation. The use of a photo-
electric sensor has been more reliable and is the preferred method.
2.4 Air-Filter Selection
Because of the numerous types of filters for many different pur-
poses, the selection of the most-economical filter must be based on the
consideration of certain factors. One obvious factor is the availability
of filters that match the frame size and thickness of the filter housing.
More important, the filter must be compatible with the rated specifica-
tions of the HVAC system, namely, (1) the filter-face velocity, (2) the
pressure drop across the filter, and (3) the airflow capacity. For the
more-common viscous impingement filters, some typical values are pre-
sented. Depending on the thickness of the filter, which typically ranges
from l/2 to 4 in., the values are 300 to 500 ft/min for the initial
filter-face velocity and 0.10 to 0.25 in., water gauge, for the initial
resistance. The final pressure drop is expected to be -0.5 in., water
gauge. The final airflow capacity can be determined from the size of the
opening and the other two quantities. The average arrestance is -80%.
The average dust-spot efficiency will range from 5 to 10% for the l/2-in.-
thick medium and 10 to 25% for the 4-in.-thick medium.
A determination must be made in the selection of the degree of fil-
tration required. If protecting the heat-transfer surface is the main
goal, a low-efficiency filter will be satisfactory under normal operating
conditions. If cleaner air is required, a wide variety of higher-
efficiency filters is available. These filters offer more resistance to
the airflow and affect the energy consumption by requiring more horsepower
to move the air through the filter.
Some major filter manufacturers have representatives available to
advise on the proper selection of air filters and to conduct seminars;
some will provide life-cycle studies. Reference 4 contains a comprehen-
sive list of air-filter manufacturers.

10
3. FUNDAMENTALS OF WAC SYSTEMS
3.1 Refrigeration Cycle
A brief description of the simple vapor-compression refrigeration
cycle for an air-to-air system is presented5 to aid in understanding some
of the problems that clogged air filters or dirty heat-transfer surfaces
can cause in air-conditioning systems. The basic components (Fig. 2) are
the evaporator, compressor, condenser, and expansion device.
The evaporator is the coil through which indoor air is passed to
provide cooling. The refrigerant enters the evaporator from an expansion
device as a liquid-vapor mixture and leaves as a low-pressure, low-
temperature, slightly superheated vapor (point 1). This gas then enters
the compressor where it is compressed to a high-temperature, high-
pressure, superheated vapor (point 2). This hot vapor enters the con-
denser coil where it is cooled and condensed - at constant pressure - to
ORNL-DWG 87-4029 ETD
AIR FLOW
HIGH [ @qlS$
PRESSURE -EXPANSION
DEVICE
L IWI COMPRESSOR
1 - LOW-PRESSURE, LOW-TEMPERATURE, SLIGHTLY SUPERHEATED VAPOR
2 - HIGH-PRESSURE, HIGH-TEMPERATURE, SUPERHEATED VAPOR
3-HIGH-PRESSURE, INTERMEDIATE-TEMPERATURE LIQUID
4- LOW-PRESSURE, LOW-TEMPERATURE, LIQUID-VAPOR MIXTURE
Fig. 2. Simple refrigeration cycle: schematic flaw diagram.
11
a high-pressure, intermediate-temperature liquid (point 3). The heat of
condensation is dissipated into the atmosphere by air blown through a
coil usually located outdoors. The liquid then travels to the expansion
device through which it is then admitted to the adjacent evaporator.
When the refrigerant enters the low-pressure region of the evaporator,
enough liquid flashes into vapor to cool the remaining liquid to the pre-
vailing saturation temperature (point 4). In the evaporator the re-
maining liquid is vaporized (by absorbing heat from the air being cooled)
to the original slightly superheated vapor starting point (point 1) to
repeat the cycle. Because heat travels from a higher to a lower tempera-
ture, the conditioned space heat is, therefore, transferred to the
refrigerant in the evaporator and then rejected to the outdoor air by the
condenser. When the unit is operating, it is this heat, plus the heat of
compression of the refrigerant, that is rejected by the outdoor unit.
3.2 Other Cooling Systems
Although an air-to-air refrigeration system has been described, the
same principles apply to other cooling systems using the compression
cooling cycle. For medium-size systems, where the cost of water is not
prohibitive or where a source of outdoor air is not convenient, the con-
denser can be cooled by city water that is usually dumped down a drain.
An air evaporator coil may still be used to cool the indoor air.
In large buildings, a hydronic system is usually employed for heating
and cooling. The heat removal from the condenser coil may employ large
fan units or use water. For water-cooled units, cooling towers are nor-
mally used to cool an inner loop of water that is heated by the con-
denser. For cooling, chilled water surrounding the evaporator is piped
throughout the building. Heat is removed by blowing the indoor air
through coils cooled by the chilled water, which is then cycled back to
the evaporator. For heating, the hydronic system's water is heated.
3.3 Heat Pump
The heat pump uses the refrigeration cycle for both heating and
coaling. When there is a demand for heat, the indoor coil becomes the

12
condenser through a reversing valving arrangement. The liquid refrig-
erant is expanded as a vapor through the expansion valve and evaporates
in the outdoor coil. Heat is supplied from the. atmosphere for the
vaporizing action and is then transferred to the interior of the build-
ing by compressing the vapor and condensing the refrigerant to a liquid.
During periods of extreme cold weather when the heat pump does not have
sufficient capacity to maintain the desired indoor temperature, auxil-
iary electric resistant heater strips are employed.
3.4 Furnace
The visit to the Army installations indicated a predominance of gas
furnaces. Because of the limited scope of this report, only the forced-
air, atmospheric gas-fired type furnace will be discussed. Figure 3 is
a cutaway drawing of this type of furnace with the air filter removed
from the cold-air return. Gas is mixed with air and burned in a chamber
at atmospheric pressure. The outer surface of this chamber is the heat
exchanger that heats the interior air, which is then distributed through-
out the building through ducts. The main gas valve is controlled by the
building thermostat. The blower motor is activated by another thermo-
stat that senses when the heat-exchanger temperature is hot enough.
Heat can continue to be extracted from the hot heat exchanger long after
the flame has been extinguished. To conserve energy, the blower motor
is deactivated when a cool-enough temperature is reached.
The amount of gas to the amount of primary-air mixture in the com-
bustion process is factory set for most small units and is usually not
adjustable. For larger units this ratio can be adjusted for optimum
combustion efficiency. The steady state efficiency is measured by ana-
lyzing the flue-gas temperature and the concentrations of certain combus-
tion products. The flue-gas temperature should be as low as possible,
w350°F, without condensation forming in the flue venting system and
causing corrosion. Higher flue temperatures waste energy up the
stack. The optimum fuel-air mixture is achieved with stoichiometric
(complete) combustion.

DWG 87 4193 ETD
JPPLY
DRAFT HOOD
ROOM AIR IN
GAS CONTROL VALVE -
BURNERS
COMBUSTION AIR IN - (ROOM Al R)
COLD AIR , RETURN
-
HEAT EXCHANGER
CIRCULATING AIR BLOWER
Fig. 3. Atmospheric combustion furnace - central, upflow, forced circulation.
3.5 Air Handler
3.5.1 Blower assembly and motors
The blower assembly is composed of the fan, usually centrifugal,
and housing. Impellers are forward curved, radial or straight, and
backward curved [Figs. 4(aL(c)]. Typical performance curves are shown
in Figs. 5(a)-(c). The highest efficiencies and static pressures usu-
ally occur around one-half of the wide-open volume. For the forward- curved and the radial impeller fans, the power rises continuously toward
the free-air delivery, and it is possible to overload the motor if a

14
ORNL-DWG 87-3965 ETD
CURVED
BACKWARD-
CURVED
Fig. 4. Fan impellers (rotation is in the direction of the arrows). Source: Adapted with permission from Carrier System Design Manual. Part 6: Air HandZing Equipment, Carrier Air Conditioning Company, Syracuse, N.Y., 1963, Fig. 5, p. 6-3.
reasonable capacity margin has not been provided. For the backward-
curved impeller fan, the horsepower curve peaks at high capacity and
does not overload at any point on the curve at any fan speed if the
speed is maintained.
For a given type of fan, the characteristic performances6 are that
1. the capacity varies directly with the fan speed,
2. the static discharge pressure varies as the square of the fan speed,
and
3. the horsepower or energy requirement varies as the cube of the fan
speed.
The air filter is always installed upstream of the blower assembly
and the heat exchanger to keep these components clean and the air filter
from becoming heated.
3.5.2 Dampers
On medium-to-large HVAC systems automatic .dampers are installed to
allow the entry of fresh outdoor air. These dampers operate by closing
to the minimum position in the summer and winter and by opening fully
during intermediate seasons. During the intermediate season the use of
outdoor air may be sufficient to maintain the indoor-air comfort level.
If the dampers are not closed to minimum position during hot or cold

ORN L-DWG 87-3964 ETD
80
60
0 0 10 20 30 40 50 60 70 80 90 100
FREE DELIVERY CAPACITY I%)
Fig. 5. Fan impellers' performances. (a) Forward-curved fan impeller performance, (b) radial fan-impeller performance, (c) backward- curved fan-impeller performance. Source : Adapted with permission from Carrier System Design Manual. Part 6: Air Handling Equipment, Carrier Air Conditioning Company, Syracuse N.Y., 196'3, Figs. 6-8, pp. 6-3 and 6-4.
. outdoor temperatures, energy is wasted by bringing the air to the
desired comfort level. On large units the air is usually filtered near
the entry.
16
4. EFFECTS ON HVAC SYSTEMS' PERFORMANCES
4.1 Refrigeration Systems
In cooling systems the only useful refrigeration is due to the heat
transferred by the evaporator. The maximum performance of the cycle is
obtained by operating at the maximum possible evaporating temperature
and at the lowest possible condensing temperature.7 Any deviation in
these temperatures will affect the air-conditioner's performance and
energy consumption. As the air filter becomes clogged, the airflow
across the evaporator is reduced, and heat transfer from the air to the
evaporator is inhibited. A dirty evaporator surface also lowers the
heat-transfer coefficient so that less heat can be transferred to the
refrigerant. When either the filter becomes clogged or the evaporator
surface becomes dirty, the evaporator temperature and the suction pres-
sure are lowered, thus reducing the cycle efficiency.
Single-layered condenser coils, although not filtered, are not
prone to get dirty if properly installed. Multilayer condenser coils
are more likely to clog because of debris becoming trapped between the
coils. When installed at the ground level, the unit should be placed on
a concrete pad of sufficient size so that rain cannot splash dirt onto
the coils; ground cover or certain bushes also can be effective in pre-
venting splashing. If possible, no trees should be in close proximity.
If nearby trees are unavoidable, the coils should be checked periodi-
cally for accumulation of leaves, seed pods from trees, or pine needles,
especially in the fall and spring. Units in a high-dust area with heavy
particles, such as those from a coal-fired plant, also .should be checked
periodically. Mowers should be cautioned not to blow grass clippings
into the coils. If the condenser coils become dirty or clogged with
debris, the discharge temperature and pressure will rise. Unless pro-
tected by a high-pressure limit switch, the compressor can be damaged.
In refrigeration systems there are two basic types of expansion de-
vices. First, the thermostat expansion valve has a thermostatic bulb
attached to the suction line from the evaporator coil. This bulb senses
any increase in the coil temperature and causes the valve to open wiser
17
to admit more refrigerant.- The pressure of the refrigerant on the low-
pressure side of the valve tends to close the valve. When the valve is
functioning properly, no liquid can get to the compressor. The second
expansion device is a small-diameter capillary tube sized to reduce the
condenser pressure to the evaporator pressure. The amount of refriger-
ant passing through the tube is dependent upon the pressure difference
across it and the amount of subcooling of the high-pressure liquid
entering the tube. Although the tube tends to be self-adjusting, the
combination of less heat being transferred by the evaporator and a
higher liquid pressure caused by an abnormally high outdoor temperature
or a dirty condenser coil can overcome the compensating effect and pro-
duce a flood-back condition in which some liquid reaches the compressor.
Because liquid is virtually incompressible, damage to the compressor is
likely if enough liquid enters.
As related by one air-conditioner manufacturer, flood-back has been
observed during tests conducted on their units with a capillary tube and
an evaporator airflow reduction of 55% of the unit's rating at an out-
side air temperature of 105'F for its single-packaged units and at 112'F
for its split systems. Thus, the combination of the air conditioner's
being taxed during extremely hot weather and having reduced airflow
through the evaporator may produce a flood-back condition, causing
damage to the compressor. This set of operating conditions may be con-
sidered one limiting criterion beyond which the air conditioner should
not be operated. This limit will also be used in the analysis. There-
fore, for units with a capillary tube expansion device, the importance
of keeping the air filter and the evaporator coil clean during peak
cooling periods cannot be overemphasized.
Since the mid-1950s, the capillary tubes, easier and cheaper to
manufacture, have become widely used in small- and middle-size units.
These tubes also tend to give no problem because there is no moving
part. If the refrigerant becomes dirty, the tube can plug, but replace-
ment is relatively inexpensive. However, under the flood-back condition
the more-expensive compressor can be damaged.
18
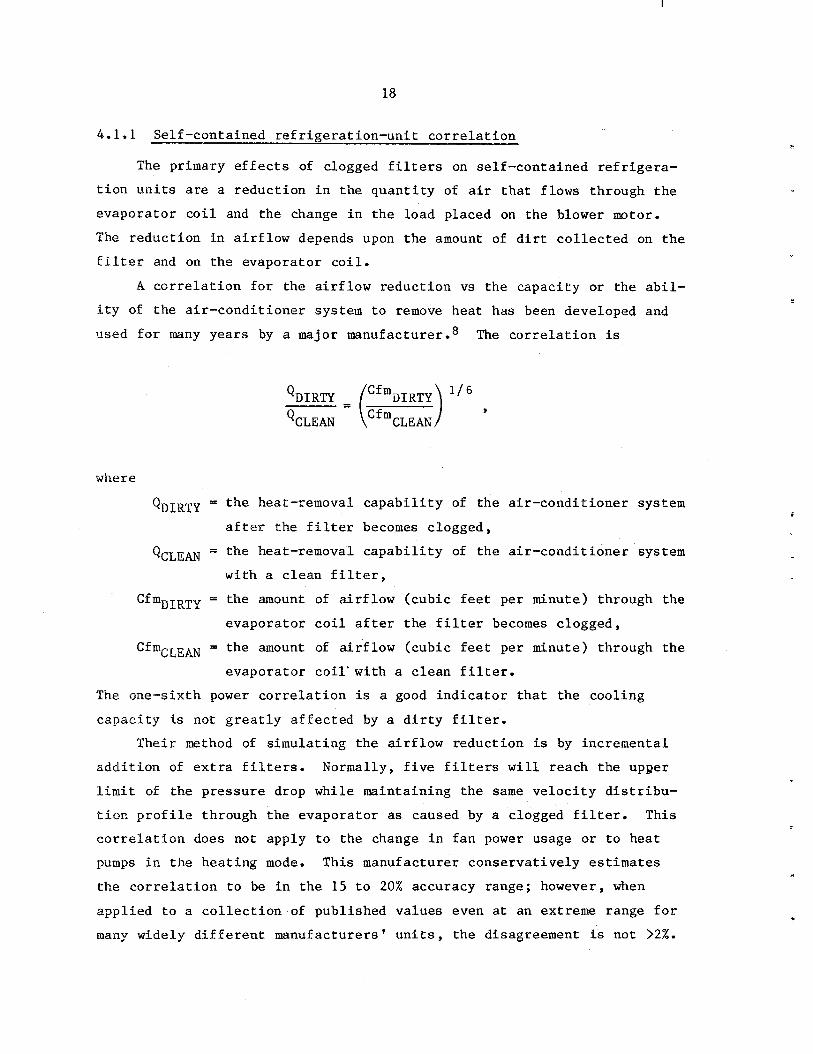
4.1.1 Self-contained refrigeration-unit correlation
The primary effects of clogged filters on self-contained refrigera-
tion units are a reduction in the quantity of air that flows through the
evaporator coil and the change in the load placed on the blower motor.
The reduction in airflow depends upon the amount of dirt collected on the
filter and on the evaporator coil.
A correlation for the airflow reduction vs the capacity or the abil-
ity of the air-conditioner system to remove heat has been developed and
used for many years by a major manufacturer.* The correlation is
Q DIRTY = l/6
QCLEAN ,
where
QDIRTY = the heat-removal capability of the air-conditioner system
after the filter becomes clogged,
Q CLEAN = the heat-removal capability of the air-conditioner system
with a clean filter,
CfmDIRTY = the amount of airflow (cubic feet per minute) through the
evaporator coil after the filter becomes clogged,
CfmCLEAN = the amount of airflow (cubic feet per minute) through the
evaporator coil'with a clean filter.
The one-sixth power correlation is a good indicator that the cooling
capacity is not greatly affected by a dirty filter.
Their method of simulating the airflow reduction is by incremental
addition of extra filters. Normally, five filters will reach the upper
limit of the pressure drop while maintaining the same velocity distribu-
tion profile through the evaporator as caused by a clogged filter. This
correlation does not apply to the change in fan power usage or to heat
pumps in the heating mode. This manufacturer conservatively estimates
the correlation to be in the 15 to 20% accuracy range; however, when
applied to a collection of published values even at an extreme range for
many Twidely different manufacturers' units, the disagreement is not >2%.

19
By setting a limit for the airflow through a dirty filter to 55% of
the flow through a clean filter, a simpler, approximate expression can be
derived. Although this simpler expression may seem to be applicable only
to units with
use with most
i Q DIRTY = Q CLEAN
.
When the mass flow limit is substituted, the lower limit of the heat-
a capillary tube, it will be seen later to be suitable for
types of air-conditioning units. The expression is
Cfm 0.2 x CfmDIRTY + 0.8 ,
CLEAN
removal capacity factor QDIRTY/QCLEm iS 0.91.
How valid is 0.91 as a lower limit? During one of the times that
filters were being changed at Fort Bragg, some of the used filters were
saved for testing. The degree of clogging varied from light to ex-
tremely heavy, and there was no doubt. that the dirtiest filter had
exceeded its useful life. Also, the manufacturer's suggested maximum
allowable pressure drop across that filter was exceeded. In a fabri-
cated test rig, the airflow measured by Fort Bragg's Engineers was
1150 ft3/min for a clean filter and 700 ft3/min for the dirtiest
filter. These measurements translate into a reduced mass flow factor
CfmDIRTY/CfmCLEAN of 0.61, which is considerably higher than the 0.55
chosen. Applying either correlation, the capaci'ty factor QDIRTY/QCLEAN
is 0.92. Therefore, regardless of what type of expansion device is
used, the value of 0.91 appears to be a valid lower limit for the
reduction in the heat-removal capacity because of a very dirty filter.
The limit also corresponds with that condition where flood-back can
occur.
4.1.2 Air-conditioner performance evaluation
In addition to a reduction in the airflow through the evaporator
coil caused by a clogged filter, dirt on the evaporator coil will reduce
the heat-transfer capability of the refrigerant to extract heat from the
airstream. Even a thin film of dirt on any metal surface will affect
the heat-transfer coefficient. For a dirty evaporator a reasonable
estimated drop in the refrigerant's temperature is -lOoF; a much larger

20
change is not expected, If the refrigerant becomes slightly colder, ice
will likely form on the evaporator coil.
Likewise, a change in the heat-transfer coefficient because of a
dirty condenser is expected to increase the condensing temperature
-10°F. If there is airflow blockage, the temperature could rise higher.
These estimated temperature limits do not represent the worst possible
case but are reasonable expected limits because of reduced airflow or
heat transfer. Long before the maximum limits are reached and espe-
cially during hot weather, the occupants should be complaining about
inadequate cooling, or the unit may have malfunctioned.
The compressor's performance data can be used to determine the mag-
nitude of the effects of dirty filter, dirty or clogged evaporator coil,
and dirty or clogged condenser c0i1.~~~~ The capacity and power re-
quirement for compressors operating at various suction and condensing
temperatures are available from the manufacturers, The suction tempera-
ture, nearly equal to the temperature of the refrigerant leaving the
evaporator, will be assumed to be the same. Using manufacturer's data,
the compressor's capacity for different units over all sizes was found
to be nearly proportional to any other unit at the same operating condi-
tion for the commonly used R-12 and R-22 refrigerants. However, the
power requirement may differ slightly, especially when older units are
compared with modern units with more-efficient motors or when there is a
comparison between motors sealed within the compressor or located
externally.
From the performance data three performance factors - capacity,
power, and energy - will be defined. These factors are derived from
ratios of compressor capacity and power requirements at some suction
temperature TS and condensing temperature TC to the corresponding quan-
tity at a selected baseline temperature condition TSBL and TCBLS
The capacity factor is
Capacity Factor = Q(T,, Tc'
Q(TSBL' TCBL' '
where the quantity Q is the cooling capacity at the designated tempera-
tures,
21
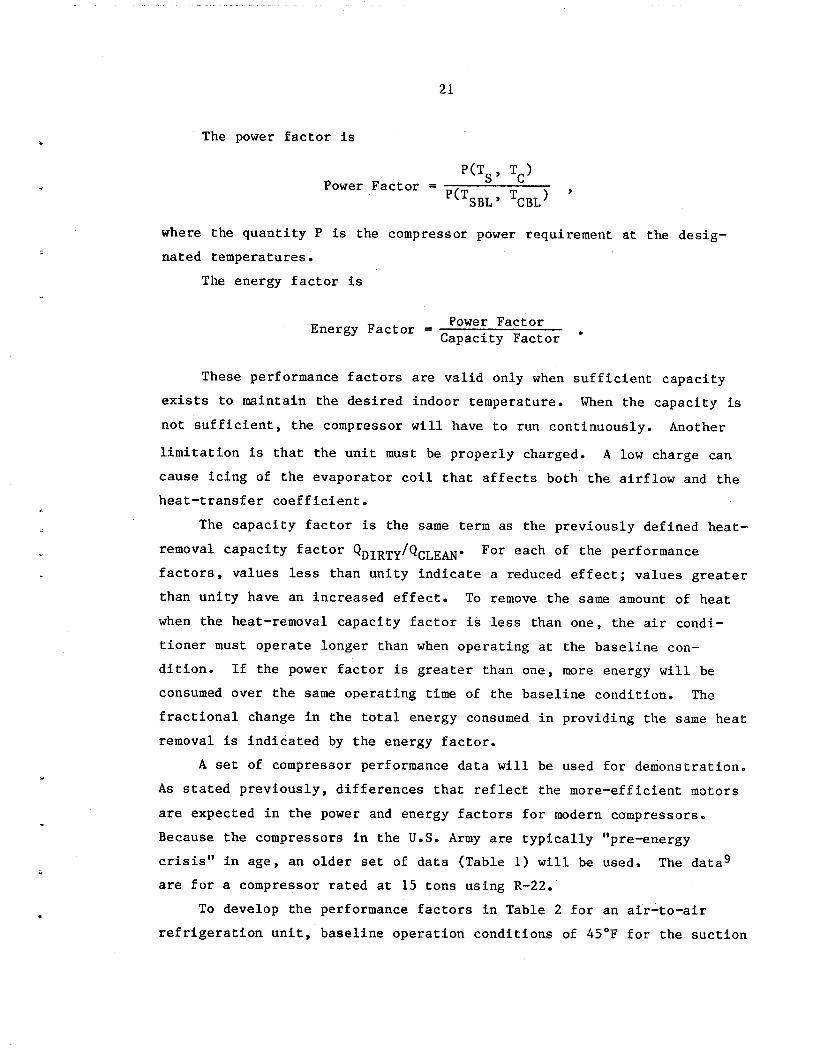
The power factor is
Power Factor = P(‘$, TC>
P('JJ , SBL' TCBL)
where the quantity P is the compressor power requirement at the desig-
nated temperatures.
The energy factor is
Energy Factor = Power Factor Capacity Factor '
These performance factors are valid only when sufficient capacity
exists to maintain the desired indoor temperature. When the capacity is
not sufficient, the compressor will have to run continuously. Another
limitation is that the unit must be properly charged. A low charge can
cause icing of the evaporator coil that affects both the airflow and the
heat-transfer coefficient.
The capacity factor is the same term as the previously defined heat-
removal capacity factor QUTRTy/QCLEm. For each of the performance
factors, values less than unity indicate a reduced effect; values greater
than unity have an increased effect. To remove the same amount of heat
when the heat-removal capacity factor is less than one, the air condi-
tioner must operate longer than when operating at the baseline con-
dition. If the power factor is greater than one, more energy will be
consumed over the same operating time of the baseline condition. The
fractional change in the total energy consumed in providing the same heat
removal is indicated by the energy factor.
A set of compressor performance data will be used for demonstration.
As stated previously, differences that reflect the more-efficient motors
are expected in the power and energy factors for modern compressors.
Because the compressors in the U.S. Army are typically "pre-energy
crisis" in age, an older set of data (Table 1) will be used. The data9
are for a compressor rated at 15 tons using R-22.
. To develop the performance factors in Table 2 for an air-to-air
refrigeration unit, baseline operation conditions of 45'F for the suction
22
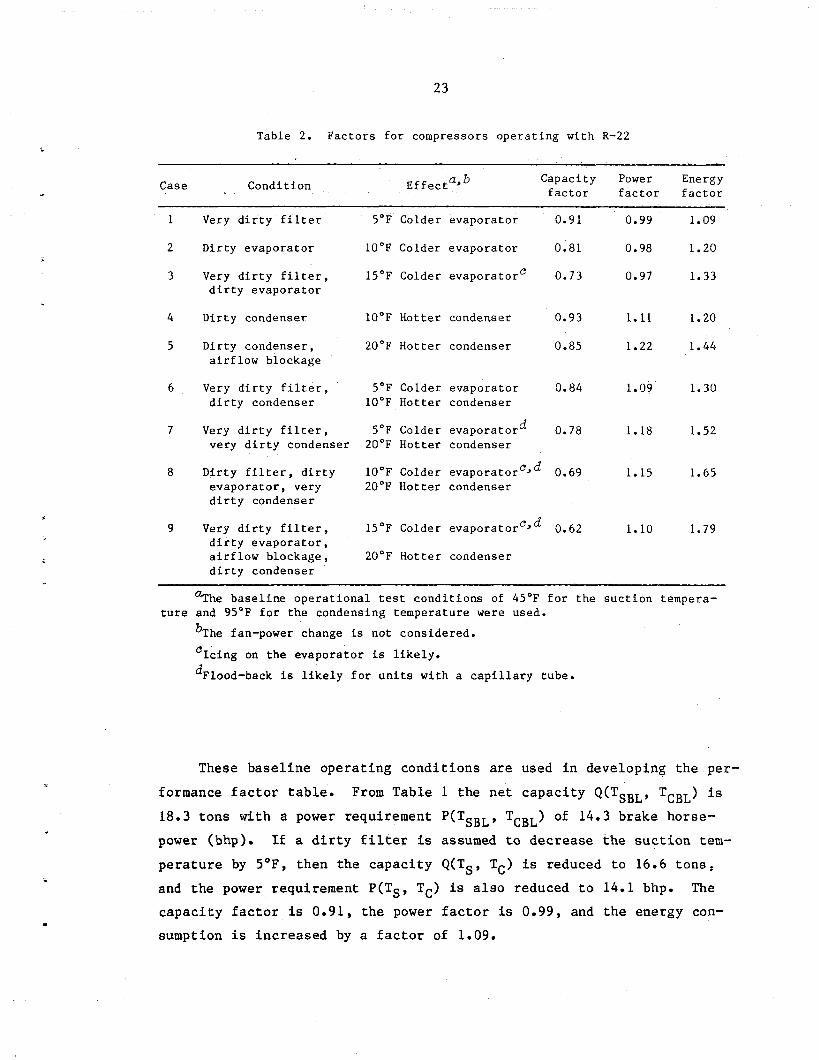
Table 1. Capacity and power demand for various suction and condensing temperatures for a 15-ton
compressor operating. on R-22"
---- ___
Capacity and power at various condensing temperatures Suction
temperature 85'F 95°F 105'F 115OF (OF)
Tons bhp Tons bhp Tons bhp Tons bhp
0 6.8 10.3 6.1 9 5.6 10.9 5 7.5 10.8 7.1 11.3 6.3 11.7
10 8.9 11.2 8.1 11.9 7.3 12.4 15 10.1 11.7 9.3 12.4 8.4 13.2 20 11.4 12.1 10.5 13 9.6 14 25 12.9 12.4 11.9 13.4 11.0 14.5 30 14.4 12.5 13.3 13.8 12.4 14.9 35 16.1 12.5 14.9 14 13.8 15.3 40 17.7 12.6 16.6 14.1 15.4 15.6 45 19.6 12.7 18.3 14.3 17 15.9 50 21.5 12.7 20 14.4 18.6 15.9
5.7 12.1 6.6 13 7.6 13.8 8.7 14.5 9.9 15.3
11.3 15.8 12.7 16.4 1'4.2 16.9 15.6 17.5 17.3 17.7
aReproduced by permission of The Trane Company, La Crosse, Wisconsin.
source : R. W. Roose, camp.-ed., Handbook of Energy Conserva- tion for Mechanical Systems in Buildings, copyright 1978 by Litton Educational Publishing, reprinted by permission of Van Nostrand Reinhold, New York, all rights reserved, Table 43-3, p. 281.
temperature TSBL and 95'F for the condensing temperature TCgL were
elected because of the following considerations.
1. To generate a cooling sensation, the air temperature leaving the
evaporator should be at least 20°F cooler than the indoor tempera-
ture. If 75'F is the indoor thermostat setting, the air leaving the
evaporator should be ~55'F, which would require that the suction'
temperature be ~45'F.
2. Cooling needs are expected when the ambient outdoor temperature
reaches -85'F and hotter. This temperature translates into a con-
densing temperature of -95'F, which is our reference temperature. A
water-cooled unit would probably have a condensing temperature of
105“F, and a similar table could be constructed. A check showed that
these factors differ slightly, but not significantly, from the
factors of the above baseline temperatures.
23
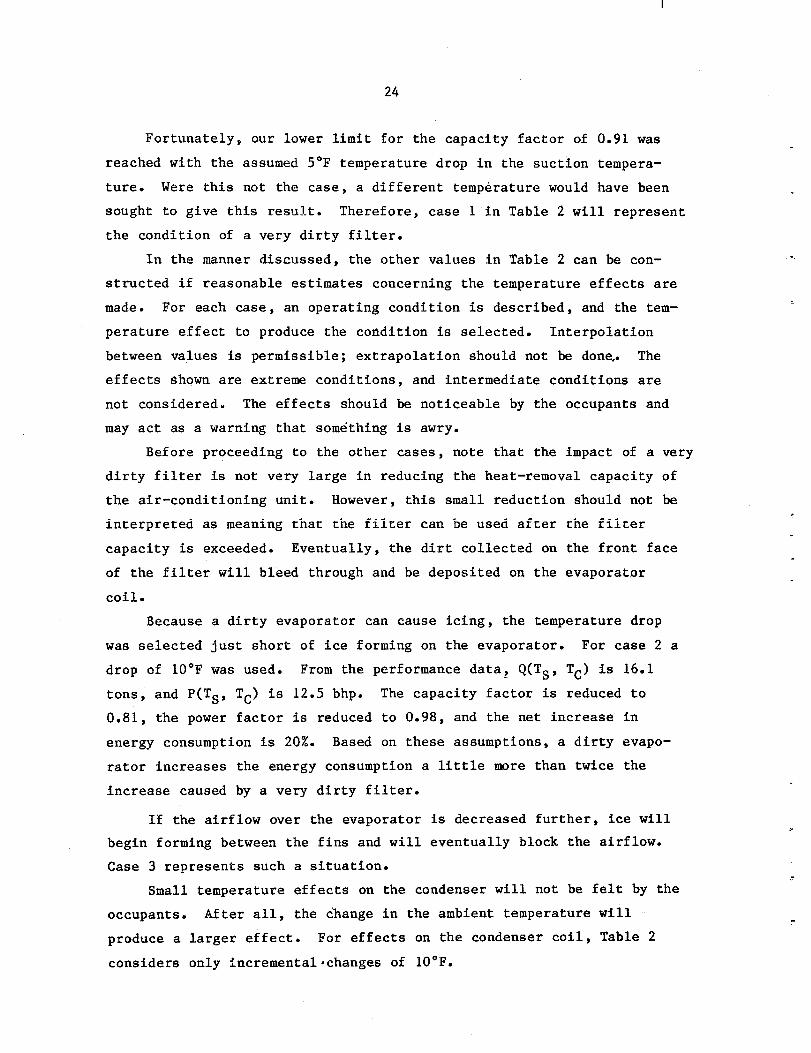
Table 2. Factors for compressors operating with R-22
. 4
5
6
7
8
‘ 9
Case Condition Effect a,b Capacity Power Energy factor factor factor
Very dirty filter
Dirty evaporator
Very dirty filter, dirty evaporator
5°F Colder evaporator 0.91 0.99 1.09
lOoF Colder evaporator 0.81 0.98 1.20
15“F Colder evaporatorC 0.73 0.97 1.33
Dirty condenser
Dirty condenser, airflow blockage
lOoF Hotter condenser 0.93 1.11 1.20
20°F Hotter condenser 0.85 1.22 1.44
Very dirty filter, 5’F Colder evaporator 0.84 dirty condenser lOoF Hotter condenser
Very dirty filter, 5°F Colder evaporatord 0.78 very dirty condenser 20°F Hotter condenser
1.09 1.30
1.18 1.52
Dirty filter, dirty 1O“F Colder evaporator cJd 0.69 evaporator, very 20°F Hotter condenser dirty condenser
1.15 1.65
Very dirty filter, 15°F Colder evaporator cJd 0.62 dirty evaporator, airflow blockage, 20°F Hotter condenser dirty condenser
1.10 1.79
%‘he baseline operational test conditions of 45°F for the suction tempera- ture and 95’F for the condensing temperature were used.
bThe fan-power change is not considered.
‘Icing on the evaporator is likely. d Flood-back is likely for units with a capillary tube.
These baseline operating conditions are used in developing the per-
formance factor table. From Table 1 the net capacity Q(TSBL, TCBL) is
18.3 tons with a power requirement P(TsBL, TCBL> of 14.3 brake horse-
power (bhp) . If a dirty filter is assumed to decrease the suction tem-
perature by 5’F, then the capacity Q(TS, TC) is reduced to 16.6 tons,
and the power requirement P(TS, TC> is also reduced to 14.1 bhp. The
capacity factor is 0.91, the power factor is 0.99, and the energy con-
sumption is increased by a factor of 1.09.
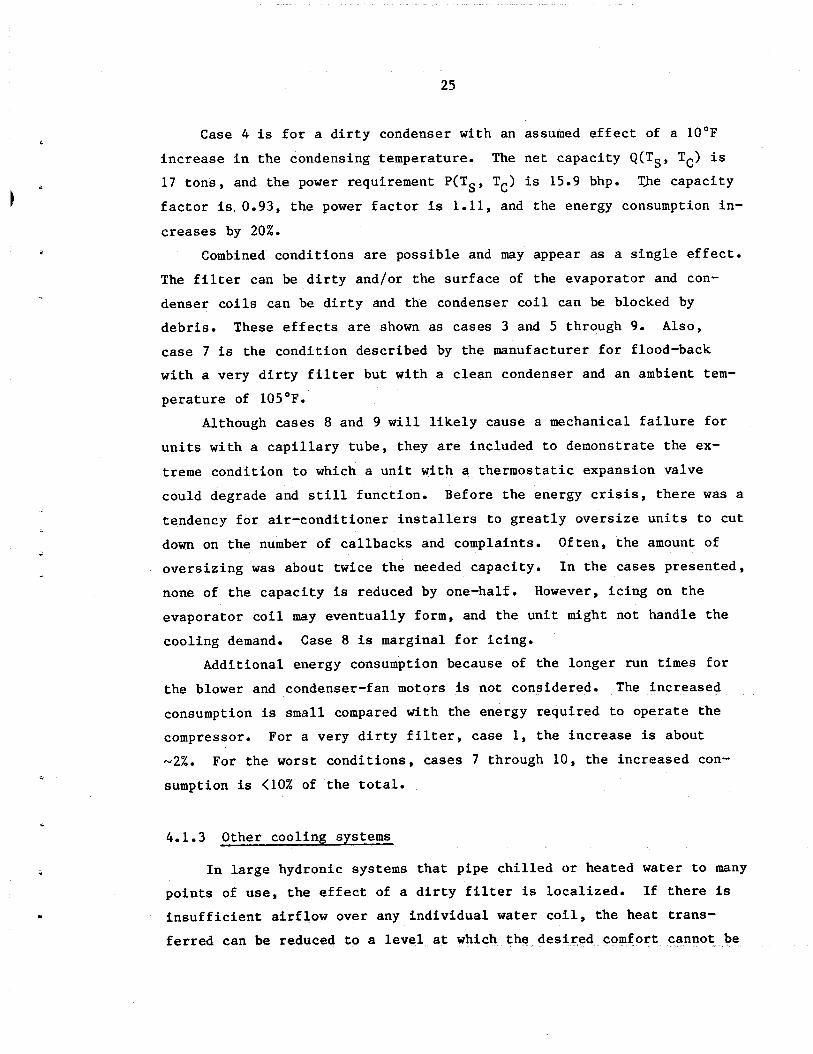
24
Fortunately, our lower limit for the capacity factor of 0.91 was
reached with the assumed 5'F temperature drop in the suction tempera-
ture. Were this not the case, a different temperature would have been
sought to give this result. Therefore, case 1 in Table 2 will represent
the condition of a very dirty filter.
In the manner discussed, the other values in Table 2 can be con-
structed if reasonable estimates concerning the temperature effects are
made. For each case, an operating condition is described, and the tem-
perature effect to produce the condition is selected. Interpolation
between values is permissible; extrapolation should not be done,. The
effects shown are extreme conditions, and intermediate conditions are
not considered. The effects should be noticeable by the occupants and
may act as a warning that something is awry.
Before proceeding to the other cases, note that the impact of a very
dirty filter is not very large in reducing the heat-removal capacity of
the air-conditioning unit. However, this small reduction should not be
interpreted as meaning that the filter can be used after the filter
capacity is exceeded. Eventually, the dirt collected on the front face
of the filter will bleed through and be deposited on the evaporator
coil.
Because a dirty evaporator can cause icing, the temperature drop
was selected just short of ice forming on the evaporator. For case 2 a
drop of lOoF was used. From the performance data, Q(TS, TC) is 16.1
tons, and P(TS, TC> is 12.5 bhp. The capacity factor is reduced to
0.81, the power factor is reduced to 0.98, and the net increase in
energy consumption is 20%. Based on these assumptions, a dirty evapo-
rator increases the energy consumption a little more than twice the
increase caused by a very dirty filter.
If the airflow over the evaporator is decreased further, ice will
begin forming between the fins and will eventually block the airflow.
Case 3 represents such a situation.
Small temperature effects on the condenser will not be felt by the
occupants. After all, the c'hange in the ambient temperature will
produce a larger effect. For effects on the condenser coil, Table 2
considers only incrementalochanges of lOoF.
25
L Case 4 is for a dirty condenser with an assumed effect of a lOoF
increase in the condensing temperature. The net capacity Q(T8, TC) is
17 tons, and the power requirement P(T8, TC) is 15.9 bhp. The capacity
factor is.O.93, the power factor is 1.11, and the energy consumption in-
creases by 20%.
Combined conditions are possible and may appear as a single effect.
The filter can be dirty and/or the surface of the evaporator and con-
denser coils can be dirty and the condenser coil can be blocked by
debris. These effects are shown as cases 3 and 5 through 9. Also,
case 7 is the condition described by the manufacturer for flood-back
with a very dirty filter but with a clean condenser and an ambient tem-
perature of 105'F.
Although cases 8 and 9 will likely cause a mechanical failure for
units with a capillary tube, they are included to demonstrate the ex-
treme condition to which a unit with a thermostatic expansion valve
could degrade and still function. Before the energy crisis, there was a
tendency for air-conditioner installers to greatly oversize units to cut
down on the number of callbacks and complaints. Often, the amount of
oversizing was about twice the needed capacity. In the cases presented,
none of the capacity is reduced by one-half. However, icing on the
evaporator coil may eventually form, and the unit might not handle the
cooling demand. Case 8 is marginal for icing.
Additional energy consumption because of the longer run times for
the blower and condenser-fan motors is not considered. The increased
consumption is small compared with the energy required to operate the
compressor. For a very dirty filter, case 1, the increase is about
-2%. For the worst conditions, cases 7 through 10, the increased con-
sumption is <10X of the total.
4.1.3 Other cooling systems
In large hydronic systems that pipe chilled or heated water to many
points of use, the effect of a dirty filter is localized. If there is
insufficient airflow over any individual water coil, the heat trans-
ferred can be reduced to a level at which the,desired comfort cannot be

26
maintained. The water, when returned for recycling, is mixed with the
much larger total volume. A single or a small number of units having
dirty filters or coils does not greatly affect the suction temperature,
and the effect on the system is small. A large number of affected units
will be required to have a significant impact.
Air-cooled condensing units should experience the same temperature
effects as discussed for the self-contained units. Fortunately, the
large units have a tendency to reject debris buildup, and hardly any
problem is expected because of a dirty or clogged coil.
4.2 Heat Pumps
In the cooling mode the heat pump acts exactly as an air condi-
tioner. The previously described effects and correlation are applicable.
In the heating mode the condenser coil becomes the evaporator coil
and vice versa. With a set of performance data and different baseline
temperatures, a performance factor table could be constructed. However,
the available data cover only a limited range and do not include the
type of effects sought. Only a few effects can be calculated.
For a dirty filter with a 20% reduction in the mass airflow, the
gross heating capacity factor is reduced slightly by 0.98 with an in-
crease in the power factor to 1.02. The result is an increase of 4% in
the energy consumption. With the same reduction in the mass air-flow,
the gross cooling capacity is reduced by 0.96, which is less than when
the same unit is in the heating mode. This trend applies to all of the
different units checked.
An estimate was made for a dirty or clogged outdoor coil by assum;-
ing a lOoF drop in the suction temperature. The capacity factor was re-
duced to 0.81 with a drop in the power factor ,to 0.95. The energy fac-
tor increased to 1.17. The outside coil is not likely to get dirty
while in the heating mode. Moisture from the air will condense and will
tend to keep the fins washed. However, debris may have accumulated dur-
ing the fall.
While the unit is in the heating mode, any dirt fouling the inside
coil will be baked onto the surface, resulting in a reduction in the

27
heat-transfer capability. If not cleaned before the heating season, the
coil will become more difficult to clean.
During extreme cold weather when the auxiliary heater strips are
employed, the dirty filter could reduce the airflow enough so that in-
. sufficient heat is removed and the temperature rises in the vicinity of
the heater strips. A safety cutout switch will cause the heater strips
to operate intermittently. There would be little increase in the energy
cost, and there may be a decrease because not enough heat is being sup-
plied for comfort.
4.3 Furnace
As the air filter becomes clogged, the airflow over the furnace heat
exchanger will be reduced, causing the flue gases to be exhausted at a
higher temperature. Some of the excess energy content in the exhaust
that could have been used to heat the interior is carried away. The
composition of the combustion products is not expected to change signifi-
cantly. As a result, almost all of the effect is centered on the higher
flue-gas temperature.
In Ref. 2 the percentage of the energy wasted because of the reduced
air velocity across the furnace heat exchanger was calculated. The re-
sults are tabulated in Table 3. The calculation considered the change in
Table 3. Percent of energy wasted because of reduced air velocity
across furnace heat exchanger
.
.
Energy wasted (%I
100 0 90 2.8 80 6.1 70 10.2 60 14.8 50 27.2
+o = initial velocity.

28
the heat exchanger's effectiveness as a result of the temperature in-
crease and the change in the heat-transfer coefficient for forced con-
vection over parallel plates. The calculated results are used.
4.4 Air Handler
4.4.1 Blower assembly and motors
Another component affected by a dirty filter is the fan-coil motor.
Referring to Figs. 5(U) and (b) for the forward-curved and the radial
impeller fans, there is a decrease in the power required as the filter
becomes loaded. However, the reduced energy consumption is offset by
the longer run times as a result of the reduced capacity. As shown in
Fig. 5(c), the backward-curved impeller fan power rises and peaks near a
fully clogged filter.
Instead of cycling, the motor could run continuously, thus consuming
more energy and adding its heat to the cooling load. If operated long
enough, the motor could burn out and require replacing. In many older
air conditioners the blower and fan motors should be lubricated annually.
Most motor failures are caused by lack of lubrication. Some newer air
conditioners have permanently lubricated motors.
4.4.2 Dampers
Instead of a dirty filter's affecting dampers, the situation is re-
versed. A malfunctioning damper adversely shortens the life of f,ilters
and significantly increases the direct energy cost. Excess outside air
that leaks by the damper blades passes through the filter and must be
heated or cooled. Leaking or malfunctioning dampers have been estimated
to waste as much as 30% of a plant's energy cost.ll
3

29
i
5. ENERGY SAVINGS VS FILTER-REPLACEMENT SCHEDULING OPTIONS
5.1 General
The main qukstion to be answered by this study is 'men is it most
economical to replace the filter while conserving energy on a HVAC sys-
tem?" As long as the filter is serving its intended purpose and has not
exceeded its useful life, it can be-left in place. Obviously, the filter
must be replaced when fully clogged. However, there may be some
advantages in replacing the filter before clogging. To develop a filter-
replacement schedule, the analysis will consider periods less than the
filter's lifetime.
Lifetimes for filters can vary greatly. For example, assume a time
period during a seasonal change, such as spring, when little heating or
cooling is required. If a large source of pollen is close, the filter
may become ciogged in a relatively short time.
Further, the heating and cooling requirements differ greatly among
the many regions of the country. A common practice is running the blower
fan by itself to eliminate hot and cold areas caused by air stratifica-
tion between building levels and to circulate the air for a more uniform
temperature distribution. The number of fan hours and the degree of
dust in the air - not the amount of energy consumed -will determine how
much and how fast the filter will clog. If the amount of airborne dust
in two different regions is the same and one of the regions has a much
milder climate than the other, the two HVAC systems would still require
a filter change at about the same time. Only when a fan is operated in
conjunction with the HVAC system's demand would the number of operating
hours correlate with the amount of dirt collected on the filter.
For the analytical technique presented, the filter is assumed to be
completely clogged after some arbitrary time period. In practice, this
time period will need to be determined at the individual site for the
various building types, types of occupants, activities, etc. Records or
experiences can furnish this necessary information. Normally, this time
period is not expected to exceed 3 months.

30
Although a certain amount of the energy required for heating or
cooling can be shown to be conserved by scheduling the filter replace-
ment cycle, another, more-important economic consideration should also
be included. A filter replacement schedule should be considered both as
an energy conservation measure and as part of the preventive maintenance
for the system. A filter that bedomes dirty should be replaced, espe-
cially before some vital component, such as a motor or compressor, is
damaged.
In a life-cycle analysis the cost of replacing the filters is part
of the recurring cost of the HVAC system. Nonrecurring cost includes
replacement of the fan motor or compressor, either one being much more
expensive than the relatively low cost of individual common filters. If
the HVAC system is properly maintained, the coils should rarely require
the tedious and labor-intensive chore of cleaning. It is easier to keep
the coils clean than to have to clean the coils. This analysis will
strive to keep these nonrecurring costs low by stressing certain good
practices that will show up as constraints in the analysis.
5.2 Assumptions and Constraints
Various options are available for analyzing the different schemes
in scheduling the filter replacement. These options will be bound by
the assumptions that
1. the filter accumulates dirt uniformly over its lifetime and
2. the fan is operated only in conjunction with heating or cooling
and the constraints that
1. the life of the filter ends when the filter.is fully clogged and is
replaced to prevent damage to the HVAC system and
2. the filter can be replaced anytime before the end-of-life but the
period between replacement is at least 1 month. (Realistfcally, an
unusual circumstance, such as remodeling, may shorten this period
and require an immediate filter replacement.)
31
5.3 Analytical Technique
The most-accurate and preferred method for this analysis involves
the use of periodic energy consumption data for individual buildings or
building types. However, on most military installations this kind of
information is rarely available. An entire post is usually metered by
one meter or by several meters if sections of the post are widely sepa-
rated. Another method that could be used to generate the energy con-
sumption data would involve the rated capacities of the various systems
and estimated operating times. An energy audit for the different types
of buildings could be used, but this effort would be tedious.
For the examples shown, the results from a study of the energy-use
patterns for certain types of buildings on a military installation will
be incorporated.l* Hourly energy consumption data were analyzed by the
U.S. Army Construction Engineering Research Laboratory (CERL) for 70
buildings at Fort Carson, Colorado; Fort Hood, Texas; and Fort Belvoir,
Virginia. A regression technique was used on the combined data for
classes of buildings. Although the results are not likely to agree for
any one particular building, the results are expected to produce fair
agreement for a class of building. The slopes from the regression and
appropriate heating-degree days (HDD) or cooling-degree days (CDD)
values are used to estimate the energy requirements for heating or
cooling. An inherent shortcoming is that the many HVAC systems' effi-
ciencies have been included and averaged into the final results and
cannot be removed. Also, the survey determined the cooling slopes for
only a couple of building types.
For cooling, the incremental increased energy consumption caused by
reduced capacity is estimated from the QDTRTy/QCLEm relationship, along
with the appropriate airflow rates. For the range of interest, the
power required is unchanged. For heating, the values from Table 3 are
used. Because a constant flow reduction rate caused by dirt collecting
on the filter is assumed, interpolation is done to calculate the inter-
mediate values.
Two examples will be shown for some buildings sited at Fort Bragg.
The first example will be for a family housing to demonstrate the effect

32
on cost for single filter of a WAC system with no labor charges. The
assumption is that the occupant will change the filter. The second
example will be for a modern barrack that has many filters and a labor
charge. Because Fort Bragg purchases bulk filter materials from which
the individual replacement filters are cut, no ready cost was available.
Therefore, the filter cost and labor charge (recurring nonenergy costs)
are taken from Mean's.13 The filters cost $1.81 each, and the labor
rate, including overhead and profit, for an average skilled worker is
$227.60/d. Because Mean"s costs are based on new construction, for
failed components, best guesses were made from a cursory survey of
several service shops to determine reasonable repair (nonrecurring)
costs.
The tabulated degree-days values (Table 4) for the nearest metro-
politan area, Raleigh/Durham, North Carolina, were used.14 For the
transition months this set of calculations assumed no cooling require-
ments for March and October and no heating requirements for May and
September. For electrical consumption the energy cost was calculated by
using fuel-cost information supplied by Fort Bragg and the 11,600-Btu/kWh
conversion required by the "Energy Conservation Investment Program
Table 4. Heating and cooling degree days for Raleigh/
Durham, North Carolina
Month HDD, CDD, base 65OF base 65'F
Feb Mar Apr May Jun Jul Aug Sep Ott Nov Dee
760 0 637 0 500 11 180 14 47 122 0 281 0 387 0 356
11 180 185 36 450 0 738 0
.
c
33
(ECIP) Guidance."15-18 The electricity cost of $O.O2781/kWh converts to
$8.18/million Btu (MBtu). For natural gas the fuel cost is $5.153/MBtu.
5.3.1 Single military housing
From the CERL survey the single family housings' average living
space is 1900 ft*. The HVAC system is assumed to be a gas furnace that
incorporates an air conditioner in the same unit. The slopes of the
fitted data from CERL's regression analysis are 0.00172 kWh/(ft**CDD)
for cooling and 16.5 Btu/(ft**HDD> for heating.
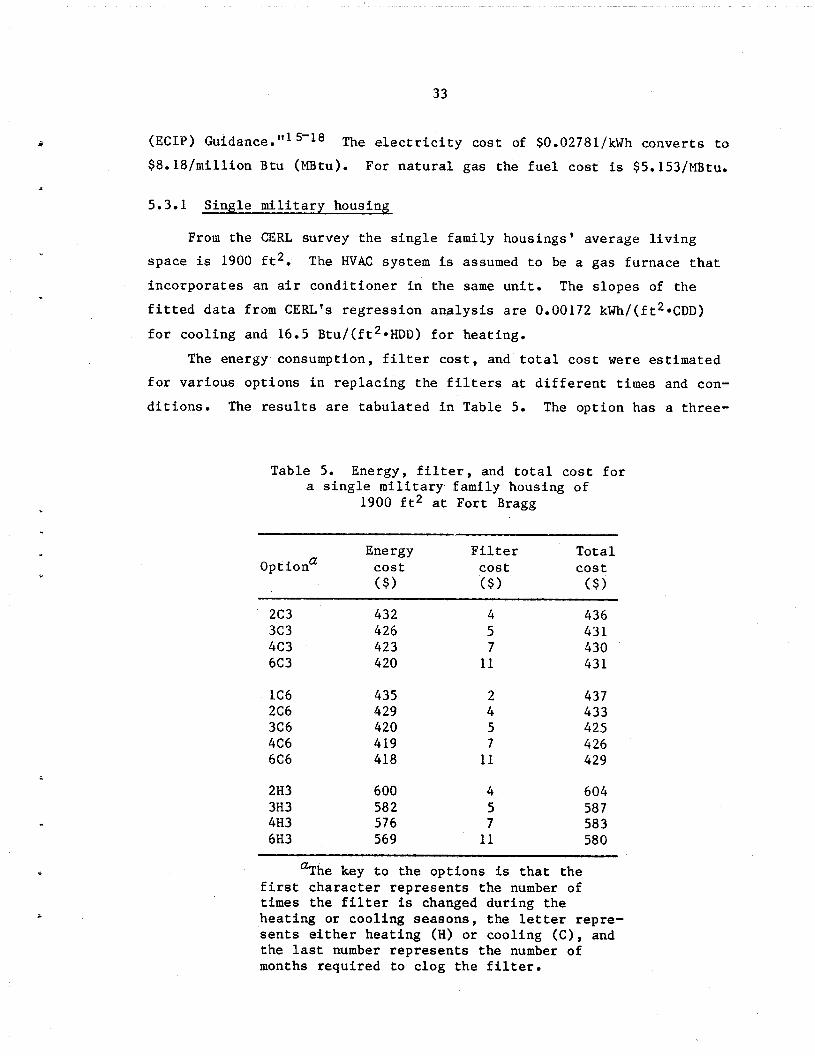
The energy consumption, filter cost, and total cost were estimated
for various options in replacing the filters at different times and con-
ditions. The results are tabulated in Table 5. The option has a three-
Table 5. Energy, filter, and total cost for a single military family housing of
1900 ft* at Fort Bragg
Option"
2C3 3c3 4c3 6C3
Energy Filter Total cost cost cost ($1 ($1 ($)
432 4 436 426 5 431 423 7 430 420 11 431
lC6 435 2 437 2C6 429 4 433 3C6 420 5 425 4C6 419 7 426 6C6 418 11 429
2H3 600 4 604 3H3 582 5 587 4H3 576 7 583 6H3 569 11 580
"The key to the options is that the first character represents the number of times the filter is changed during the heating or cooling seasons, the letter repre- sents either heating (H) or cooling (C), and the last number represents the number of months required to clog the filter.
34
character designation of a number, a letter, and another number. The
options are grouped by the last two designations and in an increasing
order by the first number. The key to the options is that the first
character represents the number of times the filter is changed during
the heating or cooling seasons, the letter represents either heating (H)
or cooling (C), and the last number represents the number of months
required to clog the filter, For example, if 3 months are required
before the filter is clogged, option 2C3 states that the filter is
changed twice during a 6-month cooling season. Because the arbitrary
period is 3 months and March was stated as a month that does not require
cooling, the filter is changed at the beginning of July. A clean filter
is assumed at the start of any arbitrary period. All of the filter
changes are spaced equally except for those options that have four fil-
ter changes. This option is an attempt to reduce the filter cost by not
changing the filter for the mild months. For example, option 4C3 uses
the same filter for April and May; the filter is changed at the begin-
ning of the summer months of June, July, and August; the filter is not
changed for September. This option also allows a buffer time that can
be used to apply preventive maintenance, such as oiling the fan motors,
which should be lubricated once a year.
By chance, if the filter does not become completely clogged until
the end of a 6-month cooling season, the option with the last character
"6" is calculated. An arbitrary period of 6 months is not believed2
likely for heating because of occupants' tendency to stay indoors more,
the air dryness, and the electrostatic charge effects that tend to in-
crease the amount of dispersed dust. Therefore, only one period of
3 months was considered.
For heating, the airflow lower limit is assumed to be the same as
that used in the cooling estimates. The filter is completely clogged
whether it is used in the heating or cooling cycle. A lower airflow
rate is likely to cause the furnace bonnet to overheat, thus activating
a safety thermostat. At the beginning of the heating season, October, a
clean filter is installed. If a filter is to be replaced at the begin-
ning of April, its cost is added into the cooling option to avoid double
costing.
35
In general and as expected, the energy cost decreases with an in-
creasing number of filter changes. The filter cost naturally follows
the number of filter changes. However, none of the total costs are sig-
nificantly different.
For cooling with a 3-month filter lifetime, option 4C3 was somewhat
successful in minimizing the total cost but not enough to warrant recom-
. mending. Although options 3C3 and 6C3 are nearly equal in total cost,
option 6C3 is recommended because of the greater energy reduction.
During the cooling season, option 6C3 is simply monthly replacement of
the filter, a schedule that supports the manufacturer's usual recommen-
dation,
.
The 6-month filter lifetime option demonstrates the effect that if
the filter is not replaced often enough, the extra energy cost will be
more than the lower filter cost. If the filters are replaced too often,
the cost of the filters will be more than the energy cost reduction.
Option 3C6 would be recommended because the energy cost is near the
minimum and the filter cost is not excessive. . As seen in the heating options 2H3 through 6H3, the heating energy
costs are higher than the cooling costs. Although the British-thermal-
unit price is lower, a greater amount of energy is consumed. Results of
lower energy consumption will show more readily. As expected, there is
a steady decrease in the energy costs with each increase in the number
of filter replacements. Option 6H3 is recommended because of its lowest energy consumption and total cost. Again, monthly filter replacement is
recommended.
For an installed HVAC system these options can be put into practice
t for cost savings. For proposed systems this technique can be applied in
estimating the annual recurring cost in the life-cycle cost analysis (an
example is shown in Table 6). Using the example presented here, filters
are recommended for replacement every month at an annual cost of $22.
When discounted at the required 7% inflation rate over the estimated 15-
year lifetime of the equipment, the discounted cost is $198.
Documented studies of compressor failures performed by American
Electric Power Company and by Alabama Powarlg imply that compressors
will fail and must be replaced on an average of every 8 years. No data

36
Tab1.e 6. Life-cycle analysis summary Energy Conservation Investment Program (ECIP)
LOCATION: Bra Fort REGION NO.4 - PROJECT NUMBER Example 1
PROJECT TITLE More Efficient HVAC System FISCAL YEAR 86
DISCRETE PORTION NAME Filter RpDlacapnt program
ANALYSIS DATENov. 85 ECONOHIC LIFE 15 YEARS PREPARED BY 1~. Jung
1. INVESTMENT A:CONSTRUCTION COST B. SIOH C. DESIGN COST D. ENERGY CREDIT CALC (lA+lB+lC)X.g E. SALVAGE VALUE - F. TOTAL INVESTMENT (lD-1E)
:
: .S
S
2. ENERGY SAVINGS (+I / COST (-1 ANALYSIS DATE ANNUAL SAVINGS,.UNIT COST 6 DISCOUNTED SAVINGS
COST SAVINGS ANNUAL $ DISCOUNT DISCOUNTED FUEL $/HBTu(~) HBTU/YR(2) SAVINGS(3) FACTOR(4) SAVINGS(S)
S S A. ELEC $8.18 s S 1. DIST $ C. RESID $ D. NG s- !?. COAL $
i i
s S S
P. TOTAL S ------->$ ----
3. NON ENERGY SAVINGS(+) / COST(-) A. ANNUAL RECURRING (+/-I S -22
(I) DISCOUNT FACTOR (TABLE A) 9.11 (2) DISCOUNTED SAVING/COST (3A X 3A1) s -198
B. NON RECURRING SAVINGS(+) / COST(-) ITEM SAVIWS(+) YEAR OF DISCOUNT DISCOUNTED SAV-
COST (-l(r) OCCURRENCE(Z) FACTOR(3) INGS(+) COST(-l(4) a.
b -- C.
d .MTAL
C. TOTAL NON
s -1000 $ -568
ENERGY DISCOUNTED SAVINGS(+) / COST(-) (3A2+3Bd4) S -766
0. PROJECT NON ENERGY QUALIFICATION TEST (1) 25% HAX NON ENERGY CALC (2F5 X .33) S
a IF 3D1 IS - OR > 3C GO TO ITEM 4' b IF 3Dl IS < 3C CALC SIR - (2F5+3Dl)+lF= c IF 3Dlb IS - > 1 GO 'l0 ITEM 4 d IF 3Dlb IS < 1 PROJECT DOES NOT QUALIFY
4. AVERAGE ANNUAL DOLLAR SAVINGS 2F3+3A+(3Bld+ YEARS ECONOMIC LIFE) $
5. TOTAL NET DISCOUNTED SAVINGS (2F5i3c) S
6. DiSCOUNTED SAVINGS RATIO (IF < 1 PROJECT DOES NOT QUALIFY) (SIR)=(5+-IF)” .-

37
were available for fan motors, and a conservative 10 years is used. For
a 2 l/2-ton compressor the total replacement cost is $800. Fan motor
costs vary widely; the total replacement cost is estimated at $200.
Discussions with representatives at Fort Bragg show that one of the
benefits already experienced in their aggressive filter replacement pro-
gram is a reduction in the number of fan-coil motor replacements.
Clogged filters do shorten the life of motors by increasing the load and
operating times. Temperature is probably the main culprit. If the
failure occurs during the unit's early life, the replacement cost for
one motor nearly equals the discounted cost for all of the filters
throughout the unit's life. As discussed previously, filter abuse can
cause a compressor failure for units with capilliary tubes. Regular
filter replacement can contribute to a longer life.for compressors and
motors and can be very cost-effective if early failure is prevented.
5.3.2 Modern barrack
A large, modern barrack of 39,500 ft2 will be used as an example.
The HVAC system is mounted on the roof. Inside the air handler are
eight filters that filter the make-up air and the return air. Condi-
tioned air is ducted to each room and returned through a plenum. Each
room has an air return with a filter across the opening. No survey was
made of the total room filters; 150 will be assumed. One man-day is
assumed to be needed to replace all of the room filters. The slopes of
the fitted data from CERL's regression analysis, are 0.00149 kWh/(ft2*CDD)
for cooling and 7.4 Btu/(ft**HDD) for heating. For this analysis, natural
gas is assumed for heating.
To estimate the energy cost savings, it is neither practical nor
necessary to consider the incremental condition of each filter at various
life spans. However, the maximum energy cost savings can be estimated
from the cost difference of the energy cost if all of the filters stay
clean and the energy cost if all of the filters are clogged. For
cooling, the maximum cost is $8139, the minimum cost is $7493, and the
maximum energy cost savings is $646. For heating, the maximum cost is
$6107, the minimum cost is $5203, and the maximum energy cost savings is
$904.

38
Because all of the conditioned air must pass through the eight fil-
ters inside the air handler, these -filters are of primary concern.
Assuming 1 h of labor is required, each change of these filters is $43.
A complete filter change, including the room filters, is $514 with about
one-half being the labor cost. Because the maximum energy cost savings
for cooling is $646 and for heating is $903, a few complete filter
changes will exceed these savings. The air-handler filters filter out-
door air before distribution throughout the building and prevent the
room filters from becoming clogged too rapidly. These filters can be
changed each month if necessary and not use up the savings. Experience
from observation will be necessary to determine when to change the indli-
vidual room filters. Those filters on the upper levels may not need to
be changed as often as those on the lower levels. However, as stated
previously, filters should be replaced when they become clogged. If the
room filters are clogged too soon, a longer-life pleated filter is an
alternative to consider.
39
6. OTHER OBSERVATIONS, CONCLUSIONS, AND RECOMMENDATIONS 3
i Concurrent with the literature search, additional information was
sought by following a filter-changing crew and observing the condition
of filters and evaporator coils in a large building at one of the Oak
Ridge plants. The filters had about 2-months' usage, and the air con-
ditioners were mainly window units and some larger floor units. All of
the units have had many years of service. None of the filters was very
dirty but, more surprisingly, most of the evaporator coils were shiny
clean. Only three coils were dirty, and they are located in rooms that
are rarely occupied and are kept locked. Later, two more units with
dirty coils were found in occupied offices that keep the doors shut most
of the time. All of the other units were in offices or work areas with
doors opened to hallways. Although the sample size is small and the
observed effects are unexpected, some speculations about cause are made. I
The reason for the clean evaporator coils appears to be the wash-
down effect from the condensate. During the summer the many large
entrances of the building are kept open, and the air infiltration rate is
high in the experimental areas. The office areas are separated by closed
doors that are opened many times during the day because of people
traffic. This traffic is the main reason for the high air infiltration
into the office areas. Because the outside air has a high humidity, the
condensate appears to be sufficient in keeping the coils clean. The fil-
ters by themselves cannot account for the cleanliness. Because of the
particle sizes, most of the dust cannot be stopped by the type of filters
used.
The search for an explanation for the dirty coils has shown what
seems a common denominator. Rarely are the doors to those rooms opened.
i Thus, moisture in the air is greatly reduced. These evaporator co+ do
not have the wash-down effect of the other units, and dirt co&lectg. A
c dirty condenser coil was also found on one of the yindow units, and i& &LA ,L I. ~ dirt has continued to bu$$d.

40
is not sufficient to ensure that a coil will not get dirty. There
appears to be a correlation between a coil's beginning to get dirty and
the fact that a filter has been used too long. As the filter becomes
clogged, the airstream will bypass around the edges of the filter. This
fact is evidenced by observing that when a dirty evaporator is found,
the edges are usually the first place where dirt begins to accumulate.
Also, as the filter becomes clogged, the airflow velocity on the face of
the evaporator is greatly reduced. There is some bleed-through of the
dirt, and the airstream does not have sufficient velocity to blow the
dirt off of the evaporator's surface. When wet by the condensate, the
accumuiation mats and continues to build. If this mechanism is correct,
it is important to replace the filter before the evaporator coils become
coated with dirt.
These observations have generated two questions: (1) how valid is
the concept that high-quality air filters are needed? and (2) what mini-
mum quality of air filter (and what conditions) is necessary to keep the
evaporator surface clean? If a lower-quality, inexpensive filter is
suitable, additional savings can be realized by reduced blower-fan
requirements and by the use of less-expensive filters. A loose,ly woven
fiberglass filter with a resin coating could be used to keep large par-
ticle-size pollutants from reaching the evaporator coil. Because the
single-family filter analysis recommended replacing the filter monthly,
an inexpensive filter should be sufficient because it is to be replaced
before any accumulated dust bleeds through the filter.
A general purpose, low-quaiity air filter may be employed in
1. areas that do not require any high-quality filtered air,
2. areas tSat experience high humidity,
3. units that do not run the blower fan when the compressor is not
operating (if the humidity level and the heat load are sufficient to
maintain a high percentage of operating tftae, the blower may be left
running),
4. units that have the evaporator coil mutated vertically so that the
eondensate drips over the layers of tubes, and
5. areas that have high infiltration rates.
41
i There may be more conditions and limitations that could be determined
-3
from experience or testing.
Conditions under which high-quality filters should be left in place
are
1. work areas that have a large amount of dust;
2. areas requiring a relatively dust-free condition, such as computer
rooms, medical facilities, food service areas, and bowling alleys;
and
3. areas near coal- or oil-fired power plants.
It must be emphasized that there is not enough evidence to support
these speculations. However, it may be worthwhile to conduct a limited
test by monitoring filters and air conditioners to determine if these
speculations have merit. A large majority of the filters used might be
replaced by these inexpensive filters. If there should be additional
follow-up work, the areas suggested for investigating are
1. locating units with dirty evaporator coils and determining the cause
and
2. testing the concept of using an inexpensive filter to screen out
large particle-size pollutants while maintaining a clean evaporator
coil.

42
REFERENCES
1. J. J. Krajewiski, U.S. Army Facilities Engineering Support Agency, Fort Belvoir, Va., letter to M. A. Broders, Oak Ridge Natl. Lab., April 22, 1985; Subject: "U.S. Army Conservation Equipment Testing Program'" (with attached Task Order No, 0003).
2. E. Swider, K. Mniszewski, and T, Waterman, Development of a Home Energy Alert (HEAL) System. Final Report, PB84-128390,' National Technical Information Service, Springfield, Va., July 1982.
3. ASHRAE STANDARD 52-76, Method of Testing Air-cleaning Devices Used in General Ventik-hion for Removing Particuhte Matter, The Ameri- can Society of Heating, Refrigerating and Air-Conditioning Engineers, Inc., New York, 1976.
4. 1982 ASHRAE Product Specification File, American Society of Heat- ing, Refrigerating and Air-Conditioning Engineers, Inc., Atlanta, 1982.
5. H. A. McLain et al., Benefits of Replacing Residential Central Air Conditioning Systems, ORNL/CON-113, Martin Marietta Energy Systems, Inc., Oak Ridge Natl. Lab,, April 1985.
6. J. A. Allen, J. H. Walker, and J, W. James, Heating and Air Condi- tioning, 6th ed., McGraw-Hill Book Company, New York, 1946.
7. J. L. Threlkeld, Ther?maZ Environmental Engineering, 2d ed., Prentice-Hall, Englewood Cliffs, N-J*, 1970.
8. D. Beaver, Trane Corporation, Tyler, Tex., personal communication with L, Jung, Martin Marietta Energy Systems, Inc,, Oak Ridge Natl. Lab., June 1985.
9. K. LeBrun, "Equipment Maintenance for Energy Conservation," ppe 276-86 in Handbook of Energy Conservation for Mechanical Systems in Buildings, ed. R. W, Roose, Van Nostrand Reinhold, New York, 1978.
10. B. Korte, ed., "Retrofitting and Replacing Energy Intensive Rooftops," Heat./Piping/Air Cond. 48(10), 31-37 (October 1976).
11. R. J. Gerhold, "HVAC System Dampers a-O Analyzing and Correcting Operational Deficiencies to Conserve Energy," Plant Eng. 33(b), 141=-44 (Feb. 22, 1979).
12. B. J. Sliwinski and E, Elischer, Analysis of Facilities' Energy Use Puttem, Technical Report E-186, Construction Engineering Research Laboratory, U.S. Army Corps of Engineers, Champaign, Ill., August 1983.
43
13. Means Mechanical Cost Data: 1984 7th Annual Edition, Robert Snow Means Company, Kingston, Maine, 1983.
14. C. L. Knapp, T. L. Stoffel, and S. D. Whitaker, Insulation Data Manual: Long-Term Monthly Averages of Solar Radiation, Tempera- ture, Degree Days and GZobaZ i$ for 248 National Weather Service Stations, SERI/SP-755-789, Solar Energy Information Data Bank, Solar Energy Research Institute, Golden, Cola., October 1980.
15. E. T. Walting, Department of the Army, Office of Chief Engineers, Washington, letter DAEN-ZCF-N to U.S. Army distribution, January 18, 1983; Subject: "Energy Conservation Investment Program (ECIP) Guidance."
16. R. W. Daniel, U.S. Army, Office of Assistant Secretary of Defense, Washington, letter to Department of Defense distribution, February 5, 1985; Subject: "Energy Conservation Investment Program (ECIP) Guidance" (updated).
17. Appendices A, i?, and C of the Methodology for Life Cycle Cost AnuZy- s&s Using Average Fuel Costs (updated), DOE/CE-101, U.S. DOE, Div. Buildings Energy R&D, September 1984.
18. "Life Cycle Costing Manual for the Federal Energy Management Program," NBS Handbook 135, U.S. Department of Commerce, National Bureau of Standards, December 1980.
19. L. A. Abbatiello, E. A. Nephew, and M. L. Ballou, Performance and Economics of the ACES and Alternative Residential Heating and Air Conditioning Systems in 115 U.S. Cities, ORNL/CON-52, Union Carbide Corp. Nuclear Div., Oak Ridge Natl. Lab., March 1981.

44
SELECTED BIBLIOGRAPHY
(in order of importance)
ASHRAE Handbook, 1983 Equipment Volume. 1983. American Society of Heating, Refrigerating and Air-Conditioning Engineers, Inc., Atlanta.
'ASHRAE Handbook, 1981 Fundamentals. 1981. American Society of Heating, Refrigerating -and Air-Conditioning Engineers, Inc., Atlanta.
ASHRAE Handbook, 1984 Systems. 1984. American Society of Heating, Refrigerating and Air-Conditi.oning Engineers, Inc., Atlanta.
Price, S. J. 1970. Air Conditioning for Building Engineers,and Manu- gem: Operation and Maintenance, Industrial Press, New York.
McQuiston, F. C., and Parker, J. D. 1977. A%r Conditioning:
Heating, Ventilating, oxd Analys&s and Design, John Wiley & Sons, New York.
Faber, O., and Kell, J. R. 1958. Buildings,
Heating and Air-Conditioning of rev., The Architectural Press, London.
Heating and Cooling for Man in Industry. 1975. American Industrial Hygiene Association, Akron, Ohio.
Cassidy, V. M. August 1981. "Air Handling Units," Specifying Eng. 6(2), 13337.
Harding, L. A., and Willard, A. C. 1937. Heating, Ventilating and Air Conditioning: A Reference Book for Engineers, Architects and Contractors, John Wiley & Sons, London.
Strock C., and Koral, R. L., eds. 1965. Handbook of Air Conditioning Heating and Ventilating, 2d ed., Industrial Press, New York.
Madison, R. D., ed. 1948,. Fan Engineering, 5th ed., Buffalo Forge co., Buffalo.

45
ORNL/TM-9894
Internal Distribution
1.' V. D. Baxter 2-6. M. A. Broders
7. R. S. Carlsmith 8. B. G. Eades 9. W. Fulkerson
10. J. A. Getsi 11. J. E. Hardy 12. H. W. Hoffman
13-27. L. Jung 28. R. J. Kedl 29. M. A. Kuliasha 30. J. M. MacDonald 31. F. C. Maienschein
32. W. R. Mixon 33-42. C. L. Nichols
43. T. K. Stovall 44. M. P. Ternes 45. J. J. Tomlinson 46. H. E. Trammel1 47. T. J. Wilbanks
48-49. Central Research Library 50. Document Reference Section 51. Laboratory Records - RC
52-53. Laboratory Records 54. ORNL Patent Office
External Distribution
55.
56.
57-59.
60-62.
63-65.
66-68.
69.
70.
71.
72.
73.
74.
J. C. Bouldin, Engineering Division, Energy Branch/EN, U.S. Army Facilities Engineering Support Agency, Fort Belvoir, VA 22060-5516 J. G. Carbonell, Associate Professor of Computer Science, Carnegie-Mellon University, Pittsburgh, PA 15213 Commander, Fort Bragg, ATTN: AFZA-EH, Energy Coordinator, Fort Bragg, NC 28307 Commander, Fort Lesley J. McNair, ATTN: NACSA-E, Energy Coordinator, Bldg. 48-A, Washington, DC 29319 Commander, Fort Myers, ATTN: NACMY, Energy Coordinator, Ft. Myers, VA 22211 Commander, U.S. Army Military District of Washington, ATTN: Ms. Johnson, Facility Engineer, Washington, DC 29319-2793 H. C. Gignilliat, Engineering Division, Mechanical Branch/EM, U.S. Army Facilities Engineering Support Agency, Fort Belvoir, VA 22060-5516 D. Goldenberg, EnerServ, Inc., P.O. Box 3393, Oak Ridge, TN 37831 F. R. Kalhammer, Vice President, Electric Power Research Insti- tute, P.O. Box 10412, Palo Alto, CA 94303 R. H. Karney, Engineering Division, Mechanical Branch/EM, U.S. Army Facilities Engineering Support Agency, Fort Belvoir, VA 22060-5516 R. E. Kasperson, Professor, Government and Geography, Graduate School of Geography, Clark University, Worcester, MA 01610 C. A. Kotas, Engineering Division, Energy Branch/EN, U.S. Army Facilities Engineering Support Agency, Fort Belvoir, VA 22060- 5516
46
75. J. J. Krajewski, Chief, Engineering Division, U.S. Army Facili- ties Engineering Support Agency, Fort Belvoir, VA 22060-5516
76. Shelley Launey, Department of Energy, CE-222, 1000 Independence Avenue, SW, Washington, DC 20585
77. R. L. Perrine, Professor, Engineering and Applied Sciences, Civil Engineering Department, Engineering I, Room 2066, Univer- sity of California, Los Angeles, CA 90024
78. B. S. Wasserman, DAEN-ZCF-U, Office of the Chief of Engineers, 20 Massachusetts Avenue, Washington, DC 20314-1000
79. Office of the Assistant Manager for Energy Research and Development, U.S. Department of Energy, Oak Ridge Operations, Oak Ridge, TN 37830
80-109. Technical Information Center, U.S. Department of Energy, P.0. Box 62, Oak Ridge, TN 37830
*U.S. GOVERNMENT PRINTING OFFICE: 198%748-168/60073