Impact of Agricultural Stream Restoration on Riparian Hydrology and Biogeochemistry
16
Impact of agricultural stream restoration on hydrology and biogeochemistry Sara McMillan, Gavin Downs, Maria Laura Ortiz de Zarate Purdue University Philippe Vidon, Molly Welsh SUNY-ESF
-
Upload
national-institute-of-food-and-agriculture -
Category
Environment
-
view
89 -
download
1
Transcript of Impact of Agricultural Stream Restoration on Riparian Hydrology and Biogeochemistry
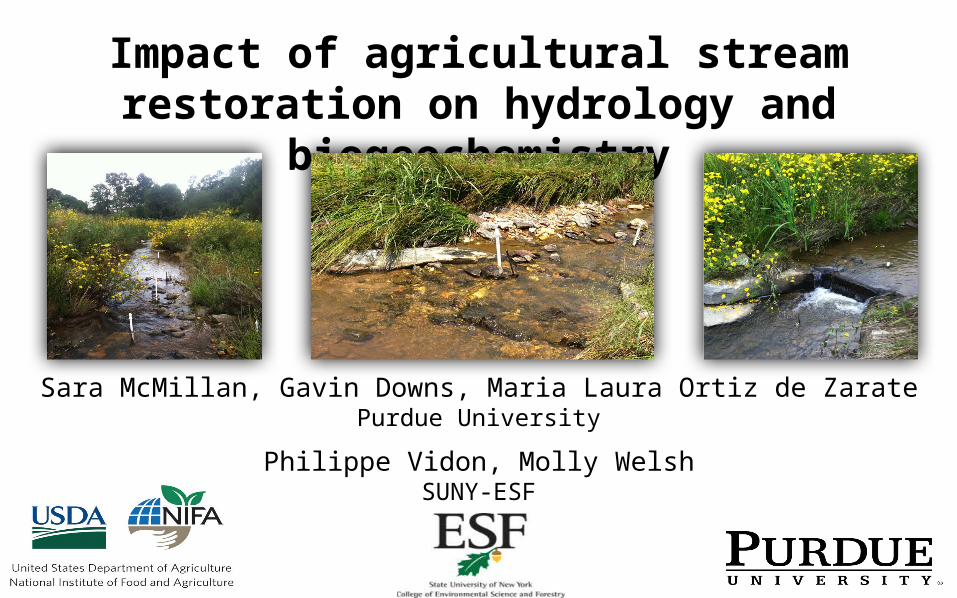
Impact of agricultural stream restoration on hydrology and
biogeochemistry
Sara McMillan, Gavin Downs, Maria Laura Ortiz de ZaratePurdue University
Philippe Vidon, Molly WelshSUNY-ESF

Pristine Impaire
d
Restored?
Rationale & project goals Restoration goals AND practices focus on stream channel stability and reduced sediment transport Channel construction, engineered structures designed to achieve stability, grade control and bank stabilization.
- How do physical changes influence near-stream hydrology?- What is the effect of restoration on water quality (NO3, NH4, PO4) and GHG emissions (CH4, N2O, CO2) in streams
& riparian zones?- Drivers of N, P and C cycling in the stream-riparian system?

Stream-Floodplain-Riparian SystemRiparian buffer function: Transform and remove nutrients from adjacent uplandsFloodplain function: Overbank flow + enhanced hyporheic exchange attenuates peak flow and
retains/transforms nutrients & sedimentStream function: Hyporheic flow & retention in deep pools retains and transforms nutrients
OC input (leaves)
Nutrient transport
Nutrient, sediment input during floods
NO3- transport
Nitrification,root uptake
DOC transport
Debris dam
Cross vane
OM accumLateral hyporheic
flow
Denitrification
OM accumFlow

Grassy Creek-Horne Creek Watershed
Unrestored – Forested BufferDrainage area = 5 km2
Middle Fisher River Watershed
1 2
3
Agriculture
HerbaceousForested
Open Space
RestoredDrainage area = 1.5 km2
Unrestored – Mixed BufferDrainage area = 4.5 km2
Study Sites
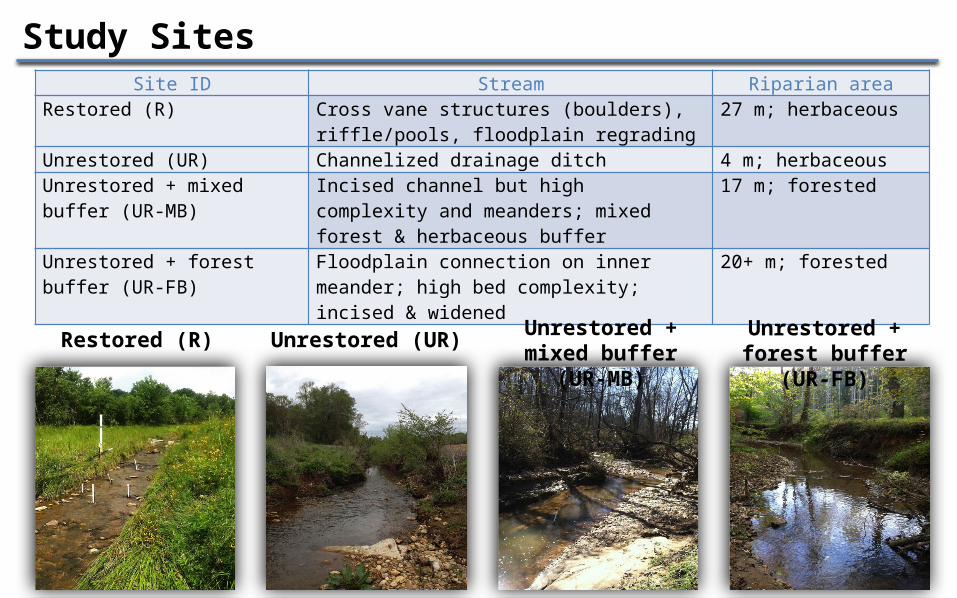
Study SitesSite ID Stream Riparian area
Restored (R) Cross vane structures (boulders), riffle/pools, floodplain regrading
27 m; herbaceous
Unrestored (UR) Channelized drainage ditch 4 m; herbaceousUnrestored + mixed buffer (UR-MB)
Incised channel but high complexity and meanders; mixed forest & herbaceous buffer
17 m; forested
Unrestored + forest buffer (UR-FB)
Floodplain connection on inner meander; high bed complexity; incised & widened
20+ m; forested
Restored (R) Unrestored (UR) Unrestored + mixed buffer (UR-
MB)
Unrestored + forest buffer
(UR-FB)

Approach & Methods1) Riparian & Floodplain
a. Seasonal & event-based hydrology, water quality and GHG fluxes
2) Stream & Hyporheic Zone:a. Seasonal hydrology, water qualityb. Potential denitrification ratesc. Reach scale nutrient retention
3) Stream-Floodplain-Riparian connectivity a. High temporal resolution: water table, stream
height & soil moisture

RiffleA2
B1C
D1
E
F
G2H2
I1
1
2
3
4
5
7
8
6
A1Riffle
B2D2
G1H1
I2
Piez. Color Code Red = Well (W) Orange = Deep (D) Yellow = Mid (M) Green = Shallow (S)
2” well
RunRiffleRunRun4
J2/5
J1/6K/7Pool8
Run
910
Example of monitoring framework – Restored site
LegendIn-stream piezometer
Staff Gage
Rocks
Piezometer nest
Static chamber
Soil Moisture Sensors/ Silicone chambers

STREAM-FLOODPLAIN-RIPARIAN CONNECTIVITY
What is the influence of restoration on trade-offs between nutrient removal and greenhouse gas
emissions?

Greenhouse Gases: Riparian Function Highly variable; both
nitrification & denitrification contribute to total flux
U-Forest is net sink/zero Restored = lowest rate
likely because low soil OM + compacted riparian zones
Highest rates in summer/fall (warm temperatures)
U-Forested site is a sink Restored site = source. No
pattern with hillslope position or restoration feature.
Spr 1
3 SuFa
ll 13Win
13Sp
r 14 Su
Fall 1
4Win
14Sp
r 15 Su
-1.5-1
-0.50
0.51
1.52
R U U-FB
N2O
mg
N/m
2/d
Spr 1
3 SuFa
ll 13 Wi
Spr 1
4 SuFa
ll 14 Wi
Spr 1
5 Su-20-10
010203040
CH4
mg
C/m
2/d
NSNSNS
Sp Su Fal Wi Sp Su Fa
l Wi Sp Su-2-101234
CO2
g C/
m2/
d
ND
ND
ND
ND
ND
ND

Storm events – Restored site
-0.50
0.51
1.52
2.53
N2O
(m
g N
/m2/
day)
PRE 24h 72h
00.5
11.5
22.5
33.5
4
CO2
(g C
/m
2/da
y)
PRE 24h 72h-60-40-20
0204060
CH4
(mg
C/m
2/da
y)
PRE 24h 72h
N2O – Uplands source post event
CH4 – Near stream shifts from sink to source post event.
CO2 – No change

Hillslope position affects riparian-stream denitrification
Denitrification in riparian zones > stream sediments
Near-stream zones = higher rates in restored sites
Highest rates associated with higher soil moisture & organic carbon

R UR UR-MB
UR-FB
aPool Riffle Run Point
bar
DEA
(ng
N/g
DM/h
r)
sandy clay
loamy sand
fine sand
sand coarse sand
0
50
100
150
200
250
300
DEA
(ng
N/g
DM
/h)
DEA by texture (in-stream locations)
Geomorphology & sediment drive instream denitrification
Highest rates associated with fine textured sediments Pools high in unrestored sites Riffles high/variable in all sites
100
200
0

Sw (m) 324Vf (mm min-1) 0.95U (mg m-2 h-1) 14.5
Residuals
Riffles/shallow runs
Deep pools
- Sink
+ Source
Reach scale retention: Restored stream

Sw (m) 151Vf (mm min-1) 2.75U (mg m-2 h-1) 138
Reach scale retention: U-Forested Riparian
- Sink
+ Source
Residuals
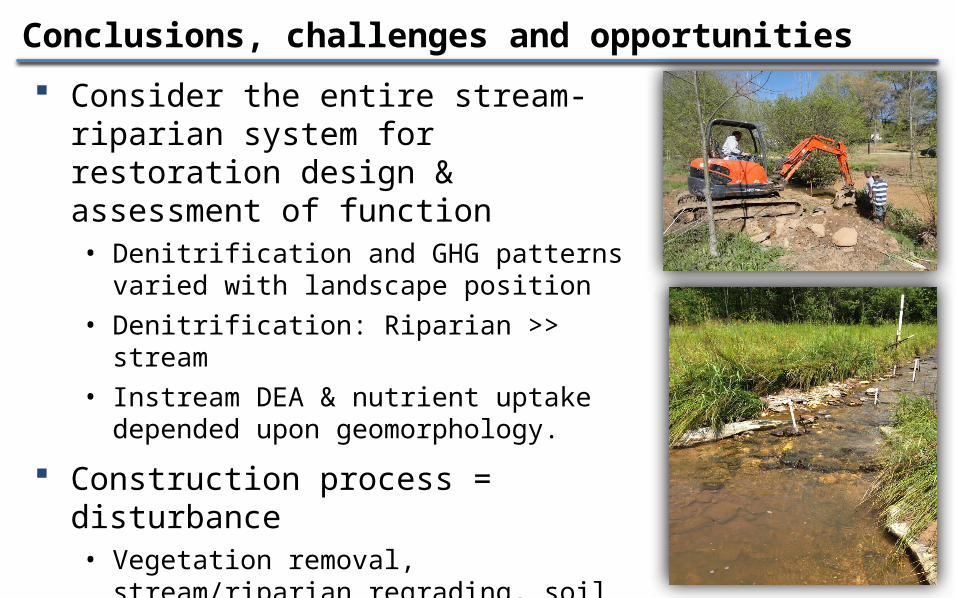
Conclusions, challenges and opportunities Consider the entire stream-riparian
system for restoration design & assessment of function• Denitrification and GHG patterns
varied with landscape position• Denitrification: Riparian >> stream• Instream DEA & nutrient uptake
depended upon geomorphology. Construction process =
disturbance• Vegetation removal, stream/riparian
regrading, soil compaction. • Reduced water quality function• Failures are common = maintenance

Thanks! Questions?