SOCIAL AND EMOTIONAL LEARNING Transforming Students' Lives with Social and Emotional
Upload
vuongquynhCategory
view
219download
1
Impact of the Positive Action program Page 1 of 29
Published in: Journal of Research on Educational Effectiveness, 3(1), 26-55, 2010.
Impact of a Social-Emotional and Character Development Program on School-Level Indicators
of Academic Achievement, Absenteeism, and Disciplinary Outcomes: A Matched-Pair, Cluster
Randomized, Controlled Trial Frank J. Snyder, M.P.H.1, Brian R. Flay, D.Phil.1, Samuel Vuchinich, Ph.D.2, Alan Acock, Ph.D.2, Isaac J. Washburn, M.S.2, Michael W. Beets, M.P.H., Ph.D.3, & Kin-Kit Li, M.S., Ph.D.4 1 College of Health and Human Sciences, Department of Public Health, Oregon State University 2 College of Health and Human Sciences, Department of Human Development and Family Studies, Oregon State University 3 Arnold School of Public Health, Department of Exercise Science, University of South Carolina 4 Department of Applied Social Studies, City University of Hong Kong Acknowledgments: This project was funded by the National Institute on Drug Abuse (R01-DA13474). Additionally, The National Institute on Drug Abuse (DA018760) provided financial support for the completion of the work on this manuscript. The authors would like to thankfully recognize the support and involvement of the Hawaii school district and the principals, administrators, teachers, staff, students and their families at the participating schools. We also thank Howard Humphreys and Jonathan Wang for help with data collection and management.
Notice of potential conflict of interest: The research described herein was done using the program and the training and technical support of Positive Action, Inc. Dr. Flay’s spouse holds a significant financial interest in Positive Action, Inc.
Impact of the Positive Action program Page 2 of 29
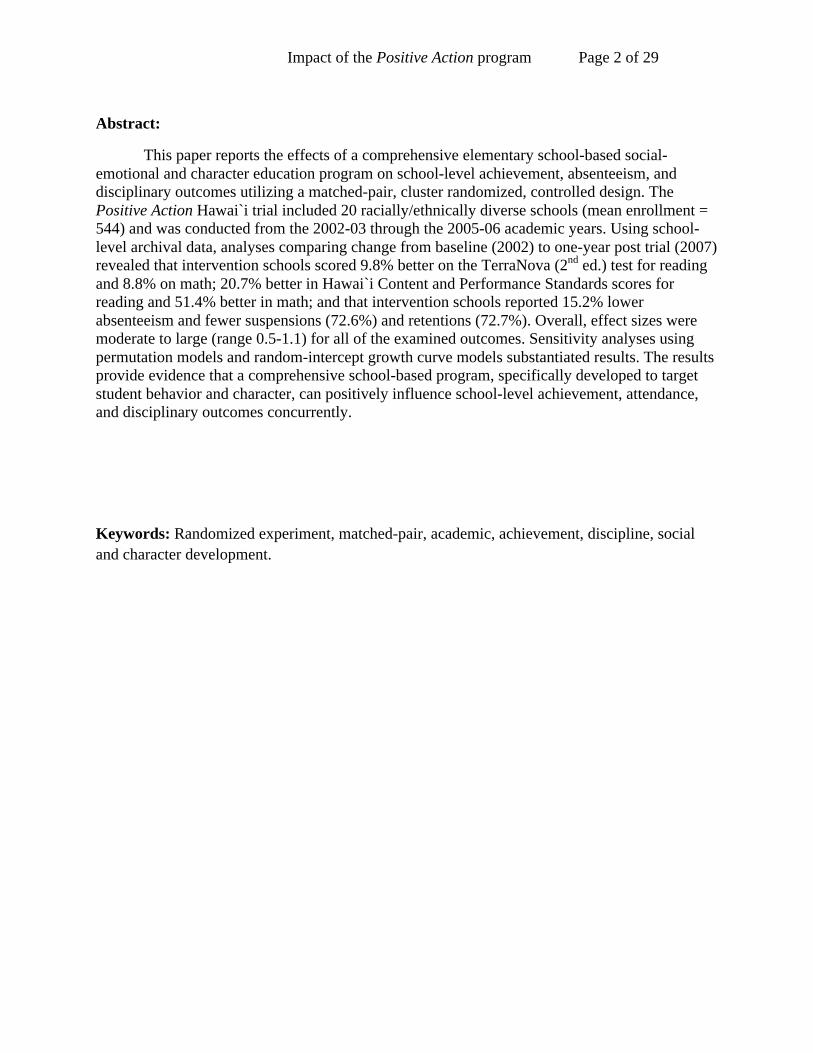
Abstract:
This paper reports the effects of a comprehensive elementary school-based social-emotional and character education program on school-level achievement, absenteeism, and disciplinary outcomes utilizing a matched-pair, cluster randomized, controlled design. The Positive Action Hawai`i trial included 20 racially/ethnically diverse schools (mean enrollment = 544) and was conducted from the 2002-03 through the 2005-06 academic years. Using school-level archival data, analyses comparing change from baseline (2002) to one-year post trial (2007) revealed that intervention schools scored 9.8% better on the TerraNova (2nd ed.) test for reading and 8.8% on math; 20.7% better in Hawai`i Content and Performance Standards scores for reading and 51.4% better in math; and that intervention schools reported 15.2% lower absenteeism and fewer suspensions (72.6%) and retentions (72.7%). Overall, effect sizes were moderate to large (range 0.5-1.1) for all of the examined outcomes. Sensitivity analyses using permutation models and random-intercept growth curve models substantiated results. The results provide evidence that a comprehensive school-based program, specifically developed to target student behavior and character, can positively influence school-level achievement, attendance, and disciplinary outcomes concurrently.
Keywords: Randomized experiment, matched-pair, academic, achievement, discipline, social and character development.

Impact of the Positive Action program Page 3 of 29
INTRODUCTION
Education has an urgent need to learn more about the role of behavior, social skills, and character in improving academic achievement (Eccles, 2004; Meece, Anderman, & Anderman, 2006). Since the No Child Left Behind Act passed, education has been focused on teaching to core content standards to improve academic achievement scores, particularly in reading and mathematics, for which schools are being held accountable (Hamilton et al., 2007). Teaching to, and support for, the behavioral, social, and character domains have been relegated to no or limited dedicated instructional time (Greenberg et al., 2003). Nevertheless, schools are expected to prevent violence, substance use, and other disruptive behaviors that are clearly linked to academic achievement (Fleming et al., 2005; Malecki & Elliott, 2002; Wentzel, 1993). The prevalence of discipline problems, for example, correlates positively with the prevalence of violent crimes within a school (Heaviside, Rowland, Williams, & Farris, 1999) which, in turn, affects attendance and academic achievement (Eaton, Brener, & Kann, 2008; Walberg, Yeh, & Mooney-Paton, 1974). Further, mental health concerns become more prevalent as students move into adolescence and can contribute to behavioral problems that detract from academic achievement (Costello, Mustillo, Erkanli, Keeler, & Angold, 2003). Disciplinary problems (Dinks, Cataldi, & Lin-Kelly, 2007; Eaton, Kann et al., 2008; Eisenbraun, 2007) and underachievement abound (Coalition for Evidence-Based Policy, 2002; Perie, Moran, & Lurkus, 2005; Snyder, Dillow, & Hoffman, 2008). To address these needs, numerous school-based programs have been developed to target problems of academic achievement (Slavin & Fashola, 1998; What Works Clearinghouse, n. d.). In addition, many other types of programs have offered the promise of improving academic performance indirectly through a focus on specific problem behaviors, such as substance use and violence (Battistich, Schaps, Watson, Solomon, & Lewis, 2000; Biglan et al., 2004; DuPaul & Stoner, 2004; Elias, Gara, Schuyler, Branden-Muller, & Sayette, 1991; Flay, 1985, 2009a, 2009b; Horowitz & Garber, 2006; Peters & McMahon, 1996; Sussman, Dent, Burton, Stacy, & Flay, 1995; Tolan & Guerra, 1994). Although some of these programs are promising, most are problem-specific and tend to address only the micro-level or proximal predictors (e.g., attitudes toward a behavior) of a single problem (e.g., violent behavior) (Catalano, Hawkins, Berglund, Pollard, & Arthur, 2002), not the multifaceted ultimate (e.g., safety of neighborhood) and distal (e.g., bonding to parents) factors that influence many other important outcomes (Flay, 2002; Flay, Snyder, & Petraitis, in press; Petraitis, Flay, & Miller, 1995; Romer, 2003) Consequently, programs have had limited success (Catalano et al., 2002; Flay, 2002).
As practitioners, policymakers, and researchers have implemented programs and sought to raise academic achievement and address negative behaviors among youth, an increasing amount of evidence indicates a relationship among multiple behaviors (Botvin, Griffin, & Nichols, 2006; Botvin, Schinke, & Orlandi, 1995; Catalano, Berglund, Ryan, Lonczak, & Hawkins, 2004; Flay, 2002). Several mechanisms involving multiple behaviors have been identified in improving student behavior and performance (Greenberg et al., 2003; Zins, Weissberg, Wang, & Walberg, 2004). This suggests that key behaviors do not exist in isolation from each other. Moreover, prevention research offers ample empirical support showing that many youth outcomes, negative and positive, are influenced by similar risk and protective factors (Catalano et al., 2004; Catalano et al., 2002; Flay, 2002). That is, most, if not all, behaviors are linked (Flay, 2002). For example, the early initiation of alcohol and cigarette use and/or abuse is associated with lower academic test scores (Fleming et al., 2005). Further, early initiation of

Impact of the Positive Action program Page 4 of 29
substance use and sexual activity can place youth at a greater risk of mental health disorders and aggressive behaviors (Gustavson et al., 2007; Hallfors, Waller, Bauer, Ford, & Halpern, 2005) and continuation of substance use through adolescence and into adulthood (Merline, O'Malley, Schulenber, Bachman, & Johnston, 2004). Subsequently, there has been a movement toward more integrative and comprehensive programs that address multiple co-occurring behaviors and that involve families and communities. Such programs generally appear to be more effective (Battistich et al., 2000; Catalano et al., 2004; Derzon, Wilson, & Cunningham, 1999; Elias et al., 1991; Flay, 2000; Flay, Graumlich, Segawa, Burns, & Holliday, 2004; Hawkins, Catalano, Kosterman, Abbott, & Hill, 1999; Hawkins, Catalano, & Miller, 1992; Kellam & Anthony, 1998; Lerner, 1995). One of these programs currently being used nationally is the Positive Action (PA) program. PA is a comprehensive school-wide social-emotional and character development (SACD) program (Flay & Allred, 2003; Flay, Allred, & Ordway, 2001) developed to specifically target the positive development of student behavior and character.
Based on quasi-experimental studies, PA has been recognized in the character-education report by the U.S. Department of Education’s What Works Clearinghouse as the only “character education” program in the nation to meet the evidentiary requirements for improving both academics and behavior (What Works Clearinghouse, June, 2007). Preliminary findings indicate that PA can positively influence school attendance, behavior and achievement. Two previous quasi-experimental studies utilizing archival school-level data (Flay & Allred, 2003; Flay et al., 2001) reported beneficial effects on student achievement (e.g., math, reading, and science) and serious problem behaviors (e.g., suspensions and violence rates).
The first study (Flay et al., 2001) used School Report Card (SRC) data from two school districts that had used PA within a number of elementary schools for several years in the 1990’s. Schools were rank ordered on poverty and mobility and each PA school was matched with the best matched non-PA school(s) having similar ethnic distribution. Results indicated that PA schools scored significantly better than the non-PA schools in their percentile ranking of 4th grade achievement scores and reported significantly fewer incidences of violence and lower rates of absenteeism. The second study (Flay & Allred, 2003) used a similar methodological approach but expanded the variables on which PA and non-PA schools were matched to include dependent variables (e.g., reading and math achievement) assessed before the introduction of PA. Results confirmed previous findings and also demonstrated that involvement in PA during elementary school improved academic and disciplinary outcomes at both the elementary and secondary levels.
In sum, the prior quasi-experimental studies provide preliminary evidence regarding the effects of PA on academic achievement and disciplinary outcomes. However, these findings are in need of confirmation utilizing a randomized design (Flay, 1986; Flay et al., 2005), a standard considered vital before an intervention is ready for broad dissemination (Flay et al., 2005). Designs that use matching without random assignment leave open the possibility that variables other than those measured were responsible for observed posttest differences, rather than the intervention itself. Additionally, the previous quasi-experimental studies lacked data on program implementation, a measurement that is desirable to ensure that implementation occurred and, if so, how well it occurred (Domitrovich & Greenberg, 2000; Durlak & DuPre, 2008; Flay et al., 2005).
Utilizing student self-report data from the current randomized trial, Beets and colleagues

Impact of the Positive Action program Page 5 of 29
(2009) examined the preventive benefits of PA on rates of student self-report and teacher reports of student substance use, violence, and voluntary sexual activity. Results indicated lower rates of substance use, violence and sexual activity among students attending PA schools. Overall, this randomized trial 1) replicated findings from quasi-experimental studies regarding violence and substance use and 2) found that PA can also alter other behaviors, such as sexual activity, that the program does not address directly. Hence, even though PA did not teach sexual responsibility, for example, the SACD content produced effects on sexual activity. Previous results suggest a mechanism that leads PA to positively affect multiple outcomes, such as sexual responsibility and academic achievement, even though the program does not include explicit discussion of these outcomes. The purpose of the present study was to apply a matched-pair, cluster randomized, controlled design to evaluate the effects of PA on school-level indicators of academic achievement, absenteeism, and disciplinary outcomes. School-level data are useful for estimating causal effects but are underutilized (Stuart, 2007). The present study builds on extant research and is the first to report the effects of PA on school-level outcomes from a randomized, controlled design; thus, it provides the most rigorous test yet conducted for whether PA can improve school-level performance, and greatly reduces the possibility that factors other than the PA intervention are responsible for observed posttest group differences. PA was hypothesized to result in decreased absenteeism, disciplinary referrals and grade retentions and improved academic achievement. METHODS Design and sample The PA Hawai`i trial was a matched-pair, cluster randomized, controlled trial, conducted during the 2002-03 through 2005-06 school years, with a one-year follow-up in 2007, in Hawai`i elementary schools. The state is one large school district with diverse ethnic groups and a recognized need for improvement (i.e., low standardized test scores and a high percentage of students receiving free or reduced-price lunch). The trial took place in 20 public elementary (K-5th or K-6th) schools (10 matched-pairs) on three Hawai`ian islands. Eligible schools for the study were those elementary schools that 1) were located on O`ahu, Maui or Moloka`i, 2) were K-5 or K-6 community schools (were not academy, charter, or special education), 3) had at least 25% of students receiving free or reduced-price lunch, 4) were in the state’s lower three quartiles of standardized test scores, and 5) had annual student mobility rates under 20%, thereby ensuring that at least 40% of a selected cohort was still in the same school by the end of the trial. To ensure comparability of the intervention and control schools with respect to baseline measures, 2000 SRC data on 111 eligible schools were used to stratify schools into strata ranked on an index based on 1) demographic variables of percent free or reduced-price lunch, school size, percent stability, and ethnic distribution; 2) characteristics of the student populations such as percent special education, and limited English proficiency; and 3) indicators of student behavior and performance outcomes such as standardized test scores, absenteeism, and suspensions (Dent, Sussman, & Flay, 1993; Flay et al., 2004; Graham, Flay, Johnson, Hansen, & Collins, 1984). Schools were matched based on their index score, resulting in 19 utilizable strata. Matched pairs were randomly selected from within strata, with one school of each pair randomly assigned to either the intervention or control condition before recruitment.

Impact of the Positive Action program Page 6 of 29
Starting with schools only on O`ahu (to limit travel costs), intervention schools were asked to implement PA whereas the control schools were asked to continue “business as usual” without making any substantial SACD reforms. Once it was evident that no additional schools could be recruited on O`ahu, recruitment began using strata from Maui and Moloka`i. The final sample of schools was representative of Hawai`ian schools, though with higher stability (as intended) and at higher risk (as intended) as indicated by percent free or reduced-price lunch and standardized test scores, respectively.
Intervention schools were offered the complete PA program free of charge and control schools were offered a monetary incentive during the randomized trial and the PA program upon completion of the trial. Three of the 10 control schools chose to receive the PA program after the formal trial; they were treated as controls at the follow-up to the present study, as anecdotal evidence suggests that they did not fully implement the program, and it is likely that schools need several years to fully implement a comprehensive program to see substantial benefits (Beets et al., 2009; Li et al., 2009). Program overview
The Positive Action program (www.positiveaction.net) is a comprehensive, school-wide SACD program designed to improve academics, student behaviors and character. The program, developed in 1977 by Carol Gerber Allred, Ph.D. and revised since then as a result of process and outcome evaluations, is grounded in a broad theory of self-concept (Purkey, 1970; Purkey & Novak, 1970), is consistent with integrative, ecological, theories of health behavior such as the Theory of Triadic Influence (Flay & Petraitis, 1994; Flay et al., in press), and is described in detail elsewhere (Flay & Allred, 2003; Flay et al., 2001). The full PA program consists of K-12 classroom curricula, of which only the elementary curriculum was used in the present randomized trial; a school-wide climate development component, including teacher/staff training by the developer, a PA coordinator’s (principal’s) manual, school counselor’s program, and PA coordinator/committee guide; and family- and community-involvement programs.
The sequenced elementary curriculum consists of 140 lessons per grade, per academic year, offered in 15-20 minutes by classroom teachers. When fully implemented, the total time students are exposed to the program during a 35 week academic year is approximately 35 hours. Lessons cover six major units on topics related to self-concept (i.e., the relationship of thoughts, feelings, and actions) physical and intellectual actions (e.g., hygiene, nutrition, physical activity, avoiding harmful substances, decision-making skills, creative thinking), social/emotional actions for managing oneself responsibly (e.g., self-control, time management), getting along with others (e.g., empathy, altruism, respect, conflict resolution), being honest with yourself and others (e.g., self-honesty, integrity, self-appraisal) and continuous self-improvement (e.g., goal setting, problem solving, courage to try new things, persistence). The classroom curricula utilize an interactive approach, whereby interaction between teacher and student is encouraged through the use of structured discussions and activities, and interaction between students is encouraged through structured or semi-structured small group activities, including games, role plays and practice of skills. For example, students are asked how they like to be treated. Regardless of age, socioeconomic status, gender or culture, students and adults suggest the same top values of respect, fairness, kindness, honesty, understanding/empathy and love, consistent with others’ findings (Nucci, 2001). These values are then adopted as the code of conduct for the classroom and school (Flay & Allred, in press).

Impact of the Positive Action program Page 7 of 29
The school-climate kit consists of materials to encourage and reinforce the six units of PA, coordinating school-wide implementation. Included in the kit, the PA coordinator’s (principal’s) manual directs the use of materials such as posters, music, tokens, and certificates. It also includes information on planning and conducting assemblies, creating a PA newsletter, and establishing a PA committee to create a school-wide PA culture. Additionally, a counselor’s program, implemented by school counselors, specializes in developing positive actions with students at higher risk and their classrooms, families, and the school as a whole. The family-involvement program is available in various levels of involvement and promotes the core elements of the classroom curriculum and reinforces school-wide positive actions. The parent manual is designed for parents to use at home and includes materials that parallel the classroom curriculum. The present study did not include the more intensive family kit. The community-development component of PA was not used in this trial.
Prior to the beginning of each academic year, teachers, administrators, and support staff (e.g., counselors) attended PA training sessions conducted by the program developer. The training sessions lasted approximately 3-4 hours for the initial year, and 1-2 hours for each successive year. Booster sessions, conducted by the Hawai`i-based project coordinator and lasting approximately 30-50 minutes, were provided an average of once per academic year for each school. Additionally, mini-conferences were held in February of each year to bring together 5-6 leaders and staff (e.g., principals, counselors, teachers) from each of the 10 participating schools in order to share ideas and experiences as well as to get answers to any concerns regarding implementing the program. Data and measures Archival school-level indicators
Archival school-level data were obtained from the Hawai`i Department of Education (HDE) as part of the state’s SRC data accountability system (Hawai'i Department of Education, n. d.-b), with different indicators available at different time points as shown in Table 1. The SRC data were included in schools’ School Status and Improvement Report, designed to provide information on schools’ performance and progress. Absenteeism, suspensions, retention in grade, and four academic achievement indicators, served as the dependent variables for the present study; these were chosen because they were the publically-available indicators of school performance; corresponding classroom- and student-level data were not available due to privacy considerations. School-level performance is an appropriate measure of program effectiveness because the PA Hawai’i trial tested a school-wide implementation of the program and whole schools were randomized to condition (Stuart, 2007).
---Insert Table 1 about here--- The four school-level academic achievement variables included the grade 5 math and
reading standardized test (percent scoring average or above; the HDE switched from the Stanford Achievement Test [SAT] to the TerraNova [2nd ed.] test at one-year follow-up during the current study), and the grade 4 math and reading Hawai`i Content and Performance Standards (HCPS II) (percent proficient). The math and reading SAT and TerraNova (2nd ed.) are national norm-referenced tests that are utilized by school districts in the U.S. to assess achievement of students from kindergarten through high school. The math and reading HCPS II were developed by the HDE through a collaborative process involving teachers and HDE curriculum specialists and represent the HDE performance standards to meet No Child Left Behind mandates (Hawai'i

Impact of the Positive Action program Page 8 of 29
Department of Education, n. d.-a). The archival school-level academic achievement data were available continuously, from 2002 to one-year post trial, as intervention schools continued to implement the PA program. Achievement scores were not reported for one of the 10 pairs of schools because they had too few students at each grade level, so these schools were not included in the primary analysis. There were no missing data for the other dependent variables.
The other three school-level indicators used in this study included: 1) absenteeism (average number of days absent per year, 2) suspensions (percent suspended), and 3) retentions (percent retained in grade, i.e., kept back a grade). Student suspensions may have occurred due to, for example, disorderly conduct, burglary, truancy, and contraband (e.g., possession of tobacco). Suspension data represent all grade levels at each school, and the retention variable included students who were retained in all grades except kindergarten. The archival school-level absenteeism data were available annually from 1997 to 2007; the suspension data from 1999 to 2007; and the retention data from 2002 to 2007.
Thus, the archival data utilized in the present analysis were collected from schools with a different student body each academic year, and intervention schools, over time, had increasing exposure to PA. For example, archival school-level data collected for PA schools during the 2005-2006 academic year represented schools with students who were exposed to the intervention for up to four years compared to the 2002-2003 academic year. Implementation
As part of the PA Hawai’i trial, sufficient data from year-end process evaluation surveys were collected from teachers at the end of the second (2004), third (2005), and final year (2006) of program implementation and are described in detail elsewhere (Beets et al., 2008). We used three school-level implementation indicators related to program exposure and adherence: 1) exposure, measured by seven items (i.e., six items referred to the six units in the PA curriculum and asked about how often the teachers taught the concept throughout the school day, and an additional item assessed the amount of PA workbooks and activity sheets used during a typical day), 2) classroom material usage, measured by three items (i.e., how often teachers used PA materials/activities) and 3) school-wide material usage, measured by tree items (i.e., how often PA materials/activities were used throughout the school). All item responses ranged from 1 “never” to 5 “always.” Alpha reliabilities were adequate (Beets et al., 2008).
The three school-level implementation indicators and an overall school-level implementation indicator were calculated at the second (2004), third (2005), and final year (2006) of program implementation using several steps. First, based on teachers’ responses to the items that comprised each of the different implementation indicators, we calculated mean teacher-level indicator scores. Second, using the teacher-level indicator scores, a mean school-level implementation indicator was calculated for every school each year. Lastly, an overall school-level implementation indicator was calculated by computing the mean across all schools for each year of program implementation.
During the spring of the final year of the four-year randomized trial, data were collect from one school leader (i.e., principal, vice principal, counselor) from each treatment and control school regarding the SACD programs and/or activities that were conducted in their school during the prior three academic years. Respondents were asked to list up to 16 SACD programs. For each program, respondents indicated the number of weeks the program was offered, the amount of time (minutes) devoted to the program per week, and whether or not teachers attended/received training to deliver the program (yes/no).

Impact of the Positive Action program Page 9 of 29
Analyses For our primary analysis, we used matched paired t-tests, Hedges’ adjusted g as a
measure of effect size (Grissom & Kim, 2005; Hedges & Olkin, 1985), and percent relative improvement (RI). To assess the robustness of results, permutation tests and random-intercept growth curve models were used for sensitivity analyses. The random-effects growth curve models provide some statistical control beyond randomization for potentially confounding unmeasured variables in case randomization was not totally successful with 10 schools per condition. This battery of statistical approaches was used separately for each of the outcomes and was applied to end-of-study (2006) and one-year post trial (2007) outcomes. Primary analysis
First, matched paired t-tests of difference scores were used to examine change in school-level outcomes by condition. For each outcome, two difference scores [posttest (2006) – baseline (2002) and one-year post trial (2007) – baseline (2002)] were calculated for each pair of intervention and control schools and a paired t-test was performed. In a randomized design, the difference in means provides an unbiased estimate of the true average intervention effect (Stuart, 2007).
Second, effect sizes for absenteeism, suspensions, retentions and each of the four achievement outcomes were calculated by subtracting the mean difference of control schools from the mean difference of PA schools and dividing by the pooled posttest standard deviation. Hedges’ g (as well as other measures of effect size such as Cohen’s d and Glass’ d) has some positive bias; therefore, Hedges’ approximately unbiased adjusted g was calculated. Moreover, the adjusted g is an appropriate effect size calculation when the sample size is small (Grissom & Kim, 2005). Effect sizes were examined at posttest and at one-year post trial and were interpreted as small (0.2), moderate (0.5) or large (0.8) (Cohen, 1977).
Additionally, we calculated RI as an indicator of effect size that may be more understandable to practitioners. RI is the posttest difference between groups minus the baseline difference between groups, divided by the control group posttest level; that is, (PA mean – C mean) posttest – (PA mean – C mean) baseline / C mean posttest, expressed as a percentage. Sensitivity analysis
Subsequently, to avoid reliance on t-test assumptions alone and as a sensitivity analysis, permutation tests were conducted with Stata v10 permute, which estimates p-values based on Monte Carlo simulations (Stata Corp., College Station, TX). Both paired t-tests of differences and permutation models have demonstrated good performance in randomized trials when the number of pairs is small (Brookmeyer & Chen, 1998).
Lastly, random-intercept growth curve models (see Appendix A) were conducted with Stata v10 xtmixed (Rabe-Hesketh & Skrondal, 2008) to account for all observations and to model school differences. That is, this allows a more complete analysis of the multiple waves of available data (5 waves of data at posttest; 6 waves of data at one-year post trial) and takes into account the pattern of change over time. The random-intercept model allows the intercept to vary between schools, which indicates that some schools tend to have, on average, better outcomes and other schools have worse outcomes. The random coefficient is fixed, which reflects that intervention effects are similar for all schools. To estimate effects with missing values present, full information maximum likelihood estimation was used which utilizes all available data to provide maximum likelihood estimation (Acock, 2005). For the present analyses, each growth curve involved approximately 100 observations (5 waves × 20 schools at posttest; 6 waves × 20

Impact of the Positive Action program Page 10 of 29
schools at one-year post trial). Although this sample size is at the lower end of some suggested guidelines for this estimator, it is adequate as a supplementary sensitivity analysis, as different views exist regarding appropriate sample size (Singer & Willett, 2003).
For each outcome, from baseline through both posttest and one-year post trial, we tested whether a quadratic term for time was significant using the likelihood-ratio (LR) test (Rabe-Hesketh & Skrondal, 2008). Through posttest, results indicated that a quadratic model provided a significantly better fit for the data on reading HCPS II (LR χ2[1] = 14.92, p < .001) and absenteeism (LR χ2[1] = 6.25, p < .05). Through one-year post trial, results showed that a quadratic model fit significantly better for math TerraNova (LR χ2[1] = 4.04 , p < .05), reading TerraNova(LR χ2[1] = 4.56 , p < .05), math HCPS II (LR χ2[1] = 17.04, p < .001), and absenteeism (LR χ2[1] = 19.39, p < .001).
For the remaining outcomes (school suspensions and retentions), from baseline through both posttest and one-year post trial, we conducted random-intercept Poisson models with Stata v10 xtpoisson (Rabe-Hesketh & Skrondal, 2008). As is common with elementary school-level data, frequency distributions for school suspensions and retentions were skewed at both posttest and one-year post trial. Hence, a random-intercept Poisson model was used to account for this skewed distribution. The mean and variance of the suspension and retention variables were similar through posttest (suspensions [M = 0.95; variance =1.09]; retentions [M = 0.99; variance = 0.92]) and one-year post trial (suspensions [M = 1.07; variance = 1.72]; and retentions [M = 0.94; variance = 0.88]), an assumption of the Poisson model (Snijders & Bosker, 1999); therefore, we did not adjust for overdispersion. Similarly, as discussed above, a LR test was used to compare random-intercept Poisson models with the inclusion of a quadratic term. Only the result for suspensions (LR χ2[1] = 4.85, p < .05) at one-year post trial demonstrated a quadratic model provided a better fit for the data.
Additionally, to test whether the pattern of curvilinear change was different in PA and control schools, a year squared by condition interaction term was included in the quadratic models, and a LR test was performed. Results indicated that the inclusion of an interaction term did not significantly improve any of the quadratic models and, hence, was not included in the final models.

Impact of the Positive Action program Page 11 of 29
RESULTS Baseline equivalency
At the 2002 baseline no significant differences (p ≥ .05) existed between intervention and control schools on any of the SRC variables (Table 2; Table 4 displays outcome variables). Thus, the methods of developing strata and random selection and assignment were effective for these variables. Schools were racially/ethnically diverse with a mean enrollment of 544 (SD = 276.41).
---Insert Table 2 about here--- Implementation
There was some variability in school-level implementation between schools, with small improvements across years (Table 3). Regarding the three school-level indicators examined, school-wide material usage demonstrated the highest school-level implementation. Implementation was adequate for each indicator; however, results indicated that schools could have implemented PA with greater fidelity.
---Insert Table 3 about here--- We found that control schools reported implementing an average of 10.2 SACD
programs compared with 4.2 -- in addition to PA -- in the intervention schools. Teachers in control schools spent an average of 108 minutes per week on SACD-related activities. PA-school teachers spent the expected amount of time on PA (55.1 min/week), yet overall they still spent only 35 min/week more on SACD-related activities than teachers in control schools. Control schools reported that teachers were involved in SACD-related activities for an average of 24 weeks per school year. In contrast, teachers in intervention schools reported delivering PA almost every week of the school year as well as being involved in other SACD-related activities for 25 weeks/year. Both PA and control school teachers reported receiving training to implement approximately half of the SACD-related programs (52.3% and 53.3%, respectively) that they reported implementing other than PA (100% trained). School-level raw means
Raw means for school-level academic achievement, absenteeism, suspensions, and retentions are presented in Figures 1 and 2, respectively. Overall, for the academic achievement outcomes, raw means for PA and control schools were statistically similar at baseline and demonstrated a clearly discernable divergence over time. State averages for academic achievement are shown for comparison. Although the PA schools were well below state averages at baseline (as planned), they nearly met or exceeded the state averages for academic achievement at posttest and one-year post trial.
---Insert Figure 1 about here--- Likewise, for the other school-level outcomes, PA and control schools diverged between
baseline and posttest. For absenteeism and suspensions, pre-baseline years of archival school-level data were available and provide an interrupted time series presentation. As expected, these outcomes were stable for several pre-program years with divergence occurring after the intervention.
---Insert Figure 2 about here--- Matched paired t-tests and effect sizes The results of the matched paired t-tests of difference scores and effect size calculations at posttest and one-year post trial are presented in Table 4. At posttest, results indicated that PA schools had significantly higher math (p < 0.05) and reading (p < 0.05) HCPS II scores; and

Impact of the Positive Action program Page 12 of 29
significantly lower absenteeism (p < 0.001), with marginally fewer suspensions (p = 0.056). After completion of the randomized trial, at one-year post trial as PA schools continued to implement the PA program, reading TerraNova(p < 0.05) and math (p < 0.01) and reading (p < 0.05) HCPS II were significantly higher among PA schools; and absenteeism (p < 0.001) and suspensions (p < 0.05) were significantly lower for PA schools. Overall, results indicated higher achievement and lower absenteeism and suspension outcomes for the PA schools. The permutation models provided similar statistically significant results as the matched paired t-tests at both posttests. That is, permutation tests at posttest indicated statistically significant results for math (marginal p = 0.054) and reading (p < 0.01) HCPS II and absenteeism (p < 0.01); and at one-year post trial reading (p < 0.05) TerraNova, math (p < 0.001) and reading (p < 0.05) HCPS II, absenteeism (p < 0.001), and suspensions (p < 0.05) were significantly different for PA schools as compared to control schools.
---Insert Table 4 about here--- In order to provide a basis for comparing the magnitude of the intervention effects we
found with effects found in other trials, effect sizes were calculated. As shown in Table 4, all of the effect sizes were moderate to large, regardless of the level of significance. Corresponding effect size calculations demonstrated moderate to large treatment effects for the academic achievement, absenteeism, and disciplinary outcomes at posttest, with larger effects at one-year post trial. Similarly, RIs were larger at one-year post trial. Random-intercept growth curve models
The estimates for the intervention effect on academic achievement scores (random-intercept models) from baseline through posttest and one-year post trial are presented in Table 5. At posttest, the intraclass correlation coefficient (ICC; expressed as the proportion of the total outcome variation that is attributable to differences among schools) for the unconditional means models (Singer & Willett, 2003) were .72, .67, .87, and .72 for math SAT and HCPS II and reading SAT and HCPS II, respectively. At one-year post trial, the ICC for the unconditional means models were .68, .46, .87, and .66 for math TerraNova and HCPS II and reading TerraNova and HCPS II, respectively, indicating that most of the variation in academic achievement lies between schools, rather than within schools over time. Overall, through both posttest and one-year post trial, the random-intercept models’ year by condition interactions substantiated results of the matched paired t-tests and permutation models, indicating higher achievement increases in PA schools. For change from baseline through one-year post trial, the time by condition interactions for math TerraNova (B = 1.34, p < .05) and HCSPII (B = 2.69, p < .001) and reading TerraNova (B = 1.35, p < .01) and HCPS II (B = 2.10, p < .05) were all statistically significant. These effects indicate about a 2 percentage point advantage per year for the PA group compared to the control group due to the intervention, or about a 12 percentage point advantage across the six-year period.
---Insert Table 5 about here--- The estimates for the intervention effect on the absenteeism, suspension, and retention
outcomes (random-intercept and random-intercept Poisson models) from baseline through both posttest and one-year post trial are presented in Table 6. Parameter estimates and incidence rate ratios (IRR) are each presented for the random-intercept Poisson models, as an intercept parameter is not calculated for IRR estimates and, additionally, a residual variance estimate is not part of such models (Rabe-Hesketh & Skrondal, 2008). At posttest, the ICCs for the
Impact of the Positive Action program Page 13 of 29
unconditional means models were .88, .52, and .47 for absenteeism, suspensions, and retentions, respectively. The ICC values for the Poisson models are approximations and were calculated utilizing a similar approach as used for the random-intercept models (Goldstein, Browne, & Rasbash, 2002). At one-year post trial, the ICCs for the unconditional means models were .88, .52, and .41 for absenteeism, suspensions, and retentions, respectively. Thus, much of the variation in absenteeism, nearly half of the variation in suspensions, and less than half the total variation in retentions can be attributable to differences between schools.
---Insert Table 6 about here--- Regarding absenteeism, from baseline through both posttest (Year × Condition B = -0.45,
p < .001) and one-year post trial (Year × Condition B = -0.36, p < .001), the random-intercept growth models substantiated results of the matched paired t-tests, demonstrating a significant reduction in absenteeism among PA schools relative to control schools. However, as compared to the matched paired t-tests, inconsistent results emerged for the suspension and retention outcomes. The random-intercept growth curves indicated a marginally significant (B = -0.20, p = .06; IRR [95%CI] = 0.82 [0.67, 1.01]) year by condition interaction for the suspension outcome from baseline to one-year post trial, where the t-tests did not. Further, inconsistent with the non-significant matched paired t-test, the retention year by condition interactions through posttest (B = -0.30, p < .05; IRR = 0.74 [0.54-1.00]) and one-year post trial (B = -0.30, p < .05; IRR= 0.74 [0.58-0.95]) were statistically significant. Therefore, overall, the random-intercept and random-intercept Poisson models demonstrate decreased absenteeism, disciplinary and retention outcomes among PA schools relative to control schools. DISCUSSION The present study extends previous research on the capabilities of school-based interventions targeting social-emotional and character development to improve academic performance and attendance and reduce disciplinary problems and grade retention in schools. This study also confirms earlier preliminary findings of beneficial results of the PA program from quasi-experimental studies (Flay & Allred, 2003; Flay et al., 2001) using a matched-pair, cluster randomized, controlled trial. Specifically, as indicated by matched paired t-tests and permutation models, PA schools scored significantly better than control schools in reading TerraNova and math and reading HCPS II; and significantly lower absenteeism and suspensions at one-year post trial. Moreover, random-intercept growth models demonstrated that PA schools showed significantly greater growth in math and reading TerraNova, math and reading HCPS II; and significantly lower absenteeism and retentions through one-year post trial, with suspensions showing marginal significance. Indeed, school-level means for math and reading achievement demonstrated that PA schools, which were below state averages at baseline, nearly met or exceeded state averages by posttest and one-year post trial. These findings were especially noteworthy since many of the schools were in low income areas and had a high level of racial/ethnic diversity. The present results demonstrated moderate to large effect sizes on all of the observed outcomes and were likely the result of several notable attributes of the PA program. First, PA addresses distal influences on behavior in a multifaceted way; PA is a comprehensive approach that involves providing the curriculum to all grades in the school at once, involving all teachers and staff in the school, and involving parents and the community. The PA program assists students and adults to gain not only the knowledge, attitudes, norms and skills that they might gain from other programs, but also improved values, self-concept, family bonding, peer

Impact of the Positive Action program Page 14 of 29
selection, communication, and appreciation of school, with the expected result of improvement in academic performance and a broad range of behaviors. These improved outcomes may occur because positive behaviors tend to correlate negatively with negative behaviors (Flay, 2002). More specifically, with regards to academic achievement, for example, PA increases positive behaviors and decreases disruptive behaviors which, in turn, lead to more time on task for teaching and, in turn, more opportunity for student learning (Flay & Allred, in press). Also, improvements in students’ positive behaviors, such as attention and inhibitory control, can lead to increased academic achievement throughout formal schooling (McClelland, Acock, & Morrison, 2006).
Second, PA is “interactive” in delivery, using methods that integrate teacher/student contact and communication opportunities for the exchange of ideas, and utilize feedback and constructive criticism in a non-threatening atmosphere (Tobler et al., 2000). Third, the results observed may also have been a consequence of the intensive nature of the program, with students receiving approximately 1 hour of exposure during a typical week over multiple school years. Lastly, in the present study, we believe that the beneficial effects of the PA program could have been even greater if the fidelity of implementation was excellent.
This analysis has some limitations. First, data regarding academic achievement, absenteeism, suspensions, and retention outcomes were not available at the student or classroom level. Because of this, variation in scores within students across years, or variation between students within schools could not be examined. As a result, individual student or classroom characteristics could not be included as predictors in the models to reduce unexplained variation. However, with random assignment, student and classroom characteristics should be about the same in the intervention and control groups. In addition, random-intercept models provide some statistical control for unmeasured differences between schools. Since every student’s score contributes to a school’s mean score, the design and analysis in this study provides a good test for intervention effects (Stuart, 2007). Future work that utilizes multilevel analysis of student-level indicators of academic achievement, absenteeism, and disciplinary outcomes would be beneficial.
Second, although school-level data are useful for estimating causal effects (Stuart, 2007), there may be inconsistencies among schools regarding how data, such as disciplinary-related referrals, are reported. Furthermore, it is possible that an intervention could influence how these data are reported. For example, a negative behavior that results in a disciplinary referral after an intervention is implemented may not have been grounds for a disciplinary referral before the intervention.
A third limitation of our analyses is that only 20 schools participated in the study, with five waves of data resulting in 100 observations per random-effects growth curve model. Under conditions of small effect size and high ICC, this could result in relatively low statistical power to detect differences between treatment and control schools. This study found moderate to large effect sizes, but also large ICCs, so power was a concern. However, a successful matched-pair design can improve statistical power (Raudenbush, Martinez, & Spybrook, 2007), and our findings demonstrate a successful matched-pair design as well as its ability to detect statistical significance.
Fourth, there were a limited number of observations available for the random-effects growth curve models. With full information maximum likelihood estimation used in those models, a large sample is desirable (Hayes, 2006) to guarantee the accuracy of the estimates,

Impact of the Positive Action program Page 15 of 29
although there are various viewpoints on what constitutes a large sample size (Singer & Willett, 2003). Our sample was large enough to use these models to compare the sensitivity of the matched paired t-tests and permutation tests to an alternative statistical model, with different assumptions. The random-intercept models substantiated our findings from the more basic tests.
Fifth, although we demonstrated adequate implementation of PA and realize the importance of implementation fidelity (Flay et al., 2005), we had insufficient data (i.e., insufficient variation given a sample of only 10 PA schools) to examine implementation as a covariate. Also, we did not have data to observe the change in SACD-related activities in control schools. As indicated by the data procured during the last year of the four-year trail, the widespread self-initiation of SACD-related activities, especially in control schools, can reduce the possible effect size that can be detected when evaluating school-based interventions (Hulleman & Cordray, 2009). Additionally, because implementation data were not collected after completion of the randomized trial, we could not examine implementation at one-year post trial. Future studies with larger samples of schools would be valuable to examine the effects of implementation fidelity on school-level outcomes.
Lastly, as with all other similar studies, results can only be generalized to schools that are willing to conduct such a program. Though our sample was adequate for this study, a larger representative sample of schools, or randomized trials at different locations, would allow generalization of results to a broader population.
These limitations notwithstanding, this study is the first to examine the effects of PA on school-level achievement, absenteeism, and disciplinary outcomes using a matched-pair, cluster randomized, controlled design. The study extends research on the ways that changing a child’s developmental status in non-academic areas can significantly enhance academic achievement (Catalano et al., 2004; Catalano et al., 2002; Flay, 2002) and actually, may be essential for it. Future research should examine the specific mechanisms, moderators and mediators of social and character development intervention effects. Such knowledge would allow adjustments to PA that might increase the beneficial effect.
Unfortunately, elementary schools, with many demands for accountability, may concentrate solely on math, reading, and science achievement; and, due to resource and time constraints, instruction regarding social and character development may be abandoned. The findings of this study provide evidence that the Positive Action program, which has demonstrated effects on improving student behavior and character (Beets et al., 2009; Li et al., 2009) can also reduce school-level absenteeism and disciplinary outcomes and, concurrently, positively influence school-level achievement. Indeed, this study makes clear that a comprehensive school-based program that addresses multiple co-occurring behaviors can positively affect both behavior and academics.
REFERENCES Acock, A. (2005). Working with missing values. Journal of Marriage & Family, 67(4), 1012-
1028. Battistich, V., Schaps, E., Watson, D., Solomon, D., & Lewis, C. (2000). Effects of the child
development project on students' drug use and other problem behaviors. Journal of Primary Prevention, 21(1), 75-99.
Beets, M. W., Flay, B. R., Vuchinich, S., Acock, A. C., Li, K.-K., & Allred, C. G. (2008). School climate and teachers' beliefs and attitudes associated with implementation of the positive

Impact of the Positive Action program Page 16 of 29
action program: A diffusion of innovations model. Prevention Science, DOI 10.1007/s11121-11008-10100-11122.
Beets, M. W., Flay, B. R., Vuchinich, S., Snyder, F. J., Acock, A., Li, K.-K., et al. (2009).Use of a social and character development program to prevent substance use, violent behaviors, and sexual activity among elementary-school students in Hawaii. American Journal of Public Health, 99(8), 1438-1445.
Biglan, A., Brennan, P. A., Foster, S. L., Holder, H. D., Miller, T. L., Cunningham, P. B., et al. (2004). Multi-problem youth: Prevention, intervention, and treatment. New York, NY: Guilford.
Botvin, G. J., Griffin, K. W., & Nichols, T. D. (2006). Preventing youth violence and delinquency through a universal school-based prevention approach. Prevention Science, 7(4), 403-408.
Botvin, G. J., Schinke, S., & Orlandi, M. A. (1995). School-based health promotion: Substance abuse and sexual behavior. . Applied & Preventive Psychology, 4, 167-184.
Brookmeyer, R., & Chen, Y. Q. (1998). Person-time analysis of paired community intervention trials when the number of communities is small. Statistics In Medicine, 17(18), 2121-2132.
Catalano, R. F., Berglund, M. L., Ryan, J. A. M., Lonczak, H. S., & Hawkins, J. D. (2004). Positive youth development in the United States: Research findings on evaluations of positive youth development programs. Annals of the American Academy of Political and Social Science, 591, 98-124.
Catalano, R. F., Hawkins, J. D., Berglund, M. L., Pollard, J. A., & Arthur, M. W. (2002). Prevention science and positive youth development: Competitive or cooperative frameworks? . Journal of Adolescent Health, 31(6 Suppl), 230-239.
Coalition for Evidence-Based Policy. (2002). Bringing evidence-driven progress to education: A recommended strategy for the U.S. Department of Education. Washington, D.C.: Coalition for Evidence-Based Policy.
Cohen, J. (1977). Statistical power analysis for the behavioral sciences (2 ed.). New York: Academic Press.
Costello, E. J., Mustillo, S., Erkanli, A., Keeler, G., & Angold, A. (2003). Prevalence and development of psychiatric disorders in childhood and adolescence. Archives of General Psychiatry, 60(8), 837-844.
Dent, C. W., Sussman, S., & Flay, B. R. (1993). The use of archival data to select and assign schools in a drug prevention trial. Evaluation Review, 17(2), 159-181.
Derzon, J. H., Wilson, S. J., & Cunningham, C. A. (1999). The effectiveness of school-based interventions for preventing and reducing violence: Center for Evaluation Research and Methodology, Vanderbilt University.
Dinks, R., Cataldi, E. F., & Lin-Kelly, W. (2007). Indicators of school crime and safety: 2007 (NCES 2008-021/NCJ 219553). National Center for Education Statistics, Institute of Education Sciences, U.S. Department of Education, and Bureau of Justice Statistics, Office of Justice Programs, U.S. Department of Justice. Washington, DC.
Domitrovich, C. E., & Greenberg, M. T. (2000). The study of implementation: Current findings from effective programs that prevent mental disorders in school-aged children. Journal of Educational and Psychological Consultation, 11(2), 193-221.

Impact of the Positive Action program Page 17 of 29
DuPaul, G. J., & Stoner, G. (2004). ADHD in the schools: Assessment and intervention strategies: The Guilford Press.
Durlak, J. A., & DuPre, E. P. (2008). Implementation matters: A review of research on the influence of implementation on program outcomes and the factors affecting implementation. American Journal of Community Psychology, 41(3), 327-350.
Eaton, D. K., Brener, N., & Kann, L. K. (2008). Associations of health risk behaviors with school absenteeism. Does having permission for the absence make a difference? Journal of School Health, 78(4), 223-229.
Eaton, D. K., Kann, L., Kinchen, S., Shanklin, S., Ross, J., Hawkins, J., et al. (2008). Youth risk behavior surveillance—United States, 2007. Morbidity & Mortality Weekly Report, 57, 1–131.
Eccles, J. S. (2004). Schools, academic motivation, and stage-environment fit. In R. M. Lerner & L. Steinberg (Eds.), Handbook of Adolescent Psychology (2nd Edition) (pp. 125-153). Hoboken, NJ: Willey.
Eisenbraun, K. D. (2007). Violence in schools: Prevalence, prediction, and prevention. Aggression and Violent Behavior, 12(4), 459-469.
Elias, M. J., Gara, M., Schuyler, T., Branden-Muller, L., & Sayette, M. (1991). The promotion of social competence: Longitudinal study of preventive school-based program. American Journal of Orthopsychiatry, 61, 409-417.
Flay, B. R. (1985). Psychosocial approaches to smoking prevention: A review of findings. Health Psychology, 4 (5), 449-488.
Flay, B. R. (1986). Efficacy and effectiveness trials (and other phases of research) in the development of health promotion programs. Preventive Medicine, 15(5), 451-474.
Flay, B. R. (2000). Approaches to substance use prevention utilizing school curriculum plus social environment change. Addictive Behaviors, 25(6), 861-885.
Flay, B. R. (2002). Positive youth development requires comprehensive health promotion programs. American Journal of Health Behavior, 26(6), 407-424.
Flay, B. R. (2009a). The promise of long-term effectiveness of school-based smoking prevention programs: A critical review of reviews. Tobacco Induced Diseases, 5(7), doi:10.1186/1617-9625-1185-1187.
Flay, B. R. (2009b). School-based smoking prevention programs with the promise of long-term effects. Tobacco Induced Diseases, 5(6), doi:10.1186doi:1110.1186/1617-9625-1185-1186.
Flay, B. R., & Allred, C. G. (2003). Long-term effects of the Positive Action program. American Journal of Health Behavior, 27, S6.
Flay, B. R., & Allred, C. G. (in press). The Positive Action program: Improving academics, behavior and character by teaching comprehensive skills for successful learning and living. In T. Lovat & R. Toomey (Eds.), International Handbook on Values Education and Student Well-Being. Dirtrecht: Springer.
Flay, B. R., Allred, C. G., & Ordway, N. (2001). Effects of the Positive Action program on achievement and discipline: Two matched-control comparisons. Prevention Science, 2(2), 71-89.
Flay, B. R., Biglan, A., Boruch, R. F., Castro, F. G., Gottfredson, D., Kellam, S., et al. (2005). Standards of evidence: Criteria for efficacy, effectiveness and dissemination. Prevention Science, 6(3), 151-175.

Impact of the Positive Action program Page 18 of 29
Flay, B. R., Graumlich, S., Segawa, E., Burns, J. L., & Holliday, M. Y. (2004). Effects of 2 prevention programs on high-risk behaviors among African American youth: A randomized trial. Archives of Pediatrics & Adolescent Medicine, 158(4), 377-384.
Flay, B. R., & Petraitis, J. (1994). The theory of triadic influence: A new theory of health behavior with implications for preventive interventions. Advances in Medical Sociology, 4, 19-44.
Flay, B. R., Snyder, F., & Petraitis, J. (in press). The theory of triadic influence. In R. J. DiClemente, M. C. Kegler & R. A. Crosby (Eds.), Emerging Theories in Health Promotion Practice and Research (2nd ed.). San Francisco, CA: Jossey-Bass.
Fleming, C. B., Haggerty, K. P., Catalano, R. F., Harachi, T. W., Mazza, J. J., & Gruman, D. H. (2005). Do social and behavioral characteristics targeted by preventive interventions predict standardized test scores and grades? Journal of School Health, 75(9), 342-349.
Goldstein, H., Browne, W., & Rasbash, J. (2002). Partitioning variation in multilevel models. Understanding Statistics, 1(4), 223-231.
Graham, J. W., Flay, B. R., Johnson, C. A., Hansen, W. B., & Collins, L. M. (1984). Group comparability: A multiattribute utility measurement approach to the use of random assignment with small numbers of aggregate units. Evaluation Review, 8(2), 247-260.
Greenberg, M. T., Weissberg, R. P., O Brien, M. U., Zins, J. E., Fredericks, L., Resnik, H., et al. (2003). Enhancing school-based prevention and youth development through coordinated social, emotional, and academic learning. American Psychologist, 58(6/7), 466-474.
Grissom, R. J., & Kim, J. J. (2005). Effect sizes for research: A broad practical approach. New York, NY: Lawrence Erlbaum Associates.
Gustavson, C., Stahlber, O., Sjodin, A. K., Forsman, A., Nilsson, T., & Anckarsater, H. (2007). Age at onset of substance abuse: a crucial covariate of psychopathic traits and aggression in adult offenders. Psychiatry Research, 153(2), 195-198.
Hallfors, D. D., Waller, M. W., Bauer, D., Ford, C. A., & Halpern, C. T. (2005). Which Comes First in Adolescence--Sex and Drugs or Depression? American Journal of Preventive Medicine, 29(3), 163-170.
Hamilton, L. S., Stecher, B. M., Marsh, J. A., Sloan McCombs, J., Robyn, A., Russell, J., et al. (2007). Standards-based accountability under no child left behind: Experiences of teachers and administrators in three states. Santa Monica, CA: RAND Corporation.
Hawai'i Department of Education. (n. d.-a). Hawai'i Content & Performance Standards. Retrieved December 22, 2008, from http://doe.k12.hi.us/curriculum/hcps.htm
Hawai'i Department of Education. (n. d.-b). School accountability: School status & improvement report. Retrieved March, 2008, from http://arch.k12.hi.us/school/ssir/ssir.html
Hawkins, J. D., Catalano, R. F., Kosterman, R., Abbott, R. D., & Hill, K. (1999). Preventing adolescent health-risk behaviors by strengthening protection during childhood. Archives of Pediatrics and Adolescent Research, 153(3), 226-234.
Hawkins, J. D., Catalano, R. F., & Miller, J. Y. (1992). Risk and protective factors for alcohol and other drug problems in adolescence and early adulthood: Implications for substance abuse prevention. Psychological Bulletin, 112 (1), 64-105.
Hayes, A. F. (2006). A primer on multilevel modeling. Human Communication Research, 32(4), 385-410.

Impact of the Positive Action program Page 19 of 29
Heaviside, S., Rowland, C., Williams, C., & Farris, R. (1999). Violence and discipline problems in U.S. public schools: 1996-1997, NCES 98-030. Washington, DC: U.S. Department of Education, National Center for Education Statistics.
Hedges, L. V., & Olkin, I. (1985). Statistical methods for meta-analysis. San Diego, CA: Academic Press.
Horowitz, J. L., & Garber, J. (2006). The prevention of depressive symptoms in children and adolescents: A meta-analytic review. Journal of Consulting and Clinical Psychology, 74(3), 401-415.
Hulleman, C., & Cordray, D. (2009). Moving from the lab to the field: The role of fidelity and achieved relative intervention strength. Journal of Research on Educational Effectiveness, 2(1), 88-110.
Kellam, S. G., & Anthony, J. C. (1998). Targeting early antecedents to prevent tobacco smoking: Findings from an epidemiologically based randomized field trial. American Journal of Public Health, 88(10), 1490-1494.
Lerner, R. M. (1995). Developing individuals within changing contexts: Implications of developmental contextualism for human development research, policy, and programs. In T. A. Kinderman & J. Valsinar (Eds.), Development of Person-Context Relations (pp. 227-240). Hillsdale, NJ: Lawrence Erlbaum Associates.
Li, K.-K., Washburn, I. J., DuBois, D. L., Vuchinich, S., Ji, P., Brechling, V., et al. (2009). Effects of the Positive Action program on problem behaviors in elementary school students: A matched-pair randomized control trial in Chicago. Manuscript submitted for publication.
Malecki, C. K., & Elliott, S. N. (2002). Children’s social behaviors as predictors of academic achievement: A longitudinal analysis. School Psychology Quarterly, 17(1), 1-23.
McClelland, M. M., Acock, A. C., & Morrison, F. J. (2006). The impact of kindergarten learning-related skills on academic trajectories at the end of elementary school. Early Childhood Research Quarterly, 21, 471-490.
Meece, J. L., Anderman, E. M., & Anderman, L. H. (2006). Classroom goal structure, student motivation, and academic achievement. Annual Review of Psychology, 57, 487-503.
Merline, A. C., O'Malley, P. M., Schulenber, J. E., Bachman, J. G., & Johnston, L. D. (2004). Substance use among adults 35 years of age: Prevalence, adulthood predictors, and impact of adolescent substance use. American Journal of Public Health, 94(1), 96-102.
Nucci, L. P. (1997). Moral development and character formation. In H. J. Walberg & G. D. Haertel (Eds.), Psychology and Educational Practice (pp. 127-157). Berkeley, CA: MacCarchan.
Perie, M., Moran, R., & Lurkus, A. D. (2005). NAEP 2004 Trends in Academic Progress: Three Decades of Student Performance in Reading and Mathematics (NCES 2005-464). U.S. Department of Education, Institute of Education Science, National Center for Education Statistics. Washington, D.C.: Government Printing Office.
Peters, R. D., & McMahon, R. J. (1996). Preventing childhood disorders, substance abuse, and delinquency. Thousand Oaks, CA: Sage.
Petraitis, J., Flay, B. R., & Miller, T. Q. (1995). Reviewing theories of adolescent substance use: Organizing pieces in the puzzle. Psychological Bulletin, 117(1), 67-86.
Purkey, W. W. (1970). Self-concept and school achievement. Englewood Cliffs, NJ: Prentice-Hall.

Impact of the Positive Action program Page 20 of 29
Purkey, W. W., & Novak, J. (1970). Inviting school success: A self-concept approach to teaching and learning. Belmont, CA: Wadsworth.
Rabe-Hesketh, S., & Skrondal, A. (2008). Multilevel and longitudinal modeling using Stata (2nd ed.). College Station, Texas: Stata Press.
Raudenbush, S. W., Martinez, A., & Spybrook, J. (2007). Strategies for improving precision in group-randomized experiments. Educational Evaluation and Policy Analysis, 29, 5-29.
Romer, D. (2003). Reducing adolescent risk: Toward an integrated approach. Thousand Oaks, CA: Sage.
Singer, J. D., & Willett, J. B. (2003). Applied longitudinal data analysis. New York, NY: Oxford University Press.
Slavin, R. E., & Fashola, O. S. (1998). Show me the evidence! Proven and promising programs for America's schools. Thousand Oaks, CA: Sage.
Snijders, T. A. B., & Bosker, R. J. (1999). Multilevel analysis: An introduction to basic and advanced multilevel modeling. Thousand Oaks, California: Sage Publications Ltd.
Snyder, T. D., Dillow, S. A., & Hoffman, C. M. (2008). Digest of Education Statistics 2007 (NCES 2008-022). National Center for Education Statistics, Institute of Education Sciences, U.S. Department of Education. Washington, DC.
Stuart, E. A. (2007). Estimating causal effects using school-level data sets. Educational Researcher, 36(4), 187.
Sussman, S., Dent, C. W., Burton, D., Stacy, A. W., & Flay, B. R. (1995). Developing school-based tobacco use prevention and cessation programs. Thousand Oaks, CA: Sage Publications.
Tobler, N. S., Roona, M. R., Ochshorn, P., Marshall, D. G., Streke, A. V., & Stackpole, K. M. (2000). School-based adolescent drug prevention programs: 1998 meta-analysis. Journal of Primary Prevention, 20(4), 275-336.
Tolan, P. H., & Guerra, N. (1994). What works in reducing adolescent violence: An empirical review of the field. Center for the Study and Prevention of Violence, University of Colorado.
Walberg, H. J., Yeh, E. G., & Mooney-Paton, S. (1974). Family background, ethnicity, and urban delinquency. Journal of Research in Crime and Delinquency, 56, 80-87.
Wentzel, K. R. (1993). Does being good make the grade? Social behavior and academic competence in middle school. Journal of Educational Psychology, 85(2), 357-364.
What Works Clearinghouse. (June, 2007). WWC topic report: Character Education. Retrieved January 20, 2009, from http://ies.ed.gov/ncee/wwc/reports/character_education/topic/
What Works Clearinghouse. (n. d.). Topic reports. Retrieved March, 2009, from http://ies.ed.gov/ncee/wwc/publications/topicreports/
Zins, J., Weissberg, R., Wang, M., & Walberg, H. J. (Eds.). (2004). Building academic success on social and emotional learning. New York: Teachers College Press.

Impa
ct o
f the
Pos
itive
Act
ion
prog
ram
P
age
21 o
f 29
Tabl
e 1.
Tim
elin
e of
the
Posi
tive
Actio
n H
awai
’i tri
al a
nd c
ompi
latio
n of
scho
ol-le
vel i
ndic
ator
s.
Yea
r
1997
1998
1999
2000
2001
2002
2003
2004
2005
2006
2007
Posi
tive
Actio
n tri
al
B
asel
ine
x
x
x
x
†
Scho
ol-le
vel I
ndic
ator
Sta
ndar
dize
d Te
st M
athψ
(% ≥
ave
rage
)
x
x
x
x
x
x
M
ath
HC
PS II
(% p
rofic
ient
)
x
x
x
x
x
x
Sta
ndar
dize
d Te
st R
eadi
ngψ
(%
≥ a
vera
ge)
x
x
x
x
x
x
R
eadi
ng H
CPS
II (%
pro
ficie
nt)
x
x
x
x
x
x
A
bsen
teei
sm (a
vg. d
ays a
bsen
t)
x
x
x
x
x
x
x
x
x
x
x
Sus
pens
ions
(% o
f stu
dent
s)
x
x
x
x
x
x
x
x
x
R
eten
tions
(% o
f stu
dent
s)
x
x
x
x
x
x
ψ Stan
dard
ized
test
scor
es in
clud
ed S
AT
(Sta
nfor
d 9)
for 2
002-
06 a
nd T
erra
Nov
a (2
nd e
d.) f
or 2
007.
†Pos
itive
Act
ion
scho
ols c
ontin
ued
to im
plem
ent t
he p
rogr
am a
fter c
ompl
etio
n of
the
rand
omiz
ed tr
ial;
Thre
e co
ntro
l sch
ools
cho
se to
rece
ive
Posi
tive
Actio
n af
ter t
he tr
ial.

Impa
ct o
f the
Pos
itive
Act
ion
prog
ram
P
age
22 o
f 29
Tabl
e 2.
Cha
ract
eris
tics o
f stu
dy sc
hool
s at b
asel
ine
and
post
test
.
20
02 (B
asel
ine)
2006
(Pos
ttest
)
C
ontro
l
Pos
itive
Act
ion
C
ontro
l
Posi
tive
Actio
n
M
ean
SD
M
ean
SD
p†
Mea
n
SD
M
ean
SD
p† En
rollm
ent
47
8.80
207.
06
60
9.40
330.
07
0.
303
42
7.70
184.
99
57
5.40
341.
42
0.
245
Rac
ial/E
thni
c
Dis
tribu
tion
(%)
A
fric
an A
mer
ican
1.79
3.20
1.66
2.03
0.91
5
2.28
3.35
1.76
2.75
0.70
9
Chi
nese
2.05
3.66
1.88
2.75
0.90
8
2.06
3.12
2.01
2.68
0.97
0
Fili
pino
11.6
1
14.2
0
15.8
3
9.75
0.44
9
8.46
12.3
9
16.8
0
10.3
5
0.12
0
Haw
ai`ia
n
5.61
5.98
5.74
4.16
0.95
6
7.23
8.55
6.29
5.53
0.77
4
His
pani
c
2.45
2.35
3.28
3.11
0.51
0
3.50
3.12
3.62
4.40
0.94
5
Indo
chin
ese
2.
02
5.
62
0.
34
0.
69
0.
361
2.
01
3.
75
1.
56
2.
59
0.
759
Ja
pane
se
4.
26
3.
57
6.
50
6.
16
0.
333
3.
77
2.
69
5.
57
6.
09
0.
404
K
orea
n
1.19
2.12
1.71
3.50
0.69
2
1.07
1.78
1.55
3.10
0.67
6
Nat
ive
Am
eric
an
0.
44
0.
37
0.
47
0.
47
0.
876
0.
73
0.
64
0.
55
0.
53
0.
503
P
art-H
awai
`ian
31
.86
28
.37
28
.81
21
.61
0.
790
30
.99
28
.92
29
.53
24
.42
0.
904
P
ortu
gues
e
1.41
1.94
1.99
1.77
0.49
4
0.99
1.48
0.81
0.85
0.74
2
Sam
oan
3.
11
4.
83
5.
23
8.
78
0.
512
3.
1
4.03
4.83
7.96
0.54
7
Whi
te
17
.52
18
.05
13
.05
10
.81
0.
510
15
.51
18
.89
12
.27
11
.15
0.
646
O
ther
14.6
9
14.0
1
13.4
8
8.61
0.87
9
18.2
9
22.4
9
12.7
6
8.82
0.47
9 St
abili
ty (%
)
90.8
2
2.36
91.7
1
3.18
0.48
7
89.9
2
4.44
88.3
5
4.31
0.43
3 Fr
ee/re
duce
d lu
nch
(%)
54
.32
26
.40
59
.78
22
.95
0.
628
54
.80
25
.08
56
.38
18
.88
0.
875
Lim
ited
Engl
ish
Prof
icie
ncy
(%)
11
.83
15
.30
15
.58
14
.10
0.
576
11
.00
12
.59
14
.19
12
.32
0.
574
Spec
ial E
duca
tion
(%)
10
.56
5.
41
9.
76
2.
99
0.
687
8.
16
2.
29
9.
88
4.
15
0.
267
† 2-
tail
t-tes
t; 18
deg
rees
of f
reed
om

Impact of the Positive Action program Page 23 of 29
Table 3. School-level implementation 2004 2005
2006 Indicator M† SD M‡ SD M‡ SD Exposure/amount 3.08 0.65 3.29 0.52 3.14 0.50 Classroom material usage 2.58 0.71 2.65 0.76 2.66 0.46 School-wide material usage 3.41 1.02 3.62 0.88 3.63 0.84 Overall 3.02 0.74 3.18 0.64 3.14 0.54 Note: Means correspond to item scale: 1 “never” to 5 “always” †N= 8 ‡N=10

Impa
ct o
f the
Pos
itive
Act
ion
prog
ram
P
age
24 o
f 29
Tabl
e 4.
Bas
elin
e m
easu
res,
scho
ol-le
vel m
atch
ed p
aire
d t-t
ests
of d
iffer
ence
scor
es, a
nd e
ffec
t siz
es fo
r mat
h ac
hiev
emen
t, re
adin
g ac
hiev
emen
t, ab
sent
eeis
m, s
uspe
nsio
ns, a
nd re
tent
ions
.
Not
e: P
A =
Posi
tive
Actio
n ψ St
anda
rdiz
ed te
st sc
ores
incl
uded
SA
T (S
tanf
ord
9) fo
r 200
2-06
and
Ter
raN
ova
(2nd
ed.
) for
200
7.
† 2-
tail
t-tes
t; 18
deg
rees
of f
reed
om fo
r all
varia
bles
exc
ept a
chie
vem
ent-r
elat
ed v
aria
bles
(16
degr
ees o
f fre
edom
) ‡ M
ean
diff
eren
ce =
pos
ttest
– b
asel
ine;
one
-yea
r pos
t tria
l – b
asel
ine
€ 2-
tail
paire
d t-t
est d
iffer
ence
scor
e; 8
deg
rees
of f
reed
om fo
r ach
ieve
men
t-rel
ated
var
iabl
es a
nd 9
deg
rees
of f
reed
om fo
r oth
er v
aria
bles
¥ H
edge
s’ g
eff
ect s
ize
(unb
iase
d ad
just
ed g
) of m
ean
diff
eren
ce
† Rel
ativ
e Im
prov
emen
t = (P
A m
ean –
C m
ean)
post
test
– (P
A m
ean –
C m
ean)
base
line /
C m
ean
post
test
20
02(B
asel
ine)
2006
(Pos
ttest
)
2007
(One
-yea
r pos
t tria
l)
Out
com
e C
ondi
tion
M
ean
SD
p†
Mea
n SD
M
diff‡
p€
ES¥
R
I† M
ean
SD
Mdi
ff‡
p €
E
S¥
RI†
Stan
d. T
est M
athψ
(%
≥ a
vera
ge)
Con
trol
PA
76.
56
76.2
2 13
.73
11.7
2 0.
957
78.
77
82.3
3 7.
26
7.48
2.
22
6.11
0.
495
0.50
4.
9%
69
.44
75.2
2 11
.57
10.8
5 -7
.11
-1.0
0 0.
291
0.52
8.
8%
Mat
h H
CPS
II
(% p
rofic
ient
)
Con
trol
PA
15.
56
15.5
6 10
.01
7.81
1.
000
17.
44
26.5
6 9.
80
12.4
8 1.
89
10.0
0 0.
040
0.69
46
.5%
26.6
7 41
.89
7.79
15
.59
12.1
1 26
.33
0.00
6 1.
10
51.4
%
Stan
d. T
est R
eadi
ngψ
(% ≥
ave
rage
)
Con
trol
PA
71
.74
71.4
4 13
.36
13.1
2 0.
962
71
.89
77.8
9 12
.29
7.75
0.
14
6.44
0.
108
0.58
8.
8%
68
.00
74.3
3 13
.61
9.33
-3
.74
2.8
9 0.
028
0.54
9.
8%
Rea
ding
HC
PS II
(%
pro
ficie
nt)
Con
trol
PA
35.
67
34.8
9 16
.67
9.37
0.
904
37.
22
44.3
3 10
.81
10.0
0 1.
56
9.44
0.
029
0.72
21
.2%
47.7
8 56
.89
14.3
8 14
.55
12.1
1 22
.00
0.04
3 0.
65
20.7
%
Abs
ente
eism
(A
vg. d
ays a
bsen
t)
Con
trol
PA
11.
00
11.1
8 2.
27
2.66
0.
872
11.
64
10.0
1 3.
17
2.21
0.
64
-1.1
7 0.
001
-0.6
3 -1
5.5%
11.7
8 10
.17
3.07
2.
13
0.78
-1
.01
0.00
1 -0
.65
-15.
2%
Susp
ensi
ons
(% o
f stu
dent
s)
Con
trol
PA
0.
98
1.12
1.
11
1.10
0.
777
1.
72
0.67
1.
55
0.64
0.
74
-0.4
5 0.
056
-0.9
6 -6
9.4%
2.53
0.
84
2.80
0.
61
1.55
-0
.29
0.02
8 -0
.87
-72.
6%
Ret
entio
ns
(% o
f stu
dent
s)
Con
trol
PA
1.
50
1.50
0.
972
1.08
1.
000
1.
00
0.40
0.
82
0.52
-0
.50
-1.1
0 0.
313
-0.8
4 -6
0.0%
1.10
0.
30
0.88
0.
48
-0.4
0 -1
.20
0.21
0 -1
.08
-72.
7%

Impa
ct o
f the
Pos
itive
Act
ion
prog
ram
P
age
25 o
f 29
Tabl
e 5.
Sch
ool-l
evel
rand
om-in
terc
ept g
row
th m
odel
est
imat
es fo
r mat
h an
d re
adin
g ac
hiev
emen
t.
Abb
revi
atio
ns: C
= C
ontro
l; PA
= Po
sitiv
e Ac
tion
ψ Stan
dard
ized
test
scor
es in
clud
ed S
AT
(Sta
nfor
d 9)
for 2
002-
06 a
nd T
erra
Nov
a (2
nd e
d.) f
or 2
007.
† p
< .1
0; *
p <
.05;
**p
< .0
1; *
**p
< .0
01; a
ll 2-
tail
€ B e
stim
ate
base
d on
rand
om-in
terc
ept m
ode
2006
(Pos
ttest
)
Stan
d. T
est M
athψ
(P
erce
nt a
vera
ge
or b
ette
r)
M
ath
HC
PS II
(P
erce
nt p
rofic
ient
)
Stan
d. T
est
Rea
ding
ψ (P
erce
nt a
vera
ge
or b
ette
r)
R
eadi
ng H
CPS
II
(Per
cent
pro
ficie
nt)
B €
(S
E)
B €
(S
E)
B €
(S
E)
B €
(S
E)
Fixe
d ef
fect
s
Inte
rcep
t
75.7
9***
3.26
14.6
8***
2.97
71.4
8***
3.92
25.9
6***
4.68
Yea
r
0.70
0.
52
0.
77
0.47
0.25
0.
41
9.
16**
* 2.
02
Y
ear2
-
1.32
****
0.
32
C
ondi
tion
(0=C
; 1=P
A)
-2
.39
4.60
-2.5
0 4.
21
-1
.65
5.54
-2.9
2 5.
79
Y
ear x
Con
ditio
n
1.19
† 0.
73
2.
10**
0.
67
1.
49**
0.
58
2.
21**
0.
77
Rand
om e
ffect
s
Sch
ool-l
evel
var
ianc
e
69.1
3 24
.65
57
.44
20.5
0 1
21.7
9 41
.60
121
.55
42.3
0
Res
idua
l var
ianc
e
23.8
9 33
.98
20
.17
3.36
14.9
5 2.
49
26
.55
4.43
20
07 (O
ne-y
ear p
ost t
rial)
Fixe
d ef
fect
s
Inte
rcep
t
70.9
1***
3.76
20.2
1***
3.66
67.8
7***
4.08
33.1
8***
4.00
Y
ear
5.
49**
* 1.
48
-4
.28**
1.
50
3.
50**
1.
09
1.
96**
* 0.
47
Y
ear2
-0
.90**
* 0.
20
0.
89**
* 0.
21
-0
.57**
* 0.
15
Con
ditio
n (0
=C; 1
=PA)
-2.7
3 4.
41
-3
.87
4.41
-1.3
3 5.
43
-1
.14
5.66
Yea
r x C
ondi
tion
1.
34*
0.59
2.69
***
0.60
1.35
**
0.44
2.10
**
0.66
Rand
om e
ffect
s
Sch
ool-l
evel
var
ianc
e
71.6
3 25
.41
62
.67
22.4
9 1
19.6
2 40
.70
121
.72
40.8
5
Res
idua
l var
ianc
e
27.4
8 4.
10
28
.55
4.26
14.9
1 2.
22
35
.09
5.22

Impa
ct o
f the
Pos
itive
Act
ion
prog
ram
P
age
26 o
f 29
Tabl
e 6.
Sch
ool-l
evel
rand
om-in
terc
ept g
row
th m
odel
est
imat
es fo
r abs
ente
eism
, sus
pens
ions
, ret
entio
ns.
2006
(Pos
ttest
)
Abs
ente
eism
(A
vera
ge d
ays
abse
nt/y
ear)
Su
spen
sion
s (P
erce
nt su
spen
ded)
Ret
entio
ns
(Per
cent
reta
ined
)
B €
(S
E)
B
‡ (S
E)
IRR
¥ (C
I)
B ‡
(S
E)
IRR
¥
(C
I)
Fixe
d ef
fect
s
In
terc
ept
11
.56**
* 0.
80
-0
.15
0.38
0.54
0.
34
Y
ear
-0
.54*
0.27
0.12
0.
09
1.13
(0
.37,
3.6
2)
-0
.13
0.09
0.
88
(0.7
4, 1
.06)
Yea
r2
0.11
**
0.04
Con
ditio
n (0
=C; 1
=PA)
0.47
1.
04
0.
15
0.58
1.
16
(0.9
5, 1
.35)
0.32
0.
50
1.37
(0
.52,
3.6
4)
Y
ear x
Con
ditio
n
-0.4
5***
0.10
-0.2
8† 0.
16
0.76
† (0
.56,
1.0
3)
-0
.30*
0.16
0.
74*
(0.5
4, 1
.00)
Ra
ndom
effe
cts
Sch
ool-l
evel
var
ianc
e
4.85
1.
57
0.
44
0.22
0.
44
(0.1
6, 1
.18)
0.32
0.
18
0.32
(0
.10,
0.9
7)
R
esid
ual v
aria
nce
0.
54
0.09
20
07 (O
ne-y
ear p
ost t
rial)
Fixe
d ef
fect
s
Inte
rcep
t
11.5
2***
0.78
0.49
0.
50
0.
45
0.31
Yea
r
-0.4
5* 0.
20
-0
.39
0.26
0.
68
(0.4
0, 1
.14)
-0.0
8 0.
07
0.92
(0
.80,
1.0
5)
Y
ear2
0.
09**
* 0.
03
0.
08*
0.04
1.
08*
(1.0
1, 1
.16)
C
ondi
tion
(0=C
; 1=P
A)
0.
28
1.05
-0.0
5 0.
54
0.95
(0
.33,
2.7
1)
0.
32
0.47
1.
38
(0.5
5, 3
.43)
Yea
r x C
ondi
tion
-0
.36**
* 0.
08
-0
.20†
0.10
0.
82†
(0.6
7, 1
.01)
-0.3
0* 0.
12
0.74
* (0
.58,
0.9
5)
Rand
om e
ffect
s
S
choo
l-lev
el v
aria
nce
5.
01
1.61
0.54
0.
23
0.54
(0
.24,
1.2
3)
0.
32
0.18
0.
32
(0.1
1, 0
.94)
Res
idua
l var
ianc
e
0.54
0.
08
Abb
revi
atio
n: C
= C
ontro
l; PA
= Po
sitiv
e Ac
tion;
IRR
= in
cide
nce
rate
ratio
; CI=
95%
con
fiden
ce in
terv
al
† p <
.10;
* p
< .0
5; *
*p <
.01;
***
p <
.001
; all
2-ta
il € B
est
imat
e ba
sed
on ra
ndom
-inte
rcep
t mod
el
‡ B e
stim
ate
base
d on
rand
om-in
terc
ept P
oiss
on m
odel
¥ IR
R e
stim
ate
base
d on
rand
om-in
terc
ept P
oiss
on m
odel

Impa
ct o
f the
Pos
itive
Act
ion
prog
ram
P
age
27 o
f 29
Figu
re 1
: Sch
ool-l
evel
mea
ns fo
r mat
h an
d re
adin
g ac
hiev
emen
t.*
*H
awai
’i R
ando
miz
ed T
rial o
ccur
red
2002
-03
to 2
005-
06
‡ Stan
dard
ized
test
scor
es in
clud
ed S
AT
(Sta
nfor
d 9)
for 2
002-
06 a
nd T
erra
Nov
a (2
nd e
d.) f
or 2
007.

Impa
ct o
f the
Pos
itive
Act
ion
prog
ram
P
age
28 o
f 29
Figu
re 2
. Sch
ool-l
evel
mea
ns fo
r abs
ente
eism
, sus
pens
ions
, and
rete
ntio
n.*
*H
awai
`i R
ando
miz
ed T
rial o
ccur
red
2002
-03
to 2
005-
06

Impa
ct o
f the
Pos
itive
Act
ion
prog
ram
P
age
29 o
f 29
APP
EN
DIX
A
1. R
ando
m in
terc
ept m
ixed
line
ar m
odel
s:
a. R
ando
m-in
terc
ept m
odel
b. R
ando
m-in
terc
ept q
uadr
atic
mod
el
estim
ated
out
com
e m
ean
inte
rcep
t ra
ndom
inte
rcep
t le
vel-1
resi
dual
2.
Ran
dom
-inte
rcep
t Poi
sson
mod
els:
Th
e es
timat
ed o
utco
me,
, i
s ass
umed
to h
ave
a Po
isso
n di
strib
utio
n w
ith e
xpec
tatio
n .
a. R
ando
m-in
terc
ept P
oiss
on m
odel
b. R
ando
m-in
terc
ept P
oiss
on q
uadr
atic
mod
el
m
ean
rate
at w
hich
out
com
e oc
curs
.