Impact Indicators for the 21 st Century
31
Impact Indicators for the 21 st Century Susan E. Cozzens Director, Technology Policy and Assessment Center School of Public Policy, Georgia Institute of Technology [email protected] Presented at “Workshop on Measuring the Impacts of Science,” Montreal, June 17-18, 2004
-
Upload
odessa-kaufman -
Category
Documents
-
view
27 -
download
1
description
Impact Indicators for the 21 st Century. Susan E. Cozzens Director, Technology Policy and Assessment Center School of Public Policy, Georgia Institute of Technology [email protected] Presented at “Workshop on Measuring the Impacts of Science,” Montreal, June 17-18, 2004. - PowerPoint PPT Presentation
Transcript of Impact Indicators for the 21 st Century

Impact Indicators for the 21st Century
Susan E. CozzensDirector, Technology Policy and Assessment Center
School of Public Policy, Georgia Institute of [email protected]
Presented at “Workshop on Measuring the Impacts of Science,” Montreal, June 17-18, 2004

Cozzens Impacts, Montreal, June, 2004 2
History of S&T Indicators Started in mid-1970s to give overview of the
S&T system Looking under the lamp-post
Lots of input indicators – funding, people Special development efforts were needed for output
indicators – e.g., publications. Indicators of technology-based business and trade
have grown over time. Public attitudes data also developed specially, and
now have appeared in many volumes. “Impact of science on society” – focus on
broad-scale changes, intended and unintended
Cozzens Impacts, Montreal, June, 2004 3
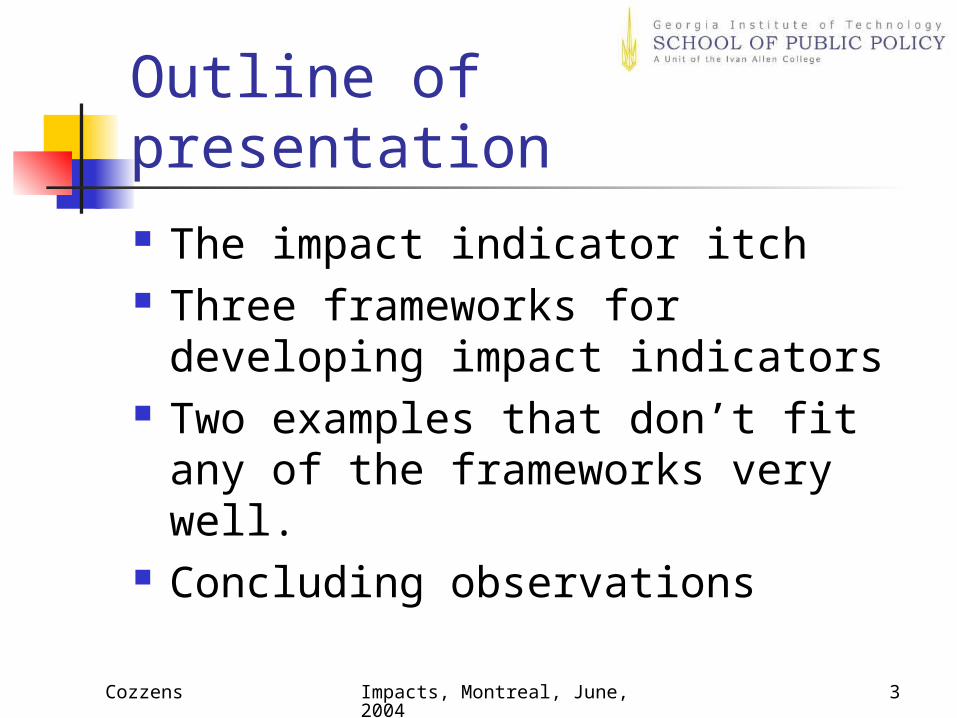
Outline of presentation The impact indicator itch Three frameworks for developing
impact indicators Two examples that don’t fit any of
the frameworks very well. Concluding observations
Cozzens Impacts, Montreal, June, 2004 4
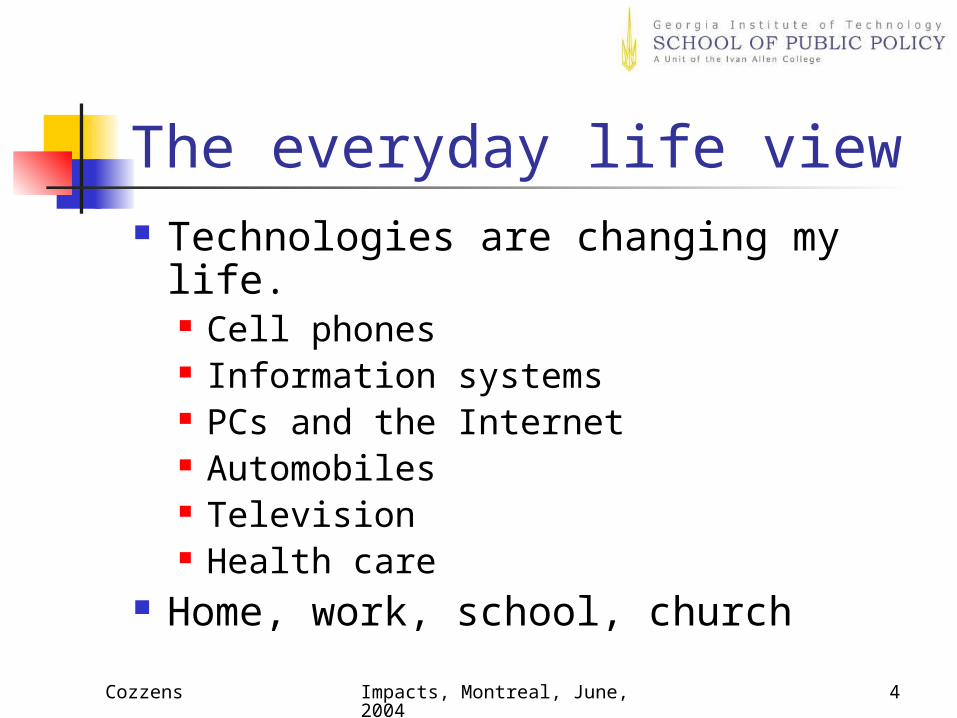
The everyday life view Technologies are changing my life.
Cell phones Information systems PCs and the Internet Automobiles Television Health care
Home, work, school, church
Cozzens Impacts, Montreal, June, 2004 5
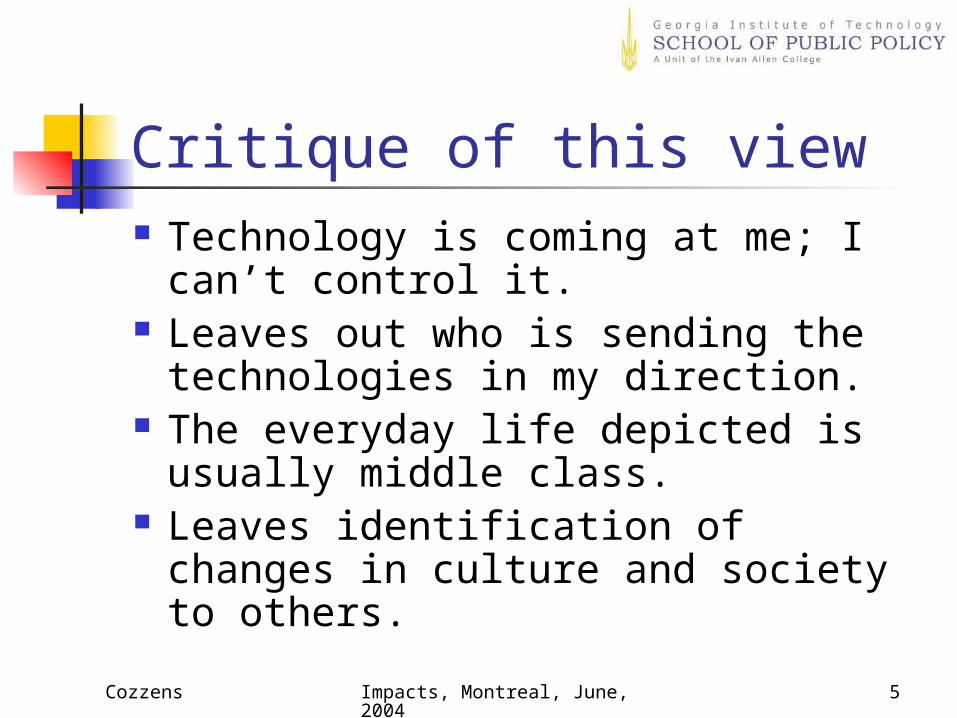
Critique of this view Technology is coming at me; I
can’t control it. Leaves out who is sending the
technologies in my direction. The everyday life depicted is
usually middle class. Leaves identification of changes in
culture and society to others.
Cozzens Impacts, Montreal, June, 2004 6
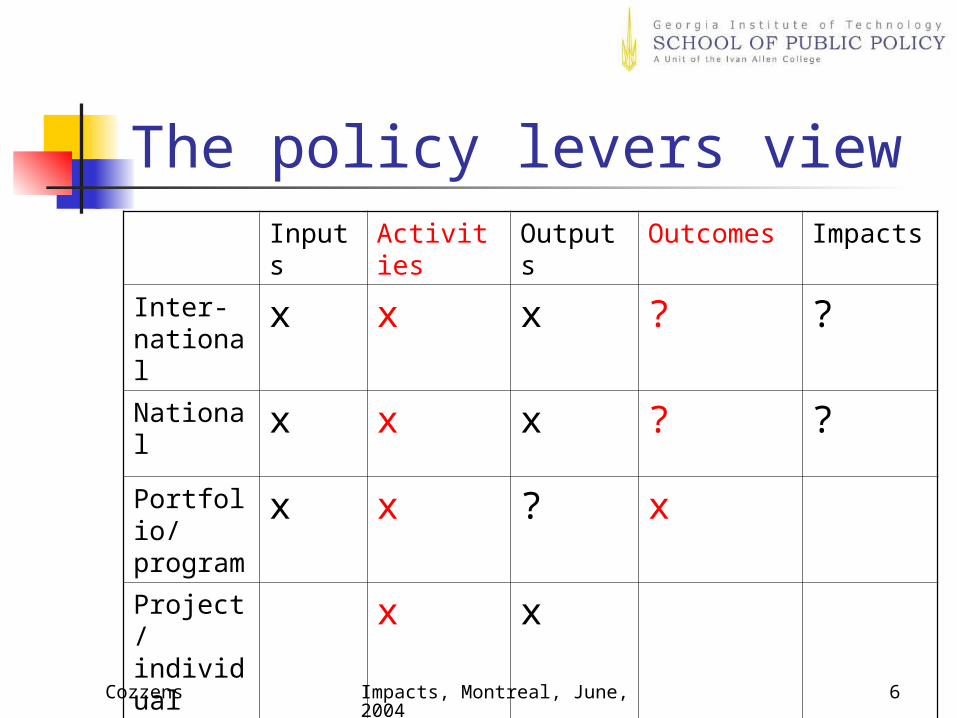
The policy levers viewInputs Activities Outputs Outcomes Impacts
Inter-national
x x x ? ?
National x x x ? ?Portfolio/program
x x ? x
Project/ individual
x x
Cozzens Impacts, Montreal, June, 2004 7
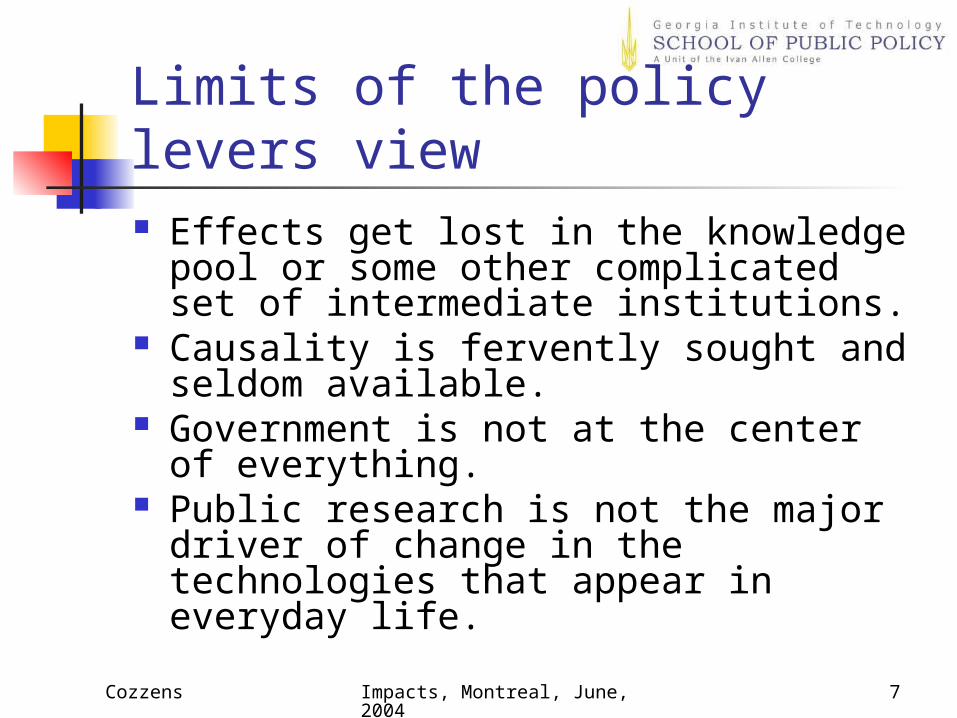
Limits of the policy levers view Effects get lost in the knowledge pool or
some other complicated set of intermediate institutions.
Causality is fervently sought and seldom available.
Government is not at the center of everything.
Public research is not the major driver of change in the technologies that appear in everyday life.

Cozzens Impacts, Montreal, June, 2004 8
Logic Model View
Research
Commercialization
Public Goals and
Strategies
Public Benefits
and Costs
Private Benefits
and Costs
Private G&S

Cozzens Impacts, Montreal, June, 2004 9
One Logic Model for Biotech
Development Goals
Programs and policies
Public R&D
Infrastructure
Germ plasm collections
Private sector
Ag
Health
Environment
Biosafety
Incentives
Biodiversity
Reduce input demands
Employment
Alliances
Market size
Clinical trials
Low-cost vaccine production
TRADE
E.g. Ha planted
Quantity produced
SOCIAL ATTITUDES
Access to life-saving drugs
Food security
Cozzens Impacts, Montreal, June, 2004 10
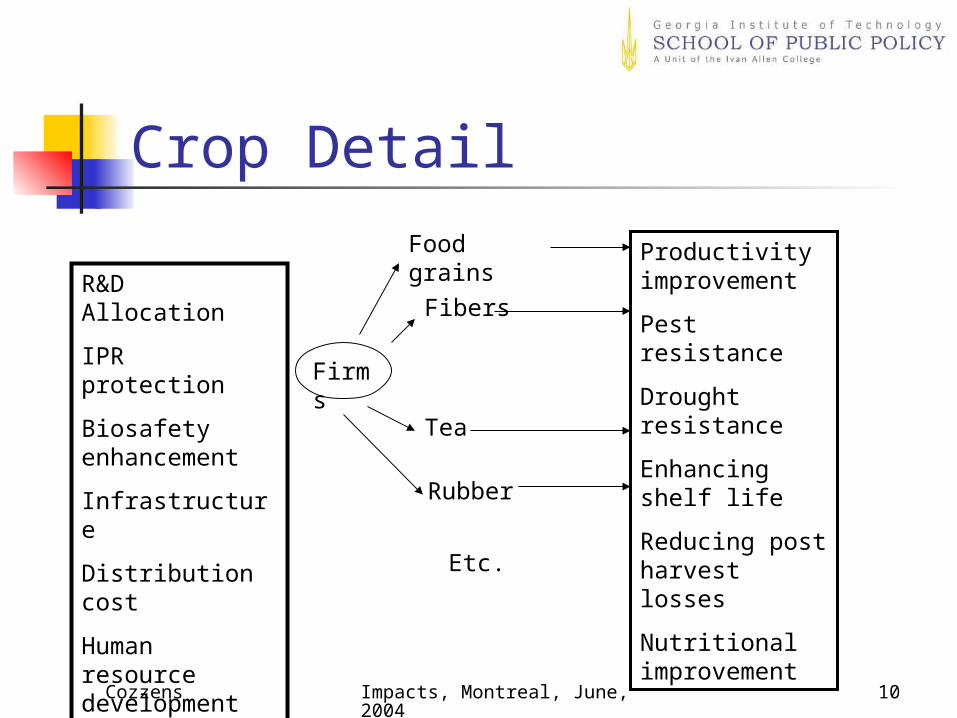
Crop Detail
Firms
Food grains
Fibers
Tea
Rubber
Etc.
R&D Allocation
IPR protection
Biosafety enhancement
Infrastructure
Distribution cost
Human resource development
Productivity improvement
Pest resistance
Drought resistance
Enhancing shelf life
Reducing post harvest losses
Nutritional improvement

Cozzens Impacts, Montreal, June, 2004 11
Pros and cons of logic model view
Allows two-ways flows and feedback loops.
Can incorporate multiple dimensions, e.g., for policy or public context.
Points to things to measure; still hard to communicate the relationships.
Works best at sectoral level; hard to apply at national or international levels.
Puts everything in boxes.
Cozzens Impacts, Montreal, June, 2004 12
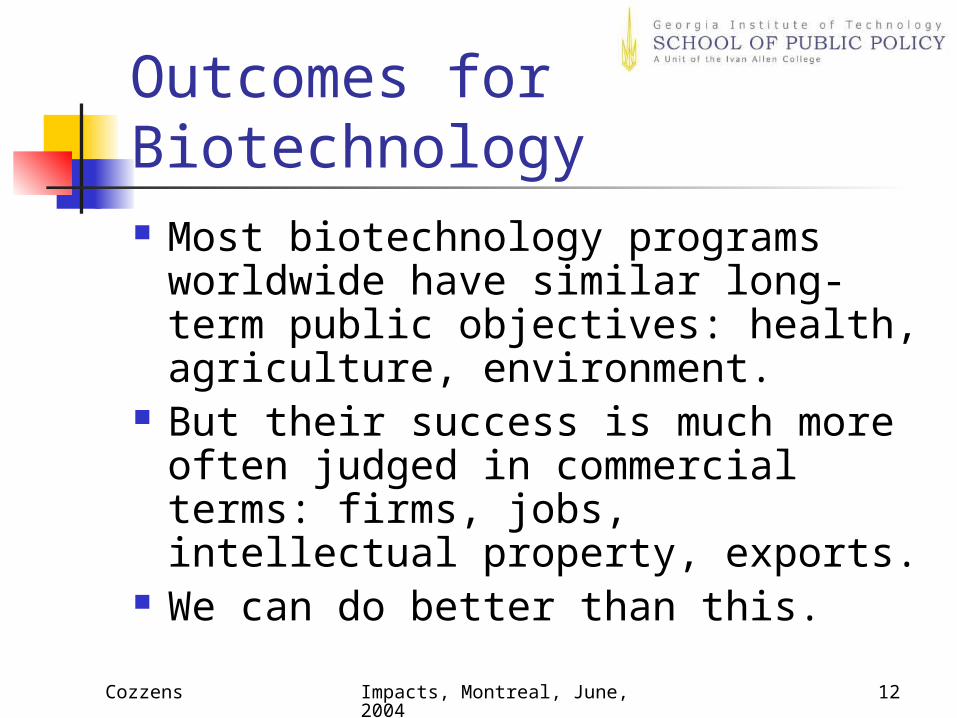
Outcomes for Biotechnology Most biotechnology programs
worldwide have similar long-term public objectives: health, agriculture, environment.
But their success is much more often judged in commercial terms: firms, jobs, intellectual property, exports.
We can do better than this.
Cozzens Impacts, Montreal, June, 2004 13
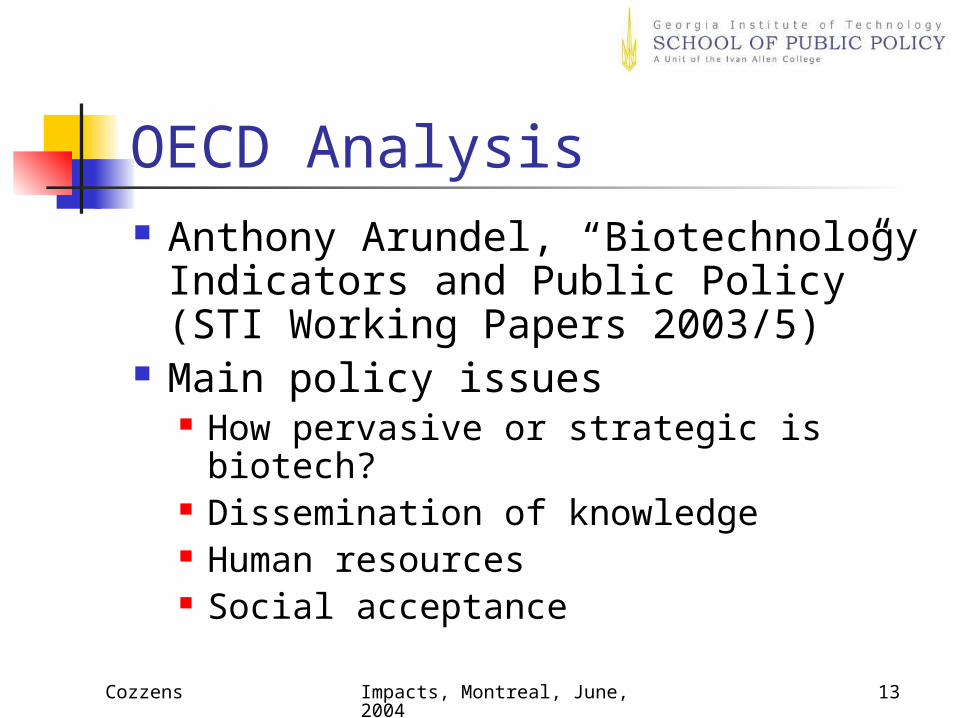
OECD Analysis Anthony Arundel, “Biotechnology
Indicators and Public Policy” (STI Working Papers 2003/5)
Main policy issues How pervasive or strategic is biotech? Dissemination of knowledge Human resources Social acceptance
Cozzens Impacts, Montreal, June, 2004 14
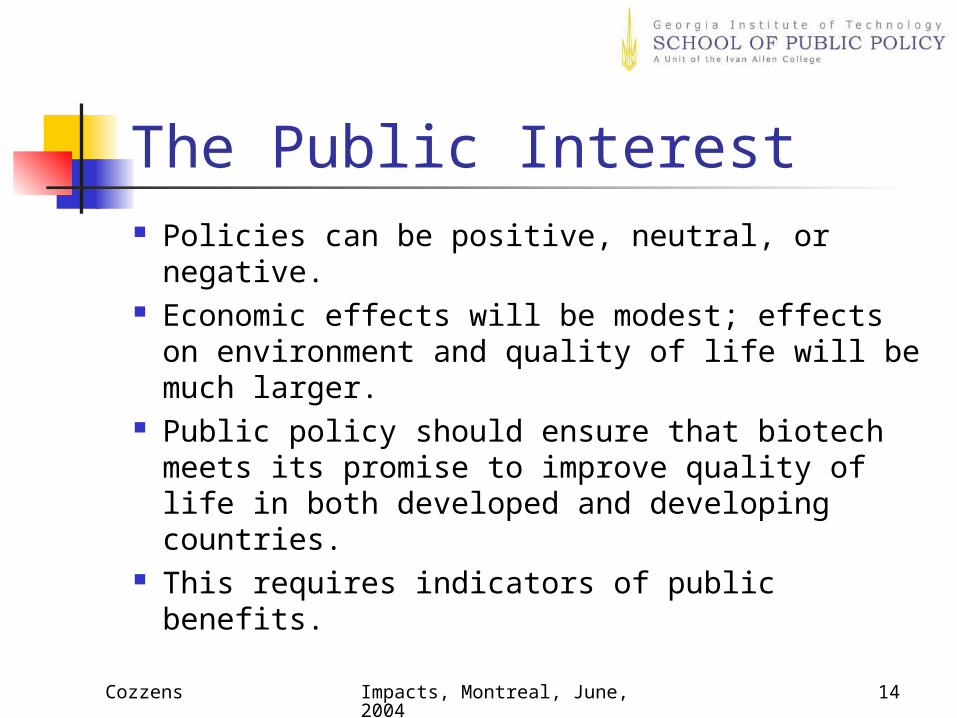
The Public Interest Policies can be positive, neutral, or negative. Economic effects will be modest; effects on
environment and quality of life will be much larger.
Public policy should ensure that biotech meets its promise to improve quality of life in both developed and developing countries.
This requires indicators of public benefits.

Cozzens Impacts, Montreal, June, 2004 15
An Example of Closing the Loop
Public sector research focuses much more than private sector on quality traits. Increase public sector investment. Find out why private sector is not
interested.
Cozzens Impacts, Montreal, June, 2004 16
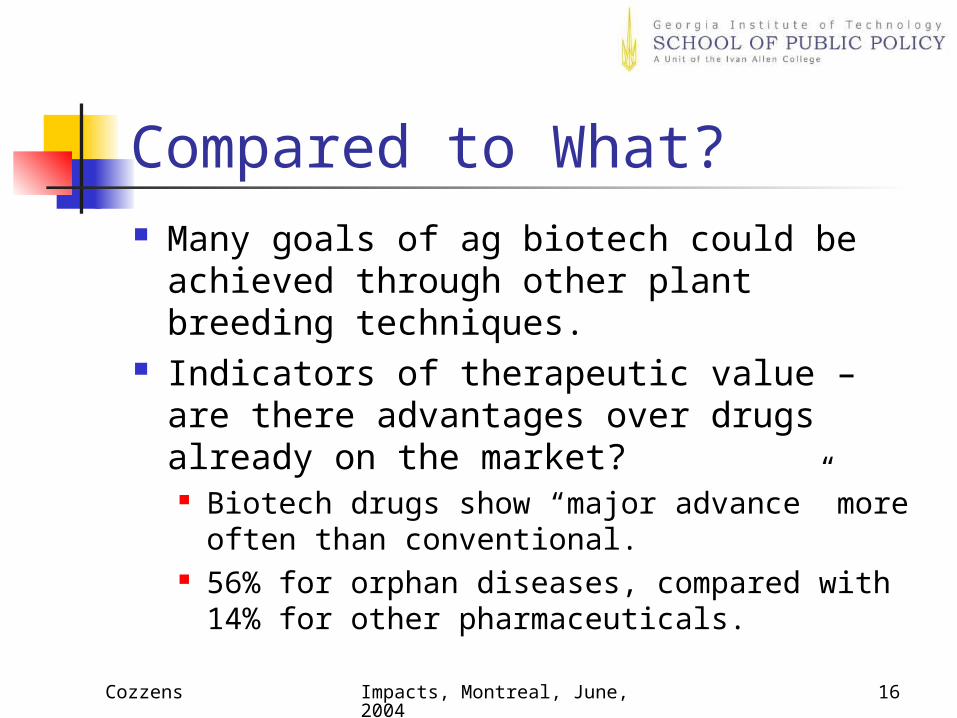
Compared to What? Many goals of ag biotech could be
achieved through other plant breeding techniques.
Indicators of therapeutic value – are there advantages over drugs already on the market? Biotech drugs show “major advance” more
often than conventional. 56% for orphan diseases, compared with 14%
for other pharmaceuticals.
Cozzens Impacts, Montreal, June, 2004 17
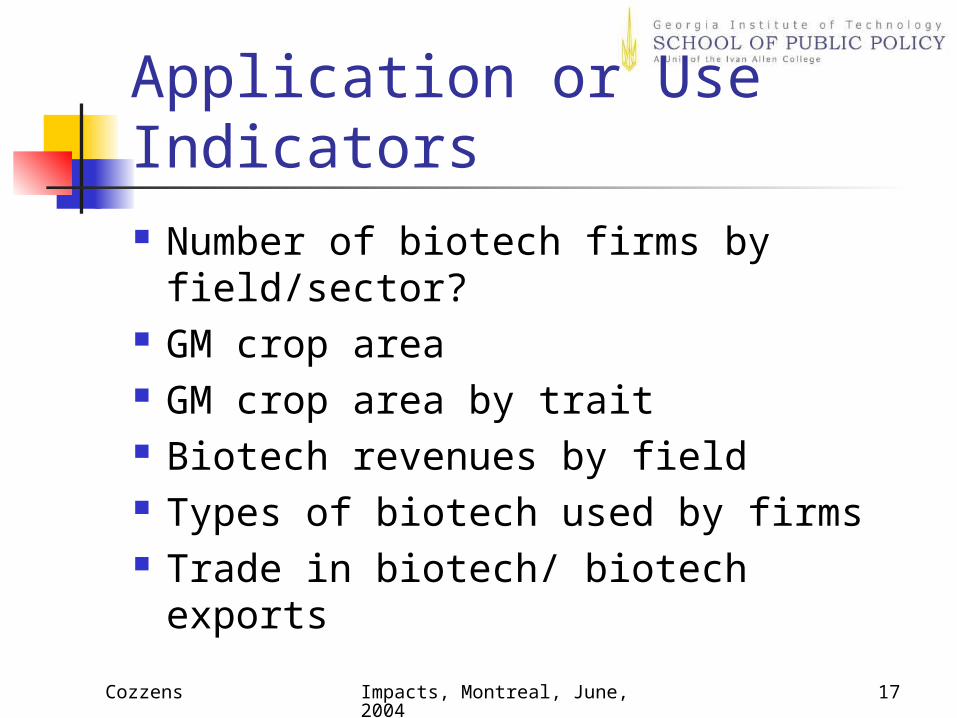
Application or Use Indicators Number of biotech firms by
field/sector? GM crop area GM crop area by trait Biotech revenues by field Types of biotech used by firms Trade in biotech/ biotech exports
Cozzens Impacts, Montreal, June, 2004 18
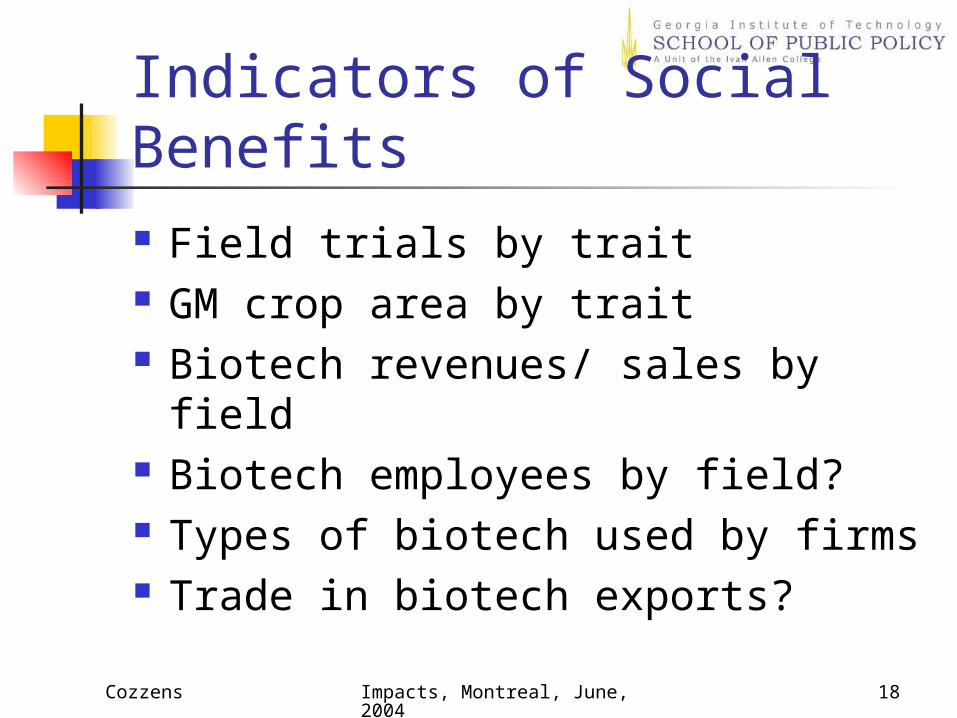
Indicators of Social Benefits Field trials by trait GM crop area by trait Biotech revenues/ sales by field Biotech employees by field? Types of biotech used by firms Trade in biotech exports?
Cozzens Impacts, Montreal, June, 2004 19
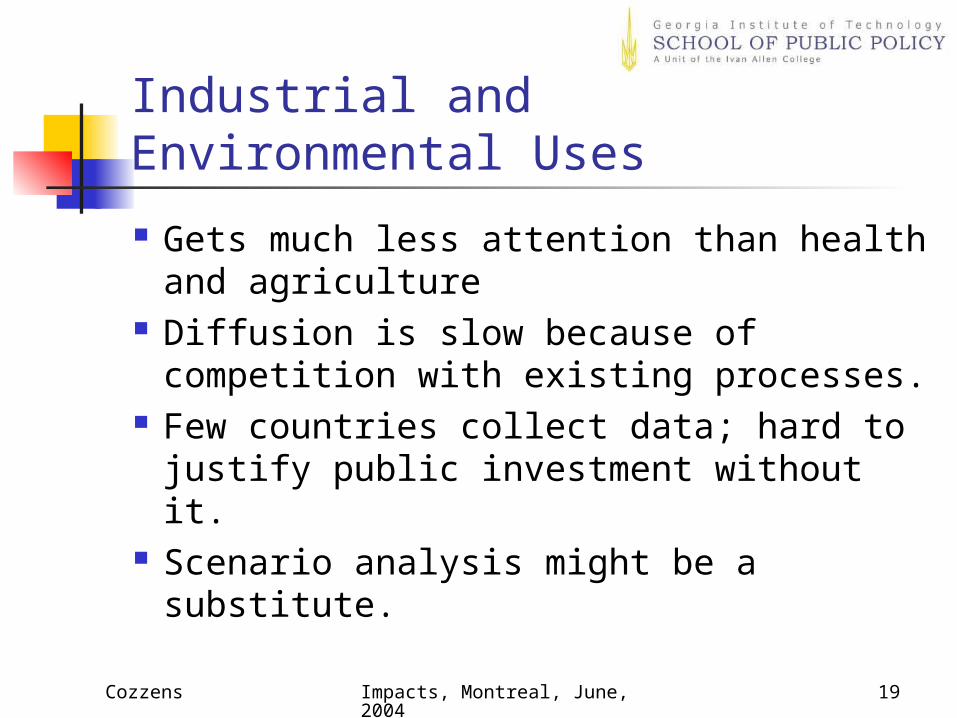
Industrial and Environmental Uses
Gets much less attention than health and agriculture
Diffusion is slow because of competition with existing processes.
Few countries collect data; hard to justify public investment without it.
Scenario analysis might be a substitute.

Cozzens Impacts, Montreal, June, 2004 20
A Latin American Example Trigo, Traxler, Pray, Echeverria, “Agricultural
Biotechnology and Rural Development in Latin America and the Caribbean,” Inter-American Development Bank, 2000
Concentrates on potential to benefit consumers and producers
Most important contribution will be expanding production in major crops without increasing pressure on fragile environments.

Cozzens Impacts, Montreal, June, 2004 21
Expected Benefits Improve competitiveness in world markets Reduce incidence of urban and rural poverty Improve yield potential and stability Increase disease and pest resistance and
support integrated pest management, lessening pesticide use
Reduce pressure to expand cultivated areas Improve nutritional value of food crops
Cozzens Impacts, Montreal, June, 2004 22
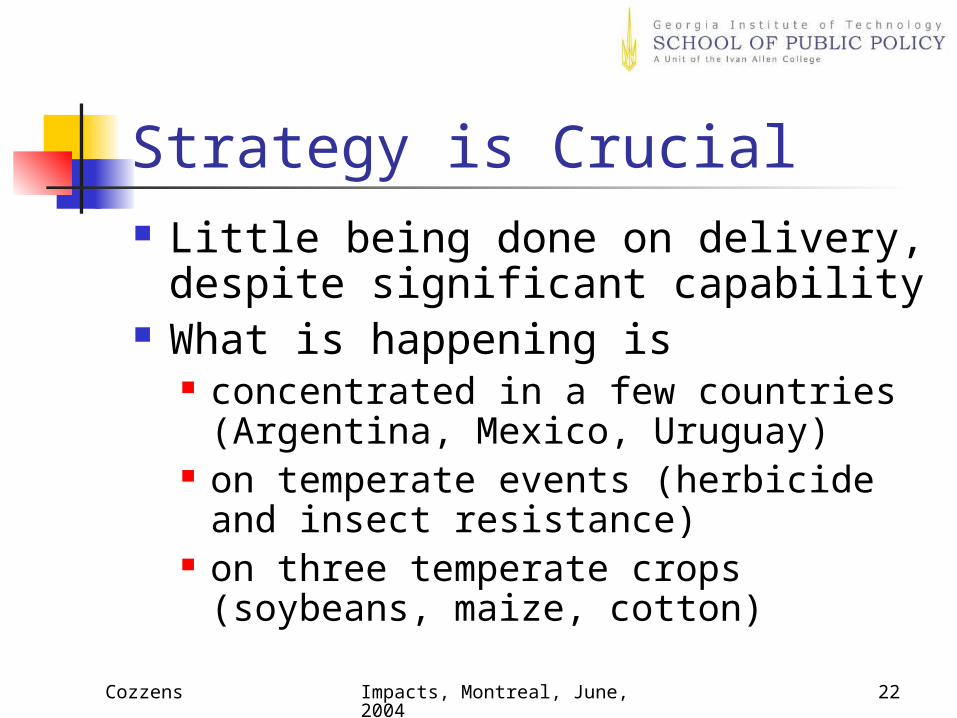
Strategy is Crucial Little being done on delivery,
despite significant capability What is happening is
concentrated in a few countries (Argentina, Mexico, Uruguay)
on temperate events (herbicide and insect resistance)
on three temperate crops (soybeans, maize, cotton)
Cozzens Impacts, Montreal, June, 2004 23
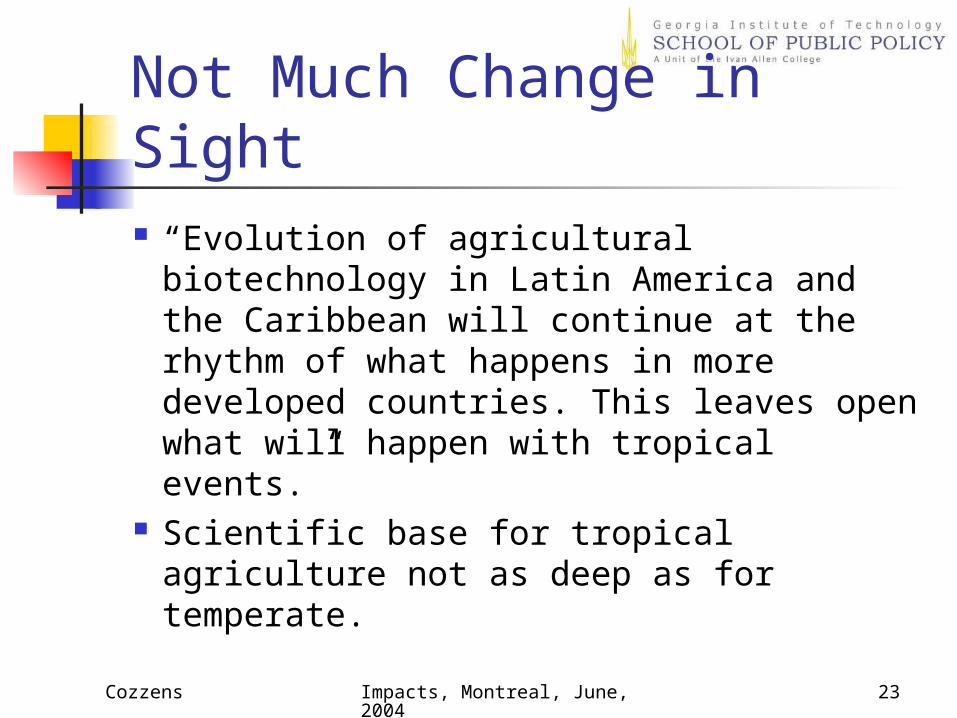
Not Much Change in Sight “Evolution of agricultural
biotechnology in Latin America and the Caribbean will continue at the rhythm of what happens in more developed countries. This leaves open what will happen with tropical events.”
Scientific base for tropical agriculture not as deep as for temperate.
Cozzens Impacts, Montreal, June, 2004 24
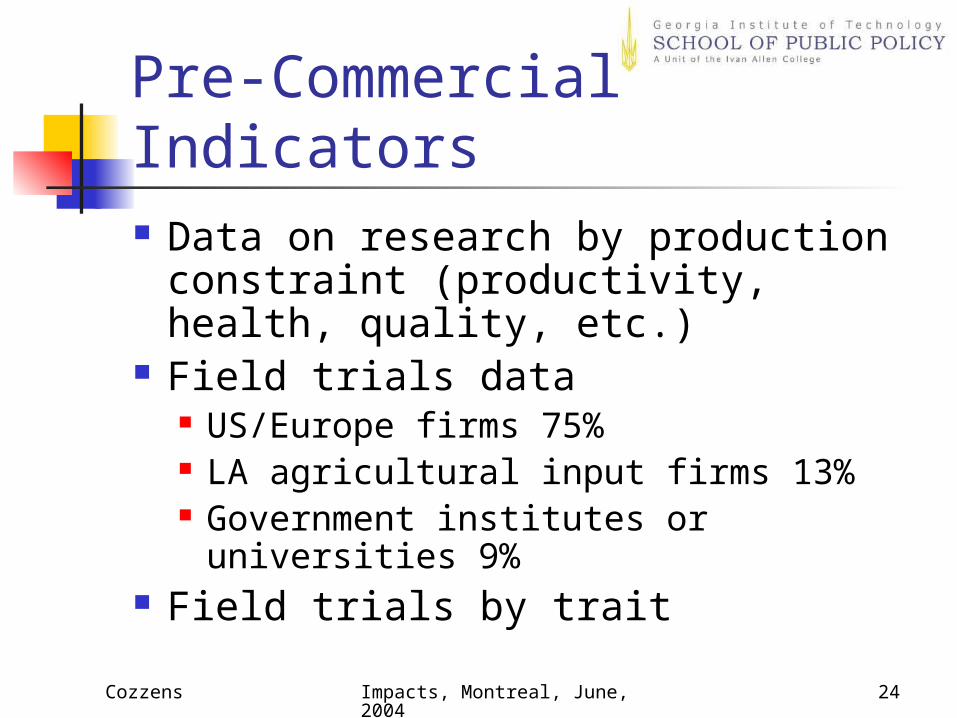
Pre-Commercial Indicators Data on research by production
constraint (productivity, health, quality, etc.)
Field trials data US/Europe firms 75% LA agricultural input firms 13% Government institutes or universities
9% Field trials by trait
Cozzens Impacts, Montreal, June, 2004 25
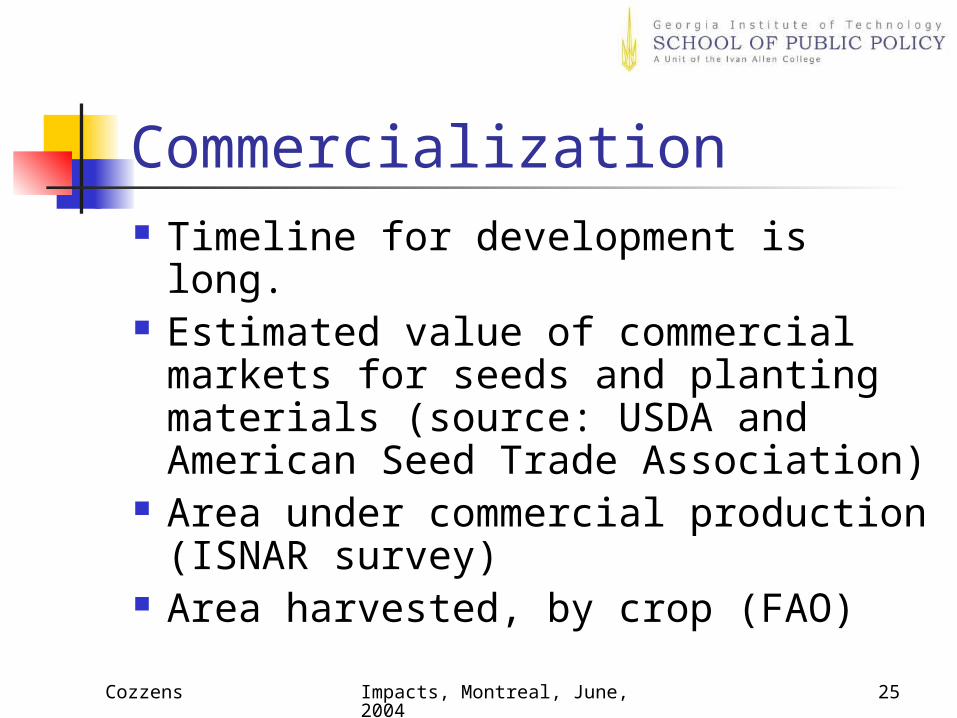
Commercialization Timeline for development is long. Estimated value of commercial
markets for seeds and planting materials (source: USDA and American Seed Trade Association)
Area under commercial production (ISNAR survey)
Area harvested, by crop (FAO)
Cozzens Impacts, Montreal, June, 2004 26
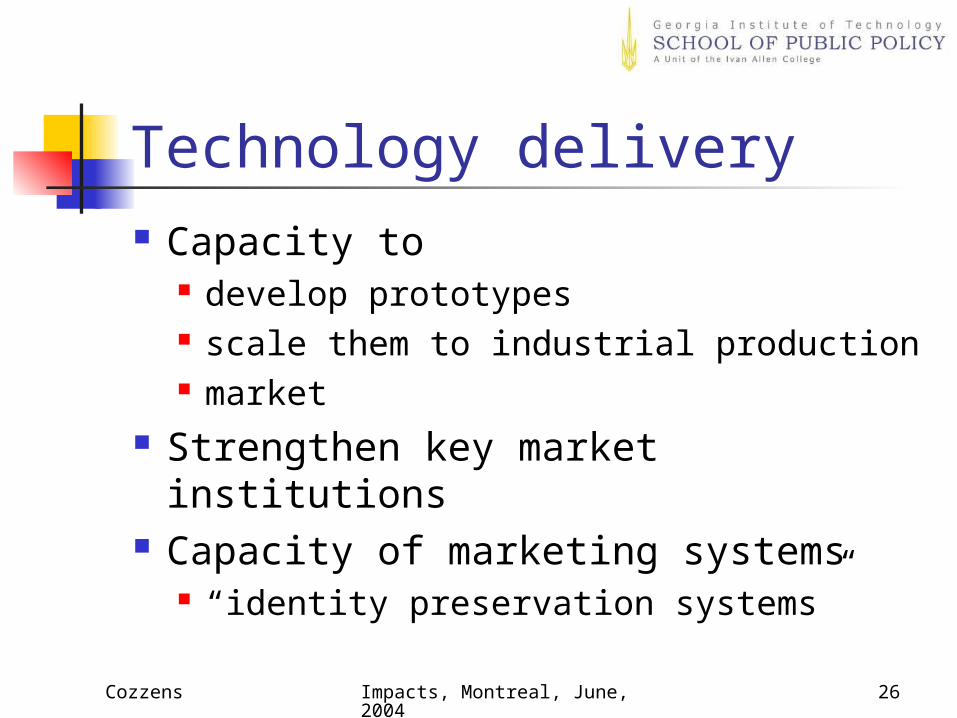
Technology delivery Capacity to
develop prototypes scale them to industrial production market
Strengthen key market institutions Capacity of marketing systems
“identity preservation systems”
Cozzens Impacts, Montreal, June, 2004 27
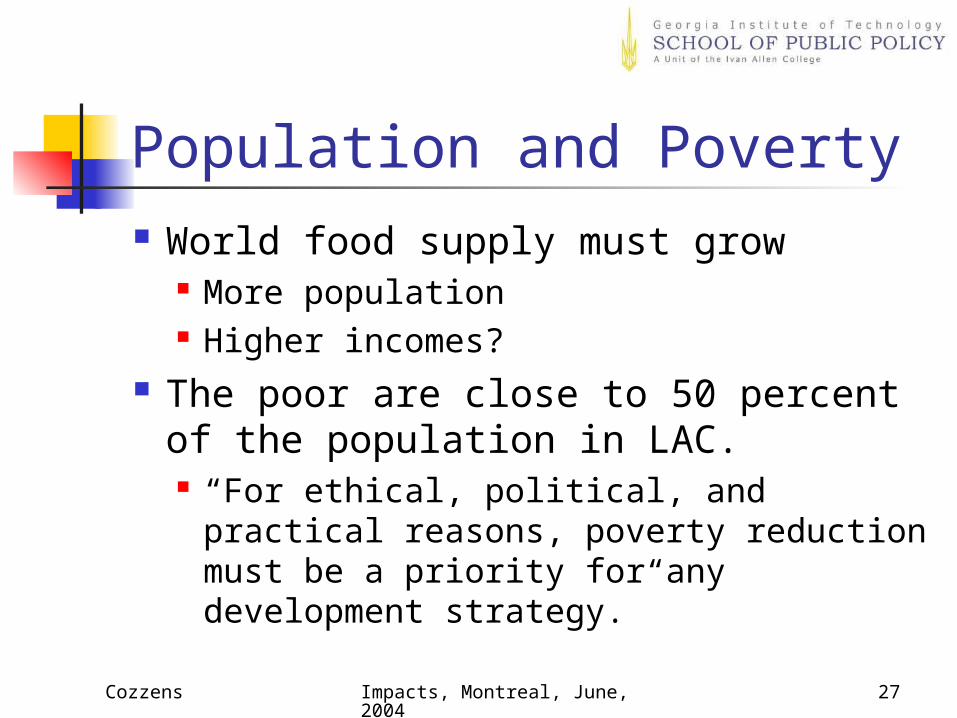
Population and Poverty World food supply must grow
More population Higher incomes?
The poor are close to 50 percent of the population in LAC. “For ethical, political, and practical
reasons, poverty reduction must be a priority for any development strategy.”

Cozzens Impacts, Montreal, June, 2004 28
How can biotechnology help? Urban poor benefit from lower food prices and
improved nutritional and health characteristics of food.
For the rural poor, benefits will concentrate on those in better endowed areas who are already in the market for technological inputs.
Some benefits will come from cash crops like cotton, cacao, coffee, where small farmers are involved.
Landless or subsistence farmers will benefit only through multiplier effect.

Cozzens Impacts, Montreal, June, 2004 29
Strategy is crucial again Main priorities have been to reduce
production costs in high productivity areas.
In the meantime, inequality increases.
“… the direction and intensity of public investments in biotechnology will play a critical role in how benefits reach small farmers.”

Cozzens Impacts, Montreal, June, 2004 30
In summary… Much fuller logic models are out there,
waiting to be extracted from the literature.
Indicators for outcomes do exist, although they are sparse and imperfect.
Without an indicator system that includes public goals and public benefits, strategic orientation is not possible.
Cozzens Impacts, Montreal, June, 2004 31
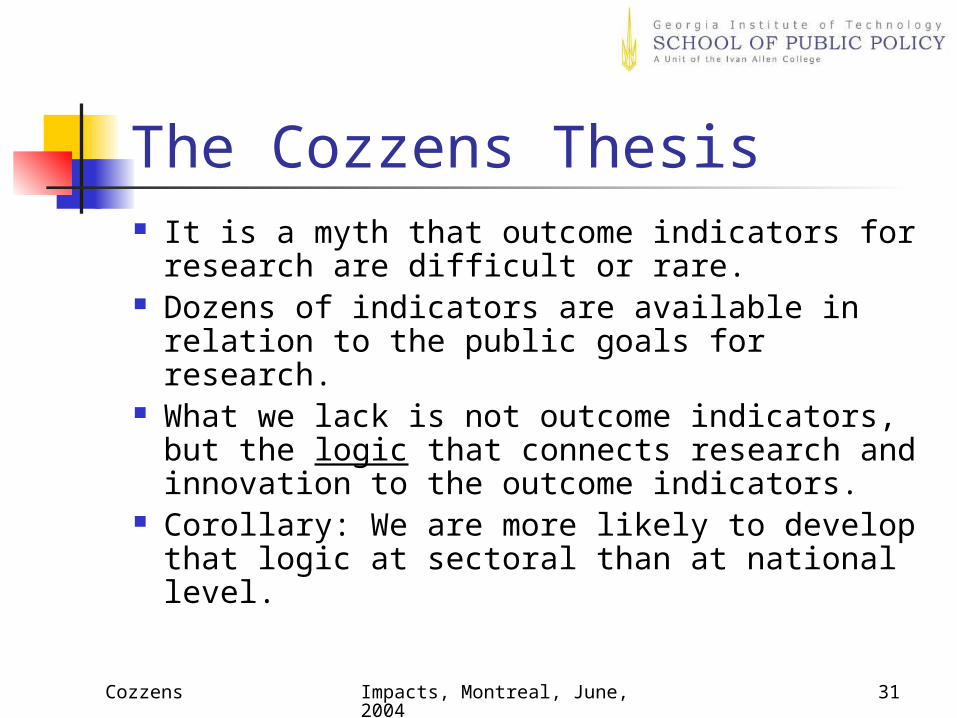
The Cozzens Thesis It is a myth that outcome indicators for
research are difficult or rare. Dozens of indicators are available in
relation to the public goals for research. What we lack is not outcome indicators,
but the logic that connects research and innovation to the outcome indicators.
Corollary: We are more likely to develop that logic at sectoral than at national level.