IMPACT GREATER FAYETTEVILLE
206
IMPACT GREATER FAYETTEVILLE Regional Impact Analysis for Reduction of Personnel at Fort Bragg and Recommendations for Economic Diversification in Cumberland, Hoke, and Harnett Counties May 2017 Sponsor Consulting Team
Transcript of IMPACT GREATER FAYETTEVILLE

IMPACT GREATER FAYETTEVILLE
Regional Impact Analysis for Reduction of Personnel at Fort Bragg and Recommendations for Economic Diversification in
Cumberland, Hoke, and Harnett Counties
May 2017
Sponsor
Consulting Team

Impact Greater Fayetteville
1
IMPACT GREATER FAYETTEVILLE Regional Impact Analysis for Reduction of Personnel at Fort Bragg and Recommendations for Economic Diversification in
Cumberland, Hoke, and Harnett Counties
Submitted to the City of Fayetteville Prepared by Fayetteville State University, School of Business and Economics Dr. Pamela Jackson, Dean, School of Business and Economics Mr. Greg McElveen, Assistant to the Dean for Strategic Initiatives, School of Business and Economics Dr. Inder Nijhawan, Professor Emeritus of Economics, School of Business and Economics Dr. Thomas G. E. Williams, Professor of Finance, School of Business and Economics Mr. Tim Moore, Director, Community Engagement, School of Business and Economics Creative Economic Development Consulting, LLC Crystal Morphis, CEcD, Founder and CEO Penny Whiteheart, Senior Consultant Leigh Howe, Applied Marketing, Partner May 2017

Impact Greater Fayetteville
2
Acknowledgements We gratefully acknowledge the valuable contributions of the members of the Steering Committee and the participants in the community input meetings. This study benefitted greatly from their insights, constructive suggestions, and guidance. We also owe a debt of gratitude to Col. Douglas Brown, Department of Defense, Office of Economic Adjustment, for his sagacious advice and assistance in obtaining critical military data for economic impact analysis. Errors, if any, are ours. The study was funded by the Department of Defense, Office of Economic Adjustment, through the City of Fayetteville. Our special thanks to Mrs. Patricia Tyson, Senior Project Manager, for overseeing and coordinating the project.

Impact Greater Fayetteville
3
Table of Contents
Executive Summary 4 Introduction 8 Steering Committee 10 Community Input Sessions Summary-SWOT Analysis 11 Economic Landscape 16 Troop Reduction Scenarios 39 Potential Economic Impact of Further Troop Reductions 41 Target Sectors 48 Workforce Development Strategy 53 Economic Development Strategy 63 Implementation Plan 72 Appendices
A: Steering Committee Members and Consulting Team 74 B: Economic Profile Background Data 76 C: Economic Impact Model Assumptions, Methodology, 105 and Supplementary Results D: Target Sector Analysis: Supporting Analytics and Data 115 E: Target Sector Analysis: Industry Profiles 130 F: Workforce Development Background/Supplemental 173 Data and Resources
G: Harnett County Population Distribution 202
References 204

Impact Greater Fayetteville
4
Executive Summary The City of Fayetteville was awarded a grant from the Department of Defense Office of Economic Adjustment (OEA) to determine the prospective regional impact of troop reductions at Fort Bragg and to develop strategies to drive growth to offset military reductions. The counties included in the scope of the grant are Cumberland, Hoke, and Harnett. The grant was a result of a 2015 Army announcement of a planned reduction of 40,000 active duty U.S. military personnel over the next few years. The City of Fayetteville contracted with Creative Economic Development Consulting and Fayetteville State University to assess potential impacts associated with a range of prospective scenarios with respect to Fort Bragg troop strength. The FSU/Creative EDC team gathered input from regional leaders, analyzed the regional economic landscape, developed alternative personnel change scenarios, used Economic Impact Analysis for Planning software (IMPLAN) to determine potential economic impacts, identified industries with highest potential for growth, compared peer cities and similar military installations, and created economic and workforce development strategies to leverage opportunities and mitigate risks associated with the region’s high economic dependence on Fort Bragg. The consulting team facilitated community input meetings, one in each county and in the City of Fayetteville, to hear the potential impacts a reduction at the base will have on the community. The communities of Hoke, Harnett, and Cumberland, and the city of Fayetteville are very different. However, Fort Bragg and the attendant population not only create unique opportunities and benefits, but also create unique challenges and uncertainties. The communities want to see strategies for infrastructure improvements, education and workforce development, small business and entrepreneur development, business recruitment, regional action, and transportation improvements. The study team examined economic output data, population size and composition, employment levels, educational attainment of the workforce, income levels, veteran presence in the population and their characteristics, and the housing stock, to understand the current economic landscape of the region. The military is clearly the key economic
Each 100 active duty military jobs in the region support as many as 60 other jobs (including
civilians at Fort Bragg); each active duty military job can support an average of as much as
$90,000 in labor income—representing soldier income plus income for a soldier’s share of
supported jobs.
With a new administration, future changes in the level of military personnel are uncertain,
but analysis indicates that the region’s economic prosperity has already been
impacted by reductions in military presence of approximately 10% at Fort Bragg from
peak levels. As a result, the region’s overall economic output has been declining since 2012, while economic activity in the state
and the nation has, on average, been rising.

Impact Greater Fayetteville
5
driver for the region, accounting for approximately 31% of the total value of goods and services produced in the Fayetteville Metropolitan Statistical Area (consisting of Cumberland and Hoke Counties), although that figure has been declining at a rate of 2-4% per year in real terms. As a result, the region’s overall economic output has been declining since 2012, while economic activity in the state and the nation has, on average, been rising. Aside from the military, the region is highly dependent upon public sector, education, and health care related jobs. Another hurdle for economic growth has been the limited presence of innovation-driven industry—together with a below average proportion of the workforce that has the skills and education needed by the companies that are powering future growth. On the other hand, the data show that military veterans, educational institutions, transportation, location, and cost of living are some of the region’s greatest assets. Population increases fuel workforce growth, and while the population in Harnett and Hoke Counties has continued to grow, Cumberland County’s population growth has slightly declined. There are two main purposes of this study: 1) to quantify the economic impact of potential
changes in troop levels at Fort Bragg; and 2) to develop recommendations to offset potential
negative economic impacts while building on current assets and prospective positive impacts.
The consulting team developed two sets of scenarios for troop reductions. The scenarios show
that a 3,000 troop reduction would result in a total loss of between 3,630-5,000 full-time and
part-time jobs (including the loss of troops), $450-$618 million in sales, $107-$264 million in
wages, and $5-$12 million in tax revenues. Troop reduction levels for 2,000 and 1,000 and the
impact on major industries are also presented in this study. Positive impacts (reported in the
appendix) in these same ranges would likely accrue if troop levels began to increase once again.
To mitigate potential negative economic impacts from a reduction of active duty personnel at Fort Bragg, the consulting team developed a set of recommendations to strengthen regional education, workforce, and economic development efforts. Basic economic development strategies will not significantly change with a reduction or increase of 1,000, 2,000, or even 3,000 active duty personnel at Fort Bragg. The core reasons companies move to and expand in this region will remain the same. Therefore, many of the recommendations focus on strengthening the efforts to recruit, retain, grow, and start up new businesses (military contracting or commercializing of military technology for example) and the talent needed to staff them.
Impact Greater Fayetteville
6
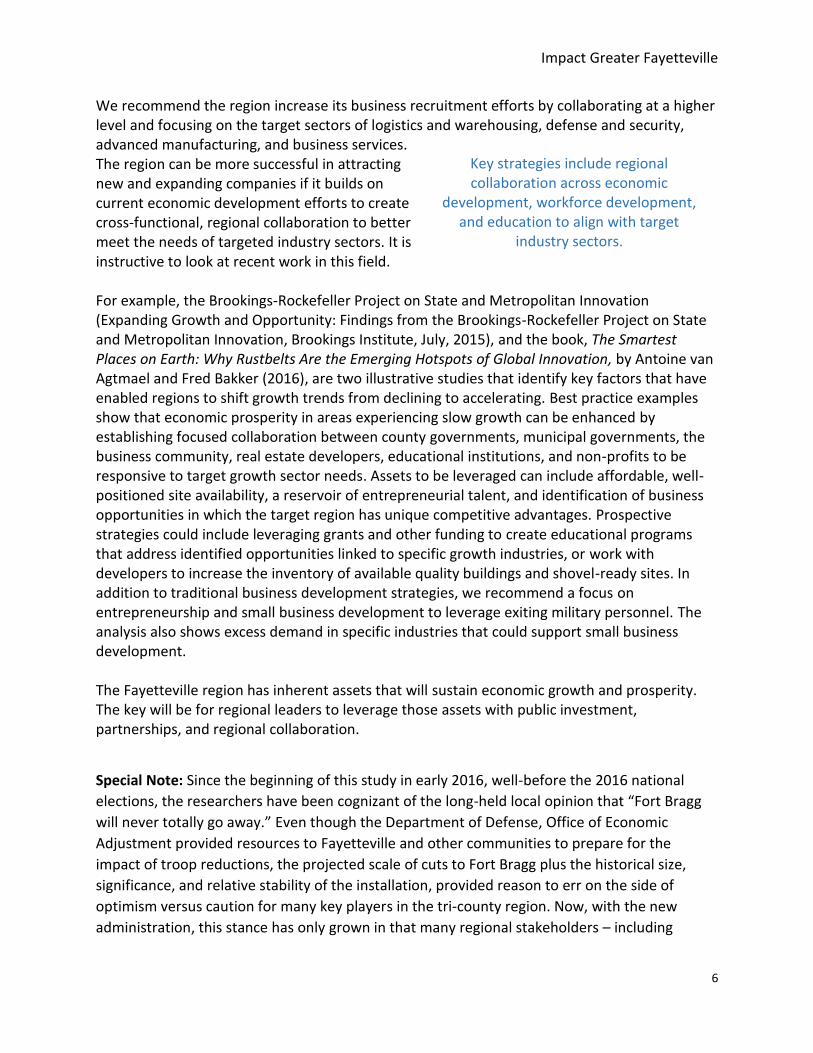
We recommend the region increase its business recruitment efforts by collaborating at a higher level and focusing on the target sectors of logistics and warehousing, defense and security, advanced manufacturing, and business services. The region can be more successful in attracting new and expanding companies if it builds on current economic development efforts to create cross-functional, regional collaboration to better meet the needs of targeted industry sectors. It is instructive to look at recent work in this field. For example, the Brookings-Rockefeller Project on State and Metropolitan Innovation (Expanding Growth and Opportunity: Findings from the Brookings-Rockefeller Project on State and Metropolitan Innovation, Brookings Institute, July, 2015), and the book, The Smartest Places on Earth: Why Rustbelts Are the Emerging Hotspots of Global Innovation, by Antoine van Agtmael and Fred Bakker (2016), are two illustrative studies that identify key factors that have enabled regions to shift growth trends from declining to accelerating. Best practice examples show that economic prosperity in areas experiencing slow growth can be enhanced by establishing focused collaboration between county governments, municipal governments, the business community, real estate developers, educational institutions, and non-profits to be responsive to target growth sector needs. Assets to be leveraged can include affordable, well-positioned site availability, a reservoir of entrepreneurial talent, and identification of business opportunities in which the target region has unique competitive advantages. Prospective strategies could include leveraging grants and other funding to create educational programs that address identified opportunities linked to specific growth industries, or work with developers to increase the inventory of available quality buildings and shovel-ready sites. In addition to traditional business development strategies, we recommend a focus on entrepreneurship and small business development to leverage exiting military personnel. The analysis also shows excess demand in specific industries that could support small business development. The Fayetteville region has inherent assets that will sustain economic growth and prosperity. The key will be for regional leaders to leverage those assets with public investment, partnerships, and regional collaboration.
Special Note: Since the beginning of this study in early 2016, well-before the 2016 national
elections, the researchers have been cognizant of the long-held local opinion that “Fort Bragg
will never totally go away.” Even though the Department of Defense, Office of Economic
Adjustment provided resources to Fayetteville and other communities to prepare for the
impact of troop reductions, the projected scale of cuts to Fort Bragg plus the historical size,
significance, and relative stability of the installation, provided reason to err on the side of
optimism versus caution for many key players in the tri-county region. Now, with the new
administration, this stance has only grown in that many regional stakeholders – including
Key strategies include regional collaboration across economic
development, workforce development, and education to align with target
industry sectors.

Impact Greater Fayetteville
7
elected officials – increasingly believe that, if anything, Fort Bragg will witness growth over the
next few years. Considering the original charge from the funder and contractor, together with
new political realties and defense spending increase probabilities, the research team has sought
to present economic and workforce development strategies that will lend themselves to any
scenario. The bottom line is that no matter what happens to the base, this region still needs to
work across county-lines in developing aligned, improved, and diversified education, workforce,
and economic development initiatives. This is also keeping in consideration the other long held
belief: “When Fort Bragg gets a cold, Fayetteville gets the flu.”

Impact Greater Fayetteville
8
Introduction In 2015, the Army announced a planned reduction of 40,000 active duty U.S. military personnel
over the next few years, in response to federal budget challenges and reduced U.S. roles in
military conflicts around the world. Thousands more civilian jobs working for the Army were
projected to be reduced as well. With a new administration, future changes in the level of
military personnel at Fort Bragg are uncertain, but it should be recognized that Fort Bragg has
already experienced reductions in troop strength from peak levels of approximately 10% (Table
3).
Recognizing that military installations can have a significant impact on their region’s economy,
the U.S. Congress allocated funds to the Department of Defense Office of Economic Adjustment
(OEA) to help regions assess and mitigate economic risks associated with reductions in force at
local military installations. The City of Fayetteville applied for, and was awarded, a grant from
the OEA to determine the prospective regional impact of troop reductions at Fort Bragg and to
develop strategies to drive growth to offset military reductions. This aligned closely with the
City of Fayetteville’s strategic plan. The
counties included in the scope of the
grant award are Cumberland, Hoke,
and Harnett (map at right). While
specific future reductions in personnel
at Fort Bragg have yet to be
determined, the City of Fayetteville
contracted with Creative Economic
Development Consulting and
Fayetteville State University to assess
potential impacts associated with a
range of prospective troop reduction
scenarios—including reductions of
1,000, 2,000, and 3,000 active duty
military personnel. With a total active
duty force at Fort Bragg of approximately 50,000, and another 9,000 civilians, a reduction of
3,000 from the military payroll would represent an approximate 5% decline from current levels.
The team also assessed potential impacts associated with troop increases (Appendix C) because
of a potential change in defense spending.
To assess potential impacts of military personnel reductions and to help develop and prioritize
mitigation strategies, the FSU/Creative EDC team used the following methodology:
1. Assembled and convened a Steering Committee consisting of key regional and
community leaders to provide guidance and input to the study team on issues

Impact Greater Fayetteville
9
addressed and conclusions reached. Steering committee members represented the four
jurisdictions covered in this study, economic development, workforce development, real
estate industry, military, education, and related agencies. The Steering Committee
provided oversight throughout the study process through regular meetings and
electronic communications. (see Appendix A for Steering Committee members).
2. Convened four community input sessions (one in each county and the city of
Fayetteville) to gain input on the potential impacts changes in Fort Bragg troop strength
could have on the community.
3. Reviewed previous background and related studies on regional economic issues and
opportunities.
4. Compiled and analyzed published statistical data describing the current regional
economic landscape.
5. Developed alternative personnel reduction and increase scenarios.
6. Used the IMPLAN econometric modelling tool to determine potential economic impacts
associated with troop reduction and increase scenarios.
7. Identified industries with highest potential for growth.
8. Developed economic and workforce development strategies to leverage growth
opportunities and mitigate risks associated with military personnel changes.
This study summarizes the research, analysis, and economic impacts, and makes
recommendations to offset potential negative economic impacts while building on current
regional assets.

Impact Greater Fayetteville
10
Steering Committee A 2012 report by the Association of Defense Communities notes that one of the most important factors for successfully addressing challenges associated with base realignments is to implement “robust sharing of information, aggressive and early engagement and creation of a strong, focused community voice, active cooperation in workforce development and retraining, and partnership…”(ADC BRAC Workshop: Using Lessons Learned to Address the Resource Challenges of Today, Association of Defense Communities, 2012). Thus, to help guide the assessment of impacts, challenges, and mitigating opportunities associated with potential reductions in personnel and contract dollars, the consulting team worked with the City of Fayetteville to establish a steering committee consisting of key regional and community leaders. Steering Committee members represented the four jurisdictions covered in this study, economic development, workforce development, real estate industry, military, education, and related agencies. The consulting team relied on input from the Steering Committee to guide research and validate results. The Steering Committee provided oversight throughout the study process through regular meetings and electronic communications. A list of Steering Committee members and the consulting team is in Appendix A.
Steering Committee Meeting Dates: o September 8, 2016 o November 15, 2016 o January 4, 2017 o March 14, 2017

Impact Greater Fayetteville
11
Community Input Sessions & SWOT Analysis The consulting team facilitated four community input meetings, one in each county and one in the City of Fayetteville, to hear the qualitative impacts a reduction at the base will have on the community. The agenda for the meetings included a SWOT (Strengths, Weaknesses, Opportunities, Threats) Analysis, qualitative impact of Fort Bragg, workforce and economic development strategies, resources for diversification, and feedback on how this study could support their local work. The consulting team used the reported qualitative impacts of Fort Bragg to influence the data gathered and analyzed. For example, when participants mentioned vacant housing as an impact, we researched the housing market. We used assets and opportunities as building blocks for the economic and workforce development strategies. The communities want to see strategies for infrastructure improvements, education and workforce development, small business and entrepreneur development, business recruitment, and transportation improvements. They noted that local, state, and federal, along with private resources, should be tapped for implementation. The communities of Hoke, Harnett, Cumberland, and Fayetteville are very different. The small
town feel of communities in Hoke and Harnett counties is juxtaposed to the amenities of the
metropolitan area of Fayetteville. However, Fort Bragg and the attendant population create
unique opportunities and benefits -- and create unique challenges and uncertainties. We found
that Fort Bragg is central to almost everything in Fayetteville, understandably, while the
counties see beyond the impacts of the base. This was proven by the economic modeling in this
study, which showed that unless new military housing development in Harnett County is scaled
back, small reductions at Fort Bragg will have minimal impacts to Hoke and Harnett counties.
We used an asset-based approach, built upon a SWOT Analysis, to create the
workforce and economic development strategies.

Impact Greater Fayetteville
12
Table 1: Combined SWOT Analysis Summary
Source: Community Input Sessions
STRENGTHS
•Affordable housing
•Work ethic, military spouses
•Proximity to Ft. Bragg, metros, RTP brain trust
•Cape Fear River-recreation, water resource
•Access to I-95, I-295, and highways
•Small town attitude
•Schools, Community College, Universities
•State parks, recreation parks
•Public infrastructure –planning department
•Diverse population
•Airport
•Health care system
•Diversity of jobs
•Cost of living
WEAKNESSES
•Identity/vision
•Perception of community
•Lack of connectivity
•Infrastructure
•Hotels
•Housing options, transient community
•Meeting space, convention space
•Dependency on military
•Attracting young workers
•Low tax base proportional to population
•Largest employers do not pay taxes, they are exempt (health care, university)
•Recreation facilities
•Out-commuters
•No one knows what we have to offer
•Airport facilities
•Better connected partnerships
•Poverty
OPPORTUNITIES
•Create an identity
•Lifestyle amenities
•Marketing
•Leveraging Ft. Bragg
•Become a destination
•Land management
•Better organized communities to attract youth
•Use river and spaces to create communities attract people
•Leverage talent
•Exiting military, graduating/graduate students
•Could have a glut of affordable housing if military left
•Agricultural products processing
•Small businesses development
•Regional strategy
•Community college closing skills gap with exiting military
•Improve water sewer capacity
•Home-based entrepreneur
THREATS
•Traffic
•People against change
•Complacency
•Workforce flight
•Poverty, crime
•Overcrowded schools
•Lack of connectivity
•National attention to HB2
•Pay scale for teachers in neighboring counties
•Growth-management
•Dependency on Ft. Bragg
•Health disparity issues
•Infrastructure lines designed to be a rural system
•Funding for implementation
•Coordination

13
SWOT Comments
Harnett County
Harnett County strengths revolved around mainly traditional economic development assets
such as transportation, education, health care, and the military base, as well as quality of life
assets. It is interesting that the group did not mention Fort Bragg until well into the discussion,
indicating it is not the leading asset. Several of the weaknesses relate to county-municipal
relations as well as regional dynamics. Harnett County has a base of small businesses but wants
more local jobs. The county is struggling with how to grow strategically. Due to residential
growth, managing land use for economic development is a priority. The county is in a good
position to attract talented workers and retain more young people due to proximity to the
Raleigh metro area. They want to be a part of a regional growth strategy. Threats were wide
ranging, from public health to infrastructure to state policy. Most of the threats to the economy
are not related to the base; however, the threats such as lack of infrastructure, do impact
economic diversification strategies.
City of Fayetteville
Even though Fayetteville is often seen as dominating the regional economy, there is recognition
of the value of the smaller communities around the city. Assets include transportation,
workforce, and the health care system. Several of the weaknesses are related to impacts from
the base, such as rental housing and low income levels attracting low-end retail.
Representatives at the community input session discussed attachment to the base and the
perception of being attached to the base as a weakness. The group discussed many
opportunities to leverage the base while at the same time diversifying from the base. Many
opportunities involve regional collaboration and marketing/branding. Many participants
discussed planning fatigue and the threat of this process stalling due to that fatigue. They
recognized the threats of complacency and negative attitudes.
Cumberland County
Participants quickly identified physical assets and investments in infrastructure and the future
as concrete strengths the region has as a foundation. They added a cooperative community
with structures and organizations pursuing community goals, as well as leaders that are inclined
to act. Fort Bragg is a strength that can be developed and focused in new ways. Especially
promising are new programs and growth at Campbell University, including a new residency
program which will bring hundreds of medical students to the region. Air and ground
transportation assets support the economy and connect other assets. Themes of disconnection
and mistrust may be addressed by communicating and convening – which may be easier than
other resource-heavy solutions. Concern was expressed for the sometimes negative portrayal
of Fayetteville “inside” Fort Bragg and a fear of the effects of this negative word-of-mouth.
Several diverse sources of opportunities include significant higher education assets, under-
utilized natural resources for recreation, and the Army and Fort Bragg. Entrepreneurship was
mentioned several times as an emerging economic development strategy that needs more

Impact Greater Fayetteville
14
support. Reductions at Fort Bragg dominated discussion of threats, including complex military
reimbursement programs and funding streams, as well as the lack of control the community
feels in dealing with Fort Bragg.
Hoke County
Hoke County is a cohesive community with a good quality of life which has attracted housing
developments to serve the Ft Bragg community. At the same time, there is a relatively lower
level of public services provided by the county. There is a conflicting view of the low tax rate.
There are unmet infrastructure needs at the local level due to the low tax rate, while at the
same time the low tax rate attracts business and homeowners. There is interest in improving
connectivity within the county and in recruiting commercial and industrial development from
the outside. The group is wary of growth that depends on Fort Bragg, but also sees how the
low-tax policy has contributed to the situation.
Prior Economic Analyses To help clarify the context of current stakeholder perceptions and to help inform the development of the study team’s recommendations, a summary of prior regional economic development reports was compiled. Prior reports reviewed included BRAC Regional Task Force reports on impacts and opportunities associated with growth in Fort Bragg personnel, a 2012 report entitled A Competitive Realities Report for Fayetteville and Cumberland County, North Carolina, authored by Garner Economics, LLC, for the Fayetteville-Cumberland County Chamber of Commerce, Fayetteville Cumberland County Economic Development Corporation Strategic Plan 2016-2017, and regional growth plans. Most of these reports were written as the number of personnel assigned to Fort Bragg was increasing or expected to increase. Findings included identification of a number of strengths that could be leveraged to capitalize on the increasing military presence, as well as an identification of weaknesses that could hinder the region’s ability to reach its full potential in growth and development. Previously identified strengths that continue to be relevant include:
o Availability of multiple high-quality higher education options—at the community
college/vocational training level as well as at the university level
o Central regional location, with close proximity to interstate highways and ready access
to major southeastern metropolitan areas
o Good utility infrastructure, including adequate water and wastewater treatment
capacity
o A strong, military-related labor pool of well-educated and highly capable veterans and
spouses
o Population diversity
o Strong base of small manufacturers

Impact Greater Fayetteville
15
However, as this report will show, some attributes that were strengths previously have changed. One example is that the region is no longer outpacing the state or the nation in GDP growth, per capita income growth, or employment growth. Also, this study has found that many previously identified weaknesses in our region’s economic profile remain, such as limited availability of skilled jobs in manufacturing, science and technology, professional services, and general business management relative to other metropolitan areas of the state. In addition, the region continues to have a below average proportion of its residents with a bachelor’s degree or higher college degree, higher tax rates, high crime, low school quality, and low tourism appeal. Prior studies also identified threats (factors that could reduce the region’s economic well-being)—some of which have materialized—such as:
o Troop reductions
o Federal budget cuts and sequestration
o Large troop deployments
o Insufficient expansion in non-military sectors to offset high dependence on military
incomes and expenditures
Growth potential has previously been recognized, but further work is needed to bring these opportunities to full fruition. Prior studies have focused on opportunities for growth in sectors in which there are clusters of expertise, such as defense and security, health care, education, and professional services. This study explores target clusters and sector growth opportunities further, with potential strategies identified to continue to increase regional prosperity.

Impact Greater Fayetteville
16
78%
16%
5%
Regional Employment
Cumberland County Harnett County Hoke County
Economic Landscape
To understand the potential impacts of personnel changes at Fort Bragg it is important to understand the current economic and demographic landscape of the region. The study team examined economic output data, population size and composition, employment levels, educational attainment of the workforce, income levels, veteran presence in the population and their characteristics, and the housing stock. It should be noted that while much of the data is presented at a regional level, additional
county and town-specific data is available in Appendix B. The economic landscape within the
target three-county region is clearly dominated by activity occurring in Cumberland County.
Cumberland County accounts for approximately 80% of the region’s non-military jobs, 85% of
the region’s non-military wage income, and 65% of the region’s total population (Figures 1-3).
Harnett County is the next largest factor in the target region, accounting for 14% of the region’s
jobs and 25% of the region’s population. Over 90% of those who live in Cumberland County also
work in Cumberland County, while only 30-40% of those who live in Harnett and Hoke Counties
work in the county of their residence. A clear majority of the military personnel live in
Fayetteville, followed by Spring Lake, Hope Mills, Raeford, and Lillington (see Figure 4). It is,
therefore, no surprise that almost 80% of the region’s military personnel currently reside in
Cumberland County, which includes Fayetteville and Hope Mills (see Figure 5).
Key Regional Economic Data Driving Allocation of Economic Impact
Assessment by County
Figure 1: Population Percentage Figure 2: Regional Employment
Source: U.S. Census Bureau and Bureau of Economic Analysis
65%
25%
10%
Population Percentage
Cumberland County Harnett County Hoke County

Impact Greater Fayetteville
17
78%
13%
9%
Military Personnel Residence by County
Cumberland County Harnett County Hoke County
21
,35
9
59
6
19
29
2,4
07
F A Y E T T E VI L L E H O P E M I L L S L I L I N G T O N R A E F O R D S P R I N G L A K E
MILITARY PERSONNEL LIVING IN TOWNS
85%
11%
4%
Percentage of Regional GDP
Cumberland County Harnett County Hoke County
Figure 3: Percentage of Regional GDP
Source: U.S. Census Bureau and Bureau of Economic Analysis
Figure 4: Military Personnel Living in Town
Source: U.S. Census Bureau and Bureau of Economic Analysis
Figure 5: Military Personnel Residence by County
Source: U.S. Census Bureau and Bureau of Economic Analysis

Impact Greater Fayetteville
18
According to the U.S. Bureau of Economic Analysis (2014), the military is clearly the key economic driver for the region, accounting for approximately 31% of the total value of goods and services produced in the Fayetteville Metropolitan Statistical Area, which consists of Cumberland and Hoke Counties (See Figure 6). Industry employment data from the North Carolina Department of Commerce (which does not include active duty military) show that aside from the military, the region is highly dependent on public sector jobs (health care, public administration or government services, and education), which together account for over 50% of non-military wages in the study region. Retail trade and manufacturing are the largest private sector industries in the region, each accounting for about 11% of total regional wages (Table 2).
Table 2: 2015 Employment by Industry in the Three-County Region
Wages by Industry
Industry Wages as % of Total
# of People Employed
Avg Weekly Wages
Weekly Wages Annualized
1 Health Care and Social Assistance $1,223,961,247 26% 26,793 $732 $38,046
2 Public Administration $ 838,650,342 18% 15,984 $840 $43,701
3 Retail Trade $526,729,255 11% 20,828 $459 $23,875
4 Manufacturing $499,882,437 11% 9,360 $909 $47,291
5 Educational Services $472,834,785 10% 12,505 $727 $37,812
6 Professional Scientific and Technical Services $314,278,314 7% 5,433 $939 $48,807
7 Construction $266,574,183 6% 6,014 $826 $42,957
8 Transportation and Warehousing $250,465,881 5% 5,855 $742 $38,578
9 Accommodation and Food Services $227,650,533 5% 16,535 $243 $12,641
10 Administrative and Support and Waste Management and Remediation Services
$219,004,740 5% 7,470 $499 $25,968
11 Wholesale Trade $130,674,996 3% 2,677 $903 $46,955
12 Finance and Insurance $119,036,400 3% 2,420 $887 $46,104
13 Other Services (except Public Administration) $103,309,991 2% 3,524 $492 $25,603
14 Information $78,061,978 2% 1,771 $932 $48,466
15 Real Estate and Rental and Leasing $68,711,798 1% 1,972 $591 $30,714
16 Management of Companies and Enterprises $31,110,441 1% 565 $1,054 $54,787
17 Arts Entertainment and Recreation $26,999,811 1% 1,560 $347 $18,048
18 Utilities $26,589,722 1% 437 $838 $43,579
19 Agriculture Forestry Fishing and Hunting $17,944,002 0% 594 $582 $30,282
20 Mining $3,554,441 0% 56 $1,221 $63,472
Source: U.S. Bureau of Labor Statistics

Impact Greater Fayetteville
19
The military contribution to the area’s economy was a key growth driver over the period of 2005 - 2010, aided in part by the military’s base realignment process (Figure 6). The military’s share of the regional gross domestic product grew from 31% in 2004 to 34% in 2010, resulting in regional economic growth rates above state and national averages in 2005 and 2007-2009 (Figure 7).
Figure 6: Federal Military Contribution to Fayetteville (MSA) Real GDP
Source: Bureau of Economic Analysis
Figure 7: Real GDP Growth Rate
Source: Bureau of Economic Analysis
-4.00%
-3.00%
-2.00%
-1.00%
0.00%
1.00%
2.00%
3.00%
4.00%
5.00%
6.00%
2002 2003 2004 2005 2006 2007 2008 2009 2010 2011 2012 2013 2014
Real GDP Growth Rate
US North Carolina Fayetteville MSA
27.0%
28.0%
29.0%
30.0%
31.0%
32.0%
33.0%
34.0%
35.0%
2001 2002 2003 2004 2005 2006 2007 2008 2009 2010 2011 2012 2013
Federal Military Contribution to Fayetteville (MSA) Real GDP

Impact Greater Fayetteville
20
However, since a peak in the military’s economic contributions to the region in 2010, military activity has been declining at a rate of 2-4% per year in real terms (i.e. excluding the impact of inflation). Comparable declines can be seen in the reduced level of troops assigned to Fort Bragg since Fiscal Year 2013 (see Table 3). Thus, the region’s overall economic output has been declining since 2012, while economic activity in the state and the nation has, on average, been rising (Figure 8).
Figure 8: Year-to-Year Change in Fayetteville MSA GDP, by Military vs. Non-Military Sources
Source: Bureau of Economic Analysis
Table 3: Fort Bragg Troop Strength Trends
Source: Fort Bragg Public Relations, January 2017
Similar patterns can be observed even when comparing the Fayetteville area to other peer cities with large military installations (Figure 9). The ramp-up in military presence at Fort Bragg resulted in higher GDP growth than most comparable military metropolitan areas, but the
-5.0%
-4.0%
-3.0%
-2.0%
-1.0%
0.0%
1.0%
2.0%
2011 2012 2013 2014
Year-to-Year Change in Fayetteville MSA GDP, by Military vs Non-Military Sources
Total Military Non-Military
Fort Bragg Population ASIP COP Data (31 January 2016) FY08 FY09 FY10 FY11 FY12 FY13 FY14 FY15 FY16
Active Duty Army Military 44,436 45,437 45,290 45,051 44,954 44,702 42,532 41,716 40,877
Reserve Component Military (Assigned at Fort Bragg) 1,891 1,810 1,816 3,207 3,281 3,283 3,262 3,391 2,358
Other Military ( Air Force, Other Services) 785 818 751 2,936 2,862 2,998 3,002 3,002 3,010
Students-Military (incl PCS & TDY) 5,995 4,943 5,502 4,730 5,600 5,786 5,873 5,119 4,796
Total Fort Bragg Military Population 53,107 53,008 53,359 55,924 56,697 56,769 54,669 53,228 51,041
Civilian Employees (Assigned at Fort Bragg) 9,340 10,158 11,344 14,116 14,515 14,380 14,470 14,663 13,808
Contract Employees (Working at Fort Bragg) 6,688 6,984 5,472 5,481 5,496 6,342 5,888 5,552 6,054
Military Family Members (Active Duty Military) 80,723 80,572 81,106 85,004 86,179 86,289 83,097 80,907 69,797
Total Fort Bragg Population 149,858 150,722 151,281 160,525 162,887 163,780 158,124 154,350 140,700

Impact Greater Fayetteville
21
declines in military activity since 2011 at Fort Bragg have resulted in lower GDP growth in the Fayetteville area than in most other peer cities (Figure 10).
Figure 9: Illustrative Benchmark Comparisons
Source: Various articles, Installation websites, and U.S. Census
Illustrative Benchmark Comparisons
Ft. Hood / Killeen, Texas
Military Population2010: 52,0002016: 38,0002017 Forecast: 35,000
2015 Total City Population: 141,000
Ft. Benning / Columbus, GA
Military Population2012: 13,0002016: 12,6002017 Forecast: 9,000
2015 Total City Population: 201,000
Redstone Arsenal / Huntsville, AL
Military PopulationActive Duty: 1,000Federal Civilians: 19,500Contractors: 15,000
2015 Total City Population: 191,000
Fort Bragg / Fayetteville, NC
Military Population2010: 49,0002016: 47,000
2015 Total City Population: 202,000

Impact Greater Fayetteville
22
Figure 10: Real GDP Growth Rate by MSA
Source: Bureau of Economic Analysis
Table 4: Year-to-Year Population Growth, by County
2011 2012 2013 2014 2015
Cumberland
1.2% -0.2% 1.0% -0.2% -0.6%
Harnett
3.0% 2.6% 2.4% 1.4% 1.0%
Hoke
4.2% 2.0% 1.3% 1.0% 2.0%
Total 3 Counties 1.9% 0.7% 1.4% 0.3% 0.1%
State
1.0% 1.0% 1.0% 1.0% 1.0%
Source: U.S. Census Bureau
Concomitant with the declining military presence at Fort Bragg has been regional
underperformance relative to state and national averages along several economic dimensions,
including family incomes, unemployment rates, new business formation, and housing.
Each of the counties in the region has lower median household incomes than the state, which itself trails the nation on this metric (Figure 11). The differences are more pronounced on a per capita basis (Figure 12).
-4.0%
-2.0%
0.0%
2.0%
4.0%
6.0%
8.0%
10.0%
Real GDP Growth Rate
US Columbus Fayetteville
Huntsville Killeen-Temple

Impact Greater Fayetteville
23
Figure 11: Median Household Income
Source: U.S. Census Bureau
$0
$10,000
$20,000
$30,000
$40,000
$50,000
$60,000
2010 2011 2012 2013 2014
Median Household Income
US North Carolina Cumberland County Harnett County Hoke County
The impacts of reductions in military presence on population have been felt particularly hard in Cumberland County. While the population in
Harnett and Hoke counties has continued to grow over the 2010-2015 period at or above state average growth rates of 1-2% per year, the
population in Cumberland County has been declining slightly, in the range of -0.2 to -0.6% per year (Table 4).

Impact Greater Fayetteville
24
Figure 12: Per Capita Income
Source: U.S. Census Bureau
As shown in Table 5, the target region has been experiencing some level of aggregate growth in jobs and income over the past several years, but the level of growth is below average for the state. Within the three-county region, Harnett and Hoke Counties have fared best with respect to wage and job growth, with Hoke County experiencing economic growth in 2015 at rates close to the state average.
Table 5: Year-to-Year Growth in Jobs, Wages, and Establishments
2013 2014 2015
3 County Region
Employment (# jobs) 0.0% -1.0% 0.1%
Total Wages 1.0% -1.4% 2.6% # of Establishments -1.2% 0.6% 1.4%
State
2013 2014 2015 Employment (# jobs) 1.8% 2.1% 2.6% Total Wages 3.4% 4.8% 6.2% # of Establishments 0.3% 0.8% 3.4%
By County: Employment (# jobs)
Cumberland -0.2% -0.6% -0.2%
Harnett 0.1% 2.3% 2.4%
Hoke 42.8% -32% 2.8%
$0
$5,000
$10,000
$15,000
$20,000
$25,000
$30,000
2010 2011 2012 2013 2014
Per Capita Income
US North Carolina Cumberland County Harnett County Hoke County

Impact Greater Fayetteville
25
Wages
Cumberland 1.2% -0.4% 1.9%
Harnett 3.8% 1.2% 2.8%
Hoke 30.7% -17.1% 6.0% Source: Bureau of Labor Statistics
Recent data indicates that while many other areas of the state are experiencing growing incomes, median family income in the Fayetteville MSA declined by almost 4% in 2016 (Table 6).
Table 6: Median Family Income
Median Family Income
Period Level (000s) YOY %
Change
Asheville MSA 2016 $57,900 3.58
Charlotte MSA 2016 $67,000 -0.3
Durham MSA 2016 $74,900 11.13
Fayetteville MSA 2016 $52,200 -3.87
Greensboro-High Point MSA 2016 $57,200 5.93
Raleigh-Cary MSA 2016 $76,600 -2.79
Winston-Salem MSA 2016 $58,500 4.28
Source: Federal Reserve Bank of Richmond
Similarly, recent data in Table 7 indicates that area unemployment rates are among the highest in North Carolina metropolitan areas.
Table 7: Labor Market Conditions
Labor Market Conditions
Unemployment Rate October-16 September-16 October-15
United States 4.90 5.0 5.0
Fifth District 4.6 4.5 5.2
North Carolina 4.9 4.7 5.6
Asheville MSA 4.1 4.1 4.6

Impact Greater Fayetteville
26
Charlotte MSA 4.7 4.7 5.3
Durham MSA 4.3 4.3 5.0
Fayetteville MSA 6.3 6.1 7.3
Greensboro-High Point MSA 5.0 5.1 5.9
Raleigh-Cary MSA 4.2 4.2 4.8
Wilmington MSA 4.8 4.8 5.5
Winston-Salem MSA 4.7 4.7 5.4
Source: Federal Reserve Bank of Richmond, data are seasonally adjusted
Associated with lower than average—and declining—incomes and higher than average unemployment rates are above average mortgage delinquency, home foreclosure, and repossessed property rates (Table 8). It must be noted, however, that these home mortgage issues are not near crisis levels.
Table 8: Owner-Occupied Loan Statistics: North Carolina
Owner-Occupied Loan Statistics: North Carolina September 2015 September 2016
Percent 90+ Days Past Due
Percent in Foreclosure
Percent in REO
Percent 90+ Days Past Due
Percent in Foreclosure
Percent in REO Geographic Area
Asheville 1.00 0.71 0.39 0.86 0.45 0.34
Burlington 1.86 1.01 0.71 1.57 0.66 0.63
Charlotte-Gastonia 1.76 0.94 0.48 1.51 0.62 0.39
Durham 1.83 0.65 0.41 1.50 0.45 0.40
Fayetteville 3.38 1.32 0.90 2.74 0.97 1.16
Goldsboro 2.64 1.04 0.86 1.99 0.82 1.03
Greensboro 2.01 0.94 0.73 1.75 0.71 0.68
Greenville 1.98 1.00 0.62 1.65 0.75 0.68
Hickory-Lenoir 1.56 1.07 0.78 1.41 0.71 0.78
Jacksonville 3.22 1.73 1.43 2.53 1.60 1.88
Kill Devil Hills 1.09 0.72 0.40 1.00 0.52 0.44
Raleigh-Cary 1.44 0.61 0.30 1.21 0.43 0.26
Rocky Mount 3.16 1.51 1.12 3.04 1.20 1.22
Wilmington 1.36 0.86 0.58 1.18 0.61 0.60
Winston-Salem 1.85 0.93 0.64 1.72 0.71 0.67
North Carolina 1.90 0.93 0.60 1.62 0.67 0.59
Fifth District 1.80 1.14 0.76 1.56 0.80 0.73
United States 1.72 1.50 0.74 1.46 1.08 0.67
Note: FHA and VA loans as well as interest-only loans are included in the count of prime loans. Areas with fewer
than 100 total loans will receive an N/A.
Source: Federal Reserve Bank of Richmond/McDash Analytics (September 2016)

Impact Greater Fayetteville
27
12%
27%
39%
22%
Civilian Population 25 Years and Over -
Cumberland County
Less than highschool graduate
High schoolgraduate (includesequivalency)
Some college orassociate's degree
Bachelor'sdegree or higher
16%
32%34%
18%
Civilian Population 25 Years and Over -Harnett County
Less than highschool graduate
High schoolgraduate(includesequivalency)
Some college orassociate's degree
Bachelor'sdegree or higher
One factor that often hinders creation of new, well-paying employment opportunities in an area is perceived lack of access to a skilled, or well-educated, labor pool. This region lags both the state and the nation in the proportion of its labor force that has attained at least a bachelor’s degree or higher. For example, 22% of Cumberland County residents over the age of 25 have attained a bachelor’s degree (Figure 13a), compared to an average of 30% for the state and 45-50% for Durham and Wake counties. The proportion of Hoke and Harnett County residents with at least a bachelor’s degree is even lower, at 18%.
Figures 13a, 13b. 13c: Civilian Population Educational Attainment 25 Years and Over
Source: U.S. Census Bureau, 2014 American Community Survey

Impact Greater Fayetteville
28
Economic data also confirms the presence of assets that could help fuel future growth, despite the prospects of continued reductions in military presence. On an annual basis, an average of 6,000 service personnel normally separate from the US Army via Fort Bragg. It is estimated that as many as one-third remain in the area. Surveys indicate that even more transitioning veterans (55%) would remain in the region if suitable employment were available. (HAS Report, 2016). This large labor pool of skilled workers could be an attractive proposition to other private- and public-sector employers.
Source: U.S. Census Bureau, 2014 American Community Survey
17%
29%37%
18%
Civilian Population 25 Years and Over -
Hoke County
Less than highschool graduate
High schoolgraduate (includesequivalency) Some college orassociate's degree
Bachelor's degreeor higher
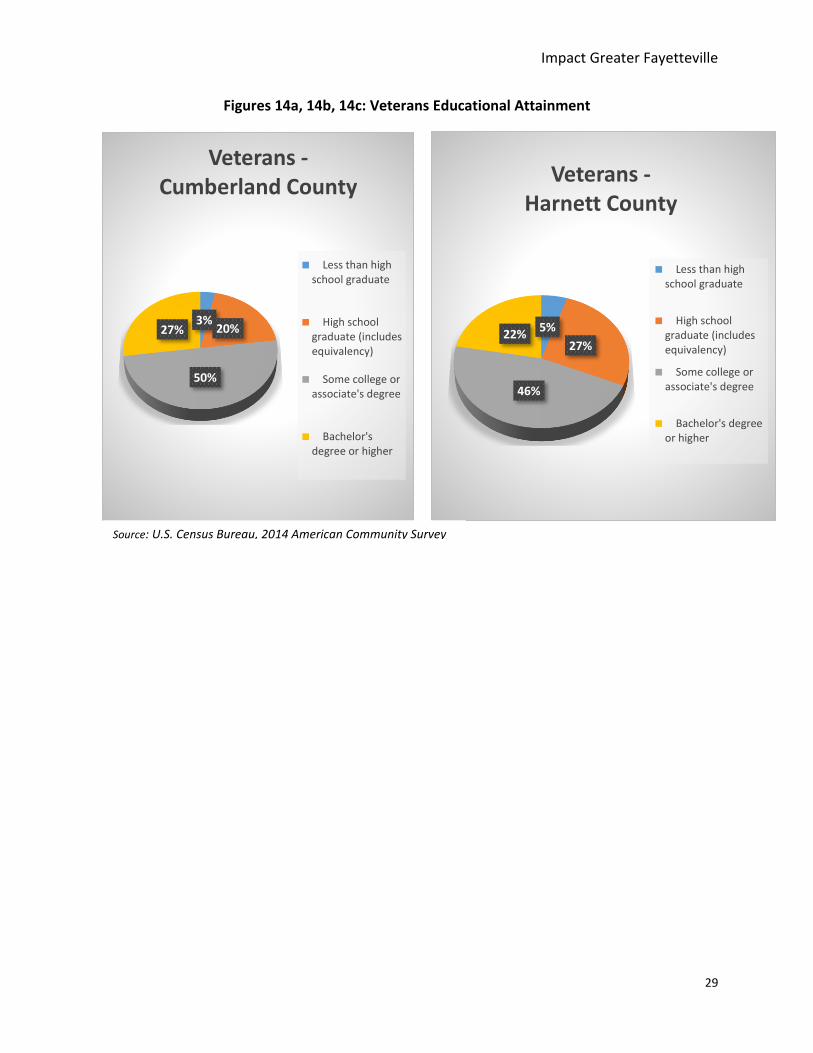
One key asset is the disproportionate presence of a
skilled, disciplined set of military veterans. Among this veteran
population within the county, 77% have some college or associate
degrees and higher, and 27% have a bachelor’s degree or higher—representing significantly higher educational attainment than the average non-veteran population
(Table 14).
Impact Greater Fayetteville
29
3%20%
50%
27%
Veterans -Cumberland County
Less than highschool graduate
High schoolgraduate (includesequivalency)
Some college orassociate's degree
Bachelor'sdegree or higher
Figures 14a, 14b, 14c: Veterans Educational Attainment
5%
27%
46%
22%
Veterans -Harnett County
Less than highschool graduate
High schoolgraduate (includesequivalency)
Some college orassociate's degree
Bachelor's degreeor higher
Source: U.S. Census Bureau, 2014 American Community Survey
Impact Greater Fayetteville
30
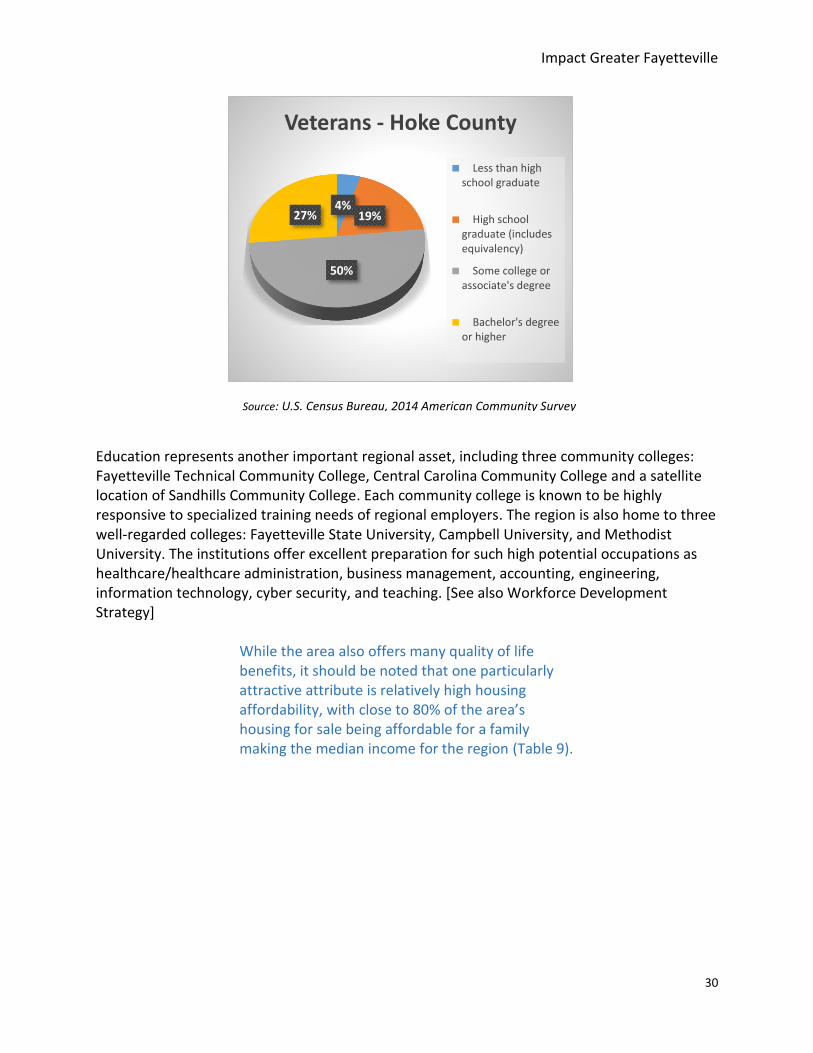
Education represents another important regional asset, including three community colleges: Fayetteville Technical Community College, Central Carolina Community College and a satellite location of Sandhills Community College. Each community college is known to be highly responsive to specialized training needs of regional employers. The region is also home to three well-regarded colleges: Fayetteville State University, Campbell University, and Methodist University. The institutions offer excellent preparation for such high potential occupations as healthcare/healthcare administration, business management, accounting, engineering, information technology, cyber security, and teaching. [See also Workforce Development Strategy]
While the area also offers many quality of life benefits, it should be noted that one particularly attractive attribute is relatively high housing affordability, with close to 80% of the area’s housing for sale being affordable for a family making the median income for the region (Table 9).
4%19%
50%
27%
Veterans - Hoke County
Less than highschool graduate
High schoolgraduate (includesequivalency)
Some college orassociate's degree
Bachelor's degreeor higher
Source: U.S. Census Bureau, 2014 American Community Survey

Impact Greater Fayetteville
31
Table 9: Real Estate Conditions
Real Estate Conditions
Housing Opportunity Index (%)
Q3:16 Q2:16 Q3:15
Asheville MSA 59.3 60.0 62.9
Charlotte MSA 69.7 70.0 69.5
Durham MSA 72.4 73.7 70.2
Fayetteville MSA 77.4 79. 5 80. 5
Greensboro-High Pont MSA 77.6 76.7 74.1
Raleigh-Cary MSA 67.2 69.0 72.5
Winston-Salem MSA 83.2 79.8 80.8
Source: Federal Reserve Bank of Richmond
Prospective Impacts on Public Education Military demographic information indicates that 48% of active duty Army personnel have dependent children. Among those Army families with children, the average number of dependent children is 2.1, with 34% being pre-school (0-4 years old), 33% being elementary school (5-10 years old), 13% middle school (11-13 years old), and 16% high school (14 - 18 years old) (2014 Demographics: Profile of the Military Community, U.S. Dept. of Defense). Based on this recent demographic data, a reduction of 3,000 active duty military personnel would be expected to lead to a reduction of approximately 3,000 school age children, in the following distribution:
o Pre-School: 1,019 o Elementary: 999 o Middle School: 380 o High School: 473 o Total: 2,871
This level of prospective future impact is comparable to the reductions in the number of military-connected students that have, in fact, already taken place over the past several years. The Department of Defense provides data on military-connected students by school district for districts with high proportions of such students (Figures 15a, 15b, 15). This data indicates that for Cumberland County Schools there was a reduction of 3,700 military-connected students
from FY 2012 to FY 2017. It is interesting to note that the decline in military-connected students in Cumberland County has been almost completely offset by an increase in students who are not dependents of military personnel. This could be an indication that many of the families with
From a FY 2012 peak of 16,000 military-connected students,
representing 31% of Cumberland County Schools students, the
military-connected proportion has declined by almost 4,000 students, now accounting for approximately
24% of the total.

Impact Greater Fayetteville
32
school age children who are transitioning away from the military may be choosing to stay in the area in part due to the area school systems. Trends in Harnett and Hoke Counties have been somewhat different. Harnett County enrollment of military-connected students has been relatively stable at approximately 20% of the total. Declines in certain areas have been offset by increased military housing in western Harnett County. While data available for Hoke County is more limited, the data that is available shows that Hoke County enrollment of military-connected students increased from 22% of total students in 2011-12 to 27% in 2016-17. Officials attribute most of this growth to increased numbers of military-connected families choosing to live in Hoke County because of property tax advantages.
Figures 15a, 15b, 15c: Military-Connected Students
Source: Department of Defense
52 52 53 53 52 51
16 15 15 14 13 12
31% 30%28%
27%25%
24%
0%
5%
10%
15%
20%
25%
30%
35%
-
10
20
30
40
50
60
FY 2012 FY 2013 FY 2014 FY 2015 FY 2016 FY 2017M
ilita
ry A
s $
% o
f To
tal
Nu
mb
er o
f St
ud
ents
Tho
usa
nd
s
Military-Connected Students in Cumberland County Schools
Total Students Military Mil %

Impact Greater Fayetteville
33
Source: Harnett County Schools
Source: Department of Defense, Hoke County Schools
0%
5%
10%
15%
20%
25%
-
5,000
10,000
15,000
20,000
25,000
2011-12 2012-13 2013-14 2014-15 2015-16 2016-7
% M
ilita
ry C
on
nec
ted
# St
ud
ents
Miliary-Connected Students in Harnett County Schools
Total Students Military Students % Military
22%
27%
0%
5%
10%
15%
20%
25%
30%
-
2,000
4,000
6,000
8,000
10,000
2011-12 2016-17
Mili
tary
as
% o
f To
tal
# o
f St
ud
ents
Hoke County Schools Military-Connected Students
Total Military Military as % of Total

Impact Greater Fayetteville
34
Figure 16a: Impact Aid Provided to Cumberland County Schools for Military-Connected
Students for School Operations
Source: Department of Defense
Figure 16b: Impact Aid Provided to Harnett County Schools for Military Connected Students
Source: Harnett County Schools
Associated with declines in military-connected students have been declines in Impact Aid grants provided by the federal government to local education agencies (i.e. school districts) that are located near military installations. While there are several impact aid-related grants available, Figure 16a shows the decline of $3.4 million that has taken place for Impact Aid supporting general operations for Cumberland County Schools since FY 2012. Aid to Harnett County
$0
$200,000
$400,000
$600,000
$800,000
$1,000,000
$1,200,000
$1,400,000
2010-11 2011-12 2012-13 2013-14 2014-15 2015-16 2016-17
Harnett County Impact Aid For Military-Connected Students

Impact Greater Fayetteville
35
Schools increased between 2013-15 with the construction of new military housing in western Harnett County, but that aid has now begun to decline as well (see Figure 16b). Harnett County officials indicate that because there was not previously sufficient capacity to accommodate the increased enrollment in western Harnett County, this growth has placed a financial burden on the school district, as the aid provided falls far short of that needed to fund the new schools required.
Housing Impacts Estimates of the potential impacts on the local housing market were derived by first examining Census Bureau data to determine current residential locations of active duty military-affiliated personnel in the target region. Guidance received from the regional association of realtors indicated that of those living off post, approximately half rented and half were purchasing their homes. If these trends remained constant with troop reductions, a cut of 3,000 troops would be felt most in Cumberland County, which could experience an increase in overall vacant housing of as much as 9.2%, increasing vacancy rates in the county to as much as 16.2% from a 2014 level of 12.9% (Table 10).
Table 10: Increase in Vacant Housing
2014 Cumberland County
Harnett County
Hoke County Total
Population 325,814 126,865 51,644 504,323
Population 16 and over 247,401 91,521 36,653 375,575
Armed forces 26,994 4,454 3,130 34,578
Owner-occupied units 65,642 27,488 11,010 104,140
Renter-occupied units 56,646 14,113 5,524 76,283
Vacant housing units 18,122 6,521 2,613 27,256
Owner vacancy rate 3.0% 2.5% 3.8%
Rental vacancy rate 8.8% 8.7% 9.2%
Overall vacancy rate 12.9% 13.9% 13.6%
Median housing value ($) $128,600 $133,400 $143,500
Units occupied by armed forces
26,994 4,454 3,130 34,578
Estimated armed forces owner-occupied
13,497 2,227 1,565 17,289
Estimated armed forces renter-occupied
13,497 2,227 1,565 17,289

Impact Greater Fayetteville
36
3,000 Armed Forces Reduction:
Housing units lost 1,664 275 193 2,131
% Increase in vacant housing 9.2% 4.2% 7.4% 7.8%
2,000 Armed Forces Reduction:
Housing units lost 1,109 183 129 1,421
% Increase in vacant housing 6.1% 2.8% 4.9% 5.2%
1,000 Armed Forces Reduction:
Housing units lost 555 92 64 710
% Increase in vacant housing 3.1% 1.4% 2.5% 2.6%
Source: U.S. Census Bureau
Defense Contracting Sector
Consistent with the declines in troop strength that have occurred at Fort Bragg over the 2012-
2016 period (Table 3), there have also been declines in defense contracting activity.
Prime contracting activity performed at Fort Bragg in FY 2016 totaled $668 million, down from over $1
billion in the 2011-2012 period. Similarly, subcontracting (which includes subcontracts performed at Fort Bragg where the primary
contract may have been controlled from a different location) in FY 2016 had declined to $92 million,
from a peak of over $1 billion in FY 2013. (Figure17)

Impact Greater Fayetteville
37
Figure 17: Defense Contracts Performed at Fort Bragg
Source: usaspending.gov
Analysis indicates a potential opportunity to increase the proportion of defense contracting
activity going to companies with North Carolina operations. Of the $4.3 billion in prime
contracts performed at Fort Bragg over the 2012-2016 period, approximately 15% were won by
North Carolina-based companies or North Carolina subsidiaries. This compares to
approximately 70% of prime defense contracts at the Army’s Redstone Arsenal installation
being performed in the nearby Huntsville, Alabama area. While 43% of the $2.7 billion in sub-
contracts performed at Fort Bragg over the 2012-16 period were won by North Carolina-based
operations, 97% of these North Carolina sub-contracts were construction-related, and thus not
sustainable over an extended period. Figure 18 provides an initial indication of the range of
contracting opportunities that have direct links to Fort Bragg activities.
$-
$200
$400
$600
$800
$1,000
$1,200
FY 2011 FY 2012 FY 2013 FY 2014 FY 2015 FY 2016
$ m
illio
ns
Defense Contracts Performed at Fort Bragg
Prime Sub-Contracts

Impact Greater Fayetteville
38
Figure 18: Prime Defense Contracting Performed at Fort Bragg, 2012-2016, Total=$4.3 billion
Source: usaspending.gov
Construction28%
IT Equip, Svcs & Software
20%Professional Support
17%
Utilities11%
Medical7%
Housekeeping5%
Equip Maint.5%
Education / Training4%
Food3%
Prime Defense Contracting Performed at Fort Bragg, 2012-2016, Total = $4.3 billion

Impact Greater Fayetteville
39
Troop Reduction Scenarios
As noted above, the number of active duty military personnel assigned to Fort Bragg has already declined by approximately 5,000 over the period FY 2012 to FY 2016 (Table 3). These declines were essentially “under the radar,” with no public announcements or descriptions. Since 2015, the only specific reductions that have been announced have been the closing of the 440th Airlift Wing in 2016, representing a reduction of over 1,000 personnel from peak levels, which was offset by an increase in another command. A reduction of another 840 Army soldiers was said to be expected by 2018, but no confirmed details were made public. The study team was asked to assess potential impacts associated with future troop reduction levels of 1,000, 2,000, and 3,000 personnel. Two different approaches were used to develop these illustrative projections of potential future outcomes.
o Scenario 1 is based on the 2013-2015 Armed Forces annual survey of consumer expenditures by military personnel and their families. This survey was used to determine the typical disposable income and expenditure patterns for 3,000, 2,000, and 1,000 soldiers. It assumed that (1) the drawdown of troops will continue to reflect the existing ratio of civilian personnel to the active duty soldiers; (2) other than the local installation contracts, the number and value of Department of Defense contracts are uncorrelated to the size of troops; and (3) the active duty soldiers who are separated from Fort Bragg do not stay in the area.
o Scenario 2 develops average salary of military personnel who may be reduced based on
the assumption that future reductions will take place primarily at the battalion level, weighted more heavily to more junior level personnel than would be assumed in Scenario 1. This second approach was also recommended by a military liaison affiliated with the Department of Defense Office of Economic Adjustment.
The personnel ranks and classification comprising a typical Army battalion (Figure 19) were used to compute personnel payroll. Adjustments were made in payroll for relevant federal taxes and saving rates to derive the disposable incomes for different personnel levels. The average disposable income was used to compute total disposable income for 3,000, 2,000, and 1,000 troops. It is assumed that separation of active duty soldiers will result in at least 10% reduction in civilian jobs. On consultant's recommendation, it was stipulated that one-quarter of civilian jobs will be in each of the following salary levels: GS 11, 12, 13, and 14. Relevant federal and state taxes and average saving rates were deducted to obtain total civilian disposable income.

Impact Greater Fayetteville
40
Figure 19: Generic 500-Soldier U.S. Army Battalion (for planning purposes)
Source: Planning Document of the U.S. Army
(500)
Total Battalion
HQ Company
Company A Company B Support Company
IntelSection
Logistics Section
Medical Section
HQ Platoon
(125) (100) (75)
(15)
(10)
(10)
(33)
(100)
Company C
(100)
PersonnelSection (10)
OperationsSection (30)
Communications Section (15)
Maintenance Platoon
DistributionPlatoon
Feeding Section
HQ Platoon (5)
(15)
(17)
(38)
Special Staff (2)

Impact Greater Fayetteville
41
Potential Economic Impact of Further Troop Reductions
The IMPLAN econometric modelling software is used in this study to estimate the economic impact of troop reductions and increases at Fort Bragg. The IMPLAN Pro software is widely used by academic institutions and federal, state, and local governmental agencies. The software uses input-output tables to track how dollars injected into a sector are spent and then re-spent in other sectors of the economy, creating ripple effects in the entire region. Under Scenario 1, the IMPLAN results indicate (Table 11):
o A reduction of 3,000 troops could result in the loss of approximately 5,000 full-time and part-time jobs in the three-county region (including the loss of troops), approximately $618 million in sales, $264 million in wages and salaries, and $12 million in tax revenues.
o With a 2,000 troop reduction, the three-county region will lose 3,238 full-time and part-
time jobs, approximately $416 million in sales, $176 million in wages and salaries, and about $8 million in taxes.
o With a 1,000 soldier draw down, the three-county region will lose 1,618 full-time and
part-time jobs, about $228 million in sales, approximately $88 million in wages and salaries, and about $4 million in state and local taxes.
Each 100 active-duty military jobs in the region support as many as 60 other jobs (including civilians at Fort Bragg). Each active-duty military job can support an average of as much as $90,000 in labor income, representing soldier income plus income for a soldier’s share of
supported jobs.
Table 11: Fort Bragg Troop Reduction Scenario 1: Economic Impact
3,000 Troop Reduction
Region Employment Labor Income Output State and Local Taxes
Cumberland County -4,847 ($264,458,573) ($617,522,885) ($12,087,902)
Harnett County -6.5 ($169,138) ($244,877) ($23,279)
Hoke County -2.5 ($35,895) ($176,356) ($5,167)
Total Impact -4,856.0 ($264,663,606) ($617,944,118) ($12,116,348)
2,000 Troop Reduction
Region Employment Labor Income Output State and Local Taxes
Cumberland County -3,231.9 ($176,305,715) ($411,681,907) ($8,058,259)
Harnett County -4.3 ($112,759) ($4,429,918) ($15,512)

Impact Greater Fayetteville
42
Hoke County -1.6 ($23,932) ($117,836) ($3,444)
Total Economic Impact
-3,237.80 ($176,442,406) ($416,229,661) ($8,077,215)
1,000 Troop Reduction
Region Employment Labor Income Output State and Local Taxes
Cumberland County -1,615 ($88,152,857) ($227,884,333) ($3,710,243)
Harnett County -2.2 ($56,379) ($87,257) ($7,759)
Hoke County -0.8 ($11,966) ($23,916) ($1,723)
Total Impact -1.618 ($88,221,202) ($227,995,506) ($3,719,725) Source: IMPLAN model and authors’ calculations
As expected, the residents of Cumberland County will bear the brunt of the adverse economic impact of reduction in troops. For example, for a loss of 3,000 soldiers, over 99% of the region’s reductions in jobs, wages, and sales would occur in Cumberland County. The top ten industries impacted given the Scenario 1 approach are shown in Table 12. Other than the federal government, the major sectors that will lose jobs are limited-service restaurants, full-service restaurants, real estate sector, office of physicians, general merchandise stores, nursing and community care facilities, food and drinking places, food and beverages stores, and personal care services. The real estate sector will lose almost 49 jobs and $8 million in sales. The offices of physicians will see a reduction of 37 jobs and a loss of about $5 million in sales. Offices of physicians and nursing facilities together will also experience about $4 million reduction in wages and salaries. Top ten losers in terms of wages and salaries are also shown in the table.
Table 12: Top Ten Industries/Sectors
Cumberland County
Top Ten Sectors by Employment Total Employment
536 * Employment and payroll of federal govt., military -4,044.0
502 Limited-service restaurants -62.7
501 Full-service restaurants -57.9
440 Real estate -48.7
475 Offices of physicians -36.8
405 Retail - General merchandise stores -35.7
483 Nursing and community care facilities -30.7
503 All other food and drinking places -26.8
400 Retail - Food and beverage stores -24.3
509 Personal care services -24.2

Impact Greater Fayetteville
43
Top Ten Sectors by Labor Income Total Labor Income
536 * Employment and payroll of federal govt., military -258,262,072.4
475 Offices of physicians -3,089,430.8
501 Full-service restaurants -1,085,560.1
434 Nondepository credit intermediation and related activities
-1,061,034.6
502 Limited-service restaurants -940,052.9
483 Nursing and community care facilities -919,302.4
504 Automotive repair and maintenance, except car washes -914,022.4
405 Retail - General merchandise stores -907,154.5
396 Retail - Motor vehicle and parts dealers -855,422.3
395 Wholesale trade -811,931.5
Top Ten Sectors by Output Total Output
536 * Employment and payroll of federal govt., military -495,893,093.0
441 Owner-occupied dwellings -17,101,382.0
440 Real estate -8,392,286.1
475 Offices of physicians -4,911,116.0
502 Limited-service restaurants -4,368,363.2
428 Wireless telecommunications carriers (except satellite) -2,746,040.8
395 Wholesale trade -2,725,459.5
501 Full-service restaurants -2,324,109.7
405 Retail - General merchandise stores -2,182,999.4
433 Monetary authorities and depository credit intermediation
-2,004,096.6
Copyright 2016 Minnesota IMPLAN Group, Inc.
The economic impact of potential reduction of troops in Scenario 2 is similar to Scenario 1, although smaller. Scenario 2 impacts include (Table 13):
o With a 3,000 troop reduction, the region will lose approximately 3,630 jobs (including the loss of troops), $450 million in sales, $107 million in wages and salaries, and $5 million in state and local tax revenues.
o With a 2,000 troop reduction, the region will lose 2,395 jobs, $291.3 million in sales,
$63.7 million in wages and salaries, and about $3 million in state and local taxes.
o With 1,000 troop reduction, the region will lose approximately 1,209 jobs, $105 million in sales, $35.8 million in wages and salaries, and about $1.7 million in state and local taxes.

Impact Greater Fayetteville
44
Table 13: Fort Bragg Troops Reduction Scenario 2 Economic Impact
3,000 Troop Reduction
Region Employment Labor Income Output State and Local Taxes
Cumberland County
-3,627 ($107,589,895) ($450,204,241) ($5,147,004)
Harnett County -2.6 ($68,811) ($262,356) ($9,479)
Hoke County -1 ($14,605) ($71,900) ($2,102)
Total Impact -3,630.6 ($107,673,311) ($450,538,497) ($5,158,585)
2,000 Troop Reduction
Region Employment Labor Income Output State and Local Taxes
Cumberland County
-2,393 ($63,659,523) ($291,115,618) ($3,026,483)
Harnett County -1.6 ($40,714) ($155,232) ($5,543)
Hoke County -0.6 ($8,641) ($45,548) ($1,243)
Total Economic Impact
-2,395.20 ($63,708,878) ($291,316,398) ($3,033,269)
1,000 Troop Reduction
Region Employment Labor Income Output State and Local Taxes
Cumberland County
-1,208 ($35,783,426) ($105,041,297)) ($1,712,323)
Harnett County -0.9 ($22,886) ($87,257) ($3,151)
Hoke County -0.3 ($4,857) ($29,916) ($699)
Total Economic Impact
-1,209.20 ($35,811,169) ($105,158,470) ($1,716,173)
Multipliers Employment Output Labor Income
Multiplier Multiplier Multiplier
3,000 Troops 1.1 1.08 1.1
Source: IMPLAN model and authors’ calculations
The impact of a reduction of 3,000 soldiers on the top ten sectors by labor income, output, and employment are shown in Table 14. The major industries that will be impacted by the drawdown of 3,000, 2,000, and 1,000 troops will be federal government, limited-service restaurants, real estate, retail, and offices of physicians, nursing, and community care facilities.

Impact Greater Fayetteville
45
Table 14: Top Ten Impacted Sectors by Labor Income
Description Labor Income
* Employment and payroll of federal govt., military -75,383,357.5
* Employment and payroll of federal govt., non-military -21,599,222.9
Offices of physicians -1,160,143.1
Full-service restaurants -407,649.6
Nondepository credit intermediation and related activities -398,439.7
Limited-service restaurants -353,008.7
Nursing and community care facilities -345,216.5
Automotive repair and maintenance, except car washes -343,233.7
Retail - General merchandise stores -340,654.7
Retail - Motor vehicle and parts dealers -321,228.2
Top Ten by Output Total Output
* Employment and payroll of federal govt., military -367,873,213.8
* Employment and payroll of federal govt., non-military -46,261,371.7
Owner-occupied dwellings -6,421,911.4
Real estate -3,151,471.5
Offices of physicians -1,844,222.4
Limited-service restaurants -1,640,407.9
Wireless telecommunications carriers (except satellite) -1,031,193.3
Wholesale trade -1,023,464.6
Full-service restaurants -872,749.7
Retail - General merchandise stores -819,760.0
Top Ten by Employment Total Employment
* Employment and payroll of federal govt., military -3,000.0
* Employment and payroll of federal govt., non-military -300.0
Limited-service restaurants -23.5
Full-service restaurants -21.8
Real estate -18.3
Offices of physicians -13.8
Retail - General merchandise stores -13.4
Nursing and community care facilities -11.5
All other food and drinking places -10.1
Retail - Food and beverage stores -9.1 Copyright 2016 Minnesota IMPLAN Group, Inc.
Economic Impact by Other Major Industries The impacts on specific industries in Scenario 1 and 2 are further detailed in Table 15. The estimates are based on the 2013-2015 Annual Expenditure of Armed Forces Survey of

Impact Greater Fayetteville
46
disposable income of most of the households included in the survey. In Scenario 1, the actual spending on each item was multiplied by the number of soldiers to obtain the total spending. Scenario 2 expenditures are based on the total disposable income of a generic battalion. The total spending was calculated by multiplying average spending of all consuming units in the survey by the total disposable income of 3,000, 2000, and 1,000 soldiers. The potential reduction of 3,000 soldiers under Scenarios 1 and 2 will impact other major industries as follows: the food industry will lose sales between $24 and $9.5 million; restaurants between $8.7 and $3 million; alcoholic beverages between $1.5 million and $867,796; furniture industry between $1.6 million and $593,546; new cars and trucks dealers between $5.7 and $2.8 million; used cars and trucks between $7.5 and $2.5 million; entertainment industry between $9 and $3.7 million; personal care products and services between $2 million and $909,570; and major appliances between $782,910 and $336,397.
Table 15: Impact by Major Industries
Scenario 1 Scenario 2
Total 3,000
Troops Total 2,000
Troops Total 1,000
Troops
Total 3,ooo Troops
Total 2,ooo Troops
Total 1,ooo Troops
Food $24,459,540 $16,306,360 $6,879,380 $9,571,565 $6,381,043 $3,190,422
Meals at restaurants, carry outs and other*
$8,734,590 $5,833,060 $2,338,060 $3,374,829 $2,249,879 $1,124,591
Alcoholic beverages $1,542,450 $1,028,300 $383,890 $867,796 $445,196 $222,538
Housing $12,828,270 $8,552,180 4,376,090 $4,005,159 $2,698,099 $1,734,689
Mortgage interest and charges
$825,230 $550,620 $275,310 $520,470 $346,970 $173,442
Household furnishings and equipment
$5,523,980 $3,669,320 $1,132,100 $2,321,116 $1,546,517 $773,696
Furniture $1,615,890 $1,077,260 $362,450 $593,546 $394,495 $197,859
New cars and trucks $5,784,480 $3,856,320 $896,600 $2,385,796 $1,589,581 $795,240
Used cars and Trucks $7,511,040 $5,007,360 $2,225,520 $2,501,078 $1,666,390 $833,666
Major appliances $782,910 $521,940 $137,710 $336,397 $224,264 $112,128
Gasoline and motor oil $8,657,430 $5,771,620 $2,405,030 $3,104,394 $2,068,360 $1,120,890
Vehicle insurance* $3,050,970 $2,033,980 $884,730 $1,504,379 $1,002,321 $501,444
Leased and rental vehicles
$2,092,800 $1,395,200 $539,400 $400,200 $266,641 $133,396
Health insurance $7,167,540 $4,778,360 $1,613,550 $3,770,259 $2,512,005 $1,265,713
Hospital room and services
$472,740 $311,160 $91,560 $183,579 $122,313 $61,191

Impact Greater Fayetteville
47
Entertainment $9,073,830 $6,049,220 $2,054,230 $3,780,245 $2,518,659 $1,260,042
Personal care products and services
$2,089,680 $1,393,120 $557,020 $909,670 $606,084 $303,212
College tuition $754,410 $502,940 $25,790 $1,107,701 $736,518 $368,245
Elementary and high school tuition
$519,150 $346,100 $86,610 $216,903 $144,600 $72,298
Legal fees $433,590 $289,060 $121,100 $183,593 $122,322 $61,395
Accounting fees $145,110 $96,740 $33,440 $94,565 $63,605 $31,820
Cash contributions to charities and other organizations
$268,800 $179,200 $89,600 $300,833 $200,436 $100,274
Cash contributions to church, religious organizations
$1,901,640 $1,267,760 $89,600 $1,024,722 $682,650 $341,518
Cash contribution to educational institutions
$129,180 $86,120 $63,600 $60,578 $40,361 $20,192
Source: 2013-2015 Annual Expenditure of Armed Forces Survey and authors’ calculations.

Impact Greater Fayetteville
48
Target Sectors The purpose of this Target Industry Validation is to review, identify, update, and validate promising industry sectors for the Fayetteville region including Cumberland, Harnett, and Hoke Counties. By recruiting new companies to the region, the potentially negative economic impacts of troop reductions can be mitigated. Beyond the scope of troop reductions or increases, the Fayetteville region should seek to diversify the economy. Objective II B in Fayetteville’s FY2017-18 strategic plan is “to implement strategies that diversify the city’s tax base and increase the industrial and commercial tax bases.” Before implementing target marketing awareness and business attraction, retention, and expansion strategies, it is critically important that proper analysis and research be done. Matching the strengths and assets of the Fayetteville region with the needs of growing and expanding companies is vital to the success of targeting. For this study, we looked at area advantages the region can build upon to expand their economic base. We also analyzed the target sectors of each county to ensure our recommendations do not conflict with local strategies. We factored in economic and demographic trends, industry growth trends, and existing industries in the region. In addition, we evaluated industry and company types which would find the Fayetteville region attractive. Fayetteville possesses many assets and strengths, including infrastructure, location, workforce, and military resources. We also want to recognize the natural resources, recreational opportunities, and overall quality of life. Our objective is to recommend industries that are the most feasible and the most desirable for the region. Based on our research and analysis, we recommend the following target industry sectors.
o Logistics and Warehousing o Defense and Security o Advanced Manufacturing o Business Services
Recommended Targets
Logistics and Warehousing Fayetteville is in the perfect location to take advantage of the opportunities in Logistics and Warehousing. The existing logistics and distribution industry in the region is flourishing for good reason. The transportation assets of the region are evident – with ready access to interstates, rail, and airports. Fayetteville’s location is also in the center of the Eastern seaboard with access to a large population. Additionally, Fayetteville and the surrounding region have a skilled workforce for this cluster, as evidenced from the existing companies. The industry cluster is broad, including

Impact Greater Fayetteville
49
freight forwarding, warehousing, wholesaling, e-commerce, and supply chain planning segments.
Defense and Security The Fayetteville region can build upon the Defense and Security Cluster existing in the region, with a focus on traditional segments, as well as developing technologies such as unmanned aerial vehicles, robotics, and biometrics. The Fayetteville region has a long military history and represents the largest Army base in the world. Even if government spending on defense remains flat, commercial applications will continue their growth. While the Fayetteville region doesn’t want to be dependent on the military for industry growth, the region’s association with the military is known worldwide. That reputation will help open conversations with leads and prospects. The military presence at Fort Bragg and the large pool of skilled workers in the area will encourage growing and expanding companies to consider the area to access the talent pool. The educational assets in the region also support this industry well. The defense and security industry cluster can include search and navigation instruments, aerospace, communications equipment, wiring, cybersecurity, and other related areas. There may be significant growth potential associated with increasing the share of defense contracts performed for Fort Bragg commands that are fulfilled by companies with significant local presence. As an example, almost two-thirds of contracts performed for commands based at Redstone Arsenal in Alabama are fulfilled by companies with a major presence in the near-by Huntsville, Alabama, metropolitan area. This contrasts with what appears to be less than 20% of Fort Bragg contracts being fulfilled by companies with local presence in the greater Fayetteville region. There may be opportunities to attract on a targeted basis companies fulfilling contracts from other states to locate major offices near Fort Bragg. There may also be opportunities to help existing small defense contractors or other businesses in the region grow with targeted assistance focused on commercializing military technology. The Department of Defense has initiatives currently underway to help drive military technology into non-military applications. Designing and manufacturing unmanned aerial vehicles for agricultural applications is one example.
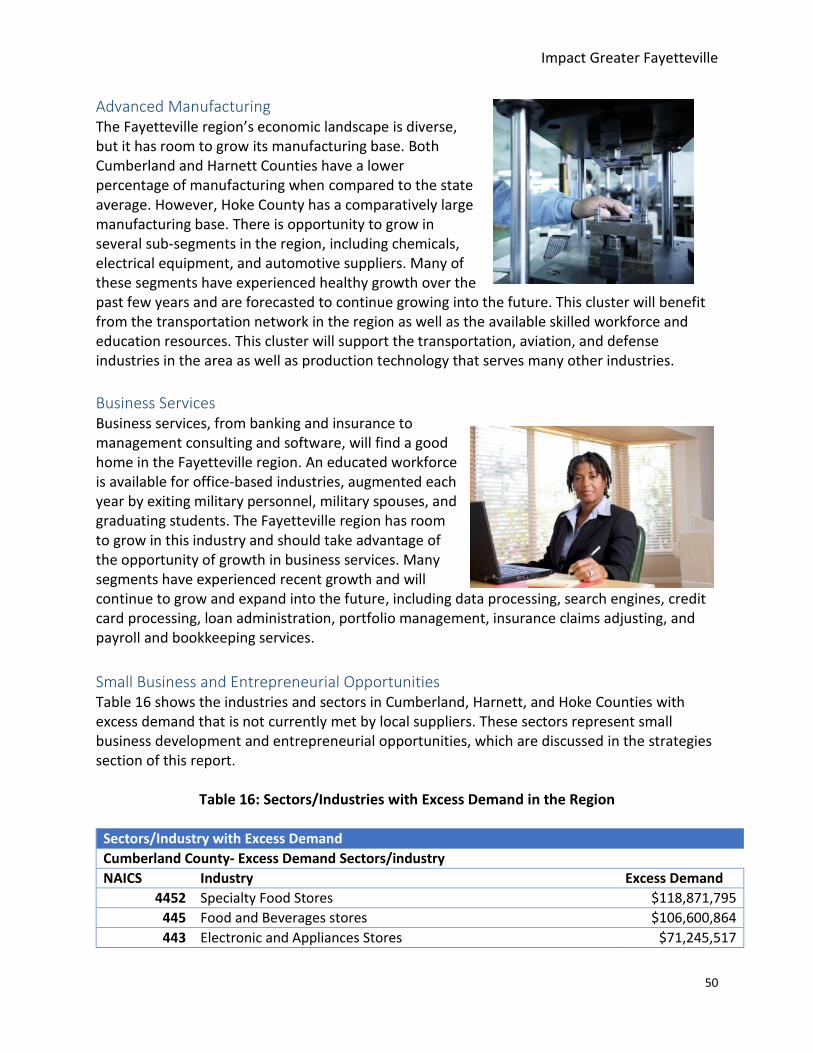
Impact Greater Fayetteville
50
Advanced Manufacturing The Fayetteville region’s economic landscape is diverse, but it has room to grow its manufacturing base. Both Cumberland and Harnett Counties have a lower percentage of manufacturing when compared to the state average. However, Hoke County has a comparatively large manufacturing base. There is opportunity to grow in several sub-segments in the region, including chemicals, electrical equipment, and automotive suppliers. Many of these segments have experienced healthy growth over the past few years and are forecasted to continue growing into the future. This cluster will benefit from the transportation network in the region as well as the available skilled workforce and education resources. This cluster will support the transportation, aviation, and defense industries in the area as well as production technology that serves many other industries.
Business Services Business services, from banking and insurance to management consulting and software, will find a good home in the Fayetteville region. An educated workforce is available for office-based industries, augmented each year by exiting military personnel, military spouses, and graduating students. The Fayetteville region has room to grow in this industry and should take advantage of the opportunity of growth in business services. Many segments have experienced recent growth and will continue to grow and expand into the future, including data processing, search engines, credit card processing, loan administration, portfolio management, insurance claims adjusting, and payroll and bookkeeping services.
Small Business and Entrepreneurial Opportunities Table 16 shows the industries and sectors in Cumberland, Harnett, and Hoke Counties with excess demand that is not currently met by local suppliers. These sectors represent small business development and entrepreneurial opportunities, which are discussed in the strategies section of this report.
Table 16: Sectors/Industries with Excess Demand in the Region
Sectors/Industry with Excess Demand
Cumberland County- Excess Demand Sectors/industry
NAICS Industry Excess Demand
4452 Specialty Food Stores $118,871,795
445 Food and Beverages stores $106,600,864
443 Electronic and Appliances Stores $71,245,517

Impact Greater Fayetteville
51
447 Gasoline Stations $29,067,044
4412 Other Motor Vehicles Dealers $19,179,338
4453 Beer, wine, and Liquor Stores $9,518,640
4442 Lawn & Garden Equipment Supply Stores $8,912,064
4512 Books, Periodicals, and Music Stores $7,305,590
4483 Jewelry, Luggage, and Leather Goods Stores $4,096,069
7223 Special Food Services $2,665,089
7224 Drinking Places-Alcoholic Beverages $941,440
4533 Used Merchandise stores $295,220
Harnett County- Excess Demand Sectors/industry
NAICS Industry Excess Demand
452 General Merchandise Stores $121,589,741
4521 Department Stores excluding leased Departments $92,357,060
441 Motor Vehicles and Parts Dealers $72,369,671
4411 Automobile Dealers $51,683,618
448 Clothing and Clothing Specialty Stores $47,849,557
4452 Specialty Food Stores $42,729,539
443 Electronic and Appliances Stores $40,612,988
722 Food Services and Drinking Places $36,245,968
4481 Clothing stores $33,244,535
4529 Other Merchandise Stores $29,232,681
7221 Full service restaurants $25,110,802
453 Miscellaneous Store Retailers $24,994,285
451 Sporting Goods, Hobby, Book and Music Stores $23,432,353
4412 Other Motor Vehicles Dealers $23,247,950
454 Non-stores Retailers $22,690,780
4441 Bldg Materials and Supply Dealers $20,164,871
4539 Other Miscellaneous Stores Retailers $19,939,839
4541 Electronic Shopping and Mail-order Houses $18,360,460
4511 Sporting Goods, Hobby, and Musical instrument Stores $18,320,132
444 Bldg Materials, Garden Equip and Supplies $15,994,448
442 Furniture and Home Furnishings $13,806,470
4421 Furniture stores $9,372,208
4483 Jewelry, Luggage, and Leather Goods Stores $8,926,985
7222 Limited service eating places $6,235,111
4532 Office supplies, Stationary, and Gifts Stores $6,062,522
7224 Drinking Places-Alcoholic Beverages $6,015,941
4482 Shoe Stores $5,678,037
4512 Books, Periodicals, and Music Stores $5,112,221
4422 Home Furnishings Stores $4,434,262
4543 Direct Selling Establishments $3,414,533
4542 Vending Machines Operators $915,787
Hoke County- Excess Demand Sectors/industry

Impact Greater Fayetteville
52
NAICS Industry Excess Demand
441 Motor Vehicles and Parts Dealers $105,410,540
4411 Automobile Dealers $91,224,024
445 Food and beverages stores $53,004,844
4451 Grocery Stores $34,439,999
722 Food Services and Drinking Places $29,064,135
448 Clothing and Clothing Accessories Stores $22,359,196
443 Electronic and Appliances Stores $21,481,614
443 Electronic and Appliances stores $21,481,614
444 Bldg Materials, Garden Equip and Supplies $20,624,928
4441 Bldg Materials and Supply Dealers $19,022,043
4441 Bldg Materials and supply dealers $19,022,043
4452 Specialty Food Stores $17,638,583
446 Health and Personal care stores $15,804,471
4482 Shoe Stores $15,350,457
4481 Clothing stores $15,350,457
7222 Limited service eating places $13,905,689
4529 Other General Merchandise Stores $13,139,150
7221 Full service restaurants $12,238,585
453 Miscellaneous Store Retailers $10,839,340
451 Sporting Goods, Hobby, Book, and Music Stores $10,496,599
447 Gasoline Stations $10,496,599
442 Furniture and Home Furnishings $9,473,764
4412 Other Motor Vehicles Dealers $8,838,187
4511 Sporting Goods, Hobby, Musical instrument Stores $7,513,235
4539 Other Miscellaneous Stores Retailers $6,535,758
4413 Auto Parts, Accessories, and Tire Services $5,348,329
4421 Furniture stores $5,231,084
4483 Jewelry, Luggage, and Leather Goods Stores $5,006,311
4422 Home Furnishings Stores $4,242,680
4422 Home Furnishings Stores $4,242,680
4541 Electronic Shopping and Mail-order Houses $4,018,395
4512 Books, Periodicals, and Music Stores $3,014,563
4532 Office supplies, Stationary, and Gifts Stores $2,537,562
454 Non-stores Retailers $2,537,562
7224 Drinking Places Alcohol beverages $2,307,500
4543 Direct Selling Establishments $1,976,712
4442 Lawn and Garden Equipment and Supplies $1,602,985
4533 Used merchandise stores $1,380,510
4453 Beer, Wine, and Liquor stores $926,262
7223 Special Food Services $612,361
4531 Florists $385,510 Source: ESRI Reports

Impact Greater Fayetteville
53
Workforce Development Strategies
Synopsis The Fayetteville State University (FSU) team prepared an inventory of the skills and experiences of expected separating soldiers and impacted civilian workers and matched them with the labor force needs of the region. The bottom line result is positive - there does not seem to be a major disconnect between the numbers or abilities of separating soldiers and needs of the region. Where additional training is indicated, special arrangements can be made with the regional community colleges including Fayetteville Technical Community College (FTCC), Sandhills Community College (SCC), and Central Carolina Community College (CCCC) to provide much of the “gap” education, and/or perhaps with the area’s three universities as well. To those separating soldiers and civilians who aspire to start their own businesses, technical and business planning assistance can be provided by the FTCC, SCC, and CCCC Small Business Centers, the FSU Small Business and Technology Development Center (SBTDC), and Veteran Business Outreach Center (VBOC). Those who lose Fort Bragg base support contracts can be provided technical assistance through the FTCC-based Military Business Center (this might include contractors, suppliers, and service providers). Longer term, the education, training, and workforce and economic development entities will need to work much more closely together to develop skills and talent pipelines for any emerging cluster industries and sector employers involved in any diversification strategy across the tri-county region. It is hoped that this plan will help guide civilian and military service providers and increase awareness of private and public sector employers regarding this talent pool for the tri-county region and larger state labor market.
Detailed Workforce Development Implementation Planning Approach Based on the results of the economic analyses of the three major impact counties, both current and future recommended scenarios, a set of implementable recommendations regarding inter-related and dependent workforce/talent and economic development and education issues are included in this overall assessment and proactive action plan. While the FSU team possessed expert knowledge of these realms, the in-depth analysis and recommended strategies that

Impact Greater Fayetteville
54
follow include input from many other key Workforce/Economic Development (WD/ED) and education community/regional stakeholders/partners, including: two sister four-year institutions: Methodist University and Campbell University; FSU’s SBTDC and VBOC; three regional community colleges (including their Small Business Centers and FTCC’s Military Business Center); three local Workforce Development Boards; Chambers of Commerce; Fort Bragg’s Transition Assistance Program (TAP f/d/b/a ACAP); Military and Veterans organizations; and local/area Economic Developers. Some of the region’s largest private (and public including federal, state, and local government) employers were also consulted. Once the predicted impact of personnel losses on the tri-county region’s various economic and employment sectors/occupations was determined, recommendations were developed and proposed for each major cluster including health care, retail, hospitality, services, real estate, and defense (especially contractor and supporting businesses). Workforce skill sets and strategies to assist and transition military personnel were identified, but additionally, new and/or increased workforce pipelines may need to be developed, including via continuing education and entrepreneurial preparation. One overall goal is to keep businesses and skilled workers in the region as the experience and education represented by these workers could complement other tri-county employers as well. Another objective is to help with sector diversification efforts. To those two ends, the FSU team - working with key stakeholders/partners and collaborative steering committee/s - created a shorter-term roadmap for assistance to affected workers and businesses in this section; and longer-term recommendations to revitalize and further diversify the regional economy and labor market elsewhere in this report.
In general, the implementation plan regarding Workforce/Economic Development issues
includes the following action items:
Providing coordinated outreach and assistance for all dislocated workers – both military and
civilian – and small to medium-sized businesses impacted to retain talent, jobs, and
employers in the region. Specifically healthcare, retail, hospitality, services, real estate, and
defense.
Bridging any skills gaps jobseekers may face including IT/computer, work readiness,
soft/interpersonal, and job finding/getting/holding skills training or retraining/up-skilling
(credential stacking/latticing) so people can seek, gain, and keep new employment.
Fostering entrepreneurism so some displaced workers might become small business owners
and existing small firms might continue to prosper.
Adjusting, aligning, and enhancing regional economic and workforce development
strategies, including perhaps diversification, using this new and more accurate data.
Developing, attracting new, and/or expanding existing businesses across the tri-county area
-- perhaps including cluster development.
Assisting the growth and expansion of new/existing industry cluster(s) that are less reliant
on federal defense contracts.

Impact Greater Fayetteville
55
Developing and launching career information education efforts around key growth
industries and their major occupations throughout the regional k-20 and workforce/training
system.
Other challenges that may need to be addressed and overcome include the fact already recognized and published by OEA that the effects of relatively small/er reductions such as those considered here can be masked until the cumulative effects ultimately become visible, necessitating early identification of and assistance to “at-risk” workers, companies, and sectors. This entire effort might also include the need for a coordinated initiative to advertise the
region as a good place for veterans to live, work, and play due to its military friendly communities.
Specific Skill Set Analyses For any active duty military and military civilians attached to Fort Bragg and involved in a reduction-in-force scenario, military occupational skills (MOS) needs to be addressed. This will ease the potential transition to civilian employment in the tri-county region. In this study we looked at the major and most prevalent occupational codes and skill sets, which were then compared to existing civilian occupations using conversion cross-walks or translators - namely O*Net Online and CareerOneStop. Then these were compared with the Standard Occupational Classification (SOC) system from the U.S. Bureau of Labor Statistics for occupational matchmaking in key current regional and future growth sectors.
For purposes of this study, it has been determined that the five most common military occupational specializations for Fort Bragg’s active military personnel are: Infantryman (11B); Health Care Specialist (68W); Wheeled Vehicle Repairer (63W/91B); Military Police (31B); Combat Engineer (12B); and Food Service Specialist (99B). These occupations match quite closely those identified by a survey used to publish “Military Human Capital Snapshot, Fort Bragg - Fayetteville, NC,” January, 2016, an assessment of the transitioning military workforce at Fort Bragg. This particular military occupational skills mix shows strong correlation with several of the tri-county Fort Bragg region’s largest civilian sectors/occupations, including growing areas in health care, public administration, public safety/homeland security, business management, logistics, and food service occupations. It also shows alignment with the target sectors of defense and security, and segments of advanced manufacturing. At any given time, per NCWorks data, there are approximately 4,000 jobs available in the Fayetteville MSA (again, that includes Cumberland and Hoke counties). In a typical month, there are an average 7,000 job openings advertised online. Both counts are relatively unduplicated. Cumberland County usually represents the 5th highest number of job openings advertised across North Carolina. Concurrently, there are about 14,000 potential candidates in any given month in the local MSA. The actual number of unemployed in the MSA is usually at a

Impact Greater Fayetteville
56
1:1 ratio to advertised online job openings. The major jobs at any given time are Truck Drivers; Nurses; Network & Computer Systems Administrators; Computer User Support Specialists; Retail Salespersons and Supervisors; Maintenance & Repair Workers; and Customer Service Representatives. Again, these occupations match up nicely with those military/civilian labor force impacted in our scenario and some of the target sectors identified for recruitment.
The employers usually with the highest number of job openings advertised online in this MSA are: General Dynamics; CACI; Department of Veterans Affairs; Booz Allen Hamilton; Cape Fear Valley Health System; Army Medical Command; FSU; SENTEL Corporation; Cumberland County; Cumberland County Schools; U.S. Army; Burger King Corporation; Harris Teeter Inc.; ManTech International Corporation; Leidos Holdings, Inc.; Compass Group; and PSA Healthcare. The nature of these employers matches quite closely the occupational skills of the military and civilian workers plus spouses potentially impacted. Furthermore, the most common minimum education requirement is high school diploma or equivalent; the 2nd most common requirement is a Bachelor of Science degree. Meanwhile, the most common education level of potential candidates (in the NCWorks system) is high school diploma or equivalent, with the 2nd most common level being 1-3 years of college or a technical or vocational school. The most common minimum experience requirement is entry level, with 1-2 years coming in 2nd. However, the most common level of experience of potential candidates was over 10 years; and 5-10 years at 2nd place. The average weekly wage for the MSA is approximately $750, or $18.75 an hour or $38,750 annualized full-time. This is ranked 8th in the state. While relatively low, it matches the minimum desired wage of available candidates – with the most common being the $20-$35K range and 2nd being the $35-$50K range.
Future Growth Occupations In addition to simply noting and matching current and projected occupational demand with existing labor skill sets, it is also valuable to point out opportunities to provide community college type training and university education for selected high potential skill types, particularly for exiting soldiers and military – civilians who are probably knowledgeable in these areas, and particularly since this has been pointed out in other studies as an opportunity worth building upon to attract companies to locate operations here. Many military-connected personnel also possess valuable security clearances. In order to develop a more highly skilled and educated workforce for the future – more in alignment with sectors and careers inherent in further diversifying the economy more towards STEM (Science, Technology, Engineering, and Math) disciplines - it is also important to put more emphasis on the potential to develop workforce talent along dimensions that would attract new and/or additional companies to locate here in targeted, high-paying industries that could leverage defense or other special assets, such as the advanced manufacturing sectors of aerospace, virtual reality simulation, and remotely piloted aircraft, in addition to an emphasis on preparing excess workforce for where the most jobs are currently, such as retail.

Impact Greater Fayetteville
57
As noted elsewhere, there are already programs for incumbent worker training and education meant to help current employees upgrade their skills. There are also customized training programs offered by the NC Community College System. As their website states:
“The NC Community College System’s Customized Training Program provides education, training, and support services for new, expanding and existing business and industry in North Carolina through our network of 58 community colleges, serving all 100 counties of the state. Our goal is to foster and support three key aspects of your company's well-being:
Job Growth Technology Investment Productivity Enhancement All solutions are the result of collaboration with the management team and customizing the training to meet specific objectives adding to business success.”
A review of the potential sectors targeted and discussed elsewhere in this report includes the following:
o Logistics and Warehousing
o Defense and Security
o Advanced Manufacturing
o Business Services
A fifth sector of growth not necessarily requiring any additional economic development
recruitment efforts is:
o Health Care/Life Science
On balance, these five sectors require a higher order of knowledge, skills, and abilities (KSAs) leading to equally higher incomes. This means at least some of the focus for the tri-county region needs to be placed on preparing new workers for future jobs in the identified sectors for possible potential growth. While there are some jobs in each sector that may only require a high school diploma and/or short to moderate on-the-job training (OJT), or a certificate, many others will require either longer term OJT and/or college degrees including 2+2 and advanced programs. Several jobs involve technical aspects that are tied into the STEM disciplines; many of these are also tied back to established career pathways in the K-20 education systems.
One area that almost all local employers express a need for is for more customer service, interpersonal and sales skills, and training for the same. In fact, the Greater Fayetteville Chamber of Commerce is planning to offer a series of communications classes for existing employers and their employees. Regional educational institutions would be wise to offer even more education and training in these critical topics as well.

Impact Greater Fayetteville
58
The Chamber is also going to be sponsoring a series of business and education roundtables on a quarterly basis to help identify and meet other skills gaps.
Much of this “trainsition” work, of course, also depends on the ability of the tri-county region to attract more business and industry operating in the five targeted growth sectors. This would need to be done in concert with local workforce development and public and post-secondary education leaders to ensure that their talent development and supply programs and pipelines are aligned and adequate to meet future demand. The number one indicator that corporate site locators use in determining to build, move, or expand operations is the quality and quantity of the local labor force and education/training system needed to produce such qualified workers.
One prime local example of an institution of higher learning developing and offering such in-demand and higher level programs is Campbell University in Harnett County. Over the last few years, partly in response to regional labor market needs and projections, the university has rolled out new undergraduate programs in nursing, engineering, homeland and cyber-security, and new graduate and professional programs including physical therapy and osteopathic medicine. Each of these fits one of the target growth sectors identified in this report. Also, FSU has developed award-winning programs in health care and health care administration, business, management information systems, and K-12 teaching, and has developed customized project management and cybersecurity graduate level programs for both military personnel and civilians. The university is also strong in preparation for criminal justice-related occupations. BRAC efforts led to the opening of the Center for Defense and Homeland Security housing training academies in cybersecurity, emergency management, and national security.
One other local example for community colleges is FTCC’s launch of its cutting-edge Collision Repair and Refinishing Technology curriculum that prepares individuals to apply technical knowledge and skills to repair, reconstruct, and finish hi-tech automobile bodies, fenders, and external features. They also have a relatively new simulation and game development curriculum. Finally, the local public school systems – notably Cumberland County’s – have opened four early colleges, with two located at FSU. The third, located at FTCC, is called Polytechnic High School and focuses on vocational education mainly in STEM disciplines. In Hoke County, SandHoke Early College High School is a partnership between the Hoke County School System and Sandhills Community College. Harnett County may want to explore doing similar.
In Harnett County, there are now two apprenticeship programs tied into the public high schools, Computer-Integrated Machining Technology and Welding Technology. These were created by Harnett County Schools, the North Carolina Department of Commerce, Central Carolina Community College, and several local companies. As future success in the local, regional, national, or even global economy may require a two- or four-year degree, a certificate or diploma, the Career & College Promise (CCP) program allows qualified high-school-age

Impact Greater Fayetteville
59
students in North Carolina to pursue these options, tuition free, while they are in high school. This allows students to get a jumpstart on their workplace and college preparation.
To make even more progress in these nascent efforts, a career information education initiative would need to be planned, coordinated, and implemented, focused on the five future growth sectors presented here plus their major occupations. This would need to include at a minimum the K-12, secondary, and post-secondary education and training institutions as well as regional Workforce Development Board operations and partners, including industry. This effort could also help position the region for external grants and other funding opportunities involving career clusters and sector training. This effort would require more robust career, educational, and personal advising and counseling in the K-12 system so that middle and high school students could better understand the range of careers available with various levels of required education, training and skills. This recommendation is made in the strategies section.
The tri-county regional education, workforce, and economic development systems would need to be even more aligned with current and future talent needs of targeted industry sectors. Core competencies and industry-specific skills needed for the projected high/er growth and wage occupations in the region would need to be developed. This sector or cluster strategy is an approach that has been adopted across the country and not just in other military towns seeking diversification.
The regional umbrella leadership group would also need to have an on-going
process to continually analyze and update any workforce gap projections for each targeted growth industry to keep the talent re-skilled and up-skilled.
More programs in the educational systems that would provide WorkKeys
Assessment and Career Readiness Certificates (CRC) will be needed as well.
Examples of some specific courses that that are currently offered through regional K-12 Career Technical Education programs and are directly relevant to the target growth industries include: Drafting, Electronics, Biotechnology, Computer Integrated Manufacturing, Fundamentals of Technology, Manufacturing, and Transportation Systems. More would need to be developed, along with an increased number of apprenticeships and life-long-learning programs.
One such initiative already in the works is a multi-county Health Career Pathway that includes Cumberland and Hoke (and Moore, but not Harnett) Counties that is currently waiting for state approval to implement. This certified pathway will allow the partnership to develop programs in health care careers, plus provide additional funds for career awareness programs, work-based learning opportunities, apprenticeships, and job placement with large health care employers. The program was developed over a six-month period through meetings with industry, education, community partners, and government agencies to meet the continually
Impact Greater Fayetteville
60
growing demand for medical professionals. There is a continuum of jobs starting with direct patient care and nursing assistance through to medical assistance and health records IT, and from 2-year to advanced degrees. Each will be addressed in this program.
More of this type of aligned and integrated planning and model implementation will be needed in this region to meet talent needs for other clusters for up to a decade out.
Looking further into the future, even beyond the more stackable certifications mentioned above, increasing numbers of education providers – including universities – and/or businesses or industry consortia are launching series of nano-degrees in tech-focused courses that range from basic to complex STEM disciplines. Schools are doing so in partnership with employers, with a focus much more directly on employment and employability. Many non-traditional learners are taking courses to advance their careers. The world of work increasingly demands a quick response from the education and training system to provide people with desired qualifications. More entities will also need to offer recognized “micro-credentials” to accompany these nano-degrees, or areas of specialization. After all, people are much more likely to invest in training if it confers a qualification that others will recognize as useful. Another answer will be for the regional colleges and universities to make their courses more accessible by doing even more teaching online. This applies to regional K-12 education systems as well.
Goal: Invest in Education and Training The deciding site location factor for expanding companies is workforce. The deciding factor for most families relocating is schools. Three of the top ten things that make a community great relate to education: community college, public schools, and a research institution (Conway, Inc. 2015). Investing in educational programs that align with targeted growth sectors will reap wide ranging rewards in economic development, including attracting exiting and retiring military to stay in the region. Strategy: K-14 Education Action Steps:
Implement a program like the Greenwood Promise in Greenwood County, SC. Greenwood County is raising an endowment that will fund enough scholarships to pay for every high school graduate to attend Piedmont Technical College for two years. The community’s expectation then becomes a K-14 education rather than a K-12 education. Similar programs are up and running in Wythe County and the Roanoke Region in Virginia, as well as Laurens County, SC. Greenwood County has plans to continue fundraising to grow the endowment to provide a four-year college education at Lander University.

Impact Greater Fayetteville
61
In other communities it has been estimated that scholarships will need to be raised for approximately 35% of the graduating class, due to the fact that a portion will go to four-year schools, a portion will receive scholarships, and a portion will not participate. A regional fundraising effort could be the catalyst to fund an endowment that will provide for the scholarships. Such a regional fundraising effort is now being considered by the Freshwater Coast Foundation in Abbeville, SC. A program such as this will encourage military families to stay in the area after exiting because of the benefit of a college education for their children. This study found that more than half prefer to stay in the community.
Many communities across North Carolina have started early colleges, which allow
students to be dual enrolled in high school and community college. Students earn college credits while completing their high school requirements. Cumberland and Hoke Counties have early college programs. Harnett County should explore the program as a way to support education and workforce development.
Focus on specific courses that are offered through regional K-12 Career Technical Education programs and are directly relevant to the target growth industries such as: Drafting, Electronics, Biotechnology, Computer Integrated Manufacturing, Fundamentals of Technology, Manufacturing, and Transportation Systems.
Replicate the multi-county Health Career Pathway model for other target sectors. The model includes programs in careers, career awareness, work-based learning, apprenticeships, and job placement.
Strategy: Workforce Development Action Steps:
Implement a careers initiative for the five target sectors for recruitment (logistics and warehousing, defense and security, advanced manufacturing, and business services). Include K-12, secondary, and post-secondary education and training institutions as well as regional Workforce Development Board operations and partners including industry. A good example is the distribution training program in York County, SC. While learning about logistics, students apply their training to pack and distribute backpacks of food that are sent home with students on the weekends.

Impact Greater Fayetteville
62
Develop career awareness information for each of the five target sectors. We have found from other studies that marketing information for careers should contain:
o Information on types of jobs, skills, wages, and education requirements. o Images of people like the students in the work setting. o For exiting military, include the occupational code and how training align with
the sectors.
For an example of an award-winning career awareness video, view this: https://www.youtube.com/watch?v=SYRHwDmpb4Q&t=134s, created by the Henderson County Partnership for Economic Development, NC.
Harnett County’s best practice model of increasing apprenticeship programs can be expanded to Cumberland and Hoke Counties.
One area that almost all local employers express a need for is for more customer
service, interpersonal, and sales skills training. The Greater Fayetteville Chamber of Commerce is offering a series of classes on such topics for existing employers and their employees. We recommend that community college and university programs integrate this training into all curriculums that support the target clusters, as well as the major employment cluster of health care.
We have found in other studies that as many as 15% of employers require a Career Readiness Certificate, while less than 7% of military spouses or exiting military have one. We recommend increased marketing of the WorkKeys Assessment and Career Readiness Certificates (CRC). Through the community college system, the assessment is free to military and military dependents.
The regional leadership should have an on-going process to continually analyze and update workforce gap projections for each targeted growth industry to keep the talent re-skilled and up-skilled.
Provide coordinated outreach and assistance for all dislocated workers – both military
and civilian – and small to medium-sized businesses impacted to retain talent, jobs, and employers in the region, specifically health care, retail, hospitality, services, real estate, and defense.
Bridge any skills gaps jobseekers may face, including IT/computer, work readiness, soft/interpersonal, and job finding/getting/holding skills training or retraining/up-skilling (credential stacking/latticing) so they can seek, gain, and keep new employment.
Foster entrepreneurism so some displaced workers might become small business owners and existing small firms might continue to prosper.
Provide customer service, interpersonal, and sales skills and training for existing employers and their employees.
Impact Greater Fayetteville
63
Economic Development Strategy The development of a regional economy can be a daunting task. The investment needed is high; the projects are complex; and many partners are required. However, the Fayetteville region does not have a choice of whether to invest in economic development. Too much of the economy is reliant on the military and related industries, and military contributions to the economy have declined at the rate of 2-4% per year over the last few years. Like other communities once dependent upon textiles and furniture, the region needs to diversify before there is a significant negative economic event, such as large military reductions. Too many textile communities waited too late to act and are still trying to recover economic losses decades later. A sound economic development strategy is based on assets. Most of the assets of the Fayetteville region (location, transportation, utilities, educational institutions, etc.) will not change with a troop reduction of 3,000 at Fort Bragg, or an increase in troops. There would be some workforce reduction as military dependents and spouses leave the area; however, the basic economic development and diversification strategy will remain the same. Therefore, most recommendations in this report are focused on enhancing the strategies of the economic development programs through regional collaboration that aligns economic development, workforce development, and education. If there were an immediate loss of 3,000 active duty soldiers and their families, efforts could be launched to recruit people to replace the loss; rather than recruiting companies to provide jobs that will attract people.
“Never doubt that a small group of thoughtful, committed citizens can change the world; indeed, it's the only thing that ever has.” – Margaret Mead

Impact Greater Fayetteville
64
Goal: Increased & Connected Economic Development Efforts Basic economic development strategies will not change with a reduction of 1,000, 2,000, or even 3,000 active duty personnel at Fort Bragg. There are fluctuations in troop levels at Fort Bragg regularly. The reasons companies move to and expand in this region will remain the same – location, transportation, educational assets, etc. Thus, one strategy to combat a potential negative economic impact is to increase current economic development efforts in the areas of recruitment, retention, and expansion of existing businesses through higher levels of regional collaboration. Strategy: Business Recruitment Economic diversification is needed in the Fayetteville regional economy. The region is highly dependent on public sector and related health and education sector jobs even outside of the military (over 50% of non-military wages). When considering military employment in addition to the public sector, the concentration is significantly higher. Fayetteville’s strategic plan includes a recommendation to diversify the city’s tax base and increase the industrial and commercial tax bases, a goal of each of the counties. The largest private sector employment categories in the region are retail trade and manufacturing. Typically, retail does not pay at or above the average county wage, but manufacturing does. We recommend the region focus on recruiting sectors that will diversify the economy, are growing, and pay at or above the average wage. Each of the local economic development organizations recruits new businesses directly and through the marketing efforts of regional partnerships. Cumberland and Hoke Counties are part of North Carolina’s Southeast Regional Partnership, and Harnett County is a member of the Research Triangle Regional Partnership. The targets for recruitment with these regional partnerships overlap except for business services. Logistics and warehousing, advanced manufacturing, and defense and security are targets of the Southeast Partnership. Defense and security and some sectors of advanced manufacturing are targets of the Research Triangle Partnership. The business services sector is one target not covered by either regional partnership. Action Steps: To be more aggressive in recruiting new business, the counties must act and think regionally.
There is an opportunity for the county economic development offices to launch a
specific marketing effort at the business services industry. For example, the three counties could conduct a sales trip to site consultants that focus on business services not covered by the regional organizations, and develop information for the business services industry on their websites.

Impact Greater Fayetteville
65
Annually, the three organizations should review their programs of work for alignment, potential areas of collaboration, and leverage. It may be possible to come together for marketing purposes as a sub-region as relates to opportunities and risks associated with Fort Bragg.
The three local economic development offices should meet quarterly to share marketing plans to identify points of leverage. For example, if Cumberland County is participating in a sales trip targeting defense, Harnett County may want to reserve its resources for a sales trip in logistics.
This study shows that the Fayetteville region receives less in military contracts than comparable regions. There is an opportunity to attract additional military contractors.
Identify and contact key defense contractors engaged in activities relevant to Fort Bragg but which do not currently have operations in this region. Ascertain what would be required for them to consider establishing operations in the region. Communicate availability of customized education and training programs to meet workforce needs, as well as other regional assets.
Develop assessment of new opportunities to pursue defense contracts in innovation-based growth areas that could leverage regional expertise, and communicate those opportunities to relevant sources of competency, including sources of related commercial expertise and entrepreneurial veterans.
In conjunction with the NC Military Business Center’s work, develop marketing information that shows large and small contractors in the region. Large contractors want to know there is a base of smaller contractors for subcontracting work, and smaller contractors want to know there is a group of larger contractors with which to collaborate. We understand this task will be exceedingly difficult given the clandestine nature of many subcontractor businesses. However, leveraging connections with Fort Bragg may help.
A unique asset of being a military region is the workforce advantage offered by exiting military and trailing spouses. We have found in other studies that military spouses are more educated than the population in general.
Quantify and publicize the military spouses available for work. It is estimated that as many as one-third of exiting military remain in the region, and the majority would prefer to stay in the region if adequate employment is available. Studies have also found that generally exiting military are more educated than the general workforce. Seymour Johnson Air Force Base regularly surveys newcomers to determine if the spouse is seeking employment, skill set, education, etc. A recent survey there found almost 200 spouses actively seeking work. This information is very useful to existing businesses seeking to hire talented workers. Cooperation with Fort Bragg will be critical on a similar study.

Impact Greater Fayetteville
66
Strategy: Business Retention and Expansion Approximately 75% of all new investment and job creation comes from existing businesses. A proactive Business Retention and Expansion (BRE) program offers significant returns to the community. Each local economic development office has a BRE program; however, there is an opportunity to use the regional information in this study to support existing businesses. Action Steps:
Economic Gardening is an economic development strategy developed and deployed in Littleton, CO. The program uses market data to help small businesses grow and entrepreneurs capture opportunities. Other than the federal government, the major sectors that are expected to lose employment are limited-service restaurants, full-service restaurants, real estate sector, office of physicians, general merchandise stores, nursing and community care facilities, food and drinking places, food and beverages stores, and personal care services. These businesses are ideal for an economic gardening program. More information on economic gardening can be found at the Edward Lowe Foundation: http://edwardlowe.org/entrepreneurship-programs/economic-gardening/ We recommend the three-county regional explore a regional economic gardening program.
Proactively visit companies on a regular basis. Develop a target profile of companies for
the visitation program. The target profile could include companies in specific target sectors, size, relationship with Fort Bragg, growth trajectory, at-risk, etc. Through the visitation program, gather data that will allow for trends analysis on existing businesses and the economy. Share high-level data among offices regarding military contractors, major regional employers, and firms in target sectors.
Create an “at-risk” profile for industry sectors most likely to be impacted by troop reductions (health care, retail, hospitality, services, real estate, and defense) so economic development staff can identify companies at-risk of closure. The profile could include reductions in employment, utilities, services, and less community engagement/participation.
Include in the visitation questionnaire a gauge of dependency on the military to start
tracking how vulnerable many businesses are to troop reductions.
Continue with business networking through online and social media discussion groups and face-to-face networking at lunch and learn seminars.
Through the visitation survey information, create an advocacy platform to support regulatory change that will help local businesses grow.
As business climate issues are identified, consider regional (three-county) strategies in response, e.g. if training and the talent pipeline is an issue, consider a meeting about higher education in all three counties to hear feedback from employers and work toward improvements

Impact Greater Fayetteville
67
Strategy: Product Development Approximately 80% of all expanding companies search for an existing building. In the three-county region, there are only 13 available buildings that are over 30,000 SF. Of those 13 buildings, only five have clear ceiling height over 22’, and all five are in Fayetteville. Advanced manufacturing requires higher ceilings than was the norm decades ago when manufacturing was more labor intensive. The fact that the region lacks a quality inventory of available industrial buildings is a glaring gap in the economic development program. There is a healthy inventory of sites listed with the NC Department of Commerce (44); however, none of the sites is a Certified Site, an indicator of the level of due diligence completed. Action Steps:
Inventory available buildings in the three-county region. Attention should be paid to buildings suitable for the targeted sectors. Consider convening the commercial/industrial real estate community for a discussion of the industrial real estate market and how vacancies align, or do not, with target sectors. Collect information on the demand for industrial business in the region as you explore public and private options for development.
Explore investment in spec building development. Catawba County has a good model of a public-private partnership spec building development program.
Develop a list of needed enhancements for the top three to five sites in each county. Enhancements could include engineering studies, infrastructure extensions, clearing, etc. Regionally support local investment in site development.
Do not overlook space for small businesses. This study shows they will be the ones most adversely affected by a troop reduction, and therefore will need the most support.
Goal: Increased Connectivity & Collaboration The current and increased economic development efforts will benefit from a higher level of connectivity and collaboration across the region. We heard from the community input sessions that leaders want a higher level of collaboration across the region. Objective II C in Fayetteville’s FY 2017-18 strategic plan is to “leverage partnerships for job creation and retention, with a focus on local and regional workforce and increasing per capita income.” We heard clearly from Hoke and Harnett Counties that they need a strong region to be successful.

Impact Greater Fayetteville
68
Strategy: Regional Planning and Collaboration Hoke, Harnett, and Cumberland Counties, and the City of Fayetteville are married through Fort Bragg and the regional economy; however, often communication between the entities is lacking. There are efficiencies to be leveraged through regional collaboration. The City of Fayetteville can lead regional collaboration as the city in the MSA.
One way to increase collaboration is to identify regional projects that can bring people together for a common cause. The key learning from this study is the need for regional alignment of target clusters with education, workforce development, and economic development. o Fayetteville can host a Higher Education Summit to bring together all institutions of
higher learning in the region. The agenda would be to discuss the regional strategy to develop the five target clusters as well as support existing top employment clusters such as health care.
o Another point of collaboration should be alignment of capital improvement, comprehensive plans, and infrastructure extensions with target sectors.
Strategy: Leadership Development We have found that the main difference between successful and unsuccessful communities is leadership. To develop the leadership talent, identify new leaders, and connect leaders across the region, we recommend launching a regional leadership development program. Chambers of commerce, economic development, universities, and local governments are a few of the partners that should be involved. There are good models of leadership programs such as Leadership North Carolina and the Rural Economic Development Institute, which trains rural leaders to bring positive change. Action Steps:
Typically, leadership programs recruit a class to meet one day a month for eight months. At each meeting the class focuses on a topic such as economic development, history, local government, natural resources, etc.
The leadership program should be self-sustaining through tuition and sponsorships.
Efforts should be made to recruit a balanced class from across geographies, industry sectors, and demographics (race and age).
Often the leadership class each year will take on a community service project.
Impact Greater Fayetteville
69
Strategy: Place-Making for the Next Generation Millennials will make up 75% of the workforce by 2025. The economic preferences of that generation are much different than previous generations. Many move to an area before finding a job. This is true in Charleston, SC, a place where approximately 47 people move to every day. Objective II D of Fayetteville’s strategic plan is to “invest in community places, revitalizing downtown as a focal point, and building opportunities to leverage the Cape Fear River.” Harnett County is already drawing many people because of its quality of life. Each community can get behind regional place-making initiatives. Action Steps:
Invest in recreation amenities that not only connect the region but also leverage the natural resources. Examples are greenways, bike paths, scenic driving trails, etc. The new baseball stadium is another example.
Develop policies that encourage public art. For example, there could be a consistent art theme across the region that is carried throughout murals, public sculpture, and signage. In every community engagement meeting in Fayetteville, branding was discussed. Public art is one way to brand a community. Think of the painted pigs in Lexington or the metal sculptures in Greenville as unique markers of the community.
Place-making includes revitalizing areas like downtowns. There are many best practices in downtown revitalization. A few include Columbia, SC’s vacant building revitalization grant; Hickory, NC’s landscaping grant; and Charlotte, NC’s security grant. The downtowns across the region can collaborate on the location of incentive districts that complement a regional place-making initiative.
Goal: Support Entrepreneurship Eighty-two percent of establishments in the Fayetteville MSA employ less than ten people. Sole proprietorships make up 12.6% of all establishments (YourEconomy.Org). Small business is big business. Entrepreneurship is a pathway for many exiting and retiring military, as well as others looking to serve the military. Military accounts for approximately 31% of the total value of goods and services produced in the Fayetteville MSA; thus, there are excellent opportunities for small businesses to leverage that level of economic activity. Strategy: Increase Access to Regional Capital Action Steps:
It is estimated that as many as one-third of exiting military remain in the area. Surveys indicate that even more transitioning veterans (55%) would remain in the region if suitable employment were available. Self-employment is one alternative to traditional employment. Many of the military subcontractors in the region are former military.
Impact Greater Fayetteville
70
IMAF Sandhills Angel Fund serves this region. A regional angel investing network can be
leveraged to support start-up businesses in the region. The three-county region could pool dollars from local investors into a collaborative loan fund for smaller businesses, such as the Invest Local program managed by Mountain BizWorks.
Revolutionary Coworking recently launched in Fayetteville. Every business, no matter
how small, needs physical space. There has been a surge in co-work space in urban areas, and some not-so-urban areas, of the state. Given the opportunity for exiting military to become entrepreneurs, we recommend the region collaborate on filling Revolutionary Coworking, and depending upon its success, look for additional small business space.
Whereas the recommendations above focus on traditional economic development strategies, the following are outside-of-the-box. If Fort Bragg reduced active duty troops by 3,000 immediately and at one time, there could be a loss of as many as 6,000 consumers in the marketplace. If the region wanted to be aggressive at recruiting people, instead of recruiting jobs for the people to follow, these are a few inventive approaches.
Goal: Retain and/or Replace 6,000 People The loss of 3,000 active duty soldiers may mean the loss of 6,000 people to the population and economy of the region. The loss could come in one snapshot of time. Almost 80% of military personnel reside in Cumberland County; thus, the impact will be felt the strongest in that county. As mentioned elsewhere, many exiting soldiers and their families seem to choose to stay in this region for one reason or another. Again, this trend could be increased through a coordinated campaign to advertise the region as a good place for veterans to live, work, and play due to its military friendly communities. Recruiting companies to provide jobs which will attract more people to move to the region is a long-term strategy. If the region is serious about recruiting people in the short-term, it must think outside-the-box. Strategy: Recruit People to the Region Action Steps:
There are examples of communities providing rent subsidies for entrepreneurs/small business owners and free land to people who will build a home. These radical ideas focus on bringing people to the community with the thinking that companies and growth will follow people. This can be true - retail sectors follow demographic and consumer patterns. There are several places in the U.S. that offer incentives for people to move there:
o Harmony, MN: cash rebates for new home construction o New Haven, CT: down payment assistance, loans for home renovation, free in-
state college tuition

Impact Greater Fayetteville
71
o Niagara Falls, NY: student loan reimbursement o Detroit, MI: cash and loans for renters and new homeowners o Kansas: tax waivers and student loan reimbursement o Alaska: annual mineral royalty dividends for all residents o Curtis, NB: free lot on which to build your new home
There are other examples of communities supporting newcomers, especially refugees,
with relocation packages that include housing assistance, workforce training, and job placement.
In North Carolina, the City of Morganton has offered low interest loans to developers of residential housing for active adults. In this case, the incentive is directed to the developer.
Goal: Adaptive Reuse of Space and Capacity If 3,000 active duty positions are eliminated at Fort Bragg, there may be an inventory of vacant houses and classrooms. It is likely that the vacancy will be spread across all four jurisdictions rather than whole neighborhoods becoming vacant.
Strategy: Use Vacated Residential and Institutional Space Action Steps:
The region should inventory “at-risk” residential and industrial space so that in the case of a major reduction at Fort Bragg, policies can easily target areas for redevelopment. o Vacant school space could be repurposed for community college training or
university training. o Vacant housing could be repurposed to support university housing needs of students
and professors.

Impact Greater Fayetteville
72
Implementation Plan Implementation has been important from the very beginning of this project. Economic, workforce, and community development professionals who will be charged with leading implementation want to know what to do. They want clear action steps from this study. The recommendations will take time to implement and will be impacted by funding and collaboration. We recommend that three task forces be created to guide implementation. First, a task force for economic development made up of the three economic development organizations. Second, an education and workforce development task force made up of representatives of the public schools, institutions of higher education, and workforce development agencies. Third, a task force of chambers of commerce should lead the effort to implement a regional leadership development program. We charge the task forces to:
Endorse the recommendations from this study. Determine how recommendations from this study can be integrated into the work plans
of the appropriate organizations, such as integrating target sectors into existing workforce and education programs.
Assign action steps to appropriate agencies. Create a process to check in on progress with implementation.
Collaboration will be the key to implementation. Individually, the city and counties have good track records with implementation. One example is the City of Fayetteville’s strategic plan. Another example is implementation of the Fayetteville Alliance strategic plan. However, regional strategies often fail because there is not a single entity responsible for implementation. Therefore, it is critical that responsibilities be assigned and progress measured. The summary of action steps on the following page provides a quick review of the recommendations from this study. The task forces should review the study in depth and pick a few action items to work on in the coming fiscal year.

Impact Greater Fayetteville
73
Summary of Action Steps
Education
• Implement a K-14 System where community college is free
• Expand Early College
• CTE Related to Target Sectors
• Replicate Career Pathway Model
Workforce Development
• Alignment with Target Sectors
• Career Awareness in Target Sectors
• Expand Apprenticeships
• Customer Service Training
• Increase CRCs
• Workforce Gaps Analysis
• Skills Bridging to Target Sectors
• Higher Educational Summit
• Leverage Military Spouse Talent Pool
Economic Development
• Business Recruitment in Target & Niche Sectors
• Collaborate as a Sub-Regional Market
• Recruit/retain/expand Contractors
• Economic Gardening
• Target At-Risk Firms
• Site & Building Development
• Regional Leadership Development
• Regional Planning
• Place-Making
• Entrepreneurship
• Loan pool, investor network, space

Impact Greater Fayetteville
74
Appendix A: Steering Committee Members and Consulting Team
Steering Committee Members
Rodney Anderson Retired General
Tamara Bryant Fayetteville Technical Community College
Letitia Edens Hoke County
TJ Haney NC Community College System
Chris Hawk Harnett County
Angie Hedgepeth Fayetteville Regional Association of Realtors
Tracy Jackson Cumberland County
Mark Locklear Harnett County
Jim Lott Cumberland Workforce Development Board
Adrian Lowery Lumber River Council of Governments
John Lowery NC Works Commission
Zan Monroe Fayetteville Regional Association of Realtors
Greg Moore Fayetteville Technical Community College
Monika Morris Fayetteville Technical Community College
James Palenick City of Fayetteville
Brandon Plotnick Fayetteville Alliance
Don Porter Hoke County
Darsweil Rogers Fayetteville Chamber of Commerce
Angie Stewart Harnett County Economic Development
Patricia Tyson City of Fayetteville
Robert Van Geons Fayetteville Alliance
Teddy Warner Economic Development Partnership of NC
Consulting Team Members:
Fayetteville State University, School of Business and Economics o Dr. Pamela Jackson, Dean, School of Business and Economics o Mr. Greg McElveen, Assistant to the Dean for Strategic Initiatives, School of Business
and Economics o Dr. Inder Nijhawan, Professor Emeritus of Economics, School of Business and Economics o Dr. Thomas G. E. Williams, Professor of Finance, School of Business and Economics o Mr. Tim Moore, Director, Community Engagement, School of Business and Economics

Impact Greater Fayetteville
75
Creative Economic Development Consulting
o Crystal Morphis, CEcD, Founder and CEO
o Penny Whiteheart, Senior Consultant o Leigh Howe, Applied Marketing, Partner

Impact Greater Fayetteville
76
Appendix B: Economic Profile Background Data
This section provides economic background data for Cumberland, Harnett, and Hoke counties
and key municipalities within those counties. A summary of the region’s economic data is
provided, along with the potential implications for a personnel reduction at Fort Bragg. The
information includes economic output data; population size and composition; employment
levels; educational attainment of the workforce; income levels; veteran presence in the
population and their characteristics; and the housing stock. The information is presented under
three categories, namely:
1. Fayetteville MSA Economic Output – Real GDP is the measure of economic output used.
It shows patterns over time and provides comparisons to highlight the significance of
the military to the region.
2. County Economic Data – The various data presented provides some basis for identifying
potential strengths and weaknesses relative to any economic shock related to a
personnel cut.
3. Cities and Town Economic Data – This data is similar to that provided for the counties
but presents a view that may be of more interest to the city officials involved with
economic development. Real GDP Data (Bureau of Economic Analysis is the source of data on Real GDP and Real Per Capita GDP. Source of
all other data is U.S. Census Bureau)
Area Profile (Economic Landscape)
In an attempt to fully explore the probable impact of a personnel draw-down at Fort Bragg on
the three-county area, we compiled a regional profile that offers the best opportunity to
identify potentially measurable effects for a diverse set of stakeholders. For this reason,
information is presented for the Fayetteville MSA, the three counties, and the major towns
within these counties that are mostly likely to experience a direct impact.
Fayetteville MSA – Economic Output
As a first step, the regional economic output (GDP) is best analyzed at the MSA level, therefore,
we focus on the Fayetteville MSA that covers the Fort Bragg area. The significance of the
military to the area is demonstrated by the fact that the federal military component of the
national MSA GDP is less than two percent, approximately 2.5 percent for North Carolina, but
averages over 30 percent for the Fayetteville MSA during the 12 years ending in 2013. The
latest figures available at the time of this report showed the military contribution to the
Fayetteville MSA Real GDP at 32.4 percent.

Impact Greater Fayetteville
77
Figure 20: Fayetteville MSA Real GDP – Federal Military Contribution
Source: Bureau of Economic Analysis (2013 data)
While the military component of Real GDP as a percentage of total Real GDP for both the
national MSA and North Carolina showed moderate fluctuation, the comparable figures for the
Fayetteville MSA was a gradual increase. The military contribution to the area grew gradually
from 30 percent in 2001 to peak at 34 percent in 2010, before beginning a downward trend.
This downward trend is also seen at both the national and statewide level.
32%
68%
Fayetteville MSA Real GDP
Federal military
Non-military

Impact Greater Fayetteville
78
Figure 21: Fayetteville MSA Real GDP Trend
Source: Bureau of Economic Analysis
Per Capita Real GDP
Looking at the real output on a per capita basis provides a more in depth picture of the
economic significance of the military on the area. In doing so, we compare the per capita real
GDP for the Fayetteville MSA to that North Carolina and the U.S. The contrasting picture that
emerged in the comparison of the military component of real GDP is even more profound when
we examine the per capita real GDP at the three levels. Per capita real GDP peeked earlier at
both the national and state level before doing so for the Fayetteville MSA at $45,506 in 2010. It
is also worth noting that even as the real per capita GDP decline began in 2007 as the national
economy began to contract, the per capital real GDP continued to grow within the Fayetteville
MSA, and only started to show decline later. That decline appears more in line with a reduction
in war fighting effort.
27.0%
28.0%
29.0%
30.0%
31.0%
32.0%
33.0%
34.0%
35.0%
2001 2002 2003 2004 2005 2006 2007 2008 2009 2010 2011 2012 2013
Federal Military Contribution to Fayetteville (MSA) Real GDP

Impact Greater Fayetteville
79
Figure 22: Per Capital Real GDP for Fayetteville MSA relative to the US and North Carolina
Source: Bureau of Economic Analysis
Real GDP Growth Rate
An examination of the actual growth rate in real GDP presents a picture which reinforces that
derived from the per capita real GDP figures. The most revealing information is the dichotomy
in the growth rates for 2009, with Fayetteville MSA reported at 4.5%, while both North Carolina
and the U.S. were negative; -3% and -2.8% respectively. The divergence has continued since,
now in the reverse, with Fayetteville MSA recording the negative growth beginning in 2012
while North Carolina and the U.S. are in positive territory as the economy rebounded. This
evidence is indicative of the relative importance of the military within the Fayetteville MSA
compared to the state of North Carolina and the United States as a whole.
Figure 23: Real GDP for Fayetteville MSA relative to the U.S. and North Carolina
Source: Bureau of Economic Analysis
35000
40000
45000
50000
2001 2002 2003 2004 2005 2006 2007 2008 2009 2010 2011 2012 2013 2014
Per Capita Real GDP
United States North Carolina Fayetteville
-4.00%
-2.00%
0.00%
2.00%
4.00%
6.00%
2002 2003 2004 2005 2006 2007 2008 2009 2010 2011 2012 2013 2014
Real GDP Growth Rate
US North Carolina Fayetteville MSA

Impact Greater Fayetteville
80
Counties Population
A broader representation of the economic profile of the area is best presented at the county
level, with some further delineation reserved for the major towns in the counties. Cumberland
County accounts for 65.4 percent, Harnett County 24.6 percent, and Hoke 10 percent of the
total population of the 496,000. Females account for just over half of the population, a pattern
that holds true also for the state and the nation. The region has a somewhat younger
population, as reflected in the median ages, than both the state and nation. Both Cumberland
and Hoke counties have a substantially larger proportion of non-white population than the
state and the country, due primarily to the large number of African Americans. The Hispanic
presence within the region, though lower than the national proportion, is higher than the state.
The variations in both the age and ethnic composition of the region’s population are worthy of
consideration by policy makers.
Ostensibly due to the location of Fort Bragg, both active armed forces personnel and veterans
are a major component of the region’s population, which provides an additional perspective
from which to examine the population.
Just over 70 percent of the armed forces personnel at Fort Bragg are reported as residents
within the three-county region. The overwhelming majority (78 percent) of these reside in
Cumberland County. Clearly this high concentration of military personnel is unique only to
communities in which military installations are located.
Veterans account for a much higher proportion of the population within the three-county
region than for both North Carolina and the nation. Veterans represent between 13.5% and
19.9% of the population within the region, but only 9.6% for North Carolina and 8.7% for the
U.S. Combine this characteristic with the fact that on average veterans have higher median
income, higher level of education attainment, and experience a lower rate of employment than
the non-veteran civilian population, retaining retiring soldiers could be a plus for these
counties.
Income
Across the board, the region experiences lower income than the state, which itself trails the
nation on this metric. The differences are more pronounced on a per capita basis. The more
recently available data does not bode well for this picture, as weekly wages for the region
currently lag behind the state1.
1 Bureau of Labor Statistics, Q2 2016 data shows the region trailing the state by a weekly wage gap of between $115 and $252; with Cumberland County experiencing a 1.3% decline from the prior year.

Impact Greater Fayetteville
81
Figure 24: Median Household Income
Source: U.S. Census Bureau
Figure 25: Per Capita Income
Source: U.S. Census Bureau
$0
$10,000
$20,000
$30,000
$40,000
$50,000
$60,000
2010 2011 2012 2013 2014
Median Household Income
US North Carolina Cumberland County Harnett County Hoke County
$0
$5,000
$10,000
$15,000
$20,000
$25,000
$30,000
2010 2011 2012 2013 2014
Per Capita Income
US North Carolina Cumberland County Harnett County Hoke County

Impact Greater Fayetteville
82
31%
19%24%
13%
13%
Harnett CountyManagement,business, science,and artsoccupationsService occupations
Sales and officeoccupations
Natural resources,construction, andmaintenanceoccupationsProduction,transportation, andmaterial movingoccupations
Employment
The region experiences higher levels of unemployment consistent with difference in the
demographics and composition of the regional economy. A review of the employment
situation, with respect to type of occupation and sector of the economy, can still be instructive.
The pattern of employment across the five classes of occupation varies slightly among the three
counties. What stands out most glaringly is the relative weakness of employment in
management, business, and science relative to the state and the country. As a proportion of
total employment, the counties trail the state by three to seven percentages points and the
nation by four to eight percentage points.
Figure 26a, 26b, 26c: Employment by Sector
Source: U.S. Census Bureau, 2014 American Community Survey
33%
21%25%
9%12%
Cumberland CountyManagement,business, science,and arts occupations
Service occupations
Sales and officeoccupations
Natural resources,construction, andmaintenanceoccupationsProduction,transportation, andmaterial movingoccupations

Impact Greater Fayetteville
83
Source: U.S. Census Bureau, 2014 American Community Survey
Employment within the three counties, like the nation, is dominated by private sector work,
however the proportion of private sector jobs is markedly lower by between six and ten
percentage points. The gap in private sector employment is filled by government jobs, which
account for between 21 and 27 percent of the employment across the region. The comparable
figures for the state and the nation is approximately 15 percent for government employment.
Lower levels of employment in higher wage occupations and the prevalence of government
work within the region are two takeaways from this information that should attract attention.
29%
21%23%
12%
15%
Hoke CountyManagement,business, science,and arts occupations
Service occupations
Sales and officeoccupations
Natural resources,construction, andmaintenanceoccupationsProduction,transportation, andmaterial movingoccupations

Impact Greater Fayetteville
84
Education
The level of educational attainment of a workforce, a well-established determinant of
employability and earnings, is a major component of the economic profile of any region. The
region lags both the state and nation on the proportion of its labor force that have attained at
least some college education. However, the component that pops out are those workers with a
bachelor’s degree or higher, where the region is behind the state by between 25 and 58
percent and the nation by between 31 and 66 percent.
Figure 27a, 27b, 27c: Civilian Population 25 Years and Over
Source: U.S. Census Bureau, 2014 American Community Survey
Source: U.S. Census Bureau, 2014 American Community Survey
12%
27%
39%
22%
Civilian Population 25 Years and Over -
Cumberland County
Less than highschool graduate
High schoolgraduate (includesequivalency) Some college orassociate's degree
Bachelor's degreeor higher
16%
32%34%
18%
Civilian Population 25 Years and Over - Harnett
County Less than highschool graduate
High schoolgraduate (includesequivalency) Some college orassociate's degree
Bachelor's degreeor higher
17%
29%37%
18%
Civilian Population 25 Years and Over - Hoke
County Less than highschool graduate
High schoolgraduate (includesequivalency) Some college orassociate's degree
Bachelor's degreeor higher

Impact Greater Fayetteville
85
The significance of the veteran community in this region is even more pronounced when the
focus is shifted to the working population, 25 years and older. Of the 179,999 civilians 25 years
and over that reside in Cumberland County, 40,192, or 22.3 percent, are veterans. Sixty-one
percent of these Cumberland County civilians have some college or associate’s degree or
higher, with 22 percent holding a bachelor’s degree or higher. However, for the veteran
population within the county, the comparable figures are 77 percent with some college or
associate degrees and higher, and 27 percent for bachelor’s degree or higher. A similar pattern
in the higher education standing among the veteran population is observed for the other two
counties; Harnett County with 52 percent and 18 percent for the overall civilian population, but
68 percent and 22 percent for the veteran population; and Hoke County at 55 percent and 18
percent for the civilian population, and 77 percent and 27 percent for the veteran population.
Note that veterans comprise 15.5 percent of the civilian population 25 years and over in
Harnett County and 16.2 percent in Hoke County.
Figure 28a, 28b, 28c: Veterans
Source: U.S. Census Bureau, 2014 American Community Survey
3%20%
50%
27%
Veterans - Cumberland County
Less than highschool graduate
High schoolgraduate (includesequivalency)
Some college orassociate's degree
4%19%
50%
27%
Veterans - Hoke County
Less than highschool graduate
High schoolgraduate (includesequivalency)
Some college orassociate's degree
Bachelor's degreeor higher
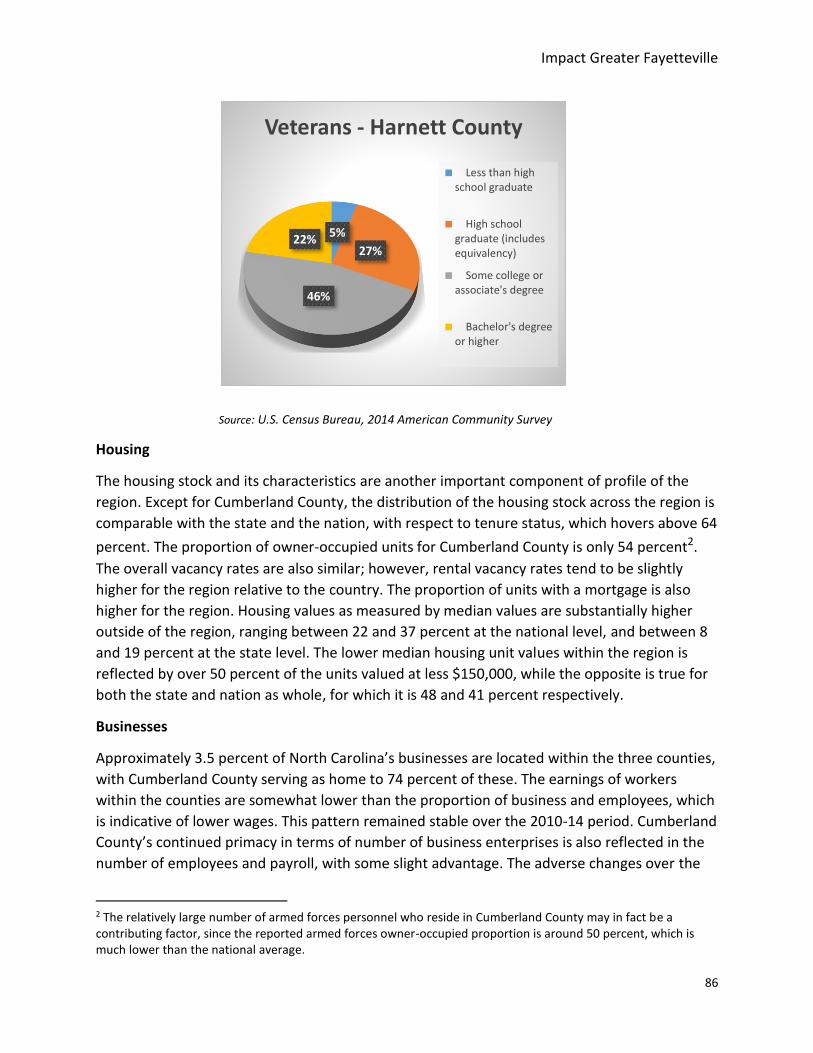
Impact Greater Fayetteville
86
Source: U.S. Census Bureau, 2014 American Community Survey
Housing
The housing stock and its characteristics are another important component of profile of the
region. Except for Cumberland County, the distribution of the housing stock across the region is
comparable with the state and the nation, with respect to tenure status, which hovers above 64
percent. The proportion of owner-occupied units for Cumberland County is only 54 percent2.
The overall vacancy rates are also similar; however, rental vacancy rates tend to be slightly
higher for the region relative to the country. The proportion of units with a mortgage is also
higher for the region. Housing values as measured by median values are substantially higher
outside of the region, ranging between 22 and 37 percent at the national level, and between 8
and 19 percent at the state level. The lower median housing unit values within the region is
reflected by over 50 percent of the units valued at less $150,000, while the opposite is true for
both the state and nation as whole, for which it is 48 and 41 percent respectively.
Businesses
Approximately 3.5 percent of North Carolina’s businesses are located within the three counties,
with Cumberland County serving as home to 74 percent of these. The earnings of workers
within the counties are somewhat lower than the proportion of business and employees, which
is indicative of lower wages. This pattern remained stable over the 2010-14 period. Cumberland
County’s continued primacy in terms of number of business enterprises is also reflected in the
number of employees and payroll, with some slight advantage. The adverse changes over the
2 The relatively large number of armed forces personnel who reside in Cumberland County may in fact be a contributing factor, since the reported armed forces owner-occupied proportion is around 50 percent, which is much lower than the national average.
5%
27%
46%
22%
Veterans - Harnett County
Less than highschool graduate
High schoolgraduate (includesequivalency)
Some college orassociate's degree
Bachelor's degreeor higher

Impact Greater Fayetteville
87
five-year period are the decline in the number of business in Cumberland and Hoke counties,
along with an associated drop in employment. Hoke County’s employment decreased by 9.5
percent, and only Hoke recorded a decline in payroll.
For Cumberland County, the construction and manufacturing sectors suffered the largest
percentage declines in number of businesses, but the corresponding payroll losses was smaller.
These and other major payroll declines in finance and insurance and management companies
were offset by payroll increases at health care and social assistance, educational services,
accommodation and food services, and transportation and warehousing businesses. The
unfavorable situation reported for Hoke County is driven by manufacturing, which suffered an 8
percent drop in the number of business, a 39 percent drop in employees, and over 30 percent
drop in payroll. The experience of Hoke County would have been more severe except for some
positive movement in the payroll situation in health care and social assistance and the retail
trade.
Table 16: County Business Patterns
County Business Patterns - 2014
Number of establishments
Paid employees for pay period including March 12 (number)
First-quarter payroll ($1,000)
Annual payroll ($1,000)
North Carolina 219,897 3,560,448 40,008,913 155,372,284
Cumberland County 5,689 92,537 741,621 3,079,679
Harnett County 1,609 19,249 138,484 582,528
Hoke County 417 5,015 30,048 126,724
Source: U.S. Census Bureau, 2014 American Community Survey Major Towns
Of the five major towns within the region, three are in Cumberland County, and there is one
each in Harnett and Hoke counties. The major towns are Fayetteville, Hope Mills, Lillington,
Raeford, and Spring Lake. Fayetteville is far larger than the other towns in terms of both the
population and the economy, features which in turn affect several other aspects of a
community. The population of Fayetteville far exceeds the population of the other four towns
combined.
Household income at the state level exceeds that of all the towns except for Hope Mills. On a
per capita income basis, the state leads all five towns by at least seven percent, but exceeds
Lillington, which has experienced a decline in per capita income over the past five years, by a
whopping 98 percent.

Impact Greater Fayetteville
88
Figure 29: Median Household Income
Source: U.S. Census Bureau, 2014 American Community Survey
Figure 30: Per Capita Income
Source: U.S. Census Bureau, 2014 American Community Survey
$0
$10,000
$20,000
$30,000
$40,000
$50,000
$60,000
Fayetteville,NC
Hope Mills,NC
Lillington, NC Raeford, NC Spring Lake,NC
NorthCarolina
Median Household Income
2010 2011 2012 2013 2014
$0
$5,000
$10,000
$15,000
$20,000
$25,000
$30,000
Fayetteville,NC
Hope Mills,NC
Lillington, NC Raeford, NC Spring Lake,NC
NorthCarolina
Per Capita Income
2010 2011 2012 2013 2014

Impact Greater Fayetteville
89
Table 17: Selected Economic Data Counties
Census Bureau, American Community Survey 2010-2014
United States North Carolina
Cumberland County
Harnett County
Hoke County
Total population 314,107,084 9,750,405 324,002 121,789 50,034
Male 154,515,159 4,750,366 157,667 59,921 24,456
Female 159,591,925 5,000,039 166,335 61,868 25,578
Median age (years) 37.4 37.8 31.0 33.4 31.1
White alone 62.8% 64.6% 46.1% 63.4% 41.0%
Black or African American alone 12.2% 21.2% 35.3% 20.4% 32.3%
Hispanic or Latino (of any race) 16.9% 8.7% 10.4% 11.4% 12.4%
Asian alone 4.9% 2.4% 2.3% 1.1% 1.2%
American Indian and Alaska Native alone
0.7% 1.1% 1.1% 0.8% 8.0%
Other races alone 0.4% 0.3% 0.6% 0.1% 0.5%
Two or more races 2.1% 1.9% 4.3% 2.7% 4.6%
EMPLOYMENT STATUS
Population 16 years and over 248,775,628 7,717,630 247,401 91,521 36,653
In labor force 158,965,511 4,879,118 162,166 56,119 22,634
Civilian labor force 157,940,014 4,793,358 135,172 51,665 19,504
Employed 143,435,233 4,287,690 117,557 45,298 16,862
Unemployed 14,504,781 505,668 17,615 6,367 2,642
Armed Forces 1,025,497 85,760 26,994 4,454 3,130
Not in labor force 89,810,117 2,838,512 85,235 35,402 14,019
Civilian labor force 157,940,014 4,793,358 135,172 51,665 19,504
Percent Unemployed 9.2% 10.5% 13.0% 12.3% 13.5%
Mean family income (dollars) 86,963 75,892 65,716 63,968 59,021
Median family income (dollars) 65,443 57,328 52,106 53,089 53,102
Per capita income (dollars) 28,555 25,608 23,204 20,274 19,036
Median household income (dollars) 53,482 46,693 44,778 44,417 43,754
Mean household income (dollars) 74,596 64,555 58,139 56,723 54,760
Median earnings for workers (dollars) 30,815 28,159 28,591 27,643 26,915
Median earnings for male full-time, year-round workers (dollars)
49,400 43,437 40,371 43,547 43,323
Median earnings for female full-time, year-round workers (dollars)
39,087 35,472 32,736 32,334 31,807

Impact Greater Fayetteville
90
Census Bureau, American Community Survey 2010-2014
United States North Carolina
Cumberland County
Harnett County
Hoke County
OCCUPATION BY CLASS OF WORKER
Civilian employed population 16 years and over 143,435,233 4,287,690 117,557 45,298 16,862
Management, business, science, and arts occupations
52,234,574 1,541,258 39,027 14,125 4,968
Service occupations 26,053,338 758,433 24,122 8,433 3,503
Sales and office occupations 34,935,133 1,016,981 29,512 10,948 3,923
Natural resources, construction, and maintenance occupations
12,875,934 403,182 10,605 5,725 1,941
Production, transportation, and material moving occupations
17,336,254 567,836 14,291 6,067 2,527
INDUSTRY
Civilian employed population 16 years and over 143,435,233 4,287,690 117,557 45,298 16,862
Agriculture, forestry, fishing and hunting, and mining
2,807,292 59,781 645 679 345
Construction 8,843,718 284,986 6,702 4,201 949
Manufacturing 14,955,235 535,084 9,051 4,884 2,415
Wholesale trade 3,937,598 118,706 1,686 1,365 254
Retail trade 16,598,718 506,433 15,848 5,316 1,932
Transportation and warehousing, and utilities 7,066,666 184,221 4,954 1,810 417
Information 3,064,078 77,183 1,904 605 267
Finance and insurance, and real estate and rental and leasing
9,467,555 268,732 4,766 2,027 366
Professional, scientific, and management, and administrative and waste management services
15,618,627 431,640 9,005 3,927 998
Educational services, and health care and social assistance
33,297,237 1,011,582 32,578 10,374 4,650
Arts, entertainment, and recreation, and accommodation and food services
13,610,162 402,861 12,520 3,745 1,515
Other services, except public administration 7,112,579 211,390 5,780 2,159 920
Public administration 7,055,768 195,091 12,118 4,206 1,834
CLASS OF WORKER (SECTOR)
Civilian employed population 16 years and over 143,435,233 4,287,690 117,557 45,298 16,862
Private wage and salary workers 79.1% 78.9% 69.0% 72.8% 70.7%
Government workers 14.6% 15.2% 26.6% 20.7% 24.3%
Self-employed in own not incorporated business workers
6.1% 5.8% 4.3% 6.2% 4.9%
Unpaid family workers 0.2% 0.2% 0.1% 0.2% 0.1%
OCCUPATION BY CLASS OF WORKER
Civilian employed population 16 years and over 143,435,233 4,287,690 117,557 45,298 16,862
Management, business, science, and arts occupations
36.4% 35.9% 33.2% 31.2% 29.5%

Impact Greater Fayetteville
91
Census Bureau, American Community Survey 2010-2014
United States North Carolina
Cumberland County
Harnett County
Hoke County
Service occupations 18.2% 17.7% 20.5% 18.6% 20.8%
Sales and office occupations 24.4% 23.7% 25.1% 24.2% 23.3%
Natural resources, construction, and maintenance occupations
9.0% 9.4% 9.0% 12.6% 11.5%
Production, transportation, and material moving occupations
12.1% 13.2% 12.2% 13.4% 15.0%
Educational attainment of population 25 years and older
208,423,578 6,444,551 179,999 71,979 27,906
Less than high school 13.7% 14.7% 11.6% 16.1% 17.3%
High school graduate 28.0% 26.9% 27.4% 31.6% 28.5%
Some college, associate 29.0% 30.6% 38.7% 34.4% 36.6%
Bachelor’s degree or higher 29.3% 27.8% 22.3% 17.8% 17.6%
Veterans 20,389,113 695,129 40,192 11,175 4,511
Less than high school 7.4% 7.3% 3.2% 5.0% 4.6%
High school graduate 29.3% 27.7% 19.7% 26.6% 18.6%
Some college, associate 36.6% 39.2% 49.9% 46.3% 50.1%
Bachelor’s degree or higher 26.6% 25.8% 27.2% 22.1% 26.6%
Nonveterans 188,034,465 5,749,422 139,807 60,804 23,395
Less than high school 14.4% 15.6% 14.0% 18.2% 19.8%
High school graduate 27.9% 26.8% 29.6% 32.5% 30.4%
Some college, associate 28.2% 29.5% 35.5% 32.2% 34.0%
Bachelor’s degree or higher 29.5% 28.0% 20.9% 17.0% 15.9%
HOUSING OCCUPANCY
Total housing units 132,741,033 4,385,668 140,410 48,122 19,147
Occupied housing units 116,211,092 3,742,514 122,288 41,601 16,534
Vacant housing units 16,529,941 643,154 18,122 6,521 2,613
Homeowner vacancy rate 2.1 2.4 3.0 2.5 3.8
Rental vacancy rate 6.9 8.2 8.8 8.7 9.2
HOUSING TENURE
Occupied housing units 116,211,092 3,742,514 122,288 41,601 16,534
Owner-occupied 74,787,460 2,461,741 53.7% 66.1% 66.6%
Renter-occupied 41,423,632 1,280,773 46.3% 33.9% 33.4%
VALUE
Owner-occupied units 74,787,460 2,461,741 65,642 27,488 11,010

Impact Greater Fayetteville
92
Census Bureau, American Community Survey 2010-2014
United States North Carolina
Cumberland County
Harnett County
Hoke County
Less than $50,000 9.3% 10.2% 9.1% 13.0% 13.2%
$50,000 to $99,999 15.6% 18.0% 24.9% 21.8% 19.4%
$100,000 to $149,999 16.0% 20.3% 24.8% 22.1% 19.8%
$150,000 to $199,999 15.1% 17.5% 18.0% 18.4% 27.8%
$200,000 to $299,999 18.2% 17.5% 15.2% 16.2% 14.9%
$300,000 to $499,999 15.5% 11.3% 6.2% 6.4% 4.6%
$500,000 to $999,999 8.2% 4.3% 1.4% 1.7% 0.2%
$1,000,000 or more 2.1% 0.9% 0.3% 0.4% 0.1%
Median (dollars) 175,700 153,600 128,600 133,400 143,500
MORTGAGE STATUS
Owner-occupied units 74,787,460 2,461,741 65,642 27,488 11,010
Housing units with a mortgage 65.6% 66.1% 70.7% 68.0% 72.3%
Housing units without a mortgage 34.4% 33.9% 29.3% 32.0% 27.7%
Source: U.S. Census Bureau, 2014 American Community Survey
Table 18: North Carolina Business Pattern
North Carolina Number of establishments
Paid employees for pay period including March 12 (number)
First-quarter payroll ($1,000)
Annual payroll ($1,000)
Total for all sectors 219,897 3,560,448 40,008,913 155,372,284
Agriculture, forestry, fishing and hunting 790 4,671 41,709 174,888
Mining, quarrying, and oil and gas extraction 206 3,233 39,158 167,300
Utilities 562 19,494 558,591 1,818,309
Construction 21,086 167,929 1,667,398 7,528,882
Manufacturing 8,721 408,132 4,810,536 19,609,960
Wholesale trade 11,674 174,694 3,306,229 11,877,850
Retail trade 34,246 469,243 2,773,634 11,547,754
Transportation and warehousing 5,509 113,804 1,204,170 4,964,460
Information 3,469 80,535 1,524,539 5,687,425
Finance and insurance 13,085 172,319 5,119,189 14,506,552
Real estate and rental and leasing 10,618 51,023 519,652 2,172,662
Professional, scientific, and technical services 23,413 203,500 3,468,905 14,318,796
Management of companies and enterprises 1,781 92,537 2,880,292 9,622,942
Administrative and support and waste management and remediation services
12,281 355,469 2,782,217 12,030,004
Educational services 2,671 94,867 912,468 3,792,715

Impact Greater Fayetteville
93
Health care and social assistance 23,053 560,309 5,742,940 24,055,763
Arts, entertainment, and recreation 3,576 60,055 398,066 1,762,635
Accommodation and food services 19,923 379,757 1,337,353 5,874,571
Other services (except public administration) 22,796 148,355 919,881 3,849,416
Industries not classified 437 f 1,986 9,400
Source: U.S. Census Bureau, 2014 County Business Patterns
Table 19: Cumberland County Business Pattern
Cumberland County Number of establishments
Paid employees for pay period including March 12 (number)
First-quarter payroll ($1,000)
Annual payroll ($1,000)
Total for all sectors 5,689 92,537 741,621 3,079,679
Agriculture, forestry, fishing and hunting 8 c D D
Mining, quarrying, and oil and gas extraction 5 b D D
Utilities 10 302 4,660 20,814
Construction 432 3,455 30,782 137,404
Manufacturing 95 6,834 79,938 338,814
Wholesale trade 160 2,302 22,247 90,567
Retail trade 1,069 16,603 96,324 396,238
Transportation and warehousing 152 3,776 38,519 158,345
Information 62 1,741 17,719 69,197
Finance and insurance 306 1,928 24,480 88,589
Real estate and rental and leasing 323 1,748 16,230 61,194
Professional, scientific, and technical services 575 5,073 67,506 284,420
Management of companies and enterprises 31 303 5,777 29,190
Administrative and support and waste management and remediation services
249 7,247 44,947 185,612
Educational services 69 2,318 14,239 59,879
Health care and social assistance 772 19,268 204,123 842,677
Arts, entertainment, and recreation 66 972 3,232 14,082
Accommodation and food services 652 13,871 45,458 193,529
Other services (except public administration) 645 4,662 24,575 105,196
Industries not classified 8 a 13 122
Source: U.S. Census Bureau, 2014 County Business Patterns

Impact Greater Fayetteville
94
Table 20: Harnett County Business Pattern
Harnett County
Number of establishments
Paid employees for pay period including March 12 (number)
First-quarter payroll ($1,000)
Annual payroll ($1,000)
Total for all sectors 1,609 19,249 138,484 582,528
Agriculture, forestry, fishing and hunting 6 a D D
Mining, quarrying, and oil and gas extraction 4 e D D
Utilities 2 b D D
Construction 233 1,289 9,816 45,327
Manufacturing 60 1,330 12,010 53,245
Wholesale trade 56 500 4,839 18,957
Retail trade 273 3,242 17,145 71,574
Transportation and warehousing 39 1,109 10,724 44,889
Information 14 c D D
Finance and insurance 89 568 6,606 25,212
Real estate and rental and leasing 76 251 1,391 5,828
Professional, scientific, and technical services 109 433 3,915 18,851
Management of companies and enterprises 5 c 731 4,823
Administrative and support and waste management and remediation services
96 918 5,796 26,088
Educational services 24 g D D
Health care and social assistance 169 3,757 30,242 117,420
Arts, entertainment, and recreation 16 79 362 1,612
Accommodation and food services 157 2,690 7,224 30,358
Other services (except public administration) 177 788 3,999 16,990
Industries not classified 4 a S 43
Source: U.S. Census Bureau, 2014 County Business Patterns
Table 21: Hoke County Business Pattern
Hoke County Number of establishments
Paid employees for pay period including March 12 (number)
First-quarter payroll ($1,000)
Annual payroll ($1,000)
Total for all sectors 417 5,015 30,048 126,724
Agriculture, forestry, fishing and hunting 2 a D D
Utilities 3 a D D
Construction 38 258 1,995 8,482

Impact Greater Fayetteville
95
Manufacturing 11 1,436 11,148 45,093
Wholesale trade 10 94 814 3,996
Retail trade 79 819 4,410 18,813
Transportation and warehousing 15 c D D
Information 5 b D D
Finance and insurance 16 75 701 2,475
Real estate and rental and leasing 22 46 295 1,145
Professional, scientific, and technical services 38 c 702 3,046
Administrative and support and waste management and remediation services
21 110 287 1,188
Educational services 5 b D D
Health care and social assistance 65 1,092 6,105 27,808
Arts, entertainment, and recreation 6 20 80 320
Accommodation and food services 24 481 1,120 5,067
Other services (except public administration) 56 248 992 3,826
Industries not classified 1 a D D
Source: U.S. Census Bureau, 2014 County Business Patterns
Table 22: Industry Employment by Town
Fayetteville
Total Managemen
t, business, science, and arts occupations
Service occupations
Sales and office occupations
Natural resources, construction, and maintenance occupations
Production, transportation, and material moving occupations
Civilian employed population 16 years and over
70,730 34.5% 21.2% 25.8% 7.9% 10.7%
Agriculture, forestry, fishing and hunting, and mining
208 20.2% 0.0% 5.8% 58.7% 15.4%
Construction 3,294 15.1% 0.6% 9.8% 71.1% 3.4%
Manufacturing 4,579 13.4% 2.7% 9.0% 9.2% 65.7%
Wholesale trade 897 21.4% 1.0% 47.7% 5.1% 24.7%
Retail trade 9,591 6.0% 5.1% 75.6% 3.9% 9.3%
Transportation and warehousing, and utilities
2,473 7.8% 2.8% 31.9% 6.4% 51.2%
Information 1,089 32.0% 2.8% 45.0% 18.2% 2.0%
Finance and insurance, and real estate and rental and leasing
2,949 33.1% 4.8% 53.2% 4.4% 4.5%
Professional, scientific, and management, and administrative and waste management services
5,209 45.2% 22.3% 21.2% 3.8% 7.5%
Educational services, and health care and social assistance
20,178 65.5% 22.0% 9.9% 0.5% 2.0%
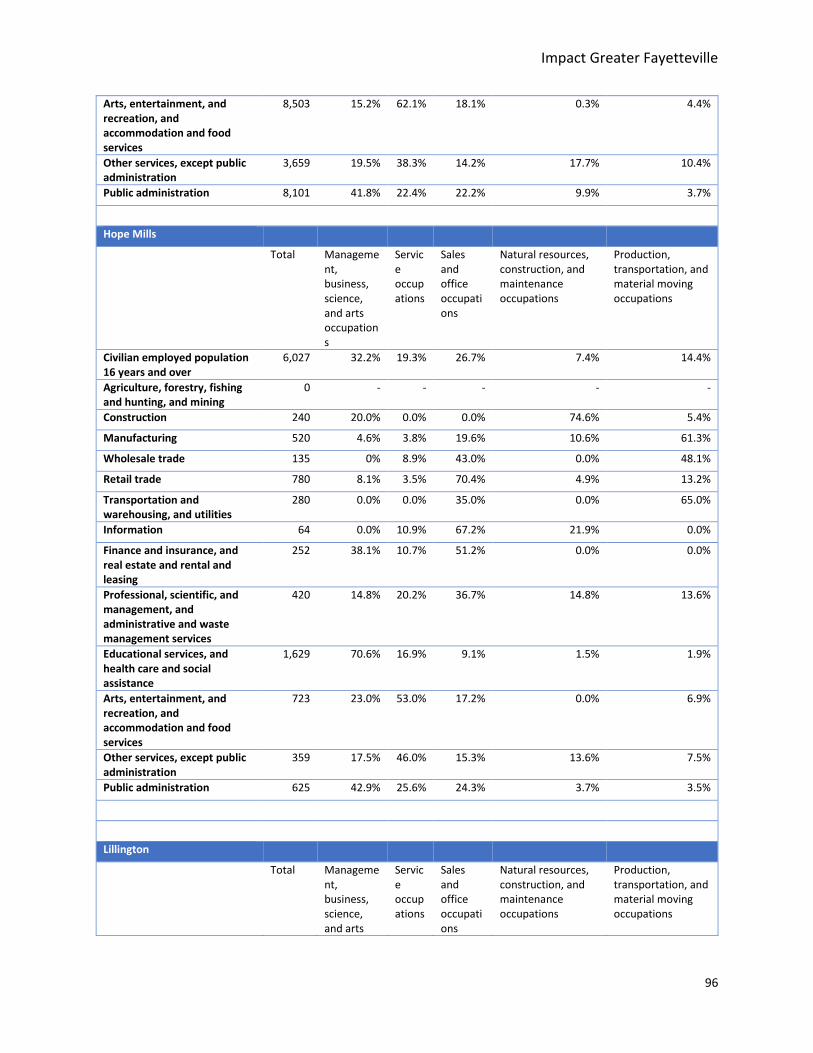
Impact Greater Fayetteville
96
Arts, entertainment, and recreation, and accommodation and food services
8,503 15.2% 62.1% 18.1% 0.3% 4.4%
Other services, except public administration
3,659 19.5% 38.3% 14.2% 17.7% 10.4%
Public administration 8,101 41.8% 22.4% 22.2% 9.9% 3.7%
Hope Mills
Total Manageme
nt, business, science, and arts occupations
Service occupations
Sales and office occupations
Natural resources, construction, and maintenance occupations
Production, transportation, and material moving occupations
Civilian employed population 16 years and over
6,027 32.2% 19.3% 26.7% 7.4% 14.4%
Agriculture, forestry, fishing and hunting, and mining
0 - - - - -
Construction 240 20.0% 0.0% 0.0% 74.6% 5.4%
Manufacturing 520 4.6% 3.8% 19.6% 10.6% 61.3%
Wholesale trade 135 0% 8.9% 43.0% 0.0% 48.1%
Retail trade 780 8.1% 3.5% 70.4% 4.9% 13.2%
Transportation and warehousing, and utilities
280 0.0% 0.0% 35.0% 0.0% 65.0%
Information 64 0.0% 10.9% 67.2% 21.9% 0.0%
Finance and insurance, and real estate and rental and leasing
252 38.1% 10.7% 51.2% 0.0% 0.0%
Professional, scientific, and management, and administrative and waste management services
420 14.8% 20.2% 36.7% 14.8% 13.6%
Educational services, and health care and social assistance
1,629 70.6% 16.9% 9.1% 1.5% 1.9%
Arts, entertainment, and recreation, and accommodation and food services
723 23.0% 53.0% 17.2% 0.0% 6.9%
Other services, except public administration
359 17.5% 46.0% 15.3% 13.6% 7.5%
Public administration 625 42.9% 25.6% 24.3% 3.7% 3.5%
Lillington
Total Manageme
nt, business, science, and arts
Service occupations
Sales and office occupations
Natural resources, construction, and maintenance occupations
Production, transportation, and material moving occupations

Impact Greater Fayetteville
97
occupations
Civilian employed population 16 years and over
836 34.1% 23.3% 19.7% 3.8% 19.0%
Agriculture, forestry, fishing and hunting, and mining
16 100.0% 0.0% 0.0% 0.0% 0.0%
Construction 37 27.0% 0.0% 0.0% 29.7% 43.2%
Manufacturing 88 11.4% 0.0% 14.8% 13.6% 60.2%
Wholesale trade 24 37.5% 0.0% 16.7% 0.0% 45.8%
Retail trade 76 2.6% 0.0% 73.7% 0.0% 23.7%
Transportation and warehousing, and utilities
33 33.3% 0.0% 33.3% 9.1% 24.2%
Information 18 22.2% 0.0% 0.0% 16.7% 61.1%
Finance and insurance, and real estate and rental and leasing
26 19.2% 0.0% 80.8% 0.0% 0.0%
Professional, scientific, and management, and administrative and waste management services
76 51.3% 28.9% 15.8% 3.9% 0.0%
Educational services, and health care and social assistance
276 44.9% 43.1% 2.9% 0.0% 9.1%
Arts, entertainment, and recreation, and accommodation and food services
61 27.9% 60.7% 11.5% 0.0% 0.0%
Other services, except public administration
37 10.8% 29.7% 13.5% 0.0% 45.9%
Public administration 68 50.0% 8.8% 41.2% 0.0% 0.0%
Raeford
Total Manageme
nt, business, science, and arts occupations
Service occupations
Sales and office occupations
Natural resources, construction, and maintenance occupations
Production, transportation, and material moving occupations
Civilian employed population 16 years and over
1,630 29.0% 22.9% 24.4% 8.2% 15.5%
Agriculture, forestry, fishing and hunting, and mining
0 0.0% - - - -
Construction 25 0.0% 0.0% 0.0% 100.0% 0.0%
Manufacturing 339 20.1% 0.0% 0.0% 13.6% 66.4%
Wholesale trade 0 - - - - -
Retail trade 223 0.0% 0.0% 87.4% 0.0% 12.6%
Transportation and warehousing, and utilities
0 - - - - -
Information 23 0.0% 0.0% 100.0% 0.0% 0.0%

Impact Greater Fayetteville
98
Finance and insurance, and real estate and rental and leasing
14 57.1% 0.0% 42.9% 0.0% 0.0%
Professional, scientific, and management, and administrative and waste management services
74 14.9% 17.6% 67.6% 0.0% 0.0%
Educational services, and health care and social assistance
581 52.7% 31.8% 15.5% 0.0% 0.0%
Arts, entertainment, and recreation, and accommodation and food services
155 0.0% 100.0%
0.0% 0.0% 0.0%
Other services, except public administration
92 39.1% 0.0% 22.8% 38.0% 0.0%
Public administration 104 41.3% 20.2% 11.5% 26.9% 0.0%
Spring Lake
Total Manageme
nt, business, science, and arts occupations
Service occupations
Sales and office occupations
Natural resources, construction, and maintenance occupations
Production, transportation, and material moving occupations
Civilian employed population 16 years and over
3,080 26.6% 31.2% 26.0% 4.6% 11.6%
Agriculture, forestry, fishing and hunting, and mining
10 0.0% 0.0% 0.0% 100.0% 0.0%
Construction 102 20.6% 0.0% 0.0% 79.4% 0.0%
Manufacturing 164 9.1% 0.0% 0.0% 17.7% 73.2%
Wholesale trade 22 68.2% 0.0% 31.8% 0.0% 0.0%
Retail trade 609 7.7% 3.4% 81.0% 0.0% 7.9%
Transportation and warehousing, and utilities
105 24.8% 0.0% 10.5% 0.0% 64.8%
Information 41 61.0% 0.0% 39.0% 0.0% 0.0%
Finance and insurance, and real estate and rental and leasing
132 67.4% 15.2% 17.4% 0.0% 0.0%
Professional, scientific, and management, and administrative and waste management services
236 5.9% 58.1% 36.0% 0.0% 0.0%
Educational services, and health care and social assistance
789 48.3% 42.7% 4.9% 0.0% 4.1%
Arts, entertainment, and recreation, and accommodation and food services
473 9.3% 65.8% 7.6% 0.0% 17.3%
Other services, except public administration
112 11.6% 71.4% 8.0% 8.9% 0.0%
Public administration 285 44.9% 19.3% 28.8% 4.2% 2.8%

Impact Greater Fayetteville
99
Source: U.S. Census Bureau, 2014 American Community Survey
Table 23: Employment by Sector by Town
Employment by Sectors
Fayetteville
Hope Mills
Lillington
Raeford
Spring Lake
Civilian employed population 16 years and over 70,730 6,027 836 1,630 3,080
Agriculture, forestry, fishing and hunting, and mining 208 0 16 0 10
Construction 3,294 240 37 25 102
Manufacturing 4,579 520 88 339 164
Wholesale trade 897 135 24 0 22
Retail trade 9,591 780 76 223 609
Transportation and warehousing, and utilities 2,473 280 33 0 105
Information 1,089 64 18 23 41
Finance and insurance, and real estate and rental and leasing 2,949 252 26 14 132
Professional, scientific, and management, and administrative and waste management services
5,209 420 76 74 236
Educational services, and health care and social assistance 20,178 1,629 276 581 789
Arts, entertainment, and recreation, and accommodation and food services
8,503 723 61 155 473
Other services, except public administration 3,659 359 37 92 112
Public administration 8,101 625 68 104 285
Total 70,730 6,027 836 1,630 3,080
Employment by Sectors (percent)
Fayetteville
Hope Mills
Lillington
Raeford
Spring Lake
Civilian employed population 16 years and over 100.0% 100.0% 100.0%
100.0%
100.0%
Agriculture, forestry, fishing and hunting, and mining 0.3% 0.0% 1.9% 0.0% 0.3%
Construction 4.7% 4.0% 4.4% 1.5% 3.3%
Manufacturing 6.5% 8.6% 10.5% 20.8%
5.3%
Wholesale trade 1.3% 2.2% 2.9% 0.0% 0.7%
Retail trade 13.6% 12.9% 9.1% 13.7%
19.8%
Transportation and warehousing, and utilities 3.5% 4.6% 3.9% 0.0% 3.4%
Information 1.5% 1.1% 2.2% 1.4% 1.3%
Finance and insurance, and real estate and rental and leasing 4.2% 4.2% 3.1% 0.9% 4.3%
Professional, scientific, and management, and administrative and waste management services
7.4% 7.0% 9.1% 4.5% 7.7%

Impact Greater Fayetteville
100
Educational services, and health care and social assistance 28.5% 27.0% 33.0% 35.6%
25.6%
Arts, entertainment, and recreation, and accommodation and food services
12.0% 12.0% 7.3% 9.5% 15.4%
Other services, except public administration 5.2% 6.0% 4.4% 5.6% 3.6%
Public administration 11.5% 10.4% 8.1% 6.4% 9.3%
Total 100% 100% 100% 100% 100%
Employment by Occupations
Fayetteville
Hope Mills
Lillington
Raeford
Spring Lake
Civilian employed population 16 years and over 70,730 6,027 836 1,630 3,080
Management, business, science, and arts occupations 34.5% 32.2% 34.1% 29.0%
26.6%
Service occupations 21.2% 19.3% 23.3% 22.9%
31.2%
Sales and office occupations 25.8% 26.7% 19.7% 24.4%
26.0%
Natural resources, construction, and maintenance occupations 7.9% 7.4% 3.8% 8.2% 4.6%
Production, transportation, and material moving occupations 10.7% 14.4% 19.0% 15.5%
11.6%
Total 100% 100% 100% 100% 100%
Source: U.S. Census Bureau, 2014 American Community Survey
Table 24: Selected Economic Data for Towns
Subject Fayetteville city, NC Hope Mills town,
NC Lillington town, NC
Raeford city, NC Spring Lake town, NC
Estimate Percent Estimate
Percent
Estimate
Percent
Estimate
Percent
Estimate
Percent
EMPLOYMENT STATUS
Population 16 years and over 157,188 157,188 11,500 11,500 2,875 2,875 3,474 3,474 8,495 8,495
In labor force 103,387 65.8% 7,279 63.3% 976 33.9% 1,855 53.4% 6,078 71.5%
Civilian labor force 82,028 52.2% 6,683 58.1% 957 33.3% 1,826 52.6% 3,671 43.2%
Employed 70,730 45.0% 6,027 52.4% 836 29.1% 1,630 46.9% 3,080 36.3%
Unemployed 11,298 7.2% 656 5.7% 121 4.2% 196 5.6% 591 7.0%
Armed Forces 21,359 13.6% 596 5.2% 19 0.7% 29 0.8% 2,407 28.3%
Not in labor force 53,801 34.2% 4,221 36.7% 1,899 66.1% 1,619 46.6% 2,417 28.5%
Civilian labor force 82,028 82,028 6,683 6,683 957 957 1,826 1,826 3,671 3,671
Percent Unemployed (X) 13.8% (X) 9.8% (X) 12.6% (X) 10.7% (X) 16.1%

Impact Greater Fayetteville
101
Females 16 years and over 80,547 80,547 6,632 6,632 1,034 1,034 1,970 1,970 4,460 4,460
In labor force 47,190 58.6% 3,907 58.9% 547 52.9% 1,096 55.6% 2,547 57.1%
Civilian labor force 44,310 55.0% 3,838 57.9% 547 52.9% 1,096 55.6% 2,300 51.6%
Employed 38,421 47.7% 3,429 51.7% 508 49.1% 972 49.3% 1,898 42.6%
OCCUPATION
Civilian employed population 16 years and over
70,730 70,730 6,027 6,027 836 836 1,630 1,630 3,080 3,080
Management, business, science, and arts occupations
24,407 34.5% 1,940 32.2% 285 34.1% 472 29.0% 818 26.6%
Service occupations 14,983 21.2% 1,161 19.3% 195 23.3% 374 22.9% 961 31.2%
Sales and office occupations 18,229 25.8% 1,612 26.7% 165 19.7% 397 24.4% 801 26.0%
Natural resources, construction, and maintenance occupations
5,572 7.9% 445 7.4% 32 3.8% 134 8.2% 142 4.6%
Production, transportation, and material moving occupations
7,539 10.7% 869 14.4% 159 19.0% 253 15.5% 358 11.6%
INDUSTRY
Civilian employed population 16 years and over
70,730 70,730 6,027 6,027 836 836 1,630 1,630 3,080 3,080
Agriculture, forestry, fishing and hunting, and mining
208 0.3% 0 0.0% 16 1.9% 0 0.0% 10 0.3%
Construction 3,294 4.7% 240 4.0% 37 4.4% 25 1.5% 102 3.3%
Manufacturing 4,579 6.5% 520 8.6% 88 10.5% 339 20.8% 164 5.3%
Wholesale trade 897 1.3% 135 2.2% 24 2.9% 0 0.0% 22 0.7%
Retail trade 9,591 13.6% 780 12.9% 76 9.1% 223 13.7% 609 19.8%
Transportation and warehousing, and utilities
2,473 3.5% 280 4.6% 33 3.9% 0 0.0% 105 3.4%
Information 1,089 1.5% 64 1.1% 18 2.2% 23 1.4% 41 1.3%
Finance and insurance, and real estate and rental and leasing
2,949 4.2% 252 4.2% 26 3.1% 14 0.9% 132 4.3%
Professional, scientific, and management, and administrative and waste management services
5,209 7.4% 420 7.0% 76 9.1% 74 4.5% 236 7.7%
Educational services, and health care and social assistance
20,178 28.5% 1,629 27.0% 276 33.0% 581 35.6% 789 25.6%
Arts, entertainment, and recreation, and accommodation and food services
8,503 12.0% 723 12.0% 61 7.3% 155 9.5% 473 15.4%
Other services, except public administration
3,659 5.2% 359 6.0% 37 4.4% 92 5.6% 112 3.6%
Public administration 8,101 11.5% 625 10.4% 68 8.1% 104 6.4% 285 9.3%

Impact Greater Fayetteville
102
CLASS OF WORKER
Civilian employed population 16 years and over
70,730 70,730 6,027 6,027 836 836 1,630 1,630 3,080 3,080
Private wage and salary workers
47,761 67.5% 4,152 68.9% 581 69.5% 1,238 76.0% 2,388 77.5%
Government workers 20,001 28.3% 1,638 27.2% 226 27.0% 322 19.8% 598 19.4%
Self-employed in own not incorporated business workers
2,842 4.0% 237 3.9% 29 3.5% 70 4.3% 94 3.1%
Unpaid family workers 126 0.2% 0 0.0% 0 0.0% 0 0.0% 0 0.0%
INCOME AND BENEFITS (IN 2014 INFLATION-ADJUSTED DOLLARS)
Total households 77,935 77,935 5,756 5,756 997 997 1,804 1,804 4,516 4,516
Less than $10,000 6,887 8.8% 427 7.4% 157 15.7% 340 18.8% 336 7.4%
$10,000 to $14,999 4,226 5.4% 316 5.5% 82 8.2% 213 11.8% 263 5.8%
$15,000 to $24,999 8,663 11.1% 673 11.7% 189 19.0% 305 16.9% 709 15.7%
$25,000 to $34,999 10,400 13.3% 768 13.3% 177 17.8% 279 15.5% 813 18.0%
$35,000 to $49,999 13,557 17.4% 748 13.0% 169 17.0% 222 12.3% 1,020 22.6%
$50,000 to $74,999 15,280 19.6% 1,113 19.3% 93 9.3% 113 6.3% 788 17.4%
$75,000 to $99,999 8,421 10.8% 911 15.8% 77 7.7% 122 6.8% 416 9.2%
$100,000 to $149,999 6,741 8.6% 540 9.4% 38 3.8% 140 7.8% 113 2.5%
$150,000 to $199,999 2,190 2.8% 225 3.9% 10 1.0% 56 3.1% 37 0.8%
$200,000 or more 1,570 2.0% 35 0.6% 5 0.5% 14 0.8% 21 0.5%
Median household income (dollars)
44,514 (X) 47,332 (X) 29,031
(X) 26,392
(X) 37,154
(X)
Mean household income (dollars)
57,695 (X) 57,575 (X) 37,381
(X) 47,950
(X) 42,771
(X)
With earnings 62,249 79.9% 4,654 80.9% 655 65.7% 1,161 64.4% 4,003 88.6%
Mean earnings (dollars) 55,087 (X) 56,736 (X) 39,725
(X) 41,957
(X) 41,013
(X)
With Social Security 18,267 23.4% 1,564 27.2% 336 33.7% 533 29.5% 546 12.1%
Mean Social Security income (dollars)
16,073 (X) 13,088 (X) 14,146
(X) 15,639
(X) 12,362
(X)
With retirement income 17,205 22.1% 1,319 22.9% 181 18.2% 420 23.3% 527 11.7%
Mean retirement income (dollars)
24,404 (X) 21,696 (X) 18,882
(X) 52,356
(X) 19,175
(X)
With Supplemental Security Income
4,228 5.4% 226 3.9% 106 10.6% 153 8.5% 204 4.5%
Mean Supplemental Security Income (dollars)
8,922 (X) 8,730 (X) 7,392 (X) 8,269 (X) 7,649 (X)
With cash public assistance income
1,680 2.2% 164 2.8% 5 0.5% 38 2.1% 35 0.8%
Mean cash public assistance income (dollars)
2,278 (X) 1,954 (X) 7,400 (X) 5,455 (X) 1,711 (X)
With Food Stamp/SNAP benefits in the past 12 months
12,942 16.6% 885 15.4% 161 16.1% 427 23.7% 753 16.7%

Impact Greater Fayetteville
103
Median family income (dollars)
50,493 (X) 57,739 (X) 39,479
(X) 35,923
(X) 39,121
(X)
Mean family income (dollars) 64,252 (X) 65,292 (X) 48,214
(X) 53,481
(X) 45,661
(X)
Per capita income (dollars) 23,843 (X) 21,194 (X) 12,936
(X) 19,260
(X) 16,365
(X)
Source: U.S. Census Bureau, 2014 American Community Survey
Table 25: Employment by Sectors for Towns
Employment by Sectors for Local Cities and Towns
Fayetteville
Hope Mills
Lillington
Raeford
Spring Lake
Civilian employed population 16 years and over 70,730 6,027 836 1,630 3,080
Agriculture, forestry, fishing and hunting, and mining 0.3% 0.0% 1.9% 0.0% 0.3%
Construction 4.7% 4.0% 4.4% 1.5% 3.3%
Manufacturing 6.5% 8.6% 10.5% 20.8% 5.3%
Wholesale trade 1.3% 2.2% 2.9% 0.0% 0.7%
Retail trade 13.6% 12.9% 9.1% 13.7% 19.8%
Transportation and warehousing, and utilities 3.5% 4.6% 3.9% 0.0% 3.4%
Information 1.5% 1.1% 2.2% 1.4% 1.3%
Finance and insurance, and real estate and rental and leasing 4.2% 4.2% 3.1% 0.9% 4.3%
Professional, scientific, and management, and administrative and waste management services
7.4% 7.0% 9.1% 4.5% 7.7%
Educational services, and health care and social assistance 28.5% 27.0% 33.0% 35.6% 25.6%
Arts, entertainment, and recreation, and accommodation and food services
12.0% 12.0% 7.3% 9.5% 15.4%
Other services, except public administration 5.2% 6.0% 4.4% 5.6% 3.6%
Public administration 11.5% 10.4% 8.1% 6.4% 9.3%
Total 100% 100% 100% 100% 100%
Source: U.S. Census Bureau, 2014 American Community Survey
Table 26: Employment by Occupations for Towns
Employment by Occupations for Local Cities and Towns
Fayetteville
Hope Mills
Lillington
Raeford
Spring Lake
Civilian employed population 16 years and over 70,730 6,027 836 1,630 3,080
Management, business, science, and arts occupations 34.5% 32.2% 34.1% 29.0% 26.6%

Impact Greater Fayetteville
104
Service occupations 21.2% 19.3% 23.3% 22.9% 31.2%
Sales and office occupations 25.8% 26.7% 19.7% 24.4% 26.0%
Natural resources, construction, and maintenance occupations
7.9% 7.4% 3.8% 8.2% 4.6%
Production, transportation, and material moving occupations
10.7% 14.4% 19.0% 15.5% 11.6%
Total 100% 100% 100% 100% 100%
Source: U.S. Census Bureau, 2014 American Community Survey
Table 27: Civilian Labor Force Unemployed Percent by Town
Civilian labor force unemployed, percent Fayetteville Hope Mills Lillington Raeford Spring Lake
2014 14.6 9.8 12.6 10.7 16.1
2013 14.6 9.4 13.1 11.8 18.9
2012 13.9 10.5 14.7 13.5 17.9
2011 12.9 8.4 13.3 9.9 14.6
2010 11.7 6.8 9.8 7.8 11.6
Source: U.S. Census Bureau, 2014 American Community Survey
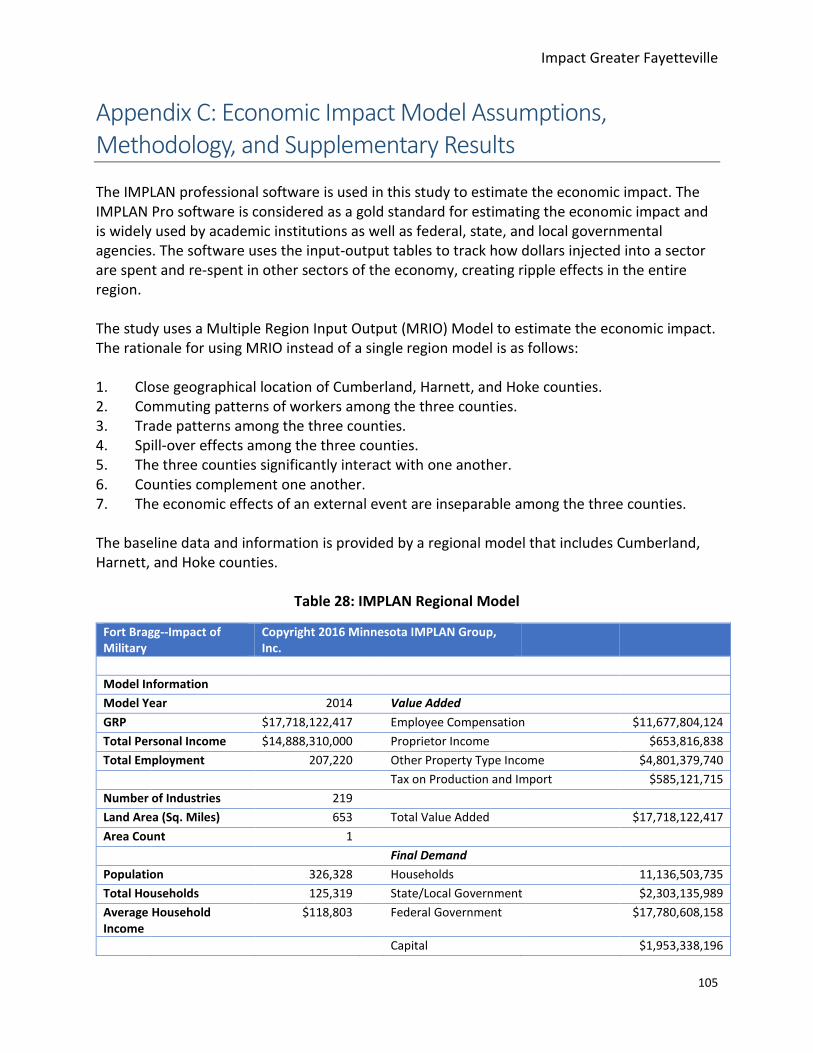
Impact Greater Fayetteville
105
Appendix C: Economic Impact Model Assumptions, Methodology, and Supplementary Results The IMPLAN professional software is used in this study to estimate the economic impact. The IMPLAN Pro software is considered as a gold standard for estimating the economic impact and is widely used by academic institutions as well as federal, state, and local governmental agencies. The software uses the input-output tables to track how dollars injected into a sector are spent and re-spent in other sectors of the economy, creating ripple effects in the entire region. The study uses a Multiple Region Input Output (MRIO) Model to estimate the economic impact. The rationale for using MRIO instead of a single region model is as follows: 1. Close geographical location of Cumberland, Harnett, and Hoke counties. 2. Commuting patterns of workers among the three counties. 3. Trade patterns among the three counties. 4. Spill-over effects among the three counties. 5. The three counties significantly interact with one another. 6. Counties complement one another. 7. The economic effects of an external event are inseparable among the three counties. The baseline data and information is provided by a regional model that includes Cumberland, Harnett, and Hoke counties.
Table 28: IMPLAN Regional Model
Fort Bragg--Impact of Military
Copyright 2016 Minnesota IMPLAN Group, Inc.
Model Information
Model Year 2014
Value Added
GRP
$17,718,122,417
Employee Compensation $11,677,804,124
Total Personal Income $14,888,310,000
Proprietor Income $653,816,838
Total Employment 207,220
Other Property Type Income $4,801,379,740 Tax on Production and Import $585,121,715
Number of Industries 219
Land Area (Sq. Miles) 653
Total Value Added $17,718,122,417
Area Count 1
Final Demand
Population 326,328
Households 11,136,503,735
Total Households 125,319
State/Local Government $2,303,135,989
Average Household Income
$118,803
Federal Government $17,780,608,158
Capital
$1,953,338,196

Impact Greater Fayetteville
106
Trade Flows Method Trade Flows Model
Exports
$4,883,169,229
Model Status Multipliers
Imports
-$19,513,972,801 Institutional Sales -$824,660,118
Economic Indicators
Shannon-Weaver Index .6007
Total Final Demand: $17,718,122,388
Top Ten Industries
Sector Description
Employment Labor Income Output
536 * Employment and payroll of federal govt, military
52,764 $5,303,258,000 $6,229,695,000
535 * Employment and payroll of federal govt, non-military
12,708 $1,207,496,000 $1,886,813,000
533 * Employment and payroll of local govt, non-education
8,863 $583,120,800 $676,594,200
534 * Employment and payroll of local govt, education
8,665 $436,734,600 $506,217,400
502 Limited-service restaurants
7,250 $104,699,000 $483,887,700
440 Real estate
5,770 $62,645,480 $942,615,300
501 Full-service restaurants
5,027 $90,681,440 $193,088,600
532 * Employment and payroll of state govt, education
4,308 $202,174,300 $236,112,800
405 Retail - General merchandise stores
4,001 $97,882,050 $240,496,200
456 Scientific research and development services
3,045 $268,531,400 $837,533,400
Copyright 2016 Minnesota IMPLAN Group, Inc.
Table 28 above shows that the region employs 265,000 people to produces goods and services worth about $21 billion. Total population of the region is about 504,000. Approximately 190,000 households earn $20,556,270,000 in personal income, including investment and other income as well as wages. IMPLAN has 536 sectors, but only 262 sectors are represented in the region. This reflects the fact that a few sectors/industries dominate the region and determine its economic growth. The dominance of service sectors and the conspicuous absence of manufacturing industries is evident from the list of top ten employers. The major employers in this region are federal, state, and local governments, which together employ more workers in the region than the top 20 employers combined. It is also noteworthy that the federal government alone (because of the military at Fort Bragg) employs one fifth of all workers in the region. Because the region is not highly diversified, much is imported from elsewhere in the state, the country, and abroad. While the three-county region exports about $6.5 billion, the region imports almost $25 billion worth of goods and services. This presents a potential opportunity

Impact Greater Fayetteville
107
85%
11%
4%
Percentage of Regional GDP
Cumberland County Harnett County Hoke County
78%
16%
5%
Regional Employment
Cumberland County Harnett County Hoke County
for sustained growth by potentially leveraging resources and expertise within the region to produce within the region goods and services that are currently imported from elsewhere. Cumberland County’s economy is the largest economy in the region, with 85 percent of Regional GDP, followed by Harnett County with 11 percent and Hoke with about 4 percent.
Figure 31: Key Regional Economic Data Driving Allocation of Economic Impact
Assessment by County
Figure 31a: Population Percentage Figure 31b: Regional Employment
Source: U.S. Census Bureau and Bureau of Economic Analysis
Figure 31c: Percentage of Regional GDP
Source: U.S. Census Bureau and Bureau of Economic Analysis
65%
25%
10%
Population Percentage
Cumberland County Harnett County Hoke County

Impact Greater Fayetteville
108
78%
13%
9%
Military Personnel Residence by County
Cumberland County Harnett County Hoke County
21
,35
9
59
6
19
29
2,4
07
F A Y E T T E VI L L E H O P E M I L L S L I L I N G T O N R A E F O R D S P R I N G L A K E
MILITARY PERSONNEL LIVING IN TOWNS
Figure 31d: Military Personnel Living in Town
Source: U.S. Census Bureau and Bureau of Economic Analysis
Figure 31f: Military Personnel Residence by County
Source: U.S. Census Bureau and Bureau of Economic Analysis
Regional employment reflects the same trend. Cumberland County employs about 78 percent of the labor force, Harnett about 16 percent and Hoke approximately 5 percent. Approximately 64 percent of the region’s population resides in Cumberland County, followed by more than a quarter living in Harnett County and about 11 percent in Hoke County. The chart shows distribution of the military population among different municipalities in a county. Fayetteville has the largest concentration of military population at about 32,000, followed by Spring Lake with about 22,000, 500 in Hope Mills, 19 in Lillington and 29 in Raeford. The data presented in the slide suggest that whether the troops are reduced by 3,000, 2,000, or 1,000, the brunt of the impact will be borne by residents of Cumberland County.
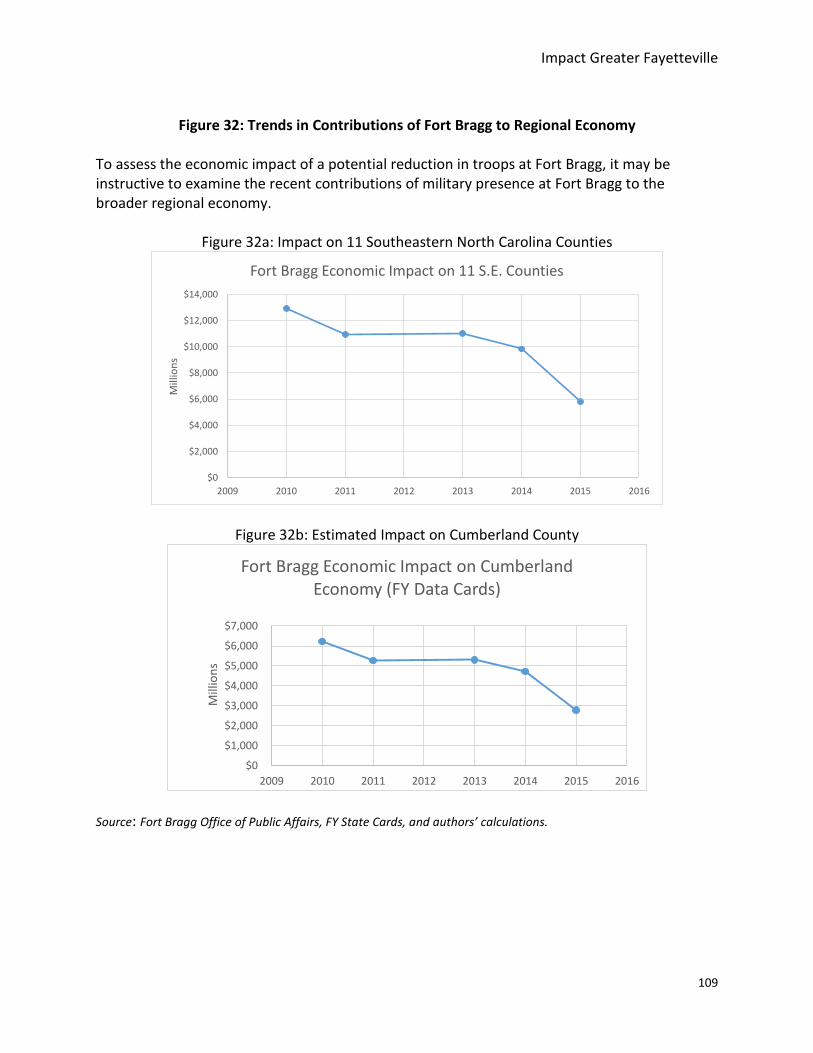
Impact Greater Fayetteville
109
Figure 32: Trends in Contributions of Fort Bragg to Regional Economy
To assess the economic impact of a potential reduction in troops at Fort Bragg, it may be instructive to examine the recent contributions of military presence at Fort Bragg to the broader regional economy.
Figure 32a: Impact on 11 Southeastern North Carolina Counties
Figure 32b: Estimated Impact on Cumberland County
Source: Fort Bragg Office of Public Affairs, FY State Cards, and authors’ calculations.
$0
$2,000
$4,000
$6,000
$8,000
$10,000
$12,000
$14,000
2009 2010 2011 2012 2013 2014 2015 2016
Mill
ion
s
Fort Bragg Economic Impact on 11 S.E. Counties
$0
$1,000
$2,000
$3,000
$4,000
$5,000
$6,000
$7,000
2009 2010 2011 2012 2013 2014 2015 2016
Mill
ion
s
Fort Bragg Economic Impact on Cumberland Economy (FY Data Cards)

Impact Greater Fayetteville
110
Figure 32c: Estimated Impact on Harnett County
Figure 32d: Estimated Impact on Hoke County
Source: Fort Bragg Office of Public Affairs, FY State Cards, and authors’ calculations. It is important to note that except for 2012, there has been a steady decline in the overall economic impact of Fort Bragg on this region (see Figure 32 above). In the 11-county region, the economic impact of Fort Bragg has steadily declined from $12 billion in 2010 to about $6 billion in 2015-- almost a 50 percent reduction. The trend is the same for Cumberland, Harnett, and Hoke counties.
$0
$100
$200
$300
$400
$500
$600
$700
$800
$900
2009 2010 2011 2012 2013 2014 2015 2016
Mill
ion
s
Harnett County Fort Bragg Economic Impact (2010-2015)
$0
$50
$100
$150
$200
$250
$300
$350
2009 2010 2011 2012 2013 2014 2015 2016
Mill
ion
s
Hoke County Fort Bragg Economic Impact (2010-2015)

Impact Greater Fayetteville
111
It is noteworthy that the number of active-duty soldiers peaked in 2012 and has been steadily declining ever since. The peak for Fort Bragg’s total population occurred one year later.
Table 29: Fort Bragg Population
Source: Fort Bragg Public Relations, January 2017
Fort Bragg Troops Increase Scenarios It is reasonable to assume that the labor output and technology co-efficients in the regional IMPLAN model will not change if the troops at Fort Bragg were to increase. Accordingly, the employment, income, and output multiplier impact will be the same as in the troop reduction scenarios except the impact will be positive rather than negative. Table 30 illustrates the potential economic impact of 3,000, 2,000, and 1,000 increase in active duty soldiers at Fort Bragg under Scenario 1.
Table 30: Fort Bragg Troops Increase Scenario 1 Economic Impact
3000 Troops Increase
Region Employment Labor Income Output State and Local Taxes
Cumberland County 4,847 $264,458,573 $617,522,885 $12,087,902
Harnett County 6.5 $169,138 $244,877 $23,279
Hoke County 2.5 $35,895 $176,356 $5,167
Total Impact 4,856.0 $264,663,606 $617,944,118 $12,116,348
2000 Troops Increase 2000 Troops Reduction
Region Employment Labor Income Output State and Local Taxes
Cumberland County 3,231.9 $176,305,715 $411,681,907 $8,058,259
Harnett County 4.3 $112,759 $4,429,918 $15,512
Hoke County 1.6 $23,932 $117,836 $3,444
Fort Bragg Population ASIP COP Data (31 January 2016) FY08 FY09 FY10 FY11 FY12 FY13 FY14 FY15 FY16
Active Duty Army Military 44,436 45,437 45,290 45,051 44,954 44,702 42,532 41,716 40,877
Reserve Component Military (Assigned at Fort Bragg) 1,891 1,810 1,816 3,207 3,281 3,283 3,262 3,391 2,358
Other Military ( Air Force, Other Services) 785 818 751 2,936 2,862 2,998 3,002 3,002 3,010
Students-Military (incl PCS & TDY) 5,995 4,943 5,502 4,730 5,600 5,786 5,873 5,119 4,796
Total Fort Bragg Military Population 53,107 53,008 53,359 55,924 56,697 56,769 54,669 53,228 51,041
Civilian Employees (Assigned at Fort Bragg) 9,340 10,158 11,344 14,116 14,515 14,380 14,470 14,663 13,808
Contract Employees (Working at Fort Bragg) 6,688 6,984 5,472 5,481 5,496 6,342 5,888 5,552 6,054
Military Family Members (Active Duty Military) 80,723 80,572 81,106 85,004 86,179 86,289 83,097 80,907 69,797
Total Fort Bragg Population 149,858 150,722 151,281 160,525 162,887 163,780 158,124 154,350 140,700

Impact Greater Fayetteville
112
Total Economic Impact
3,237.80 $176,442,406 $416,229,661 $8,077,215
1000 Troops Increase 1000 Troops Reduction
Region Employment Labor Income Output State and Local Taxes
Cumberland County -1,615 $88,152,857 $227,884,333 $3,710,243
Harnett County 2.2 $56,379 $87,257 $7,759
Hoke County 0.8 $11,966 $23,916 $1,723
Total Impact 1.618 $88,221,202 $227,995,506 $3,719,725 Source: IMPLAN model and authors’ calculations
It is noteworthy that the Scenario 1 potential economic impact analysis and magnitude are the same for troop increase as for the troop reduction except the economic impact is positive. The top sectors impacted by the potential increase in troops will also remain unchanged. It is evident form the above table, given the income and expenditure patterns noted, a 3,000 increase in troops would result in the region gaining approximately 5,000 full-time and part-time jobs, approximately $618 million in sales, $264 million in wages and salaries and $12 million in tax revenues. With a 2,000 troop reduction, the region will gain 3,237 full-time and part-time jobs, approximately $416 million in sales, $176 million in wages and salaries and about $8 million in taxes, given this set of troop income assumptions. With a 1,000 soldier draw down, the region will gain 1,618 full-time and part-time jobs, about $228 million in sales, approximately $88 million in wages and salaries and about $4 million in state and local taxes in this scenario. The table shows the potential economic impact of 3,000, 2,000, and 1,000 troops increase at Fort Bragg on the tri-county region under Scenario 2. As stated earlier, the employment, income, and output multipliers are like a double-edged sword: just as a reduction in soldiers (and consequent reduction in payroll) decreases the economic activity, an increase in the number of soldiers will increase the economic activity manifold.
Table 31: Scenario Set 2—Impact of Prospective Troop Increase
3000 Troops Increase Region Employment Labor Income Output State and Local
Taxes
Cumberland County
3,627 $107,589,895 $450,204,241 $5,147,004
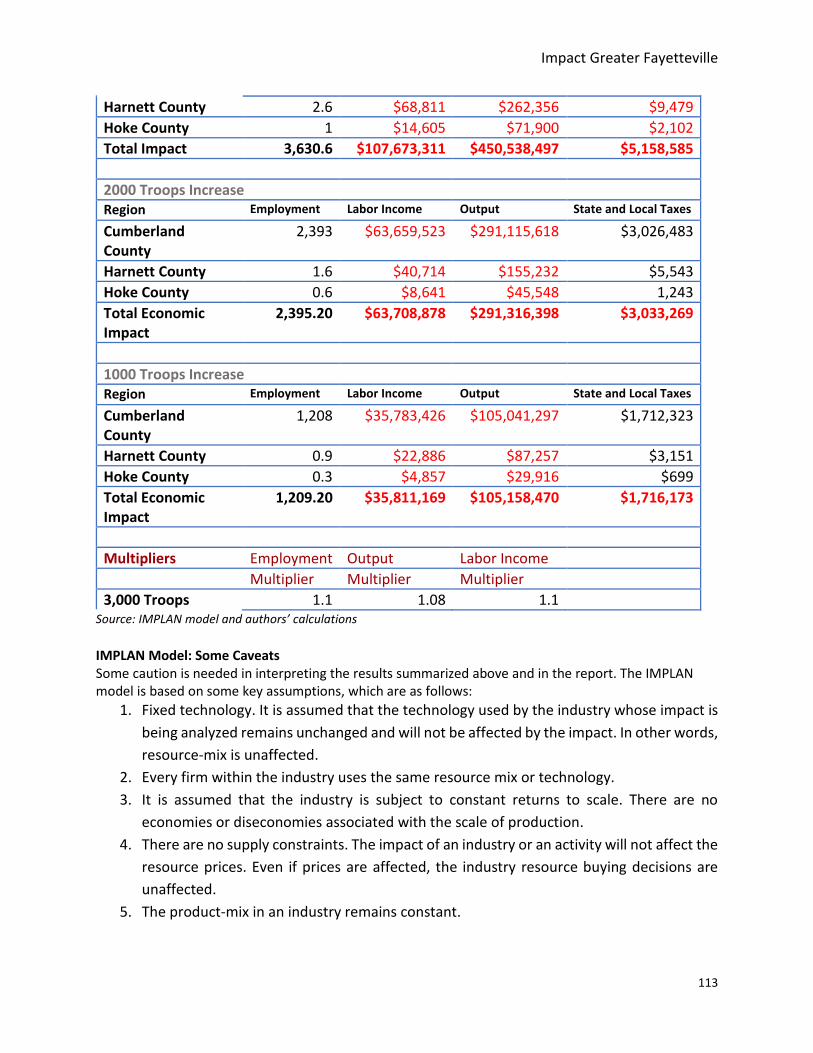
Impact Greater Fayetteville
113
Harnett County 2.6 $68,811 $262,356 $9,479
Hoke County 1 $14,605 $71,900 $2,102
Total Impact 3,630.6 $107,673,311 $450,538,497 $5,158,585
2000 Troops Increase Region Employment Labor Income Output State and Local Taxes
Cumberland County
2,393 $63,659,523 $291,115,618 $3,026,483
Harnett County 1.6 $40,714 $155,232 $5,543
Hoke County 0.6 $8,641 $45,548 1,243
Total Economic Impact
2,395.20 $63,708,878 $291,316,398 $3,033,269
1000 Troops Increase Region Employment Labor Income Output State and Local Taxes
Cumberland County
1,208 $35,783,426 $105,041,297 $1,712,323
Harnett County 0.9 $22,886 $87,257 $3,151
Hoke County 0.3 $4,857 $29,916 $699
Total Economic Impact
1,209.20 $35,811,169 $105,158,470 $1,716,173
Multipliers Employment Output Labor Income
Multiplier Multiplier Multiplier
3,000 Troops 1.1 1.08 1.1
Source: IMPLAN model and authors’ calculations
IMPLAN Model: Some Caveats Some caution is needed in interpreting the results summarized above and in the report. The IMPLAN model is based on some key assumptions, which are as follows:
1. Fixed technology. It is assumed that the technology used by the industry whose impact is
being analyzed remains unchanged and will not be affected by the impact. In other words,
resource-mix is unaffected.
2. Every firm within the industry uses the same resource mix or technology.
3. It is assumed that the industry is subject to constant returns to scale. There are no
economies or diseconomies associated with the scale of production.
4. There are no supply constraints. The impact of an industry or an activity will not affect the
resource prices. Even if prices are affected, the industry resource buying decisions are
unaffected.
5. The product-mix in an industry remains constant.

Impact Greater Fayetteville
114
6. The regional purchase coefficient (the amounts of inputs purchased from local vendors)
does not change.
These assumptions may seem inordinately restrictive, but they are common to all input-output
models. Most researchers conclude that the IMPLAN impact estimates are reasonably accurate
so long as (1) the scale of activity is not too large to significantly change the total demand for and
supply of resources; (2) there is no radical change in technology; (3) regional purchase coefficient
remains the same. The most serious error may occur if the regional purchase coefficient has
changed and a researcher fails to make an adjustment for it in the model.
There is no evidence that the nature and scale of troops reduction or increase are so large to seriously violate the assumption mentioned above.

Impact Greater Fayetteville
115
Appendix D: Target Sector Analysis: Supporting Analytics and Data The research for the target sector analysis was led by Applied Marketing Sciences in partnership with Creative Economic Development Consulting. The following tables, information, and analysis were compiled to understand the framework of industry in Fayetteville, including Cumberland, Harnett, and Hoke Counties. Each level of information allows a deeper look at the industry clusters for Fayetteville and the region. An understanding was established for the type of industry supported and developing in the region by looking at what exists in the region, employment levels, and location quotients. Multiple industry clusters were considered throughout the process. The resulting recommended target industries for Fayetteville were discovered to be strong in the regional economy, were (in part or full) forecasted for future growth, or represented a developing opportunity. Analyzing multiple information sources allowed the data to be overlaid and industry clusters to be researched, considered, and ultimately chosen, for Fayetteville.
Summary of Analyses The analysis began with a look at the base industries in Cumberland, Harnett, and Hoke Counties, along with North Carolina as comparison. Total employment, percentage of employment by sector, and location quotient was performed at this base industry level. Trade, transportation, and utilities, along with education and health services and leisure and hospitality, were recognized as a strong industry base in the Fayetteville region. A location quotient by industry cluster was then completed by establishment, employment, and wages. Industry location quotient is a way of quantifying how “concentrated” an industry is in a region compared to a larger geographic area, such as the state or nation. The basic uses of location quotient include: 1) determining which industries make the regional economy unique; 2) identifying the “export orientation” of an industry and identifying the most export-oriented industries in the region; and 3) identifying emerging export industries beginning to bring money into the region. Industry clusters identified through this process were biomedical/biotechnical; chemicals and chemical based products; defense and security; energy; transportation and logistics; primary metal manufacturing; and transportation equipment. A deeper look was then taken at the employment levels by 3-digit NAICS Codes to understand the specific opportunities in manufacturing, logistics, and services. At this level of analysis, the specific clusters began to materialize around defense, logistics, manufacturing, and business services. Another consideration was the forecasted growth by industry segment. While growth factors were studied across all industries, the fastest growing segments were included in the tables below. Growing segments were found among many of the industry clusters being considered

Impact Greater Fayetteville
116
for Fayetteville. This part of the analysis identified health care and life sciences for consideration given the various segments of this industry included in the fastest growing industries.
Table 32: Employment Calculated from Quarterly Census of Employment and Wages Data - 2015 (BLS)
Source: U.S. Bureau of Labor Statistics
Comparison of Cumberland, Harnett, and Hoke Counties to North Carolina, 2015 (BLS) The distribution of business by major sectors was analyzed to compare and contrast Cumberland, Harnett, and Hoke Counties, along with North Carolina as a whole. Based on this analysis, each county has a unique make up. While manufacturing percentages are lower in Cumberland and Harnett Counties, Hoke County shows a strong manufacturing base. Alternatively, Cumberland and Harnett are strong in trade, transportation, and utilities, along with leisure and hospitality, while Hoke County falls below the state average in both areas. All counties are above average in education and health services.
Table 33: Percentage of Employment calculated from Quarterly Census of Employment and Wages Data
Percentage of Employment: Ratio of industry employment to base-industry employment times 100.

Impact Greater Fayetteville
117
Table 34: Location Quotients calculated from Quarterly Census of Employment and Wages Data
Location Quotient: Ratio of analysis-industry employment in the analysis area to base-industry employment in the analysis area divided by the ratio of analysis-industry employment in the base area to base-industry employment in the base area.
Source: U.S. Bureau of Labor Statistics
Industry Cluster Analysis/Location Quotient Cumberland, Harnett, and Hoke Counties were analyzed by industry cluster to take a closer look at those clusters where the Location Quotient (LQ) was greater than one, indicating the area is producing more goods or services than it is consuming; therefore, exporting and creating value. The industry clusters having a Location Quotient greater than one in establishments or employment include:
Apparel and Textiles
Biomedical/Biotechnical (Life Sciences)
Chemicals and Chemical Based Products
Defense and Security
Education and Knowledge Creation
Energy
Transportation and Logistics
Primary Metal Manufacturing
Transportation Equipment Manufacturing

Impact Greater Fayetteville
118
Table 35: Industry Cluster Analysis/Location Quotient
Source: U.S. Bureau of Labor Statistics, Quarterly Census of Employment & Wages (QCEW) and Purdue Center for Regional Development (cluster definitions).
Manufacturing Analysis Looking deeper into the industries at the county and regional level, we analyzed the employment, by 3-digit NAICS Industry Code, for Cumberland, Harnett, and Hoke Counties. Many industry numbers were not disclosable in the data. Given what we can determine from the analysis, the manufacturing industries of note in the region include:
Food manufacturing
Chemical manufacturing
Fabricated metal manufacturing

Impact Greater Fayetteville
119
Table 36: Employment calculated from Quarterly Census of Employment and Wages Data (2015)
Footnotes: (ND) Not Disclosable (NC) Not Calculable, the data does not exist or it is zero
Source: U.S. Bureau of Labor Statistics, Quarterly Census of Employment & Wages
Wholesale/Retail/Transportation Analysis Looking deeper into the industries at the county and regional level, we analyzed the employment, by 3-digit NAICS Industry Code, for Cumberland, Harnett, and Hoke Counties. Many industry numbers were not disclosable in the data. Wholesale, retail, or transportation industries of note in the region include:
General merchandise stores
Motor vehicle and parts dealers
Food and beverage stores
Warehousing and storage
Clothing and clothing accessories stores
Truck transportation

Impact Greater Fayetteville
120
Table 37: Employment Calculated from Quarterly Census of Employment and Wages Data (2015)
Footnotes: (ND) Not Disclosable (NC) Not Calculable, the data does not exist or it is zero
Source: U.S. Bureau of Labor Statistics, Quarterly Census of Employment & Wages
Services Analysis Looking deeper into the industries at the county and regional level, we analyzed the employment, by 3-digit NAICS Industry Code, for Cumberland, Harnett, and Hoke Counties. Many industry numbers were not disclosable in the data. Services industries of note in the region include:
Food services and drinking places
Ambulatory health care services
Administrative and support services
Professional and technical services
Educational services
Nursing and residential care facilities

Impact Greater Fayetteville
121
Table 38: Employment Calculated from Quarterly Census of Employment and Wages Data (2015)
Footnotes: (ND) Not Disclosable (NC) Not Calculable, the data does not exist or it is zero
Source: U.S. Bureau of Labor Statistics, Quarterly Census of Employment & Wages

Impact Greater Fayetteville
122
Current Fayetteville Businesses (D&B) Using current Dun &Bradstreet company location data, we analyzed the primary industry for companies with twenty employees or greater (1,499 companies within the three-county region) in manufacturing, wholesale, and services industry. The following industries were present and were noted for further exploration.
Food Products / Processing
Fabricated Metal Products
Motor Freight Transportation and Warehousing
Communications
Wholesale Trade – Durable Goods
Wholesale Trade – Non-Durable Goods
Depository Institutions
Business Services
Engineering, Accounting, Research, Management and Related Services
Figure 33: Top Clusters in Fayetteville Metropolitan (U.S. Cluster Mapping Project)
Source: U.S. Cluster Mapping Project, Institute for Strategy and Competitiveness, Harvard Business School.

Impact Greater Fayetteville
123
Figure 34: Employment by Traded Cluster Fayetteville, NC
Source: U.S. Cluster Mapping Project, Institute for Strategy and Competitiveness, Harvard Business School.

Impact Greater Fayetteville
124
Figure 35: Cluster Linkages and Economic Diversification
Source: U.S. Cluster Mapping Project, Institute for Strategy and Competitiveness, Harvard Business School.

Impact Greater Fayetteville
125
Figure 36: Job Creation by Traded Cluster Fayetteville, NC
Source: U.S. Cluster Mapping Project, Institute for Strategy and Competitiveness, Harvard Business School.

Impact Greater Fayetteville
126
Table 39: Fastest Growing Industries According to IBISWorld, the following industries are forecast to have 4% or greater growth in the period from 2015 to 2016.
Code Title Revenue Growth % (2016)
11111 Soybean Farming in the US 7.55
11191 Tobacco Growing in the US 6.37
21111 Oil Drilling & Gas Extraction in the US 22.33
21211 Coal Mining in the US 4.72
21221 Iron Ore Mining in the US 10.41
21231 Stone Mining in the US 5.77
22111c Hydroelectric Power in the US 7.12
22111d Wind Power in the US 9.77
22111e Solar Power in the US 21.81
23611b Apartment & Condominium Construction in the US 5.97
23611c Housing Developers in the US 8.10
23611d Remodeling in the US 5.90
23622a Commercial Building Construction in the US 5.10
23712 Oil & Gas Pipeline Construction in the US 7.27
23713 Transmission Line Construction in the US 5.83
23811 Concrete Contractors in the US 5.23
23814 Masonry in the US 7.88
23815 Glass & Glazing Contractors in the US 6.59
23822b Plumbers in the US 6.88
23831 Drywall & Insulation Installers in the US 4.74
23832 Painters in the US 4.37
23833 Flooring Installers in the US 4.54
23834 Tile Installers in the US 4.09
23899b Swimming Pool Construction in the US 6.64
23899c Fence Construction in the US 8.51
31191 Snack Food Production in the US 4.18
31213 Wineries in the US 5.18
32111 Sawmills & Wood Production in the US 5.11
32121 Wood Paneling Manufacturing in the US 4.12
32412 Asphalt Manufacturing in the US 4.12
32519 Organic Chemical Manufacturing in the US 5.18
32541a Brand Name Pharmaceutical Manufacturing in the US 5.66
32541b Generic Pharmaceutical Manufacturing in the US 5.66
32562 Cosmetic & Beauty Products Manufacturing in the US 7.81
32611 Plastic Film, Sheet & Bag Manufacturing in the US 5.06

Impact Greater Fayetteville
127
32731 Cement Manufacturing in the US 6.03
32742 Gypsum Product Manufacturing in the US 6.52
32799 Mineral Product Manufacturing in the US 5.01
33299a Guns & Ammunition Manufacturing in the US 5.14
33313 Mining, Oil & Gas Machinery Manufacturing in the US 8.72
33321 Woodworking Machinery Manufacturing in the US 4.74
33329b Printing, Paper, Food, Textile & Other Machinery Manufacturing in the US 5.12
33341 Heating & Air Conditioning Equipment Manufacturing in the US 4.24
33351 Metalworking Machinery Manufacturing in the US 4.18
33441a Semiconductor & Circuit Manufacturing in the US 6.70
33451b Medical Device Manufacturing in the US 4.89
33512 Lighting Fixtures Manufacturing in the US 4.60
33592 Wire & Cable Manufacturing in the US 4.14
33593 Wiring Device Manufacturing in the US 5.53
33632 Automobile Electronics Manufacturing in the US 6.74
33635 Automobile Transmission Manufacturing in the US 4.14
33661a Ship Building in the US 5.84
33661b Boat Building in the US 4.30
33711 Cabinet & Vanity Manufacturing in the US 4.86
42332 Stone, Concrete & Clay Wholesaling in the US 6.20
42351 Metal Wholesaling in the US 5.23
42361 Electrical Equipment Wholesaling in the US 4.97
42371 Tool & Hardware Wholesaling in the US 4.77
42373 Heating & Air Conditioning Wholesaling in the US 4.69
42432 Men's & Boys' Apparel Wholesaling in the US 5.37
42461 Plastics Wholesaling in the US 5.10
42471 Gasoline & Petroleum Bulk Stations in the US 14.87
44122b Bicycle Dealership and Repair in the US 4.93
44229 Home Furnishings Stores in the US 5.52
44611 Pharmacies & Drug Stores in the US 5.56
44612 Beauty, Cosmetics & Fragrance Stores in the US 4.92
44833 Handbag, Luggage & Accessory Stores in the US 4.52
45291 Warehouse Clubs & Supercenters in the US 4.78
45399 Small Specialty Retail Stores in the US 5.29
45411a E-Commerce & Online Auctions in the US 10.82
48111b Domestic Airlines in the US 4.17
48541 Public School Bus Services in the US 4.19
48691 Refined Petroleum Pipeline Transportation in the US 7.60
48710 Sightseeing Transportation in the US 4.20
48851 Freight Forwarding Brokerages & Agencies in the US 4.22
49222 Couriers & Local Delivery Services in the US 5.37
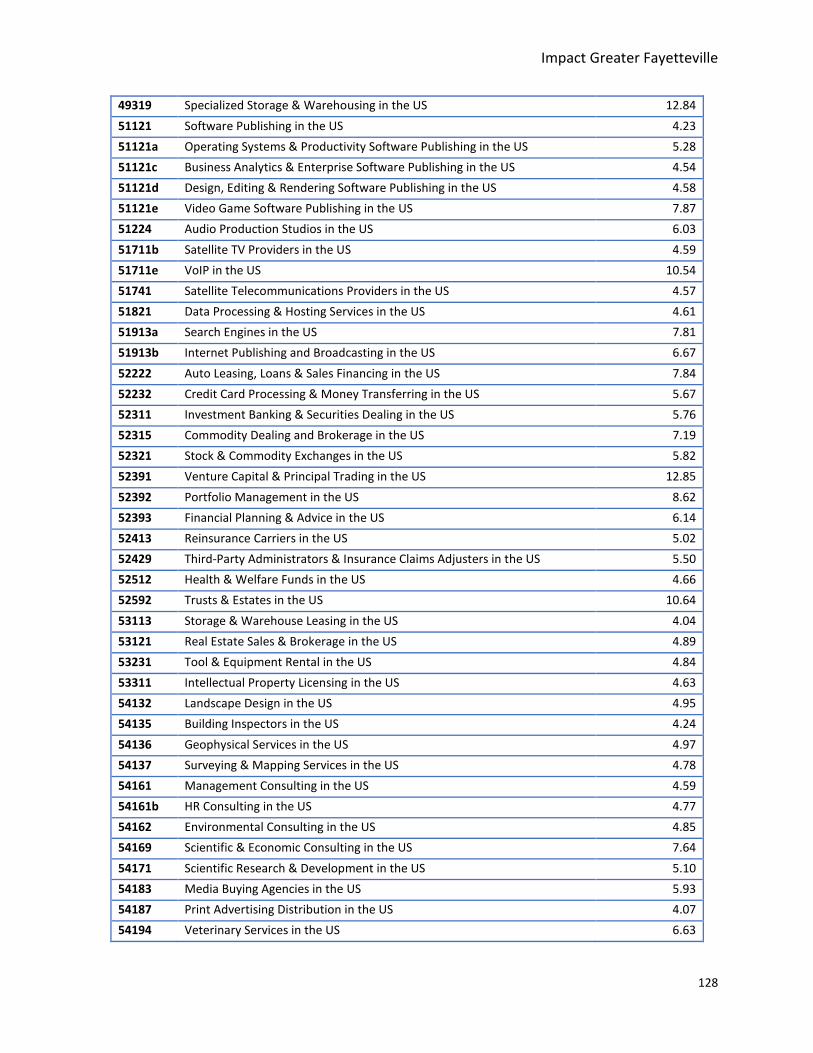
Impact Greater Fayetteville
128
49319 Specialized Storage & Warehousing in the US 12.84
51121 Software Publishing in the US 4.23
51121a Operating Systems & Productivity Software Publishing in the US 5.28
51121c Business Analytics & Enterprise Software Publishing in the US 4.54
51121d Design, Editing & Rendering Software Publishing in the US 4.58
51121e Video Game Software Publishing in the US 7.87
51224 Audio Production Studios in the US 6.03
51711b Satellite TV Providers in the US 4.59
51711e VoIP in the US 10.54
51741 Satellite Telecommunications Providers in the US 4.57
51821 Data Processing & Hosting Services in the US 4.61
51913a Search Engines in the US 7.81
51913b Internet Publishing and Broadcasting in the US 6.67
52222 Auto Leasing, Loans & Sales Financing in the US 7.84
52232 Credit Card Processing & Money Transferring in the US 5.67
52311 Investment Banking & Securities Dealing in the US 5.76
52315 Commodity Dealing and Brokerage in the US 7.19
52321 Stock & Commodity Exchanges in the US 5.82
52391 Venture Capital & Principal Trading in the US 12.85
52392 Portfolio Management in the US 8.62
52393 Financial Planning & Advice in the US 6.14
52413 Reinsurance Carriers in the US 5.02
52429 Third-Party Administrators & Insurance Claims Adjusters in the US 5.50
52512 Health & Welfare Funds in the US 4.66
52592 Trusts & Estates in the US 10.64
53113 Storage & Warehouse Leasing in the US 4.04
53121 Real Estate Sales & Brokerage in the US 4.89
53231 Tool & Equipment Rental in the US 4.84
53311 Intellectual Property Licensing in the US 4.63
54132 Landscape Design in the US 4.95
54135 Building Inspectors in the US 4.24
54136 Geophysical Services in the US 4.97
54137 Surveying & Mapping Services in the US 4.78
54161 Management Consulting in the US 4.59
54161b HR Consulting in the US 4.77
54162 Environmental Consulting in the US 4.85
54169 Scientific & Economic Consulting in the US 7.64
54171 Scientific Research & Development in the US 5.10
54183 Media Buying Agencies in the US 5.93
54187 Print Advertising Distribution in the US 4.07
54194 Veterinary Services in the US 6.63
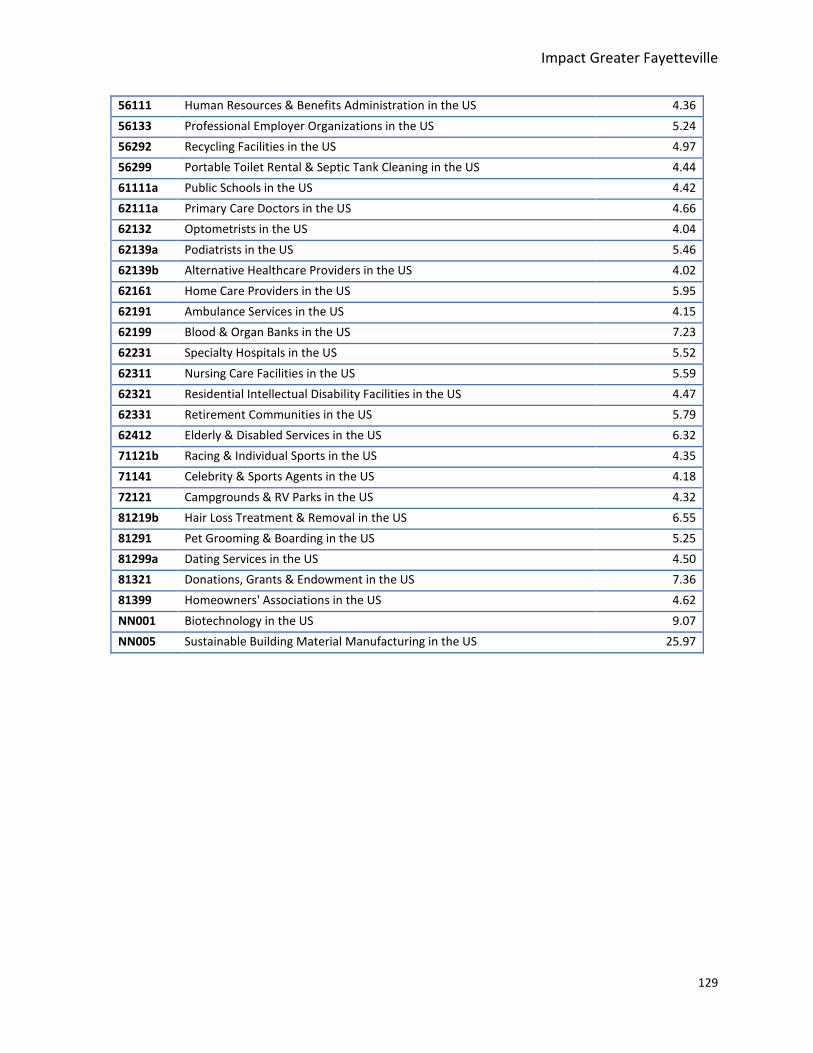
Impact Greater Fayetteville
129
56111 Human Resources & Benefits Administration in the US 4.36
56133 Professional Employer Organizations in the US 5.24
56292 Recycling Facilities in the US 4.97
56299 Portable Toilet Rental & Septic Tank Cleaning in the US 4.44
61111a Public Schools in the US 4.42
62111a Primary Care Doctors in the US 4.66
62132 Optometrists in the US 4.04
62139a Podiatrists in the US 5.46
62139b Alternative Healthcare Providers in the US 4.02
62161 Home Care Providers in the US 5.95
62191 Ambulance Services in the US 4.15
62199 Blood & Organ Banks in the US 7.23
62231 Specialty Hospitals in the US 5.52
62311 Nursing Care Facilities in the US 5.59
62321 Residential Intellectual Disability Facilities in the US 4.47
62331 Retirement Communities in the US 5.79
62412 Elderly & Disabled Services in the US 6.32
71121b Racing & Individual Sports in the US 4.35
71141 Celebrity & Sports Agents in the US 4.18
72121 Campgrounds & RV Parks in the US 4.32
81219b Hair Loss Treatment & Removal in the US 6.55
81291 Pet Grooming & Boarding in the US 5.25
81299a Dating Services in the US 4.50
81321 Donations, Grants & Endowment in the US 7.36
81399 Homeowners' Associations in the US 4.62
NN001 Biotechnology in the US 9.07
NN005 Sustainable Building Material Manufacturing in the US 25.97

Impact Greater Fayetteville
130
Appendix E: Target Industry Profiles
Industry Profiles
Summary Profiles were developed for each of the recommended target industries for Fayetteville. Profiles are important in taking the next steps in proactively targeting companies and providing insight into each industry cluster and sub-segments. The profiles will provide understanding of the industry cluster and each industry sub-sector included in the cluster. The Industry Profiles include the following information:
Definition of the industry by North American Industry Classification System (NAICS) Codes Targeting recommendations Industry statistics by industry sub-segment including
o Industry revenue o Industry profit o Historical and forecasted growth o Revenue per employee o Wages as a percentage of revenue o Average employees per establishment o Wages per employee
Industry sub-segment summaries and outlooks, along with key external drivers and key success factors
Logistics and Warehousing
Cluster Definition (NAICS Codes) 48412 Long Distance Freight Trucking 48423 Tank and Refrigeration Trucking 48851 Freight Forwarding Brokerages and Agencies 48899 Freight Packing and Logistics Services 49311 Public Storage and Warehousing 49312 Refrigerated Storage 49319 Specialized Storage and Warehousing 45411 E-Commerce and Online Auctions 42312 Auto Parts Wholesaling 42351 Metal Wholesaling 42361 Electrical Equipment Wholesaling 42369 Electronic Parts and Equipment Wholesaling

Impact Greater Fayetteville
131
Table 40a: Industry Vitals-Logistics and Warehousing
Targeting Recommendations The following avenues are recommendations, as targeting strategies, for Logistics and Warehousing:
Email marketing and awareness campaigns to surrounding communities and states to create awareness of specific opportunities within Fayetteville such as industry park developments, available sites, and incentives
National, ongoing lead generation program Trade show marketing in conjunction with regional or state partners for an opportunity to meet
with companies as well as network within the industry
Initial target lists can be built from online resources such as Hoovers, Avention, InfoUSA, and industry associations. As lists are built, we search for companies fitting the target using industry codes and business descriptions. The company research process evaluates each company as well as their fit with Fayetteville assets, benefits, and culture. Selected industry associations relevant to this target include:
International Warehouse Logistics Association – www.iwla.com Global Cold Chain Alliance – www.gcca.org Electronic Retailing Association – www.retailing.org National Association of Wholesaler-Distributors – www.naw.org Council of Supply Chain Management Professionals – www.cscmp.org Retail Industry Leaders Association – www.rila.org
Segment Summaries 48412 Long-Distance Freight Trucking DEFINITION Operators in the Long-Distance Freight Trucking industry handle various commodities, usually palletized and transported in containers or van trailers. Establishments typically provide trucking between metropolitan areas and regions that may cross North American country borders. The industry includes establishments operating as truckload or less-than-truckload carriers. KEY EXTERNAL DRIVERS Freight transportation services index Industrial production index Per capita disposal income
Price of diesel Total trade value

Impact Greater Fayetteville
132
KEY SUCCESS FACTORS Market research and understanding Having a high profile in the market Output is sold under contract –
incorporate long-term sales contracts
Optimum capacity utilization Ensuring pricing policy is appropriate Superior financial management and
debt management
OUTLOOK Revenue for the Long-Distance Freight Trucking industry is expected to rise 2.4% in 2017. Increasing manufacturing activity and greater retail spending will ensure higher freight volumes as retail inventory returns to pre-recessionary levels. In addition, rising trade volumes during the next five years will increase shipments to and from U.S. ports, requiring more trucking companies to move goods across the country. The Transportation Services Index is also expected to grow as consumer spending slowly increases, indicating greater demand for industry services. In the five years to 2021, IBISWorld forecasts that industry revenue will grow at an annualized rate of 2.1% to $202.0 billion. 48423 Tank and Refrigeration Trucking DEFINITION This industry comprises establishments that provide long-distance specialized transportation of cargo using trucks and trailers. The industry moves cargo that, because of size, weight, shape or other characteristics, requires specialized equipment for transportation. Companies within this industry transport items such as automobiles, gravel, sand, dirt, chemicals, frozen goods, livestock, milk and petroleum. KEY EXTERNAL DRIVERS Freight transportation services index U.S. oil and gas production index Demand from frozen food
wholesaling Price of diesel
KEY SUCCESS FACTORS Optimum capacity utilization Output is sold under contract –
incorporate long-term sales contracts Access to the latest available and
most efficient technology and techniques
Access to highly skilled workforce Having a diverse range of clients Successful industrial relations policy
OUTLOOK Over the next five years, the Tank and Refrigeration Trucking industry will continue to grow steadily. A strengthening U.S. economy is anticipated to lead to increased consumer spending, stimulating retail, industrial, and construction activity. Thus, demand for industry services will climb. Moreover, as the manufacturing sector recovers and fuel surcharges rise, revenue will pick up from recent declines. Therefore, in the five years to 2021, industry revenue is forecast to climb an annualized 3.0% to $43.7 billion. 48851 Freight Forwarding Brokerages and Agencies DEFINITION Companies in this industry arrange the transportation of freight between shippers and carriers. These operators are usually known as freight forwarders, marine shipping agents

Impact Greater Fayetteville
133
or customs brokers and offer services for many modes of transportation. Because operators act as agents, the industry does not include the cost of arrangement as part of its revenue. KEY EXTERNAL DRIVERS Freight transportation services index Total trade value Consumer spending E-commerce sales World price of crude oil
KEY SUCCESS FACTORS
Ability to quickly adopt new technology
Understanding government policies and their implications
Provision of superior after sales service
Access to quality personnel Having contacts within key markets
OUTLOOK The Freight Forwarding Brokerages and Agencies industry will continue to grow at a relatively brisk pace over the next five years. A strengthening domestic economy, including increased consumer spending and recovering industrial activity, is projected to lead to higher freight volumes. Consequently, demand for industry services is expected to increase. Moreover, operators will continue to expand their international businesses as emerging markets further develop and trade grows. However, the recent slowdown in emerging market growth and U.S. manufacturing may continue to slow this trend. Nonetheless, in the five years to 2021, industry revenue is forecast to climb at an annualized rate of 3.5% to $146.8 billion. 48899 Freight Packing and Logistics Services DEFINITION This industry’s main activity is providing packing and crating services for the transportation sector. The industry is composed of companies that provide consolidation of freight consignments, trade document preparation, packing, crating and otherwise preparing goods for transportation and logistics consulting services. The industry does not include actual transportation of goods. KEY EXTERNAL DRIVERS Consumer spending Freight transportation services index Industrial production index Total trade value
KEY SUCCESS FACTORS
Marketing of differentiated products Ability to quickly adopt new
technology Ability to provide goods and services
in diverse locations Effective quality control Proximity to key markets Access to multi-skilled and flexible
workforce OUTLOOK The Freight Packing and Logistics Services industry will grow more robustly in coming years as the global economy gains traction. Over the five years to 2020, revenue is forecast to rise at an annualized rate of 2.2% to $2.5 billion. Stronger consumption and manufacturing levels, as well as trade growth, will bolster freight volumes. These higher freight volumes will boost demand for freight packing and logistics services. The freight transportation services

Impact Greater Fayetteville
134
index is forecast to increase at an annualized 1.5% over the five-year period. Nonetheless, strong internal and external competition will slow growth. Domestic and international trade are important sources of demand for freight packing and logistics services. As domestic wholesale trade and imports and exports increase, industry revenue grows as well. Operators are often responsible for packing consignments or preparing documents for product exports. Domestic wholesale trade and the total value of U.S. trade are projected to rise over the next five years, supporting industry growth. Industry operators that survived the recession will benefit from continuous increases in demand through 2020. Rebounding domestic and overseas demand will also attract new entrants to the industry, with the number of enterprises expected to rise at an annualized rate of 1.3% to 5,867 in 2020, as demand picks up and freight volumes are revived. This industry expansion over the next five years reflects an expected long-term rise in freight trade. However, the recent slowdown in emerging market growth is anticipated to slow down demand for trade-related industry services. IBISWorld projects that a flexible workforce will continue to protect industry profitability. Companies typically hire employees on an as-needed basis, allowing them to reduce the size of their staff when downstream demand weakens so that they can stay afloat amid weaker revenue streams. Moreover, many participants operate independently and do not maintain a permanent staff. As demand for industry services grows, employment is expected to modestly increase at an annualized rate of 1.4% to 21,701 workers over the five years to 2020. Wages will follow a similar trend, increasing at an annualized rate of 1.8% to total $1.2 billion in 2020. This growth will help the industry maintain healthy profit, which is forecast to rise from 8.4% of revenue in 2015 to 9.9% in 2020. As demand returns and the workforce expands, the average employee wage is expected to rise 49311 Public Storage and Warehousing DEFINITION Industry operators provide third-party storage warehousing and storage services to the manufacturing, wholesale and retail sectors. Operators generally use equipment such as forklifts, pallets, and racks to handle goods in containers like boxes, barrels, and drums. Industry companies avoid specializing in handling bulk products of any particular type, size or quantity. Companies that rent or lease space for self-storage to consumers are not included in this industry. KEY EXTERNAL DRIVERS Consumer spending E-commerce sales Freight transportation services index Total trade value Manufacturing capacity utilization
KEY SUCCESS FACTORS Use of most efficient work practices Ability to alter mix of inputs in line
with cost Optimum capacity utilization Output is sold under contract –
incorporate long-term sales contracts Provision of appropriate facilities
OUTLOOK The Public Storage and Warehousing industry is expected to experience stronger growth over the next five years. An anticipated acceleration of consumer spending relative to

Impact Greater Fayetteville
135
the prior period will further lift demand for warehousing from manufacturers as they ship, and purchase storage for, more consumer goods. In addition, increased import penetration into the manufacturing sector is expected to drive greater demand because foreign manufacturers often require domestic third parties to receive and store products for the U.S. market. Finally, although it will continue to put upward pressure on industry wage and rental costs, sustained growth in e-commerce is also expected to increase third party warehousing needs, driving strong industry growth. Over the five years to 2021, industry revenue is expected to increase at an annualized rate of 3.3% to $24.1 billion. 49312 Refrigerated Storage DEFINITION This industry includes establishments that operate refrigerated warehousing and storage facilities. Temperature-controlled services include blast freezing and tempering. Establishments that primarily store furs for trade are included in this industry. These furs are used as raw materials for the manufacturing of garments and personal accessories such as bags and shoes. KEY EXTERNAL DRIVERS Consumer spending Total trade value Demand from grocery wholesaling Demand from brand name
pharmaceutical manufacturing Demand from frozen food production KEY SUCCESS FACTORS
Optimum capacity utilization Automation – reduces costs,
particularly those associates with labor
Output is sold under contract – incorporate long-term sales contracts
Provision of appropriate facilities
OUTLOOK The Refrigerated Storage industry is forecast to grow during the five years to 2021, supported by increasing demand from downstream markets and higher trade volume. Improving economic conditions will enable consumers to purchase a greater variety of food products at grocery stores and other retail channels, boosting demand for refrigerated storage. While pharmaceutical manufacturers only account for a small share of industry revenue, demand from this downstream market segment is anticipated to grow as the U.S. population ages, lifting demand for prescription medication. Additionally, growing demand for pharmaceutical goods in countries such as China, Brazil, and India will cause U.S. pharmaceutical companies to increasingly rely on refrigerated storage facilities to store their goods before they are exported. The total U.S. trade value is anticipated to grow at an annualized rate of 4.4% over the five years to 2021. Coupled with robust consumer spending, overall industry revenue is forecast to grow at an annualized rate of 2.0% to $5.0 billion over the same period, including a growth of 1.5% in 2017. Data from the U.S. Department of Agriculture indicates that total cold storage capacity in the United States has grown steadily over the past decade. IBISWorld forecasts capacity to continue growing during the outlook period. As credit conditions improve, refrigerated storage operators are expected to invest in new facilities, expand the storage space of existing facilities and invest in new technology and equipment.

Impact Greater Fayetteville
136
49319 Specialized Storage and Warehousing DEFINITION Companies in the Specialized Storage and Warehousing industry primarily operate specialized warehousing and storage facilities. This does not include general merchandise, refrigerated and farm product warehousing or storage. KEY EXTERNAL DRIVERS Demand from oil drilling and gas
extraction Demand from petroleum refining Regulation for the specialized storage
and warehouse industry Demand from chemical manufacturing Demand from logging KEY SUCCESS FACTORS
Ability to alter mix of inputs in line with cost
Optimum capacity utilization Automation – reduces costs, particularly
those associates with labor Output is sold under contract –
incorporate long-term sales contracts Ability to accommodate environmental
requirements
OUTLOOK The Specialized Storage and Warehousing industry is expected to grow in the five years to 2020. Industry fortunes are linked closely to the performance of the oil and gas sectors, the chemical manufacturing sector, and, to a lesser extent, the logging and automobile-manufacturing sectors. Other factors that affect industry growth include legislative compliance with security and environmental regulation, as well as technological innovation. Steady growth in demand for oil drilling and gas storage is expected to cause industry revenue to grow at a steady annualized rate of 5.9% in the five years to 2020, to $9.1 billion. In 2016, industry revenue is forecast to increase 12.8% as demand for petroleum storage increases as a result of low oil prices, and the growing economy boosts demand from chemical manufacturers and the logging industry. 45411 E-Commerce and Online Auctions DEFINITION The E-Commerce and Online Auctions industry comprises establishments that sell merchandise online. The internet is the main selling platform via either a retailer’s online store or an auction site. This industry excludes media and software that is streamed or downloaded online. KEY EXTERNAL DRIVERS Per capital disposable income Number of mobile internet connections Percentage of services conducted online World price of crude oil
KEY SUCCESS FACTORS Ability to control stock on hand Ability to quickly adopt new technology Provision of superior after sales service Having a loyal customer base
OUTLOOK The E-Commerce and Online Auctions industry will continue to grow, albeit at a slower rate than in the past, as the convenience and ability to compare items and prices incentives consumers to purchase products online. In the five years to 2021, revenue is expected to increase at an annualized rate of 4.4% to $366.2 billion, with a 4.9% growth in 2017. Despite

Impact Greater Fayetteville
137
accelerated per capita disposable income growth, the growth in the number of mobile internet connections is expected to slow over the five years to 2021, rising at an annualized rate of only 5.1%, depressing industry revenue. Additionally, volatility in the world price of crude oil is expected to have negative impacts on the average industry profit margin. In the five years to 2016, the world price of crude oil drastically declined due to increased supply; however, a correction in the price over the five years to 2021 is estimated to raise the price at an annualized rate of 8.5%. An increase in the price of crude oil could negatively affect operators’ profit margin by increasing shipping costs. 42312 Auto Parts Wholesaling DEFINITION This industry comprises operators that sell automotive parts wholesale to automobile manufacturers, automotive parts retailers and auto service providers. Sales of new tires and tubes are not included. KEY EXTERNAL DRIVERS Demand from car and automobile
manufacturing Number of motor vehicle registrations Per capital disposable income Age of vehicle fleet Regulation for the automotive sector KEY SUCCESS FACTORS
Upstream vertical integration (ownership links)
Ability to control stock on hand Having contacts in key markets Production of goods currently favored
by the market Development of a symbiotic relationship
with another industry
OUTLOOK As the entire automotive sector grows steadily in line with a generally improving economy, the Auto Parts Wholesaling industry will benefit. Additionally, IBISWorld expects the industry to continue its upward trend as demand from car and automobile manufacturing improves. Moreover, due to stricter emission requirements and increased ecofriendly initiatives, automakers are demanding lighter and more efficient auto parts, which are anticipated to also spur industry demand. Thus, industry revenue is estimated to grow at an annualized rate of 2.0% to $200.0 billion over the five years to 2021. In the future, the average value of auto parts demanded per vehicle may decline because of consumer trends moving toward more compact, fuel-efficient vehicles. These cars are smaller in size and scope, requiring fewer parts in production than the amount a sport utility vehicle (SUV) or light truck would call for. Over the next five years, consumer demand for these vehicles will facilitate higher compact car production. While the value of parts per vehicle is generally lower in these compact vehicles, recently introduced computer components, such as on-board diagnostic systems aimed at controlling vehicle emissions and proposed technological safety features, have the ability to increase their value. Additionally, as vehicles age and their components depreciate, replacement parts become more important. Therefore, suppliers will focus on wholesaling strategies around new, high profit margin products as they are incorporated into new vehicle production and aging vehicles as replacement parts. As a result of this new strategy, industry profit is expected to benefit.

Impact Greater Fayetteville
138
Leaner operating conditions lean will also ultimately lead operators to improved profitability. For example, operators are expected to find alternative ways to increase capacity without expanding the number of facilities. To this end, the number of industry establishments is forecast to grow at an annualized rate of only 1.0% to 19,174 facilities over the five years to 2021. As a result, operators are projected to hire more employees. Therefore, employment numbers are anticipated to slightly grow at an annualized rate of 1.6% to 235,969 employees over the five-year period. For fear of being overzealous, participants in the Auto Parts Wholesaling industry are cautiously increasing capacity and hiring, despite recent economic improvements. Nonetheless, as demand rebounds and operating costs are kept relatively low, industry operators are estimated to benefit from increased profit margins. 42351 Metal Wholesaling DEFINITION Metal wholesaling operators distribute primary metal products, both ferrous and nonferrous, to industrial and construction markets. Operators maintain inventory and may perform functions like sawing and cleaning on a custom basis and as part of the distribution service. However, operators do not distribute precious metals, such as gold, silver and platinum, and they also do not distribute insulated wire or recyclable metal scrap. KEY EXTERNAL DRIVERS World price of steel Industrial production index Value of construction World price of aluminum KEY SUCCESS FACTORS Effective quality control
Ability to control stock on hand and maintain appropriate inventory levels
Having links with suppliers Access to the latest available and most
efficient technology and techniques Ability to alter mix of offerings in line
with price changes and consumer preference
Proximity to key markets
OUTLOOK Moving forward, the Metal Wholesaling industry’s performance will remain tied to conditions in key industrial markets and movements in primary metal prices. Sustained need for metals in key manufacturing, mining and construction industries will propel demand for industry services, especially as disposable income, business investment and interest rates continue to improve. The price of steel is expected to trend upward, after its decline over the past five years. Overall, revenue is expected to increase at an annualized rate of 2.4% in the five years to 2021 to reach $171.8 billion. Copyright © 1999-2016 IBISWorld

Impact Greater Fayetteville
139
Defense and Security
Cluster Definition (NAICS Codes) 33299 Guns and Ammunition Manufacturing 33361 Engine and Turbine Manufacturing 33422 Communication Equipment Manufacturing 33429 Alarm, Horn, and Traffic Control Equipment Manufacturing 33451 Navigational Instrument Manufacturing 33592 Wire and Cable Manufacturing 33593 Wiring Device Manufacturing 33641 Aircraft, Engine, and Parts Manufacturing 33641 Space Vehicle and Missile Manufacturing 33699 Tank and Armored Vehicle Manufacturing 51121 Security Software Publishing 51721 Wireless Telecommunications Carriers 51791 Radar and Satellite Operations 54151 IT Consulting
Table 40b: Industry Vitals-Defense and Security
Targeting Recommendations The following avenues are recommendations, as targeting strategies, for Defense and Security:
National, ongoing lead generation program Email marketing and awareness campaigns to surrounding communities and states in order to
create awareness of specific opportunities within Fayetteville such as industry park developments, available sites, and incentives
Trade show marketing in conjunction with regional or state partners for an opportunity to meet with companies as well as network within the industry
Initial target lists can be built from online resources such as Hoovers, Avention, InfoUSA, and industry associations. As lists are built, we search for companies fitting the target using industry codes and business descriptions. The company research process evaluates each company, as well as, their fit with Fayetteville assets, benefits and culture. Selected industry associations relevant to this target include:
National Electrical Manufacturers Association – www.nema.org Aerospace Industries Association – www.aia-aerospace.org

Impact Greater Fayetteville
140
Information Systems Security Association – www.issa.org National Defense Industrial Association – www.ndia.org National Homeland Security Association – www.nationalusai.com AeroDef Manufacturing – www.areodefevent.com International Society for Optics and Photonics – www.spie.org
Segment Summaries 33299 Guns and Ammunition Manufacturing DEFINITION This industry manufactures small arms (including shotguns, rifles, revolvers, pistols, machine guns, and grenade launchers), and ammunition, ordnance, and accessories. KEY EXTERNAL DRIVERS Federal funding for defense Non-NATO defense spending Local and state government investment Per capita disposable income Trade-weighted index
KEY SUCCESS FACTORS Having a loyal customer base Access to high quality inputs Effective quality control Having a good technical knowledge of
the product Establishment of branch names Control of distribution arrangements
OUTLOOK The Guns and Ammunition Manufacturing industry’s trajectory over the next five years will largely depend on U.S. defense spending and perceptions about the future of firearms legislation. While revenue grew substantially over the past five years, it is forecast to move more in line with historical growth rates as consumer demand eventually begins to normalize. Nonetheless, increased military spending on industry products will help bolster industry growth, despite overall spending remaining below levels seen in 2012. Moreover, industry operators will increasingly depend on exports for expansion. Overall, in the five years to 2021, industry revenue is forecast to grow at an annualized 2.8% to $18.2 billion, with a 3.4% increase in 2017. 33361 Engine and Turbine Manufacturing DEFINITION Operators in this industry manufacture turbines and equipment used for power transmission, such as generators, as well as diesel engines for highway vehicles and heavy-duty equipment. Parts and accessories are included, but wind turbines are excluded (see IBISWorld report 33361b). KEY EXTERNAL DRIVERS Trade-weighted index Demand from truck transportation Private investment in industrial
equipment and machinery Electric power consumption World price of steel
KEY SUCCESS FACTORS Quickly adopting new technology Using the latest technologies Effective quality control Securing long-term sales contracts Access to export destinations
Impact Greater Fayetteville
141
OUTLOOK Over the five years to 2021, industry manufacturers will benefit from an extended upturn in domestic freight volumes, especially in the trucking sector. Greater industrial and manufacturing activity will also ultimately increase energy demand, aiding industry sales of turbine and power generation equipment. However, sales growth for industry exports is anticipated to slow in subsequent years, as a strengthening U.S. dollar and diminished global growth in vital emerging economies may threaten export demand for engines and turbines. However, exports are still anticipated to account for a fair share of industry revenue. Consequently, in the five years to 2021, industry revenue is expected to increase a more moderate annualized rate of 1.5% to $59.9 billion, including an estimated growth of 2.0% in 2017. 33422 Communication Equipment Manufacturing DEFINITION This industry primarily manufactures broadcasting and other wireless communication equipment. Examples of such equipment include antennas, set-top boxes, GPS systems, cell phones, satellite uplink technologies, and radio and TV broadcasting equipment. Operators in this industry do not manufacture radio or television sets, intercoms, or equipment to test communication signals. KEY EXTERNAL DRIVERS Aggregate private investment Consumer spending Trade-weighted index Number of cable TV subscriptions Number of mobile internet connections Demand from radio broadcasting
KEY SUCCESS FACTORS Effective quality control Production of a range which
accommodates future developments Having technology sharing
arrangements with major players Superior financial management and
debt managementOUTLOOK The Communication Equipment Manufacturing industry will benefit from increasing demand as the economy grows and consumer sentiment rises, stimulating demand from downstream industries. Moreover, as the unemployment rate decreases and per capita disposable income rises, consumers are expected to increase discretionary spending, particularly on electronics such as smart phones. Over the five years to 2021, consumer spending is forecast to increase at an annualized rate of 2.4%. Additionally, demand from the Wireless Telecommunications Carriers industry (IBISWorld report 51721) and the Television Broadcasting industry (IBISWorld report 51512) are expected to grow at a faster rate than in the previous five-year period, while demand from the Radio Broadcasting industry (IBISWorld report 51511) is also anticipated to increase over the next five years. As a result of stronger demand, industry revenue is expected to rebound and grow at an annualized rate of 1.3% to $29.2 billion over the five years to 2021. 33429 Alarm, Horn, and Traffic Control Equipment Manufacturing DEFINITION This industry manufactures communications equipment that includes alarm systems, hazard detection systems, traffic signals, sirens, and intercom systems. This industry excludes

Impact Greater Fayetteville
142
telephone apparatuses, radio and TV broadcast equipment, and wireless communications equipment. KEY EXTERNAL DRIVERS Demand from car and automobile
manufacturing Demand from road and highway
construction Housing starts Trade-weighted index Value of private nonresidential
construction
KEY SUCCESS FACTORS Automation Having links with suppliers Establishment of export markets Production of premium goods/services Access to the latest available and most
efficient technology and techniques Economies of scale
OUTLOOK As residential and nonresidential construction industries ramp up building activity in the next five years, the Alarm, Horn, and Traffic Control Equipment Manufacturing industry is set for steady revenue growth. The industry will also benefit from a rebound in U.S. automobile manufacturing and renewed investments in roads and highways. In the five years to 2020, revenue is forecast to increase at an annualized rate of 0.8% to $5.6 billion. More robust growth in industry revenue is anticipated to be subdued by competition from imports and slow export growth caused by an appreciating dollar during the five-year period. 33451 Navigational Instrument Manufacturing DEFINITION The industry manufactures navigational, measuring and control instruments. Its products include aeronautical instruments, appliance regulators and controls (except switches), laboratory analytical instruments, navigation and guidance systems, and physical properties testing equipment. KEY EXTERNAL DRIVERS Demand from laboratory testing
services Private investment in industrial
equipment and machinery Research and development expenditure Trade-weighted index Government consumption and
investment
KEY SUCCESS FACTORS Access to the latest technology Having links with suppliers Developed export markets Economies of scale Access to highly skilled workforce Research and development
OUTLOOK Over the five years to 2021, the Navigational Instrument Manufacturing industry’s revenue is forecast to increase at an annualized rate of 1.3% to $111.1 billion. Revenue will decline 0.3% in 2017 due to strong rises in the TWI. During this period, increasing corporate profit will allow for greater private R&D spending, which will facilitate product innovation and industry revenue growth. Furthermore, operators will benefit from a rebound in government consumption and investment, allowing for greater demand in the segment. Continued strong demand from downstream markets and emerging markets, such as energy, will also contribute to the industry’s projected growth. For example, the government has also provided tax grants

Impact Greater Fayetteville
143
to enterprises that operate in renewable energy, such as solar and wind. Government incentives will enable these industries to expand in the next five years, and their operations will require testing and measuring devices provided by industry operators. However, growing international competition and lower economic prospects in certain export regions will hamper growth. 33592 Wire and Cable Manufacturing DEFINITION This industry manufactures insulated nonferrous wire and cable and fiber optic cable used for power transmission and communication. This industry does not manufacture nonferrous wire or unsheathed fiber-optic materials, and instead uses wire and optical fiber manufactured by companies outside the industry. KEY EXTERNAL DRIVERS Trade-weighted index World price of copper Demand from broadcasting and
telecommunications Government consumption and
investment Value of private nonresidential
construction Consumer spending
KEY SUCCESS FACTORS Access to the latest available and most
efficient technology and techniques Having contracts with large customers Establishment of export markets Undertaking technical research and
development Guaranteed supply of key inputs Economies of scale
OUTLOOK Over the five years to 2021, improving economic conditions are expected to further stimulate downstream demand for wire and cable. An anticipated rise in per capita disposable income will result in greater consumer spending on electrical goods and appliances, driving rising demand for electrical wires from downstream consumer goods manufacturers. Additionally, as the population continues to rise, increased demand for power will continue to stimulate rising private and public expenditure and investment in power infrastructure, driving downstream utilities sector demand for power transmission wire and cable. Furthermore, increasing construction activity and rising telecommunications sector spending on wireless connectivity are expected to sustain growing demand for building and fiber-optic cable. In addition to rising downstream demand for industry products, world copper prices are projected to increase, positively impacting revenue. The Wire and Cable Manufacturing industry revenue is projected to increase at an annualized rate of 1.5% to reach $13.6 billion over the five years to 2021. Despite this positive trend, revenue growth will continue to be constrained by high import penetration, as both offshoring of manufacturing operations to low-wage countries and the further appreciation of the US dollar are anticipated to continue over the outlook period. 33593 Wire Device Manufacturing DEFINITION Companies in this industry manufacture current-carrying wiring devices and noncurrent-carrying wiring devices for wiring electrical circuits. These include products such as outlet and switch electrical wiring boxes, electrical insulators, transmission pole and line

Impact Greater Fayetteville
144
hardware, electrical metallic tubes, switches, conductor connectors, electric sockets, plugs, and electric cords. KEY EXTERNAL DRIVERS Demand from electricians Demand from electrical equipment
manufacturing Housing starts Industrial production index Trade-weighted index World price of copper
KEY SUCCESS FACTORS Having links with suppliers Establishment of export markets Access to the latest available and most
efficient technology and techniques Economies of scale Effective quality control Control of distribution arrangements
OUTLOOK The Wiring Device Manufacturing industry is expected to continue benefiting from improved economic conditions over the next five years. Construction activity, consumer spending, and private investment are all expected to increase over the period. Furthermore, an increase in domestic demand from downstream industries and a rise in exports will also contribute to the industry’s improved performance. As a result of these trends, industry revenue is expected to grow at an annualized rate of 4.4% to $19.8 billion in the five years to 2020, including a 5.5% increase in 2016 alone. From a cost perspective, industry consolidation among the larger and medium sized players will raise productivity and keep labor costs in check due to streamlining production. Thus, while total industry employment will increase at a five-year average annual rate of 2.8% to total 46,985 workers by 2020; industry wages as a percentage of revenue will go from 14.4% in 2015 to 13.6% in 2020. 33641 Aircraft, Engine, and Parts Manufacturing DEFINITION Companies in this industry manufacture and overhaul complete aircraft, develop prototypes and convert aircraft. The industry also includes the manufacture, conversion, and overhaul of aircraft engines and propulsion systems. Additionally, the industry makes related parts and auxiliary equipment. For information on guided missiles, space vehicles and related equipment, which are excluded from this industry, see Space Vehicle and Missile Manufacturing industry (IBISWorld report 33641b). KEY EXTERNAL DRIVERS Demand from air transportation Federal funding for defense Non-NATO defense spending Trade-weighted index KEY SUCCESS FACTORS
Economies of scope Well-developed internal processes Establishment of export markets Ability to accommodate environmental
requirements Economies of scale Access to the latest available and most
efficient technology and techniques
OUTLOOK Over the next five years the Aircraft, Engine and Parts Manufacturing industry will reach new altitudes. Rising domestic and international demand for air travel will create strong

Impact Greater Fayetteville
145
demand for more commercial aircraft and associated parts. In addition, airlines will seek to replace older models with newer, more fuel-efficient ones. However, weak U.S. military spending will continue to put pressure of defense contractors. Nonetheless, increased military hardware exports and a leveling off of the defense budget should ease this pressure. Therefore, in the five years to 2021, industry revenue is forecast to climb at an annualized rate of 4.2% to $296.5 billion. 33641 Space Vehicle and Missile Manufacturing DEFINITION The Space Vehicle and Missile Manufacturing industry consists of businesses involved in the manufacture of guided missiles and space vehicles, including the development of prototypes and the manufacture and development of parts, propulsion units and support equipment used in guided missiles and space vehicles. This industry does not produce satellites. KEY EXTERNAL DRIVERS Federal funding for defense Non-NATO defense spending Technological change for the space
vehicle and missile industry Demand from satellite
telecommunications providers Trade-weighted index
KEY SUCCESS FACTORS Well-developed internal processes Ability to take advantage of government
subsidies and other grants Ability to expand and curtail operations
rapidly in line with market demand Economies of scale Access to the latest available and most
efficient technology and techniques
OUTLOOK Over the next five years, the Space Vehicle and Missile Manufacturing industry will slowly liftoff. More stable government funding and development of next generation missile systems will boost revenue growth, while NASA funds further space programs. Moreover, climbing defense spending in emerging markets and continued geopolitical tensions will strengthen demand for missile exports. Industry competition will also intensify as new players continue to enter the market, while the commercial segment expands. At the same time, government funding will remain constrained, tempering demand and endangering industry programs. Therefore, over the five years to 2021, industry revenue is forecast to climb an annualized 2.1% to $30.8 billion. 33699 Tank and Armored Vehicle Manufacturing DEFINITION This U.S. industry manufactures complete military armored vehicles, combat tanks, and specialized components for combat tanks, including self-propelled weapons. KEY EXTERNAL DRIVERS Federal funding for defense Non-NATO defense spending World price of steel Trade-weighted index
KEY SUCCESS FACTORS Provision of superior after sales service Undertaking technical research and
development
Impact Greater Fayetteville
146
Financial structure of the company Establishment of export markets
Access to the latest available and most efficient technology and techniques
Experienced work force OUTLOOK Over the next five years, the Tanks and Armored Vehicle Manufacturing industry will stabilize and expand as defense spending cuts on industry programs reverse. Operators will still face heavy fire, as the United States further scales down combat operations in Afghanistan and the government attempts to reduce the deficit, with spending on tanks and armored vehicles will remain pressured. However, these cuts are anticipated to reverse, with funding for industry programs expected to grow over 5.0% each year after 2016. Additionally, industry exports are projected to climb as geopolitical tensions continue to generate foreign demand for US arms. Therefore, in the five years to 2020, industry revenue is forecast to climb at an annualized 6.3% to $4.4 billion. 51121 Security Software Publishing DEFINITION This industry develops and distributes antivirus, anti-keylogger, spyware removal, encryption and firewall software. Operators in the industry may also provide consulting and technical support related to this software. KEY EXTERNAL DRIVERS Crime rate Private investment in computers and
software Number of mobile internet connections Number of broadband connections Price of computers and peripheral
equipment
Government consumption and investment
KEY SUCCESS FACTORS Undertaking technical research and
development Access to highly skilled workforce Protection of patents Ability to quickly adopt new technology Access to retail distribution channels
OUTLOOK Over the five years to 2021, revenue for the Security Software Publishing industry is expected to grow at an annualized rate of 5.0% to $16.1 billion, starting with a 5.4% jump in 2017. New opportunities in mobile will continue to drive industry growth as consumers migrate away from their desks to portable computing devices, such as smartphones and tablets, forcing security software to adapt to protect new devices. Additionally, with computing technology evolving at a rapid pace, the prevalence and complexity of cyber attacks will grow, forcing consumers and businesses to invest more in security software. However, slowed corporate profit growth will lead to slow growth in private investment for computers and software. Moreover, growth in the number of mobile internet connections is also expected to slow. 51721 Wireless Telecommunications Carriers DEFINITION This industry operates and maintains switching and transmission facilities to provide direct communication through radio-based cellular networks. Industry services include cellular mobile phone services, paging services, wireless internet access, and wireless video services.

Impact Greater Fayetteville
147
KEY EXTERNAL DRIVERS Number of mobile internet connections Percentage of services conducted online Per capita disposable income Price of semiconductor and electronic
components
KEY SUCCESS FACTORS Developing close relationships in other
industries Ready access to investment funding Ability to quickly adopt new technology Having a high profile in the market Exclusive product sales contracts Economies of scale
OUTLOOK The Wireless Telecommunications Carriers industry is well positioned for future growth. Expanding demand for wireless data services is anticipated to offset declining demand for voice-only services, particularly as more broadband-enabled mobile devices, such as tablet computers and e-readers, achieve wider penetration. Over the five years to 2021, the number of wireless subscribers is expected to continue increasing. As a result, revenue is projected to grow at an annualized rate of 3.2% over the next five years, reaching $300.1 billion in 2021. The battle to establish a dominant fourth-generation (4G) technology appears to have come to an end. Verizon and AT&T have settled on long-term evolution (LTE) as their preferred 4G technology, and Sprint-Nextel has also indicated that it will be transitioning from WiMax, a wireless technology similar to Wi-Fi that travels faster and further, to LTE. The emergence of LTE as the dominant 4G wireless technology is expected to enable a more rapid transition by consumers to 4G devices and continue encouraging households to let go of their wired service. A format war between LTE and WiMax would likely have kept many consumers from committing to either as they waited to see which standard would emerge victorious and offer the greatest service area. The speedy victory of 4G technology is expected to increase industry revenue by reducing capital costs, enabling industry operators to focus on further developing this technology instead of two separate options. 51791 Radar and Satellite Operations DEFINITION Industry operators provide specialized satellite telecommunication services such as satellite tracking, telemetry and radar station operation. They also provide terminal stations and facilities connected with terrestrial systems that transmit telecommunications to, and receive telecommunications from, satellite systems. The industry does not provide telecommunication services but works closely with those that do, reflecting high interdependence in the telecommunications sector. KEY EXTERNAL DRIVERS Demand from satellite
telecommunications providers Demand from satellite TV providers Government consumption and
investment Number of broadband connections Per capita disposable income
Private investment in computers and software
KEY SUCCESS FACTORS Proximity to key markets Ability to effectively manage debtors Access to secure revenue Access to highly skilled workforce Having an integrated operation Ability to quickly adopt new technology

Impact Greater Fayetteville
148
OUTLOOK The outlook for companies in the Radar and Satellite Operations industry suggests slightly slower revenue growth. Over the five years to 2021, IBISWorld forecasts that revenue will increase at an annualized rate of 3.1% to $3.3 billion. While the industry will benefit from an expanding global economy and stability in demand from the downstream satellite telecommunications market, the industry’s revenue growth per year will trail its performance during the previous five-year period. Fortunately, the continual business and consumer need for satellite telecommunications service and repair will stretch satellite network capacity and necessitate some infrastructure upgrades and expansions. The interdependency of satellite launches and the tracking, telemetry and control (TT&C) of these satellites remain high. The limited supply of operators with the experience and technology required to perform these operations will likely allow the industry’s well-established players to increase their prices accordingly. Therefore, industry profit margins are also expected to remain stable and reach 8.4% in 2021. 54151 IT Consulting DEFINITION The IT Consulting industry includes firms that provide the following services to client companies: writing, testing, and supporting custom software; planning and designing integrated hardware, software, and communication infrastructure; and on-site management of computer systems and data processing facilities. This industry excludes packaged software publishers and off-site data processing and hosting services. KEY EXTERNAL DRIVERS Private investment in computers and
software Corporate profit Demand from finance and insurance Government consumption and
investment
KEY SUCCESS FACTORS Adoption of a commercial focus Access to the latest available and most
efficient technology and techniques Access to highly skilled workforce Effective cost controls Good project management skills
OUTLOOK The IT Consulting industry is forecast to experience consistent growth over the next five years. In terms of technological trends, demand for industry services will primarily be driven by mainstream adoption of third-platform services, which encompasses cloud-based computing, big data analytics and mobile-based solutions. In terms of economic factors, industry revenue will be driven by continued growth in corporate profit, which is expected to boost private investment in computers and software, as well as increasing demand from the finance and insurance industry. Overall, the industry is projected to grow at an annualized 2.7% to $442.4 billion over the five years to 2021. Copyright © 1999-2016 IBISWorld

Impact Greater Fayetteville
149
Advanced Manufacturing
Cluster Definition (NAICS Codes) 32518 Inorganic Chemical Manufacturing 32519 Organic Chemical Manufacturing 33231 Structural Metal Product Manufacturing 33271 Machine Shop Services 33272 Screw, Nut, and Bolt Manufacturing 33512 Lighting Fixtures Manufacturing 33531 Electrical Equipment Manufacturing 33632 Automobile Electronics Manufacturing 33635 Automobile Transmission Manufacturing
Table 40c: Industry Vitals-Advanced Manufacturing
Targeting Recommendations The following avenues are recommendations, as targeting strategies, for Advanced Manufacturing:
National, ongoing lead generation program Trade show marketing in conjunction with regional or state partners for an opportunity to meet
with companies, as well as network within the industry Email marketing and awareness campaigns to surrounding communities and states to create
awareness of specific opportunities, within Fayetteville such as industry park developments, available sites, and incentives
Initial target lists can be built from online resources such as Hoovers, Avention, InfoUSA, and industry associations. As lists are built, we search for companies fitting the target using industry codes and business descriptions. The company research process evaluates each company, as well as its fit with Fayetteville assets, benefits, and culture. Selected industry associations relevant to this target include:
National Electrical Manufacturers Association – www.nema.org Society of Chemical Manufacturers and Affiliates – www.socma.com Specialty and Agro Chemicals America – www.chemicalsamerica.com Precision Metalforming Association – www.pma.org Electronic Components Industry Association – www.ecianow.org Original Equipment Suppliers Association – www.oesa.org

Impact Greater Fayetteville
150
Segment Summaries 32518 Inorganic Chemical Manufacturing DEFINITION This industry produces inorganic chemicals including titanium dioxide, chloralkali products, and carbon black. Inorganic chemicals are mineral based, while organic chemicals are carbon based (see 32519 Organic Chemical Manufacturing). Inorganic chemicals are mainly used as inputs in manufacturing and industrial processes. Inorganic chemicals are used as pigments and dyes (32513) or pesticides (32532) are not included in this industry. KEY EXTERNAL DRIVERS Industrial production index Housing starts Price of electric power Trade-weighted index KEY SUCCESS FACTORS
Having contracts that are favorable to the purchaser
Economies of scale Access to the latest available and most
efficient technology and techniques Establish relationships with downstream
industries Must comply with government
regulationsOUTLOOK Over the five years to 2021, IBISWorld expects the Inorganic Chemical Manufacturing industry to slowly expand, as downstream industries grow. As the housing sector improves, demand from the construction, paint, and glass manufacturing sectors will drive sales growth. The American Chemistry Council estimates that the chemical business impacts more than 96% of all goods manufactured in the United States, so moderate industrial production will fuel demand for industry products. Consequently, in the five years to 2021, IBISWorld expects industry revenue to grow an annualized 2.1% to $39.2 billion, beginning with a 2.2% growth in revenue in 2017. 32519 Organic Chemical Manufacturing DEFINITION This industry manufactures basic organic chemicals (other than petrochemicals), industrial gases and synthetic dyes and pigments. Key product groups include gum and wood products, cyclic crudes and intermediates, ethyl alcohol and other basic organic chemicals. These products are predominantly intermediates that are used as raw material inputs by other manufacturing industries in the production of downstream products. KEY EXTERNAL DRIVERS Industrial production index Trade-weighted index World price of crude oil Consumer spending Value of construction
KEY SUCCESS FACTORS Comply with government regulations Ability to accommodate environmental
requirements Having contracts that are favorable to
purchaser Having a diverse range of clients Degree of globalization in the firm
OUTLOOK Over the five years to 2021, revenue for the Organic Chemical Manufacturing industry is expected to grow at an average annual rate of 3.2% to $171.6 billion. The industry will experience a rise in demand as key buying markets (e.g. cosmetic and beauty products

Impact Greater Fayetteville
151
manufacturing and rubber manufacturing) increase purchases. As disposable income grows, rising consumer demand for beauty products will underpin this trend. Additionally, exports will rise as steady economic growth in developing nations propels demand for consumer and construction-related goods which use organic chemicals produced by this industry. However, raw material price volatility and government legislation in the form of security, environmental, safety, and health regulations will pose threats to future performance. 33231 Structural Metal Products Manufacturing DEFINITION Operators in this industry manufacture structural metal products such as reinforcing bars, bar joists, railway bridge sections, dam gates, transmission tower sections, and railroad car racks. They also manufacture metal plate work such as bins, culverts, hoods, ladles, and containment vessels, as well as prefabricated metal buildings. Most industry products are used in nonresidential building and utility construction. KEY EXTERNAL DRIVERS Value of private nonresidential
construction World price of steel Government funding for highways Value of utilities construction Trade-weighted index
KEY SUCCESS FACTORS Availability of resources Ability to vary services to suit different
needs Having a diverse range of clients Economies of scale Proximity to key markets
OUTLOOK The Structural Metal Product Manufacturing industry is expected to improve over the five years to 2021, propelled by steady nonresidential construction and recovering steel prices. In turn, revenue is estimated to increase at an annualized rate of 3.6% over the period to $53.6 billion, beginning with an estimated 3.3% increase in 2017. Still, as domestic demand picks up, the industry is likely to experience rising competition from Chinese manufacturers who will continue to be the largest steel producers in the world due to highly cost-efficient production. Import competition will propel continual innovation and restructuring within the industry, including increased attention to cost efficiency and vertical integration. 33271 Machine Shop Services DEFINITION The Machine Shop Services industry cuts raw materials into specified shapes and sizes using a variety of tools, such as lathes, milling machines, grinders, and drill presses. Almost all forms of metal product fabrication involve machining, and industry operators may also machine plastic and composite materials. KEY EXTERNAL DRIVERS Industrial production index Demand from metal stamping and
forging Demand from car and automobile
manufacturing
Demand from machinery manufacturing Aggregate private investment World price of steel Federal funding for defense
KEY SUCCESS FACTORS
Impact Greater Fayetteville
152
Ability to quickly adopt new technology Effective quality control Access to multiskilled and flexible
workforce
Ability to vary services to suit different needs
OUTLOOK In the five years to 2021, the Machine Shop Services industry is expected to build on its recent growth due to the continued expansion of most of its major downstream markets. Except for defense spending, indicators of downstream demand are forecast to improve over the next five years. Thus, industry revenue is expected to grow at an annualized rate of 1.6% to $44.7 billion over the five years to 2021. 33272 Screw, Nut, and Bolt Manufacturing DEFINITION This industry manufactures metal fastening products that can be divided into two groups. Precision fastening products are custom made for a particular project or customer. Alternatively, metal bolt, nut, screw, rivet, washer, and industrial fastening products are fabricated to an industry standard and are designed for the wider market. This industry does not manufacture plastic fastening products. KEY EXTERNAL DRIVERS Industrial production index Value of construction World price of steel Trade-weighted index
KEY SUCCESS FACTORS Having a diverse range of clients Having links with suppliers Effective cost controls Development of new products Degree of globalization in the firm Effective quality control
OUTLOOK The Screw, Nut, and Bolt Manufacturing industry has been growing due to the resurgence of key manufacturing and construction industries. In the five years to 2021, growth will continue to be heavily driven by an increase in aircraft and automotive demand and foreign demand for precision products. The shift to precision products will also keep profit healthy despite rising imports and increasing saturation of the domestic and global market for fasteners. IBISWorld expects industry revenue to grow an annualized 2.8% during the period to $32.9 billion, beginning with 5.0% growth in 2017 due to recovering steel input prices. 33512 Lighting Fixtures Manufacturing DEFINITION This industry manufactures electric lighting fixtures, nonelectric lighting equipment, lighting fixture components and lampshades made of metal, paper or textiles. The industry excludes establishments that manufacture light bulbs and tubes, glass lighting fixtures, vehicular lighting equipment, current-carrying wiring devices, and lampshades made of plastic. KEY EXTERNAL DRIVERS Value of private nonresidential
construction Housing starts Government funding for highways
Import penetration into the manufacturing sector
Per capita disposable income Trade-weighted index

Impact Greater Fayetteville
153
KEY SUCCESS FACTORS Having links with suppliers Access to niche markets Production of goods currently favored
by the market
Production of premium goods/services Economies of scale Having a wide and expanding product
range
OUTLOOK The world is in the midst of a “green” transition, in which consumers are increasingly seeking more energy-efficient items to reduce their environmental impact and save money. In response to consumer interest, operators will continue to refine existing lighting fixture designs, while also developing new technologies to accommodate demand for more environmentally friendly products. In the past, the transition to energy-efficient products has been led by strong demand for LED fixtures, driven by governmental regulation to eliminate incandescent light bulb manufacturing. The switch to LED and other energy-efficient products is expected to continue in the next five years to 2021, driving growth in the industry by annualized rate of 0.6% to $11.9 billion in 2021. According to a McKinsey study entitled “Lighting the Way: Perspectives on the global lighting market, by 2020,” LED products are expected to account for 70% of the global market. As energy efficiency and cost savings continues to spur demand for LEDs and the market becomes saturated, revenue growth is expected to slow. To maintain revenue, companies must develop new energy-efficient technology to continue to drive demand and differentiate their products from low-cost imports. 33531 Electrical Equipment Manufacturing DEFINITION This industry manufactures power, distribution, and specialty transformers; electric motors, generators and motor-generator sets; switchgear and switchboard apparatus; relays; and industrial controls. Electrical equipment manufacturers sell their products to other manufacturing industries, wholesalers, and the construction sector. KEY EXTERNAL DRIVERS Demand from manufacturing Industrial production index Demand from building, developing and
general contracting Electric power consumption
KEY SUCCESS FACTORS Business expertise of operators Adoption of latest available and most
efficient technology and techniques Access to high quality control Economies of scale
OUTLOOK Greater demand for energy-efficient electrical equipment will drive the Electrical Equipment Manufacturing industry forward over the five years to 2021, albeit slowly. Expected upgrades in electrical infrastructure will also stimulate demand for industry products over the period. As a result, revenue is projected to modestly rise at an average annual rate of 0.7% to $41.3 billion over the next five years, including a 0.5% increase in 2017. Industry growth will continue to be constrained by high import penetration, which will be further encouraged by the appreciation of the U.S. dollar. 33632 Automobile Electronics Manufacturing

Impact Greater Fayetteville
154
DEFINITION This industry manufactures motor vehicle parts that have or operate with the aid of small components that control and direct an electric current. Industry operators include manufacturers of lighting systems, electrical wiring, electrical control units, sensors, electronic ignition systems, and driver displays. Manufacturers of electric motors are excluded. KEY EXTERNAL DRIVERS Demand from car and automobile
manufacturing New car sales World price of crude oil Consumer Confidence Index National unemployment rate Trade-weighted index
KEY SUCCESS FACTORS Access of the latest available and most
efficient technology and techniques Effective cost controls Undertaking technical research and
development Degree of globalization Ability to control stock on hand
OUTLOOK The Automobile Electronics Manufacturing industry is expected to recede from its previously strong growth over the five years to 2021. While industry revenue is projected to continue to be strong, several factors are anticipated to facilitate a minor decline. The unemployment rate is expected to grow slightly, as it has been hovering near its lower rate. This, in combination with prolonged slow economic growth, is expected to cause consumer confidence to decline. Consumers are far more likely to buy a vehicle that contains substantial automobile electronics when they are employed and have a positive outlook for future income. The amount of new car sales is forecast to decline an annualized 1.3% over the period, limiting demand from automakers for industry parts. Conversely, the industry will be supported by an increase in revenue per new car as vehicles are manufactured with a larger portion of electronic parts. As a result, industry revenue is anticipated to decline at an annualized rate of 0.7% to $26.7 billion over the five years to 2021. 33635 Automobile Transmission Manufacturing DEFINITION Companies in this industry manufacture transmissions for motor vehicles (cars and light, medium and heavy-duty trucks), parts for transmissions, and powertrain parts. Industry products include clutches, gears, differentials and axle bearings. KEY EXTERNAL DRIVERS Demand from car and automobile
manufacturing Trade-weighted index Consumer Confidence Index Regulation for the automotive sector World price of crude oil Yield on 10-year treasury note
KEY SUCCESS FACTORS Access of the latest available and most
efficient technology and techniques Ability to accommodate environmental
requirements Effective cost controls Undertaking technical research and
development Degree of globalization of the firm

Impact Greater Fayetteville
155
OUTLOOK Over the five years to 2021, the Automobile Transmission Manufacturing industry’s performance is expected to mirror that of the automotive industry at large. Due to the near one-to-one ratio of transmissions to automobiles, slower growth of car, truck, and special purpose vehicle production is expected to have a similar effect on transmission and powertrain part manufacturers. As a result, IBISWorld estimates industry revenue will increase at an annualized rate of 2.3% to $46.4 billion in the five years to 2021. Copyright © 1999-2016 IBISWorld
Business Services
Cluster Definition (NAICS Codes) 51121 Software Publishing 51821 Data Processing and Hosting Services 51913 Search Engines 51913 Internet Publishing and Broadcasting 52221 Credit Card Issuing 52222 Auto Leasing, Loans and Sales Financing 52232 Credit Card Processing and Money Transferring 52239 Loan Administration, Check Cashing, and Other Services 52312 Securities Brokering 52392 Portfolio Management 52393 Financial Planning and Advice 52411 Life Insurance and Annuities 52411 Health and Medical Insurance 52412 Property, Casualty and Direct Insurance 52413 Reinsurance Carriers 52429 Third-Party Administrators and Insurance Claims Adjusters 54121 Payroll and Bookkeeping Services 54121 Accounting Services 54161 Management Consulting 56145 Credit Bureaus and Rating Agencies

Impact Greater Fayetteville
156
Table 40d: Industry Vitals-Business Services
Targeting Recommendations The following avenues are recommendations, as targeting strategies, for Business Services:
Email marketing and awareness campaigns to surrounding communities and states in order to create awareness of specific opportunities within Fayetteville such as office park developments, available buildings, and incentives
National, ongoing lead generation program Entrepreneurial development and encouraging business start-ups
Initial target lists can be built from online resources such as Hoovers, Avention, InfoUSA, and industry associations. As lists are built, we search for companies fitting the target using industry codes and business descriptions. The company research process evaluates each company, as well as, their fit with Fayetteville assets, benefits and culture. Selected industry associations relevant to this target include:
comScore – www.comscore.com The Shared Services and Outsourcing Network – www.ssonetwork.com The Software & Information Industry Association - www.siia.net Securities Industry and Financial Markets Association – www.sifma.org American Council of Life Insurers – www.acli.com Insurance Information Institute – www.iii.org
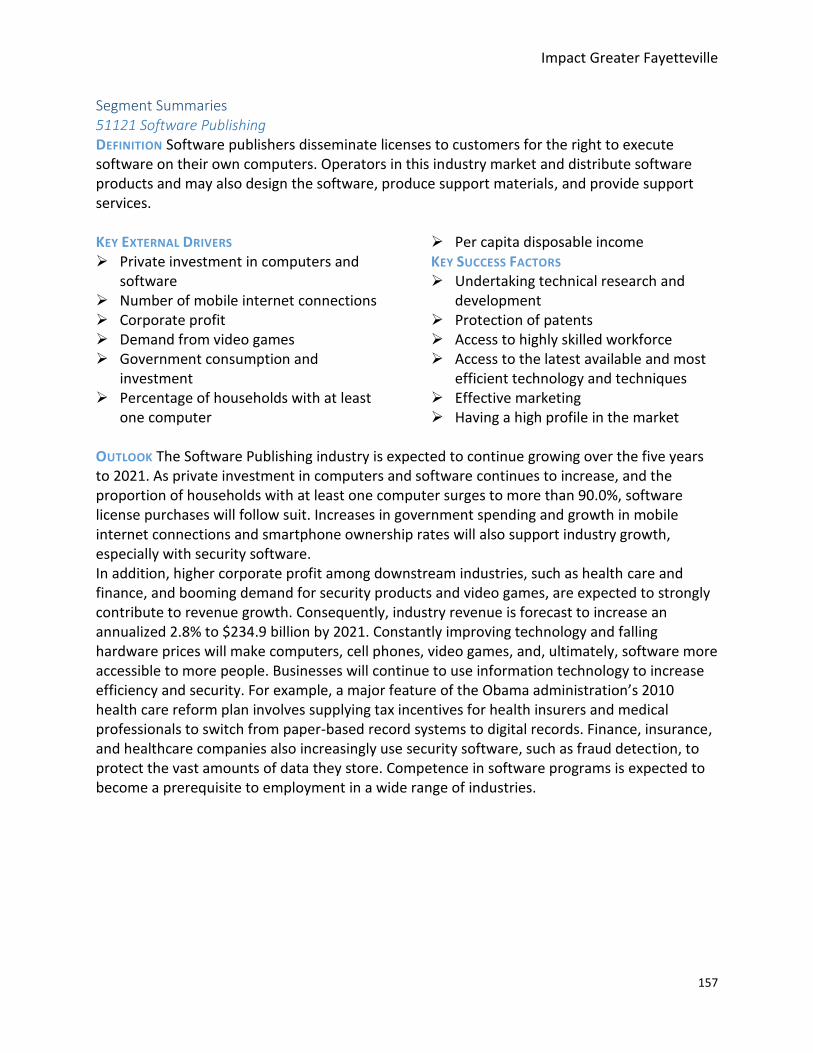
Impact Greater Fayetteville
157
Segment Summaries 51121 Software Publishing DEFINITION Software publishers disseminate licenses to customers for the right to execute software on their own computers. Operators in this industry market and distribute software products and may also design the software, produce support materials, and provide support services. KEY EXTERNAL DRIVERS Private investment in computers and
software Number of mobile internet connections Corporate profit Demand from video games Government consumption and
investment Percentage of households with at least
one computer
Per capita disposable income KEY SUCCESS FACTORS Undertaking technical research and
development Protection of patents Access to highly skilled workforce Access to the latest available and most
efficient technology and techniques Effective marketing Having a high profile in the market
OUTLOOK The Software Publishing industry is expected to continue growing over the five years to 2021. As private investment in computers and software continues to increase, and the proportion of households with at least one computer surges to more than 90.0%, software license purchases will follow suit. Increases in government spending and growth in mobile internet connections and smartphone ownership rates will also support industry growth, especially with security software. In addition, higher corporate profit among downstream industries, such as health care and finance, and booming demand for security products and video games, are expected to strongly contribute to revenue growth. Consequently, industry revenue is forecast to increase an annualized 2.8% to $234.9 billion by 2021. Constantly improving technology and falling hardware prices will make computers, cell phones, video games, and, ultimately, software more accessible to more people. Businesses will continue to use information technology to increase efficiency and security. For example, a major feature of the Obama administration’s 2010 health care reform plan involves supplying tax incentives for health insurers and medical professionals to switch from paper-based record systems to digital records. Finance, insurance, and healthcare companies also increasingly use security software, such as fraud detection, to protect the vast amounts of data they store. Competence in software programs is expected to become a prerequisite to employment in a wide range of industries.

Impact Greater Fayetteville
158
51821 Data Processing and Hosting Services DEFINITION This industry provides data processing or hosting activities. Data processing services provide specialized reports from information supplied by clients. Hosting services can include web and application hosting. Services range from automated data entry to processing data. KEY EXTERNAL DRIVERS Number of mobile internet connections Percentage of services conducted online Demand from internet publishing and
broadcasting Corporate profit Price of computers and peripheral
equipment Private investment in computers and
software
KEY SUCCESS FACTORS Effective quality control Having a cost-effective distribution
system Ability to quickly adopt new technology Ability to manage external (outsourcing)
contracts Access to multiskilled and flexible
workforce Ensuring pricing policy is appropriate
OUTLOOK Over the five years to 2021, the Data Processing and Hosting Services industry is expected to experience strong growth attributed to non-industry companies’ continued outsourcing of information technology (IT) to third parties. Efforts to improve operational efficiencies, coupled with the rising costs of handing IT internally, will drive outsourcing by large companies. Moreover, the continued shift to online services will drive additional demand for industry services. As a result, IBISWorld expects industry revenue to grow at an annualized rate of 4.8% to $182.3 billion over the five years to 2021, including an increase of 4.4% in 2017 alone. 51913 Search Engines DEFINITION This industry includes enterprises that operate search engines and other types of search-based websites that display advertisements. These search engines typically provide search services for free and earn income when a user clicks on an advertising link, known as a "paid click." Websites may attract users to their search engines by offering a range of additional free services, such as e-mail, news, social networking, entertainment and other information.

Impact Greater Fayetteville
159
KEY EXTERNAL DRIVERS Number of mobile internet connections Consumer spending Percentage of services conducted online Total advertising expenditure Demand from internet publishing and
broadcasting
KEY SUCCESS FACTORS Quick adoption of new technology Strong branding A highly skilled workforce Economies of scale Effective quality control
OUTLOOK As the number of mobile internet connections and the percentage of services conducted online continue to increase, the amount of advertising money spent in the Search Engines industry is expected to rise accordingly. The increasing prominence of internet advertising will also contribute to this aggressive shift in advertising expenditure to search engine marketing. However, the extremely high growth in the mobile segment is expected to slow, consumer confidence is anticipated to drop, and corporate profit growth will decelerate, which will ultimately slow growth. Industry revenue is thus expected to increase an annualized 8.0% over the five-year period, reaching $79.0 billion in 2021. Large search engines that grow their user bases and continually improve their advertising technology will capture most of this growth. Moreover, Google, Yahoo, and Microsoft, the industry’s dominant players, will aggressively compete for users and advertisers in both the PC and mobile search markets. 51913 Internet Publishing and Broadcasting DEFINITION This industry includes organizations and individuals that offer non-physical products such as news, music, and video, exclusively through the internet. Revenue in this industry is derived from the sale of advertising space or subscriptions to consumers. In addition, companies may derive revenue from intellectual property licensing and the sale of user information to third parties. This industry does not include search engines, internet service providers, or publishers of offline content. KEY EXTERNAL DRIVERS Number of mobile internet connections Total advertising expenditure Demand from search engines Demand from television broadcasting Internet traffic volume
KEY SUCCESS FACTORS Developing a clear niche Word of mouth recommendations Attracting advertisers Protection of intellectual
property/copyrighting of output Access to highly skilled workforce
OUTLOOK Over the five years to 2021, the Internet Publishing and Broadcasting industry is projected to grow rapidly as advertisers continue to shift resources toward internet and mobile platforms. This expected growth is largely a result of the continued influx of mobile internet connections that are expected in the United States over the five-year period, and strong increases in internet traffic volume. Advertisers are expected to continue aggressively targeting internet users through social media and other content sites and applications. The internet content publishers that will benefit the most from this increased advertising expenditure are the industry’s well-established major players and smaller players that develop specialized

Impact Greater Fayetteville
160
mobile applications or publish original content that pertains to a niche market. Growth in online streaming platforms, such as Netflix and Hulu, will boost revenue further. Over the five years to 2021, industry revenue is anticipated to increase at an annualized rate of 9.3% to $141.0 billion, with a 9.1% increase in 2017 alone. 52221 Credit Card Issuing DEFINITION This industry issues credit cards, providing the funds required to buy goods and services in return for payment on a full balance or installment basis. Credit cards issued in the United States are not issued directly by Visa, MasterCard, or any other payment-solution organization. Rather, Visa, MasterCard, and other similar corporations provide the actual payment systems used when payments are made by credit card. KEY EXTERNAL DRIVERS Aggregate household debt National unemployment rate Prime rate Households earning more than
$100,000 Per capita disposable income
KEY SUCCESS FACTORS Access to the latest available and most
efficient technology and techniques Having an extensive
distribution/collection network Effective cost controls Production of goods currently favored
by the market Marketing of differentiated products Market research and understanding
OUTLOOK An improving economy, increased e-commerce and security, and higher interest rates will help spur revenue growth for the Credit Card Issuing industry in the coming five years. In the five years to 2021, industry revenue is projected to grow an annualized 4.5% to $116.5 billion, including anticipated growth of 6.6% in 2017. E-commerce is expected to increase at an annualized rate of 10.6% over the next five years, which will further exacerbate the shift away from cash and checks towards credit card issuers. Additionally, the level of aggregate household debt is forecast to rise an annualized 4.3%, spurring higher interest income from outstanding debts. Profitability within the industry is also anticipated to increase as interest rates continue to rise, allowing companies to earn higher interest on credit issuance. Furthermore, costs associated with establishing data security should taper as operators become increasingly capable to adjust to cyber threats. As a result, the industry profit margin is forecast to increase from 25.0% in 2016 to 29.1% in 2021. 52222 Auto Leasing, Loans, and Sales Financing DEFINITION This industry includes establishments that provide sales financing or sales financing in combination with leasing. Sales financing establishments are primarily engaged in lending money for the purpose of providing collateralized goods through a contractual-installment sales agreement, either directly from or through arrangements with dealers. Industry participants generate revenue through the interest and fees that are included in the installment payments of borrowers. KEY EXTERNAL DRIVERS Consumer Confidence Index
Yield on 10-year Treasury note Corporate profit National unemployment rate

Impact Greater Fayetteville
161
Per capita disposable income Price of new cars KEY SUCCESS FACTORS Output is sold under contract –
incorporate long-term sales contracts
Well-developed internal processes Financial position of the company Ability to raise revenue from additional
sources Ability to carry out credit checks on
clients Access to highly skilled workforce
OUTLOOK The Auto Leasing, Loans, and Sales Financing industry entered a turnaround phase in the latter half of 2012, which is expected to continue over the five years to 2021. Higher consumer confidence and disposable income will drive the anticipated recovery. Consequently, industry revenue is forecast to grow at an annualized rate of 3.3% to reach $125.4 billion over the next five years, including projected growth of 5.1% in 2017. Automobile and machinery sales are expected to rebound during the period, but persistent unemployment may hinder recovery. Rising income levels and low interest rates will encourage individuals and companies to purchase automobiles as their current vehicles age. Businesses will also be more likely to replace older machinery and equipment, thereby increasing the volume of loans and leases. An increase in customer consumption and an improving economy will raise the likelihood of borrowers making monthly payments and is expected to provide a boost to the industry’s profit margins. 52232 Credit Card Processing and Money Transferring DEFINITION This industry offers financial transaction processing, reserve and liquidity services and check or other financial instrument clearinghouse services. The industry excludes electronic transactions associated with the U.S. Federal Reserve (central bank). KEY EXTERNAL DRIVERS Consumer spending Consumer Confidence Index E-commerce sales Per capita disposable income Regulation for the credit card processing
and money transferring industry
KEY SUCCESS FACTORS Access to the latest and most efficient
technology and techniques Low operating costs Use of specialist equipment or facilities Ability to effectively change community
behavior Economies of scale Comply with government regulations
OUTLOOK Consumers will continue to bypass cash and perform transactions using credit cards or other electronic means, leading to higher transaction volumes for the Credit Card Processing and Money Transferring industry. IBISWorld anticipates revenue for the Credit Card Processing and Money Transferring industry to grow at an annualized rate of 3.7% to $93.5 billion in the five years to 2021. Over this period, the growing popularity of electronic payment methods, due to the growing online retail and e-commerce market, will drive industry growth. Consumer spending will rise as a result of easily accessible payment methods and markets, increasing

Impact Greater Fayetteville
162
transaction volumes. The industry's client base will continue to grow as more merchants rely on credit cards and other electronic methods for payment from customers. As a result, growth will continue steadily through 2016 and is expected to increase 4% in 2017. In addition, continued declines in paper check use and cash transactions are anticipated to support industry growth. Most transactions are now conducted electronically, with 59% of all transactions made with a credit or debit card, and only 15% made with checks, according to a 2013 Federal Reserve study on payment trends in the United States. Check activity is projected to steadily decline as consumers and businesses increasingly prefer electronic payment methods for their speed and flexibility. 52239 Loan Administration, Check Cashing, and Other Services DEFINITION The Loan Administration, Check Cashing, and Other Services industry services loans, most notably mortgages. This industry does not originate loans, which includes legally arranging and issuing the loan. Servicing loans includes performing all of the administrative aspects of managing a debt portfolio. Operators also perform money transmission services, which include selling and cashing traveler’s checks, money orders, and cashier’s checks, as well as renting safe-deposit boxes. KEY EXTERNAL DRIVERS Demand from real estate loans and
collateralized debt House price index Prime rate Consumer Confidence Index Housing starts
KEY SUCCESS FACTORS Experienced work force Having links with suppliers Ability to effectively manage risk Well-developed internal processes Ability to constantly blend new
technology with services OUTLOOK The Loan Administration, Check Cashing, and Other Services industry is forecast to expand at a steady pace over the next five years as a result of new loan activity, which had been severely hurt by the subprime fallout and the subsequent decline in home prices. Rising home prices will lead to renewed demand for mortgages as consumers’ trust in real estate investments renews. The rise in demand will increase operators’ ability to acquire mortgage-servicing rights and the associated fees. IBISWorld estimates home prices will increase at an annualized rate of 2.5% over the five years to 2021. In light of these conditions, industry revenue is forecast to grow at an annualized rate of 3.8% to $134.5 billion in the five years to 2021. Rising consumer sentiment, which measures consumers’ level of optimism about their own financial situation and the economy, will encourage spending on big-ticket items that require loans (e.g. home mortgages) and drive industry revenue. Increased demand from loan servicing and the benefit of technological integration is also expected to improve margins for operators in this industry. A decline in delinquencies and a rise in the prime rate will increase the fees the industry generates. IBISWorld expects profit to increase from 16.4% of revenue in 2016 to 17.5% in 2021. Nonetheless, as industry participants take advantage of technological advancements that improve the automation of their processes, especially within the check cashing segment of this industry, new regulatory compliance costs
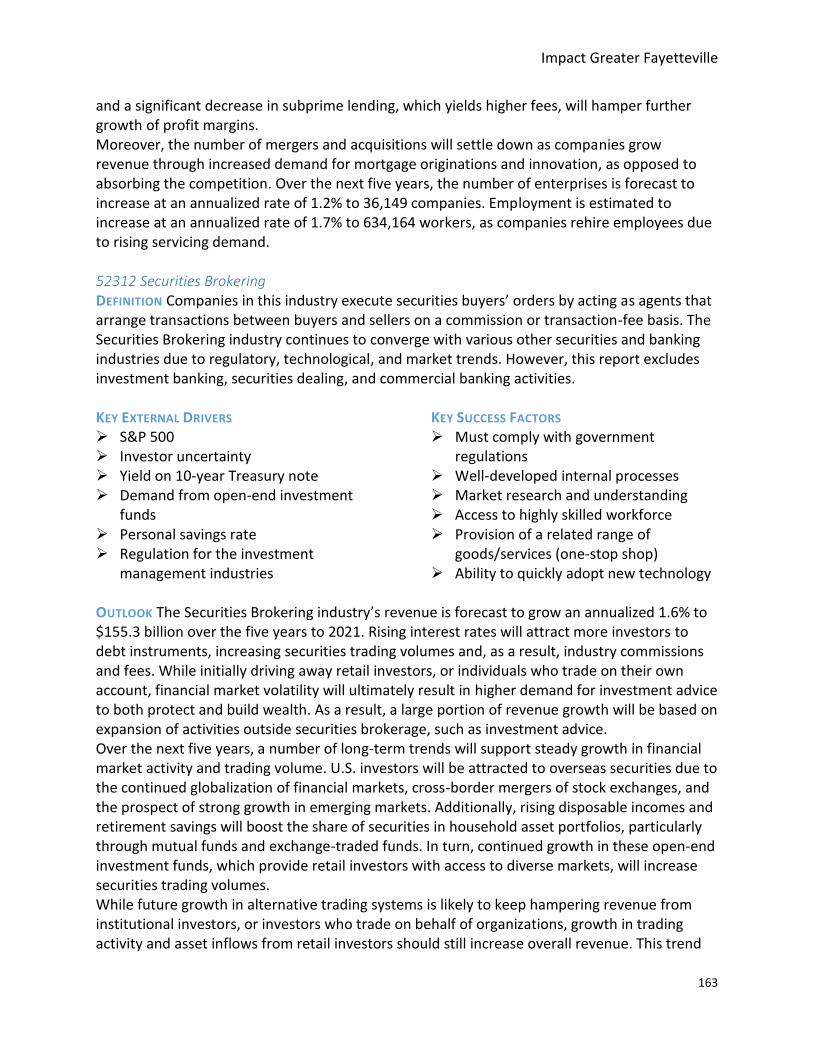
Impact Greater Fayetteville
163
and a significant decrease in subprime lending, which yields higher fees, will hamper further growth of profit margins. Moreover, the number of mergers and acquisitions will settle down as companies grow revenue through increased demand for mortgage originations and innovation, as opposed to absorbing the competition. Over the next five years, the number of enterprises is forecast to increase at an annualized rate of 1.2% to 36,149 companies. Employment is estimated to increase at an annualized rate of 1.7% to 634,164 workers, as companies rehire employees due to rising servicing demand. 52312 Securities Brokering DEFINITION Companies in this industry execute securities buyers’ orders by acting as agents that arrange transactions between buyers and sellers on a commission or transaction-fee basis. The Securities Brokering industry continues to converge with various other securities and banking industries due to regulatory, technological, and market trends. However, this report excludes investment banking, securities dealing, and commercial banking activities. KEY EXTERNAL DRIVERS S&P 500 Investor uncertainty Yield on 10-year Treasury note Demand from open-end investment
funds Personal savings rate Regulation for the investment
management industries
KEY SUCCESS FACTORS Must comply with government
regulations Well-developed internal processes Market research and understanding Access to highly skilled workforce Provision of a related range of
goods/services (one-stop shop) Ability to quickly adopt new technology
OUTLOOK The Securities Brokering industry’s revenue is forecast to grow an annualized 1.6% to $155.3 billion over the five years to 2021. Rising interest rates will attract more investors to debt instruments, increasing securities trading volumes and, as a result, industry commissions and fees. While initially driving away retail investors, or individuals who trade on their own account, financial market volatility will ultimately result in higher demand for investment advice to both protect and build wealth. As a result, a large portion of revenue growth will be based on expansion of activities outside securities brokerage, such as investment advice. Over the next five years, a number of long-term trends will support steady growth in financial market activity and trading volume. U.S. investors will be attracted to overseas securities due to the continued globalization of financial markets, cross-border mergers of stock exchanges, and the prospect of strong growth in emerging markets. Additionally, rising disposable incomes and retirement savings will boost the share of securities in household asset portfolios, particularly through mutual funds and exchange-traded funds. In turn, continued growth in these open-end investment funds, which provide retail investors with access to diverse markets, will increase securities trading volumes. While future growth in alternative trading systems is likely to keep hampering revenue from institutional investors, or investors who trade on behalf of organizations, growth in trading activity and asset inflows from retail investors should still increase overall revenue. This trend

Impact Greater Fayetteville
164
will likely decrease institutional trade volume as a share of brokerage revenue through 2021, as technology drives brokerage trading fees down and enables institutions to engage in direct trading with each other, eliminating the need for securities brokers as intermediaries. Trade commission revenue will also likely bottom out. 52392 Portfolio Management DEFINITION The industry comprises firms that actively manage assets for clients. Portfolio managers have the authority to make investment decisions and generate revenue through fees that are based on service and portfolio performance. Industry operators manage assets for investment vehicles such as mutual funds, hedge funds and variable insurance products. KEY EXTERNAL DRIVERS S&P 500 Per capita disposable income Yield on 10-year Treasury note External competition for the portfolio
management industry KEY SUCCESS FACTORS
Having an extensive distribution/collection network
Highly trained workforce Having a high prior success rate Having a good reputation Ability to adapt technology
infrastructure to meet new compliance and reporting requirements
Ability to offer new products and services to meet changing customer tastes
OUTLOOK Over the five years to 2021, the performance of the Portfolio Management industry is anticipated to benefit from a number of long-term, structural trends. The aging of the domestic population is assisting the growth of mutual funds, pension funds, and other collective investment schemes. As a growing number of individuals approach retirement age, the value of assets in pension plans and other forms of retirement savings is anticipated to increase. Additionally, interest rates, which have been effectively held down to the zero lower bound by the Federal Reserve since late 2008, are anticipated to increase in mid-2015, causing the value of industry assets under management (AUM) to increase over time. Moreover, the technology-driven globalization of the industry will also enable portfolio managers to continue diversifying into emerging markets. Moderate growth anticipated in both the S&P 500 and the MSCI World index will underpin improvements in portfolio performance across actively managed funds, drawing in a significant number of investors. These inflows, combined with rising bond yields, are forecast to cause industry revenue to rise at an annualized rate of 2.3% over the five years to 2021 to $281.2 billion, which includes expected growth of 2.6% in 2017. 52393 Financial Planning and Advice DEFINITION This industry comprises companies that provide financial planning, financial advice, and wealth management to individuals and business clients. Operators also offer advice, in conjunction with other activities such as portfolio management, protection planning, and brokerage services. This industry does not include mutual fund companies, hedge funds,

Impact Greater Fayetteville
165
discount brokers, insurance brokers, or other companies that deliver these services, outside the context of a written financial plan. KEY EXTERNAL DRIVERS Per capita disposable income S&P 500 Investor uncertainty Median age of population Households earning more than
$100,000 Regulation for the investment
management industries
KEY SUCCESS FACTORS Having a loyal customer base Have a good reputation Experienced work force Market research and understanding
OUTLOOK Over the five years to 2021, increased market valuations for various types of assets and securities are expected to push industry revenue growth at an annualized rate of 3.0% to $56.2 billion. As the economy continues to recover, the number of wealthy households and institutions needing financial management services will also increase, raising the value of assets under management (AUM) for firms. The majority of this growth is expected to go to existing firms, rather than the limited number of new operators breaking into the industry. In 2017, total industry revenue is estimated to rise 3.9%. Rising interest rates, geopolitical tension and inflation over the next year are anticipated to encourage consumers to consult professional services for managing their finances and protecting their assets. 52411 Life Insurance and Annuities DEFINITION Operators within this industry are primarily engaged in accepting liability under annuities and life, disability income, and accidental death and dismemberment insurance policies. Enterprises within this industry include fraternal organizations, privately held insurers, publicly traded insurers, and mutual insurance companies. KEY EXTERNAL DRIVERS Median age of population Per capita disposable income Number of employees Yield on 10-year Treasury note S&P 500
KEY SUCCESS FACTORS Financial strength Must comply with government
regulations Effective asset management Having an extensive distribution
network Effective cost controls
OUTLOOK Growth in household wealth and an aging domestic population are anticipated to boost demand levels for the Life Insurance and Annuities industry over the five years to 2021. Downstream consumers are expected to increasingly use life insurance and annuity products for asset protection and retirement purposes over the five-year period. Additionally, as the outlook for sustainable social welfare programs is anything but certain, households are expected to share a larger burden of their retirement and estate planning needs, benefiting

Impact Greater Fayetteville
166
industry demand. Furthermore, as the economy improves, investment income for industry operators is forecast to rise due to improvements in equity markets and interest rate increases. As a result of these trends, industry revenue is forecast to increase at an annualized rate of 2.3% to $989.5 billion over the five years to 2021, with an anticipated 2.8% increase in 2017 alone. Profitability is expected to improve over the five-year period, as the Federal Reserve’s latest aim is to increase interest rates to 2.4% by 2018. Due to these rising interest rates, industry operators will generate higher returns on fixed income, boosting investment income. Furthermore, insurers are anticipated to benefit from a decline in delinquency rates and lower asset write-downs on mortgage and other debt-related securities. This trend is important because many life insurers built up a large portfolio of mortgage-backed securities and other collateralized debt obligations during the housing boom and have been slow to divest these products. By 2021, the average industry profit margin is forecast to reach 7.1%. 52411 Health and Medical Insurance DEFINITION This industry underwrites (i.e. assumes the risks of and assigns premiums for) health and medical insurance policies. Insurance is the transfer of the risk of a loss in exchange for payment. Operators also provide administrative services for self-funded insurance plans (whereby an employer provides health benefits to workers with its own funds). Under this structure, the industry operator is a third-party administrator and is not responsible for health benefit payments. KEY EXTERNAL DRIVERS Total health expenditure Number of employees Median age of population Number of physician visits Per capita disposable income
KEY SUCCESS FACTORS Having an extensive
distribution/collection network Having a good reputation Ability to pass on cost increases Must comply with government
regulations Effective cost controls Ability to raise revenue from additional
sourcesOUTLOOK Medical cost inflation and increased demand for medical insurance will dictate performance for the Health and Medical Insurance industry over the five years to 2021. Industry revenue will remain highly correlated with total health expenditure, which is expected to continue to trend upward from 2016 to 2021. However, the industry’s average profit margin is forecast to decline from 3.9% of revenue in 2016 to 3.6% in 2021, due to increased compliance costs caused by health care reform. Despite constrained profitability, revenue is projected to increase at an annualized 2.1% over the period, reaching $860.8 billion, largely due to increased demand caused by the same legislation. 52412 Property, Casualty, and Direct Insurance DEFINITION Operators in this industry are primarily engaged in underwriting insurance policies that protect individuals, businesses, and agencies against losses that occur as a result of property damage, liability, or other risks. Industry participants also protect real estate owners

Impact Greater Fayetteville
or creditors against losses sustained because of any title defect to real property. This industry does not include insurance coverage for life, disability, accidental death, dismemberment or health risks. KEY EXTERNAL DRIVERS Number of motor vehicle registrations Homeownership rate Natural disaster index Yield on 10-year Treasury note Regulation for the property, casualty,
and direct insurance industry S&P 500
KEY SUCCESS FACTORS Ability to effectively manage risk Offer a range of insurance products Management of a high quality assets
portfolio Disciplined underwriting processes Having a cost effective distribution
system Possession of accurate information
OUTLOOK The Property, Casualty, and Direct Insurance industry is expected to keep pace with the overall economy over the five years to 2021, due to the resurgence in automotive sales, recovery in housing, and rise in investment income. Generally, industry growth does not fluctuate dramatically with economic activity because insurance is not a discretionary purchase. However, due to the recession’s dramatic impact on investment markets and the prolonged nature of the downturn, the industry is expected to continue benefiting from growth in the broader economy. This factor is particularly true for title insurers, which were decimated by the unprecedented decline in housing transactions resulting from the subprime mortgage crisis. As a result of these trends, revenue for the industry is forecast to increase at an annualized rate of 3.2% to $732.7 billion over the five years to 2021, with expected growth of 3.5% in 2017 alone. 52413 Reinsurance Carriers DEFINITION Companies in this industry specialize in assuming all or part of the risk associated with existing insurance policies originally underwritten by other insurance carriers. In other words, the primary business of participants in this industry is insuring insurance companies. KEY EXTERNAL DRIVERS Demand from property, casualty, and
direct insurance Demand from life insurance and
annuities Natural disaster index Yield on 10-year Treasury note S&P 500
KEY SUCCESS FACTORS Disciplined underwriting processes Ability to effectively manage risk MUST COMPLY WITH GOVERNMENT
REGULATIONS DEGREE OF GLOBALIZATION IN THE FIRM POSSESSION OF ACCURATE INFORMATION
OUTLOOK Over the five years to 2021, Reinsurance Carriers industry revenue is forecast to grow at an annualized rate of 3.4% to $56.6 billion. In the early part of the five-year period, the industry will benefit from rising premium prices and interest rate hikes, leading revenue to increase 3.9% in 2017. In the later years of the period, premium prices are anticipated to soften, but increased investment income from rising interest rates and stock prices will help to offset some of the profit-eroding effects. Due to the increased frequency and severity of global

Impact Greater Fayetteville
168
weather catastrophes, success within the Reinsurance Carriers industry will depend more heavily on underwriting discipline, or pricing risk adequately, and capital management. Reinsurance carriers will focus these critical activities on adjusting their businesses to contend with mass capital depletion in the event of a natural disaster. This process will involve revising pricing policies and renewing expansion in alternative financing strategies such as CAT bonds. 52429 Third-Party Administrators and Insurance Claim Adjusters DEFINITION Operators in this industry investigate, appraise, and settle insurance claims; provide third-party administration services of insurance and pension funds; and offer insurance advisory and ratemaking services. This industry does not include companies that primarily provide portfolio management services, sell insurance policies, or offer actuarial consulting services. KEY EXTERNAL DRIVERS Number of employees Per capita disposable income Natural disaster index S&P 500
KEY SUCCESS FACTORS Access to highly skilled workforce Undertaking technical research and
development Ability to vary services to suit different
needs DEGREE OF GLOBALIZATION IN THE FIRM AUTOMATION – REDUCES COSTS,
PARTICULARLY THOSE ASSOCIATED WITH
LABOR
OUTLOOK Expansion and regulation in downstream insurance and employee-benefit fund markets will increase outsourcing to the Third-Party Administrators and Insurance Claims Adjusters industry, driving growth over the five years to 2021. Therefore, IBISWorld estimates that industry revenue will increase at an average annual rate of 2.5% to $234.2 billion over the five years to 2021. Downstream demand for industry services will be also be bolstered by higher employment levels, which raises the number of funds and plan participants, as well as higher disposable income levels, which increases the likelihood that consumers will purchase insurance. Meanwhile, new financial-sector regulations stemming from the financial crisis will raise compliance costs and pressure profitability for employee-benefit and insurance funds, which will consequently increase outsourcing to industry operators over the next five years. Moreover, rising downstream demand will attract more companies and individuals to the industry, but heightened competition will put downward pressure on profit margins. Consequently, the average industry profit margin is expected to decline from 10.0% in 2016 to 8.7% in 2021. Nevertheless, the industry will also benefit from a strengthening economy. Insurance policy volumes will rise, particularly within the business sector, which will support a revival in demand for claims adjustment services. In particular, rising medical costs for downstream health and medical insurers (IBISWorld report 52411b); higher weather-related losses for general insurers driven by climate change (IBISWorld report 52412); and higher costs for life insurers (IBISWorld report 52411a) will result in greater outsourced claims volumes and higher demand for third-party administration services. Advisory and risk management services will also benefit from the

Impact Greater Fayetteville
169
improved economy, since businesses, insurers, and individuals will be able to allocate a greater portion of income to these services to mitigate risks and hedge liabilities. Furthermore, demand from insurance and employee-benefit funds will grow as their plan participants and assets increase, along with rising employment and financial markets, leading to higher industry revenue from third-party administration services. 54121 Payroll and Bookkeeping Services DEFINITION Operators in this industry provide outsourced payroll services for clients’ employees and basic bookkeeping services are also included. However, this industry does not include tax preparation companies or certified public accountants. KEY EXTERNAL DRIVERS Outsourcing to the business services
sector National unemployment rate Number of businesses Corporate profit External competition for the payroll and
business services industry
KEY SUCCESS FACTORS Access to quality personnel
management Ability to quickly adopt new technology Accessibility to consumers/users Economies of scale Ability to management external
(outsourcing) contracts
OUTLOOK Industry growth will be driven by increasing product penetration and an expanding customer base in the five years to 2021. In a climate of improving economic conditions, managers and small business operators will focus their time strategizing business activity and expansion plans, decreasing their focus on administrative tasks such as payroll and bookkeeping. Many businesses will prefer to outsource payroll services in order to focus on core competencies. Furthermore, an improving labor market will provide the Payroll and Bookkeeping Services industry with a platform for growth, given the rising number of businesses and employees. Over the five years through 2021, the number of businesses in the United States is expected to grow at an annualized rate of 0.8%, which will drive down the national unemployment rate. Consequently, in the five years to 2021, IBISWorld projects that revenue will increase at an annualized rate of 3.5% to $86.2 billion. 54121 Accounting Services DEFINITION Firms in this industry are certified to audit the accounting records of public and private organizations and to demonstrate compliance to generally accepted accounting practices. Certified public accountants (CPAs), included in this industry, provide a variety of accounting services, including auditing accounting records, designing accounting systems, preparing financial statements, developing budgets, and providing advice on matters related to accounting. KEY EXTERNAL DRIVERS Corporate profit Initial public offerings
Demand from finance and insurance Number of businesses Number of adults ages 20 to 64

Impact Greater Fayetteville
170
KEY SUCCESS FACTORS Access to highly skilled workforce Having a good reputation Effective quality control
Maintenance of excellent client relations
Having a clear market position Ability to compete on tender
OUTLOOK The Accounting Services industry is expected to experience stronger demand over the next five years as overall business activity improves. Increased corporate profit and business sentiment will cause aggregate private investment to increase and create higher demand for traditional accounting services like auditing and corporate tax assistance. Furthermore, increased corporate activity, including mergers and acquisitions (M&As) and initial public offerings (IPOs), will spur growth for industry services. Additionally, the industry is expected to benefit from rising demand for advisory services, such as consulting on tax issues and financial transactions. Increased consumer wealth will also drive demand from individuals seeking tax assistance; however, competitive conditions are also expected to intensify in the market for the provision of services to private citizens. Overall, the industry is projected to grow at an average annual rate of 3.2% to $113.7 billion over the five years to 2021, because of private investment and demand growth. 54161 Management Consulting DEFINITION Management consultants advise businesses, nonprofits and public-sector agencies in the following areas: organizational design, human resources, corporate strategy, information technology strategy, marketing and sales, finances, and logistics. This industry excludes establishments providing day-to-day administrative services and establishments that are concentrated in recruitment, training, public relations, market research, engineering design, computer systems design, and investment advice. KEY EXTERNAL DRIVERS Corporate profit Aggregate private investment Number of businesses Government consumption and
investment
KEY SUCCESS FACTORS Ability to compete on tender Well-developed internal processes Access to highly skilled workforce Access to niche markets Having good working relationships with
subcontracting building trade specialists OUTLOOK Over the next five years, strong macro-economic conditions are expected to help drive growth in the Management Consulting industry. Rising corporate profit will increase business budgets and, therefore, increase spending on consulting services. Additionally, as businesses become increasingly confident in future conditions, companies are expected to increase the size of their workforces and expand investment in new facilities and operations. Investment in new capabilities will likely boost demand for process and operations management consulting, corporate strategy and organizational design.

Impact Greater Fayetteville
171
Furthermore, rapid information technology developments will continue to be instrumental in developing new strategies, designs and understanding an evolving U.S. market. Private sector investment in information technology is expected to boom and management consultants will likely pursue more solutions that incorporate computer systems. Moreover, major investment in life sciences and healthcare over the next five years will help drive growth for consultants that assist in merger and acquisition activity. Consequently, the Management Consulting industry is projected to grow at an average annual rate of 4.1% to $308.9 billion over the five years to 2021. Major accounting and specialized prestigious consulting firms are expected to win most contracts and drive industry revenue. 56145 Credit Bureaus and Rating Agencies DEFINITION This industry comprises operators that provide information, outlooks and ratings on the credit worthiness of particular companies, individuals, securities, or financial obligations. The Credit Bureaus and Rating Agencies industry can be divided into two primary groups: credit bureaus and credit rating agencies (CRAs). Credit bureaus provide services related to consumer credit information, while CRAs generally focus on businesses, governments, securities and financial markets. KEY EXTERNAL DRIVERS Number of businesses Aggregate household debt National unemployment rate S&P 500 Yield on 10-year Treasury note
KEY SUCCESS FACTORS Level of security provided/used Access to high quality inputs Access to highly skilled workforce Accessibility to consumers/users
OUTLOOK In the five years to 2021, the U.S. Credit Bureaus and Rating Agencies industry’s revenue is forecast to increase at an average annual rate of 2.2% to $9.6 billion. As the economy continues its recovery and the financial sector completely stabilizes, banks and other lending institutions are expected to gradually decrease lending standards some (not accounting for potential regulation changes). As standards become laxer and unemployment continues falling, consumer spending and borrowing will rise at a faster pace, which will improve the need for credit bureau services, consumer reports, and credit-card marketing. At the same time, lending will get a boost from a recovery in the secondary market for structured debt instruments. Increased demand for these instruments will support demand for credit rating agency (CRA) services. Additionally, the growth of credit bureaus and CRAs will be supported by innovation and diversification, as agencies look to leverage vast amounts of information. Despite strong growth, the industry is expected to face increased scrutiny and regulation in the aftermath of the credit market crisis. In the next five years, credit rating agencies will face added government oversight in response to their inability to foresee the risks associated with mortgage-backed securities (MBSs) and collateralized debt obligations (CDOs). In addition, larger CRAs are expected to improve transparency and credit rating procedures to regain credibility within the financial marketplace. Even with added regulation, industry agencies are projected to increase their profit margins (i.e. earnings before interest and taxes) from 14.9% in

Impact Greater Fayetteville
172
2016 to 15.2% by 2021. This rise will be driven by technological advancements, which will automate services and improve employee productivity.

Impact Greater Fayetteville
173
Appendix F: Workforce Development Background/Supplemental Data and Resources
Workforce Development Background/Supplemental Data Approach: The FSU Project Team sought to understand how the various levels of potential personnel losses at Fort Bragg will also impact the local civilian labor force, employers, and workforce training needs in the tri-county study area. This includes direct military, military-civilian, contractor, military family, and civilian adults inside and outside the gates for the three counties and larger municipalities within. The overall purpose of this plan is to demonstrate the number and types of jobs and employment sectors that will be impacted because of prospective military downsizings. The plan also determines the general skill requirements of job “replacement” occupations as one basis for designing and providing appropriate talent development/placement and workforce re/training and education programs throughout the region utilizing all the related military and private/public partners mentioned elsewhere in this report. More specifically, the approach included (but was not limited to) the following: Examining - Current baseline employment by sector; Military and related employment; Personnel reduction job impacts (direct, indirect, induced); Jobs and skill requirements (by sector); and Wages. Then based on a comparison of the current skills base versus the existing and/or new jobs/businesses, determinations were made regarding which and how much additional training and education and/or job placement assistance might actually be required. The concepts and design the FSU Project Team utilized include: Implementation Recommendations – Communicate, convene, and consult with key community stakeholders particularly in regional workforce/economic development and education realms (listed elsewhere); Develop coordinated and collaborative strategies and initiatives to address identified skills and other gaps; and provide assistance gaining employment or starting a business in the regional economic sectors of strength, opportunity, and growth. Top Industry Sectors Impacted by Fort Bragg Personnel Reduction Scenario Scenario: Reduce military personnel by 3,000, with 1,044 associated federal civilian jobs assumed to be lost

Impact Greater Fayetteville
174
Table: 41: Top Ten Sectors by Employment
Top Ten Sectors by Employment
Sector Total Regional Employment Impact
* Employment and payroll of federal govt, military -4,044
Limited-service restaurants -63
Full-service restaurants -58
Real estate -49
Offices of physicians -37
Retail - General merchandise stores -36
Nursing and community care facilities -31
All other food and drinking places -27
Retail - Food and beverage stores -24
Personal care services -24
To recap from data found elsewhere in this report, if the maximum reduction of 3,000 direct military personnel were to occur, this would likewise impact an additional 1,044 associated military-civilian jobs. These losses would then impact approximately 350 - 400 “outside the gate” jobs in the sectors and establishments so indicated. Most military installation towns are primarily populated by such enterprises. Spread across those many such operations in the tri-county region, it is thought that these losses could be absorbed and shifted to other similar or new work places and entities requiring this respective talent. Specific Skill Set Analyses: The occupational skills (MOS) makeup of the active duty Army service members and military-civilians attached to Fort Bragg involved in any reduction-in-force scenario needed to be assessed in order to better ease their potential transition to civilian employment in this tri-county region. The major and most prevalent occupational codes and skill sets were then compared to existing civilian occupations using conversion cross-walks or translators - namely O*Net Online and CareerOneStop. Then these were compared with the Standard Occupational Classification (SOC) system from the U.S. Bureau of Labor Statistics for occupational match-making in key current regional and future growth sectors. For purposes of this study, it has been determined that the five most common military occupational specializations for Fort Bragg’s active military personnel are: Infantryman (11B); Health Care Specialist (68W); Wheeled Vehicle Repairer (63W/91B); Military Police (31B); Combat Engineer (12B); and Food Service Specialist (99B). These occupations match quite closely those identified by a survey used to publish “Military Human Capital Snapshot, Fort Bragg - Fayetteville, NC,” an assessment of the transitioning military workforce at Fort Bragg, in January 2016. As is evident from the O*Net information below, these all relate to several compatible civilian occupations across the region:

Impact Greater Fayetteville
175
Table 42: Military Occupational Specializations
11B Infantryman (Army - Enlisted)
11-3131.00 Training and Development Managers
11-9161.00 Emergency Management Directors
13-1151.00 Training and Development Specialists Green Occupation Green
21-1092.00 Probation Officers and Correctional Treatment Specialists
33-1011.00 First-Line Supervisors of Correctional Officers
33-3012.00 Correctional Officers and Jailers Bright Outlook Bright Outlook
33-3051.01 Police Patrol Officers Bright Outlook
33-9032.00 Security Guards Bright Outlook
47-2061.00 Construction Laborers Bright Outlook Green Occupation
49-9043.00 Maintenance Workers, Machinery
53-1031.00 First-Line Supervisors of Transportation and Material-Moving Machine and Vehicle Operators
53-3033.00 Light Truck or Delivery Services Drivers Bright Outlook
68W Health Care Specialist (Army - Enlisted)
11-9111.00 Medical and Health Services Managers Bright Outlook Bright Outlook
21-1091.00 Health Educators
29-2041.00 Emergency Medical Technicians and Paramedics Bright Outlook
29-2071.00 Medical Records and Health Information Technicians Bright Outlook
31-9092.00 Medical Assistants Bright Outlook
31-9097.00 Phlebotomists Bright Outlook
43-6013.00 Medical Secretaries Bright Outlook
63W Wheel Vehicle Repairer (Army - Enlisted)
49-3023.01 Automotive Master Mechanics Bright Outlook Bright Outlook
49-3023.02 Automotive Specialty Technicians Bright Outlook Green Occupation Green
49-3031.00 Bus and Truck Mechanics and Diesel Engine Specialists Green Occupation
91B Wheeled Vehicle Repairer (Army - Enlisted)
11-1021.00 General and Operations Managers Bright Outlook Bright Outlook Green Occupation Green
49-1011.00 First-Line Supervisors of Mechanics, Installers, and Repairers Bright Outlook Green Occupation
49-2093.00 Electrical and Electronics Installers and Repairers, Transportation Equipment
49-2096.00 Electronic Equipment Installers and Repairers, Motor Vehicles
49-3023.01 Automotive Master Mechanics Bright Outlook
49-3023.02 Automotive Specialty Technicians Bright Outlook Green Occupation
49-3031.00 Bus and Truck Mechanics and Diesel Engine Specialists Green Occupation
49-3042.00 Mobile Heavy Equipment Mechanics, Except Engines
49-3053.00 Outdoor Power Equipment and Other Small Engine Mechanics
49-9071.00 Maintenance and Repair Workers, General Bright Outlook Green Occupation

Impact Greater Fayetteville
176
49-9098.00 Helpers--Installation, Maintenance, and Repair Workers Green Occupation
53-1031.00 First-Line Supervisors of Transportation and Material-Moving Machine and Vehicle Operators
53-3032.00 Heavy and Tractor-Trailer Truck Drivers Bright Outlook Green Occupation
53-6051.07 Transportation Vehicle, Equipment and Systems Inspectors, Except Aviation Green Occupation
11-3131.00 Training and Development Managers
11-9039.02 Fitness and Wellness Coordinators Bright Outlook Bright Outlook
11-9151.00 Social and Community Service Managers
11-9161.00 Emergency Management Directors
11-9199.07 Security Managers Bright Outlook
11-9199.08 Loss Prevention Managers Bright Outlook
13-1151.00 Training and Development Specialists Green Occupation Green
13-1199.02 Security Management Specialists Bright Outlook
19-4092.00 Forensic Science Technicians Bright Outlook
21-1092.00 Probation Officers and Correctional Treatment Specialists
33-1011.00 First-Line Supervisors of Correctional Officers
33-1012.00 First-Line Supervisors of Police and Detectives
33-3011.00 Bailiffs
33-3012.00 Correctional Officers and Jailers Bright Outlook
33-3021.01 Police Detectives
33-3021.02 Police Identification and Records Officers
33-3021.03 Criminal Investigators and Special Agents
33-3021.05 Immigration and Customs Inspectors
33-3021.06 Intelligence Analysts Bright Outlook
33-3031.00 Fish and Game Wardens Green Occupation
33-3041.00 Parking Enforcement Workers
33-3051.01 Police Patrol Officers Bright Outlook
33-3051.03 Sheriffs and Deputy Sheriffs Bright Outlook
33-3052.00 Transit and Railroad Police
33-9011.00 Animal Control Workers
33-9021.00 Private Detectives and Investigators
33-9031.00 Gaming Surveillance Officers and Gaming Investigators
33-9032.00 Security Guards Bright Outlook
33-9091.00 Crossing Guards
33-9093.00 Transportation Security Screeners
33-9099.02 Retail Loss Prevention Specialists Bright Outlook
39-2011.00 Animal Trainers
43-4061.00 Eligibility Interviewers, Government Programs
43-4111.00 Interviewers, Except Eligibility and Loan

Impact Greater Fayetteville
177
43-9011.00 Computer Operators
43-9061.00 Office Clerks, General Bright Outlook
12B Combat Engineer (Army - Enlisted)
11-3011.00 Administrative Services Managers
47-2061.00 Construction Laborers Bright Outlook Bright Outlook Green Occupation Green
47-5031.00 Explosives Workers, Ordnance Handling Experts, and Blasters
94B Food Service Specialist (Army - Enlisted)
35-2012.00 Cooks, Institution and Cafeteria Bright Outlook Bright Outlook Source: O*Net Online - https://www.onetonline.org/crosswalk/MOC/
Fortunately, this particular military occupational skills mix shows some strong correlation with several of the tri-county/Fort Bragg region’s largest civilian sectors/occupations, including growing areas in health care, transportation-related, and food service occupations. In addition, a couple of the occupational specializations within the military (and military-civilian) roles have a connection to established professional and business service industries or targeted growth and emerging sectors in this region such as defense and homeland security. These occupations also align with several degree and continuing education/certification programs offered by the three regional community colleges and four-year institutions. There are also military training and certification cross walks that will give college course credit for certain training received while in the Army; some functional skills sets are highly transferable. Projected Separations from Fort Bragg On an annual basis, an average of 6,000 service personnel normally separate from the U.S. Army via Fort Bragg. They are generally replaced with new enlistees on the base, but a number choose to remain residing and working and spending in this region. That number is currently unknown, but it is estimated that as many as 1/3 remain. Of the 6,000 annually transitioning service members, 38%, or 2,400, may remain in the Fayetteville/Cumberland County metropolitan area. More importantly, 55%, or 3,300 service members, would remain in the region, if suitable employment were available. (HAS Report, 2016). This large labor pool of skilled workers should be an attractive proposition to other private- and public-sector employers. While not all of these separating personnel included here will seek employment in the tri-county area, this 1,000-3,000 of total studied separations could provide a special opportunity for local businesses and other employers to hire and retain some of these skilled workers to meet regional workforce needs. As prior studies have indicated, many who leave the Army possess various technical/STEM skills and “soft” skills including leadership, communications, reliability, project management, and team work. They are also still in their prime working age. Opportunities to match employers with these individuals will exist locally via military and civilian/public “career transition” entities listed and discussed below. Furthermore, this labor pool is highly educated and well-trained when compared to the U.S. population it serves. In fact, 82.8 percent of U.S. military officers in 2010 had at least a bachelor’s degree, compared to 29.9 percent of the general population. 93.6 percent of enlisted soldiers had at least a high

Impact Greater Fayetteville
178
school diploma, compared to 59.5 percent of America (USDOD, 2010). Previous studies have found similar statistics for the Fort Bragg area. This connected workforce could also include working military spouses and their adult children. Jobs In addition to the active duty military personnel assigned to Fort Bragg, there are many military civilian employees (at about a 1:3 ratio), local government workers, and private sector employees in the defense and other industries that support and serve the military. An internet search of U.S. Army websites indicates that the great majority of military-civilians are employed in one of the following occupations: Army Career Programs
Accounting & Budget Medical Officer
Attorney
Medical Technology
Civil Engineering/Architecture
Nursing
Computer Engineering
Psychology
Contracting
Quality Assurance
Electrical Engineering Safety and Occupational
Human Resource Management
Cyber
Industrial Hygiene
Foreign Affairs
Information Technology
Public Affairs & Communications Media
Logistics Management
Program Management
Mechanical Engineering
Social Science, and Welfare
In addition, these are similar areas of their occupational expertise:
General Administrative, Clerical, and Office Services
Natural Resources Management and Biological Sciences
Veterinary Medical Science
Legal and Kindred
Copyright, Patent, and Trademark
Physical Sciences
Library and Archives
Mathematical Sciences
Equipment, Facilities, and Services
Education
Inspection, Investigation, Enforcement, and Compliance
Quality Assurance, Inspection, and Grading
Supply
Transportation Military Spouses: According to Points of Light, across the Army there are some 710,000 active duty spouses, 93% of whom are female. An additional 500,000 spouses are married to a Reservist or National Guardsman.

Impact Greater Fayetteville
179
Recent studies have found that:
84% have some college education; 25% hold an undergraduate degree; and 10% hold a post-graduate degree.
77% of spouses report that they want or need to work.
38% of military spouses are underemployed, compared to approximately 6% rate for civilian spouses.
Only 19% of military spouses have adequate full-time employment Closer to home, it is estimated that there are approximately 26,000 (1,500 dual service) active duty military spouses in the Sandhills/Cape Fear region. [Women make up about 24,700 of the military spouses.] Based on those numbers, there could be as many as 1,400 military spouses affected by the transition of 3,000 active-duty soldiers from Fort Bragg. Administrative assistant/secretary is the most common occupation among military spouses, followed by teacher, child care services, and nursing. The following represents additional information from a USAA study about those and other top military spouse careers and job prospects. Secretary/administrative assistant Jobs as a secretary/administrative assistant are expected to grow by 12% this decade. Military spouses looking to eventually work their way up the business ladder and earn a promotion and/or better pay, might consider a degree in business administration. Teacher One in 20 military spouses from the USAA article were teachers (preK- 12). The Bureau of Labor Statistics (BLS) projects employment for kindergarten and elementary school teachers will grow by 17% between 2010 and 2020, a more optimistic prediction than the growth for high school teachers (7%) in the same time frame. The average growth rate for all occupations is 14%. Child care worker Jobs as a child care worker are expected to grow by 20% by 2020, per the BLS. The BLS projects the U.S. will create 262,000 more child care jobs in the next eight years. The only negative: below-average annual salary. Registered Nurse The nursing profession is expected to grow at a rate of 26% between 2010-2020, which is the fastest rate of all professions. The BLS expects registered nurses to gain 712,000 new jobs around the country this decade. Military spouses who are interested in this flourishing and secure field could get a leg up on the competition by looking into online nursing programs. Retail sales Jobs in retail sales (the BLS described these positions primarily in clothing, furniture, and automobiles) are expected to grow by 17% from 2010 to 2020.

Impact Greater Fayetteville
180
Waiter/Waitress The employment outlook for waiters and waitresses is expected to grow by 9% (below average) by 2020. Many spouses (male and female) with a college education work in the education and health care industries. Almost every military town or a nearby city including Fayetteville and the tri-county Fort Bragg region have a large school system and/or hospital(s). Banking is another good alternative. Given all of this, the 1,000 or so military spouses that might be impacted by a loss of 3,000 soldiers have the types of needed jobs and skills in the kinds of needed sectors in the local economy that should be able to be sustained and utilized. The employment impact of a military asset such as Fort Bragg is spread out across virtually all sectors, albeit to differing degrees. According to other reports, the Professional and Technical Services sector usually has the most military-supported jobs; other major sectors include Administrative and Waste Services, Construction, Retail Trade, and Health Care and Social Assistance. This is the case here in the Fort Bragg region as well. Again, because of the maximum potential loss of 3,000 soldiers and 1,000 military-civilians under the worst case scenario studied here, it is estimated that an additional 350 – 400 or so induced jobs could then be lost because of the reduction in demand for goods and services within the tri-county Fort Bragg region. While this loss of employment (direct, indirect, and induced) may make it difficult for some of those affected to find new employment, the research team feels confident that the local market could absorb those dislocated into similar jobs. Even though current jobs within the region are concentrated in a few sectors, they tend to match the skills and experience levels offered by those inside and outside the gate impacted by the total cumulative force reductions. A review of major county-level occupations by population also indicates a pretty strong match between the skill sets/job types of military-connected residents/workers and those predominately existing in the region:
Table: 43: Population by Occupation
Population by Occupation
Hoke Harnett Cumberland
Sales, office, administrative support 23% 24% 25%
Production, transportation, material moving 16% 15% 12.50%
Construction, extraction, maintenance-repair 11% 13% 8%
Management, business, finance 9% 12% 11%
Education, library 7% 7% 8%
Food preparation, serving 6.50% 5% 7% (Source: bestplaces.net)
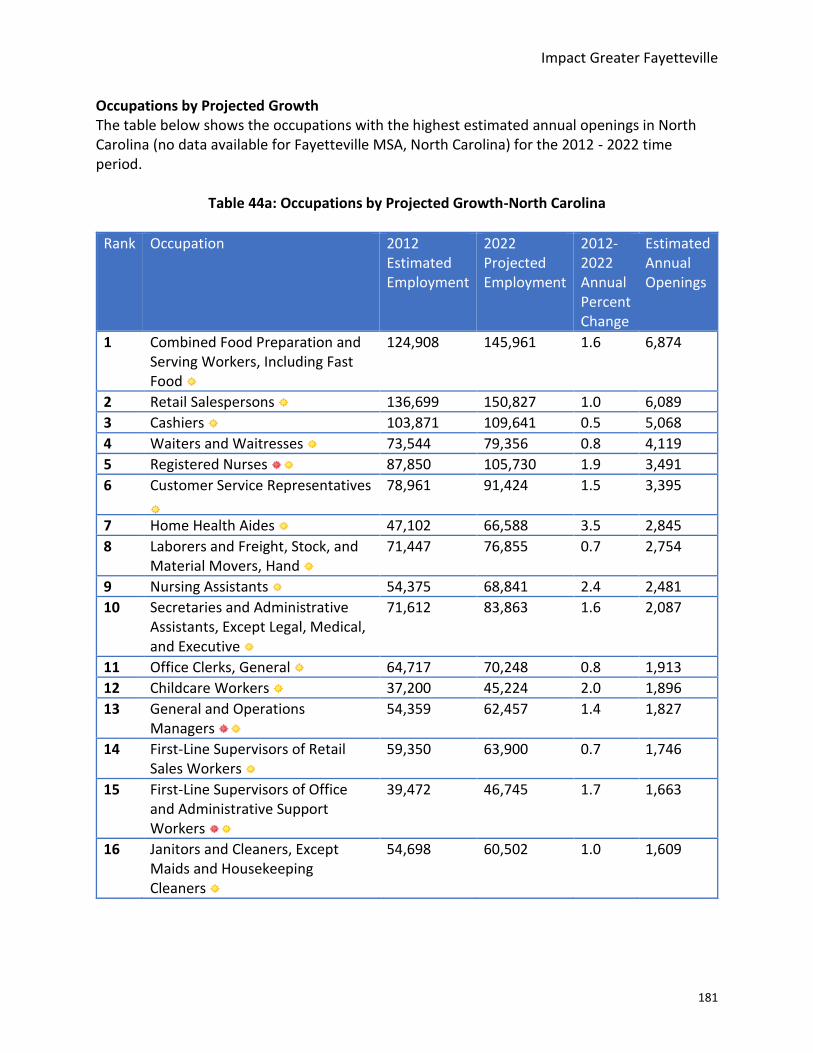
Impact Greater Fayetteville
181
Occupations by Projected Growth The table below shows the occupations with the highest estimated annual openings in North Carolina (no data available for Fayetteville MSA, North Carolina) for the 2012 - 2022 time period.
Table 44a: Occupations by Projected Growth-North Carolina
Rank Occupation 2012 Estimated Employment
2022 Projected Employment
2012-2022 Annual Percent Change
Estimated Annual Openings
1 Combined Food Preparation and Serving Workers, Including Fast Food
124,908 145,961 1.6 6,874
2 Retail Salespersons 136,699 150,827 1.0 6,089
3 Cashiers 103,871 109,641 0.5 5,068
4 Waiters and Waitresses 73,544 79,356 0.8 4,119
5 Registered Nurses 87,850 105,730 1.9 3,491
6 Customer Service Representatives
78,961 91,424 1.5 3,395
7 Home Health Aides 47,102 66,588 3.5 2,845
8 Laborers and Freight, Stock, and Material Movers, Hand
71,447 76,855 0.7 2,754
9 Nursing Assistants 54,375 68,841 2.4 2,481
10 Secretaries and Administrative Assistants, Except Legal, Medical, and Executive
71,612 83,863 1.6 2,087
11 Office Clerks, General 64,717 70,248 0.8 1,913
12 Childcare Workers 37,200 45,224 2.0 1,896
13 General and Operations Managers
54,359 62,457 1.4 1,827
14 First-Line Supervisors of Retail Sales Workers
59,350 63,900 0.7 1,746
15 First-Line Supervisors of Office and Administrative Support Workers
39,472 46,745 1.7 1,663
16 Janitors and Cleaners, Except Maids and Housekeeping Cleaners
54,698 60,502 1.0 1,609

Impact Greater Fayetteville
182
17 First-Line Supervisors of Food Preparation and Serving Workers
34,450 39,976 1.5 1,525
18 Heavy and Tractor-Trailer Truck Drivers
51,663 58,606 1.3 1,520
19 Accountants and Auditors 32,799 38,281 1.6 1,519
20 Receptionists and Information Clerks
29,673 36,199 2.0 1,452
21 Stock Clerks and Order Fillers 47,722 47,714 0.0 1,442
22 Elementary School Teachers, Except Special Education
37,007 43,138 1.5 1,427
23 Maids and Housekeeping Cleaners
37,984 44,413 1.6 1,396
24 Sales Representatives, Wholesale and Manufacturing, Except Technical and Scientific Products
45,039 49,972 1.0 1,371
25 Landscaping and Groundskeeping Workers
35,622 40,171 1.2 1,353
| | Source: Labor & Economic Analysis Division, Economic Analysis
Here is similar occupational growth projection data for the larger Sandhills Region (but not including Harnett):
Table 44b: Occupations by Projected Growth-Sandhills Region
Occupation 2012 Employment
2022 Employment
Net Change
Median Annual Wage
Registered Nurses 6445 7870 1425 57024
Elementary School Teachers, Except Special Education
4582 5347 765 38738
Licensed Practical and Licensed Vocational Nurses
2208 2922 714 39018
Interpreters and Translators 745 1251 506 187367
First-Line Supervisors of Office and Administrative Support Workers
2691 3190 499 43179
Bookkeeping, Accounting, and Auditing Clerks 3215 3655 440 30434
General and Operations Managers 2920 3349 429 91916
Heavy and Tractor-Trailer Truck Drivers 3870 4144 274 30073
First-Line Supervisors of Construction Trades and Extraction Workers
1327 1589 262 49573
Child, Family, and School Social Workers 1091 1326 235 41932

Impact Greater Fayetteville
183
Accountants and Auditors 1252 1473 221 55884
Middle School Teachers, Except Special and Career/Technical Education
1322 1543 221 38942
Secondary School Teachers, Except Special and Career/Technical Education
2192 2401 209 39163
Heating, Air Conditioning, and Refrigeration Mechanics and Installers
845 1049 204 35580
Source: NC Commerce/LEAD
Note: The equivalent lists for the Cumberland County, Lumber River (which includes Hoke County), and Triangle South Workforce Development Area (which includes Harnett County) reflect similar top growth projection occupations. Also, please note that any cuts may also have the potential to adversely impact minority-owned and/or -staffed businesses if significant numbers of separated soldiers and Army military-civilians move to areas outside of this tri-county region. Proactive interventions could utilize the existing resources of the local FSU-housed SBTDC and VBOC, regional community college SBCs, FTCC’s MBC, Fayetteville Women’s Business Center/CEED, Chambers of Commerce, and others seeking to assist local small businesses. Military personnel spend their money in the local economy, usually within a 5-10 mile radius “spend area,” supporting additional jobs, income, taxes, and sales. Currently about two-thirds, or 36,000, live on post, with the other third, or 18,000, reside “outside the gates.” Recently, the elimination or relocation of the 440th Airlift Wing occurred, consisting of approximately 350 active airmen and Air Force civilian employees and up to 1,000 drilling reservists stationed at Pope Army Airfield on Fort Bragg. It is thought, however, that this had minor, if any, adverse impacts in regional workforce or economic activity. In addition, other ongoing and new infrastructure improvements and construction and development activity also benefits the regional economy through additional jobs primarily in the construction field. This activity should help to mitigate at least some of any adverse impacts of the troop and other personnel reductions. [One remaining “unknown” problem is that it is not clear to what extent the dozens of companies and contractors doing business with Fort Bragg will even be impacted. If so, researchers would need to know exactly what portion of their revenue is reliant on military and defense spending, and what skills and knowledge are required by the companies’ workforces to be able to meet the military’s or Fort Bragg’s needs.] Potential Entrepreneurial and Economic Development Opportunities in the Tri- County Region
Many regions and/or towns/counties that are heavily dependent on military installations and seek diversification attempt to increase and/or develop economic diversification including entrepreneurial initiatives. As referenced elsewhere, the region possesses several assets to help with additional concentrated assistance, support and coaching for entrepreneurs, small

Impact Greater Fayetteville
184
business owners, and start-ups, including via incubators and accelerators. The Workforce Development Boards might also be able to provide such assistance to separated soldiers and other displaced workers.
The table below shows the industries and sectors in Cumberland, Harnett, and Hoke Counties with excess demand that is not currently met by suppliers. This is one way of identifying potential economic development and entrepreneurial opportunities in a given area. For example, in Cumberland County, an approximately $119 million demand for specialty food is currently being met by suppliers outside the county. Similarly, in Harnett County there is $121.5 million excess demand for general merchandise items, and in Hoke County $53 million excess demand for beverages and food are currently being met by suppliers from outside the county. Admittedly, the excess demand in some industries cannot be met because the county may currently lack infrastructure and complementary businesses.
Table 45: Sectors/Industry with Excess Demand
Sectors/industry with Excess Demand
Cumberland County- Excess Demand Sectors/industry
NAICS Industry Excess Demand
4452 Specialty Food Stores $118,871,795
445 Food and Beverages stores $106,600,864
443 Electronic and Appliances Stores $71,245,517
447 Gasoline Stations $29,067,044
4412 Other Motor Vehicles Dealers $19,179,338
4453 Beer wine and Liquor Stores $9,518,640
4442 Lawn & Garden Equipment Supply Stores $8,912,064
4512 Books, Periodical & Music Stores $7,305,590
4483 Jewelry, Luggage and Leather Goods Stores $4,096,069
7223 Special Food Services $2,665,089
7224 Drinking Places-Alcoholic Beverages $941,440
4533 Used Merchandise stores $295,220
Harnett County- Excess Demand Sectors/industry
NAICS Industry Excess Demand
452 General Merchandise Stores $121,589,741
4521 Department Stores excluding leased Department $92,357,060
441 Motor Vehicles and Parts Dealers $72,369,671
4411 Automobile Dealers $51,683,618
448 Clothing and Clothing Specialty Stores $47,849,557
4452 Specialty Food Stores $42,729,539
443 Electronic and Appliances Stores $40,612,988
722 Food Services and Drinking Places $36,245,968
4481 Clothing stores $33,244,535
4529 Other Merchandise Stores $29,232,681

Impact Greater Fayetteville
185
7221 Full service restaurants $25,110,802
453 Miscellaneous Store Retailers $24,994,285
451 Sporting Goods, Hobby, Book and Music Stores $23,432,353
4412 Other Motor Vehicles Dealers $23,247,950
454 Non-stores Retailers $22,690,780
4441 Bldg Materials and Supply Dealers $20,164,871
4539 Other Miscellaneous Stores Retailers $19,939,839
4541 Electronic Shopping and Mail-order Houses $18,360,460
4511 Sporting Goods, Hobby, Musical instrument Stores $18,320,132
444 Bldg Materials, Garden Equip and Supplies $15,994,448
442 Furniture and Home Furnishings $13,806,470
4421 Furniture stores $9,372,208
4483 Jewelry, Luggage and Leather Goods Stores $8,926,985 7222 Limited service eating places $6,235,111
4532 Office supplies, Stationary and Gifts Stores $6,062,522
7224 Drinking Places-Alcoholic Beverages $6,015,941
4482 Shoe Stores $5,678,037
4512 Books, Periodical & Music Stores $5,112,221
4422 Home Furnishings Stores $4,434,262
4543 Direct Selling Establishments $3,414,533
4542 Vending Machines Operators $915,787
Hoke County- Excess Demand Sectors/industry
NAICS Industry Excess Demand 441 Motor Vehicles and Parts Dealers $105,410,540
4411 Automobile Dealers $91,224,024
445 Food and beverages stores $53,004,844
4451 Grocery Stores $34,439,999
722 Food Services and Drinking Places $29,064,135
448 Clothing and Clothing Accessories Stores $22,359,196
443 Electronic and Appliances Stores $21,481,614
443 Electronic and Appliances stores $21,481,614
444 Bldg Materials, Garden Equip and Supplies $20,624,928
4441 Bldg Materials and Supply Dealers $19,022,043
4441 Bldg Materials and supply dealers $19,022,043
4452 Specialty Food Stores $17,638,583
446 Health and Personal care stores $15,804,471
4482 Shoe Stores $15,350,457
4481 Clothing stores $15,350,457
7222 Limited service eating places $13,905,689
4529 Other General Merchandise Stores $13,139,150
7221 Full service restaurants $12,238,585
453 Miscellaneous Store Retailers $10,839,340
451 Sporting Goods, Hobby, Book and Music Stores $10,496,599

Impact Greater Fayetteville
186
447 Gasoline Stations $10,496,599
442 Furniture and Home Furnishings $9,473,764
4412 Other Motor Vehicles Dealers $8,838,187
4511 Sporting Goods, Hobby, Musical instrument Stores $7,513,235
4539 Other Miscellaneous Stores Retailers $6,535,758
4413 Auto Parts, Accessories and Tire Services $5,348,329
4421 Furniture stores $5,231,084
4483 Jewelry, Luggage and Leather Goods Stores $5,006,311
4422 Home Furnishings Stores $4,242,680
4422 Home Furnishings Stores $4,242,680
4541 Electronic Shopping and Mail-order Houses $4,018,395
4512 Books, Periodical & Music Stores $3,014,563
4532 Office supplies, Stationary and Gifts Stores $2,537,562
454 Non-stores Retailers $2,537,562
7224 Drinking Places Alcohol beverages $2,307,500
4543 Direct Selling Establishments $1,976,712
4442 Lawn and Garden Equipment and Supplies $1,602,985
4533 Used merchandise stores $1,380,510
4453 Beer, Wine and liquor stores $926,262
7223 Special Food Services $612,361
4531 Florists $385,510
Regional residents seeking to start a new small business or grow an existing one in these or other markets could utilize the existing resources of the local FSU-housed SBTDC and VBOC, regional community college SBCs, Fayetteville Women’s Business Center/CEED, Chambers of Commerce, and others seeking to assist entrepreneurs. From Findings to Transition This study has attempted to understand the extent of the direct and indirect military and defense workforce footprint in the tri-county Fort Bragg region. This understanding can help with a “seamless” transition or “soft-landing” for dislocated soldiers and other impacted defense contract and civilian employees. Furthermore, it has sought to understand future opportunities for key job and industry growth in both the public and private sectors in order to meet economic and workforce needs. Part of both is a proactive focus on retaining and strengthening the defense and other sector businesses and workers that make the tri-county region their home via workforce adjustment and retraining efforts. Other sections of this report have focused on the related need to reduce the exposure of the regional economy to a reliance on military and defense spending and develop a diversification strategy and support system for those companies, workers, and communities.

Impact Greater Fayetteville
187
Therefore, the end of this plan below identifies a labor or talent transition process and a system that connects employees to growth industries/occupations and identifies technological and “high-touch” tools to support their transition process.
Regional Workforce Development, Career Intervention, and Transition Resources In order to accomplish these types of talent “trainsitions,” a collaborative effort across several entities on and off post across the three counties will need to involve the following: [Note: Given the fact that the great majority of potential dislocated workers would be military-connected, emphasis is placed on services targeted to service members and veterans. All providers besides DoD-TAP also provide similar or the exact same services and programs to the civilian population. Most of this information is taken directly from their respective websites.] The Department of Defense Transition Assistance Program (DoD-TAP) provides information, access to important documents, and training to ensure service members separating from active duty are prepared for their next step in life - whether pursuing additional education, finding a job in the public or private sector, or starting their own business. This redesigned TAP is the result of an interagency collaboration to offer separating service members and their spouses better, with more easily accessible resources and information to make their transitions more successful. Benefit Highlights: The DOD -TAP for Service Members and Veterans website is designed to provide separating service members and veterans access to their Verification of Military Experience and Training (VMET) documents, view completed Transition Modules and Tracks, view Pre-separation counseling checklist DD 2648 for active duty or DD 2648-1 for reserves and your Individual Transition Plan (ITP). From this site, service members and their spouses can:
Learn about the new Transition GPS (Goals, Plans, Success) curriculum Determine how and where to start preparing for their transition to civilian life Discover a host of online resources regarding VA benefits, financial planning assistance,
and assessing and documenting their skills for transition to civilian life
Table 46: Transition Courses
They can now complete several complementary SFL-TAP courses online on the Joint Knowledge Online (JKO) website. The following eight transition courses are now available:
Course Name JKO Course Identifier
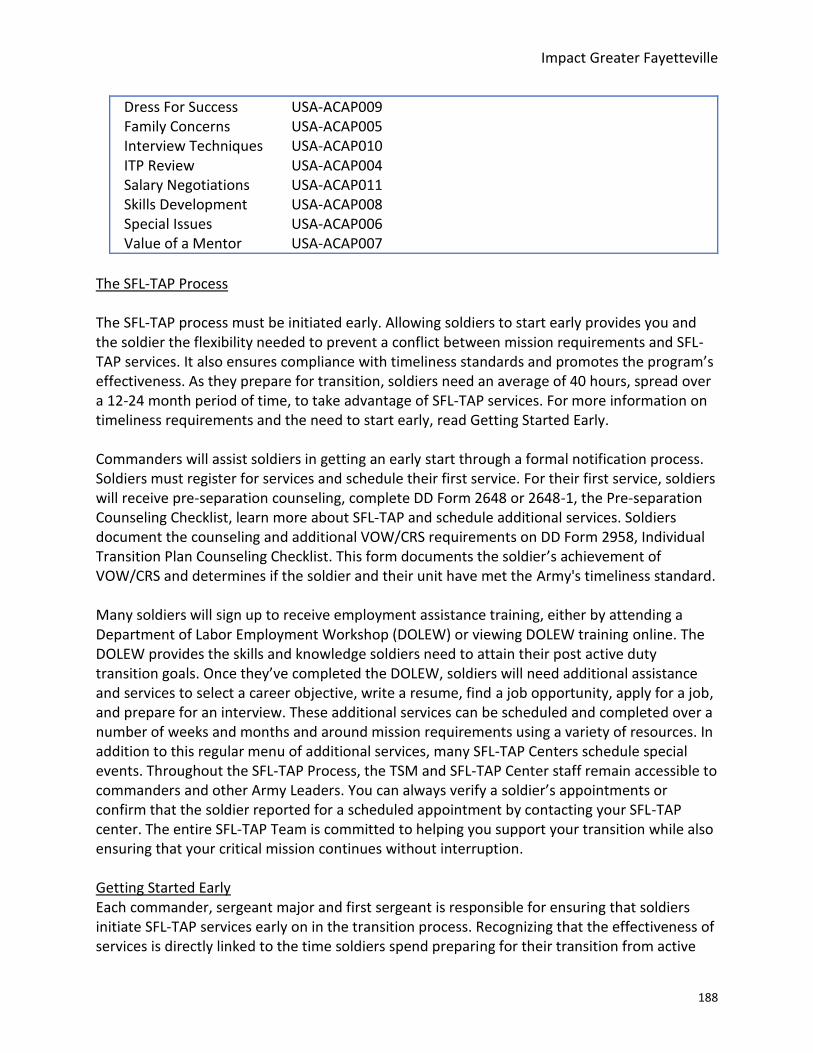
Impact Greater Fayetteville
188
Dress For Success USA-ACAP009 Family Concerns USA-ACAP005 Interview Techniques USA-ACAP010 ITP Review USA-ACAP004 Salary Negotiations USA-ACAP011 Skills Development USA-ACAP008 Special Issues USA-ACAP006 Value of a Mentor USA-ACAP007
The SFL-TAP Process The SFL-TAP process must be initiated early. Allowing soldiers to start early provides you and the soldier the flexibility needed to prevent a conflict between mission requirements and SFL-TAP services. It also ensures compliance with timeliness standards and promotes the program’s effectiveness. As they prepare for transition, soldiers need an average of 40 hours, spread over a 12-24 month period of time, to take advantage of SFL-TAP services. For more information on timeliness requirements and the need to start early, read Getting Started Early. Commanders will assist soldiers in getting an early start through a formal notification process. Soldiers must register for services and schedule their first service. For their first service, soldiers will receive pre-separation counseling, complete DD Form 2648 or 2648-1, the Pre-separation Counseling Checklist, learn more about SFL-TAP and schedule additional services. Soldiers document the counseling and additional VOW/CRS requirements on DD Form 2958, Individual Transition Plan Counseling Checklist. This form documents the soldier’s achievement of VOW/CRS and determines if the soldier and their unit have met the Army's timeliness standard. Many soldiers will sign up to receive employment assistance training, either by attending a Department of Labor Employment Workshop (DOLEW) or viewing DOLEW training online. The DOLEW provides the skills and knowledge soldiers need to attain their post active duty transition goals. Once they’ve completed the DOLEW, soldiers will need additional assistance and services to select a career objective, write a resume, find a job opportunity, apply for a job, and prepare for an interview. These additional services can be scheduled and completed over a number of weeks and months and around mission requirements using a variety of resources. In addition to this regular menu of additional services, many SFL-TAP Centers schedule special events. Throughout the SFL-TAP Process, the TSM and SFL-TAP Center staff remain accessible to commanders and other Army Leaders. You can always verify a soldier’s appointments or confirm that the soldier reported for a scheduled appointment by contacting your SFL-TAP center. The entire SFL-TAP Team is committed to helping you support your transition while also ensuring that your critical mission continues without interruption. Getting Started Early Each commander, sergeant major and first sergeant is responsible for ensuring that soldiers initiate SFL-TAP services early on in the transition process. Recognizing that the effectiveness of services is directly linked to the time soldiers spend preparing for their transition from active

Impact Greater Fayetteville
189
duty, soldiers should begin the transition process up to two years (for retirees) or no later than one year (for non-retiring transitioners) prior to transition from active duty. From a leader’s point of view, early is better than late. Soldiers who begin their SFL-TAP services early in their transition are better able to complete SFL-TAP activities around unit duty requirements. More importantly, if the Army is to realize the benefits of reduced unemployment compensation costs, enhanced active duty retention, enhanced enlistment in the National Guard and Reserve, and enhanced image of the Army as a great place to start, soldiers must have time to receive substantive transition and employment assistance services. SFL-TAP Centers maintain statistics on unit compliance with Army, DOD policies, and congressional mandates regarding timely involvement in transition and job assistance services. Your chain of command will typically have access to this data and your unit’s compliance rate will be a matter of record. Registering for Services Notified soldiers can register for their first SFL-TAP service online, in person, or pre-register by phone. Once registered, they can schedule services and print an appointment slip. Soldiers can choose to receive services in the SFL-TAP Center or online. Face-to-face service at the SFL-TAP center is always the preferred method. Either way, they will be advised of what they need to do next. You are always welcome to contact the SFL-TAP Center to confirm a soldier’s first appointment or to confirm that the soldier actually reported to the SFL-TAP Center as scheduled or completed pre-separation counseling online. First Visit The first step in the SFL-TAP process is a two-hour pre-separation counseling session, most often presented as an automated presentation delivered by the SFL-TAP website or at the SFL-TAP Center. The contents of the counseling are defined by DOD and Army policy and provide soldiers valuable information on transition benefits and programs designed to assist their smooth transition from active duty. Soldiers complete a DD Form 2648 or 2648-1 to acknowledge receipt of this counseling and indicate their desire for additional information and services. The date of this briefing is recorded in the automated SFL-TAP system and, along with the Soldiers ETS date, is the basis for all statistical reports on unit compliance with Army, DOD policies and congressional mandates. At the conclusion of the briefing, soldiers will be provided information on other service providers and given the opportunity to schedule follow-on SFL-TAP services. When soldiers do schedule a follow-on activity, they can print an appointment slip. As always, unit commanders and leaders can always verify an appointment by calling the SFL-TAP Center. Workshops The next step in the SFL-TAP process is attendance at a Department of Labor Employment Workshop (DOLEW). DOLEW is conducted by DOL facilitators. The workshop is three days in length and provides attendees the knowledge, information and skills they need to achieve their post-transition occupational goals. The Veterans Administration provides two briefings to ensure soldiers are made aware of all the benefits offered to veterans of the Armed Services, to include those disabled as a result of their service. Additional Workshops assist soldiers by comparing their current salary, benefits, and opportunities with those they might be able to

Impact Greater Fayetteville
190
attain in the private sector, as well as identifying gaps in their military skills that may assist with civilian employment. A schedule of your installation’s workshops can be found on SFL-TAP On-Line. Additional Services No one ever found a job just by attending a class. The real work of preparing for transition success begins where the workshop ends. Soldiers, even those going to school after separation, will need to begin the process of setting a career objective. Objective setting requires a careful assessment of occupations, the job market and the soldier’s own skills, aptitudes, experience, education, and training. Once the soldier has set an objective, the tough task of achieving that objective begins. Typically, job seekers must create a resume, network, identify job opportunities, apply for jobs, prepare for interviews, and prepare to negotiate salary and benefits. These are difficult tasks and few soldiers have ever performed them prior to their entry on active duty. SFL-TAP staff members are qualified professionals who have the training and resources to help soldiers perform these critical tasks. Counselors can be contacted through SFL-TAP On-Line or counseling sessions can be scheduled for individual attention. Soldiers can also go to SFL-TAP On-Line or schedule time in the SFL-TAP Center to use the automated job assistance training program, JATA, as a means of supplementing workshop instruction as well as career exploration tools, resume writers and Internet job search resources. Generally, soldiers can print an appointment slip and commanders and leaders can always contact the SFL-TAP Center to verify an appointment or attendance at an appointment. Special Events The SFL-TAP Center may schedule special events to enrich SFL-TAP services. Job fairs may be held to help transitioners meet and interview with hiring employers. Local employers may be invited into the SFL-TAP Center to help soldiers understand the local job market and better appreciate what employers are looking for in successful job applicants. The SFL-TAP Center also might hold short classes for those who want to learn more about a specific job search topic such as resume writing or interviewing. A schedule of these special events can be found on SFL-TAP On-Line.

Impact Greater Fayetteville
191
Table 47: Preseparation Timeline
Preseparation Timeline
24 - 12 Months Prior to Transition (Retirees Only) Complete Pre-separation Counseling Complete Initial Counseling Begin Individual Transition Plan (ITP) Register on eBenefits
18 - 12 Months Prior to Transition (Non-Retirees) Complete Preseparation Counseling Complete Initial Counseling Begin Individual Transition Plan (ITP) Register on eBenefits
15 - 12 Months Prior to Transition Complete MOS Crosswalk/Gap Analysis Complete Standardized Individual Assessment Identify requirements for Certification/ Licensure
12 - 9 Months Prior to Transition Complete DOL Employment Workshop and obtain DOL Gold Card
9 - 6 Months Prior to Transition Attend VA Benefits Briefings I and II
6 - 5 Months Prior to Transition Complete Resume of Choice
5 - 4 Months Prior to Transition Complete 12-Month Post Separation Budget
No Later Than 3 Months Prior to Transition Complete DD Form 2958 (Capstone)
*Transition Career Tracks (Accessing Higher Education, Career Technical Training and Entrepreneurship) will
be completed throughout the transition period in accordance with each Soldiers ITP. *Continuum of Military Service Counseling will be conducted in accordance with appropriate Army timeline standards.
NCWorks Career Centers: Formerly known as JobLink, or ESC Job Service Centers, these are operated by regional Workforce Development Boards and staff under the auspices of the N.C. Department of Commerce/Division of Workforce Solutions. They provide job seeker services for veterans, transitioning service members, and eligible spouses. They are located in all three counties. Veterans (and other civilians) can visit their NCWorks Career Center and take advantage of the following no-cost services:
Career assessments Labor market information Access to training opportunities, job fairs, and workshops Job interview preparation

Impact Greater Fayetteville
192
Resume and cover letter assistance Assistance with NCWorks Online Access to computers and free internet service Help applying for federal employment and training programs in which veterans receive
priority of service Veterans and eligible military spouses receive priority for all career services and training.
Some veterans face significant barriers that make it difficult for them to find suitable employment, especially vets who are transitioning into civilian life. Most offices have specialized staff—all of whom are veterans—who work closely with employers to create more opportunities for veterans and provide the following services to veterans themselves:
Help developing an employability plan and goals Coaching in individual and group settings Referrals to supportive services, including vocational rehabilitation, transportation,
elder care, food and nutrition services, and non-profit organizations that address homelessness
The following criteria are considered significant barriers to employment: Disabilities Homelessness Unemployed for at least 27 weeks Criminal background (released within the last 12 months) No high school diploma or GED Low income Between 18-24 years old
NCWorks Online The state’s official job-search website, NCWorks Online, gives veterans access to job postings for 24 hours before they are made available to the public. The system provides information on training opportunities, local services, and other resources available to veterans. Employers can also search exclusively for candidates who are veterans. NCWorks Apprenticeships The apprenticeship program is recognized as one of the leading methods for acquiring skills and knowledge necessary to become a craftsman. Business and industry, the North Carolina Department of Commerce and community colleges work together to provide apprenticeship programs consisting of on-the-job training and related instruction. Colleges provide the related instruction for both registered and non-registered apprentices. Related instruction may be provided through classroom instruction, correspondence or individualized instructional programs. Veterans participating in NCWorks Apprenticeships can continue to draw benefits from the GI Bill, even though they are employed as part of an apprenticeship.

Impact Greater Fayetteville
193
It is understood that due to military responsibilities, soldiers often require an additional level of scheduling flexibility to earn their college degree. Online flex courses provide a self-paced format, giving them the ability to choose their start date and work at their desired pace until completion The NC Community College System’s Customized Training Program provides education, training, and support services for new, expanding, and existing business and industry in North Carolina through the network of community colleges serving all 100 counties of the state. The goal is to foster and support three key aspects of your company's well-being:
Job Growth Technology Investment Productivity Enhancement
The Customized Training Program provides training assistance for full-time production and direct customer services positions for new and existing companies in North Carolina. The program is dedicated to the enhancement of workforce skills essential to successful employment. Eligible companies must demonstrate two of the following criteria: 1) The business is making an appreciable capital investment; 2) The business is deploying new technology; 3) The business is creating jobs, expanding an existing workforce, or enhancing the productivity and profitability of the operations within the state; and 4) The skills of the workforce will be enhanced by the assistance. This initiative could be tapped as well as another workforce and economic development resource for the region. Work-Based Learning Work-Based Learning (WBL) courses are designed to provide students with exposure to supervised work experience in industry, business, government, health, or service work situations. They are joint ventures between the educational institution and employers that help prepare students for responsible positions in the world of work. Students may earn college credit for Work-Based Learning when it directly relates to their program of study. The North Carolina Department of Commerce administers a Registered Apprenticeship program that helps workers learn new specialized skills needed in today’s workforce. The apprenticeship program combines on-the-job training with invaluable classroom instruction. A student enrolled in a community college technical education program may utilize WBL for the on-the-job training requirement of the apprenticeship. Regional Community Colleges In general, the community colleges offer degree plus corporate and continuing education and certificate programs that also match the predicted regional training and talent needs. These include the following areas: Degree:
Agricultural and Natural Resources Technologies
Biological and Chemical Technologies

Impact Greater Fayetteville
194
Business Technologies
Commercial and Artistic Production Technologies
Construction Technologies
Engineering Technologies
Health Sciences
Industrial Technologies
Public Service Technologies
Transport Systems Technologies Certificates:
Emergency Services – CPR, EMT-Basic, EMT-Basic (State/National Registry), EMT-Paramedic, Emergency Medical Technician
Extension Education – Automotive, Commercial Sewing, Foreign Language, Motorcycle Repair, Sign Language, Small Gas Engine, Teacher Renewal, Wedding/Event Planning & More!
Health care Programs – Cardiovascular Monitor Technician, CNA I & II, Phlebotomy, RMA I & II
Fire Training – Fire training for current professionals Law Enforcement – LET training for current professionals Online Programs – Business, Computer Training, Healthcare, Medical Office, Personal
Development Non-credit courses also include:
Business/Management Barbering & Cosmetic Arts Human Resources Development (HRD) Medical Industry Building/Construction Trades Industrial Skills
Community colleges also provide the following: Human Resources Development (HRD) The Human Resources Development (HRD) program provides workforce development training to individuals in transition. The goal of the HRD program is three pronged in its purpose: to provide program outreach and student recruitment activities to unemployed and underemployed individuals, to enhance and develop employability skills, and to assist individuals in accessing meaningful training and/or employment opportunities. There are six HRD courses listed on the Continuing Education Master Course List - Employability Skills (HRD 3001), HRD Employability Lab (HRD 3002), Career Planning and Assessment (HRD 3003), Career Readiness/Pathways (HRD 3004), Technology Awareness (HRD 3005), Employability Motivation and Retention (HRD 3006). HRD courses are open to all and are fee waived to unemployed individuals, dislocated workers, and workers earning at or below 200% of the federal poverty standards.
Impact Greater Fayetteville
195
Being student-centered, the HRD program focuses its activities toward providing instructional training in employability skills specifically designed to meet the needs of individuals facing job transition, skill and self- assessment activities designed to identify the individual’s interests, work values, aptitudes, and/or job readiness as related to career, employment, and/or educational goals, and career development activities to include career and/or academic planning and advisement, job search strategies for the 21st century, post-training placement assistance and follow-up counseling, and linkages to community support services. FTCC has a convenient location at the Bragg Training and Education Center (BTEC), as well as venues in Spring Lake and Fayetteville proper, for the thousands of soldiers and families stationed at Fort Bragg and Pope Army Airfield. They are committed to offering top quality college courses in a variety of formats to provide the flexibility they need. With over 200 programs of study to choose from and Military Services Specialists on staff, they can help soldiers pursue their educational goals Fayetteville Technical Community College's participation as a Service Members Opportunity College streamlines credit transfers between schools. Although some North Carolina community colleges, including Fayetteville Technical Community College and Central Carolina Community Colleges, have programs that provide significant course credits for military training, each institution in the University of North Carolina system determines which credits they will accept as transfer credits, or whether course credit will be granted for military training. Military Medic to Paramedic EMS Bridge Programs is one such initiative that may help separated soldiers to quickly transition to a related civilian occupation in high demand. FTCC is also proud to participate in the My Career Advancement Account (MyCAA) Scholarship. Through the MyCAA Scholarship program, an eligible military spouse can receive up to $4,000 of tuition assistance over two years. The scholarship is designed to assist military spouses in acquiring the education and qualifications needed to enter a high-demand, high-growth portable career field or occupation. Transition Tech is another special training program for transitioning military service members that provides industry-focused certificates and credentials, resume assistance, and mock interview opportunities designed to prepare them to enter the civilian workforce. After completing industry courses, each Transition Tech student will complete five days of Human Resource Development to prepare for resumes and interviews with industry employers. Program Cost These courses are FREE to veterans and active military in transition through a partnership with Workforce Development (NC Works). Training Length Most programs are 10-12 weeks in length, but depending on your MOS and skill level, you may be able to complete the training in less time.

Impact Greater Fayetteville
196
FTCC has proudly provided affordable and convenient educational pathways for our nation’s military for over four decades. They are committed to supporting our military students in their pursuit of education through: – A Tuition Grant to cover any tuition costs over $250/credit hour (TA Limit) – Waived Administrative Fees for all military students using tuition assistance – Low or No Cost Textbooks to limit any out-of-pocket costs – Credit for Military Training based on your military training and experience will reduce the number of courses needed to complete your degree The North Carolina Military Business Center (NCMBC) is a business development entity of the North Carolina Community College System, headquartered at Fayetteville Technical Community College (FTCC). The mission of the NCMBC is to leverage military and other federal business opportunities to expand the economy, grow jobs and improve quality of life in North Carolina. The NCMBC’s primary goal is to increase federal revenues for businesses in North Carolina. The Department of Defense has an annual impact of $48 billion and is the second largest sector of North Carolina’s economy (12% GDP). With six major military bases, 116 National Guard and 40 Army Reserve facilities, adding up to the third highest number of uniformed military personnel in the country, the State of North Carolina created the NCMBC to leverage opportunities with these installations and with DoD commands worldwide. The NCMBC connects North Carolina firms to current government contracting opportunities in two ways – with a team of business development specialists across the state who also provide technical services, and electronically with www.MatchForce.org. Business Development. The NCMBC’s business development team includes experienced business development, industry and procurement specialists operating from 12 community colleges across the state – from Franklin to Elizabeth City. These specialists identify the most lucrative federal contract opportunities (prime and subcontracts), notify and pre-position North Carolina firms for specific opportunities, and assist firms to understand government solicitations, prepare winning proposals, and to successfully execute federal contracts. MatchForce. To connect North Carolina businesses with all federal opportunities, including local opportunities at bases in the state, the NCMBC administers the state’s official, FREE web portal for federal contracting – www.MatchForce.org. North Carolina businesses register on the portal, receive automatic matches to federal prime opportunities and to subcontracting opportunities posted by other registered businesses, and post job opportunities for FREE that match job skills posted by registered individuals. Firms identifying contract opportunities through MatchForce can then contact the NCMBC business development team for one-on-one assistance. The Small Business Center Network, comprised of 58 Small Business Centers throughout North Carolina on community college campuses, supports the development of new businesses and the growth of existing businesses by being a community-based provider of training, counseling, and resource information. The programs and services of the Small Business Center Network

Impact Greater Fayetteville
197
promote entrepreneurship and the development of small businesses across North Carolina. The centers are local, community-based resources that help existing and potential small business owners plan and operate successfully. The specialized staff assist with business plan development and review, information on financial support, one-on-one business counseling, and referrals to other agencies and sources of business assistance. Additionally, the centers provide free and low cost seminars and courses and serve as a resource library of relevant business publications, videos/audios and software. Confidential counseling services and access to resource libraries are free of charge. Some seminars and workshops require a minimal registration fee. Services provided by the Small Business Center Network can be customized to suit specific business needs. At Central Carolina Community College, they understand the unique needs of service members and their spouses. This is why they work to make it possible for them to finish their college education, regardless of location. Whether you want to earn points toward promotion or to transfer credits toward a bachelor's degree, their staff will work to build a plan that's right for each student. Veterans Upward Bound is designed to motivate and assist veterans in the development of academic and other requisite skills necessary for acceptance and success in a program of post-secondary education. The program provides assessment and enhancement of basic skills through counseling, mentoring, tutoring, and academic instruction in the core subject areas. The primary goal of the program is to increase the rate at which participants enroll in and complete postsecondary education programs. Sandhills Community College. The Sandhills Hoke Center offers curriculum and continuing education courses as well as serving as the home for Sandhoke Early College High School. The University Studies Associate in Arts, Criminal Justice, Nursing Assistant, and Basic Law Enforcement Training are offered in total at the Hoke Center. Continuing Education classes in Career Training, College and Career Readiness and Career Development are taught at the Sandhills Hoke Center. Education programs are approved by the North Carolina State Approving Agency for the enrollment of persons eligible for education assistance benefits from the U.S. Department of Veterans Affairs (VA). Those entitled to VA benefits are eligible veterans, participants in the Montgomery G.I. Bill contributory program, active duty military in voluntary education programs, drilling National Guard, drilling Reservists, and spouses and children of disabled or deceased veterans. The Office of Veterans Affairs in Student Services provides information and assistance to students applying for VA education benefits. Apply on the VA website www.gibill.va.gov. Please see the VA Certifying Official regarding any specific questions regarding these programs.

Impact Greater Fayetteville
198
To be eligible for VA educational benefits, one must be enrolled in an approved curriculum, taking only those courses required for graduation in the chosen curriculum. Students must maintain Satisfactory Academic Progress under the same standards as Financial Aid Recipients. The VA will not pay for enrollment in the following:
course audits repeated courses previously passed credit by examination courses not required in chosen curriculum continuing education classes dropped or withdrawn classes
Regional Universities Fayetteville State University (FSU) is a public comprehensive regional university offering degrees at the baccalaureate, master's, and doctoral levels across 54 programs of study. The University's Schools of Business and Economics, Nursing, Education, and Criminal Justice are widely recognized as being top-tier schools in the state of North Carolina by U.S. News and World Report and other educational review sources. The University has also been voted as best in the state of North Carolina for Veterans, and its online MBA program has been voted as among the most affordable in the nation among highly accredited institutions. For over thirty years, the faculty and staff of Fayetteville State University have embraced military service members and their families. Today, they continue to strengthen the relationship while striving to meet the educational needs of this growing and valuable sect of the regional community. In commitment to military families, Fayetteville State University is constantly rising to the challenge of tailoring its academic programs to assist them in achieving their personal and career goals. Thus, they offer various degree programs at bachelor's and master's levels as well as fully online programs in criminal justice, psychology, sociology, fire science, and business administration-general, making the pursuit of higher education convenient and feasible.. The Veterans Business Outreach Center (VBOC) at the School of Business and Economics (SBE) offers continued entrepreneurial services and training to veterans in U.S. Small Business Administration Region IV (serving all of NC plus some other southeastern states). The VBOC mission is to maximize the availability, applicability, and usability of small business programs for veterans, service-disabled veterans, reserve component members, and their dependents or survivors. VBOC, with its parent Office of Veterans Business Development, is SBA’s liaison with the veterans’ business community providing policy analysis, reporting, and training programs for veteran entrepreneurs. VBOC has a number of programs and services to assist aspiring and existing veteran entrepreneurs such as training, counseling, mentorship, and capital access through SBA loan programs to veteran-owned and service-disabled veteran-owned small businesses. Current veteran entrepreneurship training opportunities at FSU Include:

Impact Greater Fayetteville
199
•Collaborative, hands-on, interactive learning opportunities for veterans, disabled veterans, spouses, National Guard, and reserve component members •Continued training at area military bases through Operation Boots to Business: From Service to Startup •VBOC ‘s Entrepreneur Boot Camp for Veterans with Disabilities •Ongoing one-on-one business counseling and training programs, courses and seminars •Building a community of interactive veteran resource partners locally and across SBA Region IV •Workshops to include QuickBooks, How to Write a Business Plan, Credit Counseling, and SBA Loan Programs: the Veterans Advantage Small Business & Technology Development Center at FSU Organized as an inter-institutional program of the University of North Carolina, operated in partnership with the SBA, the Small Business and Technology Development Center (SBTDC) is the primary organization through which the State of North Carolina provides counseling and technical assistance to the business community. The SBTDC's mission is to support the growth and development of North Carolina's economy by encouraging entrepreneurship, assisting in the creation and expansion of small businesses, and facilitating technology development and transfer. The Cape Fear SBTDC's primary focus is in-depth, one-on-one, confidential counseling. Assistance is provided free-of-charge to the small business owners or aspiring entrepreneurs. As the only full-service counseling resource statewide, the SBTDC helps with the myriad of tasks facing a business owner including assessing the feasibility of a business idea, preparing a business plan, finding sources of capital loan package preparation, developing marketing strategies, and improving operations and human resource management. GoArmyEd is the virtual gateway to request Tuition Assistance (TA) online, anytime, for classroom, distance learning, and eArmyU online college courses. Information on other Army Continuing Education System (ACES) programs and services is also available on GoArmyEd.com. GoArmyEd is a dynamic online portal that automates many of the paper-based processes you historically conducted with your Army Education Counselor. GoArmyEd is your one-stop location for managing your college education using TA benefits. GoArmyEd is used by:
Soldiers to pursue their postsecondary educational goals. Army Education Counselors to provide educational guidance. Colleges to deliver degree and course offerings and to report soldier progress.
Teaching Licensure Opportunities for Transitioning Soldiers Fayetteville State University, in cooperation with the Fort Bragg Education Center, offers a program of Teacher Licensure Opportunities for Transitioning Soldiers (TLOTS) through the School of Education. This program allows transitioning soldiers who have a maximum of two

Impact Greater Fayetteville
200
years of active duty remaining and hold at least a B.A. or B.S. degree to enroll in a teacher licensure program. For program requirements, contact the School of Education. Fayetteville State University first established its presence on Fort Bragg in 1973. Since then, Fayetteville State University/Fort Bragg Center has continued to provide excellent education for all Fort Bragg Military personnel, their dependents, and citizens of the surrounding communities. The “Focus” of Fayetteville State University/Fort Bragg Center is to “Target & Achieve” the specific needs and requirements unique to our military. Students may take a minimum of three semester hours or a maximum of nine semester hours credit each term, depending upon personal obligations. Also, all courses are taught after standard business hours to afford the flexibility and opportunity for higher learning. Finally, the Center for Defense & Homeland Security (CDHS) at FSU offers training academy programs in cybersecurity, emergency management, and national security for military-connected students, civilians, and professionals in the field. Methodist University The University offers bachelor's degrees in over 80 fields of study (majors and concentrations) including communications, justice studies, business administration, education, and social work. New majors, minors, and concentrations recently added include entrepreneurship, interdisciplinary studies of clandestine labs, church leadership, and radio communications. The University offers four master's degree programs: the Master of Medical Science in physician assistant studies, the Master of Business Administration in organizational management and leadership or health care administration, the Master of Justice Administration, and the Master of Education in literacy or special education. In the fall of 2015, the University enrolled its first doctoral level students in the Doctor of Physical Therapy program. MU also hosts a Center for Entrepreneurship plus offers a related major. Their office on post services their active-duty military students. At the office, military students can receive financial aid consultation, register for classes, and receive academic advising. On our Fort Bragg Campus, students can take MU at Night classes toward their degree, and even earn entire degrees in Business Administration or Environmental & Occupational Management without setting foot on the main campus. G.I. Jobs has named Methodist University a Military Friendly School for five straight years, and they are proud to offer educational services for active duty military, guardsmen, reservists, veterans, spouses, and dependents. Veteran Services MU provides information on aid for veterans, spouses, and dependents. From the G. I. Bill to the Yellow Ribbon Program, their website can answer questions about veteran benefits

Impact Greater Fayetteville
201
Campbell University is committed to meeting the needs of active duty and veteran military students to help them build their future in the civilian and military worlds. Campbell University offers:
Over 150 tracks and concentrations including relatively new offerings in nursing, engineering, homeland and cyber-security
5 graduate and professional programs including physical therapy and osteopathic medicine
Convenient day and evening programs Online courses One of the best ROTC programs in the nation Liberal transfer policy
In addition, Campbell University is a member of Service Members Opportunity Colleges (SOC) providing soldiers with enhanced transfer opportunities and the chance to turn their military training into college credit. While their main campus is located in Harnett County’s Buies Creek, they offer a number of courses on Fort Bragg in the Bragg Training and Education Center (BTEC).

Impact Greater Fayetteville
202
Appendix G: Harnett County Population Distribution To address a question raised by the representatives from Harnett County regarding the potential impact at the local level of changes in the number of Ft. Bragg armed forces personnel, we compiled and presented, in Table 48, data on the distribution of armed forces personnel throughout Harnett County at the zip code level. Harnett County is, primarily, represented by 13 zip codes, eight of these zip codes extend into neighboring counties. First, we separate the zip codes into two groups based on geographic proximity to Ft. Bragg, which aligns roughly along a diagonal running from northwest to southeast of the county. This results in seven zip codes classified as within the Ft. Bragg area (western area); the other six zip codes as outside of the Ft Bragg area (eastern area). It turns out that the seven zip codes within the western area represented 44% of the 13-zip code population but 97% of the armed forces personnel within the area in 2015. The corollary it that the eastern area account for 56% of the 13-zip code population but only 3% of the armed forces personnel. Five years earlier, in 2011, the population distribution across the 13 zip code area was quite similar. The corresponding figures for the western area were 45% and 95%, and 55% and 5%for eastern area. To better understand the situation in Harnett County we apportion the total population 16 years and over along with the armed forces population for the county according to Harnett County’s proportion of the total populations for the 13 zip codes area. The 2015 Census data indicates a population of 16 years and over of 93,412 for Harnett County, including 4,618 armed forces personnel. The comparable figures for the thirteen zip codes are 183,463 and 6,461, respectively. Harnett County represents 51%of the 13 zip code population and 72% of armed forces personnel. As a consequence, western Harnett County accounts for 4,499 or 97% of the 4,618 armed forces personnel that resides within Harnett County. Similar computations for 2011 shows that 95 or 3,229 of the 3,414 armed forces personnel that resided in the county were located within western Harnett County. During the period 2011 to 2015, Harnett County’s population 16 years and over grew by 10.5% to 93,412 while its armed forces population grew by 35.3% from 3,414 to 4,618. Skewness of the armed forces population distribution towards western Harnett County is even more pronounced. The population 16 years and over grew by 8.3% in western Harnett County to 41,354, while the armed forces population grew by 39.4 from 3,229 to 4,499. During the same period eastern Harnett County’s population of 16 years and over grew by 12.3% and recorded a decline of 36% in the number of armed personnel residents to from 185 to 119. In effect, the overall population of western Harnett County is growing at a slower rate than eastern Harnett County, however, the armed forces component of the population has skyrocketed over this period in the west of the county.

Impact Greater Fayetteville
203
Table 48: Harnett County Population 16 years and over for 2011 and 2015
Area Western Harnett County Eastern Harnett County
Total
Zip Codes* 27332, 27505, 27546, 28323, 28326, 28356, 28390
27501, 27521, 27526, 27540, 28334, 28339
2015
Zip Codes Population 81,220 102,243 183,463
Zip Codes Armed Forces 6,295 166 6,461
2011
Zip Codes Population 72,884 88,468 161,352
Zip Codes Armed Forces 4,442 255 4,697
2015
Harnett Population 41,354 52,058 93,412
Harnett Armed Forces 4,499 119 4,618
2011
Harnett Population 38,196 46,363 84,559
Harnett Armed Forces 3,229 185 3,414
Source: U.S Census Bureau, American Community Survey * Zip Codes - https://www.unitedstateszipcodes.org/
Impact Greater Fayetteville
204
References Association of Defense Communities. ADC BRAC Workshop: Using Lessons Learned to Address The Resource Challenges of Today. August 7, 2012. bestplaces.net website: http://www.bestplaces.net/
BRAC Regional Task Force: Comprehensive Regional Growth Plan (TDA, 2007); A Strategy to Grow
the Fort Bragg Region’s Defense & Homeland Security Economy (TDA, 2010); and The Economic
Impact of BRAC on the 11 Member Counties: Bridging the Gap for Economically Disadvantaged
Populations (FSU/UNC-P, 2009) CareerOneStop website: https://www.careeronestop.org/ResourcesFor/Veteran/veteran.aspx City of Fayetteville, North Carolina. Charting the Source, FY 2017-FY 2018. 2017. Cumberland County. 2015-2016 Cumberland County Strategic Plan. 2015. Department of Defense, Armed Forces: Average annual expenditures and characteristics, Consumer Expenditure Survey, 2013-2015
Department of Defense. Office of Economic Adjustment.
Department of Defense, Fort Bragg Public Relations. January 2016. ESRI Reports, 2015 Federal Reserve Bank of Richmond Fayetteville Cumberland County Economic Development Corporation. Strategic Plan 2016-2017. 2016. Garner Economics, LLC. A Competitive Realities Report for Fayetteville and Cumberland County, North Carolina. 2012. Harnett County. Grow Harnett County: Comprehensive Growth Plan 2015. Harvard Business School. U.S. Cluster Mapping Project, Institute for Strategy and Competitiveness. 2016. IBISWorld IMPLAN Professional Software

Impact Greater Fayetteville
205
Land Design and Economic Leadership. Grow Harnett County: Comprehensive Growth Plan 2015. 2015. Military Human Capital Snapshot, Fort Bragg - Fayetteville, NC, FSU SBE, January 2016. NC Commerce/LEAD Sandhills (South Central) Region website: https://www.nccommerce.com/lead/data-tools/industry/projections/prosperity-zones/sandhills-south-central-region NC Labor & Economic Analysis Division, Economic Analysis NC website:
https://www.nccommerce.com/lead/data-tools/occupations/projectionss NCWorks Cumberland Workforce Development Board website: http://www.co.cumberland.nc.us/workforce/labor_market.aspx O*Net Online website: https://www.onetonline.org/crosswalk/MOC/ Points of Light website: http://www.pointsoflight.org/programs/military-initiatives/community-blueprint/employment Standard Occupational Classification (SOC) - U.S. Bureau of Labor Statistics website: https://www.bls.gov/SOC/ USAA Magazine, September 2012 U.S. Army Planning Documents U.S. Army Career Programs website: http://cpol.army.mil/library/career/cp-templates/ U.S. Bureau of Economic Analysis U.S. Bureau of Labor Statistics U.S. Census Bureau U.S. Dept. of Defense. Demographics: Profile of the Military Community. 2014.