Impact Evaluation Psychosocial Support on Children’s Well ...
126
Long-term Assistance and Services for Research (LASER) Partners for University-Led Solutions Engine (PULSE) Impact Evaluation Psychosocial Support on Children’s Well-being, Literacy, and Math Outcomes in the South Sudan Integrated Essential Emergency Education Services Activity Final Report SUPPLEMENT TO AGREEMENT NO. AID-7200AA18CA00009 AUGUST 2020 This publication was produced for review by the United States Agency International Development (USAID). It was produced for the LASER PULSE Project, managed by Purdue University, by Consortium members, led by Indiana University. The views expressed in this publication do not necessarily reflect the views of USAID or the United States Government.
Transcript of Impact Evaluation Psychosocial Support on Children’s Well ...

Long-term Assistance and Services for Research (LASER) Partners for University-Led Solutions Engine (PULSE) Impact Evaluation Psychosocial Support on Children’s Well-being, Literacy, and Math Outcomes in the South Sudan Integrated Essential Emergency Education Services Activity Final Report
SUPPLEMENT TO AGREEMENT NO. AID-7200AA18CA00009 AUGUST 2020 This publication was produced for review by the United States Agency International Development (USAID). It was produced for the LASER PULSE Project, managed by Purdue University, by Consortium members, led by Indiana University. The views expressed in this publication do not necessarily reflect the views of USAID or the United States Government.

Impact Evaluation
1
Acknowledgements The LASER research team was composed of:
Indiana University: Arlene Benitez, Principal Investigator and Director, Center for International Education, Development, and Research and Rebecca MacFarlane, Data Quality Manager Purdue University: Jennifer DeBoer, Ph.D.; Assistant Professor Engineering Education, Mechanical Engineering (by courtesy); Moses Olayemi, Doctoral Student, Engineering Education; Priyanka Brunese, PhD., Postdoctoral Research Associate, LASER PULSE; Sukhada Sanjay Joshi, MS Student, Industrial Engineering; Utkuhan Genc, BS Student, Industrial Engineering and Yuehwern Yih, PhD., Professor, Industrial Engineering University of Notre Dame: Tom Purekal, Co-Principal Investigator, Pulte Institute for Global Development, Director of Innovation and Practice and the Pulte Institute student team who assisted with data entry. Resilient Africa Network at Makerere University: Natasha Kassami, Community Liaison Officer; Dr. Julius Ssentongo, Program Coordinator and Nathan Tumuhamye, Eastern Africa RILab Director Catholic Relief Services: Melissa Tucker, Technical Advisor for Psychosocial Support A team of South Sudanese research associates led by Dr. Mamour Chuol included Akwero Christine Okumu, Batheng Babouth Rut, Sister Georgina Victor and Grace Chunyua Marious Said. Additional logistical support in South Sudan was provided by Emmanuel Lakony and teams of local enumerators at each research site. Thanks to Dr. Julia Duany and the Gender Equity and Women’s Leadership Program for their support of our efforts. This evaluation was conducted in close collaboration with Wendy Wheaton, Senior Education Officer at USAID/Office of Sudan and South Sudan; the USAID Mission in South Sudan, particularly Daniel Wani, Program Management Specialist, Education and UNICEF South Sudan with significant support from Louise Sherwood, Child Protection Specialist; John Tileyi Yuggu, Hyacinthe Aduoku, and Emmanuel Kumuli. Additional support was provided by UNICEF’s local implementing partners including: War Child Holland, Save the Children, Community in Need Aid (CINA), and Terres des Hommes. Dr. Saima Malik, Senior Research and Learning Advisor for the Reading and Literacy team, USAID Office of Education, provided a final review of the draft.

Impact Evaluation
2
Table of Contents Acknowledgements 1
Acronyms 4
Executive Summary 5
Section 1: Introduction and Background of UNICEF IEEES 9
Section 2: Methodology 10 2.1 Impact Evaluation and Rationale 10 2.2 Desk Review 10 2.3 Study Sites 10 2.4 Sample Selection 11 2.5 Quantitative Data Collection 12 2.6 Qualitative Data Collection 13 2.7 Ethical Considerations 14 2.8 Data Analysis 14
Section 3: Evaluation Findings 16 3.1 Quantitative Findings 16
3.1.1 Psychosocial Support Outcomes 16 3.1.2 Academic Findings 20 3.1.3 Recent Assessment of Academic Outcomes (2019) 20 3.1.4 Past Assessment of Academic Outcomes (2015 and 2017) 23
3.2 Qualitative Findings 26 3.2.1 Student Outcomes 26 3.2.2 Perceived Changes in Student Behaviors, Motivations, and Skills 27 3.2.3 Peacebuilding Skills 28 3.2.4 School Attendance 28 3.2.5 Contributing Factors 28 3.2.6 PSS Trained Teacher Intervention 29 3.2.7 Family Ties 29 3.2.8 Physical Activities (Sports and Games) 29
Section 4: Challenges, Limitations, Implications, and Recommendations 29 4.1 Conducting research in a complex environment 30 4.2 A strong local research team is a key to success 30 4.3 Working with multiple institutions and stakeholders 31 4.4 Discussion and Recommendations for Further Study 31
References 34

Impact Evaluation
3
Appendices 36 Appendix 1: List of Study Sites 36 Appendix 2: Power Analysis 40 Appendix 3: Factor Loading and Factor Analysis of Survey Items 41 Appendix 4: Student Survey 44 Appendix 5: Teacher Survey 52 Appendix 6: Interview Questionnaires 63 Appendix 7: PSS Outcomes Disaggregated by Gender, Class, Urbanicity, School type, POC Status, and States 64 Appendix 8: Academic Assessment Results Disaggregated by Gender, School type, and Urbanicity 69 Appendix 9: EGRA/EGMA 2015/2017 Student Descriptives 75 Appendix 10: EGRA/EGMA Assessment 78 Appendix 11: Domains of Wellbeing 119 Appendix 12: Density plots of EGRA and EGMA scores by school type and urbanicity 123

Impact Evaluation
4
Acronyms CRS Catholic Relief Services
CYRM Child and Youth Resilience Measures
EGMA Early Grade Mathematics Assessment
EGRA Early Grade Reading Assessment
GBV Gender Based Violence
IEEES Integrated Essential Emergency Education Services
IU Indiana University
LASER PULSE Long Term Assistance and Services for Research, Partners for University-Led Solutions
MoGEI South Sudan Ministry of General Education and Instruction
OOS Out of School
POC Protection of Civilians Site (UN)
PSS Psychosocial Support
PU Purdue University
RAN Resilient Africa Network
RERA Rapid Education and Risk Analysis
SEL Social and Emotional Learning
SDQ Strengths and Difficulties Questionnaire
UND University of Notre Dame
UNICEF United Nations Children's Fund
USAID United States Agency for International Development
WASH Water Sanitation and Hygiene

Impact Evaluation
5
Executive Summary This report documents the findings of an 18-month impact evaluation of the psychosocial support
interventions included in the UNICEF Integrated Essential Emergency Education Services (IEEES) conducted by a team of researchers through the Long-Term Assistance and Services for Research, Partners for University-Led Solutions (LASER PULSE) program. Purpose of Evaluation
Building on the previous UNICEF-led Emergency Education activity that ended in March 2018, the Integrated Essential Emergency Education Services (IEEES) activity is now in the 2nd year of implementation with new sites being added. At this time of expansion, an evaluation offers an opportunity for universities to (i) partner with stakeholders to conduct research that can inform decision-making about future directions for the activity in South Sudan and (ii) guide development strategy in the broader field of education in emergencies and psychosocial support. Specifically, the purpose of this impact evaluation was to understand the impact of inclusion of psychosocial support (PSS) interventions as part of education programming in a complex environment The key question to be answered by the evaluation was, “What are the impacts of psychosocial support interventions on students’ well-being, resilience, and academic performance?”
Sub-questions included: ● “What is the impact of the intervention on psychosocial capabilities for using knowledge
(critical thinking, problem-solving), for being decisive and resilient (decision-making, motivation, resilience), and for living together (communication, empathy)?
● Do interventions impact children’s psychosocial skills and knowledge (e.g. coping skills, conflict resolution skills)?
● Do interventions impact children’s attitudes and dispositions (feelings of belonging, tendency toward violence vs. peaceful resolution)?
● Do interventions impact children’s feelings of safety and well-being? Methods
This evaluation was guided by the theory of change that if children in conflict affected settings are provided with appropriate psychosocial support, they will see improvement in general well-being, resilience, and school performance. The evaluation sought to test this theory through a mixed-methods approach that measured children’s well-being and resilience through student and teacher surveys and academic performance through modified Early Grade Reading and Mathematics Assessment tools https://pdf.usaid.gov/pdf_docs/PA00MM2C.pdf. Students from primary grades 3, 5, and 6 were included in the study. Case studies in 5 schools receiving psychosocial support interventions were also included.
Surveys administered to 3000 students covered key demographic factors, attitudes towards learning and classroom climate, and psychosocial well-being and behaviors. The three core domains of wellbeing were confirmed as appropriate during the workshop, and questions were selected and developed for the survey tool. The measures reviewed for tool development were selected from those reviewed and recommended in the CRS MEAL4Kids Guidance of Measuring Child Psychosocial Wellbeing in Emergency Response and Recovery Programming (Bhol, Dzino-silajdzic and Ryan, 2018) which identifies the most commonly defined subcomponents of wellbeing and compares validated tools for measuring these constructs.
For the purposes of this evaluation, emotional wellbeing is defined as an internal state reflecting positive thoughts and emotions such as hopefulness, calm, self-esteem and self-confidence; social
https://dec.usaid.gov/dec/search/FusionSearchResults.aspx?q=Integrated+Essential+Emergency+Education

Impact Evaluation
6
wellbeing is derived from interaction with the environment including the sense of belonging, nurturing relationships, and ability to interact with others; and skills and knowledge, or resilience, is the capacity to learn, use coping skills, and make positive decisions to overcome life’s challenges.1
Question were drawn primarily from Strengths and Difficulties Questionnaire (SDQ)2 and the Child and Youth Resilience Measurement (CYRM)3, and also from the KIDSCREEN Quality of life questionnaires for children and adolescents4 and others5 that contained questions that addressed the sub-domains identified in the workshop process. Three questions were created specifically for the context, proposed by South Sudanese research partners. All questions were cross referenced with the UNICEF monitoring and evaluation tool, to ensure accurate targeting of intended outcomes. Questions on emotional wellbeing were included to look at psychosocial status, or negative emotional experiences to understand how these scores might correlate with social or resilience outcomes, as well as learning outcomes, rather than to measure any change in psychosocial status. Scoring high on experiences such as worry and bad dreams, which could be associated with stress or anxiety, could impact classroom skills and behaviors. Additionally, questions were added specific to adolescent-aged students, as South Sudanese team members felt this age group experiences unique and additional pressures related to becoming adults, and to self-confidence. Surveys administered to nearly 600 teachers covered demographic background (including age, gender, education level, and mother tongue), training and implementation of psychosocial support activities, and attitudes towards teaching and classroom management. Additional contextual information was provided through 5 in-depth case studies (one intervention school from each of the 5 participating states) including student focus groups and key informant interviews with head-teachers, School Management Committee members (in schools that have an SMC), county education directors, PSS-Trained teachers, parents/guardians, implementing partners such as War Child Holland, Intersos, CINA (Community in Need Aid), and UNICEF field level child protection and/or education officers.
Our team built on existing survey instruments that assessed well-being and academic performance, modifying them to be appropriate to the South Sudanese context. We used a two-stage sampling approach to identify 3000 student respondents based on sample sizes estimated from an a priori power analysis comparing treatment and control schools. We also accessed historical information from the EGRA/EGMA that was completed jointly by USAID/Montrose in 2015 and 2017, which compared a non-equivalent number of treatment/control schools to estimate impact of the intervention early on in its implementation.
1 United Nations Children’s Fund. Operational guidelines on community based mental health and psychosocial support in humanitarian settings: Three-tiered support for children and families (field test version). New York, UNICEF, 2018. 2 Goodman R (1997) The Strengths and Difficulties Questionnaire: A Research Note. Journal of Child Psychology and Psychiatry, 38, 581-586. 3 CYRM: Child and Youth Resilience Measure. Halifax: Resilience Research Centre 4 The KIDSCREEN Group Europe. (2006). The KIDSCREEN Questionnaires - Quality of life questionnaires for children and adolescents. Handbook. Lengerich: Pabst Science Publishers. 5 California Department of Education. 2007. California Healthy Kids Survey, (Non‑Mandatory Resilience and Youth Development Questions in Module B); New Economics Forum. 2009. A guide to measuring children’s wellbeing. London: NEF; New Philanthropy Capital. 2011. Wellbeing measure.

Impact Evaluation
7
Data Collection Schedule
PHASE 1- April- June, 2019 PHASE II- August- November, 2019
Student Surveys P3, P6 (2982 students, 64 schools)
Student Assessments (629 students, 64 schools)
Teacher Surveys (584 teacher, 64 schools) Case Studies (5 Treatment Schools in 5 states)
Historical EGRA 2015, 2017 review
Summary of key results
Overall, we find significant differences between students in treatment and control schools for two of the three PSS factors. We find positive impacts for social well-being, and negative impacts for emotional well-being. We see overall positive significant differences in outcomes of responsibility, care of tasks, and resilience for adolescents, but no significant differences in pressure, positive self-perception, friendship and support, and grit. Among teachers, we see differences in teachers’ perception of changes in student/classroom culture. We see overall positive significant differences in outcomes of PSS training application, observed change in students, and observed change in self.
There are significant positive impacts of the intervention on students’ social and emotional well-being, including sub-items such as: being responsible, caring for tasks, getting through hard times, friendship, support, and grit. The positive impacts of social well-being are consistent across genders, while the positive impact on emotional well-being is largely driven by differential impacts on boys; there is no significant difference in emotional well-being for girls in treatment vs. control schools. The evaluation highlighted differences in implementation of PSS between sites and states in South Sudan; and documented teacher perceptions about the possible impacts of PSS.
There are no significant differences in resilience/coping between treatment and control school students. Resilience was measured using questions from the CYRM focused on dispute resolution, calming skills, mood understanding, concentration in class, and teacher listening. We discuss the potential explanations for this null difference below (selection bias, direct vs. indirect impact of the treatment) and the likelihood that the positive results we see are even attenuated. There are significant positive impacts of the intervention on students’ aggregate reading assessment scores, largely driven by significant positive differences in letter name identification. However, for math scores, we find significant negative impacts on students’ aggregate math scores, driven by significant negative differences in scores on word problems, level two subtraction, and level one addition.
We see a somewhat similarly complex pattern when comparing treatment and control schools earlier in the lifetime of the intervention (when there were few treatment schools and many more control schools in the 2015 and 2017 EGRA/EGMA administration). We see, for example, significantly higher math performance for students in treatment schools vs. control schools, but this does not hold true in each of the five states included in the analysis. (In part, this may be because of the different sample sizes by state; the samples were not balanced in each state, and we only detected differences in Jonglei and Unity.) We also find that students had significantly higher reading performance in treatment schools than in control schools. We discuss potential explanations for this, including changes in historical context that differentially affected sites that first received the treatment.

Impact Evaluation
8
Qualitative data was collected across the five sites in order to provide contextual information to help better understand the quantitative data around the impact of psychosocial support interventions on students’ well-being and academic performance. According to the case study data, following PSS; (i) teachers, students, and parents/members of PTA or SMC report observing improvement in student behavior, academic performance, and attendance, (ii) teachers and students report observing improvement in teacher preparation and classroom efficacy; and teachers, students, and community members report observing improvement in students peacebuilding skills and ability to diffuse conflict. Finally, qualitative data indicate that in order to be most effective, PSS must be integrated with other community resources and programs (requiring donor coordination). Implications The findings of this evaluation support the inclusion of PSS interventions within education programming in conflict-affected settings. The study identifies meaningful gains in both student well-being and academic performance suggesting the effectiveness of inclusion of PSS in the IEEES activity. The study identified a number key considerations for future research, discussed in detail in the final section of this report, including the need for clearer distinction between control and treatment schools, variability in the degree of implementation and dosage at different sites, collection of baseline of pre- and post- data for the well-being surveys, the importance of capacity development and training for teachers, and the impact of ongoing conflict, displacement, and seasonal school closures on effective data collection. The study also helps to identify critical areas for further study including examination of the roll out and implementation of the national level teacher training guide in psychosocial support developed by UNICEF and implementation partners (in progress); the relationship between PSS and other donor-supported initiatives (such as provision of food, WASH programs, Peacebuilding, GBV programs); and potential long term academic impact of PSS through pre and post academic assessments.

Impact Evaluation
9
Section 1: Introduction and Background of UNICEF IEEES In South Sudan, challenges in accessing quality education for children and youth in South Sudan that existed prior to independence have only been exacerbated by outbreaks of violence in December 2013 and July 2016. The conflict has resulted in displacement, increase in school dropouts, and consistently low enrollment in education services. UNICEF estimates that over 2.2 million South Sudanese children, nearly one-third of the country’s primary school-aged population, are out of school, making South Sudan one of the countries with the largest number of out-of-school children (OOSC) in the world. As a result of conflict, many children and youth have suffered the psychological effects of experiencing or witnessing violence, fleeing their homes, or living in difficult conditions in United Nations Protection of Civilian (POC) camps. In addition to addressing the academic needs of children and youth, it is essential to address the social and emotional well-being of affected children and youth in South Sudan.
UNICEF’s Integrated Essential Emergency Education Services (IEEES) activity addresses a critical gap in South Sudan between humanitarian and development programming and promotes sustainable learning opportunities for vulnerable children and youth. The goals of the project include supporting formal and non-formal learning options and building resilience and recovery by protecting children and youth from gender-based violence and mitigating the effects of violence in and around school communities. The project also provides for education sector-specific deficiencies in the teaching force, conflict-sensitive teaching and learning materials and stemming the soaring school drop-out rates as a result of flight, displacement and insecurity among resident communities, returnees and Internally Displaced Populations (IDPs). The IEEES activity addresses these challenges by: 1) increasing equitable access by restoring and expanding the availability of safe and appropriate learning opportunities; 2) improving instruction in and increasing application of essential skills (reading, math, life skills and social and emotional competencies); and 3) and improving recovery and resilience through linking education, health, water and livelihoods support and providing psychosocial services to children, youth and their families, including victims of gender-based violence. This study is not an evaluation of the entire IEEES activity, nor is it meant to serve as a performance evaluation; it focuses solely on the impact of the psychosocial support interventions as one component of the overall project. Previous evaluations have noted that the education sector has not harnessed the strength and reach of psychosocial support and social and emotional learning education programs in conflict settings (Blair, 2002; Diamond & Lee, 2011; Durlak, Weissberg, Dymnicki, Taylor, & Schellinger, 2011; Ursache, Blair, & Raver, 2012). Although some SEL programs have improved academic achievement (e.g., Jones, Brown, & Aber, 2011; Raver et al., 2011), others have shown no impact on children’s academic outcomes (Catalano, Berglund, Ryan, Lonczak, & Hawkins, 2002; Greenberg et al., 2003; Spivak & Farran, 2014). As these studies were conducted in different countries and contexts, a better understanding of how these assumptions play out in South Sudan will be explored. Hence, in addition to assessing the impact of psychosocial support on general well-being, a significant amount of effort was spent on isolating the impact this type of additive component has on children’s acquisition of academic skills, specifically reading and math.

Impact Evaluation
10
Section 2: Methodology 2.1 Impact Evaluation and Rationale
The IEEES program was guided by a theory of change, which stated that if children in conflict affected settings are provided with psychosocial support (PSS) through emergency education programs, they will see improvement in their psychosocial and social-emotional learning (SEL) skills6, as well as in their academic performance. This impact evaluation sought to test this theory by measuring the impact of the psychosocial support interventions offered by the UNICEF IEEES Activity. A mixed-methods, quasi-experimental design was adopted that compared sites where the PSS interventions were being incorporated more intentionally during the school day or as part of the curriculum (i.e., ‘Intervention’ or ‘Treatment’ schools) to those where this was not being done (i.e., ‘Control’ schools). In some cases control schools may have included some PSS activities because teachers had previously been trained or through different programs (not part of IEEES.) 2.2 Desk Review
A preliminary study of existing was conducted to offer the research team background context for the evaluation. The desk review analyzed existing activity data such as: policies, school curricula, teacher training curricula, school inspections reports, recent examination reports and other Ministry of General Instruction and Education (MoGEI) documents that were developed in support of psychosocial and SEL-skills education. Contextual data on sites was provided through the Rapid Education and Risk Analysis (RERA) https://www.eccnetwork.net/sites/default/files/media/file/RERA_South_Sudan.pdf report conducted by USAID. The desk review also included previous EGRA and EGMA data (2015 and 2017) from PSS intervention and non-intervention schools, in order to draw conclusions about the possible impact of PSS on academic performance. Analysis of the previous EGRA and EGMA data result in a separate report which is included as Appendix 9. 2.3 Study Sites
Based on input from UNICEF and USAID on the implementation of the IEEES activities, five states (Upper Nile, Jonglei, Unity, Central Equatoria and Western Equatoria) were selected for the evaluation. Study sites followed the path of implementation, which was focused on providing PSS to the most conflict affected states and counties first. Sixty-four ‘intervention’ and ‘control’ schools across the 5 states were selected to participate in the quantitative arm of the study. Implementation varied by state so representation of schools was not equal among the 5 states. Included in this arm were: (i) Two types of surveys on PSS outcomes administered among students and teachers and (ii) a modified EGRA/EGMA academic assessment administered among primary 5 students. Primary 5 was selected after conducting a pilot with P3 students where reading levels were too low to successfully conduct the assessment. In addition to the quantitative arm of the study, 5 ‘intervention’ schools (one in each of the 5 states) were further purposefully selected from the 64 based on criteria such as implementation of PSS, accessibility, and school type, as case study sites to provide more insight into the context and implementation of PSS activities and their impact. The study team collaboratively sought input and feedback from the USAID South Sudan Mission, UNICEF and its Implementing Partners on the selection of intervention and control schools in each of the states. The key factor considered in schools selection was recommendation by UNICEF as a study site due to implementation. Additional factors such as accessibility and safety/security were also considered as clusters of schools were identified in key areas. A larger number of schools than those ultimately needed were listed in case there were any difficulties in accessing some of the schools. (See Appendix 1 for the list of Schools)
6 Psychosocial support, or “PSS”, refers to the “processes and actions that promote the holistic wellbeing of people in their social world. It includes support provided by family and friends” (INEE, 2010a, p. 121), while Social and emotional learning, or “SEL”, has been defined as the process of acquiring core competencies to recognize and manage emotions, set and achieve goals, appreciate the perspectives of others, establish and maintain positive relationships, make responsible decisions, and handle interpersonal situations constructively” (Elias, Zins, Weissberg et al., 1997).

Impact Evaluation
11
2.4 Sample Selection Student and Teacher Survey
This study is a quasi-experimental design rather than a randomized control trial (RCT) because schools were selected by the program agency/implementing partners and not randomly assigned to treatment status. This selection was done to prioritize the highest needs areas first, including the highest conflict areas. We selected treatment and control schools to the best of our team’s ability to identify schools that were comparable in terms of physical and human resources, experiences with conflict, and other relevant factors. We gathered student background as well as extensive background information from teachers at the school in order to control for and potentially explain systematic differences in outcomes we observe.
Student surveys were conducted among primary 3 and primary 6 students in all of the 64 schools. These grades were selected in order to gauge the impact of PSS interventions on well-being across older and younger students. While piloting the assessment, it was determined that many students below P3 would not be able to read and comprehend the assessment, and that many schools across the country could not offer a sufficient number of students in grades higher than P6. In each school 15 students were randomly selected from P3 and 35 from P6. Surveys were administered by an enumerator and a research associate for each of the classes. A total of 2,982 student surveys were completed, as some schools did not have enough students for the full sample. Teacher surveys were administered to approximately 10 randomly selected teachers at each school sampled across the 64 total schools. A total of 584 teachers/facilitators were surveyed as not every school had 10 teachers available. Academic Assessment
A total of 10 primary students (mixed 5 boys and 5 girls) were randomly selected from the class attendance list in each of the (64) schools. A total of 629 students were given the assessment, as not all schools were large enough to provide a sample of 10. A complete EGRA/EGMA-based academic assessment tool, which consisted of both a literacy and numeracy component was administered to each of the selected students by a pair of enumerators or an enumerator and a research associate. While the initial plan was to match the assessment sample to the grade level sample for the surveys (P3 and P6), it became apparent in pilot testing with students in P3, P4, P5 and P6 that P3 students lacked the basic literacy skills to allow for any effective measurement at the intervention level given that the evaluation was measuring just the PSS component of the larger Activity. Using a slightly higher grade-level helped account for the high variability between schools based on location, while balancing the risk of students over-performing by targeting P6 students. As a result, and in consultation with UNICEF and USAID, it was decided that the academic assessment should focus on P5 students, which allowed the team to apply a validated tool adapted to the unique characteristics of a humanitarian context like South Sudan, while still being able to detect minute, intervention-level changes. Case Study In order to provide supporting information in greater depth, we have also selected 5 case study sites (one school receiving PSS from each of the 5 participating states) where we have gathered qualitative information through focus groups and key information interviews. Focus groups included School Management Committees or Parent Teacher Associations (where applicable), Teachers, and Students (youth ages 11-17). Key informant interviews sought information from head teachers, county education directors, implementing partners, and UNICEF field level child protection and/or education officers. The purpose of the case studies is to develop a deeper understanding of the implementation of PSS in schools, including the perspectives of a variety of stakeholders. Key Informants for the case study sites including country education officers or implementing partners and UNICEF staff were identified by MoGEI or UNICEF respectively. Adult participants (teachers, SMC or PTA members) in the case study were selected by school leaders based on familiarity with or participation in the PSS activities as the goal of the case study was to understand implementation of PSS in treatment schools. Students participating in FGD’s were selected randomly from a class list provided by the head teacher.

Impact Evaluation
12
2.5 Quantitative Data Collection Quantitative data was collected in two rounds, from April to June 2019 and from August to
November 2019. During the first round of data collection, quantitative data was collected to assess the impact of PSS activities on psychosocial well-being through surveys sampled among students and teachers in treatment and control schools. The second round of quantitative data collection focused primarily on assessing the impact of PSS on academic performance through a literacy and numeracy assessment. Student Surveys
In order to support ease of data collection in the field, paper copies of the survey questionnaires were printed for administration. The surveys were administered by research associates with support provided by enumerators who were native speakers of the local language in the regions. The research associates and enumerators collected the demographic data and the PSS instrument information. Both traveled to peri-urban and rural areas to survey treatment schools and corresponding control schools. The support, translation, and supervision provided by the enumerators and research associates was very effective, ultimately achieving a high response rate of 99.16%. All data collected from the field were scanned and saved in a secure repository. Scanned files were then entered into Qualtrics (an online survey tool) for analysis by the multi-national team and reviewed by an assigned data custodian. The first-round student survey (Appendix 4) captured three main PSS domains through 36 questions, namely: Emotional/Personal Well-being, Social Well-being and Ability to Cope (Resilience). More specifically, the survey included questions on key demographic factors, attitudes towards learning and classroom climate, and psychosocial attitudes and behaviors, drawing largely from the Strengths and Difficulties Questionnaire (SDQ) and the Child and Youth Resilience Measure (CYRM[MOU3]). These questions were chosen or developed in order to capture basic emotional states that relate to child wellbeing, and behaviors that are observable and relevant to children in South Sudan. Measures of psychosocial problems such as depression or PTSD were not included, as the IEEES intervention does not target these problems. The questions included in the survey were selected during a consultative workshop held in Uganda with the local (South Sudanese), the LASER PULSE research team, and stakeholder representatives from the South Sudan USAID mission and UNICEF South Sudan and were refined through a series of follow-up discussions to ensure cultural and contextual appropriateness. These questions were also aligned with monitoring and evaluation tools that are included in the UNICEF PSS Teacher Manual, to ensure the evaluation would not look for changes that are outside the objectives of the activities. Additionally, while the PSS activities address a broad range of aspects, the domains selected in the consultative process can be mapped onto core SEL competencies (see Appendix 11: Domains of Wellbeing, see Appendix 4 for the student survey). The final survey was validated in a pilot among 210 P3 and P8 students across three schools in Juba. Once the research team expanded into schools beyond Juba, they were unable to find large enough numbers of students enrolled at the P8 level and changed the plan to conduct the survey with P6 students instead. The student surveys were administered by two people (one enumerator and one research associate) for each of the classes in all the schools. Survey time varied by school but took approximately one hour. The survey questions and response options were read out loud and translated into the local languages for the students. Surveys translations were read aloud in the local language and students responded in written form. Surveys were then collected (with deidentified locator numbers) and entered into an online system upon return to Juba for analysis and creation of a comprehensive report. Original copies of the surveys are securely stored in a locked cabinet at the local office in Juba. Teacher Surveys
Surveys (Appendix 5) were also completed by the corresponding teachers of the classes where students were surveyed in each of the 64 schools. Approximately 10 teachers were surveyed per school, though some smaller schools with fewer teachers had less than 10. A total of 584 teachers were surveyed. The teacher surveys included demographic background questions (age, gender, level of education, teaching experience, mother tongue, language of instruction) as well as questions on what PSS training they had

Impact Evaluation
13
received (if any), who conducted training, their experiences with implementation of PSS activities, and general attitudes towards teaching and classroom management. Literacy and Numeracy Assessment
A literacy and numeracy assessment adapted from the EGRA and EGMA tests previously used in South Sudan was administered among primary 5 students from the same intervention and control schools included during the first phase of data collection. Academic outcomes were measured via the adapted versions of the Early Grade Reading Assessment (EGRA) and Early Grade Math Assessment (EGMA) tools (Appendix 10). Within each of these two constructs, there were a number of sub-domains. The math assessment had subdomains of number identification, quantity discrimination, missing numbers, addition levels one and two, subtraction levels one and two, and word problems. The reading assessment had subdomains of letter name identification, familiar word identification, oral reading fluency, reading comprehension, listening comprehension, and vocabulary. The original assessment was initially piloted in a school in Juba among P3, P4, P5 and P6 students. Feedback from the pilot was used to inform revisions to the assessment tools, including ways to shorten the length of time spent on the assessment. A decision to conduct the survey among primary 5 students instead of primary 3 students was made following the feedback from the pilot and further consultations with the research team in order to ensure that the assessment could detect the impact of PSS actions on the educational outcomes at the intervention level, particularly given the wide range of competencies of students across urban/rural and state-level divides. Assessments took place one-on-one with students, during the school day, and took approximately one hour each. The literacy component of the assessment including instructions was administered in English, which South Sudan has established as the medium of instruction and permitted consistency among the literacy assessment. That said, the instructions for the numeracy component was directly translated into one of the main local languages (Arabic, Zande, Dinka, Nuer, or Shilluk) by local enumerators as required by the student being assessed, since the quality of English instruction varied greatly between states, and in order to secure a clearer read on math skills. 2.6 Qualitative Data Collection
Key Informant Interviews (Appendix 6) were conducted in 5 case study sites (one in each state) to provide supporting information on the context and implementation of PSS activities. Key informant interviews were conducted with the following:
● An implementing partner in each of the case study sites identified by UNICEF (such as War Child Holland, CINA, INTERSOS)
● The County Education Director in each case study site ● The Head Teacher/School Management Committee members of a selected ‘intervention’
school in each case study site ● UNICEF field level child protection and/or education officers ● PSS-trained teacher in each of the case study sites selected by school leadership ● Guardians/parents or members of SMC/PTA when available in each of the case study sites
selected by school leadership Subjects were asked about their knowledge of the PSS interventions and perceptions of the impact the interventions had on students. Two Focus Group Discussions (FGDs) were conducted in each of the 5 case study sites and consisted of 5 boys and 5 girls randomly selected from among primary 6 pupils. The FGDs were conducted with groups separated by gender. FGD questions focused included the following (with further clarifying probes):

Impact Evaluation
14
1) Besides academic learning like reading and math, tell me about activities that you are engaged in while at school (or child-friendly spaces) (Give specific examples such as games, arts, dance, discussions, roles plays, etc.)
2) Have you felt any difference/change in yourself, how you relate to others since you have been having these activities?
3) When you were at the school/CFS, how do you feel? (How does the school/CFS make you feel?) 4) Is there anything else you would like to say or ask about the things we have talked about?
The FGD protocol was reviewed by a child protection specialist in order to avoid unintended harm. 2.7 Ethical Considerations Consent to conduct the evaluation across the 5 states was sought from the local government through the MOGEI and Bureau of Statistics in South Sudan, as well as from the USAID South Sudan Mission and UNICEF South Sudan. A local research team of 5 Research Associates and 8-10 enumerators were on-boarded for the evaluation and trained in conduct of research ethically prior to each round of data collection. 2.8 Data Analysis
The quantitative survey for students was scored based on the responses given, where responders graded their level of agreement to the survey statements along a five-point Likert scale. The final survey items were categorized into three sections. Section one (10 items) collected demographic information as well as proxy socio-economic indicator variables such as frequency of meals. Section two (20 items) was a general well-being section that was intended for all student respondents, and Section three was a 6-item section with additional questions specifically included for adolescents. In total, 26 items specific to the measurement of well-being were adapted from validated instruments in the literature, from UNICEF’s monitoring and evaluation tool, or from concepts identified by the South Sudanese researchers as relevant to the context for example:
10h). In the last two weeks, have you been able to concentrate or pay attention in the classroom? 1. Never 2. Sometimes 3. Most of the time 4. All the time
(see Appendix 3 for full list). Section one was worded and scored on a 5-point scale while all 26 items in sections 2 and 3 were worded and scored on a 4-point agreement Likert scale (1 = strongly disagree, 2 = disagree, 3 = agree, and 4 = strongly agree). No neutral response or reverse response items were provided in the questionnaires. Details on Sampling and Statistical Power Analysis
We employed a two-stage sampling strategy in this study. First, 64 schools were purposely sampled from 5 states (Central Equatoria, Western Equatoria, Upper Nile, Unity, Jonglei) within South Sudan that had the potential of offering both treatment and control schools. The final school selection comprised 36 treatment schools who had, at the time of the study, received the PSS intervention (targeted teacher training by UNICEF and implementing partners) and 28 control schools that had not but were located in relatively close proximity to the treatment schools or might have otherwise shared a similar profile to them. Most of the schools (even the control schools) contained teachers who had previously been trained in PSS. What differentiated the treatment schools from the control schools was the inclusion of a class or sessions during the school day where children would have received more dedicated and purposeful PSS. Otherwise, teachers in control schools were meant to integrate their PSS training throughout other class periods or during other routine interaction with students.

Impact Evaluation
15
There have been seven hundred sixty-one (761) schools and temporary learning spaces (TLS) that have now been supported through the IEEES program, but in order to efficiently use resources for this project, we relied on an a priori power analysis to determine a reasonable number of schools to sample. We utilized a two-stage sampling approach. After selecting the five states that would be included in this analysis to provide a broad geographic picture of the intervention, we first identified a list of treatment and control schools. Upon visiting the schools, enumerators would then sample students from P3 and P6 via a mix of random and convenience sampling, limited to students present on the day of the site visit. Originally, we targeted P8, but because an insufficient number of students were studying at the P8 level in some schools, this was amended.
There are few resources that can provide recommendations on the requisite parameters for a power analysis, so we describe our approach in detail here for transparency and also to provide a baseline for future work that builds on ours. We looked to reports of PSS interventions in other humanitarian or development contexts in Sub-Saharan Africa, including (Kelcey et al., 2016; Handa et al., 2018) (cite). A reasonable range for potential effect sizes for PSS outcomes was δ = 0.18-0.22. Given that the treatment we study is at the group (school) level, it was all the more important for us to take into account intra-class correlation (ICC). Again, given (limited) related literature in the region, we incorporated into our power analysis estimates of either ⍴ = 0.01-0.05. Finally, we planned to gather student background data and teacher background data, so we would be able to include variance explained by level-2 covariates, which we estimated as ranging from 0.1-0.3. This gave us a conservative set of bounds of a necessary number of schools between 52-78. We achieved a total number of schools of 64, well within this range (Appendix 2 includes figure showing power analyses).

Impact Evaluation
16
Section 3: Evaluation Findings 3.1 Quantitative Findings Psychosocial Support and Student Well-Being
Question 1: What is the impact of the intervention on psychosocial capabilities for using knowledge (critical thinking, problem-solving), for being decisive and resilient (decision-making, motivation, resilience), and for living together (communication, empathy)?
● Do interventions impact children’s psychosocial skills and knowledge (e.g. coping skills, conflict resolution skills)?
● Do interventions impact children’s attitudes and dispositions (feelings of belonging, tendency toward violence vs. peaceful resolution)?
● Do interventions impact children’s feelings of safety and well-being? Analytic Approach
For each of the two research aims (PSS and academic outcomes), we first provide information on the descriptive statistics of interest, including a description of the student population that completed the surveys and descriptive statistics of the outcome of interest. We describe the factor loadings and subdomains for the outcomes we ultimately use. Then, we describe the results of inferential tests of differences between treatment and control school students. Finally, to begin to hypothesize about potential systematic differences, we disaggregate by other factors of interest. Three PSS constructs (and subdomains/questions)
Our combined South Sudanese and international team identified three PSS constructs that were most relevant to measure for South Sudanese students’ well-being: emotional well-being, social well-being, and resilience/coping. We conducted confirmatory factor analysis to determine whether the factor structure that has been validated elsewhere is also present for respondents in South Sudan. After finding that the question loading did not meet acceptable thresholds, we conducted exploratory factor analysis to identify a more fitting structure. Subsets of questions were loaded onto different constructs, but overall, we still found the three factors of emotional well-being, social well-being, and resilience/coping were valid. We use the revised question weighting in our outcomes in this report. This process is described in extensive detail in one of the journal articles resulting from this project, which is as of yet unpublished and under review at the Journal of Education in Emergencies.7 3.1.1 Psychosocial Support Outcomes
The PSS instrument was administered to 64 schools across 5 states, ultimately gathering data from 2982 students in grades P3 and P6. The majority of students responding were male (61%), and the majority were in P3 (67%). There were more treatment schools in the PSS sample than control schools (56%). Table 1 provides more detail on the absolute numbers and percentages for PSS schools and student respondents.
7 Olayemi, M., Tucker, M., Choul, M., Purekal, T., Benitez, A., Wheaton, W., & DeBoer, J. (under review). Developing A Tool to Measure Children’s Well-being Outcomes and Evaluate a PSS Intervention in South Sudan. Journal on Education in Emergencies- Special Issue on Education on PSS and SEL

Impact Evaluation
17
Table 1. Descriptive statistics of students
Category Groups Frequency Percentage (%)
Students (n = 2982)
Intervention Status Control 1200 40
Treatment 1782 60
Sex Male 1814 61
Female 1160 39
Class P3 991 67
P6 1987 33
State Unity 1042 35
Jonglei 780 26
Upper Nile 251 8.5
Western Equatoria 420 14
Central Equatoria 489 16.5
Schools (n = 64)
Intervention Status Control 28 44
Treatment 36 56
Overall Differences in PSS Outcomes We use a quasi-experimental research design and also gather information on important control
variables to attempt to recover causal estimates of the impact of the intervention on psychosocial (PSS) or well-being outcomes and academic outcomes. We conduct two-sample comparison tests of aggregate scores, but we also present scores disaggregated by subdomain, gender, POC status, urbanicity, school type, class, and state in order to better understand systematic differences and comparability between the treatment/control groups.
Overall, we find significant differences between students in treatment and control schools for two of the three PSS factors. We find positive impacts for social well-being and emotional well-being, and no evidence of differences for resilience/coping skills. Note: Mean PSS score is the average of the questions described above, which are all on a Likert scale of 1 – 4. These score students’ frequency of behaviors (1 = Never, 2 = Sometimes, 3 = Most of the Time, 4 = Always), and they are coded so that higher is the “positive” interpretation of the question. We conduct 1-tailed t-tests, since we are interested in testing the alternative hypothesis that treatment school students performed better on PSS outcomes, and this essentially sets a higher bar to draw conclusions about significant positive results.

Impact Evaluation
18
Table 2. Inferential statistics results of students’ overall well-being outcomes
Construct Treatment (n=1782)
Control (n=1200)
Effect size of difference (Cohen)
P-value
Social Well Being Equal variances assumed (Student)
3.182 3.006 0.31 <0.001
Emotional Well-being Equal variances not assumed (Welch)
3.190 3.128 0.15 <0.001
Resilience/Coping Equal variances assumed (Student)
2.845 2.821 NA 0.171
The disaggregation of the results by gender, class, urbanicity, school type, and location (POC status and States) is provided in Appendix 8 Differences in Well-being Outcomes for Adolescents
The questionnaire included additional questions appropriate only for the adolescent age group. We see overall positive significant differences in outcomes of responsibility, care of tasks, and resilience for adolescents, but no significant differences in pressure, positive self-perception, friendship and support, and grit.
Table 3. Inferential statistics results of adolescent students’ well-being outcomes
Construct Treatment (n=1232)
Control (n=755)
Effect size of difference (Cohen)
p-value
Responsibility Equal variances assumed (Student)
3.191 2.993 0.19 <0.001
Pressure (reverse-coded) Equal variances not assumed (Welch)
2.902 2.860 NA 0.174
Care of tasks Equal variances assumed (Student)
3.378 3.217 0.17 <0.001
Confidence to get through Hard Times Equal variances assumed (Student)
3.106 2.823 0.27 <0.001
Positive Self Perception Equal variances assumed (Student)
3.112 3.156 NA 0.865
Friendship and Support Equal variances assumed (Student)
3.261 3.197 NA 0.052
Grit Equal variances assumed (Student)
3.281 3.291 NA 0.635

Impact Evaluation
19
Question 2: What evidence (if any) of changes do teachers perceive in classroom culture/ behavior as a result of interventions? To answer this question, we turn to the school data provided through the teacher surveys
Table 4. Teachers’ descriptive statistics Category Groups Percentage (%)
Treatment (n=267)
Control (n=317)
Overall (n=584)
Sex Male 87 82 84
Female 13 18 16
Location Unity 41 32 36
Jonglei 46 12 28
Upper Nile 5 12 9
Western Equatoria
8 10 9
Central Equatoria 0 34 18
School Type Government 92.5 61 75
Community 7.5 39 25
Trained in PSS No 41 68 56
Yes 59 32 44
Urbanicity Urban 79 83 81
Rural 21 17 19
Note: The descriptive statistics above shows how many teachers are in designated treatment schools and designated control schools. However, the inferential statistical differences presented below are representative of the teachers trained in PSS either implementing activities (treatment) or not implementing activities in their schools (control).

Impact Evaluation
20
Differences in Teachers’ perception of changes in student/classroom culture We see overall positive significant differences in outcomes of PSS training application, observed
change in students, and observed change in self. Table 5. Inferential statistics PSS results from teacher surveys
Construct Treatment (n=158)
Control (n=101)
Effect size of difference (Cohen)
p-value
PSS Training Relevance Equal variances not assumed (Welch)
3.979 3.990 NA 0.464
PSS Training Application Equal variances assumed (Student)
3.304 3.050 0.28 0.013
Observed Change in Students Equal variances not assumed (Welch)
3.304 3.093 0.26 0.027
Observed Change in Self Equal variances not assumed (Welch)
3.443 3.211 0.27 0.021
Change in Students’ School Attendance Equal variances not assumed (Welch)
3.310 3.144 NA 0.133
3.1.2 Academic Findings Question 3: What is the impact of psychosocial support intervention on the EGMA and EGRA assessments scores? 3.1.3 Recent Assessment of Academic Outcomes (2019)
We modified the existing EGRA/EGMA assessments in order to better target the students in the PSS intervention pool. This meant simplifying the literacy assessment to focus less on sounds and more on recall and comprehension and reducing the overall number of questions in order to fit within one hour. The assessments were then piloted to determine what age would provide the best discrimination (ability to distinguish between high performers). We looked for an appropriate age that would cover the content of the assessment but would have both low- and high-scoring students. Ultimately, we only sampled from P5.
Table 6 provides information on the background of the students who took the academic assessments. Again, there were more male students (60%), and the majority of respondents were in treatment schools (57%). These numbers varied slightly for respondents to the EGMA as opposed to the EGRA. Table 6. Descriptive statistics of students (Modified 2019 EGRA/EGMA)
Category Groups Percentage (%)
Students (n = 629)
Intervention Status Control 43

Impact Evaluation
21
Treatment 57
Sex Male 60
Female 40
Class P5 100
POC POC
Non-POC
State Unity 31.5
Jonglei 27
Upper Nile 8
Western Equatoria 17.5
Central Equatoria 16
Schools (n = 63)
Intervention Status Control 44
Treatment 56
We do not provide statistically significant difference results of the academic outcomes
disaggregated by state because of the limitation in sample size. With the exception of Unity and Jonglei, which together comprised about 60% of the overall sample size, the other states faced logistical challenges. Two of the 5 states (Central Equatoria, Western Equatoria) had control student sample sizes of 50 or fewer. In Upper Nile, only 30 students were sampled in the treatment schools, and 20 students in the control schools. Using recommendations provided in the literature, we decided that these sample sizes were insufficient to report meaningful statistically significant differences between the treatment and control groups in these states. Note, we focus on sub-task comparisons and inferential statistics tests for each of the chosen 6 EGRA sub-tasks and 8 EGMA sub-tasks. As per established EGRA/EGMA assessment interpretation guidance, we do not report aggregated scores here. However, we did make modifications to the assessment administration process, so we do not have the same level of validity evidence as established protocols for the 2019 data we focus on for this study. Current (2019) Modified EGRA and EGMA Results We find significant positive differences for students at treatment schools in the sub-task of letter name identification outcomes (Table 7.) This is, however, a small effect size (0.16).

Impact Evaluation
22
Table 7. Inferential statistics results of Modified EGRA (2019)
Construct Treatment (n=361)
Control (n=268)
Effect size of difference (Cohen)
p-value
Letter Name Identification Equal variances assumed (Student)
79.275 75.498 0.16 0.023
Familiar Word Identification Equal variances assumed (Student)
36.472 34.294 NA 0.065
Oral Reading Fluency Equal variances assumed (Student)
39.331 36.866 NA 0.087
Reading Comprehension Equal variances assumed (Student)
5.800 6.100 NA 0.373
Listening Comprehension Equal variances not assumed (Welch)
1.765 2.024 NA 0.058
English Vocabulary Equal variances assumed (Student)
7.894 7.981 NA 0.372
However, we see significant negative numeracy outcomes for several tasks for treatment schools compared to controls. This is consistent across a number of subdomains: level 1 addition, level 2 subtraction, and word problems (Table 8).
Table 8. Inferential statistics results of modified EGMA (2019)
Construct Treatment (n=361)
Control (n=268)
Effect size of difference (Cohen)
p-value
Number Identification Equal variances not assumed (Welch)
19.030 19.101 NA 0.346
Quantity Discrimination Equal variances not assumed (Welch)
9.573 9.481 NA 0.175
Missing Numbers Equal variances not assumed (Welch)
6.515 6.291 NA 0.139
Addition Level One Equal variances not assumed (Welch)
15.288 16.093 -0.17 0.017
Addition Level Two Equal variances assumed (Student)
4.252 4.250 NA 0.491

Impact Evaluation
23
Subtraction Level One Equal variances assumed (Student)
12.355 12.978 NA 0.163
Subtraction Level Two Equal variances assumed (Student)
3.570 3.808 -0.20 0.006
Word Problems Equal variances not assumed (Welch)
4.778 4.992 -0.21 0.020
Further disaggregation of the results by gender, urbanicity, and school type is provided in Appendix 8. 3.1.4 Past Assessment of Academic Outcomes (2015 and 2017)
We report differences for the 2015 baseline and 2017 end line results conducted with grade P3, and we also look to growth from baseline to end line to make sense of changes observed for treatment vs. control schools. We look at the P3 scores in 2015 and 2017, as the EGRA/EGMA during those years was designed for and conducted with P3 students. We provide these comparisons of treatment/control schools as historical context when the IEEES program was first being rolled out. We are not trying to draw a comparison to the impact evaluation effects we estimate in this study; the research design is distinct, and we collected P5 data based on our current design and the pilot testing we completed (see section 4.1). Differences in 2015 EGRA Outcomes We find significant positive differences for students at treatment schools for multiple subscales on the EGRA (Table 10). We observe medium-size positive differences in letter name identification, familiar word identification, and oral reading passage, and small positive effects for reading comprehension. Table 10. Inferential statistics results of historical EGRA (2015)
Construct Treatment (n=892)
Control (n=203)
Effect size of difference (Cohen)
p-value
Letter Name Identification Equal variances assumed (Student)
53.552 44.300 0.39 <0.001
Familiar Word Identification Equal variances assumed (Welch)
16.502 10.869 0.37 <0.001
Oral Reading Passage Equal variances assumed (Welch)
19.000 12.491 0.37 <0.001
Reading Comprehension Equal variances assumed (Student)
0.823 0.622 0.17 0.014
Listening Comprehension Equal variances not assumed (Student)
1.995 2.075 NA 0.603

Impact Evaluation
24
English Vocabulary Equal variances assumed (Student)
9.039 8.752 NA 0.173
Differences in 2015 EGMA Outcomes We also see significant positive differences in a small number of numeracy outcomes for P3 students at treatment schools compared to control schools (Table 11). We estimated significant positive performances in number identification (medium effect size) and addition level one (small effect size). Table 11. Inferential statistics results of historical EGMA (2015)
Construct Treatment (n=893)
Control (n=202)
Effect size of difference (Cohen)
p-value
Number Identification Equal variances not assumed (Welch)
17.946 16.572 0.38 <0.001
Quantity Discrimination Equal variances not assumed (Welch)
8.525 8.325 NA 0.094
Missing Numbers Equal variances not assumed (Student)
4.342 4.295 NA 0.394
Addition Level One Equal variances not assumed (Student)
12.693 11.786 0.19 0.008
Addition Level Two Equal variances assumed (Student)
2.891 2.924 NA 0.407
Subtraction Level One Equal variances assumed (Student)
9.450 8.962 NA 0.120
Subtraction Level Two Equal variances assumed (Student)
2.356 2.263 NA 0.254
Word Problems Equal variances not assumed (Student)
4.020 3.859 NA 0.106
Differences in 2017 EGRA Outcomes We find significant positive differences for students at treatment schools for letter name identification, familiar word identification, oral reading passage, and reading comprehension (Table 12) There are no significant differences between the two groups in listening comprehension performance, and our 2017 data did not include the English vocabulary subdomain.

Impact Evaluation
25
Table 12. Inferential statistics results of past EGRA (2017)
Construct Treatment (n=251)
Control (n=1064)
Effect size of difference (Cohen)
p-value
Letter Name Identification Equal variances assumed (Welch)
18.438 8.568 0.37 <0.001
Familiar Word Identification Equal variances assumed (Welch)
8.621 3.368 0.38 <0.001
Oral Reading Passage Equal variances assumed (Welch)
7.410 3.196 0.33 <0.001
Reading Comprehension Equal variances assumed (Welch)
0.717 0.239 0.38 <0.001
Listening Comprehension Equal variances not assumed (Student)
3.677 3.607 NA 0.296
English Vocabulary Equal variances assumed (---)
NA NA NA NA
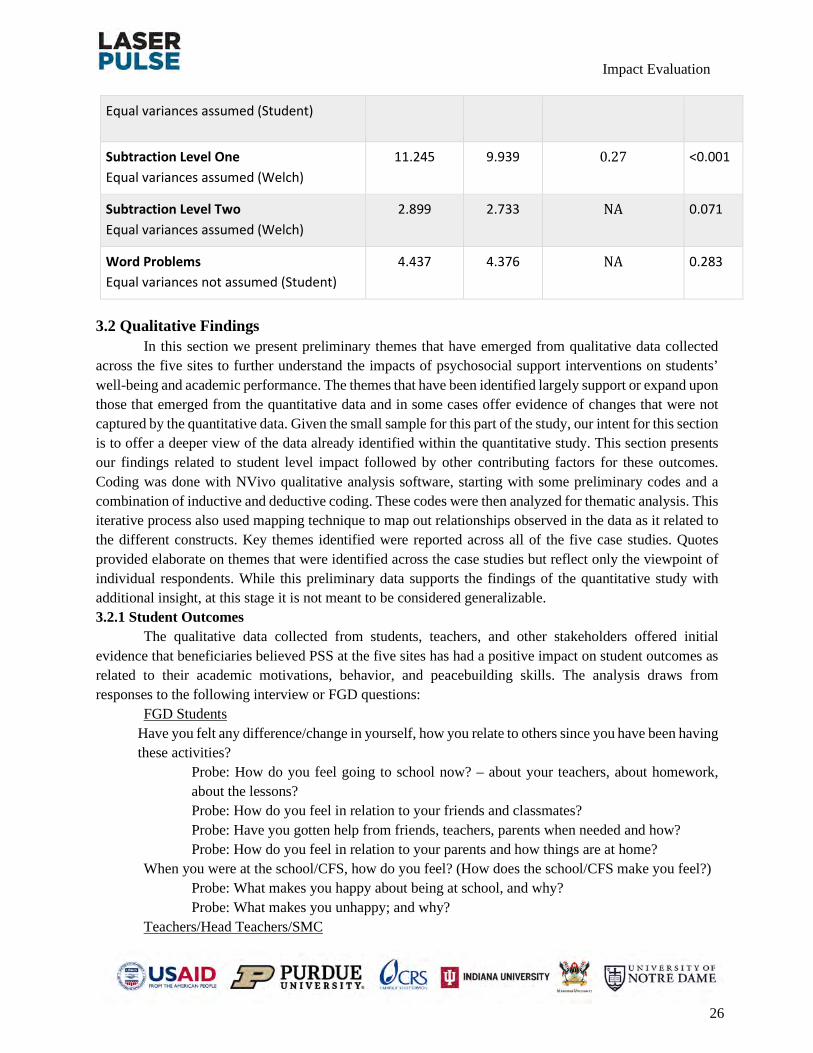
Differences in 2017 EGMA Outcomes We see significant positive differences in multiple subscales for 2017 EGMA for students in treatment schools compared to control. This is consistent across a number of subdomains: number identification, missing numbers, addition level 1, and subtraction level 1 (Table 14). Table 14. Inferential statistics results of past EGMA (2017)
Construct Treatment (n=277)
Control (n=1088)
Effect size of difference (Cohen)
p-value
Number Identification Equal variances not assumed (Welch)
18.116 17.040 0.34 <0.001
Quantity Discrimination Equal variances not assumed (Student)
8.614 8.692 NA 0.275
Missing Numbers Equal variances not assumed (Student)
5.458 5.093 0.16 0.010
Addition Level One Equal variances not assumed (Welch)
13.632 12.665 0.20 0.001
Addition Level Two 3.260 3.314 NA 0.316
Impact Evaluation
26
Equal variances assumed (Student)
Subtraction Level One Equal variances assumed (Welch)
11.245 9.939 0.27 <0.001
Subtraction Level Two Equal variances assumed (Welch)
2.899 2.733 NA 0.071
Word Problems Equal variances not assumed (Student)
4.437 4.376 NA 0.283
3.2 Qualitative Findings
In this section we present preliminary themes that have emerged from qualitative data collected across the five sites to further understand the impacts of psychosocial support interventions on students’ well-being and academic performance. The themes that have been identified largely support or expand upon those that emerged from the quantitative data and in some cases offer evidence of changes that were not captured by the quantitative data. Given the small sample for this part of the study, our intent for this section is to offer a deeper view of the data already identified within the quantitative study. This section presents our findings related to student level impact followed by other contributing factors for these outcomes. Coding was done with NVivo qualitative analysis software, starting with some preliminary codes and a combination of inductive and deductive coding. These codes were then analyzed for thematic analysis. This iterative process also used mapping technique to map out relationships observed in the data as it related to the different constructs. Key themes identified were reported across all of the five case studies. Quotes provided elaborate on themes that were identified across the case studies but reflect only the viewpoint of individual respondents. While this preliminary data supports the findings of the quantitative study with additional insight, at this stage it is not meant to be considered generalizable. 3.2.1 Student Outcomes
The qualitative data collected from students, teachers, and other stakeholders offered initial evidence that beneficiaries believed PSS at the five sites has had a positive impact on student outcomes as related to their academic motivations, behavior, and peacebuilding skills. The analysis draws from responses to the following interview or FGD questions:
FGD Students Have you felt any difference/change in yourself, how you relate to others since you have been having these activities?
Probe: How do you feel going to school now? – about your teachers, about homework, about the lessons? Probe: How do you feel in relation to your friends and classmates? Probe: Have you gotten help from friends, teachers, parents when needed and how? Probe: How do you feel in relation to your parents and how things are at home?
When you were at the school/CFS, how do you feel? (How does the school/CFS make you feel?) Probe: What makes you happy about being at school, and why? Probe: What makes you unhappy; and why?
Teachers/Head Teachers/SMC

Impact Evaluation
27
What changes, if any, have you noticed among your students since you started implementing PSS activities in: a. Students’ behavior since they started participating in these PSS activities? b. Students’ emotions/mood since they started participating in these PSS activities? c. Students’ academic performance since they started participating in these PSS activities? Parent/Guardian/PTA What changes, if any, have you noticed in: a. Your child’s behavior since they started participating in these PSS activities? b. Your child’s emotions/mood since they started participating in these PSS activities? c. Your child’s academic performance since they started participating in these PSS activities? d. Your child’s interest in school/ school-work? e. Your child’s interest in playing and interacting with other children? f. Your child’s willingness to share their worries and challenges with you? County Education Director What do you think of the benefits of this PSS program for the children?
These themes identified from responses to those questions are further explained below: 3.2.2 Perceived Changes in Student Behaviors, Motivations, and Skills
Some of the perceptions of changes in student behavior seen in our data were related to personal awareness of their emotions and behavior, listening, patience and avoiding conflict. The data from the focus groups with the students indicated that they seemed more aware of their emotions (when they feel angry, jealous, sad) and behaviors as students shared different personal examples of their own changes in behavior. The data from the interviews with teachers and headmasters also implied that children's behaviors related to fighting, shouting and arguing with other children seem to have improved. Our data also indicated that students were listening and reporting conflicts to their teachers, were more patient and would change their behavior to diffuse conflict.
Other significant themes that emerged from the fgds were increase in student motivation towards attending school and towards academic learning. The focus groups with the male and female students at the five sites all indicated an increased sense of accomplishment when they (students) achieved academic success. Some parents also noticed the impact of good scores on their children, with one sharing: "they do feel happy when they get good scores and pass in their examination when they get first, second or third in their examination, it brings changes to them, they like it.” Some students, teachers, and parents reported a perception of improved academic skills among students receiving PSS. The school staff perceived that writing skills had improved. One teacher shared,," there is a change even also they love to learn to have progress in learning ... also they have progress in learning, reading books and also... there is improvement in performance academically". Some parents noticed that children were becoming more attentive to their homework," yes there is a change in behavior, the traditional way of going to dancing places is no longer there, they became more attentive to school and their homework". One student shared how her ability to speak and debate in English has improved, “I feel happy because that time when I was in P3 I don’t know how to speak English because I don’t know how to speak in front of people yah and I feel shy but now I don’t fear and I don’t feel shy I talk I am free I don’t

Impact Evaluation
28
fear anyone that is why I like debate” One teacher shared his observation about how children are learning skills to self-regulate their emotions, "I see some changes like now when one child feel angry with other and the other don’t want to fight and that student who don’t want to fight come to teacher and report that case saying to teacher that this boy wanted to fight with me what can I do and the teacher go to that child and tell him not to fight and convince that child in many ways so that they live in the school environment." 3.2.3 Peacebuilding Skills
Peacebuilding is a key theme that emerged from the data and it overlaps with the student outcomes discussed above related to motivations and skills. Students seemed to recognize conflict in their own environments, at school or even while playing sports, and shared stories about how they diffused those situations. Students also realized that schools provide them space to practice peace building, as they get to interact with others from different groups/clans and learn to treat each other respectfully. “Here in Akobo, people know each other you may be taught by a teacher from a particular clan and that clan may have a problem with your clan but because we are in the school you should not hold any grudges against him because of the problem your clan have with their clan no you should treat him as a relative like your brother even with other students you should interact and treat each other as sisters so school changed us, as well as the church, these two institutions are institutions that strengthen relationships."
Students in the FGDs recognized their impact as children, and that they can foster peace and become examples for the elders in their communities. “The games are really good so peace in community is brought about by such children because if children move together and play together even if elders do not understand themselves, children togetherness can bridge their differences” 3.2.4 School Attendance
Key informant interviews with school staff and parents seemed to indicate that they believed enrollment in schools is higher and attendance in schools has increased for both girls and boys and associate that outcome with the provision of PSS. One of the county education directors shared that, "previously the children were not sent to school but now they are sent to school the parents allow them to come to school even the children are in need of education so much than the previous time so the parents now they allow the children to go to school". Parents also seemed to encourage girls to attend schools as depicted in this extract, "I told you about earlier at the beginning before NGOs joined in we the parents who started encouraging our girls to go to school by then UN used to distribute food to schools and the little food they get we encouraged schools’ administration to give little food to girls to take home this encouraged a lot of girls to go to school even though UN distribute food no more, the schools continued to attract a lot of girls". Increased attendance seemed to influence better academic performance as indicated by one headmaster at one of the five case study schools, "Yes, the change it comes when the child come to school always and those who absent sometimes really the level is going to be worse, that why we talk in the (student) parade please don’t be absent, you come because we are to understand your lesson and then when the exam come, he will pass. That is why we talk with those learners and those learners who are always come to school, they are going well." 3.2.5 Contributing Factors
Our qualitative findings showed that there were several factors that impacted student outcomes as part of the PSS program. The role of teacher training and development was an integral factor for student outcomes. Also, the relationships with friends and family also emerged as a strengthening factor for student's social and mental well-being. Lastly, sports and other physical activities seemed to be a critical outlet for students to develop friendships, but also feel "free" as a child. These themes are further elaborated below.

Impact Evaluation
29
3.2.6 PSS Trained Teacher Intervention Teachers reported feeling better prepared as a result of PSS training they received in the following areas:
● observe signs of stress, trauma, and/or fatigue among students ● able to avoid corporal punishment ● calm students down ● intervene in student conflicts ● use variety of different methods to teach subjects FGD responses indicated that students in PSS intervention schools respected their teachers and seemed
to be able to approach them for academic issues. Boys seem to have higher trust in teachers than the girls. Girls seem to have less confidence while approaching the teachers for non-academic issues. 3.2.7 Family Ties
Our data showed that relationships students have with their family members seem to impact their social well-being. Family ties seem to bring a sense of security as children view their parents to support them with food and other essential resources. They also feel encouraged when their parents support them to attend school and do homework. In the focus groups, several students shared that they "felt happy" when they spent time with family members like grandparents and siblings. They also discussed their trusting relationships with their siblings when they needed help.
In the following excerpt a student shared how he felt supported by his father "I trust my parent, the stage I have reached was because of them. If I don’t have shoes or anything if I tell my father he will always provide. I trust my father. I always discuss things with him like I once suggested to him that I would like to go and study in one of the East African countries (Uganda or Kenya). What he told me was that my son I am willing to help you in your study but because of war I have no reliable source of income. If I send you there you will suffer and I was really convinced because no one who can support me there". 3.2.8 Physical Activities (Sports and Games)
Student responses indicated that physical activities offered at CFS like football, volleyball and jump rope seemed to not only influence the students' moods and emotions, but also their attentiveness, their friendships, their ability to practice peace building and their attitude towards hope and freedom. Playing sports made them forget about the conflict and their worries. Multiple students across the five sites noted sports and games in their comments: "If you were having some worries, if you play you forget about all the worries and this is what is good about the games and also you feel active while playing. Even if you were not feeling well before the game when you play you feel well". "I like rope skipping a lot because I play it in school as well as at home because if I feel lazy at any time I will play it and then I will regain my strength if I go back to class I normally feel active and attentive not like before the game". "Yeah, I feel free when I am playing with my friends."

Impact Evaluation
30
Section 4: Challenges, Limitations, Implications, and Recommendations
Overall, the research team was successful in achieving its goals in developing and conducting a large and rigorous study despite significant challenges and limitations including an incredibly ambitious timeline, a complex and fluid environment, and a large and complex team of stakeholders. Throughout the process, we have noted lessons learned that might assist our team or other researchers in designing and implementing effective research on this topic in the future. These are noted below. 4.1 Conducting research in a complex environment
First and foremost, it is essential to understand that the ability to carry out an evaluation of this size and rigor is constrained by the challenges of operating in a conflict affected environment. The safety and security of researchers and subjects was always of utmost priority which may have had some impact on the selection of sites. Local researchers were assigned to collect data in areas that would be safest for them based on identification with ethnic/linguistic groups. Additionally, the aggressive timeline for data collection and analysis for a project of this scale (12 months from the first phase of data collection to the presentation of results) required adherence to a strict schedule which was challenging to manage in a complex and fluid environment. At times, changes had to be made to the data collection schedule due to disruptions related to conflict or when travel in a certain area was deemed insecure or based on other factors related to operating in a complex environment like South Sudan. The collection of data also took place during the rainy season when flooded areas, rough roads and other related challenges hampered movement. Setting appointments with government officials and other stakeholders was a challenge in some areas (i.e. Malakal). Lack of internal regular flights to certain geographies made travel logistics quite complicated. For example, a change in flight schedules meant that researchers arrived in Akobo East though they were scheduled to collect data in Akobo West schools. Given that travel to Akobo West may have been a security concern as well as the difficulty of impassable roads during the rainy season, the selection of schools was adjusted in order to collect data from Akobo East. The schedule required further alteration as schools in Akobo East were only operating for three hours a day. In an environment such as South Sudan, a critical lesson learned was the necessity of flexibility and adaptability. Additionally, it was essential that we had close communication with UNICEF partners in determining study location sites and the ability to make last minute substitutions. 4.2 A strong local research team is a key to success
Early in the process of developing the program design and assigning roles and responsibilities within the research team, the importance of having a strong team of South Sudanese researchers was recognized. Through local connections from past projects, IU was able to quickly mobilize a team of researchers and include their input in the design process at the first workshop in Uganda. This team was led by Dr. Mamour Chuol, a South Sudanese scholar with previous experience in conducting research in South Sudan and 4 additional research associates who had been students in IU’s master’s in education programs. Their leadership was critical to the success of the program. The integration of the local research team was vital from identifying/refining the research questions and instrument development to interpretation of results as they were able to provide context and assist with interpretation based on local knowledge. As the local research team had worked with members of our team previously, we were able to have a rapid start up. However, with additional time, they could have benefitted from additional training and capacity development, particularly related to data analysis in areas with low resources (without data analysis

Impact Evaluation
31
software, for example.) Individuals involved in future research should be trained on every aspect of data collection, inclusive of how to conduct interviews and transcribing. In addition to the research associates, local enumerators were hired at each site to assist with data collection and translation to local languages.
While training was offered for the enumerators, the ability of enumerators to adhere to a rigorous data collection environment and carry out surveys or interviews varied. For future research, a more in-depth selection process and additional training for enumerators would strengthen data collection procedures. Additionally, it should be noted that significant challenges existed in communication between the local team and the U.S. and Uganda based team, particularly when the South Sudan team was in the field collecting data. With unreliable internet service, we were not always able to communicate quickly by email or share documents (downloads were particularly difficult.) Much of the communication was conducted using WhatsApp or through biweekly Zoom calls, when the internet was available. 4.3 Working with multiple institutions and stakeholders
The relationship and communication among stakeholders provided another critical piece of the overall evaluation process. A strength of the evaluation was the inclusion of stakeholders from UNICEF and USAID from the initial design process of the evaluation. However, this was a complex design that included multiple partners/stakeholders both within the evaluation team and on the program implementation side and at times there were significant challenges in effective communication and coordination between the groups. Efforts were made to immediately address any concerns that arose regarding communication or coordination and all stakeholders had a good working relationship. That said, a recommendation for future evaluations with complex organizations and multiple stakeholders would be to establish clear guidance and written protocols for communication early in the process and ensure that all parties are meeting expectations.
The UNICEF model for the IEEES activity relies on a variety of implementing partners such as Intersos, War Child Holland, CINA in the various states and counties, each of which might have a slightly different approach to carrying out the program along with different materials, resources, and curricula. This model can be very effective in that it allows for adaptability and localization; however, it poses a challenge to conducting quasi-experimental research in that it introduces variables. In order to capture the breadth of the program, this study was designed to include a large number of schools spread over five states. While we were able to see some distinct trends, the number of variables mean that additional more targeted research would be necessary in order to draw conclusions about attribution. One area where the impact of the program design on the evaluation is most notable is in seeking clear definitions of control and treatment sites and how schools were selected for treatment. The intent of PSS is to assist first those who are most severely affected by violence so the path of implementation follows the conflict. Since certain schools or areas receiving treatment might have experienced greater conflict and schools in the “control” group might not have received PSS yet because they did not experience the same degree of conflict, the results of the surveys and assessments may be influenced. Given what we understand about the effects we do observe, we think that this selection bias likely attenuated the positive effects we did see and may have masked other effects. In other words, the impact of the intervention would likely be even higher with a “true” treatment/ control comparison. 4.4 Discussion and Recommendations for Further Study
The study identifies meaningful gains in both student well-being and academic performance that suggest the effectiveness of inclusion of PSS in the IEEES activity. As such, the findings of this evaluation support the inclusion of psychosocial support interventions within education programming in conflict-affected settings. As a result of the implementation of the study, several challenges were

Impact Evaluation
32
identified that if addressed could further develop the understanding of PSS interventions such as: the need for clearer distinctions between control and treatment schools; the variability in the degree of implementation at different sites due to differences among implementing partners; and the importance of capacity development and training for teachers. At the time of the data collection, there was great variability among sites, but UNICEF was just introducing a more unified guide for facilitators and conducting a training of trainers https://www.unicef.org/southsudan/media/2271/file (discussed below) which will significantly address these issues and offer opportunity for a more reliable basis for comparison. Additional critical areas for future research that could assist in further understanding of these questions have been identified, for example: Further study on the link between peacebuilding skills and a sense of well being
Future studies might offer further exploration of how changes in attitudes toward peace also contribute the improved wellbeing, emotionally and socially. As this was a salient theme which was not fully explored within the limited qualitative study, it seems worth further exploration in a setting that continues to experience conflict. Do skills for peace building, some of which are built into SEL, also promote a greater sense of safety, support and self-efficacy for children, and hope for the future, while in the classroom? Coordinated teacher training/curriculum
At the time of designing the current study, UNICEF and implementing partners were in the process of rolling out a new national level coordinated facilitator training guide (noted above) in psychosocial support. This process included the publication of the guide as well as the development of a training of trainers (TOT) model. This presents a unique opportunity to follow trainers and teachers during implementation of the same curriculum, which would reduce the number of variables introduced in the current study (due to the different approaches and curricula used by multiple implementing partners.) Understanding the impact of parent/community involvement in schools with PSS
Some children in the current study pointed to their trusting relationships with their parents, or how parents were more willing to send girls to school. Parent involvement reinforces the changes at home and contributes to the supportive environment. As this was not the main focus of the study and captured as part of focus group discussions with students, further research with a larger sample would be required in order to draw significant conclusions. This could be an interesting area to look at differences between schools where parents are more involved, or, if the parents feel supported by the new efforts teachers are making to involve parents. For example, in section 5.2 above, if family ties play a role for children, then might we want to know more about that, and how that influences child improvements. Donor coordination may better support meaningful PSS integration and amplify its effects
Future studies might explore the relationships between other donor-supported initiatives (such as provision of food, WASH programs, GBV programs) in conjunction with psychosocial support. In the qualitative study, numerous informants identified the interplay between a variety of supports in creating a secure and stable environment for children. It would be difficult to attribute the gains that students have made to the inclusion of PSS without considering other inputs. Long term academic impact of psychosocial support
The aggressive timeline of the current study limited our ability to capture growth over time. As such, the current academic assessments present a snapshot of students’ academic achievement as measured by the modified EGRA/EGMA assessments. Through those modified assessments and past scores for the standard assessment for similar schools, we were able to observe broad trends. However, a study more strictly focused on assessing academic impact using the same measurement could be designed to measure

Impact Evaluation
33
growth over a period of time while psychosocial support is being offered through the use of pre and post academic assessments, school examinations, and other measures. This would also be true of designing a study to capture change over time using well-being or psychosocial outcomes by including pre and post surveys in future research or using this study as baseline information.

Impact Evaluation
34
References
Ager, A., Akesson, B., Stark, L., Flouri, E., Okot, B., McCollister, F., & Boothby, N. (n.d.). The impact of the school-based Psychosocial Structured Activities (PSSA) program on conflict-affected children in northern Uganda. Journal of Child Psychology and Psychiatry, 52(11), 1124–1133.
Blair, C. (2002). School readiness: Integrating cognition and emotion in a neurobiological conceptualization of children’s functioning at school entry. American Psychologist, 57(2), 111–127
Catalano, R. F., Berglund, M. L., Ryan, J. A. M., Lonczak, H. S., & Hawkins, J. D. (2002). Positive youth development in the United States: Research findings on evaluations of positive youth development programs. Prevention & Treatment, 5(1)
Diamond, A., & Lee, K. (2011). Interventions shown to Aid Executive Function Development in Children 4–12 Years Old. Science (New York, N.Y.), 333(6045), 959–964.
Durlak, J. A., Weissberg, R. P., Dymnicki, A. B., Taylor, R. D., & Schellinger, K. B. (2011). The Impact of Enhancing Students’ Social and Emotional Learning: A Meta-Analysis of School-Based Universal Interventions: Social and Emotional Learning. Child Development, 82(1), 405–432.
Elias, M. J., Zins, J. E., Weissberg, R. P., Frey, K. S., Greenberg, M. T., Haynes, N. M., Kessler, R., Schwab-Stone, M. E., & Shriver, T. P. (1997). Promoting Social and Emotional Learning: Guidelines for Educators. Association for Supervision and Curriculum Development
Greenberg, M. T., Weissberg, R. P., O’Brien, M. U., Zins, J. E., Fredericks, L., Resnik, H., & Elias, M. J. (2003). Enhancing school-based prevention and youth development through coordinated social, emotional, and academic learning. American Psychologist, 58(6–7), 466–474.
Handa, S., de Hoop, T., Morey, M., & Seidenfeld, D. (2018.). ICC Values in International Development: Evidence across Many Domains in sub- Saharan Africa. 20.
INEE Minimum Standards for Education: Preparedness, Response, Recovery | INEE. (2010). Retrieved June 29, 2020, from https://inee.org/resources/inee-minimum-standards
Jones, S. M., Brown, J. L., & Aber, J. L. (2011). Two-Year Impacts of a Universal School-Based Social-Emotional and Literacy Intervention: An Experiment in Translational Developmental Research. Child Development, 82(2), 533–554.
Jones, S. M., Brown, J. L., Hoglund, W. L. G., & Aber, J. L. (2010). A school-randomized clinical trial of an integrated social-emotional learning and literacy intervention: Impacts after 1 school year. Journal of Consulting and Clinical Psychology, 78(6), 829–842.
Kelcey, B., Shen, Z., & Spybrook, J. (2016). Intraclass Correlation Coefficients for Designing Cluster-Randomized Trials in Sub-Saharan Africa Education. Evaluation Review, 40(6), 500–525.

Impact Evaluation
35
Meyer, D. S., Steinhaus, M., & Stark, D. L. (n.d.). MEASURING IMPACT THROUGH A CHILD PROTECTION INDEX. 84.
Meyer, S., Hermosilla, S., & Stark, L. (n.d.). Time 1 & Time 2 Studies Kiryandongo and Adjumani refugee settlements, Uganda. FINAL REPORT, 120.
Pedersen, D., Kienzler, H., & Guzder, J. (n.d.). Searching for Best Practices: A Systematic Inquiry Into the Nature of Psychosocial Interventions Aimed at Reducing the Mental Health Burden in Conflict and Postconflict Settings. SAGE Open, 5(4), 215824401561516. Spivak, A. L., & Farran, D. C. (2016). Predicting First Graders’ Social Competence from Their Preschool Classroom Interpersonal Context. Early Education and Development, 27(6), 735–750.
Stark, K. D., Humphrey, L. L., Crook, K., & Lewis, K. (1990). Perceived family environments of depressed and anxious children: Child’s and maternal figure’s perspectives. Journal of Abnormal Child Psychology, 18(5), 527–547.
Ursache, A., Blair, C., & Raver, C. C. (2012). The Promotion of Self-Regulation as a Means of Enhancing School Readiness and Early Achievement in Children at Risk for School Failure. Child Development Perspectives, 6(2), 122–128.

Impact Evaluation
36
Appendices Appendix 1: List of Study Sites
Name of School State Site
# of P3 Students surveyed
# of P6 Students surveyed
# of teachers surveyed
Treatment or Control
Kapuri Basic primary school
Central Equatoria Luri 15 36 9 Control
St Paul Nursery and primary school
Central Equatoria Luri 15 35 11 Control
Venus Star Academy Central Equatoria Luri 15 36 10 Control
DMI Holy Cross primary school
Central Equatoria Luri 16 12 8 Control
DMI primary school Central Equatoria Rajaf 15 35 10 Treatment
Hope primary school Central Equatoria Rajaf 15 36 10 Treatment
Mal primary school Central Equatoria Rajaf 15 35 10 Treatment
Future Generation primary school
Central Equatoria Rajaf 16 34 10 Treatment
Unity primary school Central Equatoria Rajaf 0 36 11 Treatment
United primary school Central Equatoria Rajaf 15 0 6 Treatment
Hosanna Nursery and primary school
Central Equatoria Rajaf 15 42 11 Treatment
Langbaar primary school Jonglei Bor 15 28 11 Control
Bor Public primary school Jonglei Bor 15 24 7 Control
Bor A Mixed primary school Jonglei Bor 15 34 10 Control

Impact Evaluation
37
Bor B Complex primary school Jonglei Bor 20 56 10 Control
Alternative Education System (AES) Primary School Jonglei
Akobo East 20 18 5 Control
Rhine Primary School Jonglei Akobo East 19 7 10 Control
Chuei-Keer primary school Jonglei Bor 15 34 10 Treatment
Bor Bright Star primary school Jonglei Bor 15 38 10 Treatment
Jonglei International primary school Jonglei Bor 20 35 10 Treatment
Gakyuom A primary school Jonglei Bor 20 11 8 Treatment
Bor POC primary school Jonglei Bor 20 35 10 Treatment
Anyidi primary school Jonglei Bor 15 35 10 Treatment
Nuktah Primary School Jonglei Akobo East 15 10 10 Treatment
Dilule Primary School Jonglei Akobo East 11 12 10 Treatment
Akobo Boys Primary School Jonglei
Akobo East 15 67 10 Treatment
Akobo Girls Primary School Jonglei Akobo East 15 43 10 Treatment
Akobo Mission Primary School Jonglei
Akobo East 15 13 10 Treatment
Bentiu B primary school Unity Bentiu 15 32 10 Control
Nyuel Juol Primary school Unity Rubkona 15 18 9 Control
Dawa primary school Unity Bentiu 15 19 10 Control
Bir primary school Unity Bentiu 16 21 10 Control

Impact Evaluation
38
Machakos primary school Unity Bentiu 16 4 11 Control
Salamaliza primary school Unity Rubkona 15 10 11 Control
Naam Adult Education Unity Rubkona 15 38 11 Control
Maal Lake NO Adult Education Unity Rubkona 15 26 9 Control
BNFA primary school Unity Rubkona 21 66 11 Control
Ding Ding primary school Unity Rubkona 11 0 8 Control
Liech primary school Unity Bentiu 15 30 10 Treatment
Bentiu A primary school Unity Bentiu 16 15 9 Treatment
Rubkona primary school Unity Rubkona 18 10 11 Treatment
Unity primary school Unity Rubkona 15 33 11 Treatment
Mal primary school Unity Rubkona 16 66 11 Treatment
Eden primary school Unity Rubkona 15 21 11 Treatment
Naath primary school Unity Rubkona 15 64 11 Treatment
Liberty primary school Unity Rubkona 16 58 11 Treatment
Upper Nile primary school Unity Rubkona 20 83 11 Treatment
Liech primary school (POC) Unity Rubkona 21 107 24 Treatment
Good Shepherd primary school Upper Nile Malakal 15 32 11 Control
Dr John Garang primary school Upper Nile Malakal 15 25 10 Control
St. Lwanga primary school Upper Nile Malakal 15 47 11 Control
Sector 2 West primary school Upper Nile Malakal 15 37 10 Treatment
Sector 2 East primary school Upper Nile Malakal 15 35 11 Treatment

Impact Evaluation
39
Naduru primary school Western Equatoria Yambio 16 35 5 Control
Nayure primary school Western Equatoria Yambio 20 0 6 Control
Masiya primary school Western Equatoria Yambio 21 35 7 Control
Seventh Day Adventist primary school
Western Equatoria Yambio 0 30 0 Control
Bright Star Nursery and primary school
Western Equatoria Yambio 20 36 0 Control
Nabagu primary school Western Equatoria Yambio 15 0 5 Treatment
Bakiwiri primary school Western Equatoria Yambio 16 35 3 Treatment
Manguli primary school (Bureamburu)
Western Equatoria Nzara 30 26 6 Treatment
Ikpiro primary school Western Equatoria Yambio 20 0 6 Treatment
Maingbangaru primary school
Western Equatoria Yambio 0 30 2 Treatment
St. Timothy Nursery and primary school
Western Equatoria Nzara 0 35 0 Treatment
Totals 986 1,996 580

Impact Evaluation
40
Appendix 2: Power Analysis
Figure 1. Power Analysis

Impact Evaluation
41
Appendix 3: Factor Loading and Factor Analysis of Survey Items
Social Well Being included questions about students’ self-reported frequency of being in a good mood, engaging in free time activities, having time with friends, having someone to trust, suggesting games, having their parents listen to them, helping others, understanding others, and engaging in their school environment (Figure 3).
Figure 3. Social Well-Being Items

Impact Evaluation
42
Emotional Well Being included questions about feeling helpless, feeling sad, losing one’s temper, being bullied, having bad dreams, and worrying (Figure 4).
Figure 4. Emotional Well-being Outcomes
Resilience/Coping included questions on dispute resolution, calming skills, understanding one’s mood, concentration in class, and teacher listening (Figure 5).
Figure 5. Resilience/Coping Items
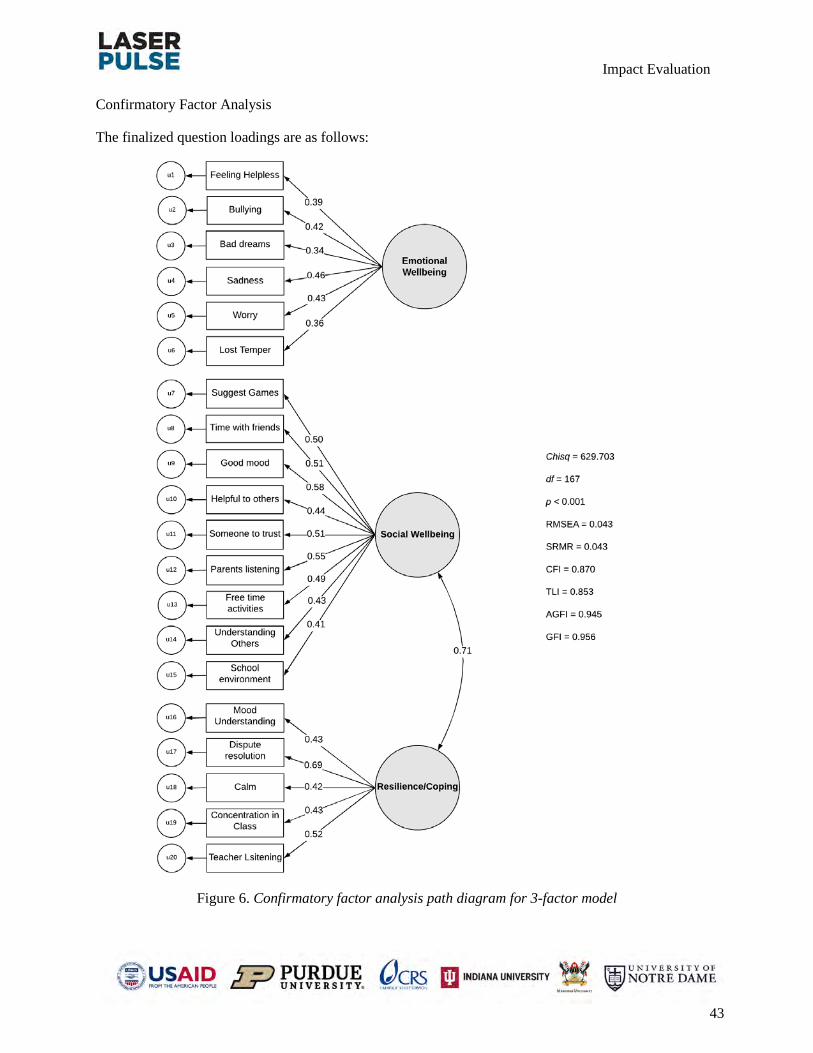
Impact Evaluation
43
Confirmatory Factor Analysis
The finalized question loadings are as follows:
Figure 6. Confirmatory factor analysis path diagram for 3-factor model

Impact Evaluation
44
Appendix 4: Student Survey PSYCHOSOCIAL SUPPORT IMPACT EVALUATION: STUDENT SURVEY
Questionnaire code
Enumerator ID
Date of survey _______/______/________
Name of School
Start time: ______________________ End time: ______________________
General instruction: Answer Questions by ticking, unless otherwise
Q1. Which class are you in?
1. P3
1. P8
Q2. Are you a boy or a girl?
1. Boy
1. Girl
Q3. How old are you? __________ (years)
Q4. What is your mother tongue? _______________________________________
Q5. In what language do you learn in school?
1. English
1. Arabic 2. Other (write here) ______________________________________________

45
Q6. How long have you been in this school?
1. Less than 1 year
2. 1 to 3 years
3. 3 to 5 years
1. 5 or more years
Q7. How many times do you eat breakfast in a week?
1. Not at all
1. 1 to 3 days per week 2. 4 to 6 days per week
3. Every day of the week
Q8. How many times do you eat lunch in a week?
1. Not at all
1. 1 to 3 days per week 2. 4 to 6 days per week
3. Every day of the week
Q9. How many times do you eat supper in a week?
1. Not at all
1. 1 to 3 days per week 2. 4 to 6 days per week
3. Every day of the week
Q10. For each of the following statements, choose one option you agree with. 10a). In the last two weeks, have you been worried about anything?
1. Never
1. Sometimes 2. Most of the time
3. All the time

46
10b). In the last two weeks, have you been able to calm yourself down when you are upset or angry?
1. Never
1. Sometimes 2. Most of the time
3. All the time
10c). In the last two weeks, have you felt that your teacher listened to you and respected your ideas?
1. Never
1. Sometimes 2. Most of the time
3. All the time
10d). In the last two weeks, have you felt sad?
1. Never
1. Sometimes 2. Most of the time
3. All the time
10e). In the past two weeks, have you been able to understand your moods or feelings?
1. Never
1. Sometimes 2. Most of the time
3. All the time 10f). In the last two weeks, have you been bullied in school?
1. Never
1. Sometimes 2. Most of the time
3. All the time

47
10g). In the last two weeks, have you been able to find friendly ways to solve misunderstandings or disputes?
1. Never
1. Sometimes 2. Most of the time
3. All the time
10h). In the last two weeks, have you been able to concentrate or pay attention in the classroom?
1. Never
1. Sometimes 2. Most of the time
3. All the time
10i). In the last two weeks, have you felt that your school is a nice place to be in?
1. Never
1. Sometimes 2. Most of the time
3. All the time
10j). In the last two weeks, have you felt you had someone you trust to help you when you were in need?
1. Never
1. Sometimes 2. Most of the time
3. All the time
10k). In the last two weeks, have you been able to do the things you wanted to do in your free time?
1. Never
1. Sometimes 2. Most of the time
3. All the time

48
10l). In the last two weeks, have you been in a good mood?
1. Never
1. Sometimes 2. Most of the time
3. All the time
10m). In the last two weeks, have you spent time with your friends?
1. Never
1. Sometimes 2. Most of the time
3. All the time 10n). In the last two weeks, have you been helpful to others?
1. Never
1. Sometimes 2. Most of the time
3. All the time 10o). In the last two weeks, have you gotten angry and lost your temper?
1. Never
1. Sometimes 2. Most of the time
3. All the time 10p). In the last two weeks, have you been in situations where you felt helpless?
1. Never
1. Sometimes 2. Most of the time
3. All the time

49
10q). In the last two weeks, have you tried to understand how others feel?
1. Never
1. Sometimes 2. Most of the time
3. All the time
10r). In the last two weeks, have you felt that your parents or guardians listened to you and respected your ideas?
1. Never
1. Sometimes 2. Most of the time
3. All the time
10s). In the last two weeks, have you suggested activities or games to do with your friends?
1. Never
1. Sometimes 2. Most of the time
3. All the time
10t). In the last two weeks, have you had bad dreams? 1. Never
1. Sometimes 2. Most of the time
3. All the time
Q11. For each of the following questions, choose one option you agree with. 11a). In the last two weeks, have you had opportunities to show others that you can act responsibly?
1. Never
2. Sometimes
3. Most of the time
4. All the time

50
11b). In the last two weeks, have you felt under pressure?
1. Never
2. Sometimes
3. Most of the time
4. All the time
11c). In the last two weeks, have you done well taking care of your tasks at home or at school?
1. Never
2. Sometimes
3. Most of the time
4. All the time
11d). Do you believe that your confidence or trust helps you to get through hard times? 1. Never
2. Sometimes
3. Most of the time
4. All the time
Q12. Choose one option for each of the following statements.
12a). A lot of things about me are good. 1. Strongly disagree
2. Disagree
3. Agree
4. Strongly agree
12b). My friends stand by me during difficult times. 1. Strongly disagree
2. Disagree
3. Agree
4. Strongly agree
51
12c). If I really try, I can do almost anything I want to do.
1. Strongly disagree
2. Disagree
3. Agree
4. Strongly agree
Thank you!!

52
Appendix 5: Teacher Survey PSYCHOSOCIAL SUPPORT IMPACT EVALUATION TEACHER SURVEY – To be completed by ALL TEACHERS available on the day of the survey!
Identification
Questionnaire code
Enumerator ID
Field supervisor ID
Date of survey [______] [______] [____________] Day Month Year
Name of School
School PSS status
1. PSS school (Intervention) [____]
2. Non-PSS School (Control)
[____]
Survey site type
1. POC site [____]
2. Non POC site [____]
Type of school
1. Government/Public school [____]
2. Private school [____]
School location
1. Urban [____]
2. Rural [____]
State
1. Upper Nile [____]

53
Start time: ________________________
End time: _________________________
2. Jonglei [____]
3. Unity [____]
4. Western Equatoria [____]
5. Central Equatoria [____]
Name of County

54
Q1. Are you male or female?
1. Male
2. Female
Q2. How old are you? Please write age in years.
________________ (years)
Q3. What is the highest level of education that you have completed? Please tick one
choice.
1. Primary/Elementary education
2. Secondary education
3. Certificate
4. Diploma
5. Bachelor’s degree
6. Master’s degree
7. Other (Specify)
________________________________________________________
Q4. What is your employment status? Please tick one choice.
1. A formal, private employed teacher
2. Government employed teacher
3. A volunteer teacher
4. Community employed teacher
5. Part time teacher

55
Q5. How long have you been a teacher? Please tick one choice.
1. Less than 1 year 2. Between 1 to 3 years 3. Between 3 to 5 years 4. Between 5 to 10 years 5. More than 10 years
Q6. What is your mother tongue? Please write in the space provided.
______________________________________________________________
Q7. In what language do you most frequently teach your classes? Please tick one choice or write in the space provided beside "other"
1. English
2. Arabic 3. Other (write here) _____________________________________
Q8. Did you receive training in Psychosocial Support (PSS)? Please tick one choice.
1. Yes 2. No
***IF YOU ANSWERED ‘NO’ TO THE ABOVE QUESTION, DO NOT BOTHER ANSWERING QUESTIONS 9 to 18, BUT INSTEAD SKIP TO QUESTION 19.
Q9. Which organization gave you the PSS training? Please write in the space below
________________________________________

56
Q10. The following statements ask about the relevance of the PSS training you received with an emphasis on the community, the school, and the students' behaviors. Please tick one choice.
10a). The training was relevant to the school. 1. Strongly disagree
2. Disagree
3. Neutral
4. Agree
5. Strongly agree
10b). The training was aligned to the students’ behaviors in class.
1. Strongly disagree
2. Disagree 3. Neutral
4. Agree 5. Strongly agree
10c). The training was relevant to the community.
1. Strongly disagree
2. Disagree
3. Neutral
4. Agree
5. Strongly agree
Q11. The following statements ask about how you apply the knowledge you received from the PSS training in your classes. Please tick one choice.

57
11a). I apply the knowledge I received in the PSS training to class activities.
1. Never 2. Rarely
3. Most of the time
4. All of the time
11b). I apply the knowledge I received in the PSS training to interactions between me and students.
1. Never
2. Rarely
3. Most of the time
4. All of the time
11c). I apply the knowledge I received in the PSS training to interactions between me and other teachers.
1. Never
2. Rarely
3. Most of the time
4. All of the time
Q12. Since you started implementing PSS activities, how has it affected the delivery of the academic syllabus?
1. I cover less than I planned.
2. I cover the same amount as I planned.
3. I cover more than I planned.
Q13. If you joined a different school, would you continue to apply PSS activities in your class?
1. Yes 2. No
Q14. If no, why? ________________________________________________________

58
Q15. The following statements ask about your impressions on the changes in the students' behaviors after participating in PSS training in your classes. Please tick one choice.
15a). What changes have you observed from the students who participate in PSS with regard to a difference in anger management?
1. Got worse 2. No change
3. Some change 4. A great change
15b). What changes have you observed from the students who participate in PSS with regard to class performance (reading and math)?
1. Got worse 2. No change
3. Some change 4. A great change
15c). What changes have you observed from the students who participate in PSS with regard to a difference in relating with other students?
1. Got worse
2. No change 3. Some change 4. A great change

59
15d). What changes have you observed from the students who participate in PSS with regard to a difference in concentration in class?
1. Got worse 2. No change
3. Some change 4. A great change
15e). What changes have you observed from the students who participate in PSS with regard to a difference in sense of well-being?
1. Got worse
2. No change 3. Some change 4. A great change
Q16. In which of the following areas have girls improved more than boys as a result of PSS implementation? Tick ALL that apply.
1. Anger management 2. Class performance
3. Concentration in class 4. Relating to students
5. Relating to teachers
17. As you apply PSS, what changes has this had on your own well-being in terms of the following? Please tick one choice.
17a). As you apply PSS, how has this changed your control of the class?
1. Got worse
2. No change 3. Some change
4. A great change

60
17b). As you apply PSS, how has this changed your own emotional well-being?
1. Got worse 2. No change
3. Some change 4. A great change
17c). As you apply PSS, how has this changed your ability to relate with others?
1. Got worse
2. No change 3. Some change
4. A great change
18. Please answer the following questions by ticking once choice.
18a). Since implementing PSS, how has the dropout of students from your classes changed?
1. Increased a lot
2. Increased a little 3. No change
4. Decreased a little 5. Decreased a lot
18b). Since implementing PSS, how has your students’ daily attendance changed?
1. Increased a lot
2. Increased a little 3. No change
4. Decreased a little 5. Decreased a lot

61
Q19. These questions are about job satisfaction and confidence. Please tick one choice. 19a). How satisfied are you with your job?
1. Strongly dissatisfied 2. Dissatisfied
3. Neutral 4. Satisfied
5. Strongly satisfied
19b). How confident are you about your job? 1. Not at all
2. To some extent
3. A lot
Q20. In your current school, how severe is each problem listed below? Please tick one choice.
20a). Teachers do not have adequate workspace (e.g., for lesson preparation, or meeting with students)
1. Strongly disagree 2. Disagree 3. Neutral
4. Agree 5. Strongly agree
20b). Teachers do not have adequate instructional materials and supplies
1. Strongly disagree
2. Disagree 3. Neutral
4. Agree 5. Strongly agree

62
20c). The school classrooms are not cleaned often enough.
1. Strongly disagree
2. Disagree 3. Neutral
4. Agree 5. Strongly agree
Thank you for your time and participation!!!!

63
Appendix 6: Interview Questionnaires

64
Appendix 7: PSS Outcomes Disaggregated by Gender, Class, Urbanicity, School type, POC Status, and States
By Gender We see that significant positive differences for social well-being outcomes are consistent for both
male and female students, who have effect sizes of the difference for their social well-being outcomes in similar ranges (Table 15). However, we see that the positive outcomes for emotional well-being between treatment and control school students are largely driven by male students. There are no significant differences for female students, and neither group observes significant impacts on their resilience/coping outcomes.
Table 15. Inferential statistics results of students’ well-being outcomes disaggregated by gender
Construct Gender (test) Treatment (male=1111)
(female=666)
Control (male=703)
(female=494)
Effect size of difference
(Cohen)
p-value
Social Well Being Male (Student) 3.206 3.042 0.29 <0.001
Female (Student) 3.143 2.953 0.33 <0.001
Emotional Well-being Male (Student) 3.256 3.147 0.17 <0.001
Female (Student) 3.106 3.061 NA 0.079
Resilience/Coping
Male (Student) 2.850 2.816 NA 0.140
Female (Student) 2.834 2.828 NA 0.445
By Class We see that significant positive differences for social well-being outcomes are consistent for
students in both classes P3 and P6, with larger effect sizes of the difference for their social well-being outcomes observed among students in class P6 compared to class P3 (Table 16). However, we see that the positive outcomes for emotional well-being between treatment and control school students are largely driven by students in class P6. There are no significant differences for emotional well-being outcomes for P3 students, and neither group observes significant impacts on their resilience/coping outcomes.
Table 16. Inferential statistics results of students’ well-being outcomes disaggregated by class
Construct Class (test) Treatment (P3=546)
(P6=1232)
Control (P3=445) (P6=755)
Effect size of difference
(Cohen)
p-value

65
Social Well Being P3 (Welch) 3.291 3.145 0.24 <0.001
P6 (Student) 3.134 2.923 0.39 <0.001
Emotional Well-being P3 (Welch) 3.094 3.069 NA 0.231
P6 (Student) 3.230 3.137 0.18 <0.001
Resilience/Coping P3 (Student) 3.022 2.956 NA 0.052
P6 (Student) 2.766 2.742 NA 0.223
By Urbanicity We see that significant positive differences for social well-being outcomes are consistent for
students in both urban and rural regions, with larger effect sizes of the difference for their social well-being outcomes observed among students in urban settings compared to rural (Table 17). Conversely, we see that the positive outcomes for emotional well-being between treatment and control school students are largely driven by students in rural settings. Neither group observes significant impacts on their resilience/coping outcomes.
Table 17. Inferential statistics results of students’ well-being outcomes disaggregated by urbanicity
Construct Urbanicity (Test) Treatment (Urban=1555)
(Rural=227)
Control (Urban=1007)
(Rural=193)
Effect size of difference
(Cohen)
p-value
Social Well Being Urban (Student) 3.171 3.012 0.29 <0.001
Rural (Welch) 3.256 2.970 0.48 <0.001
Emotional Well-being Urban (Student) 3.181 3.131 0.09 0.011
Rural (Student) 3.223 3.009 0.44 <0.001
Resilience/Coping Urban (Student) 2.835 2.813 NA 0.211
Rural (Student) 2.914 2.864 NA 0.213
By School type We see that significant positive differences for social well-being outcomes are only observed in
government schools (Table 18). However, we see that the positive outcomes for emotional well-being between treatment and control school students are consistent for both government and community schools although largely driven by students in community schools. We see a significant negative difference for

66
resilience in coping outcomes observed in community schools but a significant positive difference in government schools.
Table 18. Inferential statistics results of students’ well-being outcomes disaggregated by school type
Construct School type (test) Treatment (Govt=1335) (Comm=447)
Control (Govt=833)
(Comm=367)
Effect size of difference
(Cohen)
p-value
Social Well Being Govt (Student) 3.227 2.969 0.45 <0.001
Comm (Welch) 3.049 3.088 NA 0.153
Emotional Well-being Govt (Welch) 3.202 3.155 0.07 0.024
Comm (Student) 3.141 3.013 0.27 <0.001
Resilience/Coping Govt (Student) 2.865 2.725 0.21 <0.001
Comm (Student) 2.784 3.040 -0.43 <0.001
*Govt – Government, *Comm – Community
By POC Status We see that significant positive differences for social well-being outcomes are consistent for
students located in both POC sites and Non-POC sites with larger effect sizes of the difference for their social well-being outcomes observed among students in POC sites (Table 19). Conversely, we see that the positive outcomes for emotional well-being between treatment and control school students are largely driven by students in Non-POC sites. There are no significant emotional well-being differences for students in Non-POC sites. There are no significant impacts on the resilience/coping outcomes of students in POC sites and marginally negligible impact on students in Non-POC sites.
Table 19. Inferential statistics results of students’ well-being outcomes disaggregated by POC status
Construct Location (test) Treatment (POC=992)
(Non-POC=790)
Control (POC=180)
(Non-POC=1020)
Effect size of diff
(Cohen)
p-value
Social Well Being POC (Student) 3.218 2.973 0.45 <0.001
Non-POC (Student) 3.138 3.011 0.22 <0.001
Emotional Well-being POC (Student) 3.207 3.200 NA 0.435

67
Non-POC (Welch) 3.160 3.096 0.12 0.006
Resilience/Coping POC (Welch) 2.912 2.874 NA 0.288
Non-POC (Student) 2.760 2.812 -0.08 0.046
By States
We see significant positive differences for social well-being outcomes for students located in Unity, Jonglei, and Central Equatoria states (Table 20). We also see significant positive differences for emotional well-being outcomes for students located in Unity and Jonglei, but negative significant differences for emotional well-being outcomes for students located in Western Equatoria. We also see only significant positive differences for resilience and coping for students located in Jonglei, making it the only state with positive differences in all three well-being outcomes. However, we see significant negative differences for resilience and coping for students located in Unity, Western Equatoria, and Central Equatoria, with large effect sizes observed in Western and Central Equatoria.
Table 20. Inferential statistics results of students’ well-being outcomes disaggregated by states
Construct Location (test) Treatment (Unity=659)
(Jonglei=506) (UN=100) (WE=208) (CE=309)
Control (Unity=415)
(Jonglei=272) (UN=120) (WE=213) (CE=180)
Effect size of
difference (Cohen)
p-value
Social Well Being Unity (Student) 3.260 3.025 0.25 <0.001
Jonglei (Student) 3.264 3.042 0.36 <0.001
Upper Nile (Student) 3.073 3.181 NA 0.076
WE (Student) 2.905 2.907 NA 0.486
CE (Student) 3.102 2.906 0.36 <0.001
Emotional Well-
being
Unity (Student) 3.247 3.111 0.27 <0.001
Jonglei (Student) 3.332 3.197 0.26 <0.001
Upper Nile (Student) 3.133 3.240 NA 0.066
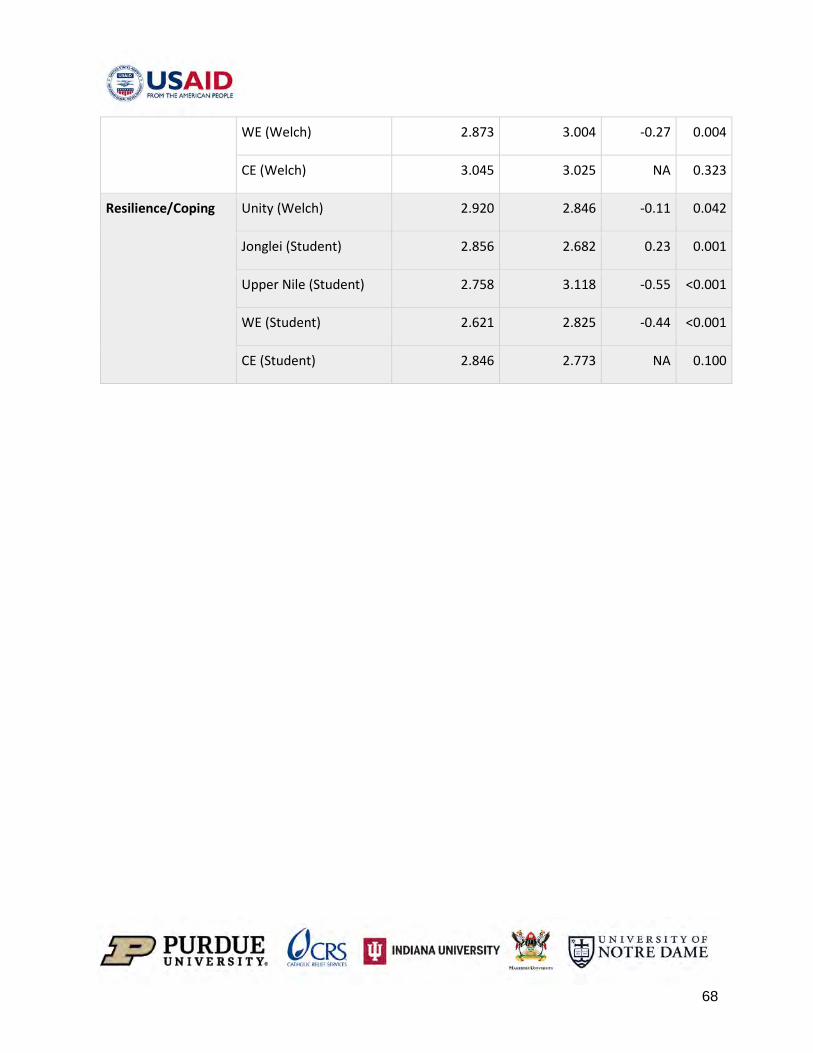
68
WE (Welch) 2.873 3.004 -0.27 0.004
CE (Welch) 3.045 3.025 NA 0.323
Resilience/Coping Unity (Welch) 2.920 2.846 -0.11 0.042
Jonglei (Student) 2.856 2.682 0.23 0.001
Upper Nile (Student) 2.758 3.118 -0.55 <0.001
WE (Student) 2.621 2.825 -0.44 <0.001
CE (Student) 2.846 2.773 NA 0.100

69
Appendix 8: Academic Assessment Results Disaggregated by Gender, School type, and Urbanicity
Literacy Outcomes by Gender
We see no significant differences when the results are disaggregated by gender (Table 21).
Table 21. Inferential statistics results of Modified EGRA (2019) disaggregated by gender
Construct Location (test) Treatment (Male=214) (Female=142)
Control (Male=161) (Female=104)
Effect size of difference (Cohen)
p-value
Letter Name Identification
Male (Welch) 83.486 80.565 NA 0.094
Female (Student) 73.127 68.077 NA 0.069
Familiar Word Identification
Male (Student) 38.523 36.988 NA 0.180
Female (Student) 33.408 29.923 NA 0.086
Oral Reading Passage Male (Student) 42.925 41.037 NA 0.183
Female (Student) 33.908 29.740 NA 0.096
Reading Comprehension Male (Student) 4.981 5.373 NA 0.645
Female (Student) 7.155 7.375 NA 0.551
Listening Comprehension
Male (Welch) 1.874 2.199 NA 0.926
Female (Welch) 1.838 2.308 NA 0.824
English Vocabulary Male (Student) 8.336 8.379 NA 0.550
Female (Student) 7.239 7.327 NA 0.582
Aggregate Sum Score Male (Welch) 180.126 174.540 NA 0.145
Female (Student) 156.676 144.750 NA 0.066

70
Numeracy Outcomes by Gender
We observe that the negative significant differences in addition level one is largely driven by the male students while the negative significant difference in subtraction level two is largely driven by the female students (table 22).
Table 22. Inferential statistics results of Modified EGMA (2019) disaggregated by gender
Construct Location Treatment (Male=214) (Female=142)
Control (Male=161) (Female=104)
Effect size of difference (Cohen)
p-value
Number Identification Male (Welch) 18.921 19.031 NA 0.673
Female (Welch) 19.211 19.183 NA 0.455
Quantity Discrimination Male (Welch) 9.565 9.522 NA 0.372
Female (Student) 9.592 9.423 NA 0.123
Missing Numbers Male (Welch) 6.491 6.348 NA 0.307
Female (Student) 6.585 6.212 NA 0.106
Addition Level One Male (Student) 15.336 16.224 -0.20 0.048
Female (Welch) 15.254 15.885 NA 0.821
Addition Level Two Male (Student) 4.210 4.280 NA 0.729
Female (Student) 4.331 4.192 NA 0.164
Subtraction Level One Male (Student) 12.589 13.447 NA 0.806
Female (Student) 12.028 12.317 NA 0.695
Subtraction Level Two Male (Student) 3.491 3.571 NA 0.703
Female (Student) 3.401 3.971 -0.41 0.002
Word Problems Male (Student) 4.762 4.994 NA 0.089
Female (Welch) 4.803 4.962 NA 0.827
Aggregate Sum Score Male (Student) 75.364 77.416 NA 0.901
Female (Student) 75.204 76.144 NA 0.707

71
Literacy Outcomes by School type
We see that the positive significant difference in letter name identification is largely driven by students in government schools (Table 23). We also see positive significant differences in familiar word identification for students in community schools, and negative significant differences in listening comprehension for students in community schools.
Table 23. Inferential statistics results of Modified EGRA (2019) disaggregated by school type
Construct School type (test)
Treatment (Govt=270) (Comm=91)
Control (Govt=188) (Comm=80)
Effect size of difference (Cohen)
p-value
Letter Name Identification Govt (Student) 79.126 74.612 0.19 0.021
Comm (Student) 79.857 77.375 NA 0.253
Familiar Word Identification Govt (Student) 36.200 35.388 NA 0.317
Comm (Student) 37.363 31.600 0.33 0.016
Oral Reading Passage Govt (Student) 39.322 36.644 NA 0.108
Comm (Student) 39.484 37.213 NA 0.248
Reading Comprehension Govt (Student) 5.767 6.489 NA 0.740
Comm (Student) 5.857 5.238 NA 0.351
Listening Comprehension Govt (Welch) 1.830 2.207 NA 0.874
Comm (Student) 1.923 2.275 -0.33 0.032
English Vocabulary Govt (Student) 7.667 7.840 NA 0.702
Comm (Welch) 8.582 8.300 NA 0.248
Aggregate Sum Score Govt (Student) 169.911 163.181 NA 0.100
Comm (Student) 173.066 162.000 NA 0.101

72
Numeracy Outcomes by School type
We observe that the negative significant differences in addition level one and subtraction level two are largely driven by students in community schools (Table 24). We also see a negative significant difference for aggregate numeracy scores for students in community schools.
Table 24. Inferential statistics results of Modified EGMA (2019) disaggregated by school type
Construct Location Treatment (Govt=270) (Comm=91)
Control (Govt=188) (Comm=80)
Effect size of difference (Cohen)
p-value
Number Identification Govt (Welch) 19.122 19.037 NA 0.339
Comm (Welch) 18.758 19.250 NA 0.915
Quantity Discrimination Govt (Welch) 9.574 9.457 NA 0.171
Comm (Student) 9.571 9.538 NA 0.415
Missing Numbers Govt (Welch) 6.674 6.287 NA 0.059
Comm (Student) 6.044 6.300 NA 0.752
Addition Level One Govt (Welch) 15.393 15.830 NA 0.821
Comm (Student) 14.978 16.713 -0.45 0.004
Addition Level Two Govt (Student) 4.322 4.197 NA 0.110
Comm (Student) 4.044 4.375 NA 0.058
Subtraction Level One Govt (Student) 12.456 13.027 NA 0.751
Comm (Student) 12.055 12.863 NA 0.897
Subtraction Level Two Govt (Student) 3.474 3.686 NA 0.941
Comm (Student) 3.352 3.850 -0.34 0.026
Word Problems Govt (Welch) 4.756 4.995 NA 0.058
Comm (Student) 4.846 4.988 NA 0.760
Aggregate Sum Score Govt (Student) 75.770 76.516 NA 0.697
Comm (Welch) 73.648 77.875 -0.35 0.025
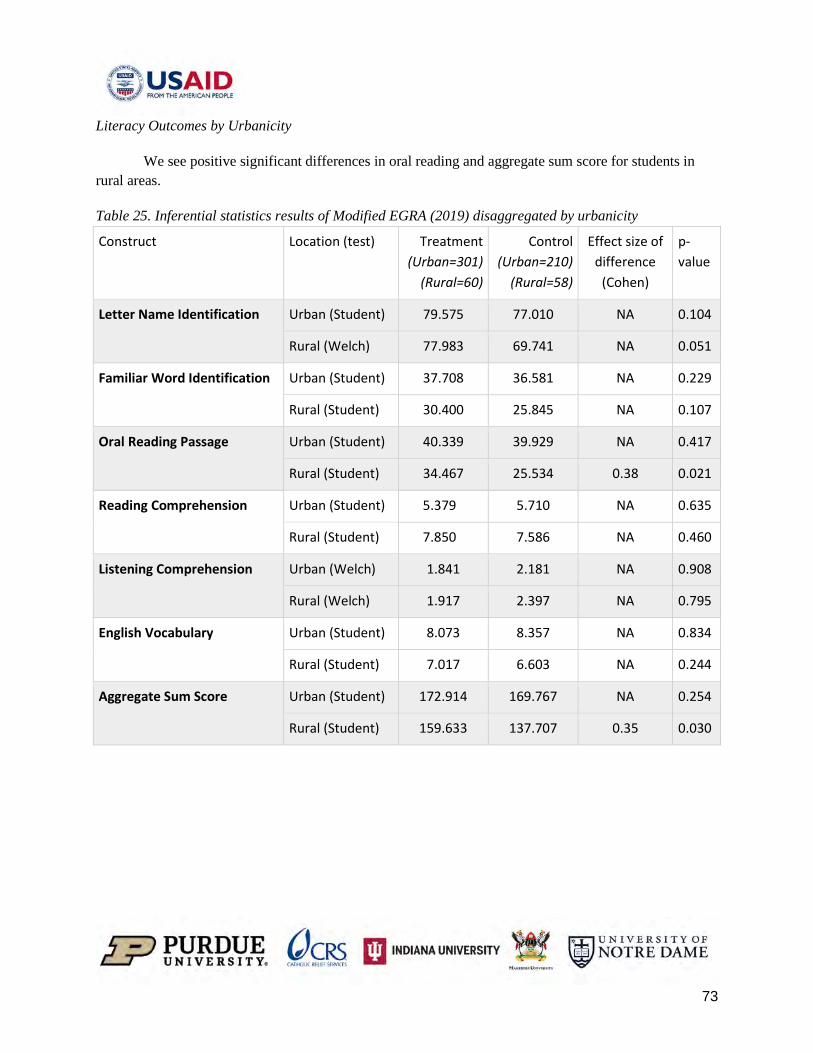
73
Literacy Outcomes by Urbanicity
We see positive significant differences in oral reading and aggregate sum score for students in rural areas.
Table 25. Inferential statistics results of Modified EGRA (2019) disaggregated by urbanicity
Construct Location (test) Treatment (Urban=301)
(Rural=60)
Control (Urban=210)
(Rural=58)
Effect size of difference
(Cohen)
p-value
Letter Name Identification Urban (Student) 79.575 77.010 NA 0.104
Rural (Welch) 77.983 69.741 NA 0.051
Familiar Word Identification Urban (Student) 37.708 36.581 NA 0.229
Rural (Student) 30.400 25.845 NA 0.107
Oral Reading Passage Urban (Student) 40.339 39.929 NA 0.417
Rural (Student) 34.467 25.534 0.38 0.021
Reading Comprehension Urban (Student) 5.379 5.710 NA 0.635
Rural (Student) 7.850 7.586 NA 0.460
Listening Comprehension Urban (Welch) 1.841 2.181 NA 0.908
Rural (Welch) 1.917 2.397 NA 0.795
English Vocabulary Urban (Student) 8.073 8.357 NA 0.834
Rural (Student) 7.017 6.603 NA 0.244
Aggregate Sum Score Urban (Student) 172.914 169.767 NA 0.254
Rural (Student) 159.633 137.707 0.35 0.030
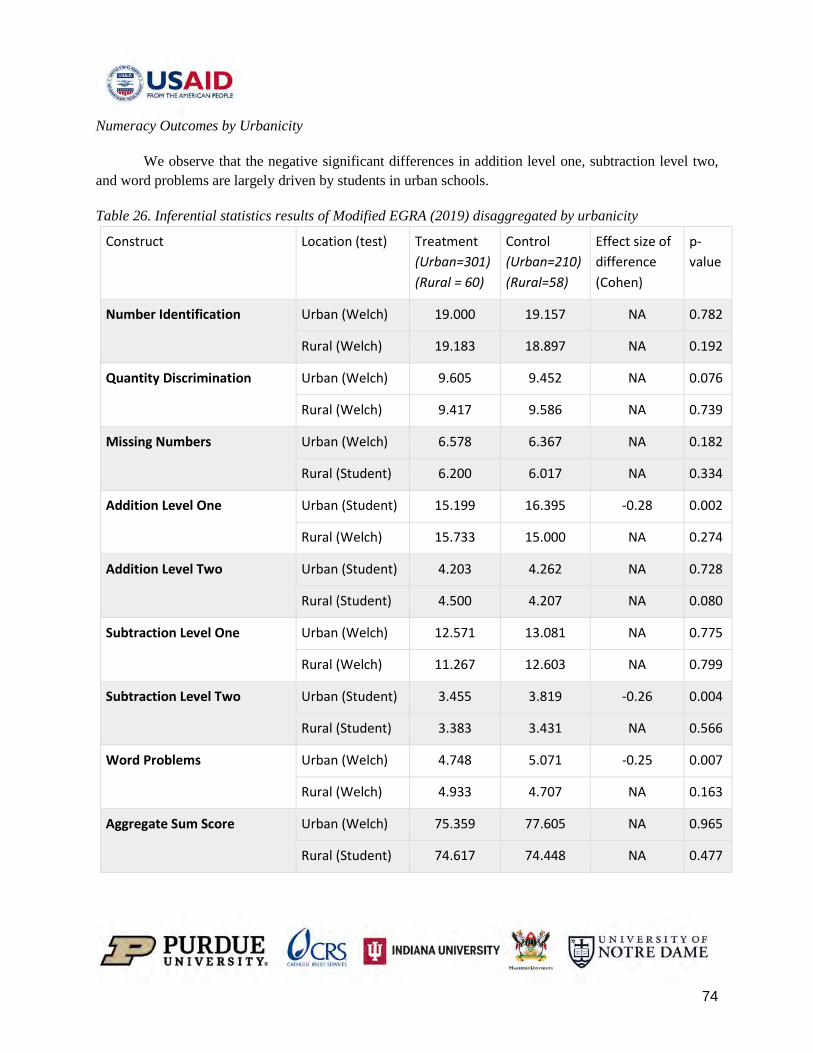
74
Numeracy Outcomes by Urbanicity
We observe that the negative significant differences in addition level one, subtraction level two, and word problems are largely driven by students in urban schools.
Table 26. Inferential statistics results of Modified EGRA (2019) disaggregated by urbanicity
Construct Location (test) Treatment (Urban=301) (Rural = 60)
Control (Urban=210) (Rural=58)
Effect size of difference (Cohen)
p-value
Number Identification Urban (Welch) 19.000 19.157 NA 0.782
Rural (Welch) 19.183 18.897 NA 0.192
Quantity Discrimination Urban (Welch) 9.605 9.452 NA 0.076
Rural (Welch) 9.417 9.586 NA 0.739
Missing Numbers Urban (Welch) 6.578 6.367 NA 0.182
Rural (Student) 6.200 6.017 NA 0.334
Addition Level One Urban (Student) 15.199 16.395 -0.28 0.002
Rural (Welch) 15.733 15.000 NA 0.274
Addition Level Two Urban (Student) 4.203 4.262 NA 0.728
Rural (Student) 4.500 4.207 NA 0.080
Subtraction Level One Urban (Welch) 12.571 13.081 NA 0.775
Rural (Welch) 11.267 12.603 NA 0.799
Subtraction Level Two Urban (Student) 3.455 3.819 -0.26 0.004
Rural (Student) 3.383 3.431 NA 0.566
Word Problems Urban (Welch) 4.748 5.071 -0.25 0.007
Rural (Welch) 4.933 4.707 NA 0.163
Aggregate Sum Score Urban (Welch) 75.359 77.605 NA 0.965
Rural (Student) 74.617 74.448 NA 0.477

75
Appendix 9: EGRA/EGMA 2015/2017 Student Descriptives Table 9. Descriptive statistics of students (2015 EGRA & EGMA)
Category Groups Percentage (%)
Students (n = 1095)
Intervention Status Control 82
Treatment 18
Gender Male 53
Female 47
Class P3 100
State Unity 18
Jonglei 30
Lakes 29
Western Equatoria 13
Central Equatoria 10
Schools (n = 116)
Intervention Status Control 82
Treatment 18

76
Table 11. Descriptive statistics of students (2017 EGRA)
Category Groups Percentage (%)
Students (n = 1365)
Intervention Status Control 81
Treatment 19
Gender Male 51
Female 49
Class P3 100
State Unity 12
Jonglei 35
Lakes 26
Western Equatoria 11
Central Equatoria 8
Eastern Equatoria 8
Schools (n = 137)
Intervention Status Control 80
Treatment 20

77
Table 13. Descriptive statistics of students (2017 EGMA)
Category Groups Percentage (%)
Students (n = 1365)
Intervention Status Control 80
Treatment 20
Gender Male 52
Female 48
Class P3 100
State Unity 15
Jonglei 34
Lakes 25
Western Equatoria 10
Central Equatoria 8
Eastern Equatoria 8
Schools (n = 137)
Intervention Status Control 82
Treatment 18

78
Appendix 10: EGRA/EGMA Assessment
Assessment of Early Grade Learners in Literacy and Numeracy
Pupil English / Mathematics
General Instructions It is important to establish a playful and relaxed rapport with the pupils to be assessed, via some simple initial conversation among topics of interest to the pupil (see example below). The pupil should perceive the following assessment almost as a game to be enjoyed rather than a test. It is important to read ONLY the sections in boxes aloud slowly and clearly. You may read the instructions (in the grey boxes) in a language that the pupil understands. For the Mathematics assessment (EGMA): The pupil may answer in any language: He may speak English or his/her language or mix both languages. He may use the number words in English or in his language. You tick the boxes to indicate which language he used for speaking and which language he used for the number words. Good morning. My name is ____ and I live in _____. I’d like to tell you a little bit about myself. [Number and ages of children; sports; etc.] 1. Could you tell me a little about yourself and your family? [Wait for response; if the
pupil is reluctant, ask question 2, but if they seem comfortable continue to verbal consent].
2. What do you like to do when you are not in school?

79
Verbal Consent • Let me tell you why I am here today. We are trying to understand how children learn to
read and do math. We selected pupils randomly from your class, and you were one of the pupils selected by chance.
• We would like your help in this. But you do not have to take part if you do not want to.
• We are going to play reading and math games. I am going to ask you to read letters, words, a short story and do math problems out loud.
• Using this stopwatch, I will see how long it takes you.
• This is NOT an exam and it will not affect your marks at school.
• I will also ask you other questions about your family, like what language your family uses at home and some of the things your family has.
• I will NOT write down your name so no one will know these are your answers.
• You do not have to participate if you do not wish to. Once we begin, if you would rather not answer a question, that’s all right.
• Do you have any questions? Are you ready to get started? Check box if verbal consent is obtained: (If verbal consent is not obtained, thank the pupil and move on to the next pupil, using this same form)
A. Date of Assessment:
Day: _____ Month: ___________________ Year: _______
I. School Name:
B. Enumerator’s Code:
J. Type of School
Public/Government Community
Private

80
C. Survey No.: K County:
D. Cl L. State:
E. Pupil’s Age in years: M. POC Site:
Yes No
F. Pupil’s Gender
N. School Shift:
Full Day Morning only Afternoon only
Male
Female
G. Time at start of assessment: H. Time at end
of assessment:

81
SUMMARY SCORE SHEET
Enumerator Code: ____________________ Survey No: ___________________________
School Name_______________________________________________________________________
Start Time: _________________________ End Time: ____________________________
Task Number
No. of Correct Answers Time
Taken
Discontinued Exercise? (✓or ✗)
Method of calculation
Used (✓ all that apply)
Language of response
Task 1: Letter Name Identification
Task 2: Familiar Word Identification
Task 3a: Oral Reading Passage
Task 3b: Reading Comprehension
Task 4: Listening Comprehension
Task 5A: English Vocabulary Body Parts
Task 5B: English Vocabulary- Spatial word
Task 6: Number Identification
Task 7: Number Discrimination
Task 8: Missing Number

82
Task 9A: Addition Level 1 his/her head Solved problems in
Counting Fingers
with a pencil Tick marks on paper
Other
Task 9B: Addition Level 2 his/her head Solved problems in
Counting Fingers
with a pencil Tick marks on paper
Other
Task 10A: Subtraction Level 1 his/her head Solved problems in
Counting Fingers
with a pencil Tick marks on paper
Other
Task 10B: Subtraction Level 2 his/her head Solved problems in
Counting Fingers
with a pencil Tick marks on paper
Other
Task 11: Word Problems his/her head Solved problems in
Counting Fingers
with a pencil Tick marks on paper
Other

83
Task 1: Letter Name Identification
Page 1 60 seconds
If you marked as incorrect all of the answers on the first line, say “Thank you!” and discontinue the exercise.
If the pupil hesitates for 3 seconds, point to the next letter and say “Please go on.” Mark the skipped letter as incorrect.
General Instructions: The answer is "correct" if the pupil gives the name of the letter. If the answer is correct you do NOT mark the item in any way. However,
( / ) Cross out each item for which the pupil has given an incorrect answer. ( O ) Circle the item if the pupil self-corrects. ( ] ) After the last item read, put this bracket.
[say to the pupil]: Here is a page full of letters of the English alphabet. Please tell me the NAMES of as many letters as you can. For example, the name of this letter [point to S] is “S”. Let’s practise: Tell me the name of this letter [point to V]:
✓: Good, the name of this letter is “V.” : The name of this letter is “V.” Now you say the name.
Now try another one: Tell me the name of this letter [point to L]:
✓: Good, the name of this letter is “L.” : The name of this letter is “L.” Now you say the name.
Do you understand what you are to do? When I say “Begin,” start here and read across the page [Point to the first letter on the row after the example and draw your finger across the first line]. Point to each letter and tell me the name of that letter in a loud voice. Read as quickly and as carefully as you can. If you come to a letter name that you do not know, go on to the next letter. Put your finger on the first letter. Ready? Begin.

84
Example: S v L
1 2 3 4 5 6 7 8 9 10
t R a B P i j n G o
s A H u R t k e N w
a T u e O F S E T d
m b h L I J v M i e
y d e G i a f i Q o
l W O Y k E n h s n
e z m N R O s t c t
o S r e P e R c w u
i r j e x A E I D T
E a Z T u G n s q x (10)
(20)
(30)
(40)
(50)
(60)
(70)
(80)
(90)
(100)

85
How many names of the letters did the student read CORRECTLY within the 60 seconds? Time elapsed on stopwatch at completion (number of SECONDS):
Tick this box if the exercise was discontinued because the pupil had no correct answers on the first line.
Task 3: Familiar Word Identification
Page 3 60 seconds
If you marked as incorrect all of the answers on the first line, say “Thank you!” and discontinue the exercise.
If the pupil hesitates for 3 seconds, point to the next word and say “Please go on.” Mark the skipped word as incorrect.
General Instructions: Mark answer as "correct" if the pupil correctly reads the word.
( / ) Cross out each item for which the pupil has given an incorrect answer. ( O ) Circle the item if the pupil self-corrects. ( ] ) After the last item read.
[say to the pupil]: Here are some words. I would like you to read as many words as you can. Do not spell the words, but read them. For example, this word is: “cat”. Let’s practise: Please read this word [point to the next word: “fall”].
✓: Good this word is “fall” : This word is “fall.” Now you say the word.
Now try another one: Please read this word [point to the next word: “clap”].
✓: Good, this word is “clap” ✓: This word is “clap.” Now you say the word.
When I say “begin,” start here and go across the page [Point to the first word on the row after the example and draw your finger across the first line]. Point to each word and read it in a loud voice. Read as quickly and are carefully as you can. If you come to a word you do not know, go on to the next word. Put your finger on the first word. Ready? Begin.

86
Example: cat fall clap
1 2 3 4 5
see go her Food leg
door sleep do Around chair
words tree river Hair far
sad house walk Man sister
called fly long After mother
me on get Time girl
all more that Eat in
work blue ear Sun school
they uncle come Stop wall
boy run eye Out window (5)
(10)
(15)
(20)
(25)
(30)
(35)
(40)
(45)
(50)

87
How many words did the student read CORRECTLY within the 60 seconds? Time elapsed on stopwatch at completion (number of SECONDS):
Tick this box if the exercise was discontinued because the pupil had no correct answers in the first line. If the pupil had no correct answers in the first line and no correct answers in the first line of the letter sound identification, END the EGRA assessment and continue with EGMA.
5
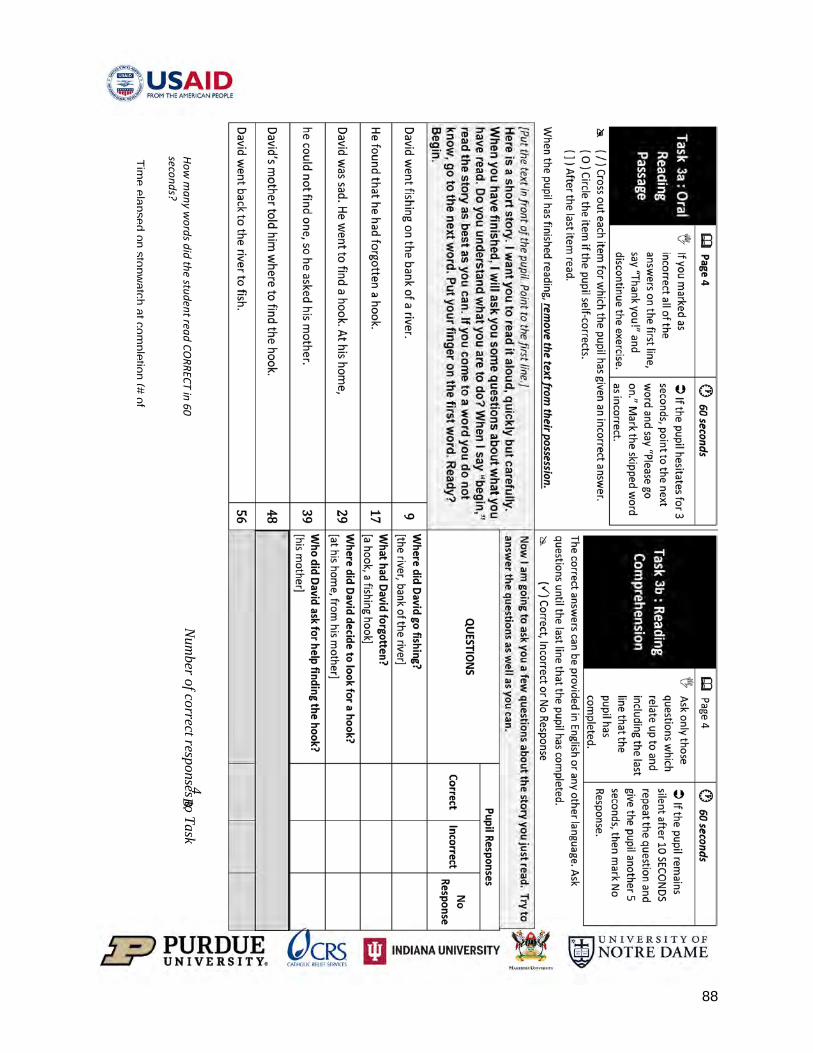
88
4
N
umber of correct responses to Task
B.
How m
any words did the student read CO
RRECT in 60 seconds? Tim
e elapsed on stopwatch at com
pletion (# of
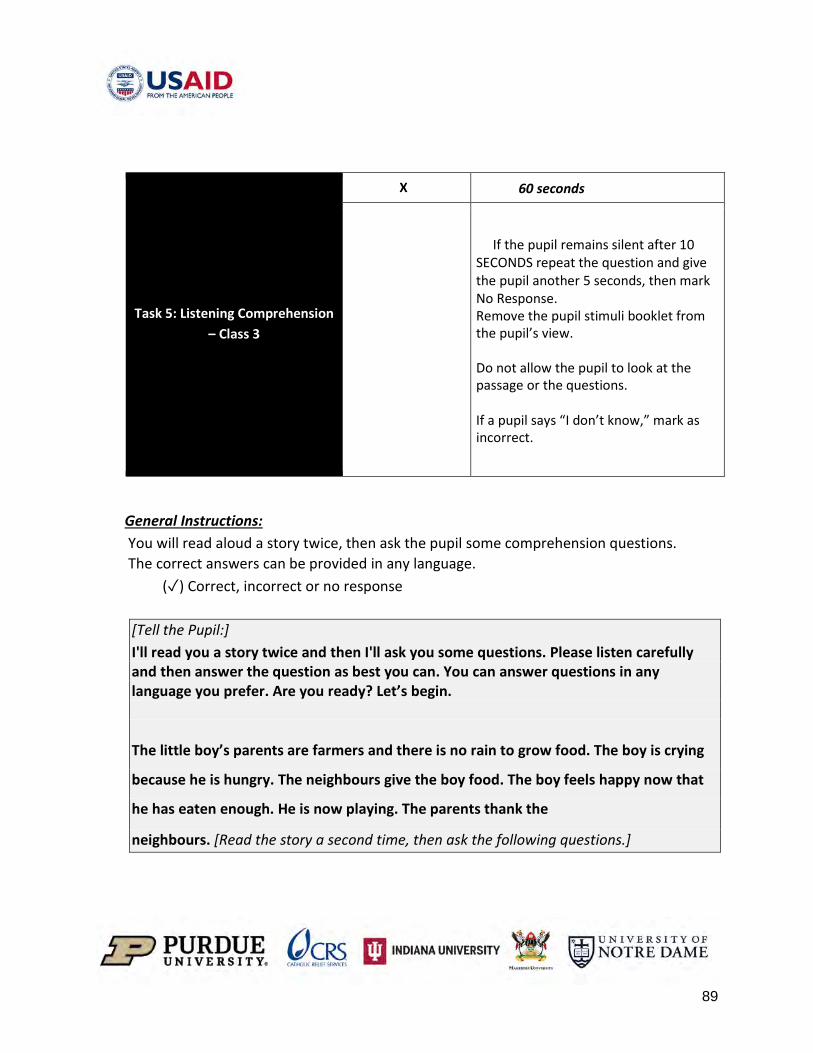
89
Task 5: Listening Comprehension – Class 3
X 60 seconds
If the pupil remains silent after 10 SECONDS repeat the question and give the pupil another 5 seconds, then mark No Response. Remove the pupil stimuli booklet from the pupil’s view. Do not allow the pupil to look at the passage or the questions. If a pupil says “I don’t know,” mark as incorrect.
General Instructions: You will read aloud a story twice, then ask the pupil some comprehension questions. The correct answers can be provided in any language.
(✓) Correct, incorrect or no response [Tell the Pupil:] I'll read you a story twice and then I'll ask you some questions. Please listen carefully and then answer the question as best you can. You can answer questions in any language you prefer. Are you ready? Let’s begin. The little boy’s parents are farmers and there is no rain to grow food. The boy is crying
because he is hungry. The neighbours give the boy food. The boy feels happy now that
he has eaten enough. He is now playing. The parents thank the
neighbours. [Read the story a second time, then ask the following questions.]

90
QUESTIONS
Correct answers (DO NOT READ TO THE PUPIL)
PUPIL RESPONSES
Correct Incorrect No Response
1. Why is the boy crying?
[he is hungry, there is no food]
2. Why do the parents not feed the boy?
[no food, no rain to grow food]
3. Who gives the boy food? [the neighbours]
Task 7. ENGLISH VOCABULARY
Materials: a sheet of paper, pencil, rubber
X
( / ) Mark any incorrect words with a slash ( Ø ) Circle self-corrections if you already marked the word incorrect
A. Body Parts:
Tell the pupil, in any language that they can understand, I'll say words in
English that represent parts of the body. Show me what part of your body the word means. Let’s practice. “nose”
(Point to your nose so that you model for the Pupil). Say, “head”. Wait for the pupil to gesture to his/her head.
Thereafter say, Good you understand the directions! Let’s start.
Total number of CORRECT responses:

91
foot arm chin knee ear back elbow shoulder
Part A Total Correct /8
B. Words from the Environment:
Now I will say other words and you will show me examples of those words.
pencil shoes desk rubber paper floor
Part B Total Correct /6
C.B. Spatial Words
(Hand the pencil to the pupil.) Say, Take this pencil. You will place the
pencil where I tell you to put it. Put the pencil…
Place a pencil and sheet of paper side by side in front of the pupil.
on the paper next to the paper behind you under the paper in front of you to the right of the paper
Part C Total Correct /6
Overall Total Correct = (Part A + Part B + Part C)) /20 14

92
Make sure all subpart scores are filled out, including time elapsed and discontinued. Now, proceed to the EGMA assessment.
Task 8 : Number Identification Page 4 60 seconds
(Timed)
Here are some numbers. I want you t and tell me what the number is. I am goin you when to begin and when to stop. - [Point to the first number] Start here. [Gli Are you ready? Begin.
o point to each number g to time you and will tell
de hand from left to right].
(Stop) • Only if
the time runs out (60 seconds).
(Move on) • If a
pupil stops on a number for 5 SECONDS, mark as wrong then prompt pupil to move on.
Mark on the table if incorrect or no re Put a bracket ( ] ) on the table after the last
3 8 0 16 25 33 59 48 13 20 62 71 44 86 95
167 287 506 713 957
sponse number read.
Number of correct responses:
Record time elapsed (seconds):
Tick here if the task was discontinued due to multiple incorrect responses:

93
What language(s) did the Pupil use for this activity?
English Juba Arabic Nuer Dinka Zande Toposha Bari Other :___________________
Task 9 : Number Discrimination - PRACTICE Pages 5-6 (Not Timed)
Example 1: Look at these numbers. Tell me which number is bigger.
8 4 ✓ That’s correct, 8 is bigger. Let’s do another one. The bigger number is 8. [Point to 8]: This is 8. [Point to 4]: this is 4. 8 is bigger than 4. Let’s do another one.
Example 2: Look at these numbers. Tell me which number is bigger.
12 22 ✓ That’s right, 22 is bigger. Let’s continue. The
bigger number is 22. [Point to 22]: This number is 22. [Point to 12]: This is 12. 22 is bigger than 12. Let’s continue.
Point and say [Repeat for each item] Look at these numbers. Tell me which number is bigger
(Stop)

94
Mark on the Tablet if incorrect or no response
7 * Correct * * Incorrect 11 24 24 * Correct * * Incorrect
39 * Correct * * Incorrect 58 49 58 * Correct * * Incorrect
65 * Correct * * Incorrect
94 78 94 * Correct * * Incorrect 146 153 153 * Correct * * Incorrect 287 534 534 * Correct * * Incorrect
623 * Correct * * Incorrect 867 965 965 * Correct * * Incorrect
• If the pupil makes 4 successive errors.
(Move on)
• If the pupil doesn’t respond after 5 SECONDS, mark as wrong then prompt pupil to move on.
Number of correct responses:
Tick here if the task was discontinued due to multiple incorrect responses:
What language(s) did the pupil use for this activity? [check all that apply]
English Juba Arabic Nuer Dinka Zande Toposha Bari Other :___________________
Task 10 : Missing number – PRACTICE Page 7 (Not Timed)
Example 1: Here are some numbers. 1, 2, and 4, what number goes here?
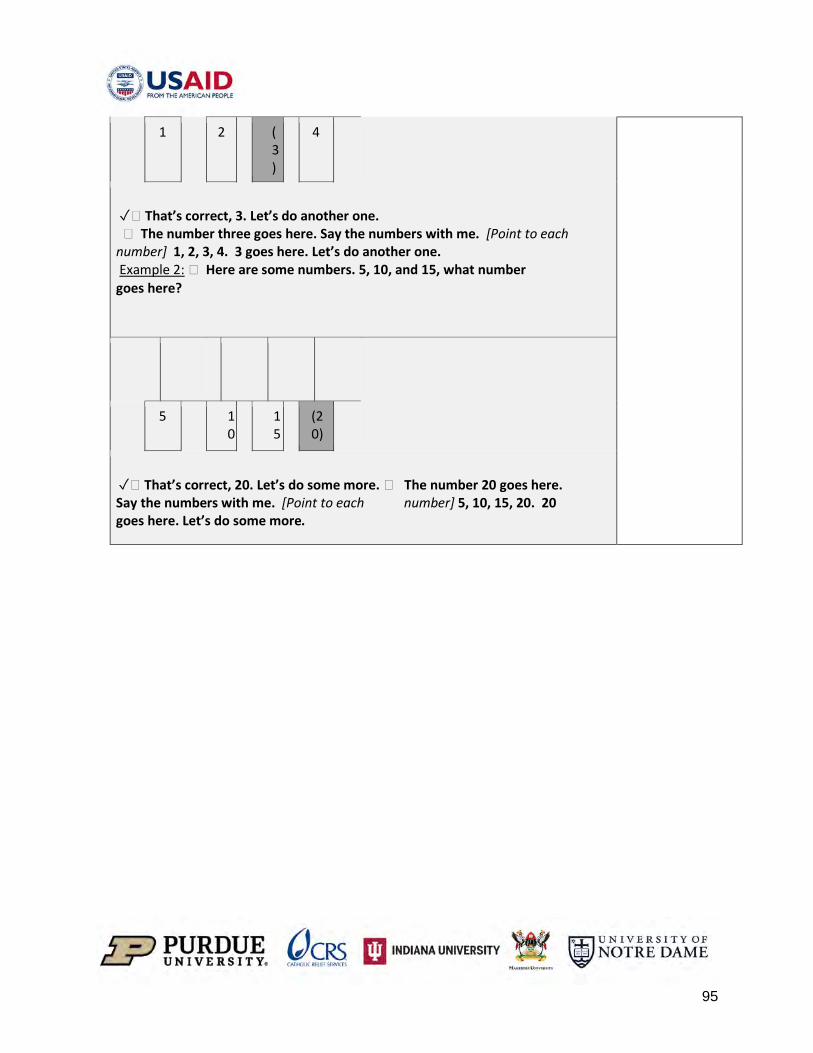
95
1 2 (3)
4
✓ That’s correct, 3. Let’s do another one. The number three goes here. Say the numbers with me. [Point to each number] 1, 2, 3, 4. 3 goes here. Let’s do another one. Example 2: Here are some numbers. 5, 10, and 15, what number goes here?
5 10
15
(20)
✓ That’s correct, 20. Let’s do some more. The number 20 goes here. Say the numbers with me. [Point to each number] 5, 10, 15, 20. 20 goes here. Let’s do some more.

96
Task 191A: A : Addition: Level 1 Pages 9-10 60 seconds (Timed)
Here are some addition exercises I am going to tell you when to begin and for each problem. If you don’t know an problem. Are you ready? Begin.
[glide hand from top to bottom]. when to stop. Say the answer answer, move to the next
(Stop) • If the time
runs out (60 seconds).
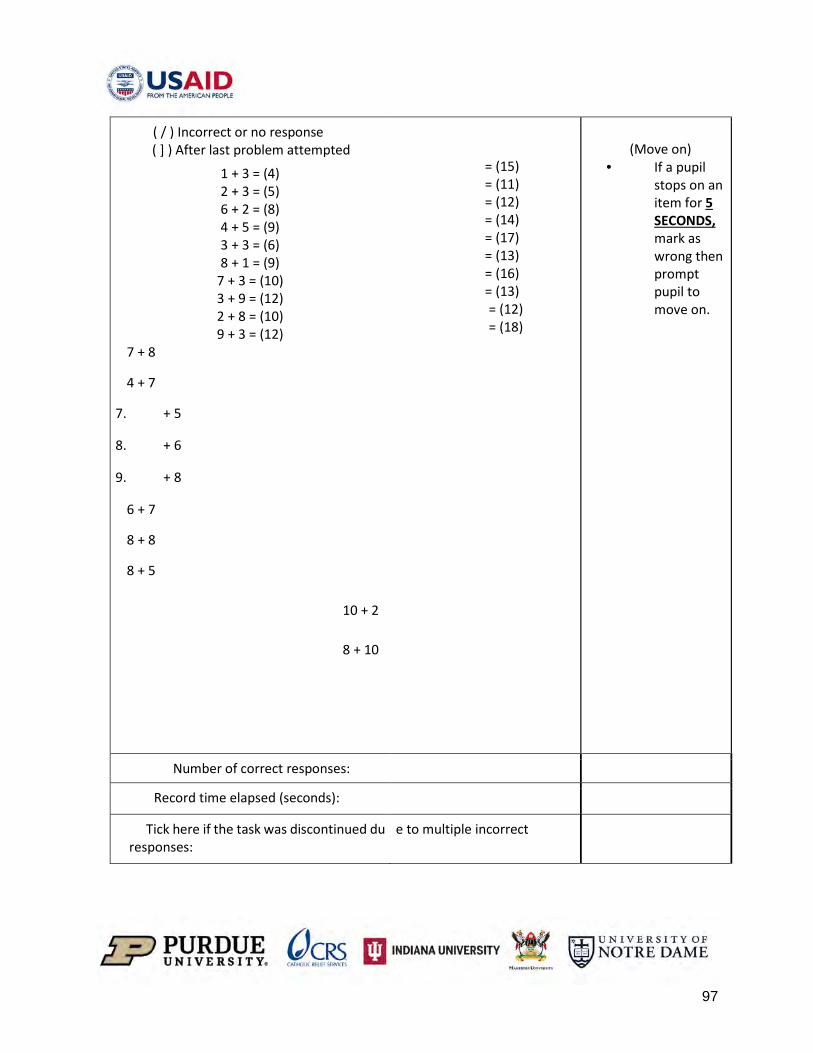
97
( / ) Incorrect or no response ( ] ) After last problem attempted
1 + 3 = (4) 2 + 3 = (5) 6 + 2 = (8) 4 + 5 = (9) 3 + 3 = (6) 8 + 1 = (9)
7 + 3 = (10) 3 + 9 = (12) 2 + 8 = (10) 9 + 3 = (12)
7 + 8
4 + 7
7. + 5
8. + 6
9. + 8
6 + 7
8 + 8
8 + 5
10 + 2
8 + 10
= (15) = (11) = (12) = (14) = (17) = (13) = (16) = (13) = (12) = (18)
(Move on)
• If a pupil stops on an item for 5 SECONDS, mark as wrong then prompt pupil to move on.
Number of correct responses:
Record time elapsed (seconds):
Tick here if the task was discontinued du responses:
e to multiple incorrect

98
To solve the problems, indicate the method t □ Solved the problems in his/her head □ Fingers □ Counters □ Tick marks on paper with a pencil
□ Other ( describe) ___________________
he pupil used (tick all that apply):
_____________________________________
What language(s) did the pupil use for this activity? [check all that apply]
English Juba Arabic Nuer Dinka Zande Toposha
Bari Other :___________________
Task 191BB: : Addition: Level 2 Page 11 (Not Timed)
❖ Paper and pencil. (Stop) • If the pupil
did not answer any Level 1
Here are more addition exercises. You may use this paper and pencil if you want to. You do not have to do so.
Start here [point to the first problem].

99
Circle: Tick the correct box.
11 + 3 = (14) * * Correct * * Incorrect
16 + 9 = (25) * * Correct * * Incorrect
11 + 17 = (28) * * Correct * * Incorrect
27 + 32 = (59) * * Correct * * Incorrect
34 + 19 = (53) * * Correct * * Incorrect
question correctly.
• If the pupil makes 4 consecutive errors.
• If a pupil
uses an inefficient strategy (e.g., tick marks), ask the pupil “Do you know another way to solve the problem?”
(Move on)
• If a pupil continues to use an inefficient strategy or stops on an item for 5 SECONDS.
Number of correct responses:
Tick here if the task was discontinued due to multiple incorrect responses:

100
To solve the problems, indicate the method the pupil used [(✓) tick all that apply]: □ Solved the problems in his/her head □ Set up the problem with paper and pencil □ Fingers □ Counters □ Tick marks □ Other ( describe) ________________________________________________________
What language(s) did the pupil use for this activity? [check all that apply]
English Juba Arabic Nuer Dinka Zande Toposha
Bari Other :___________________
Task 1102AA: : Subtraction: Level 1 Pages 12-13 60 seconds (Timed)
Here are some subtraction exercises [glide hand from top to bottom]. I will tell you when to begin and when to stop. Say the answer for each problem. If you don’t know an answer, move to the next problem. Are you ready? Begin.
(Stop) • If the time
runs out (60 seconds).

101
( / ) Incorrect or no response ( ] ) After last problem attempted
4 – 3 = (1) 15 – 8 = (7) 5 – 3 = (2) 11 – 7 = (4) 8 – 2 = (6) 12 – 5 = (7) 9 – 5 = (4) 14 – 6 = (8) 6 – 3 = (3) 17 – 8 = (9) 9 – 1 = (8) 13 – 7 = (6) 10 – 3 = (7) 16 – 8 = (8) 12 – 9 = (3) 13 – 5 = (8)
10 – 8 = (2) 12 – 2 = (10) 12 – 3 = (9) 18 – 10 = (8)
(Move on)
• If a pupil stops on an item for 5 SECONDS, mark as wrong and prompt pupil to move on.
Number of correct responses:
Record time elapsed (seconds):
Tick here if the task was discontinued due to multiple incorrect responses:
To solve the problems, indicate the method the pupil used [(✓)tick all that apply]: □ Solved the problems in his/her head □ Fingers □ Counters □ Tick marks on paper with a pencil □ Other ( describe) ________________________________________________________
What language(s) did the pupil use for this activity? [check all that apply]
English Juba Arabic Nuer Dinka Zande Toposha
Bari Other :___________________

102
Task 1102BB: : Subtraction: Level 2 Page 14 (Not Timed)
❖ Paper and pencil.
(Stop) • If the pupil
did not answer any Level 1 question correctly.
• If the pupil makes 4 consecutive errors.
• If a pupil
uses an inefficient strategy (e.g., tick marks), ask the pupil “Do you know another way to solve the problem?”
(Move on)
• If a pupil continues to use an inefficient strategy or stops on an item for 5 SECONDS.
Here are more subtraction exercises. You may use this paper and pencil if you want to. You do not have to do so.
Start here [point to first problem].
Circle: 1 = Correct. 0 = Incorrect or no response.
14 – 3 = (11) * * Correct * * Incorrect
25 – 9 = (16) * * Correct * * Incorrect
28 – 17 = (11) * * Correct * * Incorrect
59 – 32 = (27) * * Correct * * Incorrect
53 – 19 = (34) * * Correct * * Incorrect
Number of correct responses:

103
Tick here if the task was discontinued due to multiple incorrect responses:
To solve the problems, indicate the method the pupil used [(✓)tick all that apply]: □ Solved the problems in his/her head □ Set up the problem with paper and pencil □ Fingers □ Counters □ Tick marks □ Other ( describe) ________________________________________________________
What language(s) did the pupil use for this activity? [check all that apply]
English Juba Arabic Nuer Dinka Zande Toposha
Bari Other :___________________
Task
111:3 : Word Problems - PRACTICE (No stimuli Sheet) (Not Timed)
❖ Counters, paper and pencil.
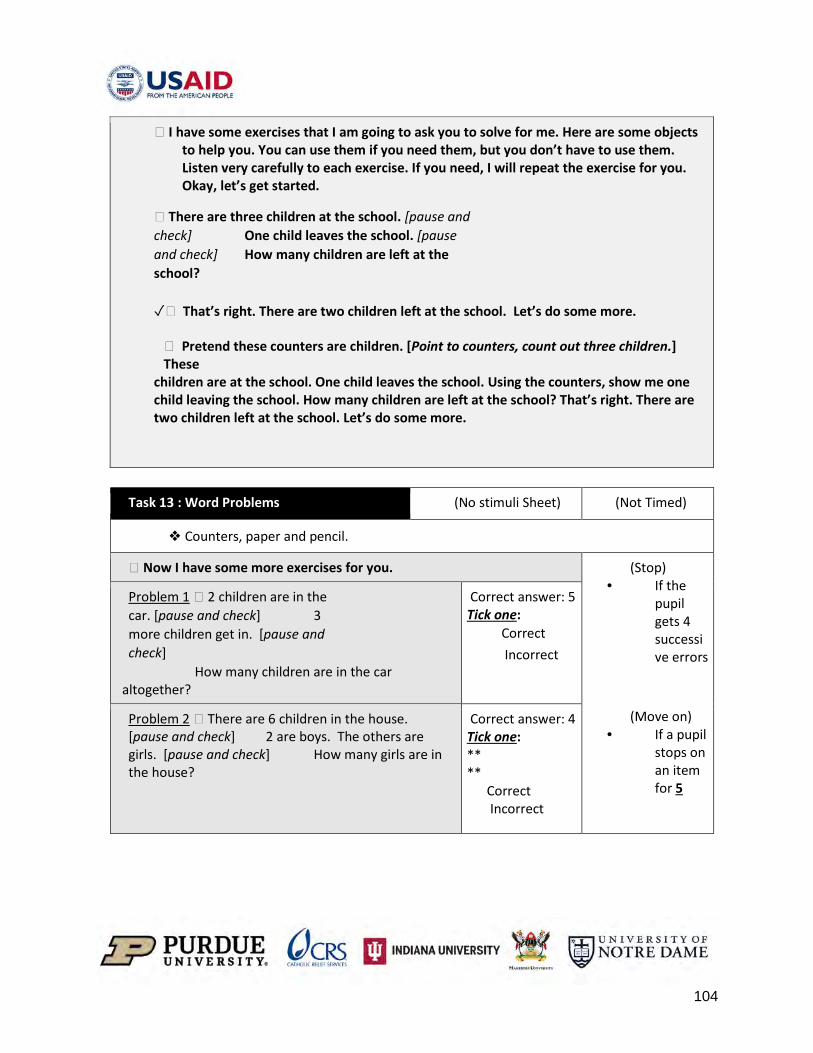
104
I have some exercises that I am going to ask you to solve for me. Here are some objects to help you. You can use them if you need them, but you don’t have to use them. Listen very carefully to each exercise. If you need, I will repeat the exercise for you. Okay, let’s get started.
There are three children at the school. [pause and check] One child leaves the school. [pause and check] How many children are left at the school? ✓ That’s right. There are two children left at the school. Let’s do some more.
Pretend these counters are children. [Point to counters, count out three children.] These
children are at the school. One child leaves the school. Using the counters, show me one child leaving the school. How many children are left at the school? That’s right. There are two children left at the school. Let’s do some more.
Task 13 : Word Problems (No stimuli Sheet) (Not Timed)
❖ Counters, paper and pencil.
Now I have some more exercises for you. (Stop) • If the
pupil gets 4 successive errors
(Move on) • If a pupil
stops on an item for 5
Problem 1 2 children are in the car. [pause and check] 3 more children get in. [pause and check]
How many children are in the car altogether?
Correct answer: 5 Tick one: ** Correct ** Incorrect
Problem 2 There are 6 children in the house. [pause and check] 2 are boys. The others are girls. [pause and check] How many girls are in the house?
Correct answer: 4 Tick one: ** ** Correct Incorrect
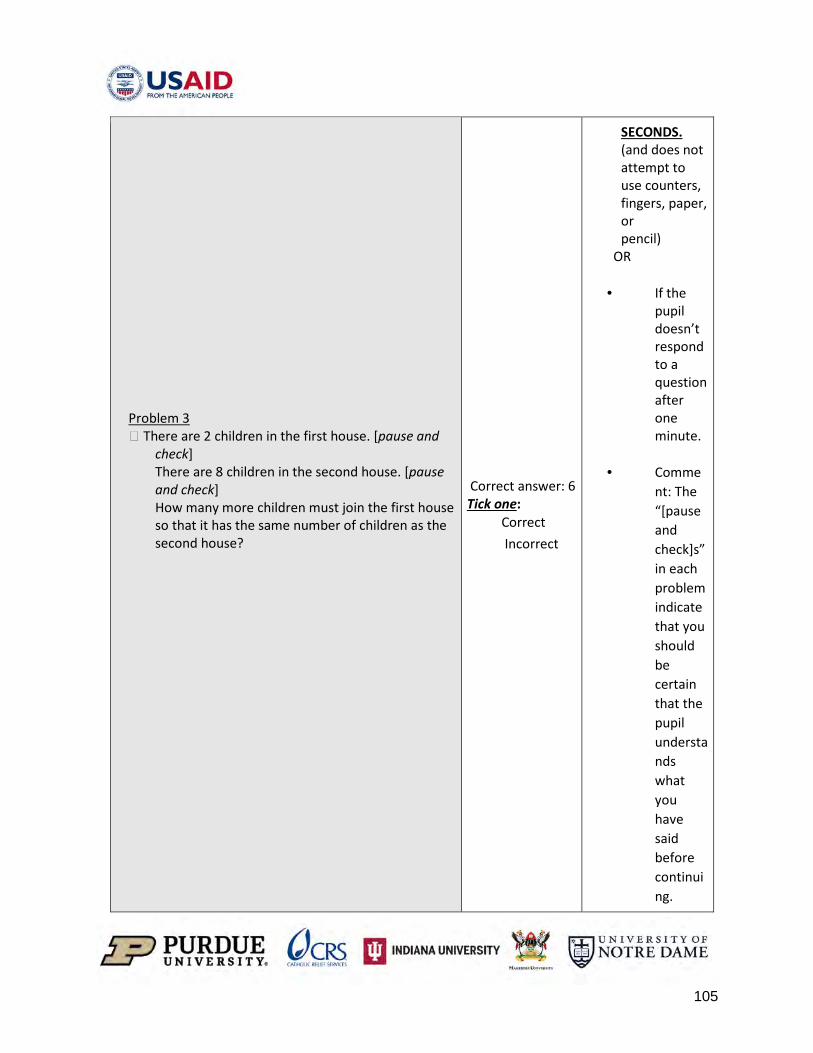
105
Problem 3 There are 2 children in the first house. [pause and
check] There are 8 children in the second house. [pause and check] How many more children must join the first house so that it has the same number of children as the second house?
Correct answer: 6 Tick one: ** Correct ** Incorrect
SECONDS. (and does not attempt to use counters, fingers, paper, or pencil)
OR
• If the pupil doesn’t respond to a question after one minute.
• Comme
nt: The “[pause and check]s” in each problem indicate that you should be certain that the pupil understands what you have said before continuing.

106
Problem 4 There are some children in the car. [pause and
check] 2 more children get into the car. [pause and check]
Now there are 9 children in the car. [pause and check] How many children were in the car at the beginning?
Correct answer: 7 Tick one: ** Correct ** Incorrect
You may want to ask, “Do you understand?”
Problem 5 There are 12 sweets. [pause and check]
4 children share the sweets equally. [pause and check] How many sweets does each child get?
Correct answer: 3 Tick one: ** Correct ** Incorrect
Problem 6 There are 5 benches in a room. [pause and check] There are 2 children on each bench. [pause
and check] How many children are in the room altogether?
Correct answer: 10 Tick one: ** Correct ** Incorrect
Number of correct responses:
Tick here if the task was discontinued due to multiple incorrect responses:
To solve the problems, indicate the method the child used [(✓)tick all that apply]: □ Solved the problems in his/her head □ Set up the problem with paper and pencil □ Fingers □ Counters □ Tick marks
□ Other ( describe) _______________________________________________________

107
What language(s) did the child use for this activity? [check all that apply]
English Juba Arabic Nuer Dinka Zande Toposha
Bari Other :___________________
Now, if the school’s language of instruction is Dinka, Nuer, Bari, Zande, or Toposha: Administer the relevant National Language EGRA, regardless of the language the child
speaks.
Else, record the time ended below. Do not administer NL EGRA. Proceed directly to the pupil background interview.
Time Ended: : AM/PM
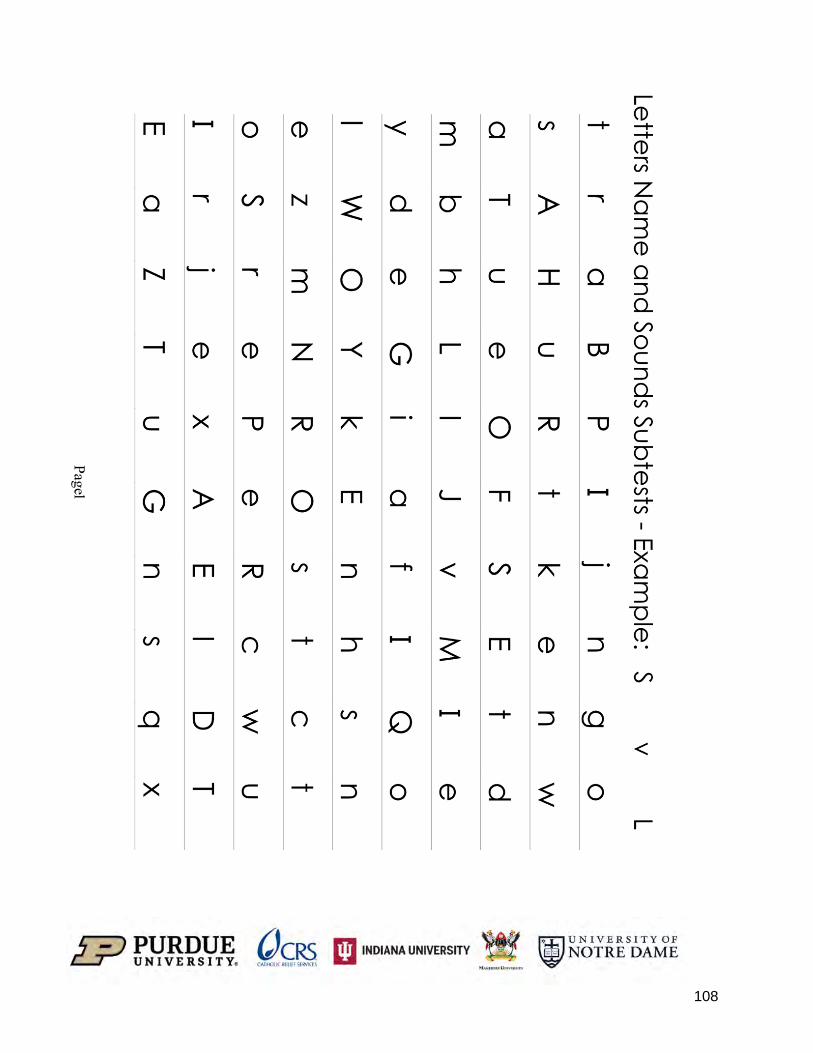
108

109
Page 2

110
Page 3
Da
vid w
ent fishing on the bank of a
river. H
e found tha
t he had
forgotten a
hook. D
avid
wa
s sad
. He w
ent to find a
hook. A
t his home, he could
not find one, so he
asked
his mother. D
avid
’s mother told
him
where to find
the hook. Da
vid w
ent back to the
river to fish.
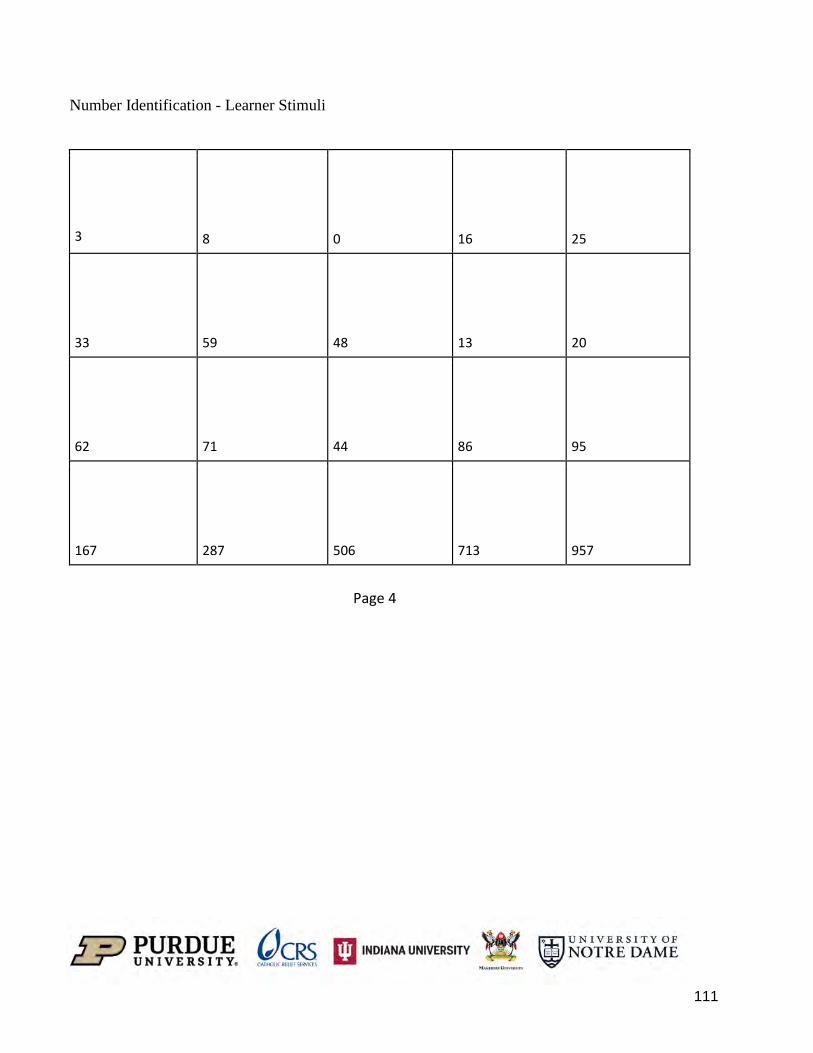
111
Number Identification - Learner Stimuli
3 8 0 16 25
33 59 48 13 20
62 71 44 86 95
167 287 506 713 957
Page 4

112
Number Discrimination – Practice Examples
8 4
12 22
Number Discrimination- Learner Stimuli
7 5
11 24
39 23
58 49
65 67
94 78
146 153
287 534
623 632
Page 5

113
Page 6

114
Page 7
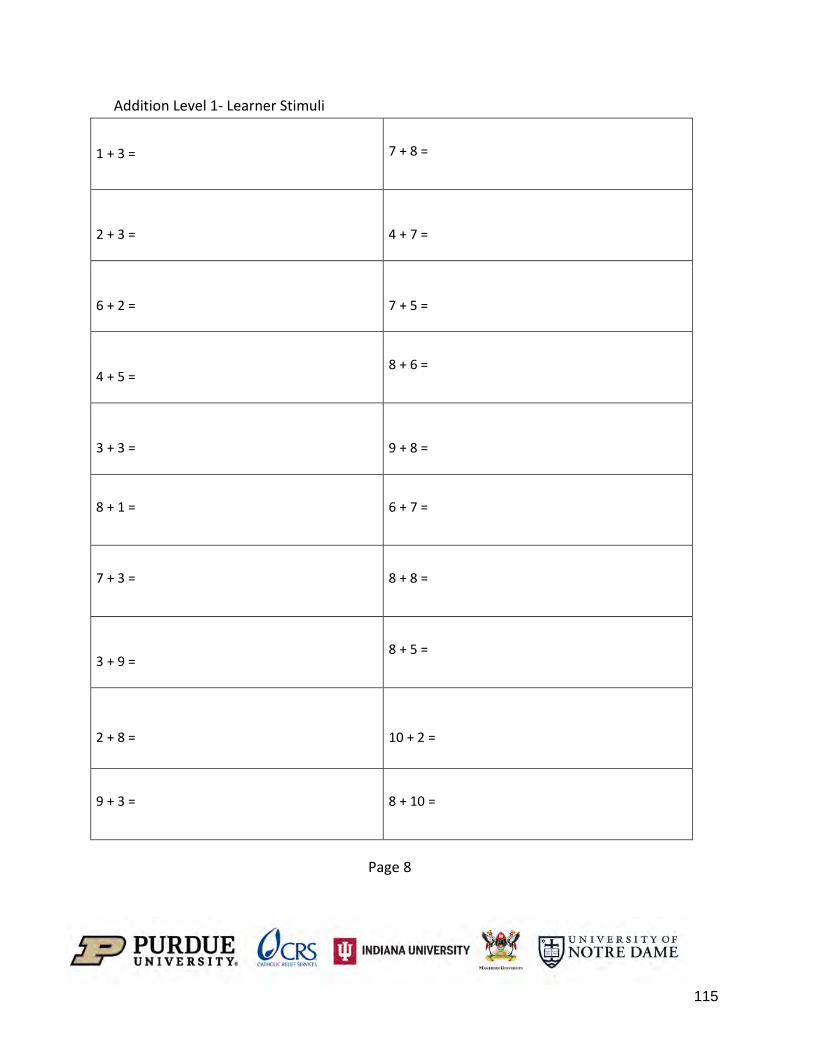
115
Addition Level 1- Learner Stimuli
1 + 3 =
7 + 8 =
2 + 3 =
4 + 7 =
6 + 2 =
7 + 5 =
4 + 5 =
8 + 6 =
3 + 3 =
9 + 8 =
8 + 1 =
6 + 7 =
7 + 3 =
8 + 8 =
3 + 9 =
8 + 5 =
2 + 8 =
10 + 2 =
9 + 3 =
8 + 10 =
Page 8

116
Addition Level 2 – Learner Stimuli
11 + 3 = iiiii
16 + 9 = iiiii
11 + 17 = iiiii
27 + 32 = iiiii
34 + 19 = iiiii
Page 9

117
Subtraction Level 1- Learner Stimuli
4 – 3 =
15 – 8 =
5 – 3 =
11 – 7 =
8 – 2 =
12 – 5 =
9 – 5 =
14 – 6 =
6 – 3 =
17 – 8 =
9 – 1 =
13 – 7 =
10 – 3 =
16 – 8 =
12 – 9 =
13 – 5 =
10 – 8 =
12 – 2 =
12 – 3 =
18 – 10 =
Page 10

118
Subtraction Level 2 – Learner Stimuli
14 - 3 = iiiii
25 - 9 = iiiii
28 - 17 = iiiii
59 - 32 = iiiii
53 - 19 = iiiii
Page 11

119
Appendix 11: Domains of Wellbeing PSS Domains Construct Sub-construct SEL Competency
Emotional Wellbeing
Emotions/Feelings
1. In the past two weeks have been able to understand my moods and feelings.[i]
Skills and knowledge for everyday (in and out of school)
Emotional awareness Self-regulation
Self -awareness
Coping skills self-management
2. In the last two weeks have you been able to use skills to calm yourself.
Skills and knowledge for everyday (in and out of school)
Emotional awareness Self-regulation
Self-awareness
Coping skills self-management
3. In the last two weeks I have been in a good mood[ii] [iii]
Emotional state Sense of wellbeing NA
4. In the last two weeks have you felt sad?[iv]
Emotional state Response to negative stimuli (stress, conflict, food insecure, etc.)
NA
5. In the last two weeks have you been worried?[v] [vi]
Emotional state Response to negative stimuli (conflict, food insecure, etc.)
NA
Behavioral
6. In the last two weeks have you gotten angry and lost your temper?[vii]
Emotional state
Response to negative stimuli/stressor
Self-awareness
Emotional awareness and Self-regulation
self-management
7. In the last two weeks have you had bad dreams?[viii]
Cognitive impacts Stress reaction Response to negative stimuli/stressor
NA
8. In the last two weeks have you been able to concentrate/pay attention in the classroom?[ix]
Cognitive impacts Response to negative stimuli /stressor
Skills and knowledge for everyday
Emotional awareness and Self-regulation

120
Social Wellbeing
9. In the last two weeks I have been helpful to others[x]
Positive view of self and feeling valued Hope
Role fulfillment empathy Self-efficacy
Social Awareness Responsible decision making Self-awareness
10. In the last two weeks have you felt you had someone you trust to help you when you needed to? [xi]
Sense of security, safety and support
Supportive adult relationship
Social Awareness Relationship skills
11. In the last two weeks have you felt that your parents/caregivers listened to you and respected your opinion?
Sense of security, safety and support
Supportive adult relationship
Social Awareness Relationship skills
Positive view of self and feeling valued
Self esteem Self-awareness
12. In the last two weeks have you been picked on or bullied in school? [xiv]
Sense of security, safety and support
Interpersonal skills School climate
Relationship skills
13. In the last two weeks have you spent time with your friends? [xv]
Social connectedness Secure peer relationships Sense of belonging
Relationship skills
14. In the last two weeks have you felt that your school is a nice place to be in? [xvi]
Sense of security, safety and support
School climate Supportive adult relationship Sense of belonging
NA
15. In the last two weeks have you felt that your teacher listened to you and respected your opinion? [xvii]
Sense of security, safety and support
Supportive adult relationship
Relationship skills
Positive view of self and feeling valued
Self-esteem
Self-awareness
Resilience/Coping
16. In the last two weeks have you been in situations where you felt helpless?[xviii]
Sense of security, safety and support
Supportive adult relationship
Relationship skills
Emotional state Response to negative stimuli/stressor
Self-awareness

121
Positive view of self and feeling valued
Self-efficacy Self-management
17. In the last two weeks, I have found friendly ways to solve disputes[xix]
Skills and knowledge for everyday (in and out of school)
Emotional awareness Self-regulation
Self-management
Respecting others Social awareness
Communication Relationship skills
18. In the last two weeks I have tried to understand how other people feel or think[xx]
Social connectedness Skills and knowledge for everyday (in and out of school)
Empathy respecting others Sense of belonging
Social Awareness
19. In the last two weeks have you been able to do the things you wanted to do in your free time?[xxi]
Positive view of self and feeling valued Hope
Self-efficacy Creative thinking, time for play
Responsible decision making Self-awareness
20. In the last two weeks have you suggested activities or games to do with your friends? [xxii]
Positive view of self and feeling valued Social connectedness
Creative thinking, time for play Self-efficacy
Self-awareness
Adolescents
21. In the last two weeks, I have had opportunities to show others that I am becoming an adult and can act responsibly. [xxiii]
Positive view of self and feeling valued
Self-efficacy Personal achievement
Responsible decision making
Skills and knowledge for everyday (in and out of school)
Role fulfillment Social awareness
22. In the last two weeks, have you done well taking care of your responsibilities?
Positive view of self and feeling valued
Self-efficacy Personal achievement
Responsible decision making
Skills and knowledge for everyday (in and out of school)
Role fulfillment Social Awareness
23. In the last two weeks I have been feeling under pressure. [xxiv]
Cognitive impacts/emotional state
Stress response Self-awareness
Role fulfillment Social awareness
Peer relationships Responsible decision making

122
24. My friends stand by me during difficult times[xxv]
Social connectedness Peer relationships Sense of belonging
Relationship skills
25. A lot of things about me are good.[xxvi]
Positive view of self and feeling valued hope
Self-esteem Self-awareness
26. My belief in myself gets me through hard times.
Positive view of self and feeling valued Hope
Self-esteem Self-efficacy
Self-awareness
27. If I really try, I can do almost anything I want to do.[xxvii]
Positive view of self and feeling valued Hope
Self esteem Self-efficacy
Self-awareness

123
Appendix 12: Density plots of EGRA and EGMA scores by school type and urbanicity We illustrate the differential distribution of students in rural vs. urban schools and in government vs. community schools to show more clearly the justification for this approach. Although the distribution of EGRA and EGMA scores for government and community schools is similar, it is notable that the mean scores are in the mid to lower range of the EGRA/EGMA scales, with a clear right skew. Students in rural schools vs. urban schools show a clearly lower distribution of scores, in particular on literacy, and it was this differential that initially concerned us and led to sampling P5.

124

125