
Impact assessment: residential charging infrastructure provision › government › ... ·...
42
1 Title: Residential charging infrastructure provision IA No: DfT00412 RPC Reference No: Lead department or agency: DfT Other departments or agencies: MHCLG Impact Assessment (IA) Date: 24/06/2019 Stage: Consultation Source of intervention: EU Type of measure: Secondary legislation Contact for enquiries: [email protected], [email protected] Summary: Intervention and Options RPC Opinion: RPC Opinion Status Cost of Preferred (or more likely) Option (in 2016 prices) Total Net Present Social Value Business Net Present Value Net cost to business per year Business Impact Target Status Qualifying provision £434.6m -£1.3bn £55.0m What is the problem under consideration? Why is government intervention necessary? To address the harmful impacts caused by emissions from Internal Combustion Engine Vehicles (ICEs) and meet legally binding targets for reducing Green House Gas (GHG) emissions the Government has set the ambition that all new cars and vans sold will be effectively zero emission by 2040. To achieve this, the UK will need a well-developed network of charging infrastructure for Electric Vehicles (EVs), delivered at least cost. Charging at home and overnight is currently preferred by EV owners due to convenience and lower costs. It is anticipated that charging at home and overnight will be the preferred mode of charging in the future; however, house builders do not install the necessary charging infrastructure at the point of construction, which would be cheaper than retrofitting charging infrastructure at a later date. The transition to EVs is likely to result in significant retrofit costs in residential dwellings which could be avoided with regulation. What are the policy objectives and the intended effects? The policy looks to ensure that every new home has a chargepoint where appropriate, a policy the Government committed to consult on in the Road to Zero strategy. Updating the Building Regulations to include provisions for electric vehicle charging infrastructure will ensure that homes have the necessary Ultra Low Emission Vehicle (ULEV) charging infrastructure to support future ULEV uptake. It also aims to impact the likelihood of homeowners purchasing ULEVs, to help support the government’s ULEV uptake ambitions. If chargepoints become readibly available in homes and at key destinations, a key barrier to purchasing a ULEV will be removed, helping to support further uptake of ULEVs. What policy options have been considered, including any alternatives to regulation? Please justify preferred option (further details in Evidence Base) The EU Energy Performance in Buildings Directive (EPBD) sets minimum requirements for charging infrastructure in new residential and non-residential buildings, which the UK is required to transpose. This IA considers the impacts of two options for transposition, costed against a ‘Do nothing’ baseline in which there is no regulation – these are; i. Transposition of rules set out in the directive requiring that ducting be installed for all parking spaces of new or majorly renovated buildings which have over 10 parking spaces. ii. Charging infrastructure to be installed for all parking spaces in all new buildings, including ducting, cabling and at least one chargepoint per dwelling. Option (ii) is preferred as it is expected going further than minimum implementation of the EPBD will result in more cost savings and promote the uptake of ULEVs. Alternatives to mandating this through regulations include continued support through grants such as the Electric Vehicle Homecharge Scheme and other investment-based policy, however these do not provide incentives to install charging infrastructure installation at the point of construction in the same way. Will the policy be reviewed? It will be reviewed. If applicable, set review date: 04/2025 Does implementation go beyond minimum EU requirements? Yes Is this measure likely to impact on trade and investment? No Are any of these organisations in scope? Micro Yes Small Yes Medium Yes Large Yes What is the CO2 equivalent change in greenhouse gas emissions? (Million tonnes CO2 equivalent) Traded: Non-traded:
Transcript of Impact assessment: residential charging infrastructure provision › government › ... ·...

1
Title: Residential charging infrastructure provision IA No: DfT00412 RPC Reference No: Lead department or agency: DfT Other departments or agencies: MHCLG
Impact Assessment (IA) Date: 24/06/2019 Stage: Consultation
Source of intervention: EU Type of measure: Secondary legislation Contact for enquiries: [email protected], [email protected]
Summary: Intervention and Options
RPC Opinion: RPC Opinion Status
Cost of Preferred (or more likely) Option (in 2016 prices) Total Net Present Social Value
Business Net Present Value
Net cost to business per year Business Impact Target Status
Qualifying provision £434.6m -£1.3bn £55.0m What is the problem under consideration? Why is government intervention necessary? To address the harmful impacts caused by emissions from Internal Combustion Engine Vehicles (ICEs) and meet legally binding targets for reducing Green House Gas (GHG) emissions the Government has set the ambition that all new cars and vans sold will be effectively zero emission by 2040. To achieve this, the UK will need a well-developed network of charging infrastructure for Electric Vehicles (EVs), delivered at least cost. Charging at home and overnight is currently preferred by EV owners due to convenience and lower costs. It is anticipated that charging at home and overnight will be the preferred mode of charging in the future; however, house builders do not install the necessary charging infrastructure at the point of construction, which would be cheaper than retrofitting charging infrastructure at a later date. The transition to EVs is likely to result in significant retrofit costs in residential dwellings which could be avoided with regulation.
What are the policy objectives and the intended effects? The policy looks to ensure that every new home has a chargepoint where appropriate, a policy the Government committed to consult on in the Road to Zero strategy. Updating the Building Regulations to include provisions for electric vehicle charging infrastructure will ensure that homes have the necessary Ultra Low Emission Vehicle (ULEV) charging infrastructure to support future ULEV uptake. It also aims to impact the likelihood of homeowners purchasing ULEVs, to help support the government’s ULEV uptake ambitions. If chargepoints become readibly available in homes and at key destinations, a key barrier to purchasing a ULEV will be removed, helping to support further uptake of ULEVs.
What policy options have been considered, including any alternatives to regulation? Please justify preferred option (further details in Evidence Base) The EU Energy Performance in Buildings Directive (EPBD) sets minimum requirements for charging infrastructure in new residential and non-residential buildings, which the UK is required to transpose. This IA considers the impacts of two options for transposition, costed against a ‘Do nothing’ baseline in which there is no regulation – these are;
i. Transposition of rules set out in the directive requiring that ducting be installed for all parking spaces ofnew or majorly renovated buildings which have over 10 parking spaces.
ii. Charging infrastructure to be installed for all parking spaces in all new buildings, including ducting,cabling and at least one chargepoint per dwelling.
Option (ii) is preferred as it is expected going further than minimum implementation of the EPBD will result in more cost savings and promote the uptake of ULEVs. Alternatives to mandating this through regulations include continued support through grants such as the Electric Vehicle Homecharge Scheme and other investment-based policy, however these do not provide incentives to install charging infrastructure installation at the point of construction in the same way. Will the policy be reviewed? It will be reviewed. If applicable, set review date: 04/2025 Does implementation go beyond minimum EU requirements? Yes
Is this measure likely to impact on trade and investment? No
Are any of these organisations in scope? Micro Yes
Small Yes
Medium Yes
Large Yes
What is the CO2 equivalent change in greenhouse gas emissions? (Million tonnes CO2 equivalent)
Traded: Non-traded:

2
I have read the Impact Assessment and I am satisfied that, given the available evidence, it represents a reasonable view of the likely costs, benefits and impact of the leading options.
Signed by the responsible SELECT SIGNATORY: Date:
3
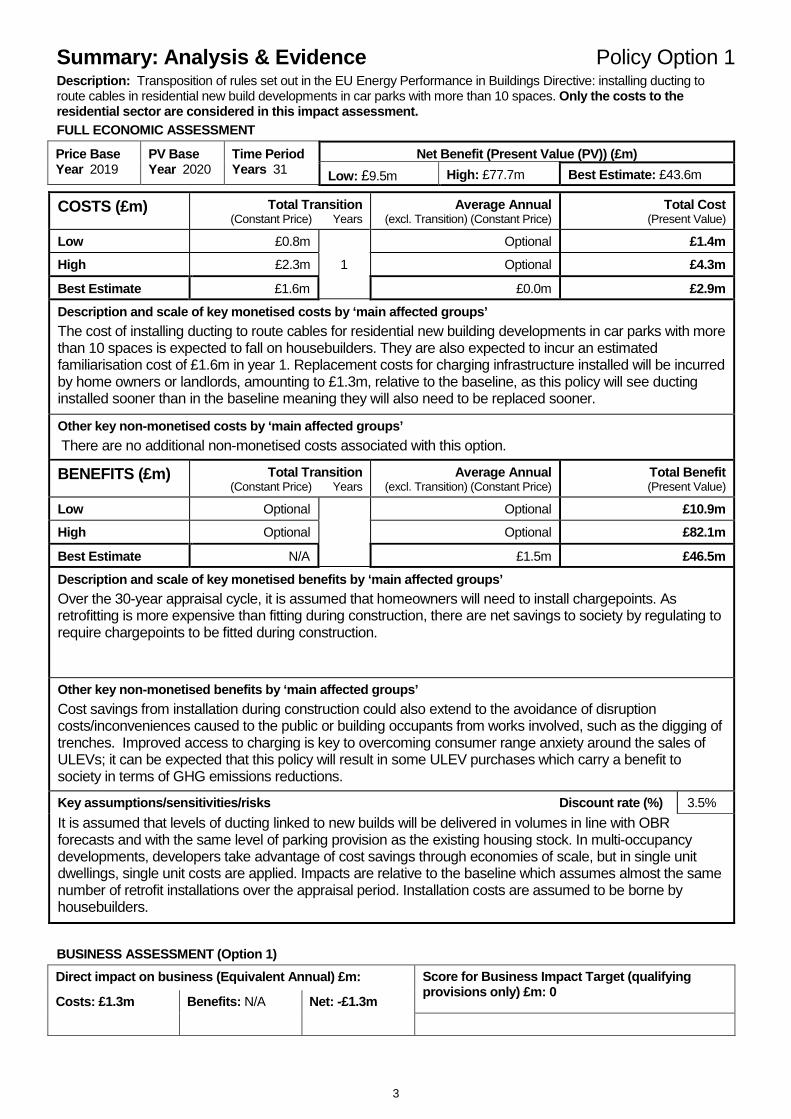
Summary: Analysis & Evidence Policy Option 1 Description: Transposition of rules set out in the EU Energy Performance in Buildings Directive: installing ducting to route cables in residential new build developments in car parks with more than 10 spaces. Only the costs to the residential sector are considered in this impact assessment. FULL ECONOMIC ASSESSMENT
Price Base Year 2019
PV Base Year 2020
Time Period Years 31
Net Benefit (Present Value (PV)) (£m) Low: £9.5m High: £77.7m Best Estimate: £43.6m
COSTS (£m) Total Transition
(Constant Price) Years
Average Annual (excl. Transition) (Constant Price)
Total Cost (Present Value)
Low £0.8m
1
Optional £1.4m High £2.3m Optional £4.3m
Best Estimate
£1.6m £0.0m £2.9m Description and scale of key monetised costs by ‘main affected groups’ The cost of installing ducting to route cables for residential new building developments in car parks with more than 10 spaces is expected to fall on housebuilders. They are also expected to incur an estimated familiarisation cost of £1.6m in year 1. Replacement costs for charging infrastructure installed will be incurred by home owners or landlords, amounting to £1.3m, relative to the baseline, as this policy will see ducting installed sooner than in the baseline meaning they will also need to be replaced sooner.
Other key non-monetised costs by ‘main affected groups’ There are no additional non-monetised costs associated with this option.
BENEFITS (£m) Total Transition (Constant Price) Years
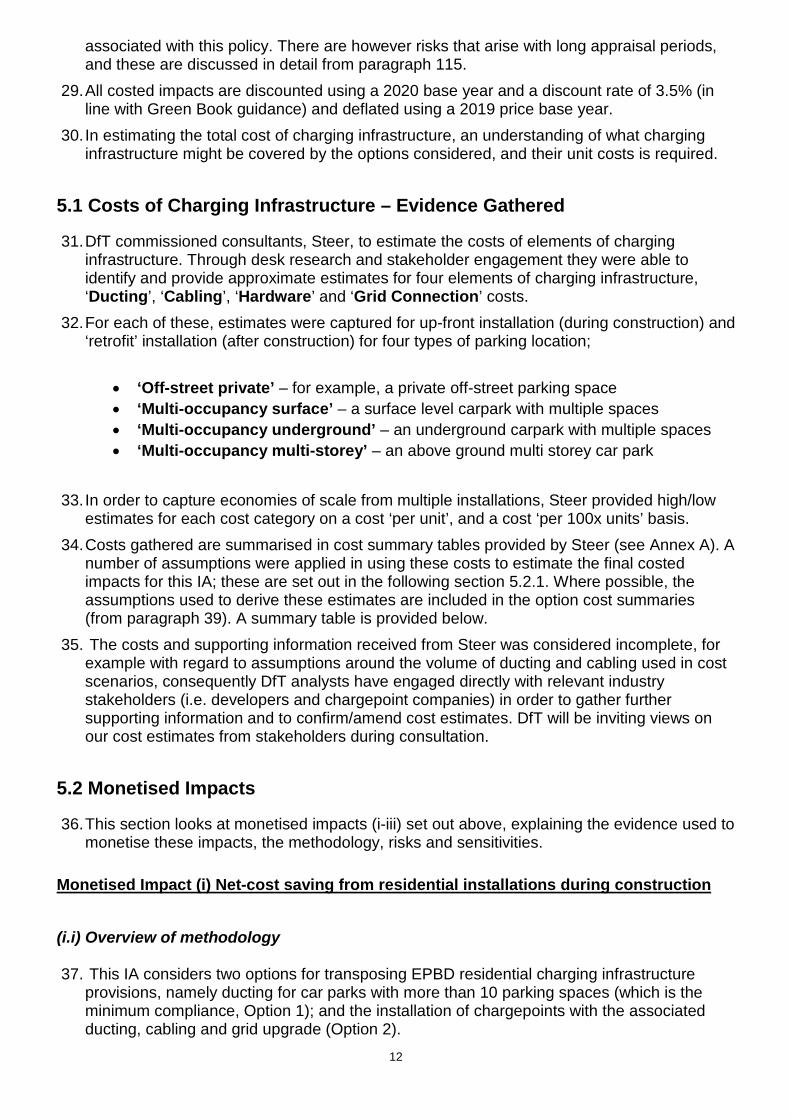
Average Annual (excl. Transition) (Constant Price)
Total Benefit (Present Value)
Low Optional
Optional £10.9m High Optional Optional £82.1m
Best Estimate
N/A £1.5m £46.5m Description and scale of key monetised benefits by ‘main affected groups’ Over the 30-year appraisal cycle, it is assumed that homeowners will need to install chargepoints. As retrofitting is more expensive than fitting during construction, there are net savings to society by regulating to require chargepoints to be fitted during construction.
Other key non-monetised benefits by ‘main affected groups’ Cost savings from installation during construction could also extend to the avoidance of disruption costs/inconveniences caused to the public or building occupants from works involved, such as the digging of trenches. Improved access to charging is key to overcoming consumer range anxiety around the sales of ULEVs; it can be expected that this policy will result in some ULEV purchases which carry a benefit to society in terms of GHG emissions reductions.
Key assumptions/sensitivities/risks Discount rate (%)
3.5% It is assumed that levels of ducting linked to new builds will be delivered in volumes in line with OBR forecasts and with the same level of parking provision as the existing housing stock. In multi-occupancy developments, developers take advantage of cost savings through economies of scale, but in single unit dwellings, single unit costs are applied. Impacts are relative to the baseline which assumes almost the same number of retrofit installations over the appraisal period. Installation costs are assumed to be borne by housebuilders.
BUSINESS ASSESSMENT (Option 1) Direct impact on business (Equivalent Annual) £m: Score for Business Impact Target (qualifying
provisions only) £m: 0 Costs: £1.3m Benefits: N/A Net: -£1.3m

4
Summary: Analysis & Evidence Policy Option 2 Description: Installation of one chargepoint per dwelling in all new residential dwellings and dwellings undergoing major renovations, with an associated parking space. FULL ECONOMIC ASSESSMENT
Price Base Year 2019
PV Base Year 2020
Time Period Years 31
Net Benefit (Present Value (PV)) (£m) Low: £76.2m High: £793.0m Best Estimate: £434.6m
COSTS (£m) Total Transition
(Constant Price) Years
Average Annual (excl. Transition) (Constant Price)
Total Cost (Present Value)
Low £0.8m
1
Optional £103.1m High £2.4m Optional £309.2m
Best Estimate
£1.6m £6.6m £206.2m Description and scale of key monetised costs by ‘main affected groups’ It is estimated that requiring the installation of one chargepoint per dwelling during construction of new residential buildings, compared to a counterfactual in which one chargepoint per dwelling is retrofitted, will yield a net cost of £206.2m. Housebuilders and chargepoint installers are expected to incur familiarisation costs £1.6m in year 1. Replacement costs for charging infrastructure will be incurred by home owners or landlords, amounting to £204.6m, relative to the baseline, with ducting installed sooner than in the baseline meaning it will also need replacing sooner. Other key non-monetised costs by ‘main affected groups’ There are no additional non-monetised costs associated with this option.
BENEFITS (£m) Total Transition (Constant Price) Years
Average Annual (excl. Transition) (Constant Price)
Total Benefit (Present Value)
Low Optional
Optional £179.3m High Optional Optional £1,102.2m
Best Estimate
N/A £20.7m £640.8m Description and scale of key monetised benefits by ‘main affected groups’ The sole monetised benefit for this option is the cost saving against the baseline scenario where chargepoints are retrofit installed into existing properties. This benefit is borne by homeowners.
Other key non-monetised benefits by ‘main affected groups’ There are also crucial non-monetised benefits to society in terms of the emissions savings as a result of the expected increase in EV uptake due to an expansion of the access to home charging for consumers who live in one of the new-build properties. It is difficult to quantify the degree to which this policy will increase EV uptake, but an impact on purchasing decisions is expected. Indicative figures have been provided to give a sense of the scale of the benefits in various uptake scenarios.
Key assumptions/sensitivities/risks Discount rate (%)
3.5% As well as the assumptions listed for policy option 1, there is a risk of stranded assets, if there are structural changes to car ownership, or if charging technology becomes obsolete. Impacts are relative to the baseline which assumes almost the same number of retrofit installations over the appraisal period. Installation costs are assumed to be borne by housebuilders.
BUSINESS ASSESSMENT (Option 2) Direct impact on business (Equivalent Annual) £m: Score for Business Impact Target (qualifying
provisions only) £m: £268.3m Costs: £55.0m Benefits: N/A
Net: -£55.0m

5
Evidence Base (for summary sheets)
Contents Impact Assessment (IA) ............................................................................................................... 1
Summary: Intervention and Options ............................................................................................. 1
RPC Opinion: .............................................................................................................................. 1
Summary: Analysis & Evidence Policy Option 1 ........................................................................ 3
Summary: Analysis & Evidence Policy Option 2 ........................................................................ 4
Evidence Base (for summary sheets) .......................................................................................... 5
1. Background .............................................................................................................................. 6
2. Problem under consideration ................................................................................................... 7
3. Policy Objective and Context ................................................................................................... 8
4. Rationale for Intervention ......................................................................................................... 9
4.1 Options ............................................................................................................................. 10
4.2 Preferred Option ............................................................................................................... 11
5. Evidence Base ....................................................................................................................... 11
5.1 Costs of Charging Infrastructure – Evidence Gathered .................................................... 12
5.2 Monetised Impacts ........................................................................................................... 12
Monetised Impact (i) Net-cost saving from residential installations during construction ..... 12
Monetised Impact (ii) Familiarisation costs ......................................................................... 20
Monetised Impact (iii) Material Replacement costs ............................................................. 21
5.3 Non-monetised Impacts .................................................................................................... 22
Non-monetised Impact (iv) Emissions Savings ................................................................... 22
Non-monetised Impact (vi) Avoided disruption costs .......................................................... 24
6. Results ................................................................................................................................... 24
6.1 Evidence Summary and preferred option ......................................................................... 24
6.2 Sensitivity Analysis ........................................................................................................... 25
6.3 Proportionality Approach .................................................................................................. 28
6.4 Risks ................................................................................................................................. 28
7. Distributional Impacts ............................................................................................................. 29
7.1 Cost incidence .................................................................................................................. 29
7.2 Direct costs and benefits to business calculations ........................................................... 30
7.3 Small and Micro Business Assessment: ........................................................................... 31
7.4 Monitoring and Evaluation: ............................................................................................... 34
8. Summary: ............................................................................................................................... 34
Annexes: .................................................................................................................................... 36
Annex A: Steer cost tables .................................................................................................. 36
Annex B: Option Cost summaries ....................................................................................... 37
Annex C: Consultation questions ........................................................................................ 41

6
1. Background 1. The Energy Performance of Buildings Directive (EPBD) is the European Union’s (EU’s)
main legislation for improving energy performance and delivering cost effective Green House Gas (GHG) emission reductions across the EU from buildings.
2. A review of the EPBD in 2016 concluded, among other things, that buildings legislation could be used to achieve broader objectives in ‘contributing to (the) decarbonisation of the Transport’ sector as well as fill a regulatory gap in EU infrastructure legislation to support the deployment of charging infrastructure in non-publicly accessible spaces1; considered essential given a significant proportion of charging for Electric Vehicles takes place at home and in private parking areas.
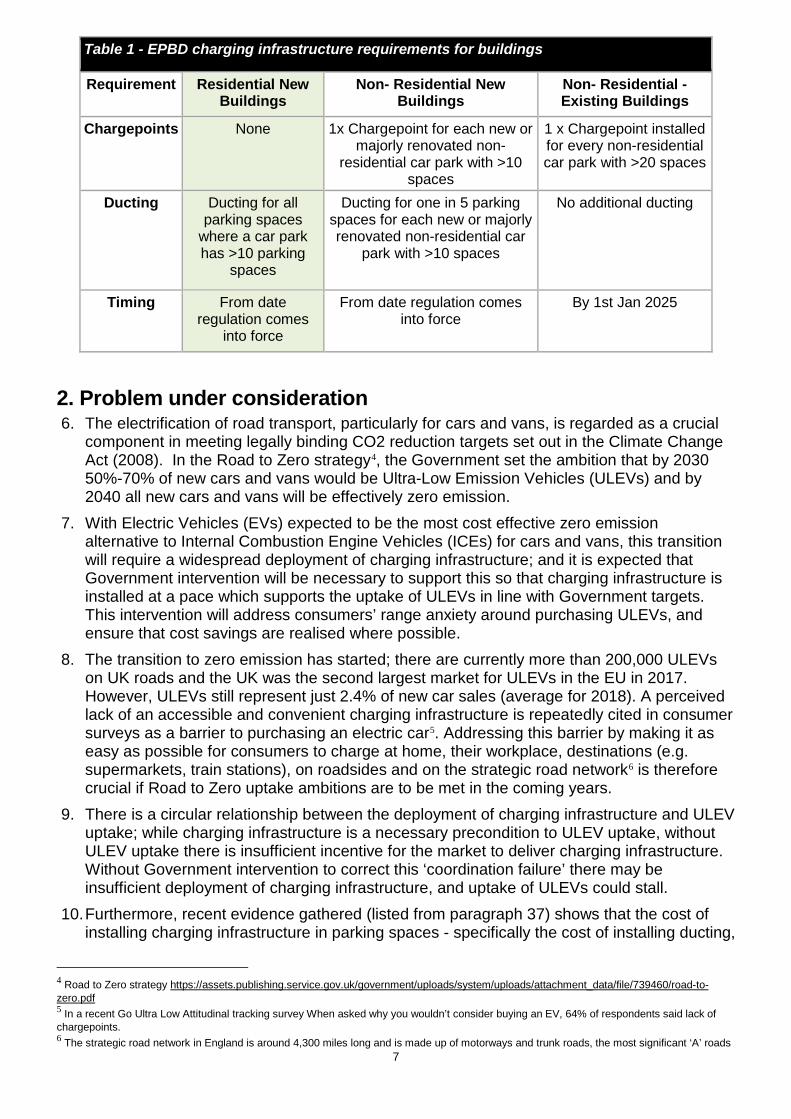
3. Consequently, a number of proposals were made to extend the provisions in the EPBD, including the addition of minimum requirements for charging infrastructure in new residential and non-residential buildings. The requirements are that ducting2 (underground tubing which allows for the easy routing of cabling at a later date) be installed in every new residential building with more than 10 parking spaces, and that in new non-residential developments there should be at least one chargepoint and ducting for one in five parking spaces. For existing non-residential developments, the requirement is for one chargepoint per car park with more than 20 spaces.
4. This IA looks specifically at provisions for charging infrastructure for residential new buildings, as well as buildings undergoing major renovations. Crucially, only residential new builds with associated off-street parking are in scope of this regulation. New builds with on-street parking are not affected by EPBD. A separate IA will assess the implications of the non-residential requirements of the EPBD.
5. Transposition of the EPBD will be done in line with guiding transposition principles3. On 23 June 2016, the EU referendum took place and the people of the United Kingdom voted to leave the European Union. Until exit negotiations are concluded, the UK remains a full member of the European Union and all the rights and obligations of EU membership remain in force. During this period the Government will continue to negotiate, implement and apply EU legislation. The outcome of these negotiations will determine what arrangements apply in relation to EU legislation in future once the UK has left the EU
1 http://www.legislation.gov.uk/uksi/2017/897/pdfs/uksi_20170897_en.pdf Alternative Fuels Infrastructure Directive covers public charging provision 2 Ducting is considered to be any conduit for routing cables from the power supply to the chargepoint. These can include cable trays and subsurface trenches. 3 https://assets.publishing.service.gov.uk/government/uploads/system/uploads/attachment_data/file/682752/eu-transposition-guidance.pdf EU transposition guidance.
7
Table 1 - EPBD charging infrastructure requirements for buildings
Requirement Residential New Buildings
Non- Residential New Buildings
Non- Residential - Existing Buildings
Chargepoints None 1x Chargepoint for each new or majorly renovated non-
residential car park with >10 spaces
1 x Chargepoint installed for every non-residential car park with >20 spaces
Ducting Ducting for all parking spaces
where a car park has >10 parking
spaces
Ducting for one in 5 parking spaces for each new or majorly renovated non-residential car
park with >10 spaces
No additional ducting
Timing From date regulation comes
into force
From date regulation comes into force
By 1st Jan 2025
2. Problem under consideration 6. The electrification of road transport, particularly for cars and vans, is regarded as a crucial
component in meeting legally binding CO2 reduction targets set out in the Climate Change Act (2008). In the Road to Zero strategy4, the Government set the ambition that by 2030 50%-70% of new cars and vans would be Ultra-Low Emission Vehicles (ULEVs) and by 2040 all new cars and vans will be effectively zero emission.
7. With Electric Vehicles (EVs) expected to be the most cost effective zero emission alternative to Internal Combustion Engine Vehicles (ICEs) for cars and vans, this transition will require a widespread deployment of charging infrastructure; and it is expected that Government intervention will be necessary to support this so that charging infrastructure is installed at a pace which supports the uptake of ULEVs in line with Government targets. This intervention will address consumers’ range anxiety around purchasing ULEVs, and ensure that cost savings are realised where possible.
8. The transition to zero emission has started; there are currently more than 200,000 ULEVs on UK roads and the UK was the second largest market for ULEVs in the EU in 2017. However, ULEVs still represent just 2.4% of new car sales (average for 2018). A perceived lack of an accessible and convenient charging infrastructure is repeatedly cited in consumer surveys as a barrier to purchasing an electric car5. Addressing this barrier by making it as easy as possible for consumers to charge at home, their workplace, destinations (e.g. supermarkets, train stations), on roadsides and on the strategic road network6 is therefore crucial if Road to Zero uptake ambitions are to be met in the coming years.
9. There is a circular relationship between the deployment of charging infrastructure and ULEV uptake; while charging infrastructure is a necessary precondition to ULEV uptake, without ULEV uptake there is insufficient incentive for the market to deliver charging infrastructure. Without Government intervention to correct this ‘coordination failure’ there may be insufficient deployment of charging infrastructure, and uptake of ULEVs could stall.
10. Furthermore, recent evidence gathered (listed from paragraph 37) shows that the cost of installing charging infrastructure in parking spaces - specifically the cost of installing ducting,
4 Road to Zero strategy https://assets.publishing.service.gov.uk/government/uploads/system/uploads/attachment_data/file/739460/road-to-zero.pdf 5 In a recent Go Ultra Low Attitudinal tracking survey When asked why you wouldn’t consider buying an EV, 64% of respondents said lack of chargepoints. 6 The strategic road network in England is around 4,300 miles long and is made up of motorways and trunk roads, the most significant ‘A’ roads

8
cabling and a chargepoint after construction is completed, is higher than installation during construction. Which means that without an incentive to install infrastructure during construction, a less cost-effective deployment of charging infrastructure will take place.
11. To support the deployment of charging infrastructure in both public and private spaces, there have been a number of government interventions to date, the policy background and objective of the policy discussed in this IA is set out below.
3. Policy Objective and Context 12. The policy objective is to prepare for the transition to ULEVs by ensuring a suitable
provision of charging infrastructure in new residential dwellings where appropriate; as well as to facilitate the transition to ULEVs by raising the visibility of charging infrastructure and improving public perception of chargepoint availability.
13. The Government has intervened a number of times to promote the installation of chargepoints in both public and private spaces. For public charging, a widespread public chargepoint network is important for drivers who do high mileage, travel long distances and/or have no access to chargepoints at home or work. Government funding and leadership, alongside private sector investment has supported the installation of more than 17,000 public chargepoints7. This includes over 1,700 rapid chargepoints - one of the largest networks in Europe.
14. An important part of the public network is the destination charging market. Destination chargers largely comprise of 3, 7 and 22 kW AC chargers in public locations where cars are parked for more than an hour.
15. Early public installations were supported by the Plugged in Places Scheme. These networks were initially owned and run by consortia largely led by local authorities. Over time ownership of many of the publicly available/destination parts of these networks have shifted to industry. Today, the majority of public chargepoints are financed by the private sector. The Government provides support for the installation of workplace charging through the Workplace Charging Scheme (WCS). The Government has also provided £40m of funding via the Go Ultra Low city scheme to eight cities across the UK to support uptake of ultra-low emission vehicles in those cities. To date, over 300 chargepoints have been installed as part of this scheme. Additional charging hubs are being installed across the country– including in York and Milton Keynes.
16. In terms of domestic charging, the Government has supported the installation of almost 100,000 domestic chargepoints in the UK, and currently offers a £500 grant through the Electric Vehicle Home-charge Scheme (EVHS) for those with off-street parking. For residential areas without access to off-street parking, the Government provides funds to local authorities to install infrastructure through the On-Street Residential Charging Scheme (ORCS).
17. Excluding installation costs, evidence shows charging at home is generally more convenient and cheaper than using the public network. For example, using Zap Map’s charging calculators8, the comparative cost of a Nissan Leaf charged by at a 7kW home and public chargepoint is £4.48 and £9.60 respectively. Studies show that around 80% of electric car owners charge their car at home9. Many drivers report never using the public network if they have access to a chargepoint at home given the convenience and low cost (around 3p a
7 Figures taken from ZapMap, and amended to reflect the volume of chargepoints that could be used simultaneously - https://www.zap-map.com/statistics/ (April 2019) 8 ZapMap: public charging calculator https://www.zap-map.com/tools/public-charging-calculator/ (April 2019) 9 Road to Zero strategy https://assets.publishing.service.gov.uk/government/uploads/system/uploads/attachment_data/file/739460/road-to-zero.pdf

9
mile). 98% of journeys in the UK are less than 50 miles10, which is well within the range of a modern electric vehicle. It is therefore expected that a large amount of electric vehicle charging to continue to happen at people’s homes.
18. Longer term, charging at home is also likely to be preferable when it comes to managing the electricity system; as charging at home, overnight will mean less addition to peak electricity demand during the day, and allow the realisation of potential benefits from Demand Side Response (DSR) and other load management technologies.
4. Rationale for Intervention 19. The overarching rationale behind government action to decarbonise road transport is to
address the social cost of emissions from the private consumption of road transport from ICE vehicles. Supporting the transition to ULEVs to tackle this problem requires intervention for further market failures which, without intervention, would likely be a barrier to the transition to ULEVs at the pace required to meet targets and at least cost. The failures which need to be addressed are;
a. Supporting ULEV uptake (Negative Externality): A negative externality exists with the consumption of transport through traditional internal combustion engine (ICE) vehicles. Pollution from these vehicles imposes a cost on those not using ICE vehicles (such as pedestrians and cyclists), such that the true cost to society is higher than the cost that an individual using the ICE vehicle has to bear. In this case, ICE vehicles will be over-consumed and ULEV take-up will be slower than if the individual had to bear the full costs of their ICE consumption decisions. ULEV adoption removes or heavily reduces this negative externality, as there are zero or low emissions at the point of use (discussion about EV emissions savings is made from paragraph 93). There is therefore evidence of market failure in the consumption of road transport. Given this negative externality, it is necessary to make the transition towards the decarbonisation of transport. EV uptake is also likely to form a key part of the Emission Reduction Plan, which will be set out in the Government’s strategy for meeting the 5th Carbon Budget.
b. Allocative inefficiency: The electrification of road transport is necessary to meet decarbonisation goals, it is also important to ensure that this is achieved in the most cost-effective way possible. Given that the Government aims to end the sale of ICE vehicles from 2040, the transition to ULEVs, and more specifically Electric Vehicles is certain. This is likely to require costs associated with the installation of charging infrastructure, and there are substantial cost efficiencies that are being missed when homeowners retrofit chargepoints into their homes. There can be significant cost and logistical difficulties involved with retrofitting chargepoints into existing properties, whilst installation in new build properties at the point of construction is in most circumstances both cheaper and easier. By setting a building regulation requirement for full installation in new build properties with off-street parking, the transition towards widespread access to home charging is achieved in a significantly more cost-effective way.
c. Coordination failure: There are currently a low number of ULEVs on the road so
current demand for chargepoints is limited. At the same time ULEV demand is largely influenced by consumers’ perceived access to charging. This interdependence between charging infrastructure and ULEV purchasers means
10Road to Zero strategy https://assets.publishing.service.gov.uk/government/uploads/system/uploads/attachment_data/file/739460/road-to-zero.pdf

10
that ULEV purchasers and charging infrastructure providers suffer a ‘first mover disadvantage’; whereby charging infrastructure provision incurs a risk of underutilisation from a lack of ULEVs on the road and ULEV purchasers risk having a lack of accessible charging infrastructure, leading to a potentially suboptimal level of charging infrastructure provision and ULEV uptake at a pace which means that targets for ULEV uptake are not met.
d. Bounded Rationality and uncertainty: As many consumers do not currently
perceive the benefits of home chargepoint installation by builders both from a cost perspective and from the perspective of this being an inevitable cost in the future, they are unlikely to demand it. Without this demand, developers would be reluctant to provide chargepoints as a default in new builds, as they will want to provide houses at the lowest cost. For existing homeowners, the upfront retrofit cost could be prohibitive, particularly if they live in multi-occupancy dwellings where the cost of single unit chargepoint installation is higher (shown in Table 6). This is a failure to coordinate on the part of consumers and developers to optimally transition towards EV ownership. Whilst transposing the EU regulations is mandatory, going further than the minimum requirements for new residential buildings is justified by addressing the information and coordination failures. Requiring chargepoint installation bypasses the need for consumers to have perfect information about the benefits of chargepoints, and to coordinate with developers to request the installation.
4.1 Options
20. There are potentially high cost savings to be realised from installation of charging infrastructure in new residential sites; additionally, ensuring charging infrastructure is delivered in new residential sites could help prepare for the transition to EVs and help to accelerate uptake, leading to potential emissions savings. Three options are therefore considered for the residential provisions in the EPBD, including the ‘do minimum’ or minimum compliance option, all of which are costed against a ‘do nothing’ baseline in which no regulations are brought in to require installation of charging infrastructure during construction.
21. Do nothing Baseline: The baseline against which the alternative policy options are compared is a scenario in which homeowners retrofit chargepoints at a rate that rises in line with the forecast % of ULEVs, as a share of total car stock, such that the installation rate for houses with off-street parking reaches 100% in 2050, in line with previously announced policy intentions of a 2040 end to ICE sales. This trajectory is however capped at 91.5% to reflect the current 8.5% of dwellings with off-street parking that do not own cars. The methodology behind establishing this baseline, and the installation distribution is discussed in detail from paragraph 54 and in figure 1.
22. Option 1 – Do minimum: To require ducting to be installed in all parking spaces in residential new builds with more than 10 parking spaces, to allow easier chargepoint installation in the future. This is in line with the EPBD minimum requirement, and indicates the minimum cost of compliance.
23. Option 2 - Preferred: To require the installation of at least one chargepoint (minimum 7KW) as well as the necessary cabling and ducting for all parking spaces associated with new buildings.

11
4.2 Preferred Option
24. Option 2 would enable fulfilment of the policy objective to ensure chargepoints are installed in every new home in England, where appropriate. This in addition to providing a cost saving to society through the avoidance of higher retrofit costs, this option should provide an incentive for homeowners to transition towards EV ownership, to help support our EV uptake ambitions. If chargepoints become readily available in homes and at key destinations, a key barrier to purchasing an EV is removed, which is likely to enhance uptake (this behavioural factor is discussed in detail in paragraph 96).
5. Evidence Base
25. The implementation of any of the policy options discussed above will mean the installation of charging infrastructure in new residential dwellings at the point of construction. Monetised impacts require the number of installations and the associated cost to be forecast, both with and without the policy.
26. This section outlines what these impacts are and, where possible, the methodology and assumptions used to monetise them. The methodology centres around charging infrastructure costs gathered from consultant-led research and stakeholder engagement; which are applied to forecasts of installations, which are derived from residential dwelling completion and parking provision data for residential sites.
27. There are a number of further impacts which are necessarily non-monetised given a lack of appropriate methodology, however evidence which supports these impacts are also outlined in this section. There are six impacts considered in this IA, four of which are monetised and two of which are non-monetised.
Monetised impacts include:
(i) An expected cost saving (benefit) from requiring installation of charging infrastructure during construction at lower cost compared to retrofitting after construction.
(ii) Familiarisation costs, incurred by builders to familiarise themselves with the new processes for installing the relevant infrastructure.
(iii) Material replacement costs, incurred my homeowners when components of the charging infrastructure require replacement.
Non-monetised impacts include: (iv) Impacts on ULEV uptake and subsequent benefits – it is not possible to estimate
exactly how many additional ULEVs would be purchased by consumers over the period as a result of implementing the policy, though evidence exists to suggest that availability and visibility of chargepoints contributes favourably to ULEV purchase decisions.
(v) Avoided disruption costs, which may be present during retrofit installations.
28. The appraisal period selected for this IA is 31 years (2020-2050) since the options considered in this IA propose the installation of cabling and other hardware with useful lives of up to 30 years, this timeframe also captures the longer-term expected transition to ULEV cars and vans (with ULEV stock share expected to reach 100% in 2050). An appraisal period of 31 years is therefore deemed appropriate to capture the costs and benefits
12
associated with this policy. There are however risks that arise with long appraisal periods, and these are discussed in detail from paragraph 115.
29. All costed impacts are discounted using a 2020 base year and a discount rate of 3.5% (in line with Green Book guidance) and deflated using a 2019 price base year.
30. In estimating the total cost of charging infrastructure, an understanding of what charging infrastructure might be covered by the options considered, and their unit costs is required.
5.1 Costs of Charging Infrastructure – Evidence Gathered
31. DfT commissioned consultants, Steer, to estimate the costs of elements of charging infrastructure. Through desk research and stakeholder engagement they were able to identify and provide approximate estimates for four elements of charging infrastructure, ‘Ducting’, ‘Cabling’, ‘Hardware’ and ‘Grid Connection’ costs.
32. For each of these, estimates were captured for up-front installation (during construction) and ‘retrofit’ installation (after construction) for four types of parking location;
• ‘Off-street private’ – for example, a private off-street parking space • ‘Multi-occupancy surface’ – a surface level carpark with multiple spaces • ‘Multi-occupancy underground’ – an underground carpark with multiple spaces • ‘Multi-occupancy multi-storey’ – an above ground multi storey car park
33. In order to capture economies of scale from multiple installations, Steer provided high/low estimates for each cost category on a cost ‘per unit’, and a cost ‘per 100x units’ basis.
34. Costs gathered are summarised in cost summary tables provided by Steer (see Annex A). A number of assumptions were applied in using these costs to estimate the final costed impacts for this IA; these are set out in the following section 5.2.1. Where possible, the assumptions used to derive these estimates are included in the option cost summaries (from paragraph 39). A summary table is provided below.
35. The costs and supporting information received from Steer was considered incomplete, for example with regard to assumptions around the volume of ducting and cabling used in cost scenarios, consequently DfT analysts have engaged directly with relevant industry stakeholders (i.e. developers and chargepoint companies) in order to gather further supporting information and to confirm/amend cost estimates. DfT will be inviting views on our cost estimates from stakeholders during consultation.
5.2 Monetised Impacts 36. This section looks at monetised impacts (i-iii) set out above, explaining the evidence used to
monetise these impacts, the methodology, risks and sensitivities.
Monetised Impact (i) Net-cost saving from residential installations during construction
(i.i) Overview of methodology 37. This IA considers two options for transposing EPBD residential charging infrastructure
provisions, namely ducting for car parks with more than 10 parking spaces (which is the minimum compliance, Option 1); and the installation of chargepoints with the associated ducting, cabling and grid upgrade (Option 2).

13
38. A net cost saving for each of these options is estimated by applying infrastructure costs form Steer, with some adjustments, to an estimated forecast number of annual ‘installations’ of charging infrastructure both with and without the proposed policy interventions from 2020-2050.
39. The cost saving arises from the difference between up front and retrofit costs of installation; with retrofit costs being higher. Without implementation of the policy, it is assumed that all installations are retrofitted into new builds in line with what the expected trajectory for the displacement of ICE vehicles by ULEVs will be if Government targets for ULEV uptake are met, and all ICE vehicles are displaced by ULEVs by 2050.
40. As a result, it is assumed that the total number of installations are almost the same over the appraisal period (see paragraph 54), but without policy intervention, annual installations are lower in the first half of the appraisal period. An implicit assumption here is that consumers ultimately purchase and install almost the same volume of charging infrastructure because they (a) do transition entirely to ULEVs and (b) they prefer to charge at home. If this does not happen, then arguably there will be an over installation of charging infrastructure leading to ‘stranded assets’ (see risks and sensitivities).
41. It is possible that some aspects of the installation costs may be considered transfers, as the purchase of hardware components by developers will result in chargepoint manufacturers profiting from increased business. If these elements are to be considered transfers, then the costs would be lower than outlined in this assessment.
(i.ii) Forecasting the number of new residential installations
42. Government is committed to delivering 300,000 homes a year by the mid-2020s and has
announced a range of plans to provide the homes that communities need. The number of chargepoint installations will depend on the number of off-street parking spaces added to the existing stock through completions of new residential dwellings each year.
43. OBR forecasts have been used to identify private enterprise residential dwelling completions in the UK in the short-term11. These forecasts are based on the relationship between macroeconomic variables such as interest rates, GDP growth and the turnover rate of property transactions divided by housing stock. These forecasts are highly uncertain and do not consider future policy12. A simplifying assumption has been made to hold the final year forecast for 2022 constant going forward until 2050. So, there is a risk that by holding this constant the volume of new builds in that period are being significantly under estimated, which would lead to a higher volume of chargepoints required, and therefore a higher cost.
44. These UK forecasts are converted to England forecasts using the average proportion of house completions in England relative to the UK over the last 3 years (82.3%13).
45. These forecasts do not however capture residential dwellings that have undergone a material change of use (which do come within the scope of EPBD requirements). Data will be sought over the course of the consultation to quantify the volume of buildings this applies to. Throughout this document, where additional information is sought, question boxes are provided and these questions are summarised in annex c. Question 1: What evidence can you provide to inform the volume of residential dwellings that annually undergo major renovation or material change of use?
11OBR Economic and Fiscal Outlook http://obr.uk/efo/economic-fiscal-outlook-november-2017/ 12 Use of these forecasts should not however be considered to be the Government’s view of what housing completion rates will be. 13 EHS table 209.
14
46. There is little evidence to support what the level of parking provision would be in new build dwellings; the most credible source identified, which allows insight into the level of parking provision in existing housing is an RAC foundation report14 (based on England Housing Survey data). Key information from the report is outlined in Table 2; which shows the % of dwellings by type (detached, flats etc.) and the % of each of these types which have a ‘garage’ and ‘other off-street’ parking. Without further evidence, it is necessary to make the assumption that dwelling completions going forward maintain the same splits illustrated in table 2, with the associated proportions having parking provision – for example 28% of houses completed will be terraced, of which 49% have off-street parking (22% garage and 27% other off-street).
Table 2: RAC estimates % of dwellings by parking provision Dwelling type garage other-off street terraced 22% 27% semi-detached 49% 34% detached 86% 13% bungalow 60% 23% flats 9% 25%
47. Splits in Table 3 are used to estimate the number of completions belonging to each
category, and the number of these which will have garage or off-street parking. In the absence of further information, it is assumed these splits remain constant over the appraisal period for all new buildings.
48. To map these dwelling categories onto our charging infrastructure cost categories, it is assumed that installations for houses (terraced, semi-detached etc.) will correspond with ‘off-street private’; and flats will correspond with costs for multi occupancy surface, underground and multi storey.
49. For flats identified as having garage parking by EHS, it is assumed that these are split in equal proportions between ‘multi-occupancy underground’ and ‘multi-occupancy multi-storey’, for the purposes of cost aggregation. This is an unevidenced assumption as no data is currently available to support this. It is considered the proportion of flats identified as having ‘other off-street’ parking to fit the ‘multi-occupancy surface’ category. The risk to cost totals for underground and multi-storey categories is limited as the cost rates for these parking types are the same, but are higher for surface car parks.
50. All flats identified as having off-street parking by EHS, are assumed to have 1 parking space per flat. This is an unevidenced assumption as no data is currently available to support this, but it is assumed that those who replied to the EHS survey stating that they had adequate off-street parking provision will have at least 1 space per flat.
51. It is assumed the distribution of the number of flats in a block will be the same for new builds as it is in the existing stock, as outlined in EHS 201015. 37.2% of flats were identified as falling in blocks with 10 flats or fewer, with 62.8% falling in blocks of 11 flats or more.
52. Table 3 shows the proportions of new dwellings in each parking provision category forecast for the following years.
14 RAC Foundation: Spaced Out - Perspectives in parking policy 2012 (p.12)https://www.racfoundation.org/wp-content/uploads/2017/11/spaced_out-bates_leibling-jul12.pdf 15https://assets.publishing.service.gov.uk/government/uploads/system/uploads/attachment_data/file/6748/2173483.pdf (p.12)
15
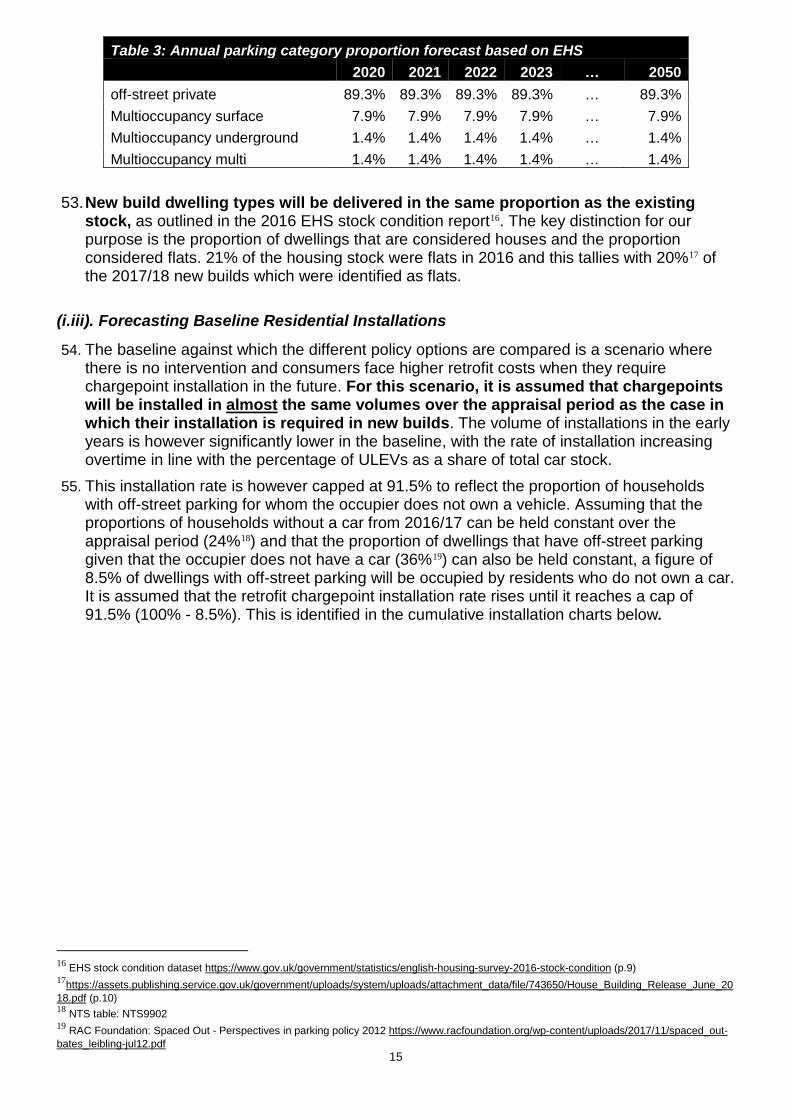
Table 3: Annual parking category proportion forecast based on EHS 2020 2021 2022 2023 … 2050 off-street private 89.3% 89.3% 89.3% 89.3% … 89.3% Multioccupancy surface 7.9% 7.9% 7.9% 7.9% … 7.9% Multioccupancy underground 1.4% 1.4% 1.4% 1.4% … 1.4% Multioccupancy multi 1.4% 1.4% 1.4% 1.4% … 1.4%
53. New build dwelling types will be delivered in the same proportion as the existing
stock, as outlined in the 2016 EHS stock condition report16. The key distinction for our purpose is the proportion of dwellings that are considered houses and the proportion considered flats. 21% of the housing stock were flats in 2016 and this tallies with 20%17 of the 2017/18 new builds which were identified as flats.
(i.iii). Forecasting Baseline Residential Installations
54. The baseline against which the different policy options are compared is a scenario where there is no intervention and consumers face higher retrofit costs when they require chargepoint installation in the future. For this scenario, it is assumed that chargepoints will be installed in almost the same volumes over the appraisal period as the case in which their installation is required in new builds. The volume of installations in the early years is however significantly lower in the baseline, with the rate of installation increasing overtime in line with the percentage of ULEVs as a share of total car stock.
55. This installation rate is however capped at 91.5% to reflect the proportion of households with off-street parking for whom the occupier does not own a vehicle. Assuming that the proportions of households without a car from 2016/17 can be held constant over the appraisal period (24%18) and that the proportion of dwellings that have off-street parking given that the occupier does not have a car (36%19) can also be held constant, a figure of 8.5% of dwellings with off-street parking will be occupied by residents who do not own a car. It is assumed that the retrofit chargepoint installation rate rises until it reaches a cap of 91.5% (100% - 8.5%). This is identified in the cumulative installation charts below.
16 EHS stock condition dataset https://www.gov.uk/government/statistics/english-housing-survey-2016-stock-condition (p.9) 17https://assets.publishing.service.gov.uk/government/uploads/system/uploads/attachment_data/file/743650/House_Building_Release_June_2018.pdf (p.10) 18 NTS table: NTS9902 19 RAC Foundation: Spaced Out - Perspectives in parking policy 2012 https://www.racfoundation.org/wp-content/uploads/2017/11/spaced_out-bates_leibling-jul12.pdf

16
Figure 1: Cumulative residential chargepoint installations – baseline and option 2.
56. Residential charging is more convenient and in many cases more cost effective for the
consumer than public charging, so it is assumed that where possible, a consumer’s preference will be for home charging. It therefore seems likely that residential chargepoints will become more important in the near future, as the percentage of ULEVs as a share of total car stock increases. For that reason, it is assumed that if chargepoints are not installed in a property at the point of construction, it is likely that they will have to be retrofitted in the future.
57. The baseline installation rate is modelled based on a ULEV stock share scenario that reflects the ULEV uptake ambition level set out in the Road to Zero strategy20. This scenario was used to model the percentage of ULEVs as a share of the total car stock and the assumption was made that the percentage of dwellings built during the appraisal period with off-street parking that install chargepoints will rise in line with this figure. These assumed baseline installation volumes were then multiplied by the retrofit chargepoint installation costs provided by Steer, to establish the total cost of the baseline scenario.
58. Crucially, the distribution of costs is different for retrofit and newbuild installation scenarios. For retrofit installations, the cost of installation is borne by the consumer, whereas for installation at the point of construction, the cost is borne by the housebuilder. The exception to this is for retrofit grid connection upgrade costs, where the costs are often socialised across consumers (annex B2 discusses grid connection costs in more detail).
59. It is assumed that absent of intervention, no chargepoints are installed at the point of construction. This is an oversimplification as there are some Local Authorities (LAs) with requirements for chargepoint installation, but this is not widespread and it varies significantly between LAs. For the moment it seems clear that this is an appropriate assumption to estimate the regulatory impact as there is no visible incentive, without regulation, for builders to install during construction. If installation at the point of construction were to be widespread in the baseline, then there would be a negative impact on the NPV. Question 2: What evidence do you have to inform the volume of dwellings that have had a chargepoint installed at the point of construction?
20 https://assets.publishing.service.gov.uk/government/uploads/system/uploads/attachment_data/file/739460/road-to-zero.pdf; This trajectory is used as it aligns with government targets for the displacement of ICEs with ULEVs (more specifically EVs)
-
500,000
1,000,000
1,500,000
2,000,000
2,500,000
3,000,000Ch
arge
poin
t Ins
talla
tions
Cumulative Installations
Cumulative (baseline) Cumulative (option 2)
17
60. Over the course of the consultation, additional information will be sought to identify the likely rate of new build installation absent of intervention – to more accurately inform the cost of baseline installations.
61. For each option detailed in this IA, it is assumed the number of installations in the baseline and with policy intervention is almost the same; however, as each option involves different elements of charging infrastructure, the costs applicable to each are different; below these are considered in turn.
(i.iv). Application of charging infrastructure costs to forecast volumes; and assumptions: 62. For each of the options considered in transposing residential charging provisions in the
EPBD, costs are taken from Steer and require a number of assumptions in order to apply them appropriately to the volumes of installations estimated. The costs used in each option and assumptions are set out in this section for each option; providing additional detail on what the costs contain, and how/why they vary between ‘high’ and ‘low’ as well as ‘new build’ vs. retrofit.
Deriving unit costs for Option 1: Ducting installed for buildings with > 10 parking spaces: 63. Ducting is considered to be any conduit for routing cables from the power supply to the
chargepoint. These can include cable trays and subsurface trenches. 64. The largest driver of variability in cost between the new build and retrofit scenario comes
from the costs of civil works21 in surface level car parks, where trenching is required. In retrofit installations, the costs of having to trench and resurface are high.
65. The difference between the low and high cost scenarios is largely because of the volume of ducting/trenching required, driven by assumed distances from the power supply to the charging infrastructure location.
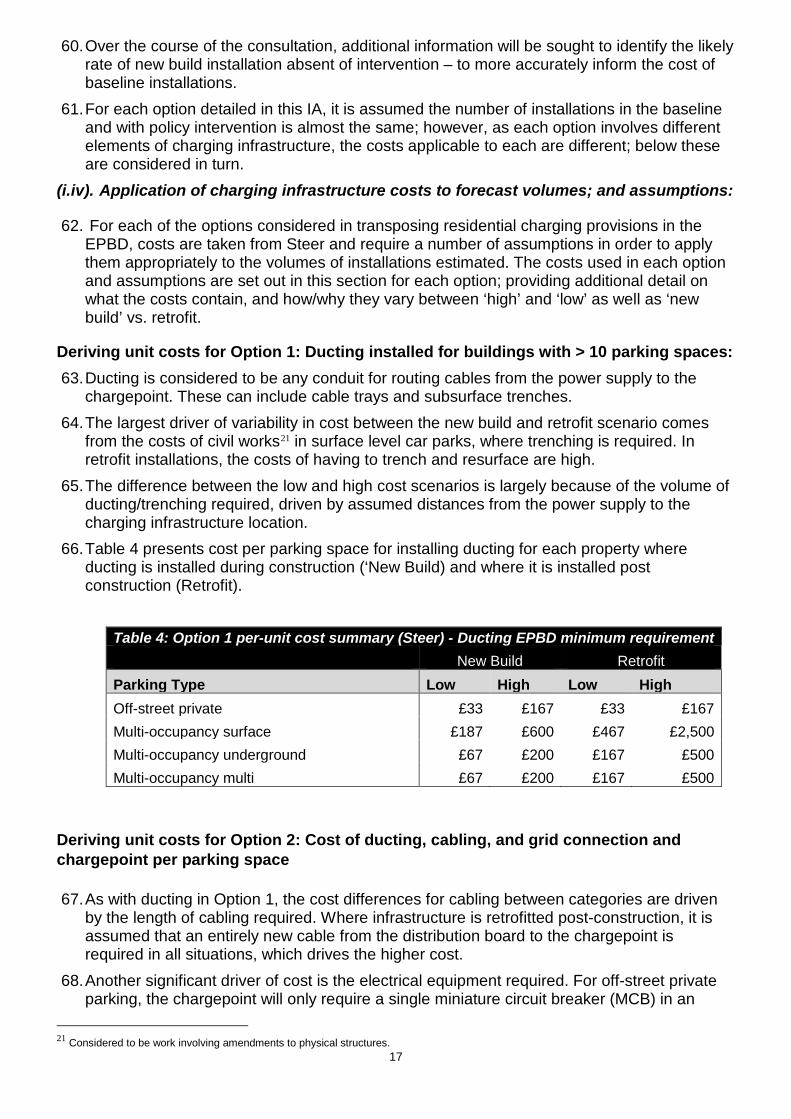
66. Table 4 presents cost per parking space for installing ducting for each property where ducting is installed during construction (‘New Build) and where it is installed post construction (Retrofit).
Deriving unit costs for Option 2: Cost of ducting, cabling, and grid connection and chargepoint per parking space 67. As with ducting in Option 1, the cost differences for cabling between categories are driven
by the length of cabling required. Where infrastructure is retrofitted post-construction, it is assumed that an entirely new cable from the distribution board to the chargepoint is required in all situations, which drives the higher cost.
68. Another significant driver of cost is the electrical equipment required. For off-street private parking, the chargepoint will only require a single miniature circuit breaker (MCB) in an
21 Considered to be work involving amendments to physical structures.
Table 4: Option 1 per-unit cost summary (Steer) - Ducting EPBD minimum requirement New Build Retrofit Parking Type Low High Low High Off-street private £33 £167 £33 £167 Multi-occupancy surface £187 £600 £467 £2,500 Multi-occupancy underground £67 £200 £167 £500 Multi-occupancy multi £67 £200 £167 £500

18
existing distribution board which can be easily retrofitted. However, when 100 connections are installed together (in multi-storey or underground car parks), multiple moulded case circuit breakers of different current ratings will be required to supply electricity to the chargepoints, which brings a higher cost.
69. At surface level, chargepoints will be supplied from a feeder pillar, which can serve multiple chargepoints.
70. Grid connection costs associated with chargepoint connections vary significantly depending on location, and hence it is difficult to establish a representative cost for installations. Whilst there is a great deal of uncertainty surrounding these figures, and it has not been possible to fully capture where the distribution of costs is likely to fall within the cost summary ranges, annex B identifies the assumptions that have been built into these cost profiles.
71. For multioccupancy installations, the low range costs reflect a scenario where a larger transformer22 is required (relative to situation where no chargepoint is installed), whilst the high range costs reflect a scenario where an additional transformer is required. For retrofit installations, the high range cost is more likely as the existing transformer will either need to be replaced, or an additional one built.
72. For a single installation, either new build or retrofit, it is assumed that there would be sufficient power capacity to supply the chargepoint, so there are no additional grid reinforcement costs (unless a dedicated supply was installed). Question 3: What evidence can you provide to support the use of alternative assumptions to inform grid connection costs?
73. The preferred option being consulted on will also include ‘hardware costs’ for chargepoints
installed for every parking space. This is the physical chargepoint unit/outlet that connects an EV to the power source. These units can be either wall or ground mounted. Costs are based on a 7kW smart chargepoint with additional data connectivity costs that are relevant for the multi-occupancy underground and multi-storey cost categories where it is assumed that data connectivity may not be available. Whilst chargepoints are assumed to be ‘smart’, this will not be an explicit requirement in the Building Regulations.
74. Multi-occupancy surface car parks are assumed to require a ground mounted chargepoint which carries an additional cost (due to the larger physical structure), whilst the other parking categories are assumed to require a wall mounted chargepoint.
75. Cost differences between new build and retrofit are solely driven by assumed bulk buy discounts gained on new build developments where chargepoint hardware can be purchased in large volumes.
Table 5: Option 2 per-unit cost summary (Steer) – full chargepoint provision
New Retro
Parking Type Low High Low High
Off-street private £615 £1,115 £982 £2,415
Multi-occupancy surface £975 £2,947 £2,230 £8,210
Multi-occupancy underground £812 £2,652 £1,640 £6,290
Multi-occupancy multi £812 £2,652 £1,640 £6,290
i.v. Other Key cost assumptions
22 A static device which transfers electrical energy from one circuit to another through the process of electromagnetic induction.

19
76. Only multi-occupancy developments can take advantage of economies of scale cost reductions. Costs were provided on the basis of a single unit cost and a 100 x unit cost, under the assumption that for multi-occupancy buildings, there will be economies of scale savings made as some fixed costs will be shared across the units. For all off-street private dwellings however, it is assumed that the single unit cost is appropriate. There is a risk that this over estimates costs as housing developers would be able to achieve economies of scale savings on multiple single occupancy developments (e.g. on housing estates), but it has not been possible to find the granularity of data necessary to inform this given the nascent stage of the market. Question 4: What evidence can you provide to support multiple single unit developments (such as housing estates) taking advantage of economies of scale for installation costs? Question 5: What evidence can you provide to support economies of scale providing cost reductions for installation and hardware costs?
77. All multi-occupancy developments are costed using the 100-installation unit cost. For
multi-occupancy dwellings, the 100 x unit costs were broken down to a per unit basis and multiplied by the volume of dwellings in each parking provision category. This does not perfectly capture the degree to which economies of scale reduce cost per unit based on different multi-occupancy building sizes, but given the limited breakdown of fixed and variable costs, it was not possible to identify this.
78. Only new build installations benefit from economies of scale savings. Cost differences arise between new build and retrofit options through the assumption that where possible, multi-occupancy new build developments will be able to take advantage of economies of scale to gain reduced unit costs, whilst retrofit installations will always be done on a single unit basis and therefore will not achieve the discounted rates.
79. For options 1, only construction firms experience familiarisation costs. It is assumed that only in option 2, where chargepoint installation takes place, will chargepoint installers and construction firms both need to familiarise themselves with the new regulations. For options 1, the regulations will only affect construction firms.
80. Technological learning rates have not been modelled due to a lack of data to inform this. It could be assumed that the hardware costs of chargepoints will decrease over the appraisal period, but this has not explicitly been modelled as evidence has not been found to inform the rate of decrease. If hardware costs were to decrease overtime, this would have a negative effect on the NPV, as a greater proportion of retrofit installations happen later in the appraisal period. Question 6: What evidence can you provide to support how technological learning rates will contribute to chargepoint cost reduction over time?
Summary of retrofit cost avoidance benefit 81. Where full chargepoint infrastructure installation takes place during construction, the cost of
installation is passed from home owners who would otherwise retrofit the infrastructure, to housing developers who install infrastructure at a lower cost – resulting in a net efficiency gain to society.
82. Table 6 shows the present value installation cost savings for options one and two. The first section of the table shows what the cost of a particular component would be under a retrofit installation, with the second part showing what the new build cost would be, and finally the benefits section showing the difference between these figures.
20
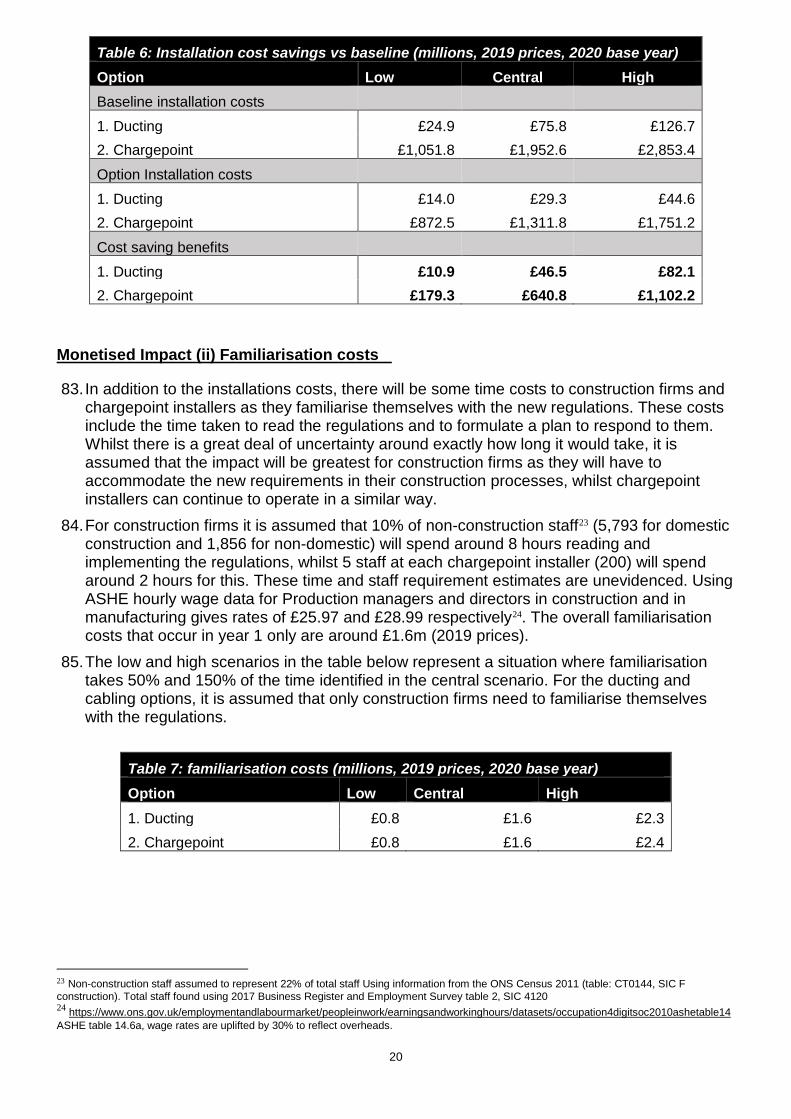
Table 6: Installation cost savings vs baseline (millions, 2019 prices, 2020 base year) Option Low Central High Baseline installation costs 1. Ducting £24.9 £75.8 £126.7 2. Chargepoint £1,051.8 £1,952.6 £2,853.4 Option Installation costs 1. Ducting £14.0 £29.3 £44.6 2. Chargepoint £872.5 £1,311.8 £1,751.2 Cost saving benefits 1. Ducting £10.9 £46.5 £82.1 2. Chargepoint £179.3 £640.8 £1,102.2
Monetised Impact (ii) Familiarisation costs
83. In addition to the installations costs, there will be some time costs to construction firms and chargepoint installers as they familiarise themselves with the new regulations. These costs include the time taken to read the regulations and to formulate a plan to respond to them. Whilst there is a great deal of uncertainty around exactly how long it would take, it is assumed that the impact will be greatest for construction firms as they will have to accommodate the new requirements in their construction processes, whilst chargepoint installers can continue to operate in a similar way.
84. For construction firms it is assumed that 10% of non-construction staff23 (5,793 for domestic construction and 1,856 for non-domestic) will spend around 8 hours reading and implementing the regulations, whilst 5 staff at each chargepoint installer (200) will spend around 2 hours for this. These time and staff requirement estimates are unevidenced. Using ASHE hourly wage data for Production managers and directors in construction and in manufacturing gives rates of £25.97 and £28.99 respectively24. The overall familiarisation costs that occur in year 1 only are around £1.6m (2019 prices).
85. The low and high scenarios in the table below represent a situation where familiarisation takes 50% and 150% of the time identified in the central scenario. For the ducting and cabling options, it is assumed that only construction firms need to familiarise themselves with the regulations.
Table 7: familiarisation costs (millions, 2019 prices, 2020 base year) Option Low Central High 1. Ducting £0.8 £1.6 £2.3 2. Chargepoint £0.8 £1.6 £2.4
23 Non-construction staff assumed to represent 22% of total staff Using information from the ONS Census 2011 (table: CT0144, SIC F construction). Total staff found using 2017 Business Register and Employment Survey table 2, SIC 4120 24 https://www.ons.gov.uk/employmentandlabourmarket/peopleinwork/earningsandworkinghours/datasets/occupation4digitsoc2010ashetable14 ASHE table 14.6a, wage rates are uplifted by 30% to reflect overheads.

21
Monetised Impact (iii) Material Replacement costs
86. This section highlights how these material replacement costs have been modelled based on the economic life of the components. These costs arise as infrastructure installed over the course of the appraisal period requires replacement due to wear.
87. The CIBSE Guide M – Maintenance engineering and management25 gives the estimated economic life of various building services items. The CIBSE guides are well respected and widely used by the building services profession. Guide M defines economic life as:
‘The estimated number of years until that item no longer represents the least expensive method of performing its function’.
88. The economic life estimates are based on a number of assumptions, including
maintenance, installation and hours of operation. Variation factors may be appropriate if, for example, the equipment will be utilised less than the assumptions used to inform the Guide.
89. Indicative economic life expectancy is given in Appendix 13.A1 of CIBSE Guide M. There are no specific guidelines for electric vehicle charging infrastructure, but reasonable inferences could be made based on general electrical equipment. From this, the figures in table 8 can be inferred.
Table 8: Indicative economic lifespan of equipment Equipment type Multi-occupancy car park Private off-street parking Cables 30 years1 25 years6 Feeder pillars, base units etc 30 years2 N/A Ducting 30 years3 30 years3 Distribution boards 20 years4 20 years4 EVSE outlet 15 years5 15 years5 References from CIBSE Guide M, Appendix 13. A1 Distribution of LV electricity from main switchgear to area distribution boards:
1. HV and LV cables and wiring etc (thermoplastic) – 30 years 2. Fuse pillars, base units, poles and accessories etc – 30 years 3. Conduits and cable trunking plus supports etc – 30 to 35 years 4. LV switch gear and distribution boards – 20 years
Power installations:
5. Socket outlets, fuse connection units, etc – 15 years 6. General LV power installations – 25 years
90. Based on the equipment lifespans presented in the table above, and assuming baseline and
policy option volumes of installations as presented above, the costs in table 9 have been generated for the appraisal period. The baseline total replacement costs are lower than for each option as installations occur later, and so fewer components require replacement during the appraisal period. For each of the options it is assumed that any aspect of the installation not installed at the point of construction, would later be retrofitted at the same time as it would have been in the baseline. Total replacement costs for each option are presented as well as the costs relative to the baseline.
25 https://www.breeam.nl/sites/breeam.nl/files/hulp/CIBSE%20Guide%20M.pdf
22
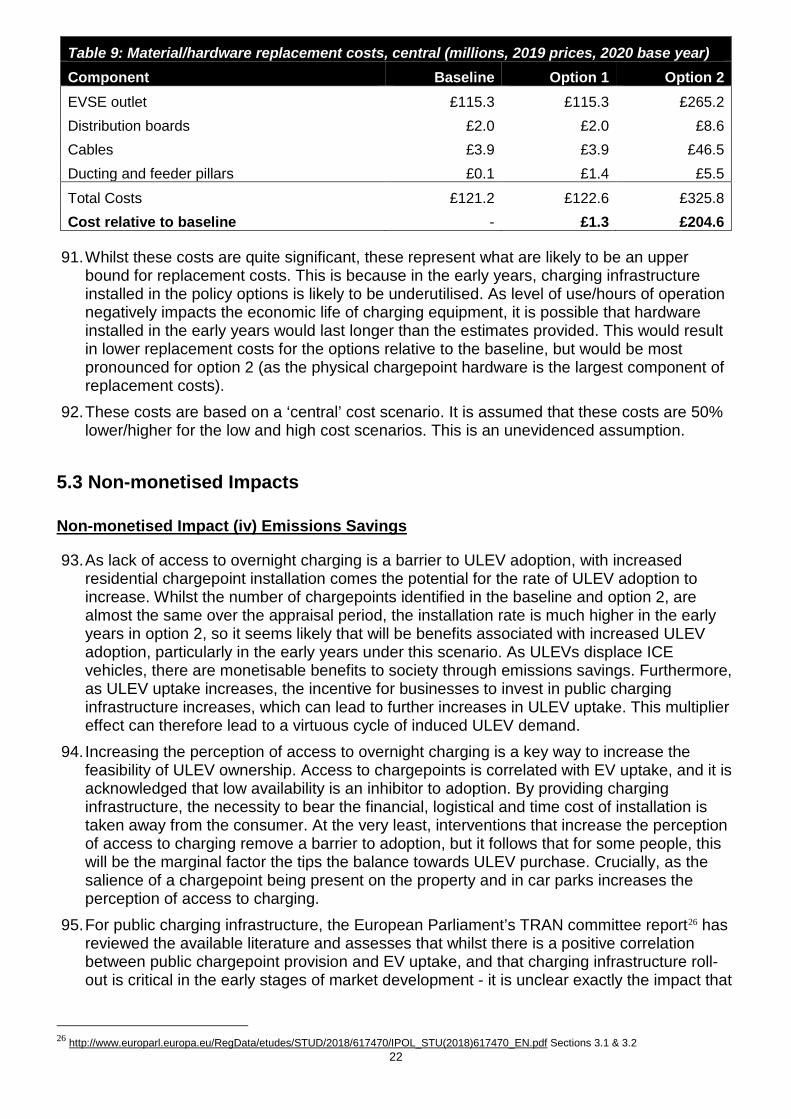
Table 9: Material/hardware replacement costs, central (millions, 2019 prices, 2020 base year) Component Baseline Option 1 Option 2 EVSE outlet £115.3 £115.3 £265.2 Distribution boards £2.0 £2.0 £8.6 Cables £3.9 £3.9 £46.5 Ducting and feeder pillars £0.1 £1.4 £5.5 Total Costs £121.2 £122.6 £325.8 Cost relative to baseline - £1.3 £204.6
91. Whilst these costs are quite significant, these represent what are likely to be an upper
bound for replacement costs. This is because in the early years, charging infrastructure installed in the policy options is likely to be underutilised. As level of use/hours of operation negatively impacts the economic life of charging equipment, it is possible that hardware installed in the early years would last longer than the estimates provided. This would result in lower replacement costs for the options relative to the baseline, but would be most pronounced for option 2 (as the physical chargepoint hardware is the largest component of replacement costs).
92. These costs are based on a ‘central’ cost scenario. It is assumed that these costs are 50% lower/higher for the low and high cost scenarios. This is an unevidenced assumption.
5.3 Non-monetised Impacts
Non-monetised Impact (iv) Emissions Savings
93. As lack of access to overnight charging is a barrier to ULEV adoption, with increased residential chargepoint installation comes the potential for the rate of ULEV adoption to increase. Whilst the number of chargepoints identified in the baseline and option 2, are almost the same over the appraisal period, the installation rate is much higher in the early years in option 2, so it seems likely that will be benefits associated with increased ULEV adoption, particularly in the early years under this scenario. As ULEVs displace ICE vehicles, there are monetisable benefits to society through emissions savings. Furthermore, as ULEV uptake increases, the incentive for businesses to invest in public charging infrastructure increases, which can lead to further increases in ULEV uptake. This multiplier effect can therefore lead to a virtuous cycle of induced ULEV demand.
94. Increasing the perception of access to overnight charging is a key way to increase the feasibility of ULEV ownership. Access to chargepoints is correlated with EV uptake, and it is acknowledged that low availability is an inhibitor to adoption. By providing charging infrastructure, the necessity to bear the financial, logistical and time cost of installation is taken away from the consumer. At the very least, interventions that increase the perception of access to charging remove a barrier to adoption, but it follows that for some people, this will be the marginal factor the tips the balance towards ULEV purchase. Crucially, as the salience of a chargepoint being present on the property and in car parks increases the perception of access to charging.
95. For public charging infrastructure, the European Parliament’s TRAN committee report26 has reviewed the available literature and assesses that whilst there is a positive correlation between public chargepoint provision and EV uptake, and that charging infrastructure roll-out is critical in the early stages of market development - it is unclear exactly the impact that
26 http://www.europarl.europa.eu/RegData/etudes/STUD/2018/617470/IPOL_STU(2018)617470_EN.pdf Sections 3.1 & 3.2

23
the provision of infrastructure has, and how it interacts with other factors affecting uptake such as model availability, financial incentives etc.
96. Behavioural biases may also play in part in nudging consumers towards ULEV purchase as a result of chargepoint ownership. The endowment effect is an example of a behavioural bias that results in individuals placing a disproportionately high valuation on items that they own27. If this bias holds, homeowners who otherwise would not have had an interest in ULEVs might value the ownership and use of a chargepoint sufficiently highly that it leads them to purchase a ULEV. Furthermore, having a chargepoint in the immediate environment may lead to a shifting preference towards EV ownership, particularly for those who may otherwise have been unaware of them.
97. Whilst it has not been possible to identify the degree to which chargepoint provision will increase EV uptake, the following analysis is provided to give an indication of the value of emissions savings that come as a result of switching from ICE vehicles to ULEVs.
98. It is assumed that average emissions of 123g/km of CO2 and 0.095g/km of NOX for cars and an average annual 12,553km/year. WebTAG valuations of emissions damage costs are used, with £70.55/tonne28 for CO2 and £33,705/tonne29 for NOX. This means that the emissions savings per ICE vehicle displaced are around £150 in 2020. If the introduction of 88,000 additional chargepoints annually led to 1000 additional ULEV purchases that otherwise would not be made (and that displaced that number of ICE vehicle sales), the value of the associated emission savings over the appraisal period would be £4,259,336.
99. A possible methodology for quantifying the effect on ULEV uptake was considered using internal DfT modelling to identify ULEV uptake based on different input scenarios. The impact of an increased access to residential charging was modelled by subtracting the chargepoint installing cost from the purchase price of an EV. The resulting increase in demand relative to the baseline inputs was considered to be attributable to the additional chargepoint access.
100. There are however a number of limitations with this approach, which is why benefits as a result of EV uptake are not included in the NPV.
• The model only captures the impact on demand as a result of not having to include the cost of chargepoint installation in an EV purchase decision. This accounts only for the financial consideration but none of the additional behavioural factors that might impact an EV purchase decision as a result of chargepoint ownership.
• This methodology does not account for the notion that the financial benefit of already owning a chargepoint should only be realised for the first EV purchase a household makes. As the model does not account for which individual makes the purchase, and given that the average vehicle turnover rate is 4 years30, the financial benefit per household is likely being counted multiple times as individuals purchase additional vehicles.
• The benefit of an existing chargepoint in a household should also be realised on the first
EV purchase every time a new occupier moves in, but it has not been possible to identify the rate at which this would happen, or how to capture this in the model.
27 https://www.behavioraleconomics.com/resources/mini-encyclopedia-of-be/endowment-effect/ 28https://www.gov.uk/government/publications/tag-data-book, Data table A3.4 non-traded values 2020, price year 2019 29 https://www.gov.uk/government/publications/tag-data-book, Data table A3.2 marginal abatement costs 2020, price year 2019 30 RAC Foundation – Car Ownership in Great Britain https://www.racfoundation.org/wp-content/uploads/2017/11/car-ownership-in-great-britain-leibling-171008-report.pdf

24
Non-monetised Impact (vi) Avoided disruption costs
101. An additional non-monetised benefit may be generated through avoiding any disruption costs that could arise as a result of construction work taking place during a retrofit installation. When installation takes place at the point of construction, there are no occupants in the property who can be inconvenienced by the work taking place. During a retrofit installation, where occupiers are likely to be present at the property, disruption costs could include: disruption to the electricity supply; property access issues; parking disruption. This will be most acute when an installation involves car park resurfacing, such as those taking place in multi-occupancy surface car parks. These disruption costs are not likely to be significant however, and no attempt to quantify them (and consequently the benefit from avoiding them) has been made.
6. Results
6.1 Evidence Summary and preferred option 102. Based on an assessment of the evidence, the preferred option for transposition of the
EPBD residential charging infrastructure provisions to be consulted on is the installation of ducting, cabling and chargepoints for all parking spaces in new residences. This section looks at the key risks and sensitivities around the monetised impacts, as well as at how these impacts are likely to fall on different groups, including small and medium businesses.
103. Impacts have been monetised using the best available information on charging infrastructure costs and a simple transparent forecasting methodology, as outlined in previous sections.
104. Table 10 shows the costs and benefits to society as a whole under each option. Familiarisation costs are shown in absolute terms, whilst replacement costs and installation cost savings under each option are shown relative to the baseline scenario. The NPV therefore captures the installation cost savings as a benefit, net of the familiarisation costs, which leads to a large positive NPV.
Table 10: societal cost/benefit summary (millions, 2019 prices, 2020 base year)
Option 1 Option 2
Costs (discounted)
Familiarisation £1.6 £1.6
Net replacement costs £1.3 £204.6
Total costs £2.9 £206.2
Benefits (discounted)
Cost savings (from installation during construction) £46.5 £640.8
Total benefits £46.5 £640.8
Summary
Net Present Value £43.6 £434.6
105. Whilst the NPV to society is positive for options 1 and 2, when considering only the impacts on business, there is a negative NPV as housebuilders bear the costs (in the first instance) whilst cost savings are realised by home owners/occupiers. This is highlighted in table 14, which considers only the costs and benefits to business. This is in contrast to the baseline
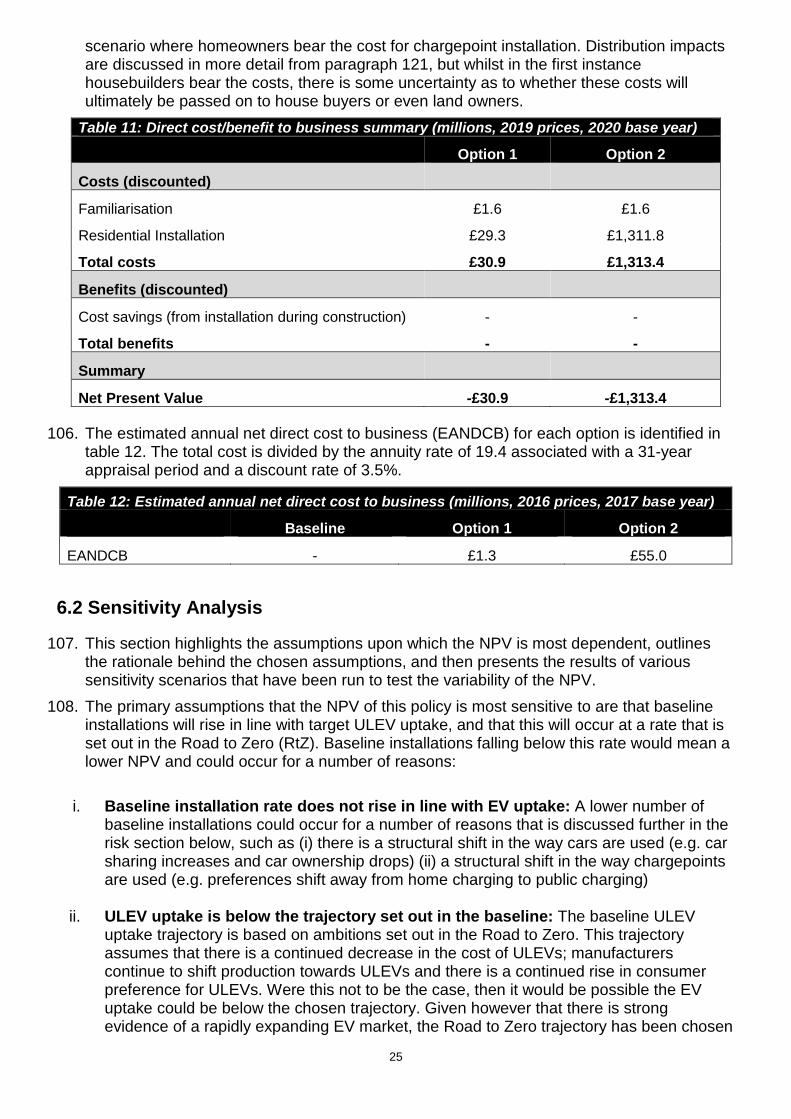
25
scenario where homeowners bear the cost for chargepoint installation. Distribution impacts are discussed in more detail from paragraph 121, but whilst in the first instance housebuilders bear the costs, there is some uncertainty as to whether these costs will ultimately be passed on to house buyers or even land owners.
Table 11: Direct cost/benefit to business summary (millions, 2019 prices, 2020 base year)
Option 1 Option 2
Costs (discounted)
Familiarisation £1.6 £1.6
Residential Installation £29.3 £1,311.8
Total costs £30.9 £1,313.4
Benefits (discounted)
Cost savings (from installation during construction) - -
Total benefits - -
Summary
Net Present Value -£30.9 -£1,313.4
106. The estimated annual net direct cost to business (EANDCB) for each option is identified in table 12. The total cost is divided by the annuity rate of 19.4 associated with a 31-year appraisal period and a discount rate of 3.5%.
Table 12: Estimated annual net direct cost to business (millions, 2016 prices, 2017 base year)
Baseline Option 1 Option 2
EANDCB - £1.3 £55.0
6.2 Sensitivity Analysis
107. This section highlights the assumptions upon which the NPV is most dependent, outlines the rationale behind the chosen assumptions, and then presents the results of various sensitivity scenarios that have been run to test the variability of the NPV.
108. The primary assumptions that the NPV of this policy is most sensitive to are that baseline installations will rise in line with target ULEV uptake, and that this will occur at a rate that is set out in the Road to Zero (RtZ). Baseline installations falling below this rate would mean a lower NPV and could occur for a number of reasons:
i. Baseline installation rate does not rise in line with EV uptake: A lower number of
baseline installations could occur for a number of reasons that is discussed further in the risk section below, such as (i) there is a structural shift in the way cars are used (e.g. car sharing increases and car ownership drops) (ii) a structural shift in the way chargepoints are used (e.g. preferences shift away from home charging to public charging)
ii. ULEV uptake is below the trajectory set out in the baseline: The baseline ULEV
uptake trajectory is based on ambitions set out in the Road to Zero. This trajectory assumes that there is a continued decrease in the cost of ULEVs; manufacturers continue to shift production towards ULEVs and there is a continued rise in consumer preference for ULEVs. Were this not to be the case, then it would be possible the EV uptake could be below the chosen trajectory. Given however that there is strong evidence of a rapidly expanding EV market, the Road to Zero trajectory has been chosen
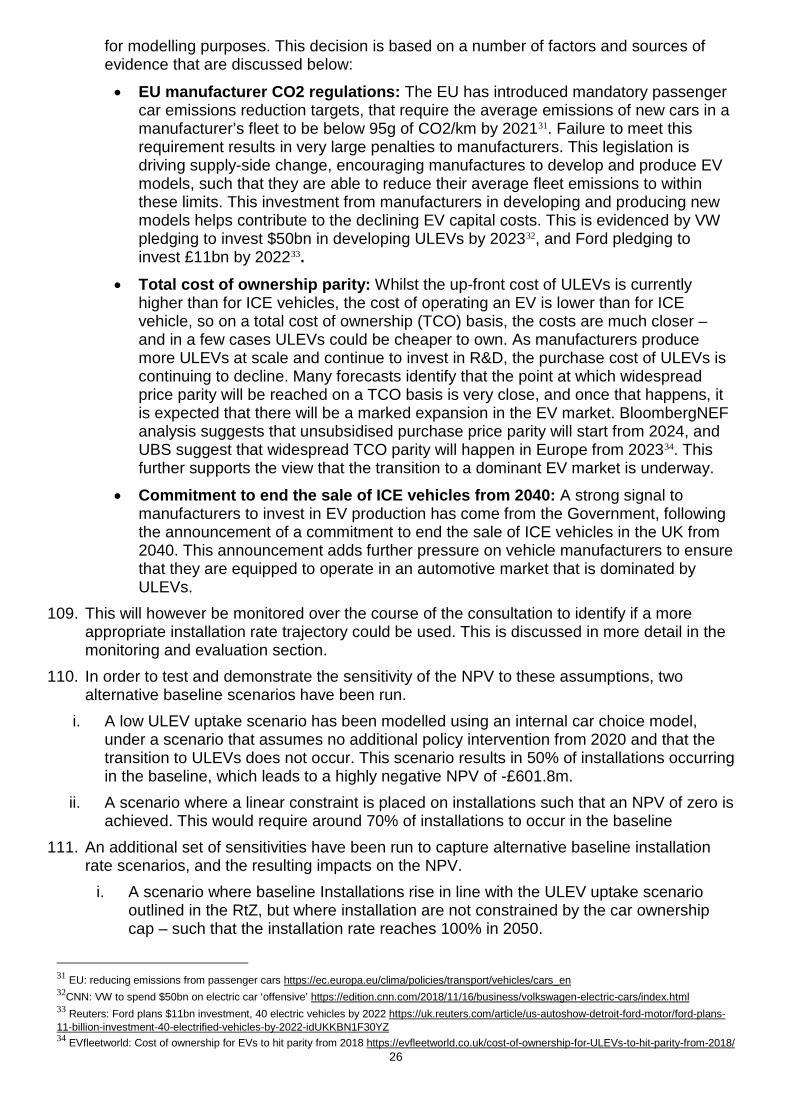
26
for modelling purposes. This decision is based on a number of factors and sources of evidence that are discussed below:
• EU manufacturer CO2 regulations: The EU has introduced mandatory passenger car emissions reduction targets, that require the average emissions of new cars in a manufacturer’s fleet to be below 95g of CO2/km by 202131. Failure to meet this requirement results in very large penalties to manufacturers. This legislation is driving supply-side change, encouraging manufactures to develop and produce EV models, such that they are able to reduce their average fleet emissions to within these limits. This investment from manufacturers in developing and producing new models helps contribute to the declining EV capital costs. This is evidenced by VW pledging to invest $50bn in developing ULEVs by 202332, and Ford pledging to invest £11bn by 202233.
• Total cost of ownership parity: Whilst the up-front cost of ULEVs is currently higher than for ICE vehicles, the cost of operating an EV is lower than for ICE vehicle, so on a total cost of ownership (TCO) basis, the costs are much closer – and in a few cases ULEVs could be cheaper to own. As manufacturers produce more ULEVs at scale and continue to invest in R&D, the purchase cost of ULEVs is continuing to decline. Many forecasts identify that the point at which widespread price parity will be reached on a TCO basis is very close, and once that happens, it is expected that there will be a marked expansion in the EV market. BloombergNEF analysis suggests that unsubsidised purchase price parity will start from 2024, and UBS suggest that widespread TCO parity will happen in Europe from 202334. This further supports the view that the transition to a dominant EV market is underway.
• Commitment to end the sale of ICE vehicles from 2040: A strong signal to manufacturers to invest in EV production has come from the Government, following the announcement of a commitment to end the sale of ICE vehicles in the UK from 2040. This announcement adds further pressure on vehicle manufacturers to ensure that they are equipped to operate in an automotive market that is dominated by ULEVs.
109. This will however be monitored over the course of the consultation to identify if a more appropriate installation rate trajectory could be used. This is discussed in more detail in the monitoring and evaluation section.
110. In order to test and demonstrate the sensitivity of the NPV to these assumptions, two alternative baseline scenarios have been run.
i. A low ULEV uptake scenario has been modelled using an internal car choice model, under a scenario that assumes no additional policy intervention from 2020 and that the transition to ULEVs does not occur. This scenario results in 50% of installations occurring in the baseline, which leads to a highly negative NPV of -£601.8m.
ii. A scenario where a linear constraint is placed on installations such that an NPV of zero is achieved. This would require around 70% of installations to occur in the baseline
111. An additional set of sensitivities have been run to capture alternative baseline installation rate scenarios, and the resulting impacts on the NPV.
i. A scenario where baseline Installations rise in line with the ULEV uptake scenario outlined in the RtZ, but where installation are not constrained by the car ownership cap – such that the installation rate reaches 100% in 2050.
31 EU: reducing emissions from passenger cars https://ec.europa.eu/clima/policies/transport/vehicles/cars_en 32CNN: VW to spend $50bn on electric car ‘offensive’ https://edition.cnn.com/2018/11/16/business/volkswagen-electric-cars/index.html 33 Reuters: Ford plans $11bn investment, 40 electric vehicles by 2022 https://uk.reuters.com/article/us-autoshow-detroit-ford-motor/ford-plans-11-billion-investment-40-electrified-vehicles-by-2022-idUKKBN1F30YZ 34 EVfleetworld: Cost of ownership for EVs to hit parity from 2018 https://evfleetworld.co.uk/cost-of-ownership-for-ULEVs-to-hit-parity-from-2018/
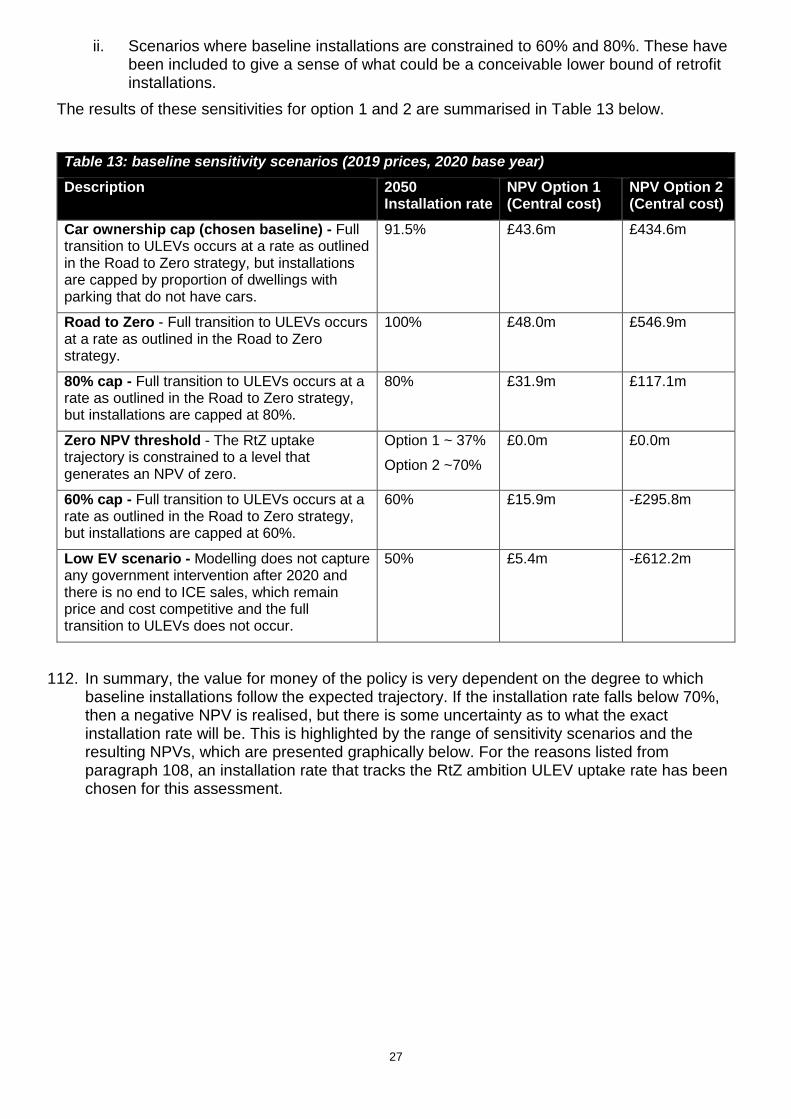
27
ii. Scenarios where baseline installations are constrained to 60% and 80%. These have been included to give a sense of what could be a conceivable lower bound of retrofit installations.
The results of these sensitivities for option 1 and 2 are summarised in Table 13 below. Table 13: baseline sensitivity scenarios (2019 prices, 2020 base year) Description 2050
Installation rate NPV Option 1 (Central cost)
NPV Option 2 (Central cost)
Car ownership cap (chosen baseline) - Full transition to ULEVs occurs at a rate as outlined in the Road to Zero strategy, but installations are capped by proportion of dwellings with parking that do not have cars.
91.5% £43.6m £434.6m
Road to Zero - Full transition to ULEVs occurs at a rate as outlined in the Road to Zero strategy.
100% £48.0m £546.9m
80% cap - Full transition to ULEVs occurs at a rate as outlined in the Road to Zero strategy, but installations are capped at 80%.
80% £31.9m £117.1m
Zero NPV threshold - The RtZ uptake trajectory is constrained to a level that generates an NPV of zero.
Option 1 ~ 37% Option 2 ~70%
£0.0m £0.0m
60% cap - Full transition to ULEVs occurs at a rate as outlined in the Road to Zero strategy, but installations are capped at 60%.
60% £15.9m -£295.8m
Low EV scenario - Modelling does not capture any government intervention after 2020 and there is no end to ICE sales, which remain price and cost competitive and the full transition to ULEVs does not occur.
50% £5.4m -£612.2m
112. In summary, the value for money of the policy is very dependent on the degree to which
baseline installations follow the expected trajectory. If the installation rate falls below 70%, then a negative NPV is realised, but there is some uncertainty as to what the exact installation rate will be. This is highlighted by the range of sensitivity scenarios and the resulting NPVs, which are presented graphically below. For the reasons listed from paragraph 108, an installation rate that tracks the RtZ ambition ULEV uptake rate has been chosen for this assessment.
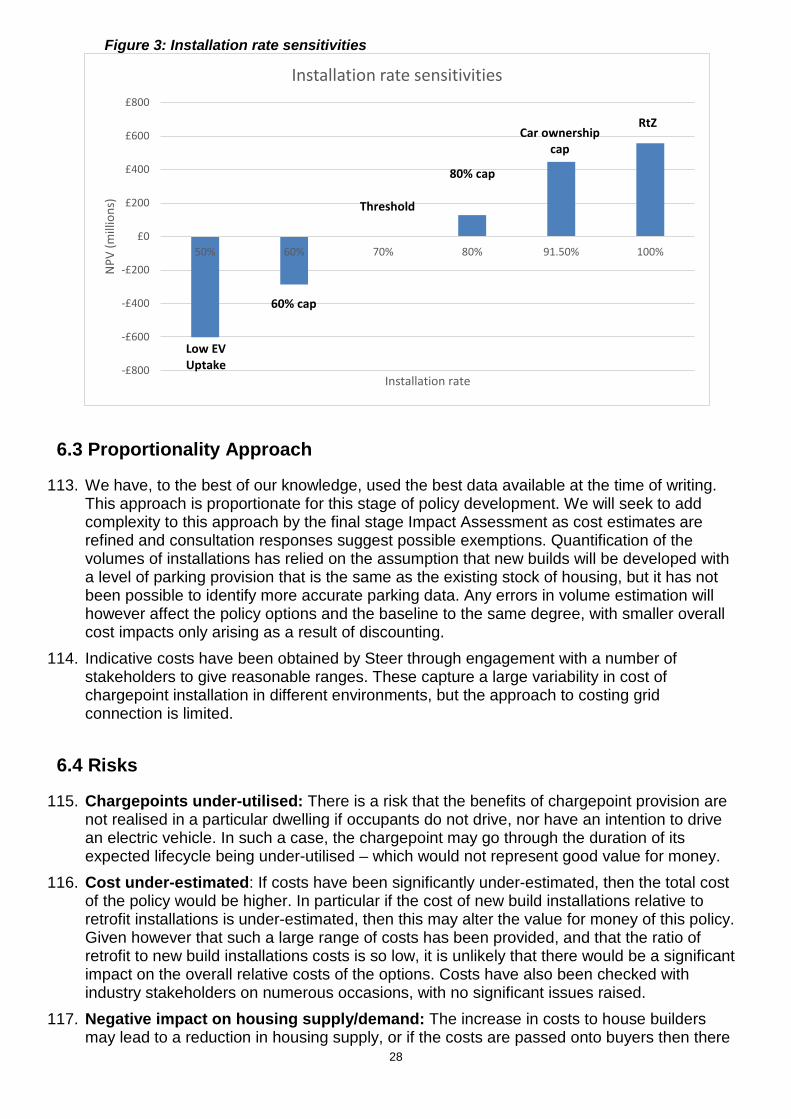
28
Figure 3: Installation rate sensitivities
6.3 Proportionality Approach
113. We have, to the best of our knowledge, used the best data available at the time of writing. This approach is proportionate for this stage of policy development. We will seek to add complexity to this approach by the final stage Impact Assessment as cost estimates are refined and consultation responses suggest possible exemptions. Quantification of the volumes of installations has relied on the assumption that new builds will be developed with a level of parking provision that is the same as the existing stock of housing, but it has not been possible to identify more accurate parking data. Any errors in volume estimation will however affect the policy options and the baseline to the same degree, with smaller overall cost impacts only arising as a result of discounting.
114. Indicative costs have been obtained by Steer through engagement with a number of stakeholders to give reasonable ranges. These capture a large variability in cost of chargepoint installation in different environments, but the approach to costing grid connection is limited.
6.4 Risks
115. Chargepoints under-utilised: There is a risk that the benefits of chargepoint provision are not realised in a particular dwelling if occupants do not drive, nor have an intention to drive an electric vehicle. In such a case, the chargepoint may go through the duration of its expected lifecycle being under-utilised – which would not represent good value for money.
116. Cost under-estimated: If costs have been significantly under-estimated, then the total cost of the policy would be higher. In particular if the cost of new build installations relative to retrofit installations is under-estimated, then this may alter the value for money of this policy. Given however that such a large range of costs has been provided, and that the ratio of retrofit to new build installations costs is so low, it is unlikely that there would be a significant impact on the overall relative costs of the options. Costs have also been checked with industry stakeholders on numerous occasions, with no significant issues raised.
117. Negative impact on housing supply/demand: The increase in costs to house builders may lead to a reduction in housing supply, or if the costs are passed onto buyers then there
-£800
-£600
-£400
-£200
£0
£200
£400
£600
£800
50% 60% 70% 80% 91.50% 100%
NPV
(mill
ions
)
Installation rate
Installation rate sensitivities
Low EV Uptake
60% cap
80% cap
Threshold
Car ownership cap
RtZ
29
may be a reduction in housing demand for new builds. These costs represent between 0.2-0.9% of the £320,48935 average new build house price in England. Moreover, studies generally suggest price elasticity of demand for housing to be around -0.5 and -0.836 which implies that the increase in price is associated with a small 0.1% to 0.72% fall in demand. The impacts on house prices in percentage terms will however be greater for affordable homes. During the course of the consultation, DfT will work with MHCLG to develop analysis to identify any impact that this policy will have on housing supply.
118. Chargepoints becomes obsolete: Given the long time-horizon, there is a chance that changes in the vehicle or chargepoint market results in chargepoints that are installed under these regulations becoming obsolete over the course of the appraisal period. This could be because the chargepoint technology changes, for instance through the introduction of wireless charging, which results in “older” type chargers becoming obsolete. This can be mitigated to an extent by not being prescriptive in the type of chargepoint mandated under the regulations. Furthermore, industry has indicated they expect home charging to continue to be central in the future, and do not expect significant changes in home chargepoint technology. It seems possible that changes to technology are likely to be centred around chargepoints getting increasingly more ‘smart’ and sophisticated in the way they deliver power. Chargepoints could however become obsolete if there are large structural shifts in the way people use personal transportation, for instance an increase in car sharing and automated vehicle use could mean that car ownership drops significantly. This could mean that people do not need chargepoints in their homes and existing chargepoints could become redundant. If the demand for chargepoints in homes and destinations failed to be realised or declined in the future, it is likely that there would be a review of whether the requirement should continue to be included in the Building Regulations.
119. Impact on fuel sector jobs: With a large expansion in the number of ULEVs and ULEV charging infrastructure, there will likely be a significant reduction in the need for ICE vehicle fuelling infrastructure, and certain jobs associated with this sector. Any impacts are likely to have occurred anyway, but policies such as this serve to bring the transition forward. The net impact is also uncertain, as with the advent of ULEVs, comes the need for an expansion in public charging facilities. In particular, it seems possible that rapid charging hubs could replace many of the existing fuelling stations – and many of the jobs could transfer. There may also be economic savings as a result of fuel no longer having to be transported around the country in lorries. Additional jobs may also be created through an increased need for chargepoint maintenance and management services (although such jobs will require some re-training costs). There may also be wider impacts such as on jobs in the electrical grid and distribution sectors as a result of increased demand for electricity, but these impacts are also very uncertain.
7. Distributional Impacts 120. This section discusses possible scenarios for where the final cost burden for any policy
intervention is likely to fall. In doing so, the uncertainty surrounding these scenarios is highlighted. Then the type of businesses affected by this intervention are presented, followed by an assessment of the impacts on small and micro businesses.
7.1 Cost incidence
121. Whereas in the baseline scenario it is the consumers that bear the cost of chargepoint installation, in all of the policy options it is assumed that some element of the cost is borne by the housing developer. There is however a possibility that developers will pass
35 UK HPI data for January 2018 https://www.gov.uk/government/news/uk-house-price-index-for-january-2018 36 Malpezzi, S & Wachter, S (2012), ‘Housing demand’, International Encyclopaedia of Housing and Home

30
on these costs. There is some uncertainty as to what the most likely outcome is in terms of who bears the final cost, but two main scenarios have been identified that seem feasible.
a. Costs are passed on to the end consumer through higher house prices. This
assumes that developers are able to pass the costs on to housing. However, new houses are subject to being sold at market rate, meaning they are competing with existing homes which are not subject to the regulation. This may deter home builders from increasing prices to cover costs.
b. Higher build costs are passed onto landowners through lower land values when housebuilders purchase land for development.
122. Under these scenarios, the following groups that will be impacted have been identified. the consultation will also be used to identify other groups that might be affected.
Scenario a: First time buyers 123. Any rise in house prices as a result of development cost increases could mean that some
house buyers may struggle to pay this. This is likely to disproportionally affect first time buyers compared to ‘second steppers’ as they do not benefit from any existing housing assets that benefit from appreciation. As it stands, the ONS estimated that first time buyers across England and Wales spent around 4.3 times their annual gross income on purchasing a house in 201737.
124. Data from the English Housing Survey can be used to give an idea as to the potential distributional impact of the new builds policy. This reported that there were 653,000 first time buyers across England in 2015-1638. This was the equivalent of around 5% of all owner occupiers. Around 15% of first time buyers belonged to a minority ethnic group and 9% reported at least one individual in the household as having a disability or long-term illness.
Scenario b: Landowners 125. With housebuilders facing higher build costs as a result of this policy, it seems possible that
they may indirectly pass costs onto landowners when they are purchasing land for development. Given that some of their profit margins will be under pressure due to the higher costs, there may be downward pressure on land prices, which would lead to landowners ultimately bearing the cost for this policy. It may also lead to less land coming forward for sale, which may put additional upward pressure on house prices. This will be limited by the degree to which land purchase decisions have already been made (and land which is already owned by developers), and the collective power that the house building sector can exert on land prices. Question 7: What evidence can you provide to support which cost incidence outcome is the most likely?
7.2 Direct costs and benefits to business calculations
126. Three types of businesses who would be directly affected by this regulatory change have been identified:
37ONS first time buyers affordability in England and Wales 2017 https://www.ons.gov.uk/peoplepopulationandcommunity/housing/articles/firsttimebuyerhousingaffordabilityinenglandandwales/2017 38 DCLG EHS First time buyers 2015-16https://assets.publishing.service.gov.uk/government/uploads/system/uploads/attachment_data/file/626887/First_Time_Buyers_report.pdf

31
• Manufacturers/Installers: Our assessment is that installers will face little to no additional cost to comply with this regulation. There could be some small familiarisation costs, but they are already fully equipped to carry out installations as technical standards outside of their usual operating are not being imposed. They will likely experience an expansion in demand which would come as a benefit to them. In 2017, around 18,000 chargepoints were installed under the Electric Vehicle Homecharge Scheme. This policy would require around 88,000 additional chargepoints in 2020.
• Housebuilders: Housebuilders will face an additional burden as the costs of chargepoint installation would be levied on the housebuilder. There will also be additional familiarisation costs above what are experienced by chargepoint installers, as it is likely that construction processes will have to be adapted to account for chargepoint installation. Whilst housebuilders will not receive any direct benefit from this policy, it is assumed that it is possible for them to pass these costs on to buyers through higher house prices, or to landowners through reduced land value. There is however uncertainty as to who will bear the final cost, and this is discussed in more detail in the distributional impacts section. It is the house buyers that experience the direct benefits of this policy as it is them who experience the cost savings relative to the baseline scenario, in which the cost would be levied on them.
7.3 Small and Micro Business Assessment:
127. This section identifies the anticipated impact of any policy intervention on small and micro businesses. The scale of the impact is assessed, along with the assumptions used to establish the impact, before possible measures to mitigate these costs are discussed.
128. The recommended policy option of providing full chargepoint installation will apply to small and large housebuilders in the same way, as they will all have to comply with these regulations. There is however the chance the SME housebuilders will be affected to a greater degree if they are unable to absorb any cost increases. Whilst chargepoint installers are typically small firms, it seems unlikely they will be impacted other than through an increase in demand for their products.
129. There is a possibility that housebuilders will be able to pass costs onto house buyers, but should this not be the case, it is understood there will be measures that they can take to mitigate these potential costs. The following sections identify the anticipated scale of the impact on SaMBs and possible measures for mitigating these costs. In addition to these, a list of possible exemptions for SaMBs are considered below. We do not currently recommend applying these exemptions, but are interested to hear wider views through the consultation process.
Table 14: SaMB exemption considerations
Factor Consideration Full exemption We do not believe full exemption to be compatible with achieving
the aims of the policy, as SaMBs produce a significant volume of dwellings. In the coming years, as demand for chargepoints grows and consumer information about the relative prices of new build and retrofit installations expands, exempted SaMB-built homes may become less attractive to consumers.
Partial exemption
We also believe a partial exemption may not achieve the aim of increasing the level of chargepoint provision. We have not identified any specific requirements within the proposals from which we would be able to exempt SaMBs.

32
Extended transition period
We do not believe an extended transition period for SaMBs is compatible with achieving a large part of the intended benefits. We will ensure that a sufficient transition period is in place for all developers and that there is sufficient time for a well-supported process of familiarisation and transition.
Information We do believe an information pack (designed for all companies) with a specific focus on smaller firms would be a viable consideration. We will explore what any information pack could look like during consultation.
Scale of impact on SaMBs 130. Headcount is not a metric that the building and development industry use to gauge size, as
contracting (and subcontracting) can make this misleading. Looking at SaMBs in terms of headcount does not necessarily bear any resemblance to the amount of new homes built. For example, the relatively few large construction firms (~18) are responsible for a large proportion of housing completions. Therefore, an alternative approach is to use the industry standard definition of small businesses - which includes micro enterprises - which are those that produce fewer than 100 new homes per year39.
131. The National House Building Council (NHBC) publishes statistics that show the proportion of new housing starts by size of builder, which here is measured in terms of new home starts per annum40. It suggests that around 10% of new home starts were by small builders in 2017, i.e. those that built less than 100 homes per year.
132. The NHBC also publishes the number of businesses by size of builder and indicated that around 92% of all construction firms (around 1,740 enterprises) were small, excluding firms with zero new starts. So, while most builders are SaMBs, they produce a fraction of new homes. It should be noted that the NHBC does not cover all construction activity, though they represent around 80% of the industry so it is still a reasonable representation.
133. The NHBC data can be sense checked with the Homes Builder Federation (HBF). Assuming new build construction of ~ 160,000 in 2020 and 10% of construction is by SaMBs, then output could be ~ 1,600 per annum. Given the NHBC also estimates that there were 1,740 SaMBs in total, plus 20% for the rest of the industry not covered by NHBC, this suggests an average of around 8 new builds per SaMB each year. This is in line with the HBF that reports small businesses produce eight new build homes per year.
134. The potential impact on SaMBs can be estimated by multiplying the average upgrade cost with the number of new builds per SaMB. (Note that only developments with an associated parking space are of interest, or multi-occupancy developments with at least 10 parking spaces for option 1). Assuming that the proportion of new builds by parking provision level in the baseline is the same for SaMBs as it is for all builder
39 HBG SME report 2017 https://www.hbf.co.uk/documents/6879/HBF_SME_Report_2017_Web.pdf 40 Housing Market Report 2018 https://www.catesbyestates.co.uk/uploads/files/HM%20Report%20April%202018.pdf

33
Table 15: 2020 costs to SaMBs (2019 prices, 2020 base year) Option 1 Option 2 Number of SaMBs 2,100 2,100 New builds per year 165,316 165,316 In scope new builds 6,020 89,646 Of which by SaMBS (10%) 602 8,965
Total cost in year 1 Total cost £195,365 £8,748,945 Cost per SaMB £93 £4,166
Mitigating costs 135. There are a number of ways smaller developers could mitigate any additional costs
incurred. Beyond the measures identified below, further information and evidence will be welcomed from stakeholders in the consultation that accompanies this impact assessment.
136. Investment - Home Building Fund: The Government’s £4.5 billion Home Building Fund is designed to be a flexible source of loan funding open to small developers and housebuilders. Infrastructure projects that lead to the development of new housing are in scope, although it can only be accessed by SMEs who build homes that otherwise would not have been developed. A case study shows how the fund can be utilised to provide investment for infrastructure41. The Home Building Fund is available to draw down on up to 31 March 2021 and the minimum loan size is £250,000. Although only a limited number of developers would be able to use this fund, there may be other similar investment options and would be interested to hear from relevant stakeholders during the consultation.
137. Passing on costs: There is also the possibility that smaller developers can pass on
additional costs to consumers. The NHBC reports42 that:
“Small housebuilders and developers are not generally concerned about competition from the larger, volume housebuilders. Their interest is in building a local reputation for developing smaller sites, typically those that would not be viable for high-volume operations. They are keen to promote individual, bespoke new home environments and carry this philosophy through into their building, differentiating their homes with individual features and special materials, finishes and appliances. Their target buyer is someone who wants a more distinctive product, is prepared to pay a premium for it and may be less inclined to live on a very large development.”
138. This principle of differentiating through quality of product could be applied to chargepoint
provision. It appears smaller developers recognise a requirement to provide high quality, sometimes bespoke, homes. It follows then that slightly increased costs to provide chargepoint connections is something that smaller developers’ clients may prioritise and be willing to pay for. Question 8: What evidence can you provide to suggest additional ways that small developers are able to mitigate costs?
41 Homes Community Agency (2016), ‘Westward UK Ltd - French Fields, St Helens’ https://assets.publishing.service.gov.uk/government/uploads/system/uploads/attachment_data/file/559041/Westward__U K__Ltd_-_French_Fields__St_Helen_s__Merseyside.pdf 42 5 NHBC (2017), ‘Small housebuilders and developers’ https://www.nhbcfoundation.org/wp-content/uploads/2017/04/NF76_WEB.pdf

34
7.4 Monitoring and Evaluation:
139. As part of this policy, a Post Implementation Review (PIR) will be conducted five years after implementation. Some of the research questions that proposed in order to assess impact include:
• Has the policy been successful in installing electric vehicle chargepoints in new build developments?
• Is the rationale for intervention still valid? For instance, whether the information failures that exist between chargepoints installers, developers, house buyers and consumers remain.
• How have installation costs changed over time? • Business impacts - what were the overall impacts on business? • Direct and indirect impacts - did the assumed impacts occur and were there others
that were not identified both direct and indirect? • Small and micro businesses - Did the approach taken to mitigate the impact on small
businesses work? What was the eventual impact of the policy on small developers? • Assessment of compliance and enforcement - Did stakeholders comply, if not, how
did Government respond to ensure adherence to the policy? • Market structure impacts - was there any impact on the market structures of
developers and chargepoint installers? • Chargepoint utilisation – how much are chargepoints utilised, and how does this vary
between location? • Technological compatibility – are developments in chargepoint technology being
reflected in installations as a result of this requirement?
140. To successfully answer these questions, monitoring the following (provisional) key indicators is proposed, though the list is not exhaustive. The consultation phase may also identify alternative indicators and methods of data collection.
• Number of housing completions with off-street parking • Type of parking provision • Volume of chargepoints installed in new builds • Volume of chargepoints installed in existing properties • Number and type of new build non-residential car parks • Volume of chargepoints installed new car parks • Volume of chargepoints installed in existing car parks • ULEV uptake rates (to establish the likelihood of the policy having impact on uptake)
8. Summary: 141. This impact assessment has considered two options for increasing the level of ULEV
charging infrastructure provision in new residential buildings, and one option for new non-residential car parks. These options are summarised in the table below.
Table 16: option summaries (2019 prices, 2020 base year)
Option NPV EANDCB
Option 1 £43.6m £1.3m
Option 2 £434.6m £55.0m

35
142. In summary, the preferred option is to recommend the installation of a 7 kW chargepoint in all residential new build dwellings with a parking space associated with the building.
143. The analysis has shown that options 2 provides better societal benefits than option 1. The degree to which these benefits are realised do however depend on the baseline chargepoint installation rate.
144. The proportion of installation cost that is transferred from homeowners to housebuilders increases with each option, as shown in the EANDCB figures. There does however, remain uncertainty as to where the final impact of these costs will be borne.
145. As discussed in the SaMBA section, possible exemptions will be consulted upon. Implementation will also be considered to give stakeholders sufficient lead in times.
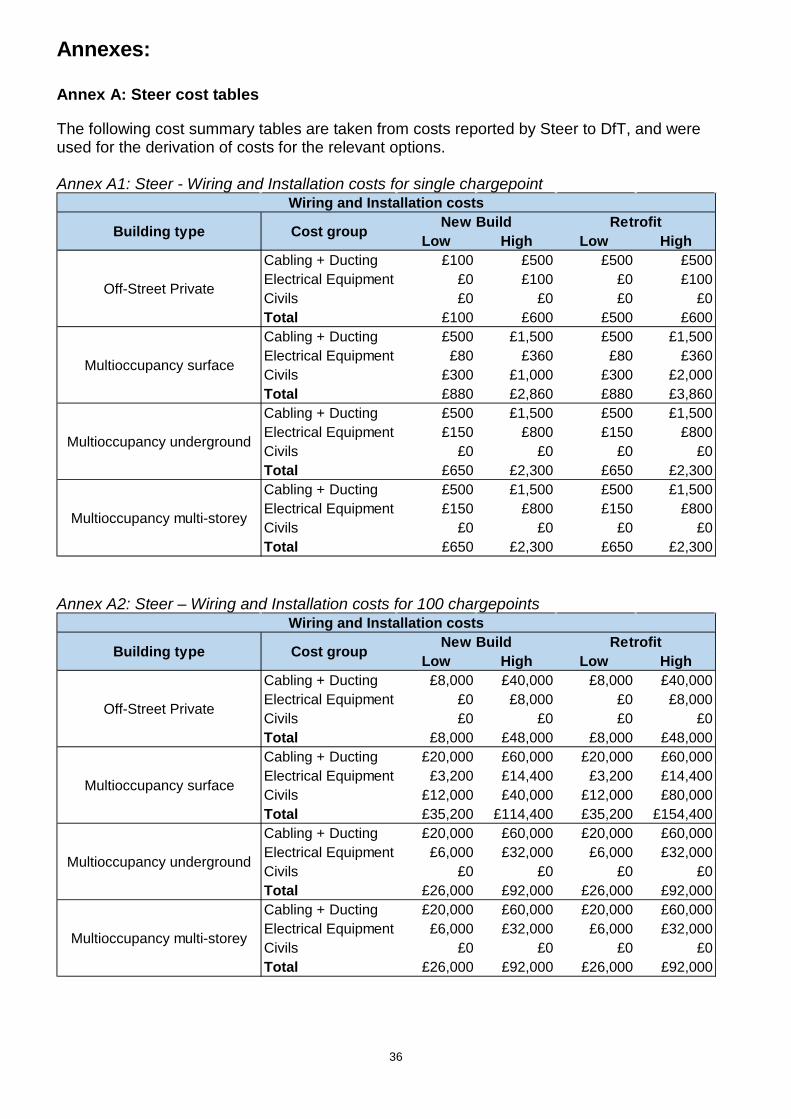
36
Annexes:
Annex A: Steer cost tables
The following cost summary tables are taken from costs reported by Steer to DfT, and were used for the derivation of costs for the relevant options. Annex A1: Steer - Wiring and Installation costs for single chargepoint
Annex A2: Steer – Wiring and Installation costs for 100 chargepoints
Low High Low HighCabling + Ducting £100 £500 £500 £500Electrical Equipment £0 £100 £0 £100Civils £0 £0 £0 £0Total £100 £600 £500 £600Cabling + Ducting £500 £1,500 £500 £1,500Electrical Equipment £80 £360 £80 £360Civils £300 £1,000 £300 £2,000Total £880 £2,860 £880 £3,860Cabling + Ducting £500 £1,500 £500 £1,500Electrical Equipment £150 £800 £150 £800Civils £0 £0 £0 £0Total £650 £2,300 £650 £2,300Cabling + Ducting £500 £1,500 £500 £1,500Electrical Equipment £150 £800 £150 £800Civils £0 £0 £0 £0Total £650 £2,300 £650 £2,300
Wiring and Installation costs
Building type Cost group New Build Retrofit
Off-Street Private
Multioccupancy surface
Multioccupancy underground
Multioccupancy multi-storey
Low High Low HighCabling + Ducting £8,000 £40,000 £8,000 £40,000Electrical Equipment £0 £8,000 £0 £8,000Civils £0 £0 £0 £0Total £8,000 £48,000 £8,000 £48,000Cabling + Ducting £20,000 £60,000 £20,000 £60,000Electrical Equipment £3,200 £14,400 £3,200 £14,400Civils £12,000 £40,000 £12,000 £80,000Total £35,200 £114,400 £35,200 £154,400Cabling + Ducting £20,000 £60,000 £20,000 £60,000Electrical Equipment £6,000 £32,000 £6,000 £32,000Civils £0 £0 £0 £0Total £26,000 £92,000 £26,000 £92,000Cabling + Ducting £20,000 £60,000 £20,000 £60,000Electrical Equipment £6,000 £32,000 £6,000 £32,000Civils £0 £0 £0 £0Total £26,000 £92,000 £26,000 £92,000
Retrofit
Off-Street Private
Multioccupancy surface
Multioccupancy underground
Multioccupancy multi-storey
Wiring and Installation costs
Building type Cost group New Build

37
Annex A3: Steer – Grid Connection costs for single chargepoint
Annex A4: Steer – Grid Connection costs for 100 chargepoints
Annex A5: Steer and Chargepoint Installer – Hardware costs
Annex A6: Steer – Data connectivity costs
Annex B: Option Cost summaries
1.This section presents in greater detail some of the underlying assumptions and drivers that inform the component costs used in this assessment.
Annex B1 - Option 1: Ducting 2.For this option, these costs are only relevant for buildings with 10 or more parking spaces
as this is in line with the minimum EPBD requirement. As data on the distribution of flats per block was broken down into block size ranges, it is assumed that blocks of 11 or more flats are appropriate for this option.
3.Itemised costs were used to disaggregate the costs of cabling and ducting which were
combined in the wiring and installation cost summaries provided by Steer. The relevant cost drivers for the low cost and high cost scenarios are identified in table B1 below.
New BuildLow High Low High
Off-street private £0 £0 £0 £1,300Multioccupancy surface £0 £3,000 £0 £3,000Multioccupancy underground £0 £3,000 £0 £3,000Multioccupancy multi-storey £0 £3,000 £0 £3,000
Grid connection 1 x point
Building Type Retrofit
New BuildLow High Low High
Off-street private £5,000 £40,000 £5,000 £80,000Multioccupancy surface £2,000 £120,000 £5,000 £120,000Multioccupancy underground £2,000 £120,000 £5,000 £120,000Multioccupancy multi-storey £2,000 £120,000 £5,000 £120,000
Grid connection 100 x point
Building Type Retrofit
x1 x100Off-street private £515 £46,003Multioccupancy surface £1,350 £120,536Multioccupancy underground £580 £51,786Multioccupancy multi-storey £580 £51,786
Charge point Hardware Costs
Building Type
Cost item Cost Additional Information
Charge point modem £410Single modem can be used for multiple chargepoints
Data Cabling (inc. labo £1,000 Cost for 100 chargepoints

38
4.The primary driver of cost differences between categories for this option is whether cabling can be routed using ducting (as with off-street private and multi-occupancy underground and multi-storey) or whether underground trenching is required (as with multi-occupancy surface car parks). This is primarily due to the significant labour costs involved which typically represent around 70% to 80% of the total costs of trenching. Furthermore, undertaking trenching to replace or lay new cable in a retrofit environment can cause disruption to the building users until the surface is reinstated. This disruption cost has not been estimated as part of this assessment.
5.For single installation there is little variability in the costs between retrofit and new build.
The only variability comes from the costs of civils works for and surface level multi-occupancy car parks. The difference between the low and high cost scenarios is driven by the volumes of ducting/trenching required, depending on the distances from the power supply to the chargepoint.
Annex B2 - Option 2: Cabling + Grid connection
Cabling 6.As with the ducting option, the cost differences for cabling between categories are driven
by the length of cabling required. These costs are also shown in the tables above. For retrofit options, it is assumed that an entirely new cable from the distribution board to the chargepoint is required in all situations, which drives the higher cost.
7.Another significant cost sensitivity is the electrical equipment required. For off-street private
parking, the chargepoint will only require a single miniature circuit breaker (MCB) in an existing distribution board which can be easily retrofitted. This is the case regardless of the quantity of chargers installed as each building will have its own distribution board. This is also true for a single installation in multi-occupancy basement or multi-storey parking. However, when 100 connections are installed together, multiple moulded case circuit breakers of different current ratings will be required to supply electricity to the chargepoints. At surface level chargepoints will be supplied from a feeder pillar, which can serve multiple chargepoints.
8.The cost for 100 connections would be inclusive of new transformers and distribution
network cabling. This cost will be absorbed by either the developer or socialised depending on the development type and whether it is new build or retrofit. The factors influencing the costs of wiring and installation are highlighted below; unless the parking provision is stated, the costs are applicable to all parking types.
Table B1: wiring and installation cost drivers Factor Low Scenario High Scenario Electrical Equipment
Distribution board Array controller Single installation Multi-installation
N/A N/A N/A N/A
Required Required MCB, RCD, PME MCCB, 400A, RCD, PME
Cabling and Ducting Cabling Ducting Connection Traffic management
6mm/3 core (1 Phase) N/A Single Outlet, 7kw N/A
25mm/5 core (3 Phase) 300mm cable tray Twin Outlet, 22kw Permitting fees (one off) Design fees (m²)
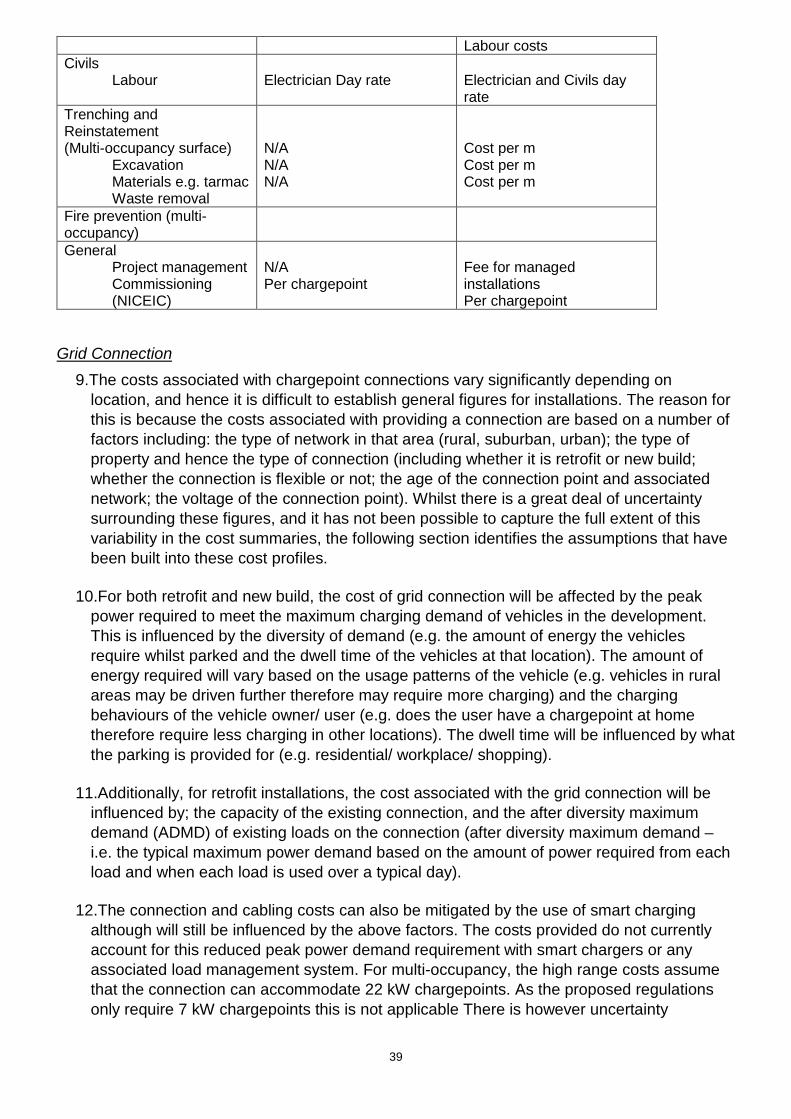
39
Labour costs Civils
Labour
Electrician Day rate
Electrician and Civils day rate
Trenching and Reinstatement (Multi-occupancy surface)
Excavation Materials e.g. tarmac Waste removal
N/A N/A N/A
Cost per m Cost per m Cost per m
Fire prevention (multi-occupancy)
General Project management Commissioning (NICEIC)
N/A Per chargepoint
Fee for managed installations Per chargepoint
Grid Connection 9.The costs associated with chargepoint connections vary significantly depending on
location, and hence it is difficult to establish general figures for installations. The reason for this is because the costs associated with providing a connection are based on a number of factors including: the type of network in that area (rural, suburban, urban); the type of property and hence the type of connection (including whether it is retrofit or new build; whether the connection is flexible or not; the age of the connection point and associated network; the voltage of the connection point). Whilst there is a great deal of uncertainty surrounding these figures, and it has not been possible to capture the full extent of this variability in the cost summaries, the following section identifies the assumptions that have been built into these cost profiles.
10.For both retrofit and new build, the cost of grid connection will be affected by the peak
power required to meet the maximum charging demand of vehicles in the development. This is influenced by the diversity of demand (e.g. the amount of energy the vehicles require whilst parked and the dwell time of the vehicles at that location). The amount of energy required will vary based on the usage patterns of the vehicle (e.g. vehicles in rural areas may be driven further therefore may require more charging) and the charging behaviours of the vehicle owner/ user (e.g. does the user have a chargepoint at home therefore require less charging in other locations). The dwell time will be influenced by what the parking is provided for (e.g. residential/ workplace/ shopping).
11.Additionally, for retrofit installations, the cost associated with the grid connection will be
influenced by; the capacity of the existing connection, and the after diversity maximum demand (ADMD) of existing loads on the connection (after diversity maximum demand – i.e. the typical maximum power demand based on the amount of power required from each load and when each load is used over a typical day).
12.The connection and cabling costs can also be mitigated by the use of smart charging
although will still be influenced by the above factors. The costs provided do not currently account for this reduced peak power demand requirement with smart chargers or any associated load management system. For multi-occupancy, the high range costs assume that the connection can accommodate 22 kW chargepoints. As the proposed regulations only require 7 kW chargepoints this is not applicable There is however uncertainty

40
surrounding this managed load scenario and what the actual power demand for charging may be when wide-scale EV adoption occurs.
13.A further factor influencing the connection cost is the type of electrical earthing the
building’s power supply (grid connection) has. Often in the UK, buildings use a protective multiple earth (PME) power supply which may no longer be suitable if a chargepoint is installed. The use of PME supplies is dependent on the type of structure the parking is located in. This primarily concerns if the parking location for charging vehicles, the chargepoint, and the supply (grid connection point) are contained within the same structure (e.g. multi-story or basement carpark); or the parking and supply are located separately (e.g. in an open-air surface level carpark). Additionally, parking located within a steel framed building (or buildings attached to a steel framed building), may not use a PME supply. For individual residential buildings certain relaxations to the wiring standards may apply.
14.The impact will be biggest for retrofit, where a PME supply is no longer appropriate,
alteration to the supply, additional electrical works, or a separate supply will be required. For new builds, there may be an increase in cost associated with not being able to use a PME supply. However, this is assumed to be marginal compared to retrofit.
15.For a single installation, either new build or retrofit, it is assumed that there would be
sufficient spare power capacity to supply the chargepoint. Therefore, there are no additional grid connection costs, unless a dedicated supply was installed.
16.For multi-occupancy car parks, the need for grid upgrades upstream of the dedicated
building transformer is assumed to be minimal. However, for both the upstream (HV) distribution network and the national grid transition network, the aggregate effects of multiple developments installing multiple chargepoints certainly would have an impact and incur significant cost, although these have not been considered within this assessment.
Table B2: Grid connection cost drivers Residential off-street (retrofit) Alteration of connection of individual house to LV distribution grid. 1. Service alteration to increase supply power capacity 2. Alteration to PME supply for vehicles used on driveway.
N/A N/A
Required (assumed 10m able) - Highest cost for overhead supply alteration. Required.
Upstream grid reinforcement (Where multiple chargepoints installed on the same distribution network) 1. Cabling (4x200m) 2. Transformer
N/A Required
Cost per m Cost dependent on capacity (kWs)
Residential off-street (new build) Single Installation N/A N/A Multi-occupancy Car Park – Basement/ Multi-storey (Retrofit)

41
Assumed no cost for 1 x installation 1. Cabling (100m) 2. Transformer 3. Alteration of PME supply
Cost per m Cost dependent on capacity (kWs) N/A
Cost per m Cost dependent on capacity (kWs) Required
Multi-occupancy Car Park – Basement/ Multi-storey (New build) Assumed no cost for 1 x installation. 1. Service connection 2. Cabling (100m) 3. Transformer
Required (fixed cost) Cost per m Cost dependent on capacity (kWs)
Required (fixed cost) Cost per m Cost dependent on capacity (kWs)
Annex B3 - Option 2: Chargepoint 17.These costs include the hardware costs of a 7kW ‘smart’ chargepoint and the data
connectivity costs that are relevant for the multi-occupancy underground and multi-storey categories where it is assumed that data connectivity may not be available. These costs are identified in annex table A6. Multi-occupancy surface car parks are assumed to require a ground mounted chargepoint which carries an additional cost, whilst the other parking categories are assumed to require a wall mounted chargepoint.
18.Chargepoint power is the biggest single factor in influencing the cost of a charger. Given
that it will be a functional requirement for chargepoints to have power of at least 7kW, we have assumed that a 7kW chargepoint is appropriate for all parking categories. The costs used were derived from a combination of the cost summaries provided by Steer as well as direct engagement with a range of chargepoint operators. A range has not been provided as we understand that many high range costs reflect the inclusion of a number of optional extras that are not essential to the functionality of the chargepoint. The bulk-buy unit costs for 100 chargepoints was found using the same ratios as identified by Steer for the wall mounted unit, meaning that for a 100 chargepoints, the unit cost is 89% of the cost of a single unit.
19.There are many additional factors that affect the cost of chargepoint hardware, such as
the number of sockets, the type of mount and payment/authorisation. We have assumed the relevant costs for a base model chargepoint. The costs are applicable whether the installation is within a retrofit or new build environment, but bulk costs means that multi-occupancy new build developments are able to take advantage of lower unit costs.
20.Although we expect the cost of hardware to fall over time, we have not included this in the
analysis, as we do not have sufficient data to inform the rate of reduction. This option includes the costs outlined in option 2, and applies to all dwellings with an associated parking space.
Annex C: Consultation questions
• Question 1: What evidence can you provide to inform the volume of residential dwellings that annually undergo major renovation or material change of use?
• Question 2: What evidence do you have to inform the volume of dwellings that have had a chargepoint installed at the point of construction?
• Question 3: What evidence can you provide to support the use of alternative assumptions to inform grid connection costs?

42
• Question 4: What evidence can you provide to support multiple single unit developments (such as housing estates) taking advantage of economies of scale for installation costs?
• Question 5: What evidence can you provide to support economies of scale providing cost reductions for installation and hardware costs?
• Question 6: What evidence can you provide to support how technological learning rates will contribute to chargepoint cost reduction over time?
• Question 7: What evidence can you provide to support which cost incidence outcome is the most likely?
• Question 8: What evidence can you provide to suggest additional ways that small developers are able to mitigate costs?