IMMUNOLOGY Copyright © 2020 B cell Sirt1 deacetylates ... · activator SRT1720, which is 1000-fold...
18
Gan et al., Sci. Adv. 2020; 6 : eaay2793 1 April 2020 SCIENCE ADVANCES | RESEARCH ARTICLE 1 of 17 IMMUNOLOGY B cell Sirt1 deacetylates histone and non-histone proteins for epigenetic modulation of AID expression and the antibody response Huoqun Gan* † , Tian Shen* ‡ , Daniel P. Chupp, Julia R. Taylor, Helia N. Sanchez, Xin Li, Zhenming Xu, Hong Zan § , Paolo Casali § Activation-induced cytidine deaminase (AID) mediates immunoglobulin class switch DNA recombination (CSR) and somatic hypermutation (SHM), critical processes for maturation of the antibody response. Epigenetic factors, such as histone deacetylases (HDACs), would underpin B cell differentiation stage–specific AID expression. Here, we showed that NAD + -dependent class III HDAC sirtuin 1 (Sirt1) is highly expressed in resting B cells and down-regulated by stimuli inducing AID. B cell Sirt1 down-regulation, deprivation of NAD + cofactor, or genetic Sirt1 deletion reduced deacetylation of Aicda promoter histones, Dnmt1, and nuclear factor–B (NF-B) p65 and increased AID expression. This promoted class-switched and hypermutated T-dependent and T-independent antibody responses or led to generation of autoantibodies. Genetic Sirt1 overexpression, Sirt1 boost by NAD + , or allosteric Sirt1 enhancement by SRT1720 repressed AID expression and CSR/SHM. By deacetylating histone and nonhistone proteins (Dnmt1 and NF-B p65), Sirt1 transduces metabolic cues into epigenetic changes to play an important B cell–intrinsic role in modulating antibody and autoantibody responses. INTRODUCTION As the master molecule for immunoglobulin (Ig) class switch DNA recombination (CSR) and somatic hypermutation (SHM), activation- induced cytidine deaminase (AID) is central to the maturation of the antibody response (1). Physiologically, AID expression is restricted to B cells only and at a specific B cell differentiation stage only. AID is undetectable in resting B cells, and it is induced at high levels in B cells activated by T-dependent and T-independent stimuli, in- cluding CD154:CD40, Toll-like receptor (TLR) ligand:TLR, and select cytokine:cytokine receptors engagement, and then subsides to undetectable levels in resting memory B cells and plasma cells (2–4). AID is also greatly up-regulated in activated B cells that make class-switched and somatically hypermutated autoantibodies in autoimmune diseases, such as systemic lupus erythematosus (SLE) (3, 4). AID induction is mediated through activation of the Aicda (AID gene) promoter and regulatory regions by transcription fac- tor nuclear factor–B (NF-B) as complemented by HoxC4, as well as by Aicda histones acetylation and DNA demethylation (5–8). Select microRNAs and Aicda cis-elements have been shown to prevent AID expression in nonactivated B cells (7, 9). However, the mechanisms underpinning the suppression of Aicda transcription, which is re- quired to avoid AID expression in B cells either resting or in response to subliminal and/or “nonspecific” stimuli and to control prolonged AID activation, have remained virtually unexplored. We contend here that B cell–intrinsic regulation of AID expres- sion is mediated by epigenetic mechanisms (3, 4, 10). Epigenetic modifications and factors comprise epigenetic marks, such as DNA methylation/demethylation and histone posttranslational modifica- tions, and epigenetic mediators, including histone methyltransferases and demethylases, histone acyltransferases, and histone deacetylases (HDACs comprise “classical” class I, II, and IV HDACs and “non- classical” class III HDACs or Sirtuins) as well as noncoding RNAs (e.g., microRNAs and long noncoding RNAs) (4, 10). Epigenetic modifications and factors are known to influence gene expression and modulate critical B cell processes, including CSR/SHM and plasma cell differentiation, thereby informing the antibody response (4, 10). By using well-characterized short-chain fatty acid HDAC inhibitors valproic acid and butyrate, which inhibit the classical class I, II, and IV HDACs, we have shown that these HDACs regulate intrinsic B cell functions that are critical in shaping effective antibody and autoantibody responses (11). Sirt1, a nonclassical class III HDAC, has been implicated in innate and adaptive immune responses (12). Sirt1 has been suggested to function as an immune regulator, sup- pressing the antinuclear autoantibody response in murine lupus and type 1 diabetes through modulation of T cell functions (12–14). Also, Sirt1-null mice develop an autoimmune condition with characteristic antinuclear autoantibodies (15). Sirt1 actively deacetylates acetyl-lysine in multiple histones, in- cluding H3K9Ac and H3K14Ac, to facilitate chromatin compaction and silence gene transcription (16). In addition to deacetylating histones, Sirt1 deacetylates select nonhistone proteins. These are generally molecules involved in signal transduction, metabolism, or gene transcription. By deacetylating the p65 subunit at lysine 310, Sirt1 inactivates NF-B (17); by deacetylating the catalytic domain of DNA methyltransferase 1 (Dnmt1), Sirt1 boosts this enzyme’s activity (18). Unlike class I, II, and IV HDACs that are Zn 2+ depen- dent for their function, Sirt1, like the other class III deacetylases, depends on nicotinamide adenosine dinucleotide (NAD + ) as cofactor (19). Increased cellular NAD + boosts Sirt1 activity. Resveratrol, a natural polyphenolic compound found mainly in grape skin and red wine, which increases Sirt1 activity by facilitating NADH oxidation to NAD + and, likely, by increasing Sirt1 affinity for both NAD + and Department of Microbiology, Immunology and Molecular Genetics, University of Texas Long School of Medicine, UT Health Science Center, San Antonio, TX 78229, USA. *These authors contributed equally to this work. †Present address: Department of Pediatrics, Xiangya University Hospital, Central South University, Changsha, Hunan 410008, China. ‡Present address: Department of Pediatrics, The Second Xiangya University Hospital, Central South University, Changsha, Hunan 410011, China. §Corresponding author. Email: [email protected] (H.Z.); [email protected] (P.C.) Copyright © 2020 The Authors, some rights reserved; exclusive licensee American Association for the Advancement of Science. No claim to original U.S. Government Works. Distributed under a Creative Commons Attribution NonCommercial License 4.0 (CC BY-NC). on June 1, 2020 http://advances.sciencemag.org/ Downloaded from
Transcript of IMMUNOLOGY Copyright © 2020 B cell Sirt1 deacetylates ... · activator SRT1720, which is 1000-fold...

Gan et al., Sci. Adv. 2020; 6 : eaay2793 1 April 2020
S C I E N C E A D V A N C E S | R E S E A R C H A R T I C L E
1 of 17
I M M U N O L O G Y
B cell Sirt1 deacetylates histone and non-histone proteins for epigenetic modulation of AID expression and the antibody responseHuoqun Gan*†, Tian Shen*‡, Daniel P. Chupp, Julia R. Taylor, Helia N. Sanchez, Xin Li, Zhenming Xu, Hong Zan§, Paolo Casali§
Activation-induced cytidine deaminase (AID) mediates immunoglobulin class switch DNA recombination (CSR) and somatic hypermutation (SHM), critical processes for maturation of the antibody response. Epigenetic factors, such as histone deacetylases (HDACs), would underpin B cell differentiation stage–specific AID expression. Here, we showed that NAD+-dependent class III HDAC sirtuin 1 (Sirt1) is highly expressed in resting B cells and down-regulated by stimuli inducing AID. B cell Sirt1 down-regulation, deprivation of NAD+ cofactor, or genetic Sirt1 deletion reduced deacetylation of Aicda promoter histones, Dnmt1, and nuclear factor–B (NF-B) p65 and increased AID expression. This promoted class-switched and hypermutated T-dependent and T-independent antibody responses or led to generation of autoantibodies. Genetic Sirt1 overexpression, Sirt1 boost by NAD+, or allosteric Sirt1 enhancement by SRT1720 repressed AID expression and CSR/SHM. By deacetylating histone and nonhistone proteins (Dnmt1 and NF-B p65), Sirt1 transduces metabolic cues into epigenetic changes to play an important B cell–intrinsic role in modulating antibody and autoantibody responses.
INTRODUCTIONAs the master molecule for immunoglobulin (Ig) class switch DNA recombination (CSR) and somatic hypermutation (SHM), activation- induced cytidine deaminase (AID) is central to the maturation of the antibody response (1). Physiologically, AID expression is restricted to B cells only and at a specific B cell differentiation stage only. AID is undetectable in resting B cells, and it is induced at high levels in B cells activated by T-dependent and T-independent stimuli, in-cluding CD154:CD40, Toll-like receptor (TLR) ligand:TLR, and select cytokine:cytokine receptors engagement, and then subsides to undetectable levels in resting memory B cells and plasma cells (2–4). AID is also greatly up-regulated in activated B cells that make class-switched and somatically hypermutated autoantibodies in autoimmune diseases, such as systemic lupus erythematosus (SLE) (3, 4). AID induction is mediated through activation of the Aicda (AID gene) promoter and regulatory regions by transcription fac-tor nuclear factor–B (NF-B) as complemented by HoxC4, as well as by Aicda histones acetylation and DNA demethylation (5–8). Select microRNAs and Aicda cis-elements have been shown to prevent AID expression in nonactivated B cells (7, 9). However, the mechanisms underpinning the suppression of Aicda transcription, which is re-quired to avoid AID expression in B cells either resting or in response to subliminal and/or “nonspecific” stimuli and to control prolonged AID activation, have remained virtually unexplored.
We contend here that B cell–intrinsic regulation of AID expres-sion is mediated by epigenetic mechanisms (3, 4, 10). Epigenetic modifications and factors comprise epigenetic marks, such as DNA
methylation/demethylation and histone posttranslational modifica-tions, and epigenetic mediators, including histone methyltransferases and demethylases, histone acyltransferases, and histone deacetylases (HDACs comprise “classical” class I, II, and IV HDACs and “non-classical” class III HDACs or Sirtuins) as well as noncoding RNAs (e.g., microRNAs and long noncoding RNAs) (4, 10). Epigenetic modifications and factors are known to influence gene expression and modulate critical B cell processes, including CSR/SHM and plasma cell differentiation, thereby informing the antibody response (4, 10). By using well-characterized short-chain fatty acid HDAC inhibitors valproic acid and butyrate, which inhibit the classical class I, II, and IV HDACs, we have shown that these HDACs regulate intrinsic B cell functions that are critical in shaping effective antibody and autoantibody responses (11). Sirt1, a nonclassical class III HDAC, has been implicated in innate and adaptive immune responses (12). Sirt1 has been suggested to function as an immune regulator, sup-pressing the antinuclear autoantibody response in murine lupus and type 1 diabetes through modulation of T cell functions (12–14). Also, Sirt1-null mice develop an autoimmune condition with characteristic antinuclear autoantibodies (15).
Sirt1 actively deacetylates acetyl-lysine in multiple histones, in-cluding H3K9Ac and H3K14Ac, to facilitate chromatin compaction and silence gene transcription (16). In addition to deacetylating histones, Sirt1 deacetylates select nonhistone proteins. These are generally molecules involved in signal transduction, metabolism, or gene transcription. By deacetylating the p65 subunit at lysine 310, Sirt1 inactivates NF-B (17); by deacetylating the catalytic domain of DNA methyltransferase 1 (Dnmt1), Sirt1 boosts this enzyme’s activity (18). Unlike class I, II, and IV HDACs that are Zn2+ depen-dent for their function, Sirt1, like the other class III deacetylases, depends on nicotinamide adenosine dinucleotide (NAD+) as cofactor (19). Increased cellular NAD+ boosts Sirt1 activity. Resveratrol, a natural polyphenolic compound found mainly in grape skin and red wine, which increases Sirt1 activity by facilitating NADH oxidation to NAD+ and, likely, by increasing Sirt1 affinity for both NAD+ and
Department of Microbiology, Immunology and Molecular Genetics, University of Texas Long School of Medicine, UT Health Science Center, San Antonio, TX 78229, USA.*These authors contributed equally to this work.†Present address: Department of Pediatrics, Xiangya University Hospital, Central South University, Changsha, Hunan 410008, China.‡Present address: Department of Pediatrics, The Second Xiangya University Hospital, Central South University, Changsha, Hunan 410011, China.§Corresponding author. Email: [email protected] (H.Z.); [email protected] (P.C.)
Copyright © 2020 The Authors, some rights reserved; exclusive licensee American Association for the Advancement of Science. No claim to original U.S. Government Works. Distributed under a Creative Commons Attribution NonCommercial License 4.0 (CC BY-NC).
on June 1, 2020http://advances.sciencem
ag.org/D
ownloaded from

Gan et al., Sci. Adv. 2020; 6 : eaay2793 1 April 2020
S C I E N C E A D V A N C E S | R E S E A R C H A R T I C L E
2 of 17
acetylated substrate, has been shown to affect protection in lupus mice (20, 21). By contrast, reduced cellular NAD+ concentration, resulting from conversion of NAD+ to NADH by the glucose meta-bolic pathway (glycolysis), leads to decreased Sirt1 activity (22). As a result of its dependence on NAD+ and, therefore, the cellular NAD+/NADH ratio, Sirt1 has emerged as a key metabolic sensor in various tissues (23). By deacetylating histone and nonhistone pro-teins, including transcription factors, Sirt1 couples the cell metabolic status (through NAD+) to the modulation of multiple biological processes, such as signal transduction, gene transcription, and DNA repair (24, 25). Although a role for Sirt1 in B cells has remained mostly unexplored, our preliminary findings have suggested that Sirt1 suppresses AID expression in a B cell–intrinsic fashion, thereby impacting CSR/SHM in antibody and autoantibody responses.
We hypothesized here that Sirt1 regulates AID expression in a B cell–intrinsic fashion to modulate CSR/SHM and the maturation of the antibody response. To test our hypothesis, we generated conditional knockout AicdacreSirt1fl/fl mice and used them together with transgenic mice expressing multiple copies of Sirt1 (Sirt1super mice) to address the B cell–intrinsic role of Sirt1 in T-dependent and T-independent antibody responses, namely, the role of Sirt1 in modulating histone acetylation of the Aicda and, for comparison, the Prdm1 (Blimp1 gene) and Xbp1 promoters. In addition, we ad-dressed the potential role of Sirt1 in modulating NF-B acetylation and, therefore, NF-B recruitment to the Aicda promoter for in-duction of Aicda expression. We also addressed the role of Sirt1 in modulating the methylation status of the Aicda promoter through deacetylation and activation of the DNA methyltransferase Dnmt1. Further, we analyzed the impact of elevated glucose on the cellular NAD+/NADH ratio and Sirt1 activity on Aicda and, for comparison, Prdm1 expression in B cells. Last, we used the small-molecule Sirt1 activator SRT1720, which is 1000-fold more potent than resveratrol, to boost Sirt1 activity in B cells in vitro and in vivo and measured SRT1720 impact on AID levels and CSR/SHM. Overall, our findings outline an important B cell–intrinsic role for Sirt1 as an epigenetic modulator of AID and as a regulator of class-switched and hyper-mutated antibody and autoantibody responses. Sirt1 affects these functions by acetylating histone and nonhistone proteins in response to B cell activation stimuli, the metabolic milieu, or small-molecule activator(s).
RESULTSSirt1 is highly expressed in resting naïve B cells and down-regulated by Aicda-inducing stimuliSirt1 has been shown to be expressed in lymphoid tissues (13). We found Sirt1 to be expressed at the highest level among the seven Sirt genes in mouse naïve B cells (Fig. 1A). Stimulation of these B cells to induce CSR greatly down-regulated Sirt1 [by 86.5% after stimu-lation with lipopolysaccharide (LPS) plus interleukin-4 (IL-4) and 87.5% after stimulation with CD154 plus IL-4] while up-regulating Aicda transcripts (Fig. 1B). Like mouse B cells, purified human naïve B cells expressed SIRT1 at a high level and down-regulated it by 90.8% after a 72-hour stimulation by CD154 plus IL-4 and IL-21, which up-regulated AICDA, resulting in CSR to IgG (Fig. 1C and fig. S1). By contrast, in B cells activated by cross-linking the B cell antigen receptor (BCR) with anti-Ig monoclonal antibody (mAb), expression of Sirt1 and Aicda was unchanged (Fig. 1D). A reciprocal Sirt1/Aicda expression also occurred in vivo. In B cells isolated from
NP-conjugated chicken gamma globulin (NP16-CGG)–immunized C57BL/6 mice, in which Aicda expression was greatly increased, Sirt1 expression was significantly reduced, as compared to nonimmunized mice (Fig. 1E). In those B cells, reduced Sirt1 expression was reflected in reduced levels of Sirt1 protein and was concomitant with increased AID protein (Fig. 1F). Sirt1 level in germinal center B cells, which expressed AID, was significantly lower than that in naïve B cells or plasma cells, which did not express AID, as shown by intracellular immunofluorescence with anti-Sirt1 and anti-AID Abs. Similarly, in B cells stimulated by LPS plus IL-4 in vitro, Sirt1 protein expression was down-regulated while AID protein was up-regulated, as shown by intracellular immunofluorescence and immunoblotting (Fig. 1, G to I). Thus, Sirt1 is expressed at a high level in resting naïve B cells, in which AID expression is virtually nil. Activation of B cells by stimuli that induce CSR down-regulates Sirt1 while reciprocally up-regulating Aicda ex-pression, indicating a role for Sirt1 in modulation of Aicda expression.
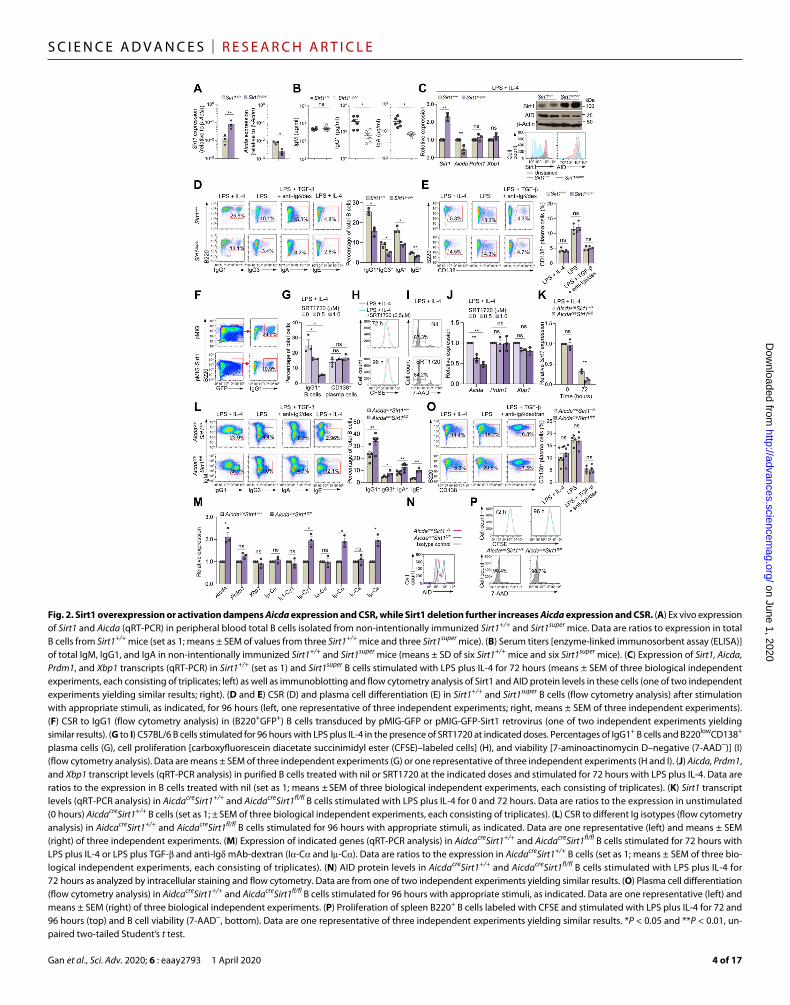
Sirt1 overexpression or activation dampens Aicda expression and CSRTo address the role of Sirt1 in modulating Aicda in vivo, we used transgenic mice expressing extra copies of Sirt1 (Sirt1super mice) (26). In Sirt1super mice, B cell Sirt1 levels were about 250 to 1000% higher than in Sirt+/+ mice, concomitant with decreased Aicda expression and decreased circulating IgG1 and IgA but normal IgM levels (Fig. 2, A and B). Sirt1super B cells stimulated in vitro by LPS plus IL-4 expressed Sirt1 225% more than wild-type (WT) B cells (Fig. 2C). The increased Sirt1 transcripts and Sirt1 protein in these Sirt1super B cells were associated with decreased Aicda transcripts and AID protein, significantly lower CSR to IgG1, IgG3, IgA, and IgE than WT B cells, but unaltered expression of Prdm1, Xbp1, and plasma cell differentiation (Fig. 2, C to E). Accordingly, enforced Sirt1 expression by a retroviral construct in normal B cells greatly reduced CSR to IgG1 (Fig. 2F). Further, selective activation of Sirt1 by SRT1720 inhibited CSR in WT B cells stimulated with LPS plus IL-4, without affecting plasma cell differentiation, cell proliferation, or viability (Fig. 2, G to I, and fig. S2A). SRT1720-induced inhibition of CSR was associated with reduced Aicda but not reduced Prdm1 or Xbp1 expression (Fig. 2J). Like SRT1720, resveratrol reduced Aicda expression and CSR in a dose-dependent fashion without altering Prdm1 expression or plasma cell differentiation (fig. S2, B and C). Thus, Sirt1 overexpression or Sirt1 activation efficiently inhibits B cell Aicda expression and CSR but not Prdm1 or Xbp1 expression or plasma cell differentiation.
B cell Sirt1 deletion up-regulates Aicda expression and CSRTo further define the B cell–intrinsic role of Sirt1 in modulating AID expression and CSR/SHM, we cross-bred transgenic Aicdacre mice (5) with Sirt1fl/fl mice (27) to construct AicdacreSirt1fl/fl mice. In these mice, which carry a normal complement of Aicda gene together with a cre gene under control of an extra Aicda promoter/enhancer within a bacterial artificial chromosome (BAC) transgene, cre recombinase expression leading to Sirt1 deletion occurred only in B cells activated to transcribe Aicda-cre. AicdacreSirt1fl/fl mice had an intact Sirt1 locus throughout embryogenesis and were born at an expected Mendelian ratio. They were indistinguishable from their AicdacreSirt1+/+ and AicdacreSirt1+/fl littermates in size, fertility, and organ morphology during development and maturation.
In vitro, AicdacreSirt1fl/fl B cells further reduced Sirt1 expression upon exposure to Aicda- and CSR-inducing stimuli, as compared to
on June 1, 2020http://advances.sciencem
ag.org/D
ownloaded from

Gan et al., Sci. Adv. 2020; 6 : eaay2793 1 April 2020
S C I E N C E A D V A N C E S | R E S E A R C H A R T I C L E
3 of 17
their AicdacreSirt1+/+ counterparts (Fig. 2K). Among AicdacreSirt1fl/fl B cells stimulated to undergo CSR to IgG3 (by LPS), to IgG1 and IgE (LPS plus IL-4), or to IgA [LPS plus transforming growth factor– (TGF-), IL-5, IL-4, and anti- mAb/dex], the proportion of switched IgG3+, IgG1+, IgA+, or IgE+ B cells was 50 to over 400% greater than among similarly stimulated AicdacreSirt1+/+ B cells, as confirmed by elevated postrecombination I-C1, I-C, and I-C transcripts (Fig. 2, L and M). Further, it was associated with increased expression of Aicda and AID protein, but not Prdm1, Xbp1, or germline I-C,
I1-C1, I-C, and I-C transcripts, as measured by real-time quan-titative reverse transcription polymerase chain reaction (qRT-PCR) after a 72-hour culture (Fig. 2, M and N), indicating a role of Sirt1 in regulating AID but not Blimp1 expression. Plasma cell differentia-tion of AicdacreSirt1fl/fl B cells, as measured by proportion of CD19low CD138+ cells, was comparable to that of AicdacreSirt1+/+ cells and so were B cell proliferation and survival (Fig. 2, O and P). Thus, ablation of Sirt1 in B cells increases Aicda expression and CSR with-out altering Prdm1 expression or plasma cell differentiation.
Fig. 1. Aicda-inducing stimuli down-regulate Sirt1 in human and mouse B cells. (A) Sirt1-7 and Aicda expression in mouse naïve B cells before and after stimulation with LPS plus IL-4 for 72 hours, as measured by mRNA-Seq and depicted as RPKM (reads per kilobase of transcripts per million mapped reads; one of two independent experiments yielding comparable results). (B) Sirt1 and Aicda transcript levels [quantitative reverse transcription polymerase chain reaction (qRT-PCR) analysis] in mouse B cells stimulated with LPS or CD154 plus IL-4 for 0, 6, 12, 24, 48, or 72 hours. Data are ratios to the expression in unstimulated B cells (set as 1; means ± SEM of three bio-logical independent experiments, each consisting of triplicates, left panel). Also shown are the inverse correlation scatter plots of Sirt1 and Aicda expression levels (right). (C) SIRT1 and AICDA expression (qRT-PCR analysis) in human naïve B cells stimulated with CD154 plus IL-4 and IL-21 for 0, 6, 12, 24, 48, 72, or 96 hours. Data are ratio to the expression in unstimulated B cells (set as 1; means ± SEM of three biological independent experiments, each consisting of triplicates, left). Also shown are the inverse correlation scatter plots of SIRT1 and AICDA expression levels (right). (D) Sirt1 and Aicda transcript levels (qRT-PCR analysis) in mouse B cells stimulated with anti-Ig mAb or LPS plus IL-4 for 72 hours. Data are ratios to the expression in unstimulated B cells (set as 1; means ± SEM of three biological independent experiments, each consisting of triplicates). (E) Sirt1 and Aicda expression (qRT-PCR analysis) in spleen B cells from C57BL/6 mice immunized with nil or NP16-CGG and analyzed 10 days after immunization. Data are ratios to the expression in nonimmunized mice (set as 1; means ± SEM of three biological independent experiments, each consisting of triplicates). (F) Sirt1 and AID protein levels in CD19+IgDhiGL7−CD138− naïve B cells, CD19+IgD−GL7hiCD138− germinal center (GC) B cells, and CD19loCD138hi plasma cells/plasmablasts in C57BL/6 mice immunized with NP16-CGG, as analyzed by flow cytometry 10 days after immunization. (G to I) Sirt1 and AID protein levels in mouse B cells before (nil) and after stimulation with LPS plus IL-4 for 72 hours analyzed by flow cytometry (G), intracellular immunofluorescence (H), and immunoblotting (I). Densitometry quantification of immuno-blotting signals normalized to -actin levels and depicted as ratios of readings in LPS plus IL-4 stimulated B cells to those in unstimulated (0 hours) B cells (I, right). Data in (F) to (I) are one of two independent experiments yielding similar results. ***P < 0.001; ns, not significant, unpaired two-tailed Student’s t test. Scale bar, 5 m. DAPI, 4′,6-diamidino-2-phenylindole.
on June 1, 2020http://advances.sciencem
ag.org/D
ownloaded from
Gan et al., Sci. Adv. 2020; 6 : eaay2793 1 April 2020
S C I E N C E A D V A N C E S | R E S E A R C H A R T I C L E
4 of 17
Fig. 2. Sirt1 overexpression or activation dampens Aicda expression and CSR, while Sirt1 deletion further increases Aicda expression and CSR. (A) Ex vivo expression of Sirt1 and Aicda (qRT-PCR) in peripheral blood total B cells isolated from non-intentionally immunized Sirt1+/+ and Sirt1super mice. Data are ratios to expression in total B cells from Sirt1+/+ mice (set as 1; means ± SEM of values from three Sirt1+/+ mice and three Sirt1super mice). (B) Serum titers [enzyme-linked immunosorbent assay (ELISA)] of total IgM, IgG1, and IgA in non-intentionally immunized Sirt1+/+ and Sirt1super mice (means ± SD of six Sirt1+/+ mice and six Sirt1super mice). (C) Expression of Sirt1, Aicda, Prdm1, and Xbp1 transcripts (qRT-PCR) in Sirt1+/+ (set as 1) and Sirt1super B cells stimulated with LPS plus IL-4 for 72 hours (means ± SEM of three biological independent experiments, each consisting of triplicates; left) as well as immunoblotting and flow cytometry analysis of Sirt1 and AID protein levels in these cells (one of two independent experiments yielding similar results; right). (D and E) CSR (D) and plasma cell differentiation (E) in Sirt1+/+ and Sirt1super B cells (flow cytometry analysis) after stimulation with appropriate stimuli, as indicated, for 96 hours (left, one representative of three independent experiments; right, means ± SEM of three independent experiments). (F) CSR to IgG1 (flow cytometry analysis) in (B220+GFP+) B cells transduced by pMIG-GFP or pMIG-GFP-Sirt1 retrovirus (one of two independent experiments yielding similar results). (G to I) C57BL/6 B cells stimulated for 96 hours with LPS plus IL-4 in the presence of SRT1720 at indicated doses. Percentages of IgG1+ B cells and B220lowCD138+ plasma cells (G), cell proliferation [carboxyfluorescein diacetate succinimidyl ester (CFSE)–labeled cells] (H), and viability [7-aminoactinomycin D–negative (7-AAD−)] (I) (flow cytometry analysis). Data are means ± SEM of three independent experiments (G) or one representative of three independent experiments (H and I). (J) Aicda, Prdm1, and Xbp1 transcript levels (qRT-PCR analysis) in purified B cells treated with nil or SRT1720 at the indicated doses and stimulated for 72 hours with LPS plus IL-4. Data are ratios to the expression in B cells treated with nil (set as 1; means ± SEM of three biological independent experiments, each consisting of triplicates). (K) Sirt1 transcript levels (qRT-PCR analysis) in AicdacreSirt1+/+ and AicdacreSirt1fl/fl B cells stimulated with LPS plus IL-4 for 0 and 72 hours. Data are ratios to the expression in unstimulated (0 hours) AicdacreSirt1+/+ B cells (set as 1; ± SEM of three biological independent experiments, each consisting of triplicates). (L) CSR to different Ig isotypes (flow cytometry analysis) in AidcacreSirt1+/+ and AicdacreSirt1fl/fl B cells stimulated for 96 hours with appropriate stimuli, as indicated. Data are one representative (left) and means ± SEM (right) of three independent experiments. (M) Expression of indicated genes (qRT-PCR analysis) in AidcacreSirt1+/+ and AicdacreSirt1fl/fl B cells stimulated for 72 hours with LPS plus IL-4 or LPS plus TGF- and anti-Ig mAb-dextran (I-C and I-C). Data are ratios to the expression in AicdacreSirt1+/+ B cells (set as 1; means ± SEM of three bio-logical independent experiments, each consisting of triplicates). (N) AID protein levels in AicdacreSirt1+/+ and AicdacreSirt1fl/fl B cells stimulated with LPS plus IL-4 for 72 hours as analyzed by intracellular staining and flow cytometry. Data are from one of two independent experiments yielding similar results. (O) Plasma cell differentiation (flow cytometry analysis) in AidcacreSirt1+/+ and AicdacreSirt1fl/fl B cells stimulated for 96 hours with appropriate stimuli, as indicated. Data are one representative (left) and means ± SEM (right) of three biological independent experiments. (P) Proliferation of spleen B220+ B cells labeled with CFSE and stimulated with LPS plus IL-4 for 72 and 96 hours (top) and B cell viability (7-AAD−, bottom). Data are one representative of three independent experiments yielding similar results. *P < 0.05 and **P < 0.01, un-paired two-tailed Student’s t test.
on June 1, 2020http://advances.sciencem
ag.org/D
ownloaded from

Gan et al., Sci. Adv. 2020; 6 : eaay2793 1 April 2020
S C I E N C E A D V A N C E S | R E S E A R C H A R T I C L E
5 of 17
AicdacreSirt1fl/fl mice increase class-switched/hypermutated antibodies and memory B cellsAicdacreSirt1fl/fl mice injected with NP16-CGG, a conjugated hapten that preferentially induces T-dependent NP-specific IgG1 antibodies, mounted a significantly greater NP4-specific IgG1 response than their AicdacreSirt1+/+ littermates (Fig. 3, A and B). NP16-CGG–injected AicdacreSirt1fl/fl mice also showed increased antibody-forming cells (AFCs) secreting NP4-specific IgG1 in the spleen and bone marrow (Fig. 3, C and D). In these mice, gut IgA-producing cells were also increased in small intestine lamina propria, Peyer’s patches, and mesenteric lymph nodes (Fig. 3E). Consistent with the augmented NP4-specific IgG1 response, somatic mutations in rearranged V186.2 DJH-C1 transcripts [V186.2, ImMunoGeneTics information system (IMGT) gene name V1-72, encodes the IgH variable region of NP-binding antibodies) were increased by almost 100% in AicdacreSirt1fl/fl mice as compared to their AicdacreSirt1+/+ littermates (analysis of more than 10,000 Illumina MiSeq sequences) (Fig. 3F and fig. S3, A and B).
In AicdacreSirt1fl/fl mice injected with NP16-CGG, class-switched IgM−IgD−IgG1+ B cells were increased by almost 55% over their AicdacreSirt1+/+ littermates (Fig. 3G). Among these B cells, the proportion of specific NP5-binding B cells was almost twice that in AicdacreSirt1+/+ littermates (19.0% versus 9.9%). In AicdacreSirt1fl/fl mice, 73.5% of these NP5-binding IgG+ B cells were CD38+ memory B cells, compared to only 30.4% in AicdacreSirt1+/+ mice. In addition, AicdacreSirt1fl/fl mice displayed a more than 320% increase in total spleen NP5-binding IgG1+ B cells, of which the proportion of CD38+ memory B cells was more than 570% greater than in AicdacreSirt1+/+ littermates (Fig. 3H). By contrast, the proportion of the spleen and bone marrow CD138+ plasmablasts/plasma cells in AicdacreSirt1fl/fl mice was comparable to that in AicdacreSirt1+/+ mice (Fig. 3, I and J) and so were spleen size and number and size of Peyer’s patches. AicdacreSirt1fl/fl mice showed normal B cell viability and proliferation (Fig. 3, K and L). They also showed B (B220+) and T (CD3+) cell numbers (Fig. 3M), proportion of B220+GL7+CD95+ germinal center B cells, and germinal center structure comparable to those of Aicdacre Sirt1+/+ mice (Fig. 3, N to P). Thus, B cell–intrinsic Sirt1 deletion leads to increased antigen-specific, class-switched, and hypermutated B cell responses and memory B cell generation, without affecting B cell number, proliferation, survival, germinal center formation, or plasma cell differentiation.
Intrinsic B cell Sirt1 activation inhibits the class-switched/hypermutated antibody responseTo further address the direct B cell–intrinsic role of Sirt1 in modulating the antibody response, we developed the “NBSGW/B” mouse model by engrafting highly immunodeficient NBSGW (NOD.Cg-KitW-41J Tyr+Prkdcscid Il2rgtm1Wjl/ThomJ) mice, which lack T cells, B cells, natural killer (NK) cells, functional dendritic cells, and macrophages (28), with highly purified C57BL/6 mouse spleen B cells. We segre-gated 10 NBSGW/B mice into two groups, 5 mice each, and injected (intraperitoneally) 5 mice with SRT1720 and 5 mice with phosphate- buffered saline (PBS) once every 2 days. All 10 mice were injected intraperitoneally, immediately after engraftment with NP-LPS (to induce an NP-specific T-independent antibody response), and all produced NP4-binding IgM, IgG3, and IgG2b antibodies (fig. S4A). However, the NBSGW/B mice given SRT1720 showed reduced total and NP4-binding class-switched IgG3 and IgG2b and marginally increased unswitched IgM antibodies, without alteration in B cell viability and numbers (fig. S4B). This was concomitant with reduced
numbers of IgG3+ and IgG2b+ B cells and normal numbers of CD138+ plasmablasts/plasma cells (fig. S4C) and underpinned by reduced Aicda, but not Prdm1 expression, and decreased postrecombination I-C3 and I-C2b transcripts (fig. S4D). In NBSGW/B mice, Aicda down-regulation by SRT1720 also resulted in a reduced mutational load in V186.2DJH-C3 and V186.2DJH-C2b transcripts encoding the IgH chain of NP-binding IgG3 and IgG2b, as assessed by enu-merating point mutations in the V186.2 segment of three “comparable” V186.2DJH-C3 and three comparable V186.2DJH-C2b clone pairs, each pair consisting of sequences from one SRT1720-treated and one nontreated mouse. Comparable pairs were defined as B cell clones expressing V186.2DJH-C3 or V186.2DJH-C2b with IgH CDR3s being identical in length (7 to 12 amino acids), identical in the first two amino acids and the last three or four amino acids. One of the three V186.2DJH-C3 clone pairs was identical in the whole IgH CDR3 se-quence (ARGYFDY). The average change/base in transcripts from mice treated with nil versus mice treated with SRT1720 was 0.48 versus 0.35, 0.44 versus 0.30, and 0.48 versus 0.28 (V186.2DJH-C3) and 0.60 versus 0.35, 0.33 versus 0.19, and 0.33 versus 0.23 (V186.2DJH- C2b) (fig. S4E). Thus, activation of Sirt1 inhibits the maturation of a class-switched and hypermutated T-independent antibody response by down-regulating Aicda expression and dampening CSR/SHM, but not Prdm1 or plasma cell differentiation, in a B cell–intrinsic fashion, independent of T cells, dendritic cells, NK cells, or macrophages.
B cell Sirt1 reduction or ablation increases acetylation of histone and nonhistone (Dnmt1 and NF-B p65) proteinsIn resting B cells, which do not express AID but express abundant Sirt1 (Fig. 1), histone H3 is hypoacetylated across the Aicda locus (5). Only upon activation by LPS and IL-4, which induced profound Sirt1 down-regulation and Aicda promoter activation, was the Aicda locus histone H3 acetylation greatly increased (Fig. 4A), Sirt1 deacetyl-ates H3Ac, including H3K9 and H3K14, to shape heterochromatin (16). The lack of Sirt1 resulted in increased histone acetylation and gene expression, indicating that in B cells expressing AID, decreased Sirt1 expression enhanced Aicda histone acetylation and transition to euchromatin. Stimulation of B cells with LPS plus IL-4 increased Aicda promoter histone acetylation (H3K9Ac/K14Ac) and induced robust Aicda expression, with no change in H3K9Ac/K14Ac of Prdm1 or Xbp1 promoter (Fig. 4A). Increased Aicda promoter histone H3 acetylation reflected a reduced recruitment of Sirt1 to this region (Fig. 4B) and was not significantly increased in activated AicdacreSirt1fl/fl B cells stimulated with LPS plus IL-4 (fig. S5A), likely due to the phys-iologically extensive Aicda histone hyperacetylation in B cells induced to express AID and undergoing CSR (5). Thus, LPS plus IL-4–induced Sirt1 down-regulation limits Sirt1 recruitment to and deacetylation of the Aicda promoter, thereby increasing Aicda promoter histone acetylation, AID expression, and CSR.
In addition to histones, Sirt1 deacetylates nonhistone proteins. Sirt1 has been suggested to boost DNA methylation by enhancing Dnmt1 activity through Dnmt1 deacetylation (18). LPS plus IL-4–stimulated AicdacreSirt1fl/fl B cells increased acetylated (inactive) Dnmt1, as compared to AicdacreSirt1+/+ B cells, while total Dnmt1 protein levels were unchanged (Fig. 4C). Inactive Dnmt1 resulted in re-duced recruitment of this DNA methyltransferase to and reduced DNA methylation of the Aicda promoter [28 and 44% of deoxycytidine (dC) nu-cleotides within CpG motifs were methylated in LPS plus IL-4–stimulated AicdacreSirt1fl/fl and AicdacreSirt1+/+B cells, respectively, as shown by bisulfite sequencing of genomic DNA (gDNA)] (Fig. 4D),
on June 1, 2020http://advances.sciencem
ag.org/D
ownloaded from

Gan et al., Sci. Adv. 2020; 6 : eaay2793 1 April 2020
S C I E N C E A D V A N C E S | R E S E A R C H A R T I C L E
6 of 17
Fig. 3. Activated B cell–specific deletion of residual Sirt1 in AicdacreSirt1fl/fl mice augments the class-switched and hypermutated antibody response. (A and B) Serum titers of total IgM, IgG1, and IgA (A) and high-affinity NP4-binding IgG1 (B) (ELISA; RU, relative units) in AicdacreSirt1+/+ and AicdacreSirt1fl/fl mouse littermates immunized with NP16-CGG at days 0 and 21 at different time points, as indicated (n = 7 mice in each group). Dotted lines link paired littermates. (C and D) AFCs secreting IgM and IgG1 or NP4-binding IgG1 (ELISPOTs) in the spleen and bone marrow in AicdacreSirt1+/+ and AicdacreSirt1fl/fl mouse littermates euthanized 28 days after the first NP16-CGG injection. Data are one representative of three independent experiments yielding similar results (C) or means ± SEM of three independent experiments (D). (E) Fluorescence microscopy analysis of IgA-producing cells in different gut tissues, as indicated, in AicdacreSirt1+/+ and AicdacreSirt1fl/fl mouse littermates AicdacreSirt1fl/fl mice (one representative of three independent experiments yielding similar results). Scale bars, 50 m. (F) Overall frequency (change/base) and distribution (pie charts) of point mutations in the V186.2 region of V186.2DJH-C1 complementary DNA (cDNA; pooled data from two mouse pairs) in AicdacreSirt1+/+ and AicdacreSirt1fl/fl mice injected (intraperitoneally) with NP16-CGG at days 0 and 21 and euthanized at day 28. Also depicted by histograms are frequencies of mutations in the framework (FR) and complementarity-determining (CDR) regions (right). P values were calculated by 2 test. (G and H) Analysis of class-switched IgM−IgD−IgG+ B cells, NP5-binding IgG1+ B cells, and NP5-binding CD38+IgG1+ memory B cells (flow cytometry) in spleen (G) and quantification of these cells in the NP16-CGG immunized mice (H). (I) Flow cytometry analysis of B220lowCD138+ plasmablasts/plasma cells in the spleen and bone marrow. (J) Quantification of proportion of B220lowCD138+ plasmablasts/plasma cells among total spleen and bone marrow cells. (K) Viable (7-AAD−) B cells in the spleen (flow cytometry) of the immunized mice. (L and M) Flow cytometry analysis of prolif-erating (incorporating BrdU and BrdU+) B cells (L) and proportions of T (CD3+) cells and B (B220+) cells (M). (N) Spleen germinal center (B220+GL7+CD95+) B cells in AicdacreSirt1+/+ and AicdacreSirt1fl/fl mice as analyzed by flow cytometry 10 days after NP-CGG injection. (O) Quantification of the proportion and of B220+GL-7+CD95+ germinal center B cells among total spleen B cells, as analyzed by FACS (left), and total numbers of B220+GL-7+CD95+ germinal center B cells in each spleen (right). (P) Germinal center structure in the spleen (fluorescence microscopy). Data in (G), (I), (K) to (N), and (P) are one representative of three independent experiments yielding similar results. Scale bar, 100 m. (H), (J), and (O) are means ± SEM of three or four biological independent experiments. *P < 0.05, **P < 0.01, paired two-tailed Student’s t test.
on June 1, 2020http://advances.sciencem
ag.org/D
ownloaded from

Gan et al., Sci. Adv. 2020; 6 : eaay2793 1 April 2020
S C I E N C E A D V A N C E S | R E S E A R C H A R T I C L E
7 of 17
leading to increased Aicda expression. The methylation of Prdm1 promoter and the intronic regulatory region or Xbp1 promoter [as further shown by methylated DNA immunoprecipitation (MeDIP)–qPCR] in AicdacreSirt1fl/fl B cells were unchanged (Fig. 4, E and F, and fig. S5, B to D).
Another nonhistone protein deacetylated by Sirt1 is NF-B p65, as occurring in macrophages, epithelial cells, and liver cancer cells, in which Sirt1 deacetylates p65 to dampen NF-B activity (17). Given the important role of NF-B in Aicda induction, we hypoth-esized that deletion of Sirt1 in B cells would lead to increased NF-B p65 acetylation, resulting in enhanced NF-B activity, and there-fore, Aicda expression. Upon stimulation with LPS or CD154 plus IL-4, AicdacreSirt1fl/fl B cells significantly increased acetylated-p65 (p65-Ac) as compared to their AicdacreSirt1+/+ counterparts, con-comitant with unchanged total p65 protein levels (Fig. 4, G and H). In AicdacreSirt1fl/fl B cells, increased p65 acetylation resulted in in-creased recruitment of p65-Ac to the Aicda promoter, as shown by chromatin immunoprecipitation (ChIP) with anti–p65-Ac mAb (Fig. 4I); despite some increased recruitment of p65-Ac to the Prdm1 promoter in Aicdacre Sirt1fl/fl B cells, Prdm1 expression was not in-creased (Fig. 2M), likely reflecting this region’s unchanged H3K9/K14 acetylation (fig. S5A) and DNA methylation (Fig. 4, E and F), as well as the down-regulation of Irf4 in these B cells (fig. S6 and S7).
Thus, in resting B cells, in addition to being recruited to the Aicda promoter where it deacetylates histones, Sirt1 deacetylates and acti-vates Dnmt1, and deacetylates and inactivates NF-B p65, overall resulting in silencing Aicda expression. Upon B cell stimulation to undergo CSR, down-regulated Sirt1 is not available for recruitment to and deacetylation of Aicda histones nor is it available to deacetylate Dnmt1-Ac, thereby keeping it in an inactive state, or NF-B p65-Ac, thereby keeping it activated. This increased acetylation of Aicda promoter histones, decreased Dnmt1 recruitment to and methylation of the Aicda promoter DNA, and increased NF-B acetylation for an overall combined activation of Aicda expression.
B cell Sirt1 overexpression or activation deacetylates Aicda and NF-B p65 to dampen Aicda expressionIn Sirt1super B cells, impaired Aicda expression and CSR were associated with decreased Aicda promoter histone acetylation (H3K9Ac/K14Ac), as determined by ChIP assays of LPS and IL-4–stimulated Sirt1super B cells and WT counterparts, with no concomitant change in H3K9Ac/K14Ac of Prdm1 or Xbp1 promoters (Fig. 4J). In addition, in these stimulated Sirt1super B cells, NF-B p65 acetylation and p65-Ac recruit-ment to the Aicda promoter were greatly reduced (Fig. 4, K and L). Similarly, Aicda expression was reduced in WT B cells treated with the potent SRT1720 Sirt1 activator; failure of SRT1720 to alter Aicda expression in Sirt1-deficient AicdacreSirt1fl/fl B cells confirmed that this was mediated by Sirt1 (Fig. 4M). SRT1720-mediated reduction of Aicda expression and CSR in B cells was also associated with reduced histone H3K9Ac/K14Ac of the Aicda promoter, but not Prdm1 or Xbp1 promoter, as a result of an increased recruitment of Sirt1 to the Aicda promoter (Fig. 4, N and O). In addition, SRT1720-mediated Sirt1 activation also significantly reduced NF-B p65 acetylation and recruitment of p65-Ac to the Aicda promoter, but not to the Prdm1 or Xbp1 promoter, in LPS plus IL-4–stimulated B cells (Fig. 4, P and Q). Thus, overexpression or activation of B cell Sirt1 leads to reduced histone Aicda promoter histone and p65 protein acetyl-ation, resulting in decreased Sirt1 and NF-B recruitment to the Aicda promoter, decreased Aicda expression, and impaired CSR.
Glycolysis reduces cytosolic Sirt1 NAD+ cofactor to increase Aicda expression and CSRNAD+ is the critical Sirt1 cofactor, and NAD+ availability is a function of NAD+/NADH ratio, which is metabolically regulated by glycolysis (19). In the glucose metabolic pathway, glycolysis converts NAD+ to NADH, thereby lowering cytosolic NAD+/NADH ratio. To test that this leads to decreased Sirt1 activity and increased Aicda expression, we cultured B cells with LPS plus IL-4 in medium containing in-creasing doses of glucose (0 to 20 mM), yielding lower cytosolic NAD+/NADH ratios. This resulted in dose-dependent increased expression of Aicda and CSR, concomitant with normal expression of Prdm1 and plasma cell differentiation (Fig. 5A and fig. S8), and reduced Irf4 expression. While this would generally lead to decreased Prdm1 expression (29), it was counteracted by the potential Prdm1 up-regulation due to increased NF-B p65 acetylation (Fig. 5A and fig. S7), thereby resulting in an unchanged Prdm1 expression level. These increased Aicda expression and CSR were not due to increased carbon/energy provided by glucose, as shown by failure of the same concentrations of galactose (galactose shares the same molecular formula with glucose and serves as a cell energy source but does not effectively feed into glycolysis) to affect Aicda expression and CSR (Fig. 5B). By contrast, B cells cultured with increased amounts of Sirt1 cofactor NAD+ (0 to 500 M) or glucose analog 2-deoxyglucose (2-DG; 0.1 to 1.0 mM), a prototypical glycolytic pathway blocker that has been shown to increase intracellular NAD+ levels and Sirt1 activity (30), reduced Aicda expression and CSR in a dose-dependent manner, with no alteration of Prdm1 expression and plasma cell differentiation (Fig. 5, C and D, and fig. S8)—glucose, galactose, or NAD+ concentrations used in these experiments did not alter B cell viability (fig. S9).
To further define the role of Sirt1 in glucose-mediated up-regu-lation of Aicda expression and CSR, we stimulated AicdacreSirt1fl/fl and AicdacreSirt1+/+ B cells with LPS plus IL-4 and cultured them in RPMI medium containing no or increasing concentrations of glu-cose. In WT B cells, glucose-induced decreased NAD+/NADH ratio and Sirt1 activity resulted in reduced Sirt1 recruitment to the Aicda promoter, leading to increased promoter histone acetylation, increased acetylated (inactive) Dnmt1, reduced recruitment of Dnmt1 to the Aicda promoter, as defined by ChIP-qPCR, thereby limiting Aicda promoter DNA methylation, as defined by MeDIP-qPCR. This to-gether with increased p65-Ac (not total p65 level) and increased recruitment of p65-Ac to the Aicda promoter led to increased Aicda expression and CSR (Fig. 5, E to L). At the highest glucose concen-tration (20 mM), the enhancement of Aicda expression and CSR to IgG1 in AicdacreSirt1+/+ B cells was comparable to those observed in AicdacreSirt1fl/fl B cells (Fig. 5, M and N). Thus, B cell glycolysis, which results in reduced NAD+/NADH ratio, paucity of Sirt1 cofactor NAD+, or decreased Sirt1 activity, leads to increased Aicda expression and CSR, mimicking the increased Aicda expression and CSR resulting from ablation of Sirt1.
Sirt1 dampens the class-switched lupus autoantibody responseIn AicdacreSirt1fl/fl mice, deletion of Sirt1 in activated B cells led to production of class-switched anti-nuclear antigen autoantibodies (ANAs), including anti–double-stranded DNA (dsDNA), anti-histone, anti–ribonucleoprotein (RNP), and anti-RNA IgG (Fig. 6, A and B). In B cells isolated from female lupus MRL/Faslpr/lpr (12-week-old) and BXD2 (36-week-old) mice or patients with SLE, enhanced
on June 1, 2020http://advances.sciencem
ag.org/D
ownloaded from

Gan et al., Sci. Adv. 2020; 6 : eaay2793 1 April 2020
S C I E N C E A D V A N C E S | R E S E A R C H A R T I C L E
8 of 17
Fig. 4. B cell Sirt1 reduction or ablation enhances acetylation of Aicda promoter histones, Dnmt1, and NF-B p65, while overexpression or activation of B cell Sirt1 results in reduced acetylation of these proteins. (A and B) ChIP-qPCR analysis of acetylated H3K9/K14 in Aicda, Prdm1, and Xbp1 promoters (A) and Sirt1 recruit-ment to the Aicda promoter (B) of WT C57BL/6 B cells nonstimulated (Nil) or stimulated with LPS plus IL-4 for 72 hours. Data are ratios to nonstimulated B cells (set as 1; means ± SEM of three biological independent experiments, each consisting of triplicates). (C to I) AicdacreSirt1+/+ and AicdacreSirt1fl/fl B cells were stimulated with LPS plus IL-4 (C to I) or CD154 plus IL-4 (G to I) for 72 hours. (C) Acetylated Dnmt1 and total Dnmt1 (left, immunoblotting; one representative of three independent experiments yielding similar results) and densitometry quantification of signals normalized to -actin levels and depicted as ratios to signals in AicdacreSirt1+/+ B cells (set as 1; means ± SD of three independent experiments; right). (D) Recruitment of Dnmt1 to the Aicda promoter or a Prdm1 regulatory region (ChIP-qPCR). Data are ratios to recruitment in AicdacreSirt1fl/fl B cells to AicdacreSirt1+/+ B cells (set as 1; means ± SEM of three biological independent experiments, each consisting of triplicates). (E) CpG DNA methylation at the Aicda promoter and Prdm1 regulatory region, as assessed by bisulfite sequencing. Depicted is the proportion of methylated dC nucleotides within the CpG motifs (pooled data from two mice in each group, with at least 5000 sequences from each mouse; means ± SD). (F) DNA methylation of Aicda and Xbp1 promoters, as well as Prdm1 regulatory region (MeDIP-qPCR). Data are normalized to DNA used as input (means ± SEM of three biological independent experiments, each consisting of triplicates). (G and H) Immunoblotting analysis of acetylated NF-B p65 and total NF-B p65 (G) and densitometry quantification of signals normalized to -actin levels and depicted as ratios to signals in AicdacreSirt1+/+ B cells (set as 1; means ± SD of three independent experiments) (H). (I) Recruitment of acetylated NF-B p65 to Aicda promoter or Prdm1 regulatory region (ChIP-qPCR) in B cells. Data are ratios of recruitment in AicdacreSirt1fl/fl cells to that in AicdacreSirt1+/+ B cells (set as 1; means ± SEM of three biological independent experiments). (J to L) Sirt1+/+ and Sirt1super B cells were stimulated with LPS plus IL-4 for 72 hours. (J) Acetylated H3K9/K14 in the Aicda, Prdm1, or Xbp1 promoter (ChIP-qPCR). Data are ratios of determinations in Sirt1super B cells to those in Sirt1+/+ B cells (set as 1; means ± SEM of three biological independent experiments, each consisting of triplicates). (K) Acetylated NF-B p65 and total NF-B p65 (immunoblotting analysis; left) and densitometry quantification of signals normalized to -actin levels and depicted as the ratio to that in Sirt1+/+ B cells (set as 1; means ± SD of three independent experiments; right). (L) Recruitment of acetylated NF-B p65 to Aicda, Prdm1, and Xbp1 promoters (ChIP-qPCR analysis). Data are ratios to recruitment in Sirt1+/+ B cells (set as 1; means ± SEM of three biological independent experiments, each consisting of triplicates). (M) Aicda expression (qRT-PCR analysis) in AicdacreSirt1+/+ and AicdacreSirt1fl/fl B cells treated with nil or SRT1720 and stimulated with LPS plus IL-4 for 72 hours (means ± SEM of three biological independent experiments, each consisting of triplicates). (N to Q) WT C57BL/6 B cells were treated with nil or SRT1720 and stimulated with LPS plus IL-4 for 72 hours. (N and O) ChIP-qPCR analysis of Sirt1 recruitment to Aicda, Prdm1, and Xbp1 promoters (N) as well as acetylated H3K9/K14 of these regions (O). Data are ratios of readings in SRT1720-treated B cells to those in nil-treated B cells (set as 1; means ± SEM of three biological independent experiments, each consisting of triplicates). (P) Immunoblotting of acetylated NF-B p65 and total NF-B p65 in B cells; densitometry quantification of signals normalized to -actin levels and depicted as ratios of readings in SRT1720-treated B cells to those in nil-treated B cells (set as 1; means ± SD of three independent experiments). (Q) Recruitment of acetylated NF-B p65 to the Aicda, Prdm1, and Xbp1 promoters (ChIP-qPCR analysis). Data are ratios of readings in SRT1720-treated B cells to those in nil-treated B cells (set as 1; means ± SEM of three biological independent experiments, each consisting of triplicates). *P < 0.05, **P < 0.01, ***P < 0.001, paired two-tailed Student’s t test.
on June 1, 2020http://advances.sciencem
ag.org/D
ownloaded from

Gan et al., Sci. Adv. 2020; 6 : eaay2793 1 April 2020
S C I E N C E A D V A N C E S | R E S E A R C H A R T I C L E
9 of 17
Fig. 5. Increased glucose concentration reduces cytosolic NAD+, increases acetylation of Aicda promoter histones, Dnmt1 and NF-B p65, and enhances Aicda expression and CSR. B cells were cultured in glucose-free fetal bovine serum (FBS)–RPMI medium supplemented with increased concentrations of (A) glucose or (B) galac-tose or in complete FBS-RPMI-1640 medium supplemented with increased concentrations of (C) 2-DG or (D) NAD+ and stimulated with LPS plus IL-4. Surface expression of B220 and IgG1 was analyzed by flow cytometry after 96 hours of culture. Expression of Aicda, Prdm1, and Irf4 was analyzed by qRT-PCR after 72 hours of culture. NAD+ and NADH concentrations in B cells cultured with increased amount of glucose were also determined after 72 hours. Data are from one representative of three indepen-dent experiments yielding comparable results (left) or means ± SEM of three biological independent experiments, each consisting of triplicates (right). C57BL/6 (E to L) or AicdacreSirt1+/+ and AicdacreSirt1fl/fl (M and N) B cells were cultured in glucose-free FBS-RPMI medium supplied with indicated concentrations of glucose and stimulated with LPS plus IL-4 for 72 (E to M) or 96 hours (N). (E and F) ChIP-qPCR analysis of acetylated H3K9/K14 in Aicda, Prdm1, and Xbp1 promoters (E) and recruitment of Sirt1 to the Aicda promoter (F) in B cells cultured with 0 or 20 mM of glucose. Data are ratios to recruitment in nil-treated B cells (set as 1; means ± SEM of three biological inde-pendent experiments, each consisting of triplicates). (G) Densitometry quantification of immunoblotting signals of acetylated Dnmt1 and total Dnmt1 after normalization to -actin levels in B cells. Data are ratios of acetylated Dnmt1 and Dnmt1 in B cells cultured with increased concentrations of glucose to B cells cultured without glucose (set as 1; means ± SD of three independent experiments). (H) ChIP-qPCR analysis of recruitment of Dnmt1 to the Aicda promoter in B cells cultured in different concentrations of glucose, as indicated. Data are ratios of recruitment in B cells cultured with glucose to that in B cells cultured without glucose (set as 1; means ± SEM of three biological independent experiments, each consisting of triplicates). (I) MeDIP-qPCR analysis of DNA methylation in the Aicda promoter of B cells cultured in different concentrations of glucose, as indicated. Data are ratios of values in B cells cultured in glucose to those in B cells cultured without glucose (set as 1; means ± SEM of three biological inde-pendent experiments, each consisting of triplicates). (J and K) Immunoblotting analysis of acetylated NF-B p65 and total NF-B p65 in B cells cultured in different con-centrations of glucose, as indicated (J); densitometry quantification of signals expressed as ratios of signal in B cells cultured in glucose to that in B cells cultured without glucose (set as 1; means ± SD of three independent experiments) (K). (L) Recruitment of acetylated NF-B p65 to the Aicda promoter (ChIP-qPCR analysis) in induced B cells. Data are ratios of recruitment of acetylated NF-B p65 to Aicda promoter in B cells cultured with glucose to that in B cells cultured without glucose (set as 1; means ± SEM of three biological independent experiments). (M) qRT-PCR analysis of Aicda expression in AicdacreSirt1+/+ and AicdacreSirt1fl/fl B cells cultured in the different concentrations of glucose. Data are ratios of Aicda expression in AicdacreSirt1fl/fl B cells to that in AicdacreSirt1+/+ B cells (set as 1; means ± SEM of three biological independent experiments, each consisting of triplicates). (N) Flow cytometry analysis of CSR to IgG1 in AicdacreSirt1+/+ and AicdacreSirt1fl/fl B cells cultured in different concentrations of glucose. Data are ratios of IgG1+ AicdacreSirt1fl/fl B cells to AicdacreSirt1+/+ B cells (set as 1 in each glucose concentration; means ± SEM of three biological independent experiments). *P < 0.05, **P < 0.01, and ***P < 0.001, unpaired two-tailed Student’s t test.
on June 1, 2020http://advances.sciencem
ag.org/D
ownloaded from

Gan et al., Sci. Adv. 2020; 6 : eaay2793 1 April 2020
S C I E N C E A D V A N C E S | R E S E A R C H A R T I C L E
10 of 17
Aicda/AICDA expression was associated with significantly reduced Sirt1/SIRT1 expression, as compared to healthy female C57BL/ 6 mice or healthy humans, respectively (Fig. 6, C and D). Accordingly, Sirt1 protein was significantly decreased in MRL/Faslpr/lpr B cells, in which AID expression was elevated (Fig. 6G). Further, reduced Sirt1 expression was associated with hyperacetylated Aicda/AICDA promoter histone H3 in mouse and human lupus B cells (Fig. 6, E and F). Last, SRT1720 treatment reduced AID expression in MRL/Faslpr/lpr B cells and decreased anti-dsDNA and anti-histone IgG1 and IgG2a, but not IgM, as well as reduced IgG1/IgG2a kidney deposition and glomerular damage in MRL/Faslpr/lpr mice (Fig. 6, G to I). Thus, Sirt1 deletion in activated B cells leads to emergence of lupus autoantibodies in otherwise normal female C57BL/6 mice. In mouse and human lupus B cells, high levels of Aicda/AICDA expression occur concomitantly with decreased Sirt1/SIRT1 ex-pression, in association with increased Aicda promoter histone acetylation. In addition, Sirt1 activation by SRT1720 reduces AID expression, autoantibody production, and autoimmunity in lupus MRL/Faslpr/lpr mice.
DISCUSSIONBy introducing single-strand nicks and double-strand breaks in the Ig locus DNA, AID affects the first and critical step in the cascade of events that lead to B cell CSR/SHM. Being a potent mutator, AID is under tight regulation. Its expression is cell type specific, being con-fined to B lymphocytes, and B cell differentiation is stage specific, being limited to activated B cells stimulated to undergo CSR/SHM (2–4). AID is not expressed in naïve resting B cells, resting memory B cells, or plasma cells. Its targeting is also specific, being restricted to the Ig locus. However, under nonphysiological conditions, AID can target DNA outside the Ig locus (AID off-targeting) and, as a potent mutator, can cause genome instability in lymphoid and nonlymphoid cells, thereby promoting neoplastic transformation (4, 31). Genomic damage by AID off-targeting has been well docu-mented, emphasizing the need for tight regulation of AID expres-sion to maintain genomic integrity (31). The mechanisms targeting AID to the Ig locus, including DNA hotspots and epigenetic marks, such as histone acetylation and phosphorylation, are relatively un-derstood. However, what keeps AID expression in check in resting B cells and limits it to B cells activated to undergo CSR/SHM has remained unaddressed.
Here, we provide evidence that Sirt1 is central to a B cell–intrinsic mechanism that, together with transcription factors and other epi-genetic modulators, regulates AID expression for CSR/SHM in the maturation of the antibody response. Sirt1-mediated regulation of AID is B cell differentiation stage specific, as shown by high levels of Sirt1 in human and mouse resting B cells and Sirt1 down-regulation by stimuli that induce Aicda expression and CSR/SHM. The B cell–intrinsic function of Sirt1 in the regulation of these processes was addressed in vitro in experiments using purified mouse and human naïve B cells and was extended to in vivo analysis of class-switched and hypermutated T-dependent and T-independent antibody re-sponses in AicdacreSirt1fl/fl mice and NBSGW/B mice. The specificity of such a B cell Sirt1 function was underlined by Sirt1 regulation of Aicda but not Prdm1 or Xbp1, thereby affecting CSR/SHM but not plasma cell differentiation. The importance of B cell–intrinsic and differentiation stage–specific Sirt1 expression was further empha-sized by the fast kinetics of Sirt1 down-regulation that preceded
AID up-regulation, as well as the compelling phenotypes generated upon manipulation of B cell Sirt1 expression or activity. Sirt1 would keep Aicda expression in check in resting B cells and allows Aicda to be expressed only to initiate CSR/SHM. By negatively regulating Aicda expression, Sirt1 would function as a key safeguard of AID- mediated DNA damage.
Sirt1 has been implicated in the functions of other immune ele-ments. Through deacetylation of histone and nonhistone proteins, Sirt1 controls the intracellular localization, stability, and activity of these proteins, making this class III HDAC involved in multiple, mainly epigenetic, functions (16). In addition to deacetylating gene promoter histones, Sirt1 modifies other epigenetic mediators, including DNA methyltransferases, acetyltransferases, and transcription fac-tors. Sirt1 has been shown to be highly expressed in medullary thymic epithelial cells, in which it is required for the expression of Aire- dependent, tissue-restricted antigen-encoding genes and, therefore, induction of central immunological T cell tolerance (32). Sirt1 negatively regulates T cell activation and would play a role in main-taining T cell tolerance and T cell–dependent humoral immune responses (13). It can also function as a molecular switch in controlling regulatory T cell (Treg) and T helper cell 17 (TH17) cell differentiation (33). Stimulation of naïve T cells with IL-4 plus TGF-1 decreased Sirt1 expression and induced TH9 cell differentiation (34). In humans, SIRT1 is a regulator of resting CD8+ memory T cell metabolism and activity, and it is significantly down-regulated in terminally differentiated CD8+CD28− memory T cells (35). Also, Sirt1 has been suggested to modulate cytokine production by dendritic cells and skewing the balance between proinflammatory TH1/TH17 cells and anti-inflammatory Treg cells (14, 36). Last, Sirt1 inhibits inflammatory pathways in macrophages and regulates macrophage self-renewal (37).
Sirt1 keeps Aicda transcription in check by a three-pronged mech-anism (fig. S10) involving (i) deacetylation of Aicda promoter histones, (ii) deacetylation of Dnmt1, and (iii) deacetylation of the p65 component of NF-B. First, Sirt1 plays a major (negative) regulatory role in Aicda locus H3 acetylation. Deacetylation of core histones promotes chromatin condensation, making promoters inaccessible to transcription factors and suppressing gene expression. Sirt deacetylates H3K9Ac and H3K14Ac (as shown here), as well as H3K4Ac and H3K36Ac (38). Accordingly, in B cells stimulated with LPS plus IL-4, H3K9Ac and H3K14Ac were hyperacetylated, reflecting Sirt1 down-regulation and, consequently, the loss of Sirt1-mediated deacetylation at these H3 Lys residues. By contrast, Sirt1 did not affect Prdm1 locus H3 acetylation, which occurred mainly at H3K27 [our analysis of primary ChIP-Seq data GEO:GSE82144 deposited in the National Center for Biotechnology Information (39)]. In nucleosomes, this H3K27 is not targeted nor is deacetylated by Sirt1 (40). Last, while histone acetylation of the Aicda promoter was increased in C57BL/6 B cells induced to undergo CSR and decreased by enforced Sirt1 expression or Sirt1 activation, the histone acetylation status of the Aicda promoter in AicdacreSirt1fl/fl B cells was unaltered, as compared to AicdacreSirt1+/+ B cells under similar CSR induction. Likely, the deep down-regulation of Sirt1 expression in B cells undergoing CSR led to Aicda promoter histone hyperacetylation, which left virtually no room for further histone acetylation upon Sirt1 ablation. All nucleosomes of Aicda exon 1 and its vicinity, including the promoter region, have been shown to be extensively acetylated in B cells induced to express Aicda and undergoing CSR (5).
Second, upon Sirt1-mediated acetylation, activated Dnmt1 was recruited to and methylated Aicda promoter DNA, thereby silencing
on June 1, 2020http://advances.sciencem
ag.org/D
ownloaded from

Gan et al., Sci. Adv. 2020; 6 : eaay2793 1 April 2020
S C I E N C E A D V A N C E S | R E S E A R C H A R T I C L E
11 of 17
this gene. The Dnmt1 selectivity in being recruited to and methylat-ing the Aicda promoter DNA contrasted with the failure of this DNA methyltransferase to be recruited and methylate Prdm1 or Xbp1 promoter DNA. This is consistent with the Prdm1 promoter showing constitutively demethylated CpG islands and, therefore, being hardly further acetylated through modulation of DNA demethylation (not shown). This would not exclude the possibility, however, that Prdm1 DNA methylation can also be mediated by additional DNA methyltransferases, such as Dnmt3a and Dnmt3b (41).
Third, deacetylation of NF-B effectively inactivates this important B cell transcription factor. NF-B together with HoxC4 is critical to Aicda promoter activation (6, 7). NF-B function is modulated by posttranscriptional modifications, such as phosphorylation, acetyla-tion, and methylation (42). Acetylated NF-B displays enhanced transcriptional activity (43), which is reduced by Sirt1-mediated deacetylation (17). The critical role of Sirt1 in modulating NF-B acetylation and, therefore, activity was further emphasized by the reduced p65 acetylation and Aicda expression by Sirt1 overexpres-sion in Sirt1super B cells and boost of Sirt1 activation by NAD+ or
Fig. 6. Sirt1 dampens the lupus autoantibody response. (A) IgG1+ and IgG2a+ ANAs in sera from 35-week-old female AicdacreSirt1+/+ and AicdacreSirt1fl/fl mice (immuno-fluorescence microscopy of one representative of three independent experiments). Scale bar, 50 m. (B) Anti-dsDNA, anti-histone, anti-RNP, and anti-RNA IgG titers (ELISAs) in sera from 35-week-old female AicdacreSirt1+/+ and AicdacreSirt1fl/fl mice (means ± SD of six AicdacreSirt1+/+ and six AicdacreSirt1fl/fl mice, each tested in triplicates). (C) Expression of Sirt1 and Aicda (qRT-PCR analysis) in spleen B cells from C57BL/6 mice and lupus-prone MRL/Faslpr/lpr and BXD2 mice. Data are relative expression to -Actin (means ± SD of three mice in each group). Dotted lines depict trends. (D) qRT-PCR analysis of expression of SIRT1 and AICDA in B cells from healthy humans and patients with SLE. Data are normalized to expression of -ACTIN (means ± SD of three healthy individuals and three patients with SLE). Dotted lines depict trends. (E) Acetylated H3K9/K14 in the Aicda, Prdm1, and Xbp1 promoters (ChIP-qPCR analysis) in B cells from C57BL/6 and MRL/Faslpr/lpr mice. Data are ratios of acetylated H3K9/K14 in MRL/Faslpr/lpr mice to that in C57BL/6 mice (set as 1; means ± SD of three mice in each group). (F) Acetylated H3K9/K14 in the AICDA and PRDM1 promoters in B cells from healthy human individuals (HS) and patients with SLE (ChIP-qPCR analysis). Data are ratios of acetylated H3K9/K14 in the AICDA and PRDM1 promoters of B cells from patients with SLE to that of healthy individuals (set as 1; means ± SD of three healthy individuals and three patients with SLE). (G) Intracellular staining of Sirt1 and AID protein levels in spleen B cells from age-matched female C57BL/6 mice, untreated MRL/Faslpr/lpr mice, and MRL/Faslpr/lpr mice treated with SRT1720 (flow cytometry anal-ysis, one representative of three independent experiments). (H) Serum anti-dsDNA and anti-histone IgM, IgG1, and IgG2a titers (ELISAs) in female MRL/Faslpr/lpr mice treated with Nil or SRT1720 (means ± SD of six mice in each group). (I) Photomicrographs of kidney sections from MRL/Faslpr/lpr mice treated with Nil or SRT1720, after hematoxylin and eosin (H&E) staining (left) or fluorescence staining of mouse IgG1/IgG2a (right). One representative of three independent experiments yielding similar results. Scale bars, 100 m. *P < 0.05, **P < 0.01, unpaired two-tailed Student’s t test.
on June 1, 2020http://advances.sciencem
ag.org/D
ownloaded from

Gan et al., Sci. Adv. 2020; 6 : eaay2793 1 April 2020
S C I E N C E A D V A N C E S | R E S E A R C H A R T I C L E
12 of 17
SRT1720. The increased p65Ac recruitment to the Prdm1 promoter in AicdacreSirt1fl/fl B cells was likely insufficient to up-regulate the induction of Prdm1 in light of the marginal role of Sirt1 in Prdm1 promoter H3 deacetylation, as well as the acetylation and activation of Dnmt3l (due to decreased Sirt1 activity) and the consequent Irf4 DNA methylation and down-regulation by this DNA methylase (fig. S7).
In B cells stimulated in a T-dependent or T-independent fashion, the significant drop in Sirt1 led to decreased Sirt1 recruitment to the Aicda promoter, but not Prdm1 or Xbp1 promoter, and reduced Aicda deacetylation. This together with greater acetylation of NF-B p65 promoted Aicda expression and CSR in B cells in vitro, as further facilitated by reduced Aicda promoter DNA methylation resulting from acetylation and inactivation of Dnmt1, which failed to be recruited to the Aicda promoter. These events were magnified by differentiation stage–specific Sirt1 ablation in AicdacreSirt1fl/fl B cells, which further increased Aicda expression, but did not affect Prdm1 or Xbp1. In AicdacreSirt1fl/fl mice, the same events boosted B cell Aicda expression and the generation of class-switched and somatically mutated antibody response, which included increased specific switched memory B cells but not plasma cells. Non-intentionally immunized AicdacreSirt1fl/fl mice produced a spectrum of lupus-like autoanti-bodies, pointing at a role of intrinsic B cell mechanisms in the devel-opment of the lupus-like autoimmune condition in constitutive Sirt1 knockout mice (15). A role of Sirt1 in regulating Aicda expression and the autoantibody response was further supported by our demon-stration of correlation between down-regulated SIRT/Sirt1 and up-regulated AICDA/Aicda in human and mouse lupus B cells. Such a role would be consistent with the suggestion that SIRT1 rs375891 allele modifies lupus morbidity, with rs375891T being a risk factor for nephritis (44), and the reduced expression levels of SIRT1/Sirt1 in lupus B cells, in which AID is known to be greatly up-regulated.
The definition of the mechanism by which Sirt1 is down-regulated in B cells induced to undergo CSR/SHM is beyond the scope of these investigations. Nevertheless, it is known that Sirt1 expression is regulated at both transcriptional and posttranscriptional levels (45). Interferon- (IFN-) has been shown to repress Sirt1 transcrip-tion (46). IFN- induces transcription factor Class II Major Histo-compatibility Complex Transactivator (CIITA), which is recruited to the Sirt1 promoter by a transcriptional repressor hypermethylated in cancer 1 (46). Once recruited to Sirt1, CIITA represses Sirt1 transcrip-tion, via active deacetylation of core histones surrounding the Sirt1 proximal promoter (46). At the posttranscriptional level, Sirt1 can be regulated by microRNAs or RNA-binding proteins (45). More than 16 microRNAs have been shown to modulate Sirt1 expression in different types of cells. These include miR-22, which is expressed in B cells and has been shown to be up-regulated by CD154 plus IL-4 in chronic lymphocytic leukemia B cells (45). In dendritic cells, miR-22 can be induced by TLR ligands such as LPS through NF-B (47). Thus, CIITA and select microRNAs, such as miR-22, may play a role in mediating Sirt1 down-regulation in B cells, as induced to undergo CSR/SHM.
Sirtuins have emerged as important metabolic sensors of energy status in mammalian cells (23–25). Sirt1 activity is directly modulated by the cellular level of its critical cofactor NAD+, whose concentration increases in response to energy or nutrient stresses such as fasting or calorie restriction (23–25). All these conditions boost Sirt1 activity (19), leading to histone deacetylation and chromatin silencing. Conversely, glycolysis, as induced by high blood sugar levels, converts
cellular NAD+ to NADH, decreasing NAD+/NADH ratio and NAD+ availability, which blunts Sirt1 activity (24, 25). Accordingly, in-creased glucose concentration led to up-regulation of Aicda and CSR. Like intrinsic B cell overexpression of Sirt1, boosting Sirt1 function by NAD+ or the small-molecule SRT1720, a specific and potent Sirt1 activator, dampened Aicda expression and CSR/SHM in the T-independent IgG response to NP-LPS in our NSGW/B mice. This novel and powerful model has unveiled a significant B cell SHM activity in the absence of T cells or other immune cells. This SHM was likely induced by our previously described mechanism of BCR and TLR4-linked co-engagement (48).
Activation of Sirt1 by SRT1720 dampened the autoantibody response in lupus MRL/Faslpr/lpr mice. In these mice, not only did SRT1720-mediated Sirt1 activation suppress the autoantibody response but it also led to a marked amelioration of lupus immuno-pathology. The decreased SIRT1/Sirt1 expression shown here in human and mouse lupus B cells would provide an explanation for the hyperacetylation of the AICDA/Aicda promoter in human and mouse lupus (3, 4), as confirmed by our findings in those B cells. Our demonstration of a regulation of AID expression through Sirt1 metabolic sensor would outline a possible mechanism by which the diabetes therapeutic metformin (inhibitor of gluconeogenesis) and 2-DG (a glucose analog, which competitively inhibits glucose uptake and glycolytic flux) dampened anti-dsDNA IgG and ANA IgG in lupus B6.Sle1.Sle2.Sle3 mice (49).
Sirt1 expression has been shown to fluctuate under physiological and pathological conditions (25). Collectively, our findings identified Sirt1 as a critical B cell–intrinsic epigenetic element in AID silenc-ing in resting B cells in regulating this potent dC deaminator, and, therefore, CSR/SHM in the maturation of the antibody response. Sirt1 suppresses Aicda expression and CSR/SHM through deacetylation of both histone and nonhistone proteins, that is, deacetylation of Aicda promoter histones, NF-B p65 and Dnmt1. In both human and mouse B cells, SIRT1/Sirt1 is down-regulated in response to stimuli that induced expression of AID and CSR/SHM, as it is in B cells from humans and mice with lupus. By showing that B cell Sirt1 inactivation by reduction of NAD+ can be an inducer of AID expression, our findings add an important effector function to Sirt1 as a metabolic sensor and suggest a role of glycolysis in the regula-tion of AID.
MATERIALS AND METHODSMice, immunization, and drug treatmentC57BL/6 (C57BL/6J, stock no. 000664), MRL/Faslpr/lpr (MRL/MpJ-Faslpr/J, 000485), BXD2 (BXD2/TyJ, 000075), Sirt1fl/fl (B6.129-Sirt1tm3Fwa/DsinJ, 029603), Aicdacre [B6;FVB-Tg(Aicda-cre)1Rcas/J, 018422], Sirt1super [B6.Cg-Tg(Sirt1)ASrn/J, 024510], and NBSGW (NOD.Cg-KitW-41J Tyr + Prkdcscid Il2rgtm1Wjl/ThomJ, 026622) mice were from The Jackson Laboratory (Bar Harbor, Maine). Sirt1fl/fl mice carry inser-tion mutations in the neomycin-resistant gene and lox sequences of the Sirt1 gene flanking exon 4 that encodes a conserved Sir2 motif (27). Sirt1super mice display abnormally increased Sirt1 expression, as a result of carrying multiple copies of a BAC transgene contain-ing the Sirt1 locus with the endogenous promoter/enhancer regions (26). In BAC transgenic Aicdacre mice, the bacterial cre recombinase gene was introduced in lieu of Aicda exon 1 in a supplementary Aicda locus and under control of the Aicda promoter/enhancers within the BAC transgene (5). We generated AicdacreSirt1fl/fl mice
on June 1, 2020http://advances.sciencem
ag.org/D
ownloaded from

Gan et al., Sci. Adv. 2020; 6 : eaay2793 1 April 2020
S C I E N C E A D V A N C E S | R E S E A R C H A R T I C L E
13 of 17
by cross-breeding Aicdacre with Sirt1fl/fl mice (fig. S3). For NP-CGG immunization, AicdacreSirt1fl/fl mice and their sex-matched AicdacreSirt1+/+ littermates (8 to 12 weeks of age) were injected intraperitoneally with 100 g of NP16-CGG (average 16 molecules of 4-hydroxy-3-nitrophenyl acetyl coupled with 1 molecule of chicken -globulin; Biosearch Technologies) in 100 l of alum (Imject Alum, Pierce). Mice were given a “booster” intraperitoneal injection of 100 g of NP16-CGG in PBS at day 21. Serum samples were collected, and mice were euthanized for ex vivo analysis at time points indicated.
To generate NBSGW/B mice, naïve B cells were purified from spleno-cytes of 8-week-old female C57BL/6 mice by negative selection using the EasySep Mouse B Cell Isolation Kit (STEMCELL Technologies) following the manufacturer’s instructions and supplemented with additional anti-CD3 mAb (clone 17A2; BioLegend), resulting in more than 99% purity. Purified B cells (3.0 × 10⁷ cells per mouse in 250 l of PBS) were injected intravenously through lateral tail veins into 8-week-old female NBSGW mice. NBSGW/B mice were injected intraperitoneally with NP0.5-LPS (average 0.5 molecule of NP con-jugated to 1 molecule of LPS; 50 g in PBS) at days 0 (after B cell engraftment), 2, 4, and 6. For in vivo Sirt1 activation, NP-LPS–immunized NBSGW/B mice were injected intraperitoneally with SRT1720 (0.3 mg in 200 l of PBS) or PBS every other day, starting at day 0 and until the end of the experiment. Mice were euthanized 7 days after the last NP-LPS injection. All mice were housed under pathogen-free conditions and were fed autoclaved food and deionized water. The Institutional Animal Care and Use Committee of the University of Texas Health Science Center San Antonio (UTHSCSA) approved all animal protocols.
Human B cells and in vitro CSR inductionFor in vitro CSR induction, human IgD+ naïve B cells were purified by negative selection from peripheral blood mononuclear cells (PBMCs) of healthy donor’s fresh buffy coats (San Antonio Blood and Tissue Center) using the EasySep Human Naïve B Cell Enrichment Kit (19254, STEMCELL Technologies) following the manufacturer’s directions, resulting in more than 98% purity. Naïve B cells were stimulated with CD154 (5 U/ml; obtained from membrane fragments of baculovirus-infected Sf21 insect cells) and cultured in fetal bovine serum (FBS)–RPMI (RPMI-1640 supplemented with 10% FBS, 50 mM -mercaptoethanol, and antibiotic-antimycotic mixture) and recombinant human IL-21 (50 ng/ml; R&D Systems) in the presence or absence of recombinant human IL-4 (20 ng/ml; R&D Systems) for up to 120 hours. B cells were then stained with 7-aminoactinomycin D (7-AAD; BD Biosciences) and fluorochrome-conjugated mAbs specific for human CD19 (clone HIB19; BioLegend) and human IgG (clone G18-125; BD Biosciences) and then analyzed by flow cytometry using an LSR-II flow cytometer (BD Biosciences). Dead cells (7-AAD+) were excluded from analysis. All flow cytometry data were analyzed using FlowJo (Tree Star).
For SIRT1 and AICDA qRT-PCR analysis and histone acetylation ChIP assays, B cells were purified by positive selection from PBMCs of healthy donor’s fresh buffy coats (San Antonio Blood and Tissue Center) or peripheral blood from patients with SLE (Division of Rheumatology, Department of Medicine, Long School of Medicine, UTHSCSA) using mouse biotin–anti-human CD19 mAb (clone HIB19; BioLegend) and streptavidin-coupled magnetic beads, resulting in more than 99% purity. All experiments involving human blood were approved by the Institutional Review Board of UTHSCSA.
Mouse B cells and in vitro CSR inductionFor in vitro CSR induction, naïve B cells isolated from red blood cell–depleted splenocytes of 8- to 12-week-old mice were purified by negative selection of cells expressing CD43, CD4, CD8, CD11b, CD49b, CD90.2, Gr-1, or Ter-119 using the EasySep Mouse B Cell Isolation Kit (STEMCELL Technologies). B cells were resuspended in FBS-RPMI at 37°C in 48-well plates and stimulated with the fol-lowing reagents: LPS (1 or 5 g/ml) from Escherichia coli (055:B5, Sigma-Aldrich) for CSR to IgG3; LPS (3 g/ml) or CD154 (1 U/ml) plus IL-4 (5 ng/ml; R&D Systems) for CSR to IgG1; LPS (3 g/ml) plus IFN- (50 ng/ml) for CSR to IgG2a; LPS (3 g/ml) plus TGF- (2 ng/ml; R&D Systems), IL-4 (5 ng/ml), IL-5 (3 ng/ml; R&D Systems), and anti-Ig mAb-dextran (Fina Biosolutions) for CSR to IgA. After 96 hours, cells were analyzed for surface Ig after being stained with fluorescein isothiocyanate (FITC)–labeled rat mAb to mouse IgG1 (clone A85-1), mouse IgG2a (clone R19-15), mouse IgG3 (clone R40-82), and mouse IgA (clone C10-3) or phycoerythrin (PE)–labeled rat mAb to mouse B220 (clone RA3-6B2), all from BD Biosciences. Cells were analyzed by flow cytometry, with dead cells (7-AAD+) excluded from analysis. All flow cytometry data were analyzed using FlowJo (Tree Star). All the Abs and mAbs used in the above experiments are listed in table S1A. For Sirt1 and Aicda qRT-PCR analysis and histone acetylation ChIP assays, B cells were isolated from C57BL/6 or lupus-prone MRL/Faslpr/lpr and BXD2 mice by positive selection using biotinylated rat anti-mouse CD19 mAb (clone 6D5; BioLegend) and streptavidin-coupled magnetic beads, resulting in more than 99% purity.
Flow cytometry of B and T cells, B cell division, surface, and intracellular florescence stainingSingle-cell suspensions were prepared from mouse spleen and stained with the following antibodies and reagents in different combinations for flow cytometry analysis (LSR-II flow cytometer, BD Biosciences) of B cells (B220+), T cells (CD3+), germinal center (GL-7hiB220+) B cells and plasma cells (B220lowCD138+), antigen-specific B cells, and class-switched B cells: PE–anti-B220 mAb (clone RA3-6B2; eBioscience), Pacific Blue anti-B220 mAb (clone RA3-6B2; BioLegend), FITC–anti-CD3 mAb (clone 17A2; BioLegend), and biotin–anti-CD138 mAb (clone 281-2; BD Biosciences) followed by FITC-streptavidin (11-4317-87, eBioscience) or PE-streptavidin (12-4317-87, eBioscience), PE-Cy7-anti-CD38 mAB (clone 90; BioLegend), PE– or FITC– anti-IgM mAb (clone RMM-1; BioLegend), FITC–anti-IgG1 mAb (clone A85-1; BD Biosciences), allophycocyanin (APC)–anti-IgG1 mAb (clone X56; BD Biosciences), FITC–anti-IgG3 mAb (clone R40-82; BD Biosciences), FITC–anti-IgA mAb (clone C10-3; BD Biosciences), and biotin–anti-IgD mAb (clone IA6-2; BioLegend) followed by FITC-streptavidin (11-4317-87, eBioscience) or APC- streptavidin (550874, eBioscience), PE-NP4 (N-5070, Biosearch Technologies), and 7-AAD, as all previously described (6, 11).
B cell division in vitro was analyzed by carboxyfluorescein diace-tate succinimidyl ester (CFSE) dilution using the CellTrace CFSE Cell Proliferation Kit (Invitrogen). Briefly, B cells were incubated for 5 min at 37°C in 3 ml of PBS with 2.5 M CFSE at a density of 1 × 10⁷ cells/ml and then washed in FBS-RPMI. Cells were then cultured in the presence of LPS or CD154 plus IL-4 for 3 days and then stained with PE–anti-B220 mAb and 7-AAD for flow cytome-try analysis. For intracellular staining, cells were reacted with an anti- CD19 mAb (clone 1D3; Tonbo) and fixable viability dye eFluor 450 (FVD 450, eBiosciences), followed by incubation with the BD
on June 1, 2020http://advances.sciencem
ag.org/D
ownloaded from

Gan et al., Sci. Adv. 2020; 6 : eaay2793 1 April 2020
S C I E N C E A D V A N C E S | R E S E A R C H A R T I C L E
14 of 17
Cytofix/Cytoperm buffer at 4°C for 20 min. After washing twice with the BD Perm/Wash buffer, cells were resuspended in Hanks’ balanced salt solution with 1% bovine serum albumin (BSA) and stored over-night at 4°C. Cells were then stained with anti-Sirt1 Ab (A11267, ABclonal; labeled with APC using Mix-n-Stain Fluorescent Protein & Tandem Dye Antibody Labeling Kit, Biotium) and FITC–anti-AID Ab (bs-7855R-FITC, Bioss) in Perm/Wash buffer. Dead (eFluor 450+) cells were excluded. All the Abs and mAbs used in the above experi-ments are listed in table S1A.
Fluorescence microscopyTo visualize Sirt1 and AID expression in B cells, cells were spun onto glass slides (800 rpm for 5 min; Cytospin 4, Thermo Fisher Scientific) and then fixed with 3% paraformaldehyde in 250 mM Hepes (pH 7.4), stained with APC-labeled anti-Sirt1 Ab (as above) or Alexa Fluor 647–anti-AID Ab (bs-7855R-A647, Bioss), and mounted in ProLong Gold Antifade Reagent with DAPI (4′,6-diamidino- 2-phenylindole; Invitrogen). Fluorescent images were captured using a 10× objective lens with a Zeiss Axio Imager Z1 fluorescence microscope.
To analyze IgM- and IgA-producing cells, intestinal sections were heated at 80°C to adhere to glass slides, washed four times in xylene for 2 min, dehydrated twice with 100% ethanol for 1 min, twice with 95% ethanol for 1 min, and washed twice in water for 1 min. Antigens were unmasked using 2 mM EDTA in 100°C for 40 min followed by a cooling step at 25°C, washed three times with tris-buffered saline (TBS), and blocked using 10% BSA for 15 min. Slides were again washed three times with TBS and stained with rabbit anti-IgA Ab (PA-1-30826, Thermo Fisher Scientific) followed by Alexa Fluor 488–conjugated anti-rabbit IgG (H+L) Ab F(ab′)2 fragment (4414, Cell Signaling Technology) and PE-conjugated goat-anti mouse-IgM mAb (clone RMM-1; BioLegend) for 2 hours in a moist dark chamber. After washing three times with Triton X-100 (0.1%) in TBS, slides were air-dried, and coverslips were mounted with ProLong Gold Antifade Reagent using DAPI (Invitrogen). To analyze germinal center structure, 10-m spleen sections were prepared by cryostat and loaded onto positively charged slides, fixed in cold acetone and stained with PE-GL7 and FITC-B220 mAb for 1 hour at 25°C in a moist chamber. Coverslips were mounted using ProLong Gold Antifade Reagent with DAPI for microscopy analysis. All the Abs and mAbs used in the above experiments are listed in table S1A.
Antibody and autoantibody analysisTiters of total and NP4-binding IgM, IgG1, IgG3, IgG2b, and IgA were measured by enzyme-linked immunosorbent assay (ELISA), as described (6, 11). Anti-dsDNA, anti-histone, anti-RNP, and anti- RNA IgG1 and IgG2a titers were measured by ELISA, as described (11)—titers were expressed in relative units (RU), defined as the dilution factor needed to reach 50% of binding saturation, as calcu-lated using the Prism software (GraphPad). To detect ANAs, sera were serially diluted in PBS (from 1:20 to 1:400), incubated on ANA substrate slides (HEp-2 cell–coated slides, MBL-BION), and detected with FITC–anti-IgG1 mAb (clone 85-1; BD Biosciences) and FITC–anti-IgG2a mAb (clone R19-15; BD Biosciences). Images were acquired with a 40× objective on a Zeiss Axio Imager Z1 fluorescence microscope. To analyze kidney IgG deposition, kidneys from MRL/Faslpr/lpr mice were fixed in 4% formaldehyde and paraffin-embedded for hematoxylin and eosin staining. For immunofluorescence, 5-m cryostat sections were loaded onto positively charged slides, fixed in cold acetone, and stained with a mixture of FITC-labeled
rat anti-mouse IgG1 or anti-mouse IgG2a mAb. Cover slips were mounted using ProLong Gold Antifade Reagent for microscopy analysis. All the Abs and mAbs used in the above experiments are listed in table S1A.
Enzyme-linked immune absorbent spot (ELISPOT) assaysMultiScreen ELISPOT plates (MAIPS4510, Millipore) were activated with ethanol (35%), washed four times with PBS, and then coated with 100 l NP4-BSA (5 g/ml; N-5050L, Biosearch Technologies), goat anti-mouse IgG1 Ab (5 g/ml; 1071-01, Southern Biotech), or goat anti-mouse IgM Ab (5 g/ml; 1121-01, Southern Biotech) in PBS overnight at 4°C. The plates were then washed six times with PBS and blocked with BSA (0.5%) in RPMI/Hepes plus l-glutamine for 1 hour at room temperature. Single-cell suspensions (250,000 or 100,000 cells/ml) from the spleen and bone marrow of immunized mice were cultured in plates at 37°C for 16 hours in FBS-RPMI. The cultures were removed, and the plates were washed six times, incu-bated with biotin-goat anti-mouse IgG1 Ab (1070-08, Southern Biotech) or biotin-rat anti-mouse IgM mAb (1022-08, Southern Biotech) for 2 hours on a shaker at room temperature, washed six times, incubated with horseradish peroxidase (HRP)–streptavidin (Santa Cruz Biotechnology) for 1 hour on a shaker at room tem-perature, washed 10 times, and developed using the VECTASTAIN AEC Peroxidase Substrate Kit (SK-4200, Vector Laboratories) follow-ing the manufacturer’s protocol. Plates were imaged and quantified using a CTL-ImmunoSpot Analyzer (Cellular Technology). All the Abs and mAbs used in the above experiments are listed in table S1A.
SHM analysis by high-throughput MiSeq sequencingThe mutations in V186.2 of rearranged V186.2DJH-C1, V186.2DJH-C2b, and/or V186.2DJH-C3 NP-binding IgG1, IgG3, and IgG2b were analyzed by high-throughput Illumina MiSeq amplicon sequencing. Spleen B cells were isolated for RNA extraction using the RNeasy Mini Kit (Qiagen). Residual DNA was removed from the extracted RNA with gDNA eliminator columns (Qiagen). Complementary DNA (cDNA) was synthesized from 1 to 2 g of total RNA using SuperScript III First-Strand Synthesis System (Invitrogen) and oligo- dT primer. Rearranged V186.2DJH-C1, V186.2DJH-C2b, and/or V186.2DJH-C3 cDNAs encoding the anti-NP IgG1, IgG2b, and IgG3 heavy chains were amplified using a V186.2 leader–specific forward primer together with a reverse C1-, C3-, or C2b-specific primer (11) tagged with Illumina clustering adapters and Phusion high- fidelity DNA polymerase (New England BioLabs). PCR conditions were 98°C for 10 s, 60°C for 45 s, and 72°C for 1 min for 30 cycles. The amplified library was tagged with barcodes for sample multi-plexing, and PCR was enriched and annealed to the required Illumina clustering adapters. High-throughput 300–base pair (bp) paired-end sequencing was performed by the UTHSCSA Genome Sequencing Facility using the Illumina MiSeq platform. Somatic mutations and clonotypes in rearranged V186.2(V1-72)-DJH gene encoding NP- binding IgG3 and IgG2b were analyzed using IMGT/High V-QUEST (http://imgt.org/HighV-QUEST/doc.action). The frequency of mutations in rearranged V186.2DJH-C2b and/or V186.2DJH-C3 NP-binding IgG3 and IgG2b, as analyzed by MiSeq amplicon sequenc-ing in SIRT1720-treated and nontreated NBSGW/B mice, was com-pared by enumerating the point mutations in the V186.2 segment of three comparable V186.2DJH-C3 and three comparable V186.2DJH-C2b clone pairs (each pair consisting of a mouse treated with nil
on June 1, 2020http://advances.sciencem
ag.org/D
ownloaded from

Gan et al., Sci. Adv. 2020; 6 : eaay2793 1 April 2020
S C I E N C E A D V A N C E S | R E S E A R C H A R T I C L E
15 of 17
and one with SRT1720). Comparable pairs were defined as B cell clones expressing V186.2DJH-C3 or V186.2DJH-C2b with IgH CDR3s being identical in length (7 to 12 amino acids), identical in the first two amino acids and the last three or four amino acids. One of the three V186.2DJH-C3 clone pairs was identical in the whole IgH CDR3 sequence (ARGYFDY).
qRT-PCR analysis of transcriptsTotal RNA was extracted from 2.0 to 5.0 × 10⁶ pelleted B cells using the RNeasy Mini Kit (Qiagen). Residual DNA was removed from the extracted RNA with gDNA eliminator columns (Qiagen). cDNA was synthesized from 1.0 to 2.0 g of total RNA with the SuperScript III First-Strand Synthesis System (Invitrogen) using oligo-dT primer. Specific transcripts were measured by real-time qRT-PCR with appropriate primers as described (6). An Applied Biosystems QuantStudio 3 Real-Time PCR System (Thermo Fisher Scientific) was used to measure SYBR Green (Bio-Rad Laboratories) incorporation with the following protocol: 95°C for 15 s, 40 cycles of 94°C for 10 s, 60°C for 30 s, and 72°C for 30 s. Data acquisition was performed during a 72°C extension step. Melting curve analy-sis was performed from 72° to 95°C. The change in cycling thresh-old (Ct) method was used to analyze levels of transcripts. Data were normalized to the expression level of -ACTIN/-Actin ex-cept noted otherwise (e.g., normalized to the Gapdh expression level).
ImmunoblottingB cells were lysed in Laemmli buffer. Cell extracts containing equal amounts of protein (20 g) were fractionated through 10% SDS–polyacrylamide gel electrophoresis. The fractionated proteins were transferred onto polyvinylidene difluoride membranes (Bio-Rad) overnight (30 V/90 mA) at 4°C. After blocking and overnight incuba-tion at 4°C with mouse anti-AID mAb (clone ZA001; Invitrogen), mouse anti–NF-B p65 mAb (clone D14E12; Cell Signaling Tech-nology), rabbit anti–Acetyl-(Lys310)NF-B p65 mAb (clone D2S3J; Cell Signaling Technology), rabbit anti–Acetyl-DNMT1-K1127/K1129/K1131/K1133 Ab (A5595, ABclonal), rabbit anti-Sirt1 Ab (A11267, ABclonal), rabbit anti-Dnmt1 Ab (A-1700, Epigentek), or rat anti–-actin mAb (clone AC-15, Sigma), the membranes were incubated with HRP-conjugated secondary Abs. After washing with TBS–Tween 20 (0.05%), bound HRP-conjugated mAbs or Abs were revealed using Western Lightning Plus-ECL reagents (PerkinElmer Life and Analytical Sciences). Densitometry was performed with Fiji software. All the Abs and mAbs used in the above experiments are listed in table S1.
DNA methylationDNA methylation was analyzed by bisulfite DNA conversion and Sanger or MiSeq sequencing. For bisulfite conversion, gDNA was treated with sodium bisulfite using the EpiTect Bisulfite Kit (Qiagen) according to the manufacturer’s instructions. Bisulfite-treated DNA was amplified by PCR using GoTaq Hot Start Polymerase (Promega). The primers for bisulfite sequencing PCR were designed using MethPrimer2 (www.urogene.org/cgi-bin/methprimer2/MethPrimer.cgi) and tagged with Illumina clustering adapters. PCR products were purified with a QIAquick PCR purification kit (Qiagen) and used directly for Sanger sequencing with a sequencing primer which reverse-complemented the adapter sequence. For MiSeq sequencing, the amplified library was tagged with barcodes for sample multiplex-
ing, PCR-enriched, and annealed to the required Illumina cluster-ing adapters. High-throughput 300-bp paired-end sequencing was performed by the UTHSCSA Genome Sequencing Facility using the Illumina MiSeq platform. DNA methylation was also analyzed by MeDIP using the MeDIP Kit (Active Motif) following the manufac-turer’s instructions. Precipitated DNA was used as a template for qPCR analysis involving specific primers (table S1B).
Chromatin immunoprecipitationChIP assays were performed as previously described (6). B cells (1.0 × 10⁷) were treated with formaldehyde (1.0%, v/v) for 10 min at 25°C to cross-link chromatin. After quenching with 100 mM gly-cine (pH 8.0) and washing with cold PBS containing protease inhibi-tors (Roche), B cells were resuspended in lysis buffer [20 mM tris–HCl, 200 mM NaCl, 2 mM EDTA, 0.1% (w/v) SDS, and pro-tease inhibitors (pH 8.0)]. Chromatin was sonicated to yield DNA fragments (about 200 to 600 bp), precleared with Pierce Protein A beads (Thermo Fisher Scientific), and incubated with rabbit anti–NF-B p65, anti–Acetyl- (Lys310) NF-B p65 and anti-Sirt1 Abs (as above), rabbit anti- H3K9Ac/K14Ac (17-615, Millipore), rabbit anti-DNMT1 Ab (A-1700, EpiGentek), rabbit anti-Sirt1 Ab (A11267, ABclonal), mouse anti- Dnmt3l mAb (S117-9, StressMarq Biosci-ences), or control rabbit or mouse IgG with irrelevant specificities at 4°C overnight. Immune complexes were precipitated by Protein A agarose beads, washed, and eluted [50 mM tris-HCl, 0.5% SDS, 200 mM NaCl, and proteinase K (100 g/ml) (pH 8.0)], followed by incubation at 65°C for 4 hours. DNA was purified using a QIAquick PCR purification kit (Qiagen). The precipitated DNA was used as a template for qPCR analysis involving specific primers (table S1B).
Sirt1 retroviral construct and enforced expressionSirt1 coding region cDNA was amplified from unstimulated mouse B cells using the appropriate primers (table S1) and cloned into the pMIG retroviral expression vector. To generate the retrovirus, the pMIG vector encoding green fluorescent protein (GFP) only or the pMIG-Sirt1 vector encoding GFP and Sirt1 was used with the pCL-Eco retrovirus-packaging vector (Imgenex) to transfect human embryonic kidney–293T cells by a Ca++ phosphate (ProFection Mammalian Transfection System, Promega). Viral supernatants were collected and used to transduce spleen B cells from C57BL/6 mice after a 12-hour LPS activation, as we reported (6). Transduced B cells were then stimulated with LPS plus IL-4 for 96 hours before analysis of GFP+ and/or IgG1+ B cells by flow cytometry. Dead (7-AAD+) cells were excluded from analysis.
NAD+ and NADH concentrationsNAD+ and NADH concentrations were measured using a fluorescence- based assay with Amplite Fluorimetric total NAD and NADH Assay Kit (Red Fluorescence, AAT Bioquest), following the manufacture’s instruction.
Statistical analysesDifferences in Ig titers, CSR, and RNA transcript expression were analyzed with the Student’s paired t test unless otherwise noted, assuming two-tailed distributions. Differences in the frequency of somatic point mutations were analyzed with 2 tests. The Excel (Microsoft) or Prism software was used for all statistical analyses and calculation of P values (*P < 0.05, **P < 0.01, and ***P < 0.001).
on June 1, 2020http://advances.sciencem
ag.org/D
ownloaded from

Gan et al., Sci. Adv. 2020; 6 : eaay2793 1 April 2020
S C I E N C E A D V A N C E S | R E S E A R C H A R T I C L E
16 of 17
SUPPLEMENTARY MATERIALSSupplementary material for this article is available at http://advances.sciencemag.org/cgi/content/full/6/14/eaay2793/DC1
View/request a protocol for this paper from Bio-protocol.
REFERENCES AND NOTES 1. M. Muramatsu, K. Kinoshita, S. Fagarasan, S. Yamada, Y. Shinkai, T. Honjo, Class switch
recombination and hypermutation require activation-induced cytidine deaminase (AID), a potential RNA editing enzyme. Cell 102, 553–563 (2000).
2. A. Cerutti, K. Chen, A. Chorny, Immunoglobulin responses at the mucosal interface. Annu. Rev. Immunol. 29, 273–293 (2011).
3. Z. Xu, H. Zan, E. J. Pone, T. Mai, P. Casali, Immunoglobulin class-switch DNA recombination: Induction, targeting and beyond. Nat. Rev. Immunol. 12, 517–531 (2012).
4. H. Zan, P. Casali, Epigenetics of peripheral B-cell differentiation and the antibody response. Front. Immunol. 6, 631 (2015).
5. E. E. Crouch, Z. Li, M. Takizawa, S. Fichtner-Feigl, P. Gourzi, C. Montaño, L. Feigenbaum, P. Wilson, S. Janz, F. N. Papavasiliou, R. Casellas, Regulation of AID expression in the immune response. J. Exp. Med. 204, 1145–1156 (2007).
6. S. R. Park, H. Zan, Z. Pal, J. Zhang, A. Al-Qahtani, E. J. Pone, Z. Xu, T. Mai, P. Casali, HoxC4 binds to the promoter of the cytidine deaminase AID gene to induce AID expression, class-switch DNA recombination and somatic hypermutation. Nat. Immunol. 10, 540–550 (2009).
7. T. H. Tran, M. Nakata, K. Suzuki, N. A. Begum, R. Shinkura, S. Fagarasan, T. Honjo, H. Nagaoka, B cell-specific and stimulation-responsive enhancers derepress Aicda by overcoming the effects of silencers. Nat. Immunol. 11, 148–154 (2010).
8. C.-W. J. Lio, V. Shukla, D. Samaniego-Castruita, E. González-Avalos, A. Chakraborty, X. Yue, D. G. Schatz, F. Ay, A. Rao, TET enzymes augment activation-induced deaminase (AID) expression via 5-hydroxymethylcytosine modifications at the Aicda superenhancer. Sci. Immunol. 4, eaau7523 (2019).
9. Y. Dorsett, K. M. McBride, M. Jankovic, A. Gazumyan, T.-H. Thai, D. F. Robbiani, M. D. Virgilio, B. Reina San-Martin, G. Heidkamp, T. A. Schwickert, T. Eisenreich, K. Rajewsky, M. C. Nussenzweig, MicroRNA-155 suppresses activation-induced cytidine deaminase-mediated Myc-Igh translocation. Immunity 28, 630–638 (2008).
10. G. Li, H. Zan, Z. Xu, P. Casali, Epigenetics of the antibody response. Trends Immunol. 34, 460–470 (2013).
11. C. A. White, E. J. Pone, T. Lam, C. Tat, K. L. Hayama, G. Li, H. Zan, P. Casali, Histone deacetylase inhibitors upregulate B cell microRNAs that silence AID and Blimp-1 expression for epigenetic modulation of antibody and autoantibody responses. J. Immunol. 193, 5933–5950 (2014).
12. S. Kong, M. W. McBurney, D. Fang, Sirtuin 1 in immune regulation and autoimmunity. Immunol. Cell Biol. 90, 6–13 (2012).
13. J. Zhang, S.-M. Lee, S. Shannon, B. Gao, W. Chen, A. Chen, R. Divekar, M. W. McBurney, H. Braley-Mullen, H. Zaghouani, D. Fang, The type III histone deacetylase Sirt1 is essential for maintenance of T cell tolerance in mice. J. Clin. Invest. 119, 3048–3058 (2009).
14. H. Yang, S.-M. Lee, B. Gao, J. Zhang, D. Fang, Histone deacetylase sirtuin 1 deacetylates IRF1 protein and programs dendritic cells to control Th17 protein differentiation during autoimmune inflammation. J. Biol. Chem. 288, 37256–37266 (2013).
15. J. Sequeira, G. Boily, S. Bazinet, S. Saliba, X. He, K. Jardine, C. Kennedy, W. Staines, C. Rousseaux, R. Mueller, M. W. McBurney, sirt1-null mice develop an autoimmune-like condition. Exp. Cell Res. 314, 3069–3074 (2008).
16. H. Jing, H. Lin, Sirtuins in epigenetic regulation. Chem. Rev. 115, 2350–2375 (2015). 17. F. Yeung, J. E. Hoberg, C. S. Ramsey, M. D. Keller, D. R. Jones, R. A. Frye, M. W. Mayo,
Modulation of NF-B-dependent transcription and cell survival by the SIRT1 deacetylase. EMBO J. 23, 2369–2380 (2004).
18. L. Peng, Z. Yuan, H. Ling, K. Fukasawa, K. Robertson, N. Olashaw, J. Koomen, J. Chen, W. S. Lane, E. Seto, SIRT1 deacetylates the DNA methyltransferase 1 (DNMT1) protein and alters its activities. Mol. Cell. Biol. 31, 4720–4734 (2011).
19. C. Canto, J. Auwerx, Targeting Sirtuin 1 to improve metabolism: All you need is NAD+? Pharmacol. Rev. 64, 166–187 (2012).
20. V. Desquiret-Dumas, N. Gueguen, G. Leman, S. Baron, V. Nivet-Antoine, S. Chupin, A. Chevrollier, E. Vessières, A. Ayer, M. Ferré, D. Bonneau, D. Henrion, P. Reynier, V. Procaccio, Resveratrol induces a mitochondrial complex I-dependent increase in NADH oxidation responsible for sirtuin activation in liver cells. J. Biol. Chem. 288, 36662–36675 (2013).
21. Z.-L. Wang, X.-F. Luo, M.-T. Li, D. Xu, S. Zhou, H.-Z. Chen, N. Gao, Z. Chen, L.-L. Zhang, X.-F. Zeng, Resveratrol possesses protective effects in a pristane-induced lupus mouse model. PLOS ONE 9, e114792 (2014).
22. L. R. Stein, S.-i. Imai, The dynamic regulation of NAD metabolism in mitochondria. Trends Endocrinol. Metab. 23, 420–428 (2012).
23. H. C. Chang, L. Guarente, SIRT1 and other sirtuins in metabolism. Trends Endocrinol. Metab. 25, 138–145 (2014).
24. A. Chalkiadaki, L. Guarente, Sirtuins mediate mammalian metabolic responses to nutrient availability. Nat. Rev. Endocrinol. 8, 287–296 (2012).
25. S. Imai, L. Guarente, NAD+ and sirtuins in aging and disease. Trends Cell Biol. 24, 464–471 (2014).
26. P. T. Pfluger, D. Herranz, S. Velasco-Miguel, M. Serrano, M. H. Tschöp, Sirt1 protects against high-fat diet-induced metabolic damage. Proc. Natl. Acad. Sci. U.S.A. 105, 9793–9798 (2008).
27. H. Li, G. K. Rajendran, N. Liu, C. Ware, B. P. Rubin, Y. Gu, Sirt1 modulates the estrogen-insulin-like growth factor-1 signaling for postnatal development of mammary gland in mice. Breast Cancer Res. 9, R1 (2007).
28. L. D. Shultz, B. L. Lyons, L. M. Burzenski, B. Gott, X. Chen, S. Chaleff, M. Kotb, S. D. Gillies, M. King, J. Mangada, D. L. Greiner, R. Handgretinger, Human lymphoid and myeloid cell development in NOD/LtSz-scid IL2R gamma null mice engrafted with mobilized human hemopoietic stem cells. J. Immunol. 174, 6477–6489 (2005).
29. R. Sciammas, A. L. Shaffer, J. H. Schatz, H. Zhao, L. M. Staudt, H. Singh, Graded expression of interferon regulatory factor-4 coordinates isotype switching with plasma cell differentiation. Immunity 25, 225–236 (2006).
30. Q. Zhang, S. Y. Wang, C. Fleuriel, D. Leprince, J. V. Rocheleau, D. W. Piston, R. H. Goodman, Metabolic regulation of SIRT1 transcription via a HIC1:CtBP corepressor complex. Proc. Natl. Acad. Sci. U.S.A. 104, 829–833 (2007).
31. R. Casellas, U. Basu, W. T. Yewdell, J. Chaudhuri, D. F. Robbiani, J. M. Di Noia, Mutations, kataegis and translocations in B cells: Understanding AID promiscuous activity. Nat. Rev. Immunol. 16, 164–176 (2016).
32. A. Chuprin, A. Avin, Y. Goldfarb, Y. Herzig, B. Levi, A. Jacob, A. Sela, S. Katz, M. Grossman, C. Guyon, M. Rathaus, H. Y. Cohen, I. Sagi, M. Giraud, M. W. McBurney, E. S. Husebye, J. Abramson, The deacetylase Sirt1 is an essential regulator of Aire-mediated induction of central immunological tolerance. Nat. Immunol. 16, 737–745 (2015).
33. H. W. Lim, S. G. Kang, J. K. Ryu, B. Schilling, M. Fei, I. S. Lee, A. Kehasse, K. Shirakawa, M. Yokoyama, M. Schnölzer, H. G. Kasler, H.-S. Kwon, B. W. Gibson, H. Sato, K. Akassoglou, C. Xiao, D. R. Littman, M. Ott, E. Verdin, SIRT1 deacetylates RORgammat and enhances Th17 cell generation. J. Exp. Med. 212, 607–617 (2015).
34. Y. Wang, Y. Bi, X. Chen, C. Li, Y. Li, Z. Zhang, J. Wang, Y. Lu, Q. Yu, H. Su, H. Yang, G. Liu, Histone deacetylase SIRT1 negatively regulates the differentiation of interleukin-9-producing CD4+ T cells. Immunity 44, 1337–1349 (2016).
35. M. Y. Jeng, P. A. Hull, M. Fei, H.-S. Kwon, C.-L. Tsou, H. Kasler, C.-P. Ng, D. E. Gordon, J. Johnson, N. Krogan, E. Verdin, M. Ott, Metabolic reprogramming of human CD8+ memory T cells through loss of SIRT1. J. Exp. Med. 215, 51–62 (2018).
36. G. Liu, Y. Bi, L. Xue, Y. Zhang, H. Yang, X. Chen, Y. Lu, Z. Zhang, H. Liu, X. Wang, R. Wang, Y. Chu, R. Yang, Dendritic cell SIRT1-HIF1alpha axis programs the differentiation of CD4+ T cells through IL-12 and TGF-beta1. Proc. Natl. Acad. Sci. U.S.A. 112, E957–E965 (2015).
37. F. Imperatore, J. Maurizio, S. V. Aguilar, C. J. Busch, J. Favret, E. Kowenz-Leutz, W. Cathou, R. Gentek, P. Perrin, A. Leutz, C. Berruyer, M. H. Sieweke, SIRT1 regulates macrophage self-renewal. EMBO J. 36, 2353–2372 (2017).
38. W. W. Hsu, B. Wu, W. R. Liu, Sirtuins 1 and 2 are universal histone deacetylases. ACS Chem. Biol. 11, 792–799 (2016).
39. K. R. Kieffer-Kwon, K. Nimura, S. S. P. Rao, J. Xu, S. Jung, A. Pekowska, M. Dose, E. Stevens, E. Mathe, P. Dong, S.-C. Huang, M. A. Ricci, L. Baranello, Y. Zheng, F. T. Ardori, W. Resch, D. Stavreva, S. Nelson, M. M. Andrew, A. Casellas, E. Finn, C. Gregory, B. G. St. Hilaire, S. M. Johnson, W. Dubois, M. P. Cosma, E. Batchelor, D. Levens, R. D. Phair, T. Misteli, L. Tessarollo, G. Hager, M. Lakadamyali, Z. Liu, M. Floer, H. Shroff, E. L. Aiden, R. Casellas, Myc regulates chromatin decompaction and nuclear architecture during B cell activation. Mol. Cell 67, 566–578.e10 (2017).
40. R. Hu, A. Warri, L. Jin, A. Zwart, R. B. Riggins, H. B. Fang, R. Clarke, NF-B signaling is required for XBP1 (unspliced and spliced)-mediated effects on antiestrogen responsiveness and cell fate decisions in breast cancer. Mol. Cell. Biol. 35, 379–390 (2015).
41. B. G. Barwick, C. D. Scharer, R. J. Martinez, M. J. Price, A. N. Wein, R. R. Haines, A. P. R. Bally, J. E. Kohlmeier, J. M. Boss, B cell activation and plasma cell differentiation are inhibited by de novo DNA methylation. Nat. Commun. 9, 1900 (2018).
42. Q. Zhang, M. J. Lenardo, D. Baltimore, 30 years of NF-B: A blossoming of relevance to human pathobiology. Cell 168, 37–57 (2017).
43. L.-F. Chen, S. A. Williams, Y. Mu, H. Nakano, J. M. Duerr, L. Buckbinder, W. C. Greene, NF-kB RelA phosphorylation regulates RelA acetylation. Mol. Cell. Biol. 25, 7966–7975 (2005).
44. C. R. Consiglio, S. Juliana da Silveira, O. A. Monticielo, R. M. Xavier, J. C. Brenol, J. A. Chies, SIRT1 promoter polymorphisms as clinical modifiers of systemic lupus erythematosus. Mol. Biol. Rep. 41, 4233–4239 (2014).
45. M. Yamakuchi, MicroRNA regulation of SIRT1. Front. Physiol. 3, 68 (2012). 46. P. Li, Y. Zhao, X. Wu, M. Xia, M. Fang, Y. Iwasaki, J. Sha, Q. Chen, Y. Xu, A. Shen, IFN-g
disrupts energy expenditure and metabolic homeostasis by suppressing SIRT1 transcription. Nucleic Acids Res. 40, 1609–1620 (2012).
on June 1, 2020http://advances.sciencem
ag.org/D
ownloaded from

Gan et al., Sci. Adv. 2020; 6 : eaay2793 1 April 2020
S C I E N C E A D V A N C E S | R E S E A R C H A R T I C L E
17 of 17
47. W. Lu, R. You, X. Yuan, T. Yang, E. L. G. Samuel, D. C. Marcano, W. K. A. Sikkema, J. M. Tour, A. Rodriguez, F. Kheradmand, D. B. Corry, The microRNA miR-22 inhibits the histone deacetylase HDAC4 to promote TH17 cell-dependent emphysema. Nat. Immunol. 16, 1185–1194 (2015).
48. E. J. Pone, J. Zhang, T. Mai, C. A. White, G. Li, J. K. Sakakura, P. J. Patel, A. Al-Qahtani, H. Zan, Z. Xu, P. Casali, BCR-signalling synergizes with TLR-signalling for induction of AID and immunoglobulin class-switching through the non-canonical NF-kB pathway. Nat. Commun. 3, 767 (2012).
49. Y. Yin, S.-C. Choi, Z. Xu, D. J. Perry, H. Seay, B. P. Croker, E. S. Sobel, T. M. Brusko, L. Morel, Normalization of CD4+ T cell metabolism reverses lupus. Sci. Transl. Med. 7, 274ra218 (2015).
Acknowledgments: We would like to thank G. Excalante for SLE blood samples, Z. Lai (UTHSCSA Genome Sequencing Facility) for high-throughput sequencing, and Y. Chen for bioinformatics analysis. We would also like to acknowledge the critical contribution of K. Gorena and M. Berton (UT Health Flow Cytometry core) for helping us on FACS analysis and cell sorting. Funding: This work was supported by NIH grants R01 AI105813, R01 AI079705, and T32 AI138944 and the Lupus Research Alliance Target Identification in Lupus Grant ALR 641363. H.G., T.S., and X.L. were supported by Xiangya Medical School, Central South University, Changsha, China, in the context of the Xiangya-UT Long School
of Medicine San Antonio medical student visiting program. Author contributions: H.G., T.S., J.R.T., D.P.C., H.N.S., and X.L. performed experiments. Z.X. helped in experimental design. H.Z. designed and performed experiments, analyzed data, supervised the work, and wrote the manuscript. P.C. planned the study, designed the experiments, analyzed the data, supervised the work, and wrote the manuscript. Competing interests: The authors declare that they have no competing interests. Data and materials availability: All data needed to evaluate the conclusions in the paper are present in the paper and/or the Supplementary Materials. Additional data related to this paper may be requested from the authors.
Submitted 5 June 2019Accepted 9 January 2020Published 1 April 202010.1126/sciadv.aay2793
Citation: H. Gan, T. Shen, D. P. Chupp, J. R. Taylor, H. N. Sanchez, X. Li, Z. Xu, H. Zan, P. Casali, B cell Sirt1 deacetylates histone and non-histone proteins for epigenetic modulation of AID expression and the antibody response. Sci. Adv. 6, eaay2793 (2020).
on June 1, 2020http://advances.sciencem
ag.org/D
ownloaded from

expression and the antibody responseB cell Sirt1 deacetylates histone and non-histone proteins for epigenetic modulation of AID
Huoqun Gan, Tian Shen, Daniel P. Chupp, Julia R. Taylor, Helia N. Sanchez, Xin Li, Zhenming Xu, Hong Zan and Paolo Casali
DOI: 10.1126/sciadv.aay2793 (14), eaay2793.6Sci Adv
ARTICLE TOOLS http://advances.sciencemag.org/content/6/14/eaay2793
MATERIALSSUPPLEMENTARY http://advances.sciencemag.org/content/suppl/2020/03/30/6.14.eaay2793.DC1
REFERENCES
http://advances.sciencemag.org/content/6/14/eaay2793#BIBLThis article cites 49 articles, 16 of which you can access for free
PERMISSIONS http://www.sciencemag.org/help/reprints-and-permissions
Terms of ServiceUse of this article is subject to the
is a registered trademark of AAAS.Science AdvancesYork Avenue NW, Washington, DC 20005. The title (ISSN 2375-2548) is published by the American Association for the Advancement of Science, 1200 NewScience Advances
License 4.0 (CC BY-NC).Science. No claim to original U.S. Government Works. Distributed under a Creative Commons Attribution NonCommercial Copyright © 2020 The Authors, some rights reserved; exclusive licensee American Association for the Advancement of
on June 1, 2020http://advances.sciencem
ag.org/D
ownloaded from
![Review Article SIRT1 Modulators in Experimentally Induced ...downloads.hindawi.com/journals/omcl/2019/8765954.pdf · deacetylates histones [27] and more than fifty nonhistone targets,](https://static.fdocuments.in/doc/165x107/5f3f0bebd8d8cf690f4aabf6/review-article-sirt1-modulators-in-experimentally-induced-deacetylates-histones.jpg)