Immigration How well do Canada’s immigration laws and policies respond to immigration issues?
33
Immigration How well do Canada’s immigration laws and policies respond to immigration issues?
-
Upload
godwin-murphy -
Category
Documents
-
view
219 -
download
0
Transcript of Immigration How well do Canada’s immigration laws and policies respond to immigration issues?
ImmigrationHow well do Canada’s immigration laws and policies respond to immigration issues?
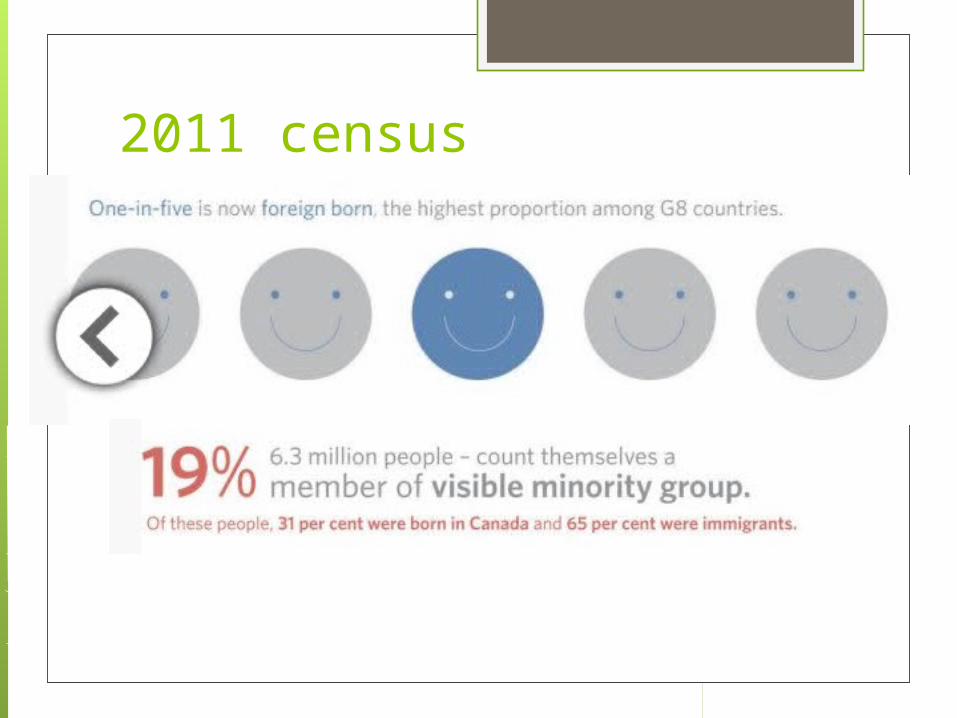
2011 census
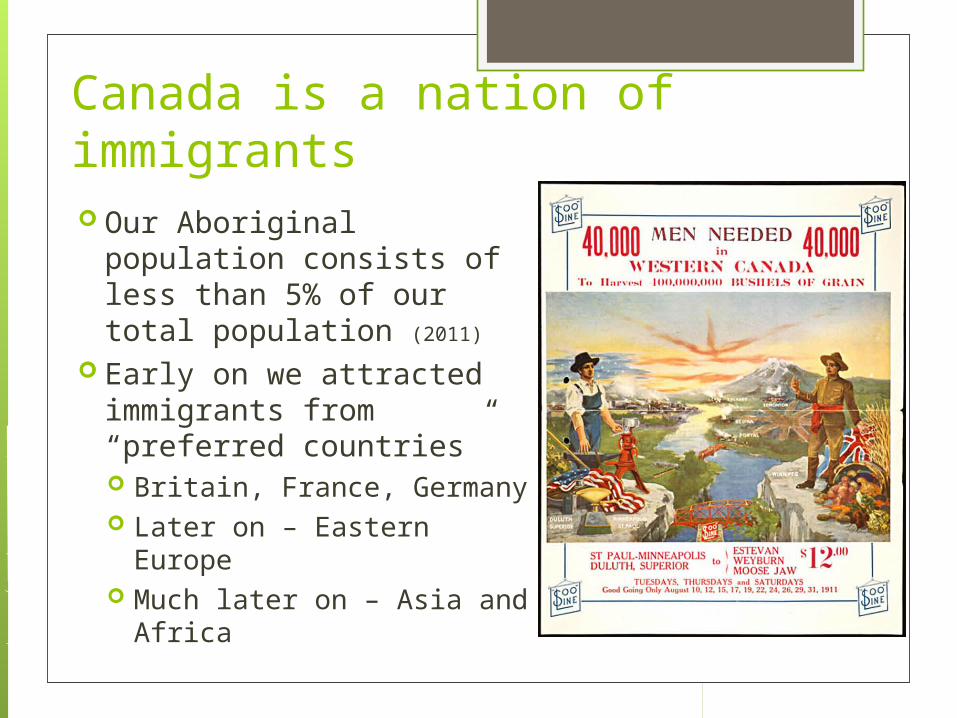
Canada is a nation of immigrants Our Aboriginal population
consists of less than 5% of our total population (2011)
Early on we attracted immigrants from “preferred countries” Britain, France, Germany Later on – Eastern Europe Much later on – Asia and
Africa
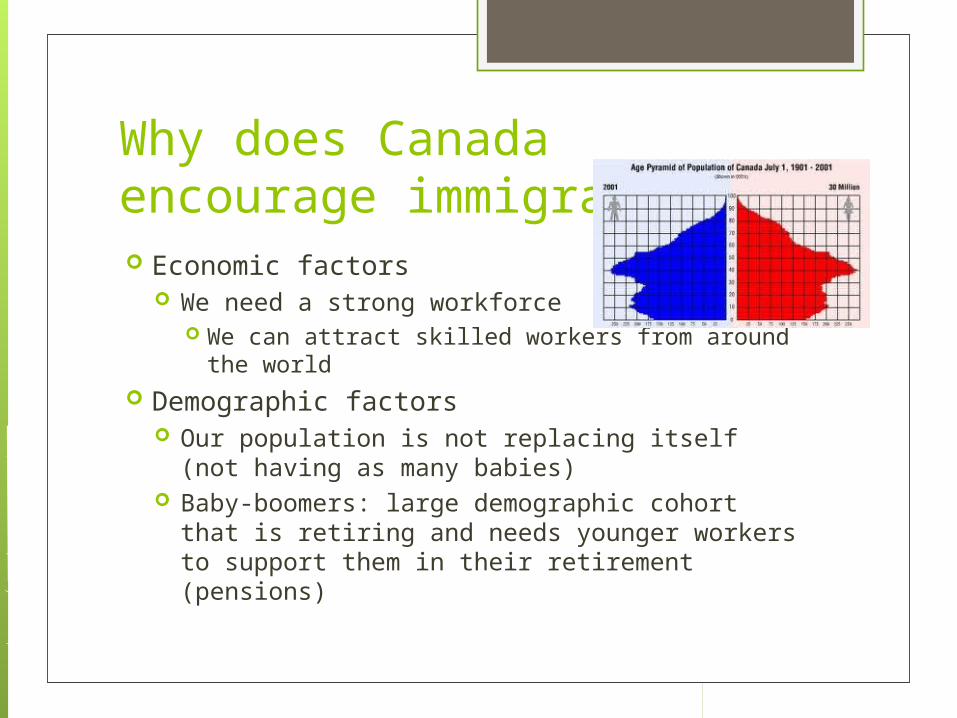
Why does Canada encourage immigration Economic factors
We need a strong workforce We can attract skilled workers from around
the world Demographic factors
Our population is not replacing itself (not having as many babies)
Baby-boomers: large demographic cohort that is retiring and needs younger workers to support them in their retirement (pensions)


We are proud of our multicultural heritage
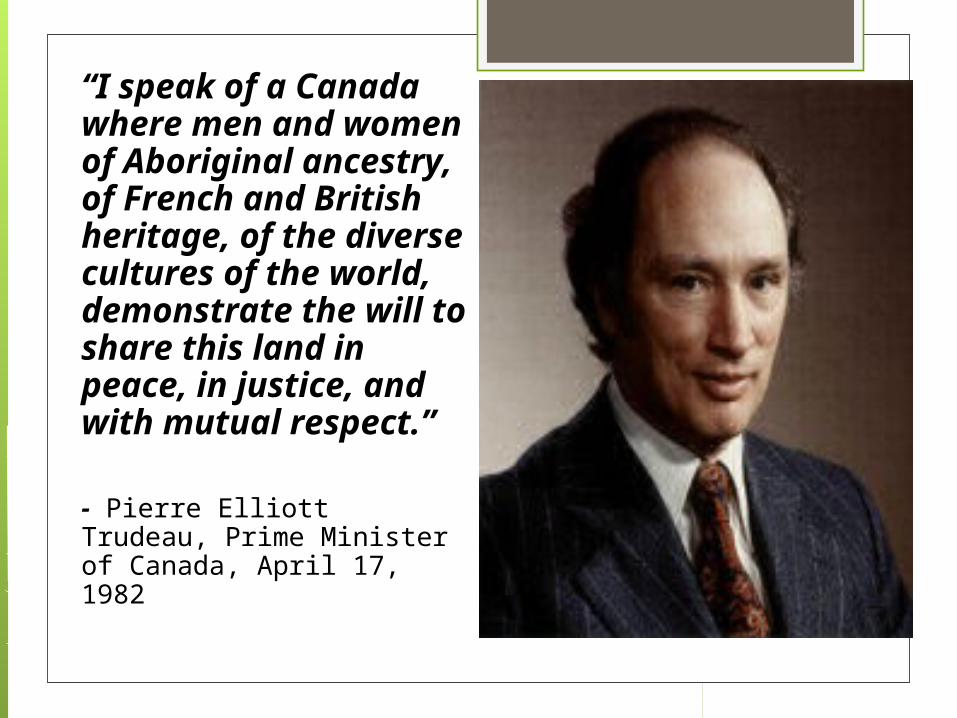
“I speak of a Canada where men and women of Aboriginal ancestry, of French and British heritage, of the diverse cultures of the world, demonstrate the will to share this land in peace, in justice, and with mutual respect.”
- Pierre Elliott Trudeau, Prime Minister of Canada, April 17, 1982
EXAMPLES OF IMMIGRATION ISSUES IN THE PAST
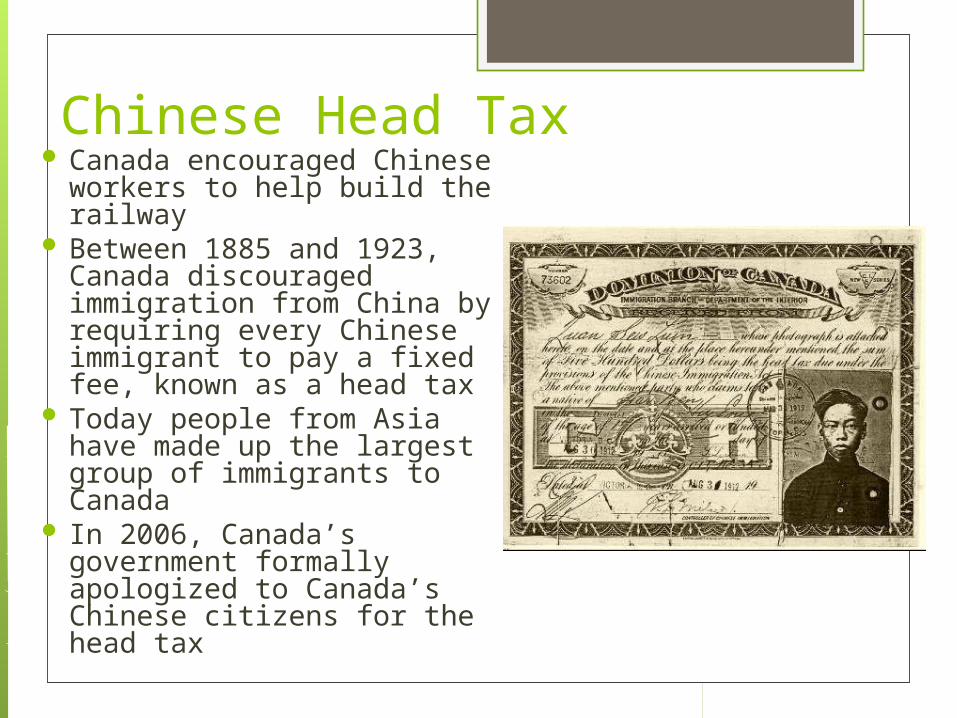
Chinese Head Tax Canada encouraged Chinese
workers to help build the railway
Between 1885 and 1923, Canada discouraged immigration from China by requiring every Chinese immigrant to pay a fixed fee, known as a head tax
Today people from Asia have made up the largest group of immigrants to Canada
In 2006, Canada’s government formally apologized to Canada’s Chinese citizens for the head tax
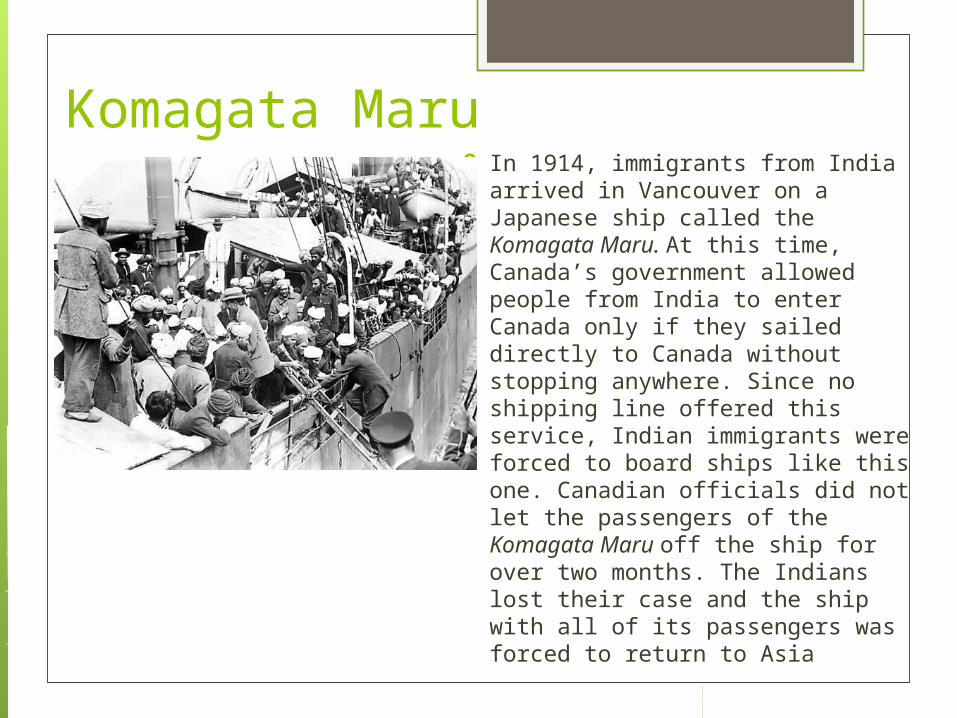
Komagata Maru In 1914, immigrants from India
arrived in Vancouver on a Japanese ship called the Komagata Maru. At this time, Canada’s government allowed people from India to enter Canada only if they sailed directly to Canada without stopping anywhere. Since no shipping line offered this service, Indian immigrants were forced to board ships like this one. Canadian officials did not let the passengers of the Komagata Maru off the ship for over two months. The Indians lost their case and the ship with all of its passengers was forced to return to Asia
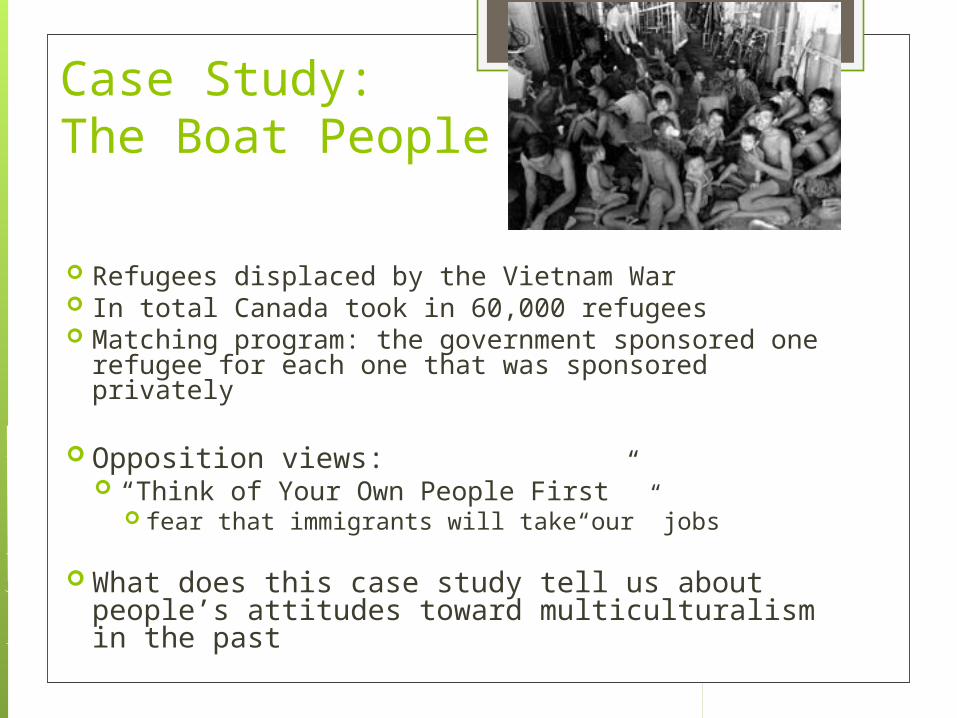
Case Study: The Boat People
Refugees displaced by the Vietnam War In total Canada took in 60,000 refugees Matching program: the government sponsored one
refugee for each one that was sponsored privately
Opposition views: “Think of Your Own People First”
fear that immigrants will take“our” jobs
What does this case study tell us about people’s attitudes toward multiculturalism in the past
Immigration Legislation
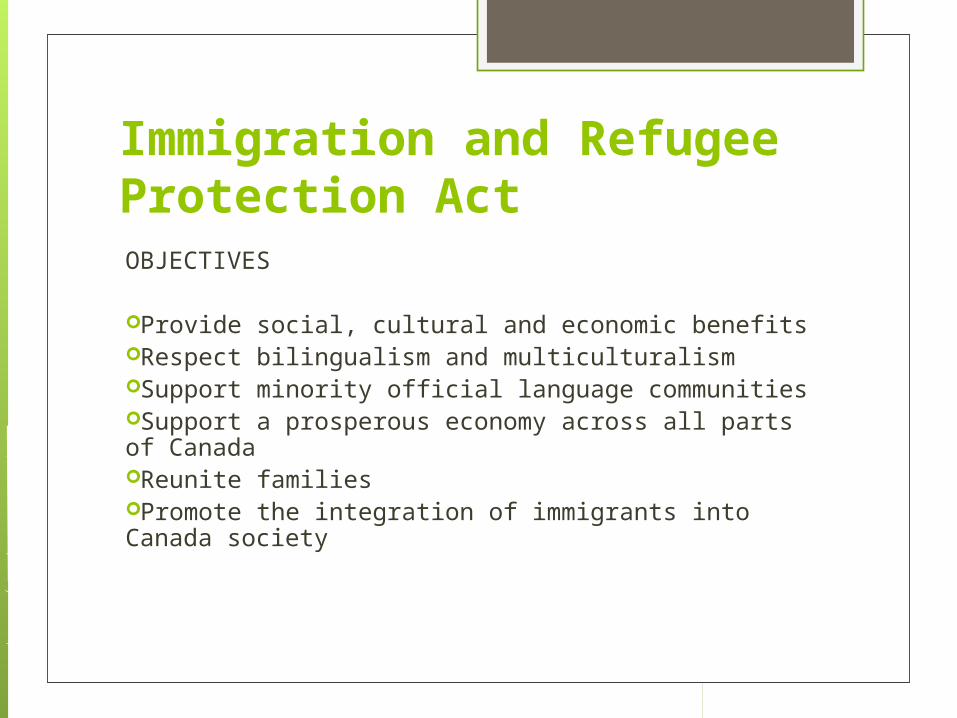
Immigration and Refugee Protection ActOBJECTIVES
Provide social, cultural and economic benefitsRespect bilingualism and multiculturalismSupport minority official language communitiesSupport a prosperous economy across all parts of CanadaReunite familiesPromote the integration of immigrants into Canada society
FACTORS RELATED TO IMMIGRATION

ECONOMIC FACTORS
Provide a workforceMuch of Canada’s economy and
infrastructure has been built by immigrants. Ex. the trans-continental railway
Demographic changes include decreasing birth rates. Without immigration there would be limited labour force growth
In some industries Canada either lacks skilled labour or lacks people willing to do those jobs.
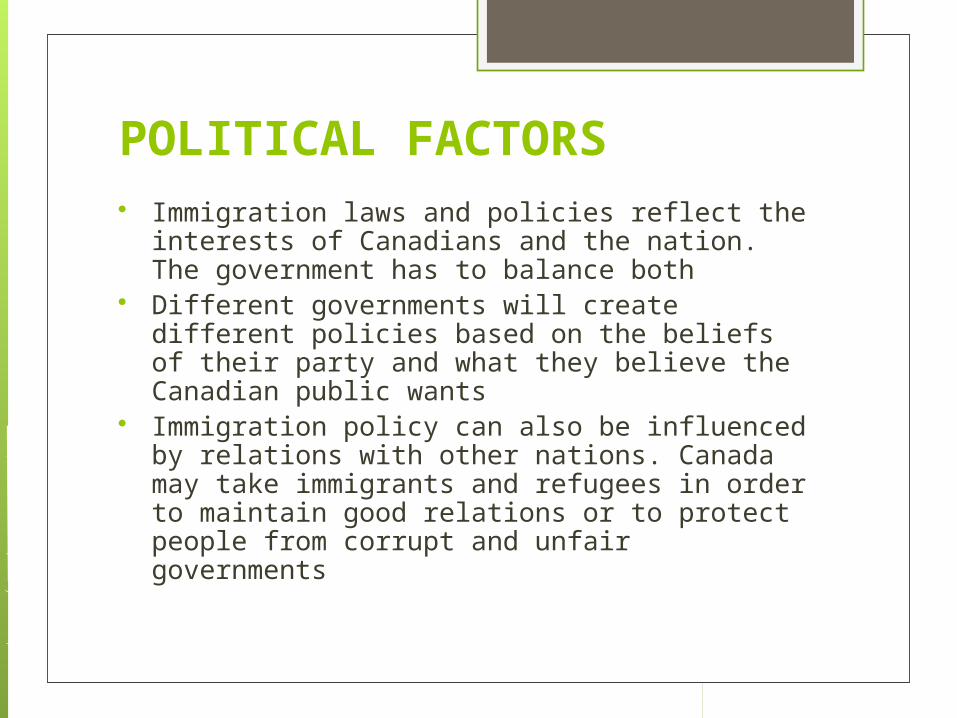
POLITICAL FACTORS Immigration laws and policies reflect the
interests of Canadians and the nation. The government has to balance both
Different governments will create different policies based on the beliefs of their party and what they believe the Canadian public wants
Immigration policy can also be influenced by relations with other nations. Canada may take immigrants and refugees in order to maintain good relations or to protect people from corrupt and unfair governments
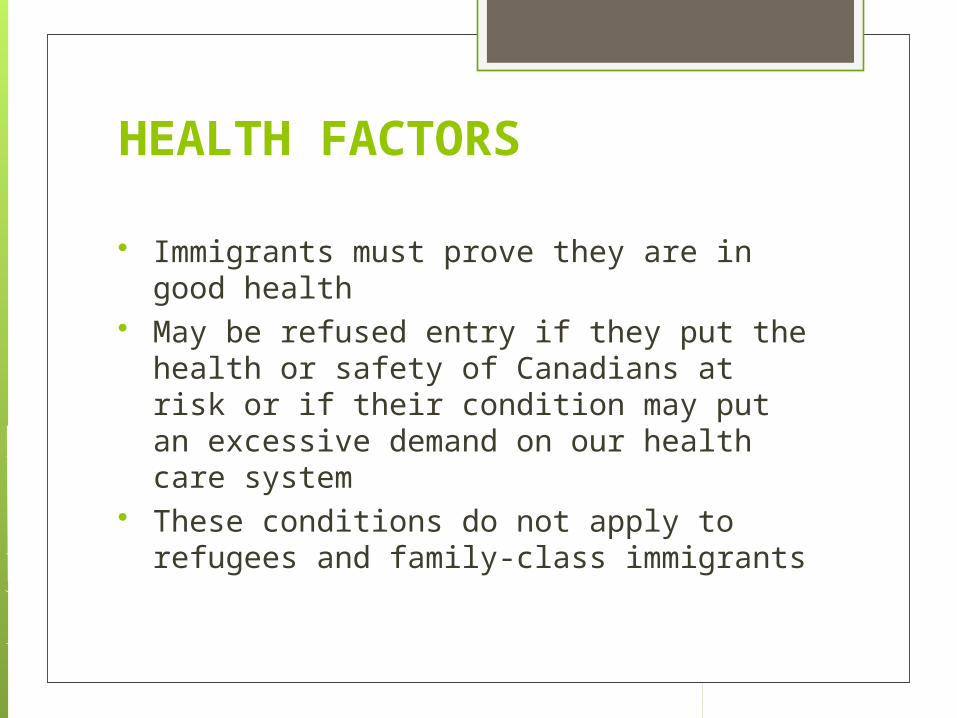
HEALTH FACTORS
Immigrants must prove they are in good health
May be refused entry if they put the health or safety of Canadians at risk or if their condition may put an excessive demand on our health care system
These conditions do not apply to refugees and family-class immigrants
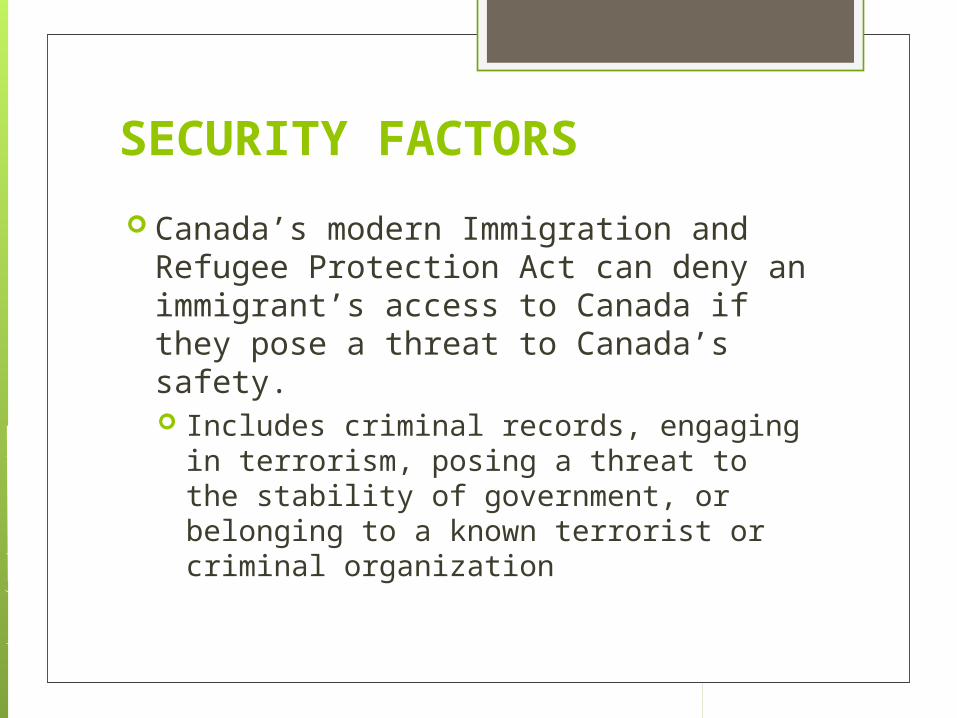
SECURITY FACTORS
Canada’s modern Immigration and Refugee Protection Act can deny an immigrant’s access to Canada if they pose a threat to Canada’s safety. Includes criminal records, engaging in
terrorism, posing a threat to the stability of government, or belonging to a known terrorist or criminal organization
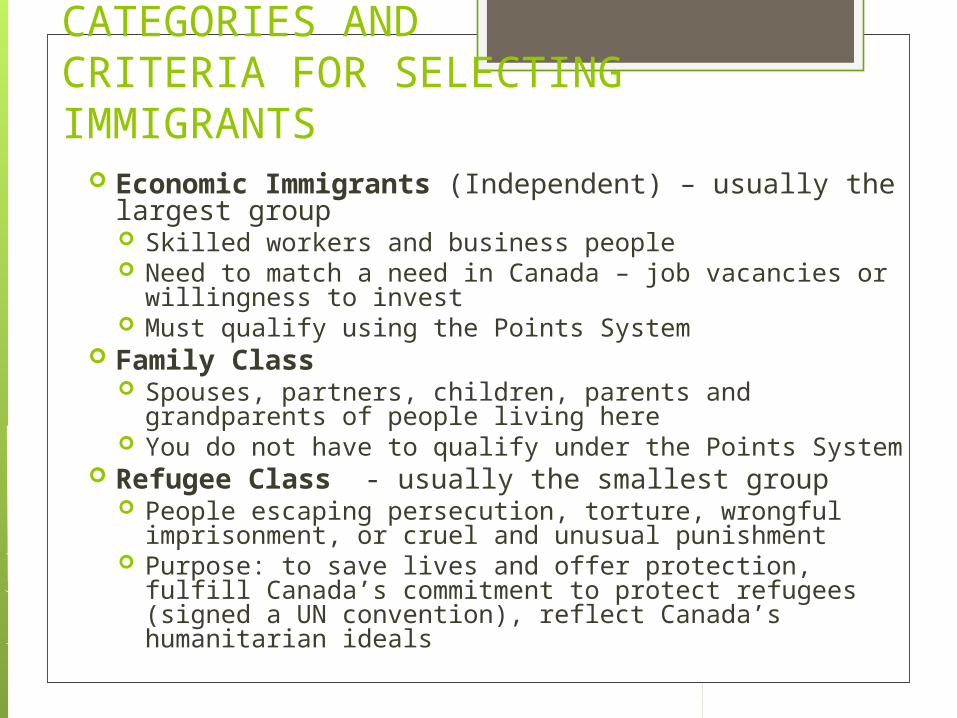
CATEGORIES AND CRITERIA FOR SELECTING IMMIGRANTS
Economic Immigrants (Independent) – usually the largest group Skilled workers and business people Need to match a need in Canada – job vacancies or
willingness to invest Must qualify using the Points System
Family Class Spouses, partners, children, parents and grandparents of
people living here You do not have to qualify under the Points System
Refugee Class - usually the smallest group People escaping persecution, torture, wrongful
imprisonment, or cruel and unusual punishment Purpose: to save lives and offer protection, fulfill
Canada’s commitment to protect refugees (signed a UN convention), reflect Canada’s humanitarian ideals
Refugees
“So often the world sits idly by, watching ethnic conflicts flare up, as if these were mere entertainment rather than human beings whose lives are being destroyed. Shouldn't the existence of even one single refugee be a cause for alarm throughout the world?”
Urkhan Alakbarov
POINTS SYSTEMA series of questions designed to determine a person’s suitability for immigration to Canada Applies only to economic immigrantsAn applicant must score enough points to be considered for immigrationQuestions are based on skills, education, and other factors related to successfully integrating into Canadian society
Issues Relating to Immigration
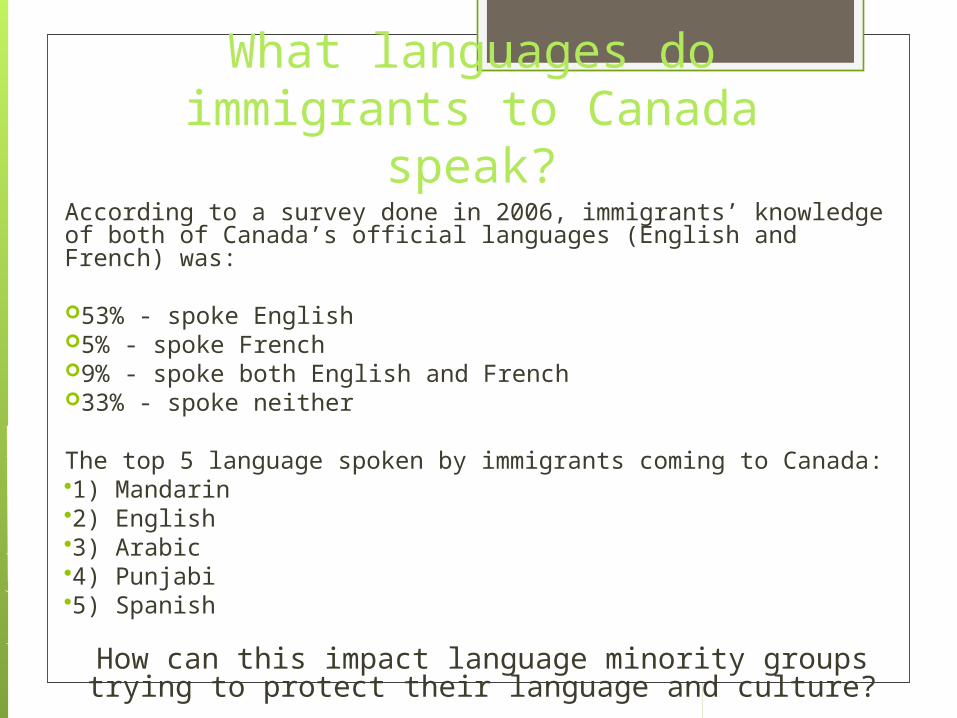
What languages do immigrants to Canada speak?
According to a survey done in 2006, immigrants’ knowledge of both of Canada’s official languages (English and French) was:
53% - spoke English5% - spoke French9% - spoke both English and French33% - spoke neither
The top 5 language spoken by immigrants coming to Canada:1) Mandarin2) English3) Arabic4) Punjabi5) Spanish
How can this impact language minority groups trying to protect their language and culture?
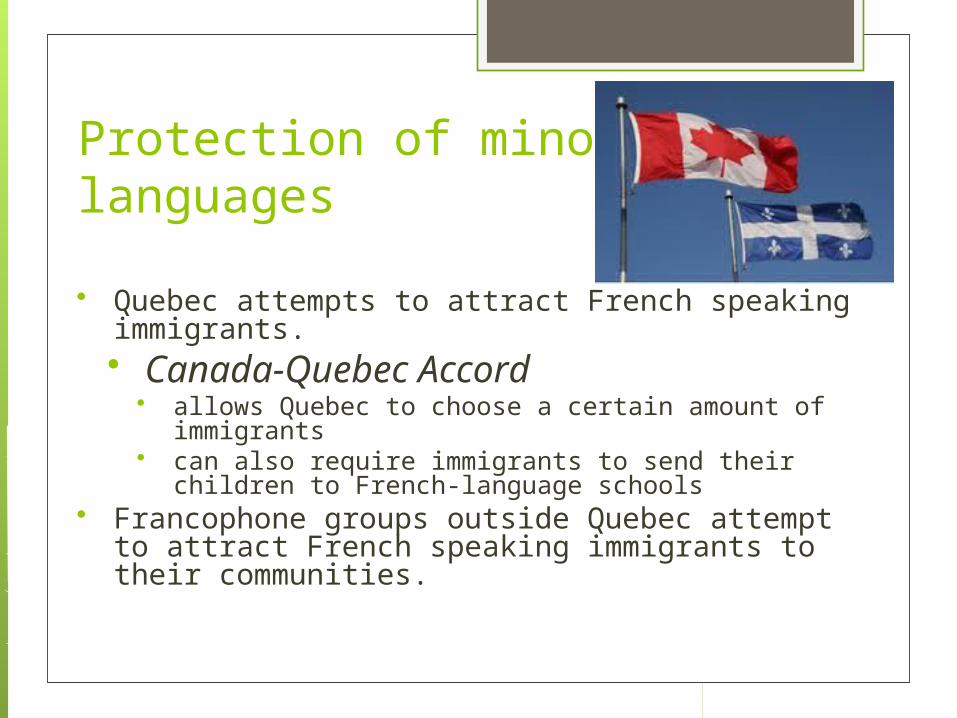
Protection of minority languages
Quebec attempts to attract French speaking immigrants. Canada-Quebec Accord
allows Quebec to choose a certain amount of immigrants
can also require immigrants to send their children to French-language schools
Francophone groups outside Quebec attempt to attract French speaking immigrants to their communities.
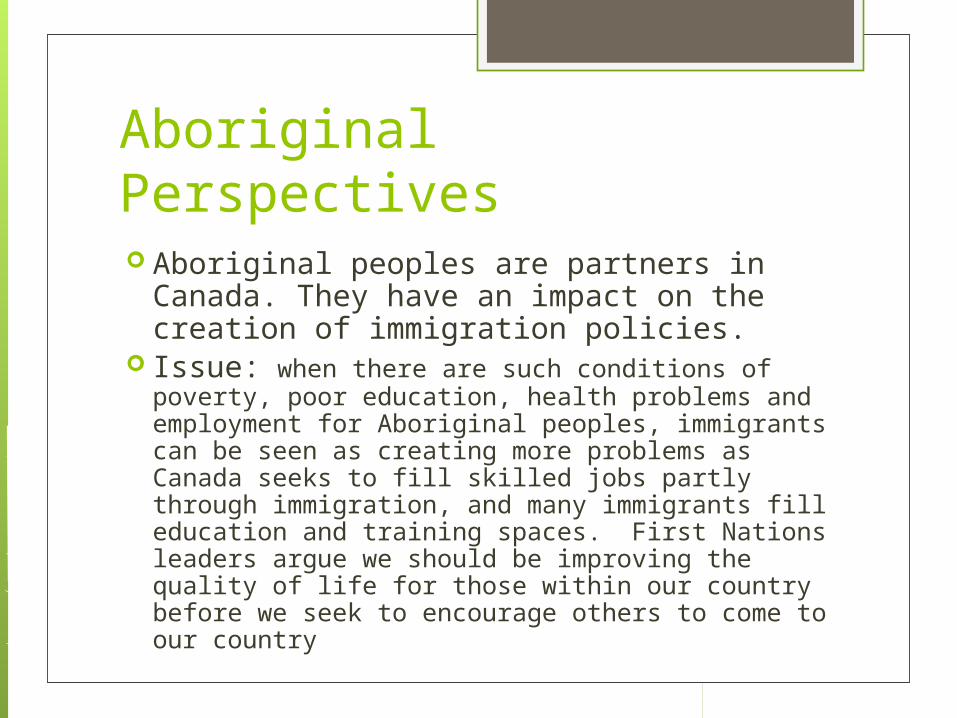
Aboriginal Perspectives Aboriginal peoples are partners in
Canada. They have an impact on the creation of immigration policies.
Issue: when there are such conditions of poverty, poor education, health problems and employment for Aboriginal peoples, immigrants can be seen as creating more problems as Canada seeks to fill skilled jobs partly through immigration, and many immigrants fill education and training spaces. First Nations leaders argue we should be improving the quality of life for those within our country before we seek to encourage others to come to our country
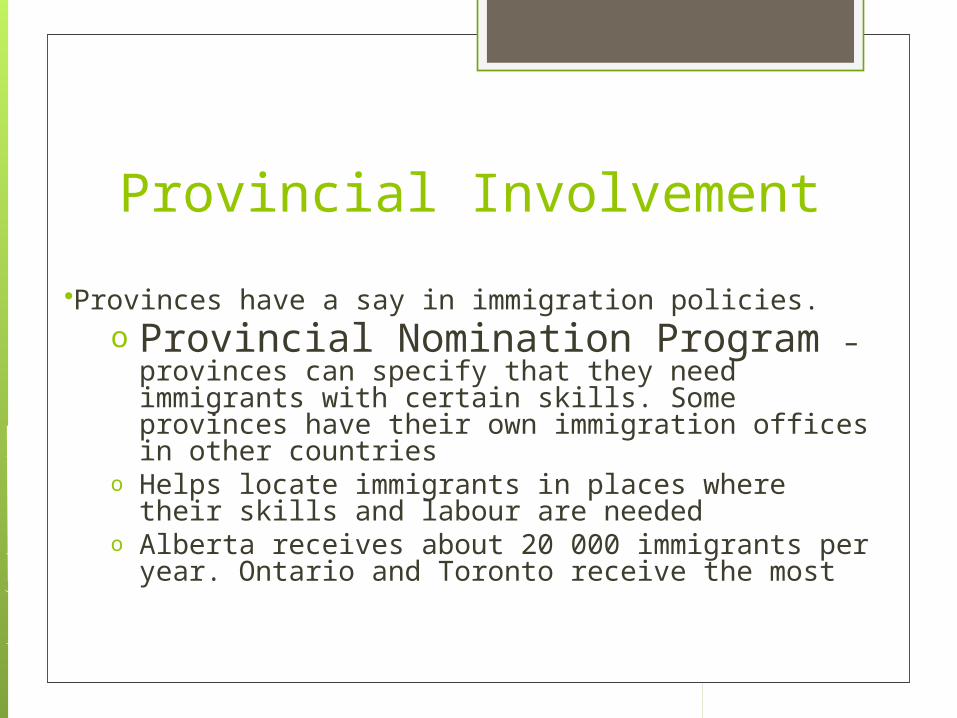
Provincial Involvement
Provinces have a say in immigration policies. o Provincial Nomination Program –
provinces can specify that they need immigrants with certain skills. Some provinces have their own immigration offices in other countries
o Helps locate immigrants in places where their skills and labour are needed
o Alberta receives about 20 000 immigrants per year. Ontario and Toronto receive the most
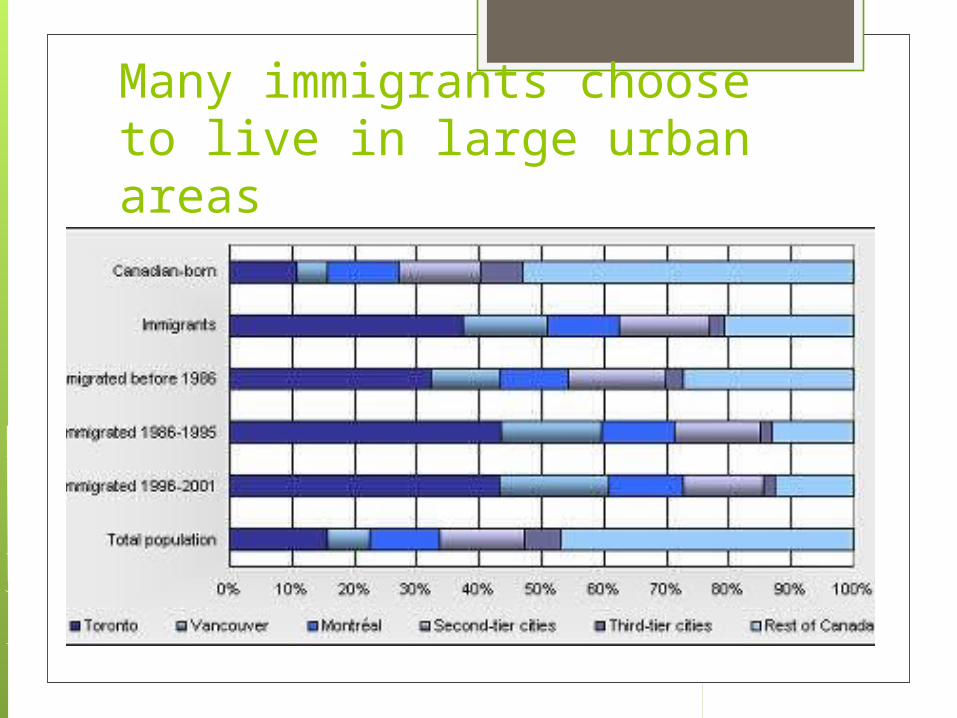
Many immigrants choose to live in large urban areas
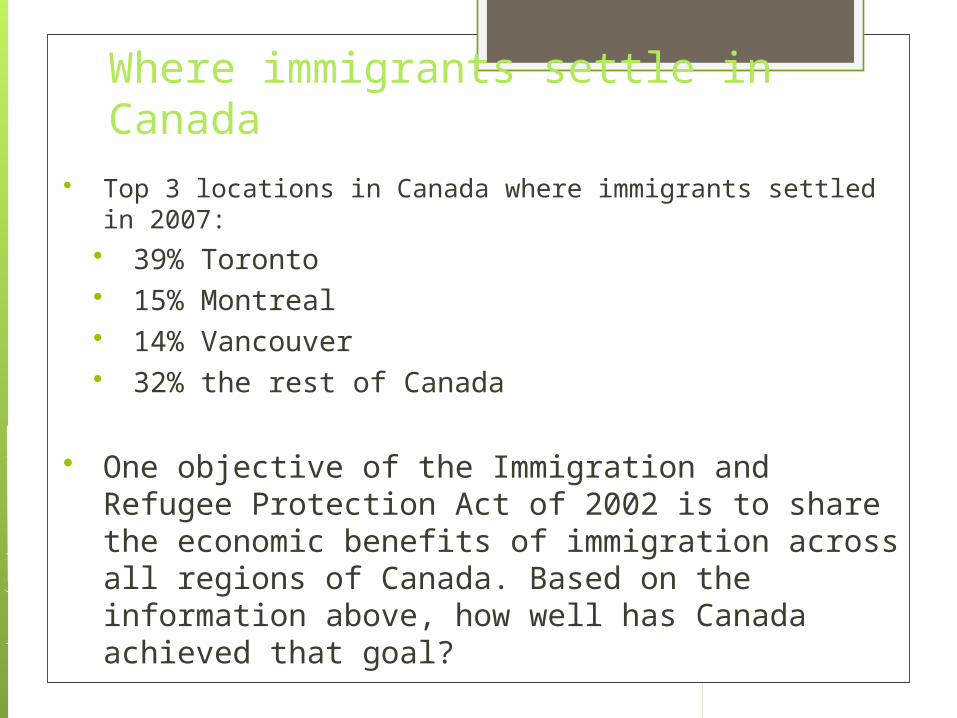
Where immigrants settle in Canada Top 3 locations in Canada where immigrants settled in
2007: 39% Toronto 15% Montreal 14% Vancouver 32% the rest of Canada
One objective of the Immigration and Refugee Protection Act of 2002 is to share the economic benefits of immigration across all regions of Canada. Based on the information above, how well has Canada achieved that goal?
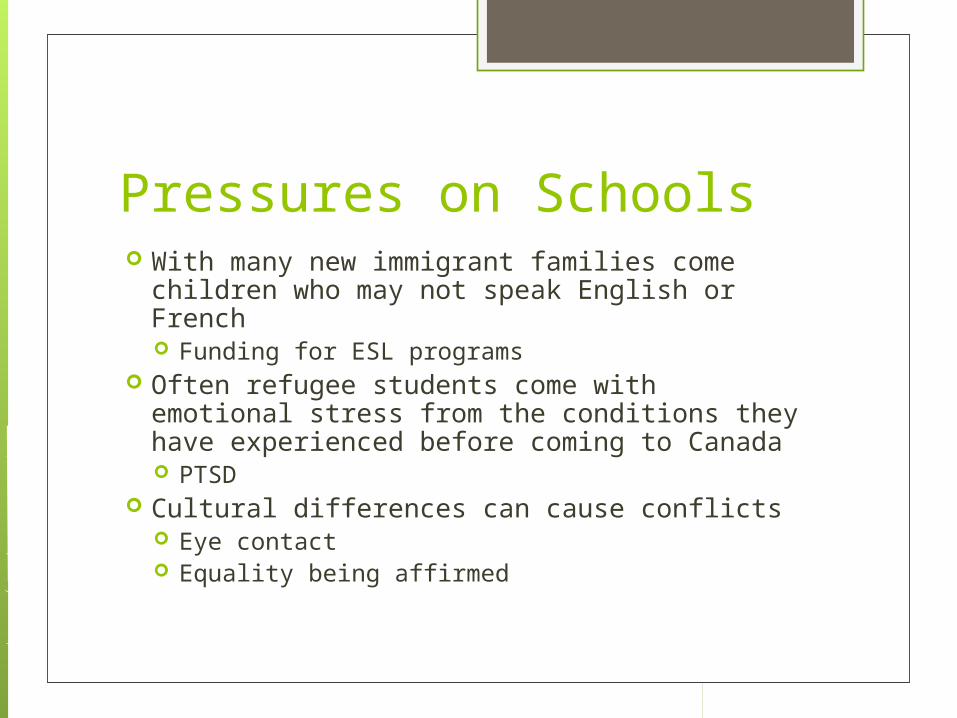
Pressures on Schools With many new immigrant families come
children who may not speak English or French Funding for ESL programs
Often refugee students come with emotional stress from the conditions they have experienced before coming to Canada PTSD
Cultural differences can cause conflicts Eye contact Equality being affirmed
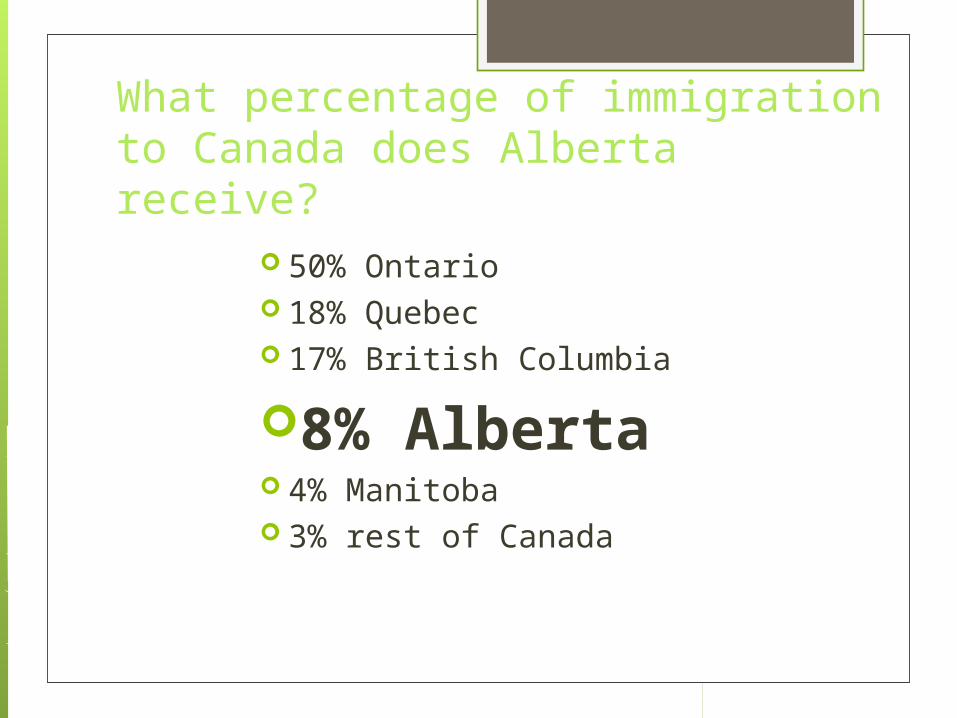
What percentage of immigration to Canada does Alberta receive?
50% Ontario 18% Quebec 17% British Columbia
8% Alberta 4% Manitoba 3% rest of Canada
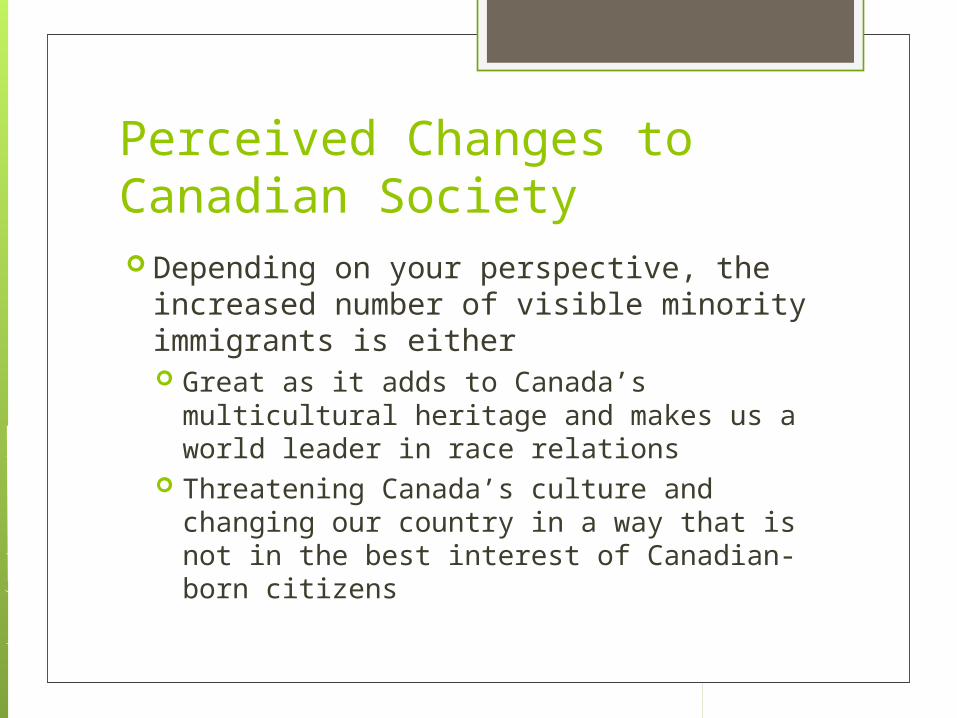
Perceived Changes to Canadian Society Depending on your perspective, the
increased number of visible minority immigrants is either Great as it adds to Canada’s multicultural
heritage and makes us a world leader in race relations
Threatening Canada’s culture and changing our country in a way that is not in the best interest of Canadian-born citizens
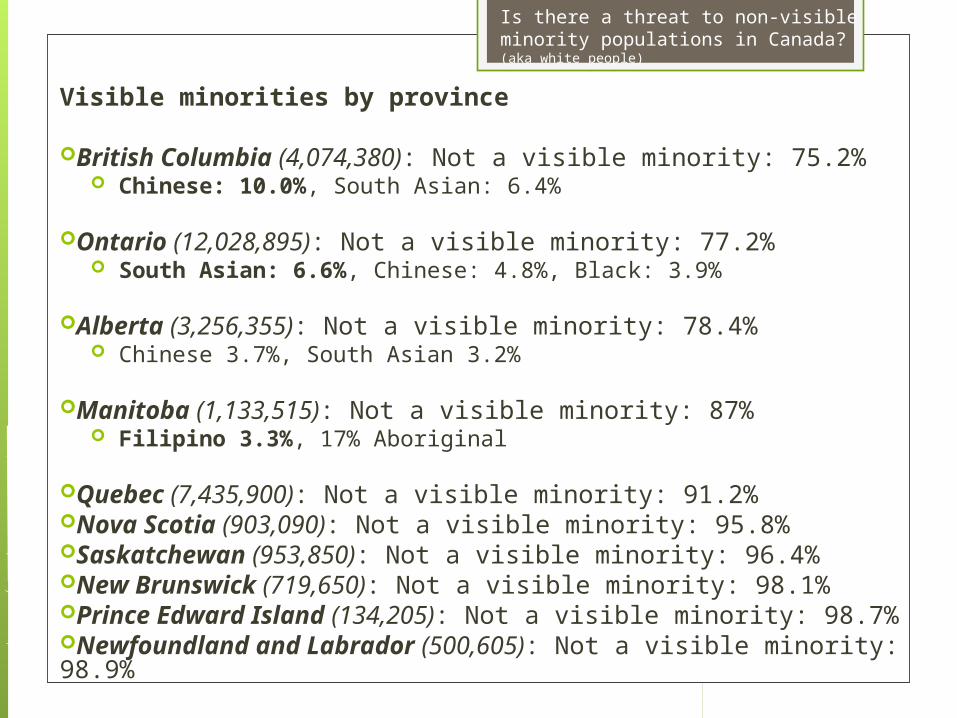
Visible minorities by province
British Columbia (4,074,380): Not a visible minority: 75.2% Chinese: 10.0%, South Asian: 6.4%
Ontario (12,028,895): Not a visible minority: 77.2% South Asian: 6.6%, Chinese: 4.8%, Black: 3.9%
Alberta (3,256,355): Not a visible minority: 78.4% Chinese 3.7%, South Asian 3.2%
Manitoba (1,133,515): Not a visible minority: 87% Filipino 3.3%, 17% Aboriginal
Quebec (7,435,900): Not a visible minority: 91.2%Nova Scotia (903,090): Not a visible minority: 95.8%Saskatchewan (953,850): Not a visible minority: 96.4%New Brunswick (719,650): Not a visible minority: 98.1%Prince Edward Island (134,205): Not a visible minority: 98.7%Newfoundland and Labrador (500,605): Not a visible minority: 98.9%
Is there a threat to non-visible minority populations in Canada? (aka white people)
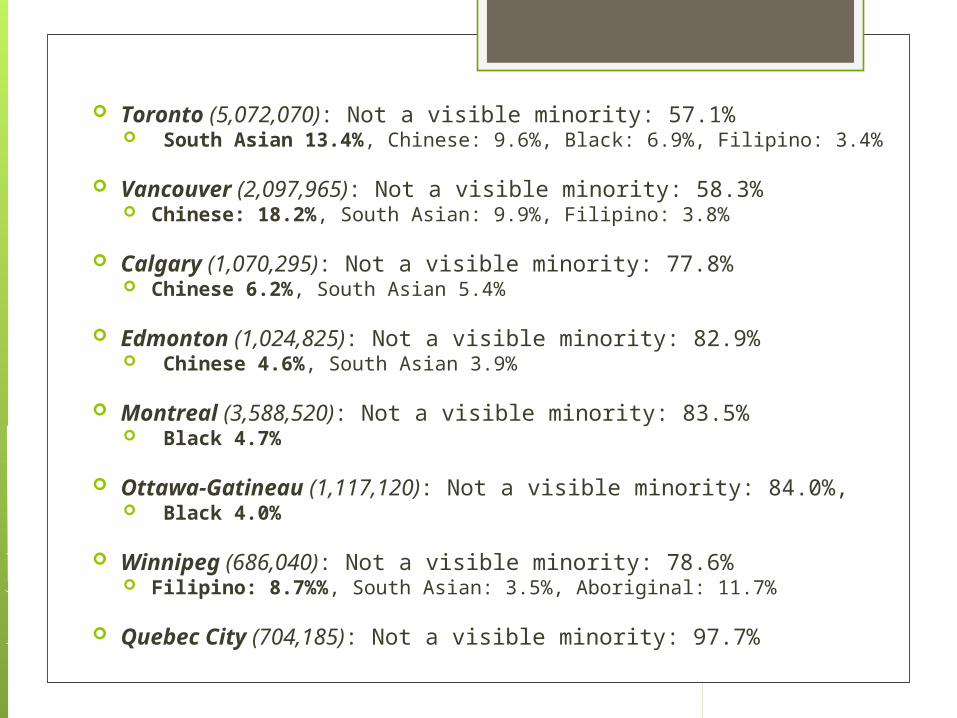
Toronto (5,072,070): Not a visible minority: 57.1% South Asian 13.4%, Chinese: 9.6%, Black: 6.9%, Filipino: 3.4%
Vancouver (2,097,965): Not a visible minority: 58.3% Chinese: 18.2%, South Asian: 9.9%, Filipino: 3.8%
Calgary (1,070,295): Not a visible minority: 77.8% Chinese 6.2%, South Asian 5.4%
Edmonton (1,024,825): Not a visible minority: 82.9% Chinese 4.6%, South Asian 3.9%
Montreal (3,588,520): Not a visible minority: 83.5% Black 4.7%
Ottawa-Gatineau (1,117,120): Not a visible minority: 84.0%, Black 4.0%
Winnipeg (686,040): Not a visible minority: 78.6% Filipino: 8.7%%, South Asian: 3.5%, Aboriginal: 11.7%
Quebec City (704,185): Not a visible minority: 97.7%