Canadian Council for Refugees Working together on behalf of refugees and immigrants .
Dr. Mark A. Grey
Immigrants and
Refugees in Iowa:
Past, Present and
Future

Mesquakie
– Sauk & Fox Tribes
1700’s
New Iowans
from Europe
Begin Arriving
1833
Arrive in Pella
from Holland
1847
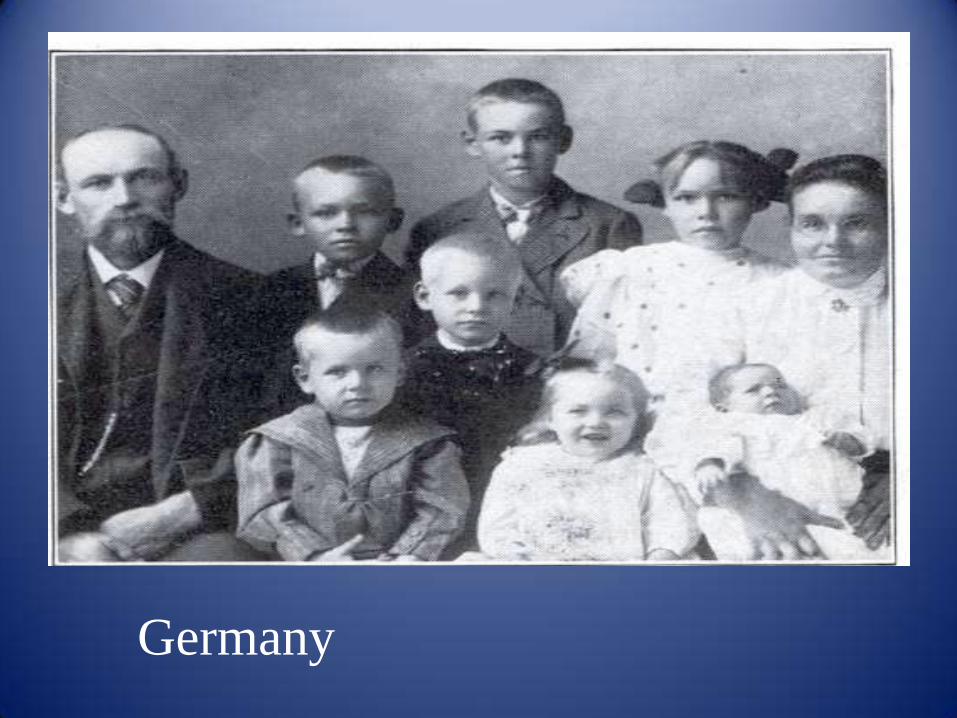
Arrive in
Davenport from
Germany
1848
Settlers Begin
Moving to
Central Iowa
1850’s
Heavy Immigration
into Northern Iowa
Counties from
Germany
1860’s
African-Americans
Migrate from Virginia
1880’s
First New Iowans
from Eastern &
Southern Europe
Arrive
1900
African-Americans
Migrate to Des Moines &
Waterloo
1920’s
Immigrate to Iowa
from Korea
1950’s
Arrive from
Southeast Asia
1975 -
Arrive from
Latin America
1970’s -
Arrive from
Sudan
1990’s
Arrive from
Bosnia, Croatia,
Serbia
1994 -
Arrive from
Mexicoo
1910-1930
Arrive from
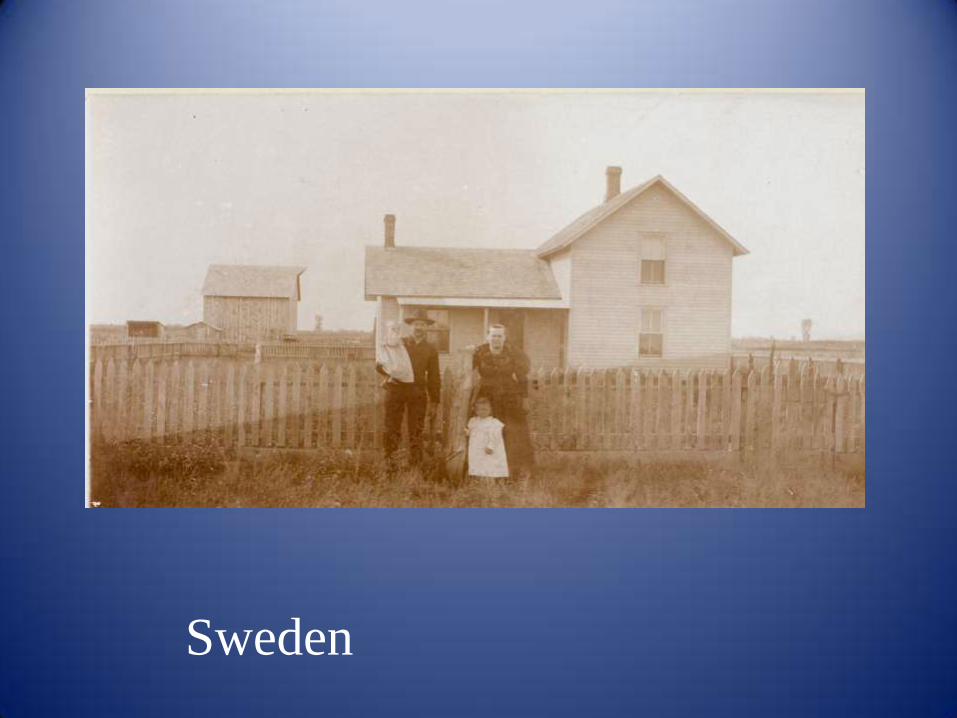
Sweden &
Wales
1840’s
Iowa’s Immigration and Refugee Resettlement Timeline
*Timeline adapted from the Iowa State Historical Society (Goldfinch Vol. 12 No.4)

Immigration and Iowa’s Early Population Growth
• 1836 Population: 10,531
• 1855 Population: 500,000
• 1890 Population: 2,231,853

“Day by day the endless procession moves on—a mighty army of invasion, which, were its objects other than peace, and holy, fraternal, cordial league with its predecessors, their joint aim to conquer this fair and alluring domain from the wild dominion of nature, would strike terror into the boldest hearts”
– Dubuque Report 1854

1869: Iowa Legislature created the Board of Immigration
• Book: Iowa: The Home for Immigrants (1870)
• 65,000 copies printed • 5 languages: English, German, Dutch, Swedish and Danish. • Distributed across the United States and Europe
• Invitation to Immigrants: To all Working Men, who live by honest toil, and would
thereby contribute their part toward the development of a free and prosperous state;
• …continued

• To all Landless Men and Women, of both the Old World and the New, who desire beautiful homes in the fairest portion of the green earth;
• To all Good Men and Women, who aspire to independence, either for themselves or their children after them, and who will contribute, either of mind or muscle, to carry Iowa forward to her grand and glorious destiny, this little book, with the information it imparts, and the counsel it gives, is respectfully offered

Denmark
Sweden
Germany
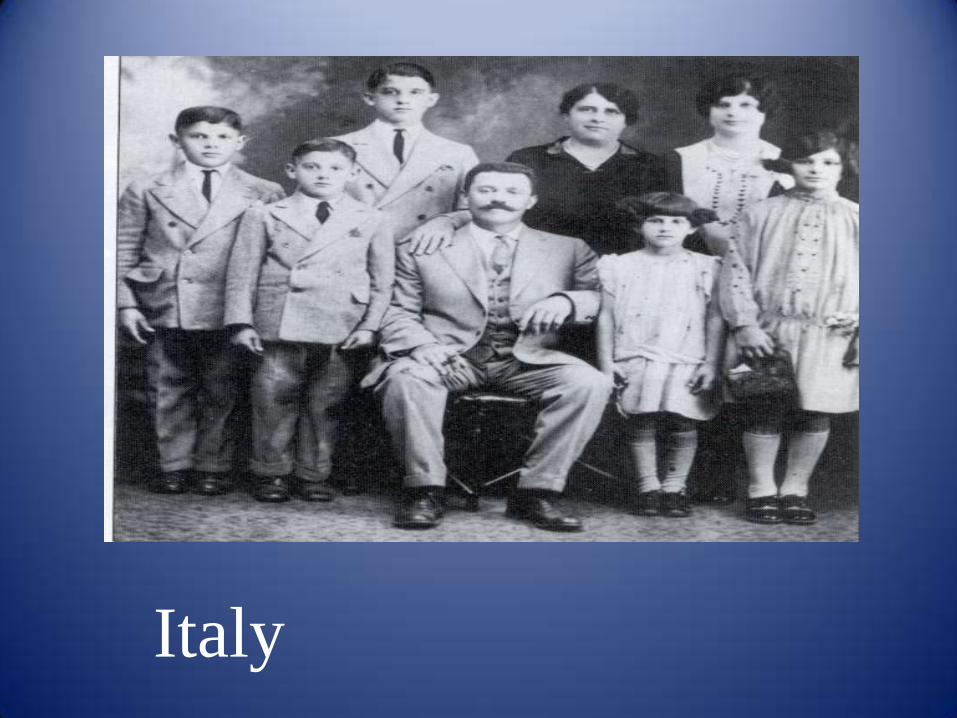
Italy

The Danish Immigrant Museum Elk Horn, Iowa
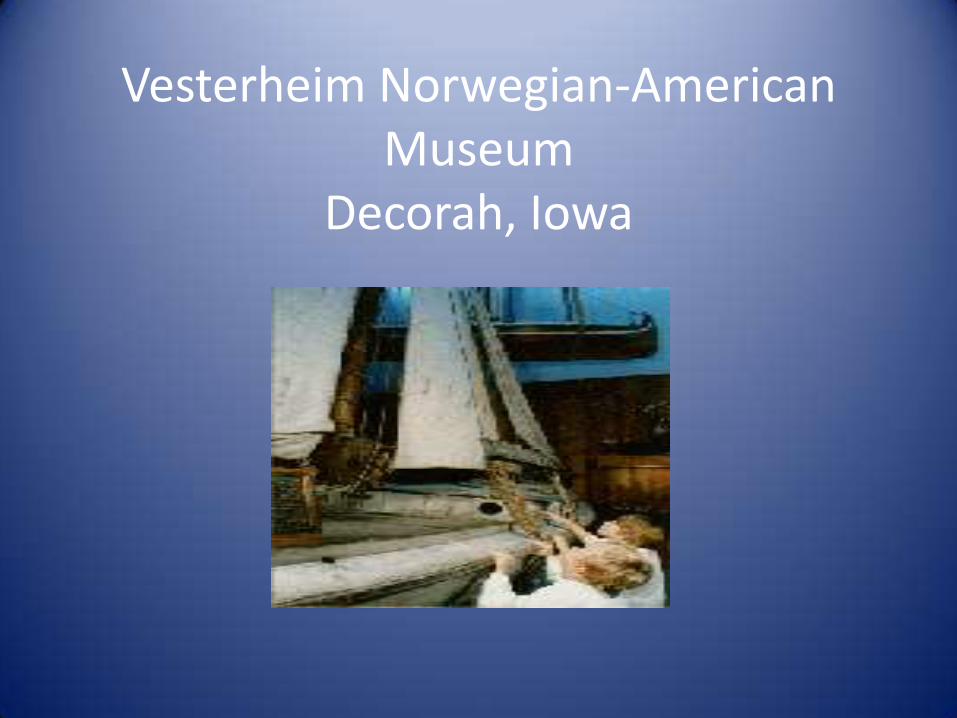
Vesterheim Norwegian-American Museum
Decorah, Iowa

Tulip Time: Pella

Czech and
Slovak
Museum:
Cedar Rapids
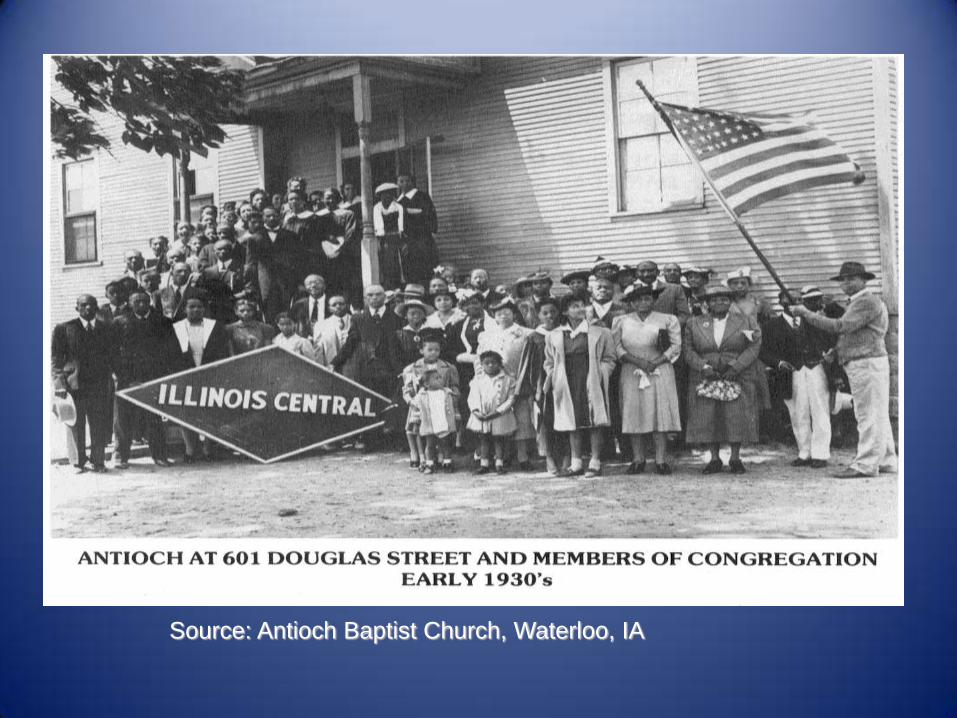
Source: Antioch Baptist Church, Waterloo, IA

Tai Dam ca. 1976

Sudan

Balkan Refugees ca. 1999

Mexico 1990s-
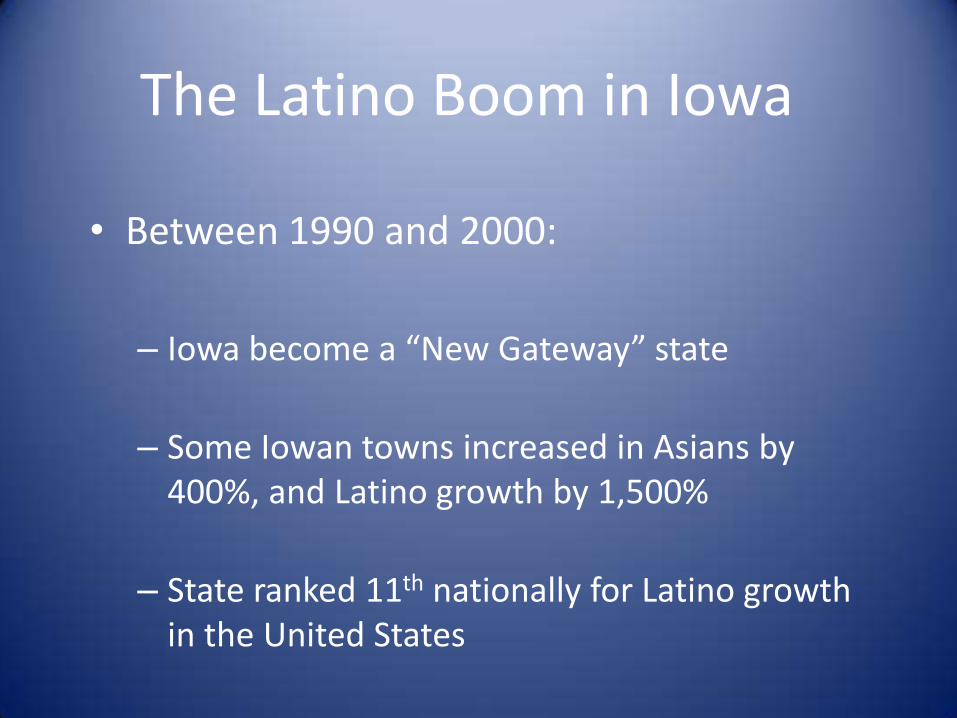
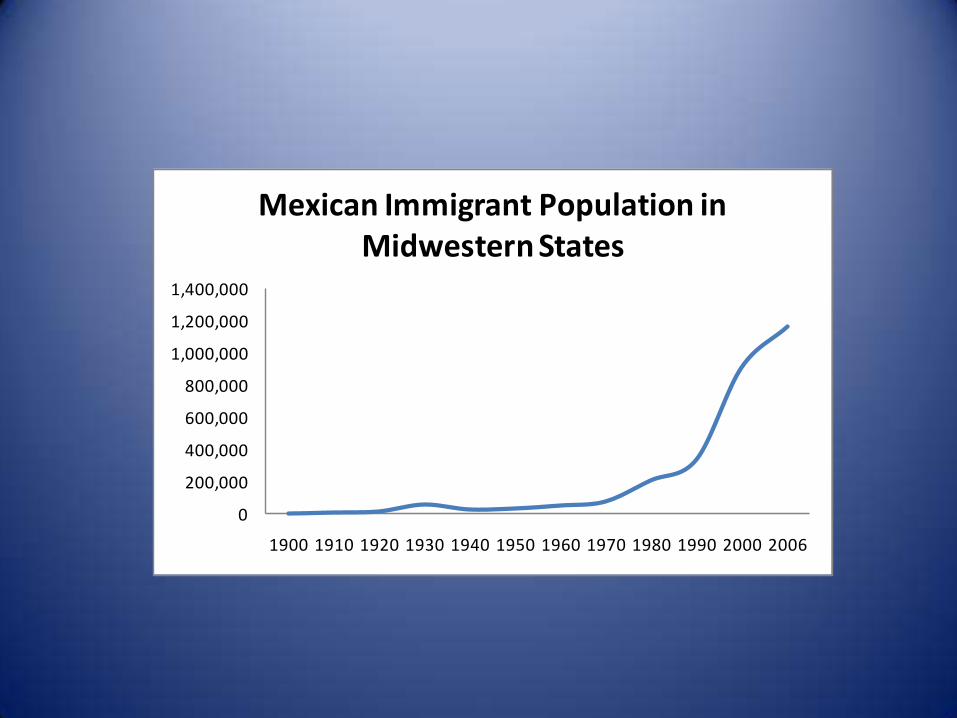
The Latino Boom in Iowa
• Between 1990 and 2000:
– Iowa become a “New Gateway” state
– Some Iowan towns increased in Asians by 400%, and Latino growth by 1,500%
– State ranked 11th nationally for Latino growth in the United States
0
200,000
400,000
600,000
800,000
1,000,000
1,200,000
1,400,000
1900 1910 1920 1930 1940 1950 1960 1970 1980 1990 2000 2006
Mexican Immigrant Population in Midwestern States

2010 Census: 151,544
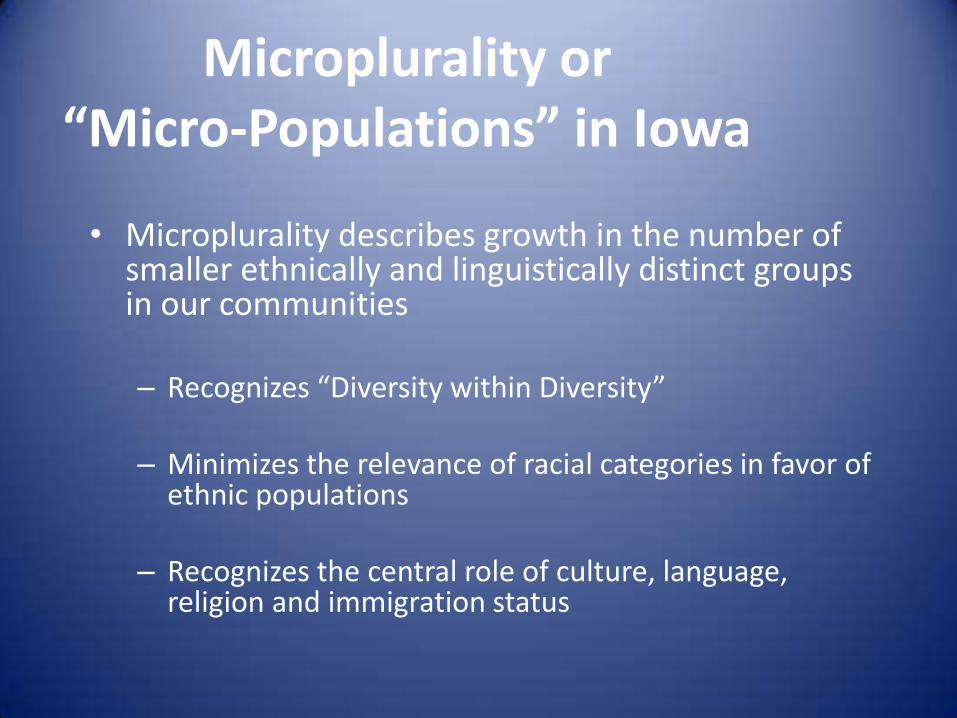
Microplurality or “Micro-Populations” in Iowa
• Microplurality describes growth in the number of smaller ethnically and linguistically distinct groups in our communities – Recognizes “Diversity within Diversity”
– Minimizes the relevance of racial categories in favor of
ethnic populations
– Recognizes the central role of culture, language, religion and immigration status

Examples of Microplurality
Growing Micro Populations in Iowa: – Southeast Asia (Hmong, Vietnamese, Burmese etc.) – East Asia (Chinese, etc.) – Former Soviet Union (Russia, Ukraine, etc.) – Ultra-Orthodox Jewish (Israel and East Coast) – African (Sudan, Somalia, etc.) – Central Pacific (Marshall Islanders, Paulau) – Ukrainian Pentecostals – Bhutanese from Nepali Refugee Camps – African Americans from Chicago and Detroit – Iraqi refugees – And many more…

The “Anglo Inversion”
• What do we call a town, state or school district when all of the “minorities” together outnumber the [former] white majority?
• “Majority-Minority”
• “Anglo Inversion” – In many Iowa communities:
• Everyone and no one is a “minority”


Looking to the Future: -Growth in Non-White Populations -Growth in the number and diversity of micro-populations -Urbanization -Challenges and Opportunities
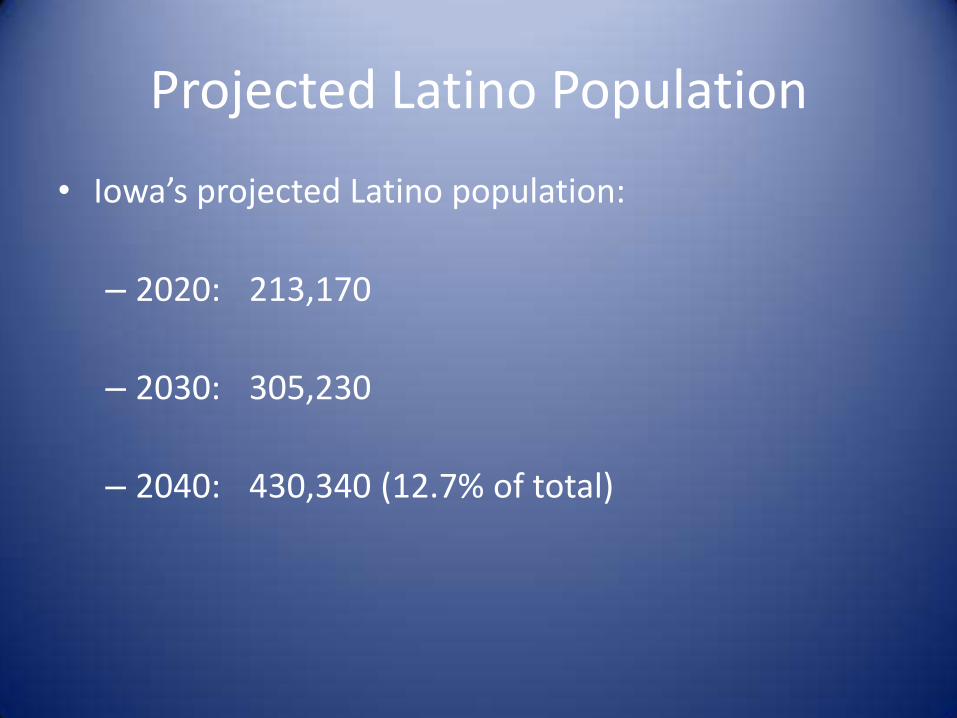
• Iowa’s projected Latino population:
– 2020: 213,170
– 2030: 305,230
– 2040: 430,340 (12.7% of total)
Projected Latino Population

Latinos as % of Counties in 2040
1. Crawford (52%) 2. Marshall (46.3%) 3. Buena Vista (45.4%) 4. Muscatine (38.9%) 5. Louisa (34.6%) 6. Woodbury (33.1%) 7. Franklin (23.9%) 8. Wapello (23.9%) 9. Wright (23.5%) 10. Polk (23.2%)
11. Sioux (19.8%) 12. Clarke (19.69) 13. Tama (19%) 14. Allamakee (18.5%) 15. Pottawattamie (18.1%) 16. Emmet (17.1%) 17. Osceola (14.4%) 18. Hamilton (13.5%) 19. Washington (13.3%) 20. Taylor (12.8%)
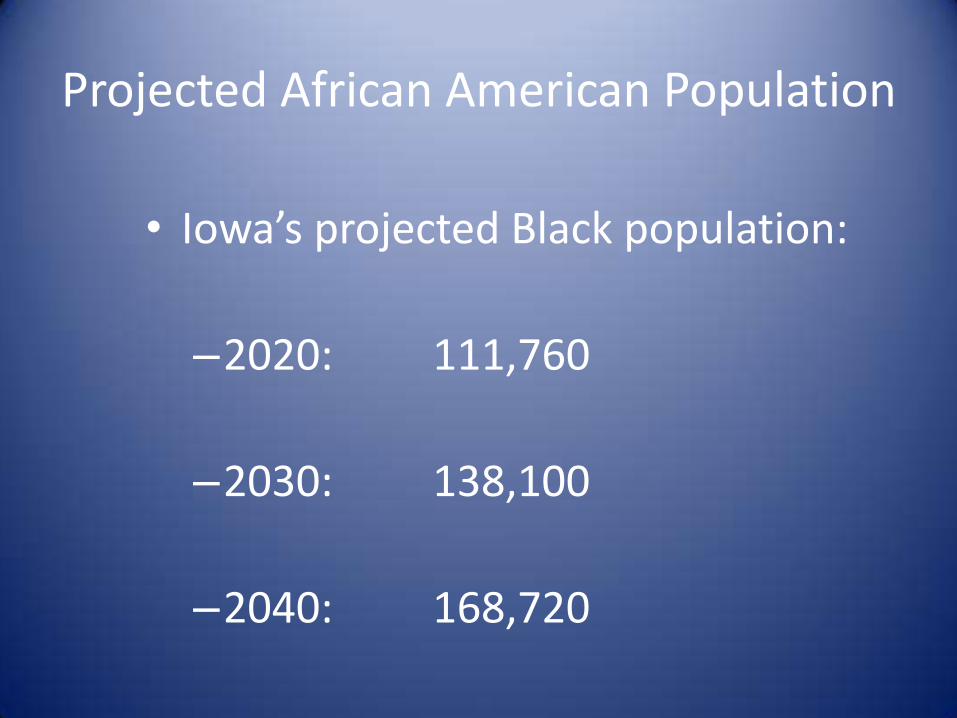
Projected African American Population
• Iowa’s projected Black population:
–2020: 111,760
–2030: 138,100
–2040: 168,720
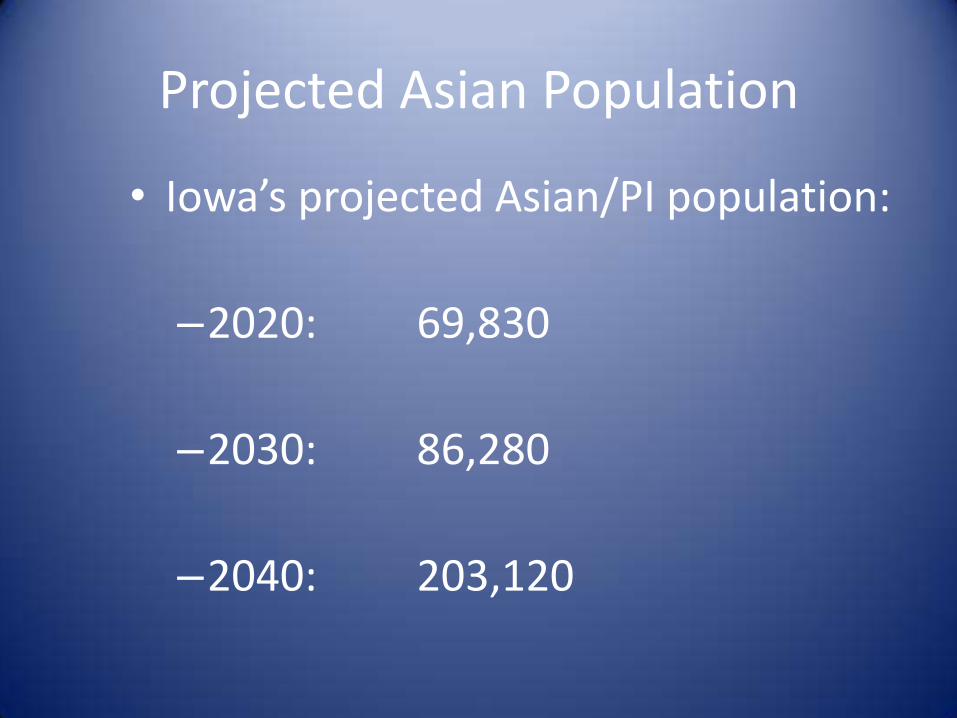
Projected Asian Population
• Iowa’s projected Asian/PI population:
–2020: 69,830
–2030: 86,280
–2040: 203,120
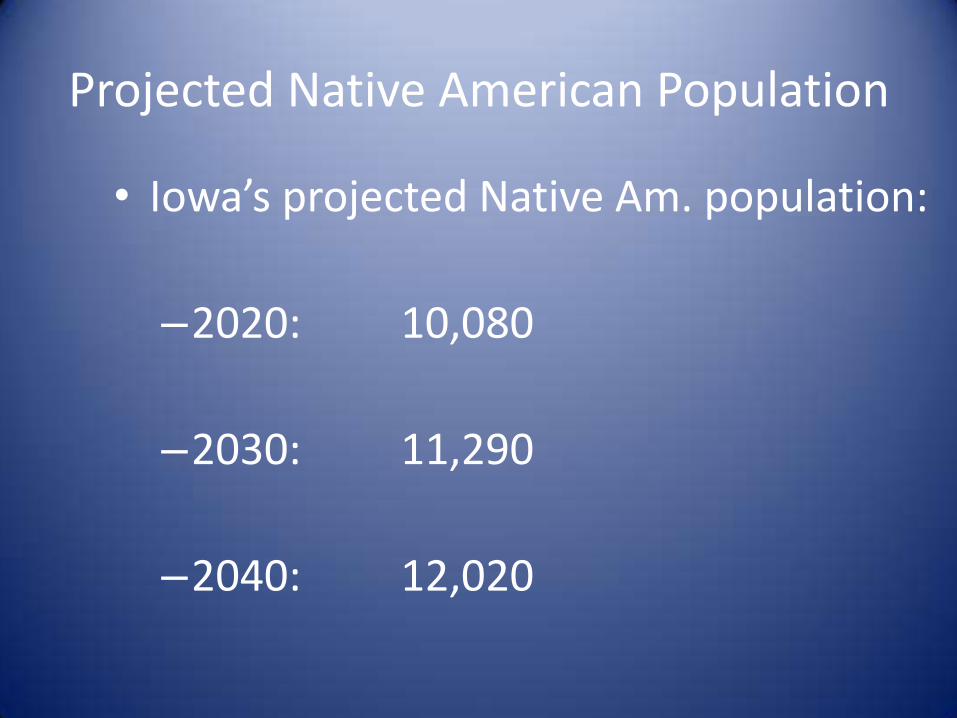
Projected Native American Population
• Iowa’s projected Native Am. population:
–2020: 10,080
–2030: 11,290
–2040: 12,020

Polk County Projections
• Year: 2015 2020 2030
Latinos 39,350 48,620 76,810
Black 29,520 32,940 40,200
Nat. Am. 960 1,000 1,020
Asian/PI 17,400 19,180 22,430
White 356,320 354,150 340,660

Thank You!
Dr. Mark Grey (319) 273-6496
University of Northern Iowa