
Immigrant returns to education and sheepskin effects ...
65
Immigrant returns to education and experience: Analysis of skill discounting in Canada Rapport de recherche pour l’obtention du grade de maîtrise presenté par: Juan Carlos González Ibarguen Sous la direction du professeur: Brahim Boudarbat Département de sciences économiques Université de Montréal, Canada June, 2006
Transcript of Immigrant returns to education and sheepskin effects ...

Immigrant returns to education and experience: Analysis of skill discounting in Canada
Rapport de recherche pour l’obtention du grade de maîtrise presenté par:
Juan Carlos González Ibarguen
Sous la direction du professeur: Brahim Boudarbat
Département de sciences économiques
Université de Montréal, Canada
June, 2006

RÉSUMÉ/ABSTRACT Cette recherche offre quelques explications au sujet des écarts de salaires entre les
immigrants et les Canadiens à l’aide de donnés des recensements Canadiens. Nous étudions les sources de cet écart en mesurant les rendements à l'éducation en prenant en compte les effets de diplômes. Le texte présente évidence d'une valorisation différenciée des immigrants sur le marché du travail selon leur région d'origine. On trouve que le marché du travail pénalise spécialement les immigrants provenant des régions d’origine non traditionnelles comme l’Asie et l’Amérique Latine. En plus, le rendement à l’expérience du travail au Canada semble s'améliorer pour les immigrants récents mais les rendements à l’expérience du travail à l’étranger sont très bas. Nos résultats indiquent aussi que le rendement d’une année d'instruction au Canada est inférieur pour les immigrants que pour les Canadiens. Cependant, pour les immigrants le rendement d’une année d'instruction à l’étranger est similaire au rendement d’une année d'instruction au Canada. Finalement, on observe que les effets des diplômes universitaires sont plus importants pour les immigrants.
This research offers evidence about the wage differentials between immigrants
and Canadians using the Canadians censuses. We investigate the sources of this wage differential by estimating returns to schooling, taking into account sheepskin effects. The paper presents evidence of a differentiated labor market valuation of immigrants according to their region of origin. We find that the Canadian labor market specially penalizes immigrants from non-traditional source regions like Asia and Latin America. Additionally, we observe improvements in the returns to Canadian working experience for recent cohorts of immigration. However, the immigrants’ returns to foreign experience are remarkably small. Furthermore, our results indicate that the return to one more year of Canadian schooling is smaller for immigrants than for native-born. In addition, immigrants’ returns to foreign schooling seem to be similar to immigrants’ return to Canadian schooling. Finally we observe that sheepskin effects have larger returns for immigrants than for native-born the higher the diplomas.
i

INDEX
RÉSUMÉ/ABSTRACT ................................................................................................................................. i
List of Tables................................................................................................................................................ iii
1. INTRODUCTION .................................................................................................................................... 1
2. PREVIOUS LITERATURE .................................................................................................................... 4
3. THEORETICAL FRAMEWORK........................................................................................................ 10 3.1. Returns to schooling ......................................................................................................................... 10 3.2. Job market signaling: Introduction to sheepskin effects ................................................................... 19
4. ESTIMATION APPROACH................................................................................................................. 21
5. DATA....................................................................................................................................................... 24
6. EMPIRICAL RESULTS........................................................................................................................ 28 6.1. Results of specifications 1 to 4 using unemployment rate ................................................................ 28
6.1.1. Returns to experience ........................................................................................................... 28 6.1.2. Birth region effects and knowledge of official languages effects ........................................ 32 6.1.3. Sheepskin effects and Returns to schooling ......................................................................... 34
6.2. Results from estimating specification 4 with different labor market related variables ..................... 38
6.2.1. Cohort effects ....................................................................................................................... 38 6.2.2. Returns to experience ........................................................................................................... 40 6.2.3. Returns to schooling............................................................................................................. 42
7. CONCLUSION....................................................................................................................................... 43
8. TABLES .................................................................................................................................................. 46
9. REFERENCES ....................................................................................................................................... 58
ii

List of Tables
Table 1:Sample Means by immigrant status................................................................................................. 46 Table 2:Schooling by immigrant status and Census year (males) ................................................................ 49 Table 3:Highest degree by immigrant status and Census year (males) ........................................................ 49 Table 4:Knowledge of official languages by immigrant status and Census year ......................................... 49 Table 5:Immigrants by birth region and Census year................................................................................... 50 Table 6:Sample average weekly wages by schooling, immigrant status and census year ............................ 50 Table 7:Sample average weekly wages by highest degree, immigrant status and census year .................... 50 Table 8:Sample average weekly wages by region of origin and census year ............................................... 51 Table 9:Estimations from specifications 1 to 4 ........................................................................................... 52 Table 10:Estimations from specification 4.1 to 4.3 ...................................................................................... 55 Table 11:Returns to Canadian and Foreign Experience ............................................................................... 30 Table 12:Evolution of Immigrants Returns to Canadian experience............................................................ 31 Table 13:Evolution of Immigrants Returns to foreign experience ............................................................... 32 Table 14:Birth region effects for different specifications............................................................................. 33 Table 15:Sheepskin effects........................................................................................................................... 35 Table 16:Returns to Canadian and foreign school years .............................................................................. 37 Table 17:Cohort Effects (eqs. 4.1 to 4.3)...................................................................................................... 39 Table 18:Returns to Canadian and foreign Experience (eqs. 4.1 to 4.3) ...................................................... 41 Table 19:Return to Canadian and foreign school years (eqs. 4.1 to 4.3) ...................................................... 43
iii

1. INTRODUCTION Immigration is an important issue for Canada. The government has several reasons to
promote it. On the one hand, the ageing of working population is augmenting. On the
other hand, the fertility rates are small. Dolin and Young (2004) report a 36 percent
increase of the population between 45 and 64 years of age from 1991 to 2001 and a
fertility rate of 1.51 children per family in 2001. Under these conditions they point out
deaths will surpass births in 20 years. Hence, Canada is in a position where it needs to
increase immigration to keep its labor market working. As a result of this challenge they
say the economic component of Canada's immigration program looks for immigrants in
different ways, among which the skilled worker class is an important group, to fulfill the
needs of Canadian labor market. According to Grant and Sweetman (2004) the 2001
Census reports 5.4 million foreign-born persons, that represent about 18.4 percent of the
total population. However, despite these facts, Grant and Sweetman (2004) argue that
there are at least three characteristics of recent immigration that concerns policy makers
and researchers. Firstly, they point out its urban nature contrary to the rural nature of
earlier decades; Secondly, the changes in demographic characteristics due to
modifications of the immigration policy which has resulted in an increase of immigrants
coming from non-traditional source countries but also in an increase of human capital
endowments; Finally, they say that immigrants have suffered a deterioration in their labor
market assimilation compared to earlier cohorts. Moreover, Reitz (2005) calls attention to
the fact that since Canada has moved towards a knowledge-based economy there is
especial interest in the “[...] effective use of immigrants’ skills in the changing labor
market [...]” (Reitz, 2005, p.2). In order to meet this objective, in the case of skilled
worker class, there exists a point accumulation method to assess the qualifications of the
applicants with a maximum score of 100 points and a current pass mark of 671. Within
this assessment, education, language proficiency and work experience have an important
share of all the points2. The reason is to attract individuals who can meet the labor market
requirements and have a successful integration to Canada. Thus, the system is supposed
1 http://www.cic.gc.ca/english/skilled/assess/index.html 2 Ibidem.
1

to attract immigrants with outstanding skills that will allow them to pass the mark.
Nonetheless, there are other components of the immigration program that do not have the
same goal but humanitarian purposes and might not attract skilled immigrants. For
instance, in the case of refugees Riddell and Ferrer (2004) mention that selection bias
could be in the worst case negative if conditions in source countries do not allow an
efficient human capital accumulation. Even with these different components of the
immigration system Green and Worswick (2004) present evidence of similar assimilation
patterns from different visa group immigrants. Furthermore, Baker and Benjamin (1994)
and Bloom, Grenier and Gunderson (1995) show evidence concerning the worsening in
the assimilation of the most recent cohorts of immigrants. More recently, Reitz (2005)
and Alboim, Finnie and Meng (2005) among others, call attention to the fact that
immigrants coming with foreign education earn less than Canadians with the same
credentials. Additionally, Reitz (2005) indicates that despite the fact that recent cohorts of
immigrants have, in average, higher credentials relative to native-born Canadians, a
downward earnings trend persists, especially for non traditional source countries.
Furthermore, Aydemir and Skuterud (2005) shows that additionally to the deterioration in
immigrants’ earnings due to the shifts in region of origin, the declines in returns to
foreign experience explain notably this deterioration. These results are perturbing,
especially since there is an important amount of immigrants coming as skilled workers
and the new Immigration and Refugee Protection Act emphasizes on human capital
Tolley (2003).
Looking at all these facts, the question concerning the causes of male immigrant
wage deterioration relative to male native-born Canadians seems important to us.
Therefore, this research will attempt to provide evidence regarding to what extent,
education and experience of immigrants are valued relative to native-born in the
Canadian labor market. Particularly, we will focus on the role of schooling and diplomas.
The study will also examine the role of the region of origin in the remuneration of
immigrants. Finally, we will inspect the return to Canadian experience for both groups
(immigrants and native-born). We believe that if there are information asymmetries in
labor market and employers are not familiar with or do not recognize experience,
schooling and diplomas of the immigrants, there will be immigrants receiving smaller
2

wages than their Canadian counterparts. The failure in the recognition of foreign
education and experience by the labor market can complicate the job search in the new
country as it will be harder for immigrants to prove their skills to potential employers. In
some cases this can lead immigrants to accept jobs for which they are overqualified or to
accept jobs different from their area of expertise due to legal restrictions in certain areas.
Additionally, if years of education have a different value for the labor market than
diplomas and there are asymmetries in the labor market, it is reasonable to suppose
different rewards for immigrants’ educational attainment and credentials. Finally, we try
to see if immigrants that come from countries not sharing similar background with
Canada will find it more difficult to integrate into the labor market. It is reasonable to
consider that immigrants coming from countries with dissimilar political and economic
institutions and economic development will find it harder to adapt to the Canadian
society and to enter into the labor market successfully.
In order to carry out this research, we use a regression analysis using a variation
of the Mincer log-wage equation to estimate returns to education and experience. The
sample for the study is composed by fulltime-working permanent residents and native-
born males from pooled data of the 1991, 1996 and 2001 Public User Micro Files of the
Canadian censuses. We find that returns to Canadian experience are lower for male
immigrants than for male native-born. Additionally, we observe foreign experience has a
trivial value relative to Canadian experience. What is more, our results let us see that
while immigrants’ returns to Canadian schooling are lower relative to native-born,
sheepskin effects are larger for immigrants. Regarding immigrants’ returns to foreign
schooling, we come across evidence that supports these are similar to the immigrants’
returns to Canadian schooling. Moreover, our outcome shows us cohort deterioration
with some recovery for the most recent cohort (1995-2000). Finally, our results also
indicate that shifts in region of origin plays an important role in the deterioration of
immigrants’ wages.
Understanding of how the labor market rewards immigrants’ characteristics
relative to Canadian is essential for understanding the problems that immigrants have to
face in order to integrate to Canadian society. In this sense, this paper adheres to the
effort of the current Canadian immigration literature for increasing the knowledge about
3
immigrant returns to schooling and experience. Nevertheless, our study has limitations.
On the one hand, a difficulty arises in evaluating the returns to schooling and experience
by class of immigrant since the Canadian census lacks variables with detailed information
regarding immigrant class. For this reason, the analysis focuses only on male permanent
residents and native-born Canadians. A second limitation comes from the fact of using
public user data files, which confines to some extent our sample and the detail of the
variables. Nonetheless, we consider that the results presented here are relevant and
provide useful information for further studies on this matter. The following paper is
divided as follows: Section 2 revises previous articles; Section 3 summarizes the theory
behind returns to education; Section 4 clarifies the estimation approach; Section 5 gives a
basic descriptive analysis of the data; Section 6 explains the results of the econometric
analysis and finally, Section 7 presents the conclusions.
2. PREVIOUS LITERATURE
There is numerous literature concerning immigrants' earnings profile and assimilation to
host country, especially addressing the United States. Among this vast literature, the
seminal paper of Chiswick (1978) regarding the earnings of foreign-born men in the US
labor market is an important point of reference regarding immigrants’ returns to
schooling and experience. Chiswick’s cross-section analysis studies the effects of foreign
birth and the length of time in the host country on the earnings of immigrants based on
the human capital earning function developed by Mincer (1974). Chiswick (1978) finds
that immigrants’ earnings growth is fairly high and estimates an overtaking time period
between 10 and 15 years for immigrants to catch up native earnings. In his research
Chiswick establishes the common model based on Mincer’s theory that later on is used
and modified at some extent by Borjas (1985, 1995), which questions the empirical
soundness of using only one cross-section analysis. In turn, Borjas develops a well
known cohort analysis using data from different censuses and a modified version of
Chiswick’s specification. Results from Borjas show that cross-section approach
overestimates the earnings growth and do not take into account the immigrant quality
deterioration between cohorts.
4

Regarding Canada, there is growing empirical literature to unveil the causes of
wage disparity between immigrants and Canadians. Covering the period from the postwar
to the beginning of the seventies Abbott and Beach (1993) examine the evolution of
immigrant earnings differentials. They use the 1973 Job Mobility Survey, which due to
the direct measure of experience, allows them to use age of individuals to measure birth-
year effects. This permits measuring the differences of earnings-experience and earnings-
years-since-migration between birth cohorts as well as analyzing the role of a direct
measure of experience in the earnings for both male native-born Canadians and
immigrants. Their results indicate that earnings differentials between immigrants and
native-born Canadians started to amplify in the middle of the 1960’s due to a lower
assimilation-earnings profile and a decreasing earnings-experience profile together with
an increase in native-born Canadians earnings profile.
For their part, Baker and Benjamin (1994) examine the assimilation of immigrants
during the 1970’s and 1980’s using the 1971, 1981 and 1986 Canadian censuses. The
analysis they perform to calculate the differences across and within cohorts use estimates
of cross-section regressions, which permits parameters to be different for each year,
contrasting with pooled regressions. Furthermore, the use of three censuses allows them
to obtain two pairs of assimilation estimates and examine the stability of the assimilation
profile throughout the 1970-1985 period. They find small immigrant assimilation all over
the three censuses. What is more, they find that many arrival cohorts do not present
earnings growth. In the case of earlier cohorts the low assimilation rate is explained by
the small earnings gap. However, unlike the earlier cohorts which had smaller entry
earnings differences relative to native-born, the recent cohorts enter with lower entry
earnings but do not present higher assimilation rates. Alternatively, with a different
model specification, Bloom, Gernier and Gunderson (1995) use pooled data from same
censuses and arrive to similar results to Baker and Benjamin (1994). Nonetheless, the
analysis of Bloom, Gernier and Gunderson (1995) shows more clearly the effects of
source country composition changes in the entry and assimilation profiles. These authors
observe the entry effects being substantially more negative for non-traditional source
countries than for traditional ones even though for both groups of countries there is a
decreasing assimilation pattern for recent cohorts. However, they also calculate that
5

immigrants of post-1970 cohorts from non-traditional sources will never catch up with
native-born wages in a reasonable amount of time compared to the pre-1970 cohorts that
completed assimilation within fifteen years. Results from their estimates of the 1971
cohort are similar to those obtained by Abbott and Beach (1993) for 1973, as well as the
worsening position tendency of recent immigrants found by Baker and Benjamin (1994).
In a different manner, Schaafsma and Sweetman (2001) use a two step procedure
for several cross-section analysis of the 1986, 1991 and 1996 censuses to investigate if
earnings differences between immigrants and native-born Canadians of the same age (and
other similar characteristics) are a function immigrants’ age at immigration. Concerning
education, they detect that immigrants arriving at younger ages have similar returns to
schooling than native-born while for older immigrants the returns diminish. However, if
immigrants’ schooling is measured as Canadian and foreign, they notice that although
there are similar returns for both (Canadian and foreign schooling), these are vaguely
smaller than the returns to schooling for native-born Canadians. Moreover, they notice
that the age of immigration has an important impact on the acculturation of visible
minorities with a mother language different to English. For instance, they observe
immigrants that arrived at around the age of 15 and 18 have a smaller amount of
schooling years than immigrants that arrived at younger or older ages. Finally, regarding
work experience, they observe returns to foreign experience are insignificant for
immigrants.
Alternatively, Green and Worswick (2003, 2004) carry out two analyses using the
Immigrant Database (IMDB) and a series of surveys of Consumer Finance (SCF) from
the years 1981, 1982, 1984-1997. To undergo the analysis the authors create and organize
cohorts to reflect the conditions of the economy and immigration policy. In the case of
the immigrants’ sample, they can define cohorts by education level since the IMDB is a
panel that links education at arrival and earnings. However, the SCF does not permit to
do this. Therefore, they restrict the analysis to males between 25 and 64 years of age,
who are considered to have completed their education and entered the labor market. In
their first analysis Green and Worswick (2003) try to measure the importance of cohort
and macroeconomic effects in the presence of human capital investment. Since human
capital theory predicts lower entry wages and higher earnings growth, they try to measure
6

net present values for different cohorts using the “overtaking” tool from Mincer (1974).
While they find important decreases in entry earnings from the 1980’s and a faster
decrease during the 1990’s, macroeconomic conditions do not help to explain this
decrease completely. When comparing with native-born Canadians cohorts of new labor
market entrants, they find that macroeconomic conditions explain about 50 percent of the
cross cohort decrease. Additionally, the use of net present values shows that immigrants
in the nineties are not a lot worse than immigrants from the eighties. However, they
identify like Bloom, Gernier and Gunderson (1995) and Baker and Benjamin (1994) that
changes in composition of source countries have an important role in the earnings
decrease, thus in the net present values. In their second analysis, using the same sample,
Green and Worswick (2004) investigate the sources of the fall in entry earnings for
Canadians and immigrants. They consider that by estimating the earnings differential for
immigrants and Canadians that entered to the labor market at the same time, they will be
able to remove the effects of Canadian economy affecting both groups. The purpose of
doing this is to corroborate the wage differences among native-born Canadians and
immigrants once changes in Canadian economy are taken into account. One advantage of
the data they use over the census data is that it contains an immigrant visa group variable.
So, the authors break down the data by visa group and country of origin. Differentiating
by type of visa, they test if the point system criterion has any effect in the wage
differential. Since the point system criterion has the objective of selecting individuals by
their skills and adaptability to Canada, it should make it easier to the immigrants accepted
through this method to transfer their human capital. They find that the general trend is
similar to the other class of immigrants. Like in their previous study they discover that an
important decrease in wages is related to the country of origin. Green and Worswick
(2004) conclude that eighty percent of the fall in entry earnings can be explained by the
effect of new entrants (36 percent), changes in the composition of source countries (30
percent) and a decrease in the returns to foreign experience (15 percent).
Further, Frenette and Morissette (2003) use censuses from 1981, 1986, 1991,
1996 and 2001 and the same methods of Baker and Benjamin (1994) and Grant (1999) to
examine what would be necessary for recent immigrants’ cohort to achieve wage
convergence with native-born. Their data show increasing earnings deterioration during
7

the 1980’s that stopped between 1990 and 1995. They show also a restarting of the
decrease and in 1995 where immigrants show 45 percent lower earnings. Nevertheless,
they detect that between 1996 and 2000 the relative entry earnings improved and by 2000
they moved back to the mid-1980’s value. Contrasting Bloom, Gernier and Gunderson
(1995), Frenette and Morissette (2003) find that immigrants’ wages from the 1975-1979
cohort converge almost to the native-born Canadians’ wages after fifteen years after the
arrival year while for immigrants from the eighties there still is a large wage difference
after 15 years. What is more, they explain that unless immigrants’ cohorts from the
nineties experience a high wage growth rate it will take longer time to converge with
their native-born counterparts. Alternatively, Warman and Worswick (2004) using the
same censuses as Frenette and Morissette (2003), study the earnings performance of
immigrants in urban areas from a completely different approach. They use mostly
graphics and wage mean values to carry out their study. Like previous studies, they find
that immigrants’ relative earnings of more recent cohorts decline for all the cities they
study. Moreover, they observe that when comparing with native-born Canadians,
economic integration of immigrants in urban areas is lower. Nevertheless, they find a
turnaround for men from the 1996-2000 cohort, which present higher earnings than the
1991-195 cohort in the first five years after arrival.
From a different stance, Ferrer and Riddell (2004) explore how the Canadian
labor market rewards the education and skills of immigrants. They include both, the
contribution of diplomas and education attainment in the wage analysis, conversely to
other studies that use just one of these variables. With this approach, they seek to separate
the effect of program completion from the effect of years of schooling. Furthermore, they
use age at immigration to distinguish between Canadian and foreign education. Ferrer
and Riddell (2004) use a sample of full time male workers by pooling the 1981, 1986,
1991 and 1996 censuses. Their study shows that immigrants’ schooling years and
experience are rewarded less than those of native-born Canadians. Surprisingly, they
discover that immigrant credentials are equally valued and sometimes more valued than
Canadian credentials. Regarding the effects of region of origin they show that the returns
to education and to credentials change according to the region. For example, for
individuals coming form England/United States and Africa the returns are similar to
8

native born Canadians but for immigrants from Europe, South America and Asia they
find that education is largely discounted whereas degrees are not.
From the same perspective of Ferrer and Riddell (2004), Alboim, Finnie and
Meng (2005) use the Literacy Skills Used in Daily Activities database for 1989 to
uncover the effects of foreign and Canadian education on immigrants’ wages. The main
advantage of this database compared to the census data used by Ferrer and Riddell (2004)
is that it has direct measures of foreign and Canadian schooling as well as individual
reading tests in English and French. Furthermore, the database allows them to separate
foreign from Canadian working experience. They find that after controlling for explicit
measures of foreign and Canadian education and experience the entry wage gap between
native-born Canadians and immigrants practically disappears. Moreover, they notice that
foreign experience and foreign education are highly discounted, especially for non-white
minorities. Nonetheless, they observe that when using a sheepskin effects approach;
immigrants with a foreign degree that obtain a Canadian degree receive similar returns
compared to their native-born counterparts. According to them, this particular finding
seems to show that a Canadian diploma serves to make a foreign credential more
meaningful. Then again, Sweetman (2004) carries out another effort to disclose the way
Canadian labor market rewards the immigrants’ skills from a slightly different angle.
Sweetman (2004) uses the censuses of 1986, 1991 and 1996. Moreover, he takes into
account the sheepskin approach used by Ferrer and Riddell (2004). However, he includes
a variable referring to the quality of immigrants’ education in their source countries. In
order to do that he uses an average score from Hanushek and Kimko (2000). This average
score is derived from the data of international standardized tests that are used to measure
quality of education. By using this variable, he finds that immigrants coming from
countries with poorer quality of education receive lower returns to education and
experience than immigrants coming form countries with better quality of education.
Additionally, he observes that education at the source country does not affect the returns
of immigrants entering to Canada at a young age and who completed their education in
Canada. More recently, Aydemir and Skuterud (2005) carry out a cohort study for
estimating the deterioration of entry earnings of immigrants. In their study they pool data
from the 1981, 1986, 1991, 1996, and 2001 Canadian censuses. One of the remarkable
9

parts of this study lies in the specifications to be estimated. Aydemir and Skuterud (2005)
start estimating earnings equations comparable to those of Bloom, Gernier and
Gunderson (1995). However, with the aim to disentangle the interpretation of years since
migration variable, they split the variables regarding immigrants’ years of schooling and
years of experience into their Canadian and foreign components. Thus, creating four
variables they have the flexibility to isolate each effect. Furthermore, they use provincial
unemployment rates interacted with immigration dummy instead of common fixed year
effects to capture for current period effects. Their results are in line with those of Alboim,
Finnie and Meng (2005), Ferrer and Riddell (2004), and Sweetman (2004) among others,
which suggest that declines in return to foreign experience (between one quarter and one
half) and shifts in the country of origin (one third) explain an important part of the
deterioration in immigrant entry earnings.
3. THEORETICAL FRAMEWORK
In this section we will give a synopsis of the common knowledge among economists
regarding returns to schooling. With that purpose in mind we will follow and summarize
Ehrenberg (2004), Pons (2004), Card (2000) and Willis (1986) who have a complete
review of the underlying theory and some econometric issues behind our research.
3.1. Returns to schooling
Ehrenberg (2004) says investments in education and training are known as human capital.
This human capital has, like physical capital, a value in the market. Ehrenberg (2004)
explain Labor economics analyzes why people under the same circumstances invest
different quantities in human capital and how the market rewards this investment. On the
one hand, human capital investments involve two major costs for a person: direct costs
and opportunity costs. The first represents the financial investment dedicated to studies,
like tuition fees, money spent on books and tools; the second represents the money a
person stops receiving for the hours he spends studying. On the other hand, a person that
10

invests in human capital expects a benefit through a higher stream of future earnings, thus
expecting higher returns for their investment relative to someone that has lower human
capital. But for these higher earnings to happen, Willis (1986) says that more schooled
persons should be significantly more productive and that on a long-run equilibrium the
schooling-earnings link would imply that anyone will have incentive to change his
schooling level. However, Willis (1986) states that among human capital literature it is
difficult to stick to full theoretical considerations since these can sometimes represent
difficulties for applied analysis under limited data and econometric methodologies.
Bearing this in mind, we follow Pons (2004) to derive the human capital investment
model developed by Becker (1964). For simplification purposes Pons (2004) considers
that investment is done in a unique period and that benefits are collected in a stream
period of time.
According to Pons (2004), a person that chooses at a certain age an activity X
which needs certain amount of schooling will have, after subtracting the tuition costs of
the first period, a net earning stream of . The present value of this stream is: nxxxx ...,, 321
∑=
++=
N
nn
n
ix
XV0
1)1()(
with i being a fix discount rate. If there is another activity Z, which does not require any
investment in education, and has a z1,z2,z3,...zn net earnings stream with a net present
value of:
∑=
++=
N
nn
n
iz
ZV0
1)1()(
Then the net present value benefits from choosing X instead of Z can be written as:
∑=
++−
=−=N
nn
nn
izx
ZVXVd0
1)1()()(
Recalling that X has costs only for the first period, Pons (2004) says that the cost
from choosing X instead of Z can be expressed as the difference from the net earnings
from the first period C=x0-z0 while the benefits R can be expressed as the net present
value of the differences in net earnings for the following periods kn=xn- zn (with n=1,
2,...N). Hence, we can write the benefit from choosing X as:
11

CRCi
kd
N
nn
n −=−+
= ∑=
+1
1)1(
Like any other investment decision, a person will compare the net present value of
benefits with the costs. So, a person that is thinking about an additional year of schooling
will compare the present value of his net future benefits with the costs of such
investment. He will only invest if the present value of the benefits is larger than the costs,
consequently a persons’ investment decision will be based on the sign of d. If d is
positive (d>0) he will invest in education whereas if d is negative (d<0) he will not.
Pons (2004) points out that another method to assess if investing in education is
profitable is to write the equation with equality and look for the internal rate of return:
∑=
++=
N
nn
n
ik
C1
1)1(
Since and00 zxC −= nnn zxk −= , this expression can be re-formulated as:
0)1()1( 0
10
1 =+
−+
= ∑∑=
+=
+
N
nn
nN
nn
n
rz
rx
d
Lastly, since , she arrives to the following expression: ),...2,1( Nnkzx nn =+=
[ ]NrrKC −+−= )1(1
which uses as a way to correct for the fact that life has a limited amount of
years. In this case Pons (2004) explains that the investment decision depends on the
internal rate of return and the discount rate. If the internal rate of return is higher than the
discount rate, then the person will choose to X whereas if the internal rate of return is
lower he will choose Z.
Nr −+ )1(
Later, with the aim of making empirically measurable the return to schooling,
Mincer (1974) develops a human capital earnings function of the form: 2log iii dXcXbSy +++= α
where y is a measure of earnings, S is schooling years and X is years of potential
experience which for data limitations is usually calculated as X=age-S-6. Willis(1986)
calls attention to the fact that Mincer’s earnings function offers an estimate of the
schooling internal rate of return “[…]only if it is assumed[…]that a given increment in
12

schooling has the same proportional effect on earnings at all levels of experience[…]”
Willis (1986). However, Willis (1986) indicates that if this is not the case, Mincer (1974)
proposes a technique to avoid numerical methods which uses the concept of “overtaking
experience”. What is more, this overtaking experience is less than or equal to the
reciprocal of the internal rate of return to schooling according to Mincer (1974). Yet,
from this human capital earnings model Card (2000) argues that maximizing earnings net
present value to reach an optimal schooling decision by matching costs and benefits is
appropriate if people face a fix interest rate and are indifferent between working and
going to school. But in a more general way, Card (2000) says, variations arise in the
optimal schooling decision between individuals since they most likely have different
talent and preferences towards school and working. Therefore, Card (2000) presents,
from a theoretical and empirical perspective, a model that takes into account some of the
problems Griliches (1977) identifies in the empirical literature, like ability bias,
measurement errors and interpretation of coefficients, which we will explain in the
following paragraphs. For this purpose we summarize a simplified version of Card’s
model from Oreopoulos (2004) and later extend the explanations using Card (2000).
Oreopoulos (2004) assumes individuals have an infinite planning horizon starting
at and a lifecycle utility function: 0=t
∫∞ −=
0))(())(,( dtetcutcSV tρ
where utility depends on consumption c(t) at period t, )(•U being a concave increasing
function, assuming that individuals use a subjective discount rate ρ and that they take a
unique decision regarding when to stop studying. This utility function is subject to a
budget constraint:
ReSydteSydtetc
RSRt
s
Rt −−∞−∞== ∫∫ )()()(
0
where is the earnings function of an individual with S years of schooling. In order
to simplify, he assumes that schooling is additively separable in age so he can ignore
earnings growth from post-schooling investments. Additionally, he assumes the
individual faces a fix interest rate R. Given that the model only considers that the
)(Sy
13
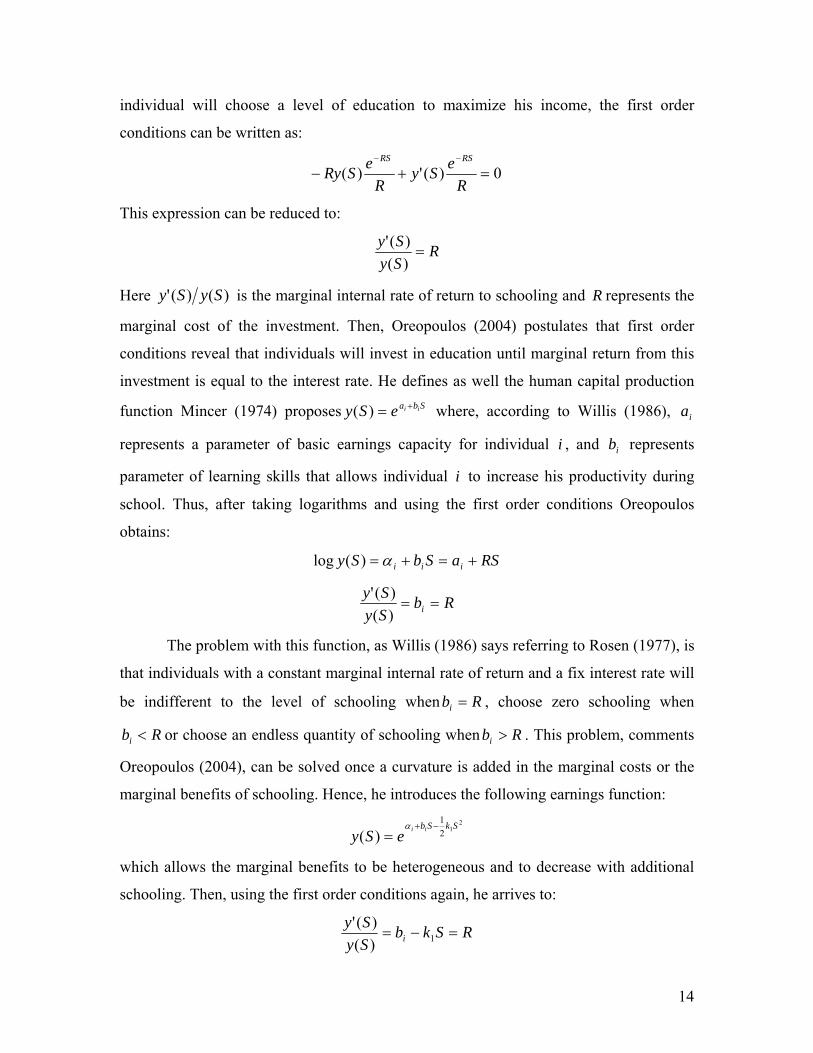
individual will choose a level of education to maximize his income, the first order
conditions can be written as:
0)(')( =+−−−
ReSy
ReSRy
RSRS
This expression can be reduced to:
RSySy
=)()('
Here )()(' SySy is the marginal internal rate of return to schooling and R represents the
marginal cost of the investment. Then, Oreopoulos (2004) postulates that first order
conditions reveal that individuals will invest in education until marginal return from this
investment is equal to the interest rate. He defines as well the human capital production
function Mincer (1974) proposes where, according to Willis (1986),
represents a parameter of basic earnings capacity for individual i , and represents
parameter of learning skills that allows individual i to increase his productivity during
school. Thus, after taking logarithms and using the first order conditions Oreopoulos
obtains:
Sba iieSy +=)( ia
ib
RSaSbSy iii +=+= α)(log
RbSySy
i ==)()('
The problem with this function, as Willis (1986) says referring to Rosen (1977), is
that individuals with a constant marginal internal rate of return and a fix interest rate will
be indifferent to the level of schooling when Rbi = , choose zero schooling when
or choose an endless quantity of schooling when . This problem, comments
Oreopoulos (2004), can be solved once a curvature is added in the marginal costs or the
marginal benefits of schooling. Hence, he introduces the following earnings function:
Rbi < Rbi >
212
1
)(SkSbiieSy
−+=
α
which allows the marginal benefits to be heterogeneous and to decrease with additional
schooling. Then, using the first order conditions again, he arrives to:
RSkbSySy
i =−= 1)()('
14
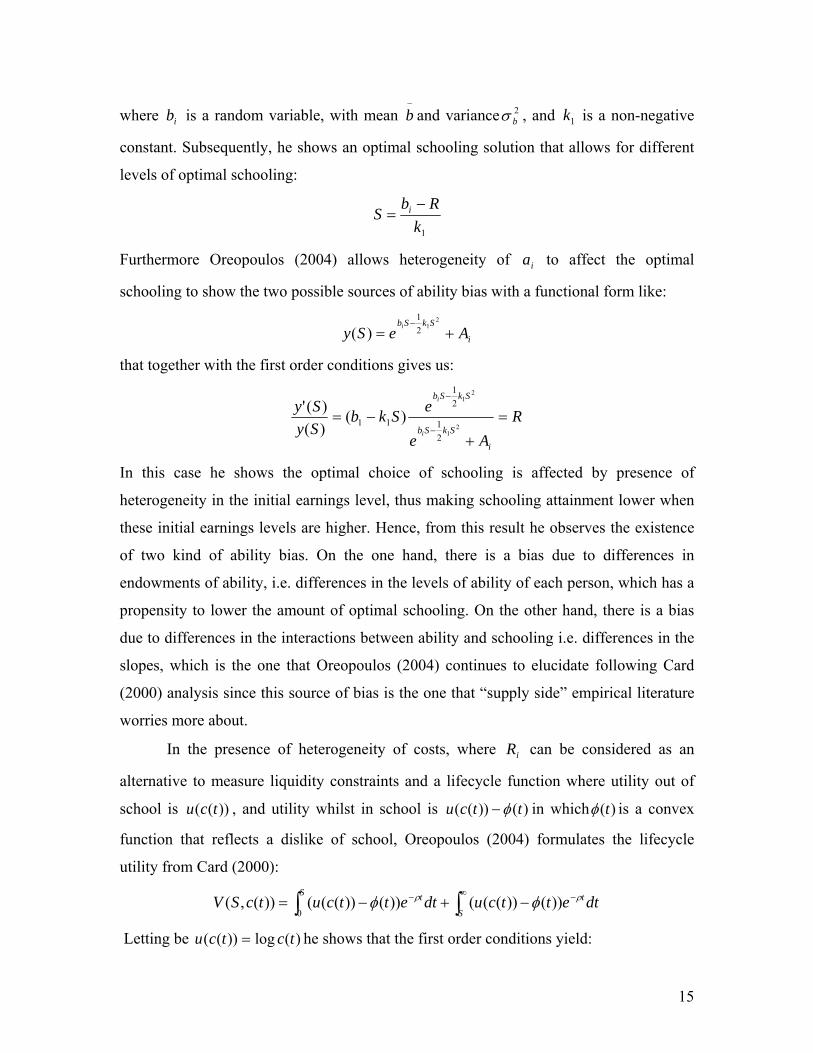
where is a random variable, with mean and variance , and is a non-negative
constant. Subsequently, he shows an optimal schooling solution that allows for different
levels of optimal schooling:
ib−
b 2bσ 1k
1kRb
S i −=
Furthermore Oreopoulos (2004) allows heterogeneity of to affect the optimal
schooling to show the two possible sources of ability bias with a functional form like:
ia
i
SkSbAeSy i
+=− 2
121
)(
that together with the first order conditions gives us:
RAe
eSkbSySy
i
SkSb
SkSb
i
i
=+
−=−
−
21
21
21
21
11 )()()('
In this case he shows the optimal choice of schooling is affected by presence of
heterogeneity in the initial earnings level, thus making schooling attainment lower when
these initial earnings levels are higher. Hence, from this result he observes the existence
of two kind of ability bias. On the one hand, there is a bias due to differences in
endowments of ability, i.e. differences in the levels of ability of each person, which has a
propensity to lower the amount of optimal schooling. On the other hand, there is a bias
due to differences in the interactions between ability and schooling i.e. differences in the
slopes, which is the one that Oreopoulos (2004) continues to elucidate following Card
(2000) analysis since this source of bias is the one that “supply side” empirical literature
worries more about.
In the presence of heterogeneity of costs, where can be considered as an
alternative to measure liquidity constraints and a lifecycle function where utility out of
school is , and utility whilst in school is
iR
))(( tcu )())(( ttcu φ− in which )(tφ is a convex
function that reflects a dislike of school, Oreopoulos (2004) formulates the lifecycle
utility from Card (2000):
∫∫∞ −− −+−=S
tS t dtettcudtettcutcSV ρρ φφ ))())((())())((())(,(0
Letting be he shows that the first order conditions yield: )(log))(( tctcu =
15

)()()()(' sdSeR
SySy S
i ≡+= − φρ ρ [1]
which is a simplified version of Card’s model.
So, when inspecting this equation Card (2000) exhibits the two possible sources
of heterogeneity affecting schooling choice and that he specifies in a simple way as:
SkbSySy
i 1)()('
−= [2]
SkrSd i 2)( += [3]
where and are random variables and and are non-negative constants. Beginning
with the first expression [2], Card (2000) observes heterogeneity from the benefits of
schooling that is represented by different marginal returns to schooling. As of the second
expression [3], Card (2000) observes that heterogeneity arises from differences in the
marginal costs of schooling. Thus, from these two expressions the optimal schooling
choice is:
ib ir 1k 2k
krbS iii /)( −= [4]
with . In this expression Card (2000) shows optimal schooling like a linear
function of the heterogeneity terms of each individual. With this equilibrium in schooling
choice, he points out that the marginal return to schooling is:
21 kkk +=
kkrkkbSkb iiiii /)/1( 111 +−=−≡β
Concerning this framework, which allows heterogeneity in the costs and benefits, it is
possible to see two particular cases for the distribution of returns to education. In the first
case, Card (2000) supposes 02 =k and for all individuals, which permits to see
that individuals have equality of opportunities and differences in the return to schooling
arise due to heterogeneity in abilities. The second case occur when Card (2000) allows
and , a situation where all individuals have equality of abilities and
differences in the return to schooling arise due to heterogeneity in the marginal costs.
Taking expectations is the average marginal return
from one more year of education for a random sample of population. Although this
_
rri =
01 =k_bbi =
_
1
_
1
_
)()( SkbSkbEE iii −=−== ββ
16

average return might not be completely relevant for specific sub-populations, Card uses it
as a point of reference to compare the coefficients of different estimation methods.
Taking this model as a basis, Card (2000) deducts an empirical form, where for
simplicity he excludes experience in order to see the implications in the estimation of .
Thus the equation he begins with is:
_β
212
1)(log iiii SkSbSy −+= α
Card (2000) remarks that in this equation the individual heterogeneity can affect the
intercept and the slope and re-writes it as
iiiii SbbaSkSbaSy )(21)(log
_2
1
_
0 −++−+= [5]
where 0aa ii −≡ α has mean 0. In this case Card says, equations [4] and [5] depict a two
equation system in terms of iii randba ,
where and are the linear projections of
on observed schooling. When he substitutes these projections in [5] he
arrives to:
iii uSSa +−= )(_
0λ iii vSSbb +−=− )(_
0
_ψ
)(_
bbanda ii −
iiiii SvuSkSSbconstSy ++−++++= 210
_
00
_
)21()()(log ψψλ
Further Card (2000) mentions that if the third central moments of a joint distribution for
and are zero there will not be a correlation between and . In this case he
explains that and the projection of on has a slope . Then,
when calculating the probability limit of the ordinary least squares regression regarding
the coefficient for returns to education, he arrives to:
ib ir ii Sv iS
0)( 3_
=⎥⎦⎤
⎢⎣⎡ − SSE i
2iS iS
_
2 S
)2/1(2lim 10
__
00
_
kSSbbp ols −×+−+= ψψλ [6]
_
00
_
1
_
lim SSkbbp ols ψλ ++−=
_
00
_
lim Sbbp ols ψλ ++=
17

In this equation Card (2000) presents the ability bias problem that arises between
schooling and earnings, where 0λ is the traditional ability bias and 0ψ is the comparative
advantage bias. Card (2000) points out that in the case all individuals had the same
marginal benefits from schooling the bias would be . Thus, 0
_
lim λ=− bbp ols 0λ is
equivalent to the omitted variable bias that arises from the correlation between the ability
and the marginal cost of schooling and would be positive if which
means marginal costs are lower for persons that would earn more at any level of
education. In the case that individuals have different marginal benefits together with
different intercepts, Card (2000) asserts a more complicated problem because individuals
with higher returns to education have incentives to have higher levels of education.
Therefore, this endogen source of bias, according to him, will give a biased estimator
even if there is no variation in the intercepts. This endogeneity bias is
ia ir 0),cov( <ii ra
S0ψ , where
fkSSb iii ∗== )var(/),cov(0ψ .Here is the fraction of the variance of schooling that
we can attribute to the differences in the slope of the earnings-schooling relation and it
can be expressed as:
f
),cov(2)var()var(),cov()var(
iiii
iii
rbrbrbb
f−+
−= .
Moreover, if it is assumed that marginal benefits are no higher for persons that face
higher marginal costs, i.e. 0),cov( <ii rb , the ordinary least squares estimator will be
upward biased. Additionally, if there is an additive measurement error in the schooling
variable of the form , where is observed schooling, is true schooling
and
iioi SS ε+= o
iS iS
iε has 0)( =iE ε and variance , Card (2000) shows that the probability limit of
ordinary least squares estimator will be:
2εσ
⎭⎬⎫
⎩⎨⎧ ++=
_
00
_
0)lim( SRbp ols ψλβ
where [ ] 1)var(/)var()var(/),cov( 2000 <+== εσiiiii SSSSSR when ii S⊥ε . In this case the
ordinary least squares estimator will be downward biased.
Further on Card (2000) analyses different instrumental variables (IV) estimators
within this framework and concludes that IV estimators yield higher estimates than OLS
18

due to three important reasons. Firstly, he says that if assuming ability biases are small in
the OLS estimates of the return to schooling, then the differences between IV and OLS
will reflect the downward bias of OLS caused by measurements errors. Secondly, he
states that IV estimates could be even more upward biased that OLS due to unobserved
differences between the characteristics of the treatment and comparison groups. Thirdly,
Card (2000) says that since researchers tend to favor estimates with higher t-statistics,
this could produce a specification search bias. Fourthly, Card (2000) comments that
under heterogeneity IV estimates that take into account changes in the supply side
recuperate the returns to schooling of individuals with high returns to schooling. Finally,
he argues that even with ideal instruments the results of IV estimators are weighted
averages of the returns to education for the sub-population whose schooling decision was
affected by the instrument and that OLS estimates, even if upward biased, are a
somewhat conservative estimate of the causal effects for groups affected by supply side
changes.
To summarize, the fact that the Mincer earnings function does not take into
account all these possible sources of bias mentioned above through a complete supply
and demand framework suggests, according to Pons (2004), an incompatibility with the
optimizing behavior of individuals. In that sense Card (2000) concludes that using a
supply and demand framework is more interesting since it results in more complete
econometric models. However, both Pons (2004) and Card (2000) say that estimates from
OLS and IV are interesting tools for estimating returns to education once we take into
account the possible bias and are careful to interpret the results.
3.2. Job market signaling: Introduction to sheepskin effects
Pons (2004) explains that signaling hypothesis embraces several theories that consider
education has more purposes than increasing productivity. On the one hand, Pons (2004)
tells that signaling hypothesis leads to models of signaling, filter and selection which
keep economic rationality and which on average anticipate that individuals with higher
education levels are more productive and consequently receive higher earnings. She says
that these theories consider the employers use education attainment, particularly the
19

diplomas, to obtain information and choose the most potentially productive workers. She
remarks the models of Spence (1973) and Stiglitz (1975) about signaling, Arrow‘s (1973)
models about filters mechanisms in function of the individuals’ abilities and Rotschild
and Stiglitz’ (1976) selection models with educative requirement of the firms for the
development of this hypothesis. In general, Pons (2004) explains that these models
assume there is asymmetric information where workers usually have information about
their level of productivity whereas the firms do not. In this context, individuals with
different levels of productivity are self-selected to different levels of education and
different solutions are conceived using education as a source of information. On the other
hand, she exposes that there is a credentials approach studied by Berg (1970) and Dore
(1976) where education serves as a way to access certain jobs in such a way that
employers offer better wages and positions to persons with higher diplomas whether they
are more productive or not. The possible reasons behind this, according to her, are
snobbism, misperception about the value of education and entry barriers. Nevertheless,
Pons clarifies that this approach in its extreme form does not work since it does not
explain why employers would want to pay higher wages due to the possession of a
diploma relative to the productivity of an employee. What is more, she argues that if
certain employers acted in this pure form in a competitive market with other employers
that did not proceed like this, the employers acting in a pure credentialist way would be
in disadvantage. On the other hand, she says the theory behind signalization puts
emphasis on the value of the information education gives about productivity than in the
end will produce different earnings streams for individuals with different levels of
productivity. Nevertheless, as she mentions, presently the signaling hypothesis is not in
opposition to the human capital theory since the first considers that education serves to
raise productivity and to inform about innate abilities. Conversely, the empirical
implications of the signaling hypothesis makes it very attractive since it gets through the
omitted ability problem in the earnings function because firms use education as a signal
to get information about abilities. Furthermore, she argues that from this approach since
firms have difficulty to observe ability and use education as a signal, the coefficient of an
ability variable should not be unavoidably significant.
20

Finally and as a conclusion of this section, Ferrer and Riddell (2001) state that since the
nature of returns to human capital is more complex than the implications of both theories,
these two should be reliable to some extent. However, a problem arises when trying to
use both theories for the study of human capital since the data for carrying out these
studies usually shows only one of the two measures. Therefore, they presume that another
possible source of bias in the returns to education might arise from the omission of
credentials’ effects. Furthermore, they judge it reasonable to assume that the importance
of schooling years and credentials differ by level of schooling attainment, diploma and
country. Thus, they conclude evaluating both measures is important for Canadian
immigration policy since knowing the sheepskin effects might contribute to enhance
admission criteria and facilitate integration of foreign human capital.
4. ESTIMATION APPROACH
For our econometric analysis we use a variation of the standard log-wage equation
developed by Mincer (1974). Particularly, we will base our estimations on the equation
Aydemir and Skuterud (2005) develop, making some changes for taking into account the
sheepskin effects approach of Ferrer and Riddell (2004). Thus, like Aydemir and
Skuterud (2005) we divide experience and schooling in their Canadian and foreign
components. Moreover, to take into account the sheepskin effects we add a series of
dummy variables with the highest earned degree achieved by the person3. Hence, the
first equation is similar to the one used by Aydemir and Skuterud with the exclusion of
interactions between cohorts and Canadian years of experience:
3These dummies reflect the census variable of highest earned diploma and are written in a non-cumulative way: α1 =1 if no diploma α1=0 otherwise
α4=1 if collegial diploma α4=0 otherwise
α7=1 if masters diploma α7=0 otherwise
α2=1 if secondary diploma α2=0 otherwise
α5=1 if university certificate α5=0 otherwise
α8=1 if PhD diploma α8=0 otherwise
α3=1 if school of trades certificate α3=0 otherwise
α6=1 if bachelor diploma α6=0 otherwise
The dummy of bachelor diploma includes persons with bachelor diploma, MD diploma and superior to bachelor diploma.
21

uSSEXPEXPEXP
EXPEXPEXPCI
SEXPEXPW
ffccfccfff
ccffcc
k
jjj
ccc
+⎟⎟⎟
⎠
⎞
⎜⎜⎜
⎝
⎛
+++
+++++
++++=
∑=
332
2
22111
21
32
210
)*(
log
θθθθ
θθθδδ
ββββ
[1]
The second equation adds the interactions between immigration cohorts and Canadian
years of experience:
uSSEXPEXPEXP
EXPEXPEXPCEXPCI
SEXPEXPW
ffccfccfff
ccff
k
jcjjccc
k
jjj
ccc
+⎟⎟⎟
⎠
⎞
⎜⎜⎜
⎝
⎛
+++
++++++
++++=
∑∑==
332
2
221
2111
21
32
210
)*(
)*(
log
θθθθ
θθθθδδ
ββββ
[2]
The third equation adds common sheepskin effects:
uSSEXPEXPEXP
EXPEXPEXPCEXPCI
DEGREESEXPEXPW
ffccfccfff
ccff
k
jcjjccc
k
jjj
i
h
iiccc
+⎟⎟⎟
⎠
⎞
⎜⎜⎜
⎝
⎛
+++
++++++
+++++=
∑∑
∑
==
=
332
2
221
211
21
23
2210
)*(
)*(
log
θθθθ
θθθθδδ
αββββ
[3]
Finally, the fourth equation allows for different sheepskin effects:
uDEGREESSEXPEXPEXP
EXPEXPEXPCEXPCI
DEGREESEXPEXPW
i
h
iiffccfccfff
ccff
k
jcjjccc
k
jjj
i
h
iiccc
+
⎟⎟⎟⎟⎟
⎠
⎞
⎜⎜⎜⎜⎜
⎝
⎛
++++
++++++
+++++=
∑
∑∑
∑
=
==
=
233
22
221
211
21
23
2210
)*(
)*(
log
γθθθθ
θθθθδδ
αββββ
[4]
In all equations, potential years of experience are divided in two variables that show
Canadian years of experience (EXPc) and foreign years experience (EXPf) where EXP =
EXPc + EXPf. Furthermore, all equations include an interaction of foreign and Canadian
22

years of experience (EXPc*EXPf) and the square of Canadian and foreign years of
experience (EXPc2 and EXPf
2 respectively) to reflect the decreasing pattern of these
variables. In the case of schooling years we divide similarly to obtain Canadian schooling
years (Sc) and foreign schooling years (Sf) where S = Sc + Sf.4 In addition to the
schooling years, equations [3] and [4] include a series of dummies representing the
highest degree of the individual. This was made to test for sheepskin effects. The variable
I is a dummy that takes value one for the immigrants and zero otherwise. The series of
cohort dummies Cj reflect the earning differences among immigrants that entered at
different periods of time. Other control dummies we use exclusively for immigrants refer
to the region of birth. We also use supplementary common control dummies in all
specifications for both, Canadians and immigrants that indicate knowledge of official
languages, province of residence, married status and living in a metropolitan area.
Contrasting to Aydemir and Skuterud (2005), we use different macroeconomic
labor market related variables to control for period effects. We decided to do this with the
aim of testing the robustness of the results once we control with different variables that
reflect information regarding the business cycle. Thus, after estimating the four equations
with unemployment rate, which is interacted with immigrant dummy, we re-estimated
equation [4] using unemployment rate, employment rate and labor activity rate5. The
unemployment rate, defined as the percentage of the labor force that actively seeks for a
4 Since we only have access to the Public User Micro Data File we have to derive some variables. Firstly, we calculate “years since migration” using the immigration year variable and the year when census was performed. In the cases where data is grouped, we used the mean of the group. Once this is done we derive “age at immigration” simply subtracting “years since migration” from the current age. Secondly, we estimate the total schooling years using the methodology suggested by Li (1997) that is explained in the next section. Thirdly, we calculate total potential years of experience using the Mincer (1974) age-S-6 formula. Once these variables are obtained and assuming all immigrants achieved their schooling in a continuous period of time and entered the labor market right after school we are able to observe the “age of entry to the labor market” for each immigrant after adding six years to “total schooling years”. Then we compare the “age of entry to the labor market” with the “age at immigration”. Only if “age of entry to the labor market”>“age at immigration” we observe some Canadian schooling that we can calculate subtracting these variables. In the case of equality we do not observe Canadian schooling nor foreign experience and if “age of entry to the labor market”<“age at immigration” we do not observe Canadian schooling but foreign experience. We are aware of the problems that could arise from the continuous schooling assumption and measurement errors in education and experience. However, looking at the results of Card and Lemieux (2000) regarding school-leaving behavior where they find that just one quarter of those who leave school return in the future and from those, more than half just complete one semester or even less, we find very plausible this assumption. 5 We estimated these rates using the Census Metropolitan Area (CMA) census classification for the years 1990, 1995 and 2000. For the persons living in rural areas we estimated the same rates within each province for the same years.
23

job but has not been able to find it, lets us know the difficulty individuals in the labor
force have to find a job. Nonetheless, it is useful to remember that the unemployment rate
does not take into account discouraged job seekers that leave the labor force when they
perceive it is too difficult to find a job. For example, a relatively small unemployment
rate might be hiding the fact that there are discouraged work seekers leaving the labor
market, thus making the rate small. For this reason we also use the employment rate,
which represents the percentage of working-age-people that has job, and the labor force
activity rate, which is the percentage of working-age-people who work or are actively
looking for one. In addition and with the purpose of staying away from the problem that
Moulton (1990) reports from using macro data in micro data analysis, we use cluster-
robust errors by province for all our estimations. A development of this robust cluster
variance estimator is given by Williams (2000), which “[...] presents a general proof that
the modified-sandwich estimator is unbiased for cluster-correlated data regardless of the
setting [...]” (Williams, 2000, p.645).
5. DATA
In line of the current literature we use pooled data from the public use micro data files
(PUMF) of three different Canadian censuses -1991, 1996 and 2001- to build our sample.
The 1991 and 1996 PUMF contain both data based on a 2.8 percent sample of the
population listed in the census. The 2001 PUMF contains data based on a 2.7 percent
sample of the population listed in the census. Following Ferrer and Riddell (2004) our
sample is restricted to fulltime male wage earners that reported working periods of 52
weeks per year and working hours of at least 30 hours per week. It is also limited to
persons between 20 and 65 years old6 living in Quebec, Ontario and the western
provinces since we did not find enough immigrants for Atlantic Provinces. Our
dependent variable is the log of weekly wages and salaries at constant prices (using the
Consumer Price Index, CPI) of 2000. Like in other studies, the use of fulltime male
workers in connection with weekly wages is a simple way to leave out labor supply
6 We consider that schooling/labor decisions for persons under 20 might vary their labor market participation across censuses as well as retirement decisions might affect persons over 65 years old.
24
issues. Furthermore, we consider that females deserve their own study. So, our sample
contains 244 047 individuals, from which 80.05 percent are native born Canadians and
19.95 percent are permanent resident immigrants. Table 1 shows the mean values of the
variables for each group. In order to have consistent variables across censuses for the
region of origin indicators we put them into 6 groups7. In order to calculate schooling
years we used the methodology suggested by Li (1997). On the one hand, we recode
some variables presented in intervals. On the other hand, we construct the variable from
others available in the censuses. Individuals reporting less than grade 5 are coded as
having 2.5 years of schooling. Individuals reporting between grade 5 and 8 are coded as
having 6.5 years of schooling. Furthermore, schooling years for persons that reported
secondary are equal to the highest grade achieved, with grade 13 recoded as year 12.
Finally, schooling years for those with post-secondary education result from the sum of
12 years (of elementary and secondary schooling years) and years spent in university or
non-university education, whichever is larger in number of years. A nuisance of our
research arises from the data format of the census public files used in this study. Some
variables are top coded while others are presented in intervals. In order to divide
schooling years and experience in its Canadian and foreign components, like Ferrer and
Riddell (2004), who face the same difficulty, we derive some variables such as
immigration year, immigration age, entry year to labor market and age of entry to the
labor market. In the case of year of immigration, we recoded it for the observations that
were presented in intervals. The variable of age at immigration was almost completely
derived from immigration year, present age and census year. These variables together
with the schooling years helped us to approximate years since migration, labor force
entry age and finally break up schooling years and experience years in its Canadian and
foreign components8. In the remaining part of this section we make an effort to describe
some general patterns among native-born male Canadians and male immigrants in an
interesting but simple manner. 7 Since data from the 1991 census used a different classification of countries than the other two and grouped some western and eastern European countries together we decided to put them into one group with exception of the England, which along with the United States of America are consistently measured. Thus, we use these two countries as reference region of origin. We sub-divided Asia in three groups but in preliminary analysis we found the coefficients were not statistically different, thus we decided to see Asia as a single group. 8 vid.supra footnote 4
25

In Table 2 we can observe the male schooling attainment composition by census
year and immigrant status. This table shows that within the groups a larger percentage of
immigrants have university and post-university education in comparison to native-born
Canadians for the three censuses. Moreover, the cumulative percentage of individuals
with university and post-university education is increasing for both native-born
Canadians and immigrants in the sample. Additionally, it is also interesting to revise the
percentages of native-born Canadians and immigrants with college education. We notice
that among native-born Canadians the percentage with college education increase for
each census while for immigrants there is a decrease between the 1991 and 1996 censuses
and a small increase between the 1996 and 2001 censuses. In contrast, for the secondary,
primary and no schooling classifications we can see a continuous decrease throughout the
three censuses for both groups.
Regarding credentials, Table 3 shows the male distribution of highest obtained
diplomas of native-born Canadians and immigrants in the sample. The table allows us to
revise the composition of the credentials that the two groups have. This is important for
our analysis since we believe that the credentials of individuals have a different effect
than the schooling years, thus being rewarded differently than the latter. In general, Table
3 also shows that between the two groups, immigrants have a larger percentage of
individuals holding higher diplomas than native-born Canadians. For instance, while for
the 1991 Census 17.38 percent of immigrants and the 11.76 percent of native-born have a
Bachelor, Master or PhD degree, for the 2001 Census 23.70 percent of immigrants and
13.79 percent of native-born Canadians have a Bachelor, Master or PhD degree.
Language distribution knowledge by male native-born Canadians and male
immigrants is presented in Table 4. This shows a small increasing trend among native-
born Canadians in the knowledge of English or both (English and French), and a decrease
in merely the knowledge of French. Interestingly, there is an increase in the percentage of
immigrants knowing neither French nor English from the 1991 to the 1996 census. In
contrast, when comparing the 1996 and 2001 censuses, we can see a very small increase
in the knowledge of English and both (English and French) and a decrease for only
French. The importance of this variable relies in the fact that the familiarity with at least
one official language can facilitate the integration of immigrants since it can help them to
26

continue studying, obtain a job, acquire local experience, specific values, and develop
other abilities that are valued in the Canadian labor market.
Table 5 shows the birth region composition among male immigrants for the three
censuses. We can see that the proportion of immigrants coming from United States,
England and European countries is decreasing, while the proportion of immigrants from
Asia and Africa is increasing. In the case of male immigrants from Latin America, we
can see that while their proportion increases between the 1991 and 1996 censuses, it
shows a small decrease between the 1996 and 2001 censuses. Several studies of
immigrants’ returns to education argue that changes in the composition of source
countries might explain the decrease of wages immigrants perceive. This decrease would
be caused by the difficulties to transfer human capital from source countries that have
very different societies and practices. In order to illustrate how these characteristics
presented above interact with wages, we introduce another set of tables that describe the
distribution of weekly wages.
Table 6 shows the average weekly wage by immigration status and schooling
attainment for each census year for our sample. We observe that for the 1991 census, the
average weekly wages for fulltime-working male immigrants seem similar or larger at all
schooling levels than for native-born Canadians with the exception of secondary and
college education. Conversely, for the subsequent censuses this seems to be reversed for
all levels of education with exception to primary education for the 2001 Census.
Table 7 breaks down average weekly wages by immigrant status and highest
obtained diplomas for each census. We see that in almost all categories, native-born
Canadians seem to receive a higher average weekly wage than immigrants for the three
censuses. The only categories in which immigrants seem to have a higher mean wage are
school of trade’s diploma collegial diploma and PhD diploma for the 1991 Census and
school trades diploma for the 2001 Census.
Finally, table 8 shows the average weekly wages by region of origin and Census
for our sample. We can see in this table that there are some differences in the wages of
immigrants from different regions. Immigrants coming from the United States and
England seem to earn more than native-born Canadians and immigrants from other
regions. Moreover, immigrants from Europe and Africa seem to have similar
27

remuneration than Canadians. However, immigrants coming from Asia and Latin-
America on average seem to earn lower weekly wages than native-born Canadians and
the other groups. We must recall that Table 6, which describes the proportion of
immigrants from different regions for each census, shows a noteworthy increase of
immigration form Asia and Latin-America. Thus, it looks like that the variable “region of
origin” is a key factor to explain the decrease in wages for immigrants. The next section
discusses these issues in more detail using results from econometric estimations.
6. EMPIRICAL RESULTS
In this section we present the results from our estimations. We begin analyzing the results
from estimating specifications [1], [2], [3] and [4] from Section 4 using unemployment
rate interacted with immigrant dummy to control for period effects. The complete
estimates from these regressions are shown in Table 9. However, for expositional
purposes, we present some selected estimates in tables throughout the explanation and
only occasionally ask the reader to see Table 9. Further, we examine some results from
estimating specification [4] with different variables to control for period effects,
specifically employment rate and activity rate. The complete results of these estimations
are in Table 10 but we introduce some selected coefficients during the section to facilitate
explanations and only occasionally ask the reader to see Table 10.
6.1. Results of specifications 1 to 4 using unemployment rate
6.1.1. Returns to experience From Table 11 we can observe that the return to Canadian years of working experience
for native-born Canadians is quite similar across the different specifications. Conversely,
in the case of immigrants although showing negative coefficients for all specifications,
only for specification [1] the coefficient is statistically significant at 10 percent level of
confidence. However, when verifying immigrants’ returns to Canadian experience for
different cohorts relative to the immigrants arriving before 1970 in specifications [2] to
[4], we remark that in general immigrants’ returns to Canadian experience for later
28

cohorts are inferior to those from immigrants arriving before 1970. In the case of the
1970-1974 cohort we see an important reduction in the returns to Canadian experience
followed by small improvement for the next cohort and again reductions for the 1980-
1984 and 1985-1989 cohorts9. Only for the two most recent cohorts the coefficients are
positive though not statistically significant. When comparing our results with those from
Aydemir and Skuterud (2005), despite the differences in the coefficient values estimates,
we coincide that there is a recovery of the last two arrival cohorts. Nevertheless, we also
report a small recovery for the 1975-1979 cohort that Aydemir and Skuterud (2005)
results do not capture.
With regards to evolution of returns to Canadian years of experience, for
specifications [1] and [2], we see that for native-born Canadians the variation on wages
with increases in years of Canadian experience goes from 4.17 percent with one year of
Canadian experience to 3.02 percent with ten years of Canadian experience. In contrast,
immigrants’ variation on wages with increases in years of Canadian experience in
specification [1] goes from 3.34 percent with one year of Canadian experience to 2.30
percent with ten years of Canadian experience respectively. Furthermore, for
specifications [3] and [4], that control for common sheepskin effects and different
sheepskin effects respectively, native-born variation on wages with increases in years of
Canadian experience goes from 4.27 with one year of Canadian experience to 3.04 with
ten years of Canadian experience. In the case of immigrants we can observe in Table 12
the different numbers for each cohort for specifications [2], [3] and [4] that allow for
different assimilation patterns. In general for all the specification and cohorts, the
immigrants’ variation on wages with increases in years of Canadian experience is inferior
with the exception of the most recent cohort.
9 After performing a Wald test on specification [2], [3] and [4] we fail to reject the null hypothesis of equality for the following premise: Test canadian_exp* c1975_1979*imm= canadian_exp* c1980_1984*imm (2) F(1,5) = 0.19 Prob > F = 0.6818 (3) F(1,5) = 0.05 Prob > F = 0.8358 (4) F(1,5) = 0.02 Prob > F = 0.8959 Conversely, we reject the null hypothesis of another series of Wald tests on specifications [2],[3] and [4] to test for equality of the following premise: test canadian_exp* c1970_1974*imm= canadian_exp* c1975_1979*imm= canadian_exp* c1980_1984*imm (2) F(2,5) = 17.95 Prob > F = 0.0052 (3) F(2,5) = 21.54 Prob > F = 0.0035 (4) F(2,5) = 18.36 Prob > F = 0.0050
29

Table 11
Returns to Canadian and Foreign Experience Eq.1 Eq.2 Eq.3 Eq.4 Canadian experience 0.0431 0.0431 0.0441 0.0441 (0.0014)*** (0.0014)*** (0.0014)*** (0.0014)***Canadian experienceXimmigrant -0.0082 -0.0038 -0.0050 -0.0050 (0.0033)* (0.0031) (0.0033) (0.0034) Canadian experienceX1970-1974Ximmigrant -0.0050 -0.0050 -0.0051 (0.0006)*** (0.0005)*** (0.0005)***Canadian experienceX1975-1979Ximmigrant -0.0020 -0.0020 -0.0020 (0.0004)*** (0.0004)*** (0.0004)***Canadian experienceX1980-1984Ximmigrant -0.0026 -0.0023 -0.0023 (0.0010)** (0.0012) (0.0013) Canadian experienceX1985-1989Ximmigrant -0.0075 -0.0067 -0.0065 (0.0012)*** (0.0016)*** (0.0017)** Canadian experienceX1990-1994Ximmigrant 0.0056 0.0075 0.0081 (0.0037) (0.0037)* (0.0038)* Canadian experienceX1995-2000Ximmigrant 0.0007 0.0039 0.0051 (0.0096) (0.0090) (0.0089) Canadian experience2 -0.0006 -0.0006 -0.0007 -0.0007 (0.0000)*** (0.0000)*** (0.0000)*** (0.0000)***Canadian experience2Ximmigrant 0.0001 0.0000 0.0000 0.0000 (0.0001) (0.00001) (0.0001) (0.00001) ForeignXCanadian experienceXimmigrant -0.0003 -0.0003 -0.0005 -0.0005 (0.0000)*** (0.0000)*** (0.0000)*** (0.0000)***Foreign experienceXimmigrant 0.0111 0.0111 0.0120 0.0121 (0.0009)*** (0.0009)*** (0.0008)*** (0.0007)***Foreign experience2Ximmigrant -0.0003 -0.0003 -0.0003 -0.0003 (0.0001)*** (0.00001)*** (0.0000)*** (0.0000)***Robust standard errors in parentheses * significant at 10%; ** significant at 5%; *** significant at 1%
When looking to the foreign experience coefficients in Table 11, we observe these
being statistically significant in all specifications. Moreover, we can notice the returns to
foreign experience are in all cases unsurprisingly small; indicating the transferability of
foreign experience is low. The evidence collected by Schaafsma and Sweetman (2001)
and Aydemir and Skuterud (2005) together with our evidence points out that returns to
foreign experience are tiny. When comparing the returns to Canadian experience with the
30

returns to foreign experience we can see that the latter correspond to a little fragment in
the region of 25.00 percent of the returns to Canadian experience.10
Table 12
Evolution of Immigrants Returns to Canadian experience (%)
Specification 2
Specification 3
Specification 4
Cohort 1970-1974 Canadian experience =1yr 3.2707 3.2348 3.2225 Canadian experience =10yrs 2.1088 2.0639 2.0457Cohort 1975-1979 Canadian experience =1yr 3.5678 3.5440 3.5245 Canadian experience =10yrs 2.4059 2.3731 2.3476Cohort 1980-1984 Canadian experience =1yr 3.5106 3.5100 3.5018 Canadian experience =10yrs 2.3487 2.3391 2.3250Cohort 1985-1989 Canadian experience =1yr 3.0162 3.0737 3.0782 Canadian experience =10yrs 1.8543 1.9028 1.9014Cohort 1990-1994 Canadian experience =1yr 4.3293 4.4944 4.5383 Canadian experience =10yrs 3.1674 3.3235 3.3614Cohort 1995-2000 Canadian experience =1yr 3.8359 4.1262 4.2404 Canadian experience =10yrs 2.6740 2.9553 3.0635(foreign experience=1yr)
The fact that immigrants’ return to foreign experience is just a very small fraction
of the returns to Canadian experience shows that Canadian labor market gives a low
value to this human capital immigrants bring with them. This is seen more clearly in
Table 13, revising the evolution of immigrants’ returns to foreign working experience in
presence of different amounts of Canadian years of experience. For example, when
looking the left column for specification [1], Table 13 shows the variation on wage with
increase in years of foreign experience going from 1.03 with one year to 0.57 with ten
10 We reject the null hypothesis of a Wald test in all specifications for the following test: test canadian_exp+canadian_exp*imm1=foreign_exp (1) F(1,5) = 89.83 Prob> F = 0.0002 (2) F(1,5) = 165.89 Prob> F = 0.0001 (3) F(1,5) = 127.98 Prob> F = 0.0001 (4) F(1,5) = 113.49 Prob> F = 0.0001
31

years of foreign experience. Nevertheless, when looking the right column for the same
specification (when immigrants have ten years of Canadian experience instead of one) the
variation on wage with increase in years of foreign experience shrinks, starting now from
0.74 with one year of foreign experience and ending in 0.28 with ten years respectively.
With reference to specifications [2], [3] and [4], we can see in Table 13 that the numbers
undergo very small changes. However, despite these changes, results show foreign
experience has a lower impact on wages for immigrants than Canadian experience and
with increasing years of Canadian experience, the contribution of foreign experience is
even poorer.
Table 13
Evolution of Immigrants Returns to Foreign experience (%)
Canadian experience =1yr
Canadian experience =10yrs
eq.1 Foreign experience=1yr 1.0300 0.7428Foreign experience=10yrs 0.5728 0.2856eq.2 Foreign experience=1yr 1.0249 0.7443Foreign experience=10yrs 0.5666 0.2860eq.3 Foreign experience=1yr 1.0959 0.6877Foreign experience=10yrs 0.5876 0.1794eq.4 Foreign experience=1yr 1.1036 0.6512Foreign experience=10yrs 0.5807 0.1283
6.1.2. Birth region effects and knowledge of official languages effects In Table 14 we observe the effects of region of birth. Overall, we see that the effects
throughout all specifications are negative, quite similar and statistically significant. We
also observe that as we pass from specification [1] to specification [4], which has
sheepskin controls, the negative effects vaguely increase for Europe, Asia and Africa and
dimly decrease for Latin America and other regions. On the whole, coming from regions
different to the United States and England has negative effects on wages. Nevertheless, if
we revise the effects of each region, we detect that there are important differences among
them. For example, equation 4 shows that coming from Europe decreases the wage 10.07
32

percent compared to immigrants from United States and England, whereas coming from
Asia decreases it about 26.93 percent compared to immigrants from United States and
England. Similarly, in the same equation, coming from Latin America negatively affects
the wage up to 23.77 percent while coming from Africa decreases the wage by 19.82
percent11. The magnitude, sign and significance of these coefficients support the idea that
declines in immigrants’ wages are related to the shifts in region of birth.
Table 14
Birth region effects for different specifications Eq.1 Eq.2 Eq.3 Eq.4 Europe -0.0934 -0.0939 -0.0976 -0.1007 (0.0148)*** (0.0144)*** (0.0175)*** (0.0175)*** Asia -0.2507 -0.2509 -0.2665 -0.2693 (0.0063)*** (0.0062)*** (0.0092)*** (0.0110)*** Africa -0.1847 -0.1850 -0.1955 -0.1982 (0.0203)*** (0.0200)*** (0.0233)*** (0.0245)*** Latin_America -0.2543 -0.2537 -0.2419 -0.2377 (0.0257)*** (0.0255)*** (0.0235)*** (0.0229)*** Others -0.0550 -0.0535 -0.0457 -0.0417 (0.0456) (0.0457) (0.0388) (0.0366) Robust standard errors in parentheses, * significant at 10%; ** significant at 5%; *** significant at 1% Region of Reference: United States and England
The evidence presented here concerning wage decrease for immigrants from non-
traditional regions supports the results of Bloom, Gernier and Gunderson (1995) Green
and Worswick (2003, 2004), Ferrer and Riddell (2004), Sweetman (2004) and Aydemir
and Skuterud (2005) which conclude that an important part of the decrease in immigrants
wages is due to the changes in the composition of source countries.
Turning to the effects of knowledge of French, both English and French and,
neither English or French relative to the knowledge of English, we can see in Table 9 that
all coefficients are statistically significant and show the importance of knowing English
or both (English and French) relative to knowing only French or neither official language. 11 After testing for the null hypothesis for equal region of origin coefficients among immigrants from Asia and Latin America, we fail to reject the null hypothesis for all equations. The test and results are: Test Asia – Latin America = 0 (1) F(1,5) = 0.03 Prob > F = 0.8722 (2) F(1,5) = 1.02 Prob > F = 0.9020 (3) F(1,5) = 1.93 Prob > F = 0.2230 (4) F(1,5) = 3.86 Prob > F = 0.1067
33

Moreover, we can see that in the case of only knowing French, the coefficients for the
first two specifications have a less negative impact than for the last two that control for
sheepskin effects. Conversely, when looking the effects of knowing both languages
relative to knowing only English, we can see that the positive effect diminishes when
controlling for sheepskin effects in the last two specifications. Finally, for immigrants,
the lack of knowledge of both official languages has further negative effects for
specifications [3] and [4] than for specifications [1] and [2].
6.1.3. Sheepskin effects and Returns to schooling Regarding sheepskin effects and return to Canadian and foreign schooling years for
specifications [3] and [4], we can see in Table 15 that in most cases all coefficients are
positive and statistically significant. Specification [3] shows that no matter the degree,
there is an increase in the wage relative to the persons not having any degree whatsoever.
This specification, which considers common sheepskin effects, shows a solid increase of
the effect the higher the degree. For instance, having a Secondary diploma increases
wage by 6.74 percent compared to not having any diploma whereas having a School of
Trades diploma increases wage by 11.83 percent and having a College diploma increases
it by 17.23 percent. In the case of University Certificate diploma, wage is increased by
19.49 percent whilst a Bachelor diploma gives a big leap of a 32.89 percent compared to
someone without any diploma. Regarding graduate diplomas, having a Master diploma
increases wages by 37.03 percent while having a PhD diploma increases wage by 44.12
percent compared to someone without any diplomas12. However, when checking the
same results for specification [4], which allows for different sheepskin effects for native-
born and immigrants, we see some differences between the groups. On the one hand, the
coefficients interacting with immigrant dummy for Secondary diploma and University
Certificate are not statistically significant, thus having a similar return relative to
Canadians with equivalent diplomas. On the other hand, the coefficients for School of
Trades and University diplomas are positive and statistically significant. Therefore,
indicating that while for lower diplomas the sheepskin effects are not statistically
12When testing for equality of coefficients for specification [3] we reject the following null hypothesis: Master degree = PhD degree (3) F(1, 5) = 28.78 Prob > F= 0.0030
34

different, for higher diplomas there are some differences in the returns for immigrants
and native-born Canadians.
Table 15
sheepskin effects Eq.3 Eq.4 Secondary diploma 0.0674 0.0686 (0.0045)*** (0.0040)***School of trades diploma 0.1183 0.1108 (0.0098)*** (0.0104)***Collegial diploma 0.1723 0.1588 (0.0187)*** (0.0246)***University certificate 0.1949 0.1892 (0.0283)*** (0.0294)***Bachelor diploma 0.3289 0.3041 (0.0226)*** (0.0251)***Master diploma 0.3703 0.3295 (0.0274)*** (0.0319)***PhD diploma 0.4412 0.3334 (0.0258)*** (0.0478)***Secondary diplomaXimmigrant -0.0190 (0.0200) School of trades diplomaXimmigrant 0.0360 (0.0127)**Collegial diplomaXimmigrant 0.0558 (0.0255)* University certificateXimmigrant 0.0267 (0.0240) Bachelor diplomaXimmigrant 0.0987 (0.0228)***Master diplomaXimmigrant 0.14513 (0.0230)***PhD diplomaXimmigrant 0.2616 (0.0396)***Robust standard errors in parentheses * significant at 10%; ** significant at 5%; *** significant at 1%
Moreover, for native-born Canadians we fail to reject the null hypothesis of equal
coefficients for having a Master diploma and a PhD diploma whereas for immigrants we
do reject the null hypothesis of equal sheepskin effects of these two diplomas. So,
according to these results, there are higher sheepskin effects for immigrants the higher the
35

diploma.13 For instance, holding a Bachelor diploma increases the wage by 9.87 percent
more for an immigrant than for a native-born Canadian. In the case of holding a Master
diploma the increase in wage for an immigrant is 14.51 percent higher than for a native-
born Canadian. Finally, for an immigrant in possession of a PhD diploma the wage
increases by 26.16 percent more compared to a native-born Canadian holding the same
diploma.
Our results using the sheepskin approach adopted by Ferrer and Riddell (2004)
and Alboim, Finnie and Meng (2005) show interesting results regarding the different
effects of these variables in wages. Like them, we find that by introducing sheepskin
effects we observe that credentials affect the wage in a different way than schooling does.
Similarly to Ferrer and Riddell (2004), we find that especially for higher degrees the
sheepskin effects are more important for immigrants than for native-born.
On the subject of the returns to Canadian and foreign schooling years, Table 16
shows these returns are higher for specifications [1] and [2] than for specifications [3]
and [4], which control for sheepskin effects. However, despite the specification, the
return to one more year of Canadian schooling is less valued for an immigrant than for a
native-born Canadian. The coefficients in Table 16 allow seeing that immigrants’ returns
to Canadian schooling is lower than native-born’ returns with a 5 and 1 percent level of
confidence for all specifications. Surprisingly, when we allow for different sheepskin
effects (specification [4]), the return to one more year of Canadian schooling decreases
for immigrants while increasing for native-born Canadians. This change indicates to us,
together with the differences in sheepskin effects, that there is a different perception and
valuation of education for native-born Canadians and immigrants. Furthermore, we fail to
reject the null hypothesis that immigrants’ return to one more year of foreign schooling is
equal to the immigrants’ return to one more year of Canadian schooling for all
13 Testing for native-born in specification [4] we fail to reject the following null hypothesis: Master degree = PhD degree (4) F(1, 5) = 0.03 Prob > F= 0.8797 However, when testing the same coefficients for immigrants we reject the following null hypotheses: a) Master degree*imm1= PhD degree *imm1 (4) F(1, 5) =32.72 Prob > F = 0.0023 b) Master degree + Master degree*imm1= PhD degree + PhD degree*imm1 (4) F(1, 5) =113.88 Prob > F =0.0001
36
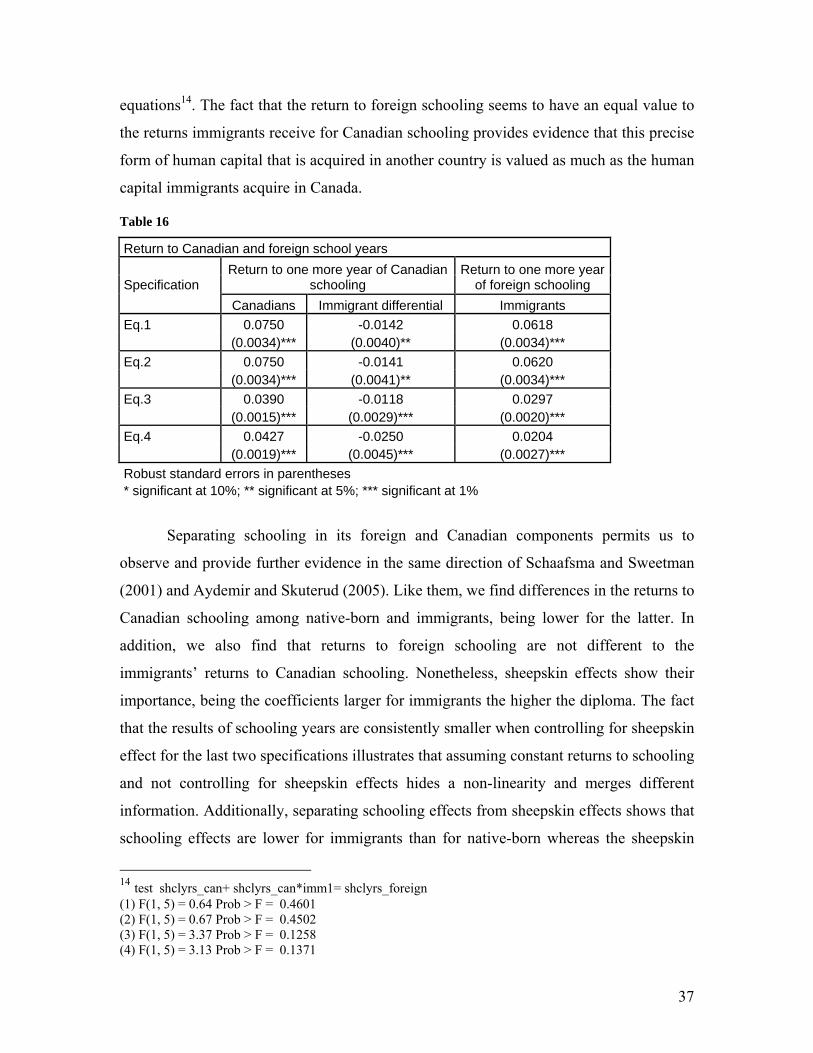
equations14. The fact that the return to foreign schooling seems to have an equal value to
the returns immigrants receive for Canadian schooling provides evidence that this precise
form of human capital that is acquired in another country is valued as much as the human
capital immigrants acquire in Canada.
Table 16
Return to Canadian and foreign school years
Specification Return to one more year of Canadian
schooling Return to one more year
of foreign schooling Canadians Immigrant differential Immigrants Eq.1 0.0750 -0.0142 0.0618 (0.0034)*** (0.0040)** (0.0034)*** Eq.2 0.0750 -0.0141 0.0620 (0.0034)*** (0.0041)** (0.0034)*** Eq.3 0.0390 -0.0118 0.0297 (0.0015)*** (0.0029)*** (0.0020)*** Eq.4 0.0427 -0.0250 0.0204 (0.0019)*** (0.0045)*** (0.0027)*** Robust standard errors in parentheses * significant at 10%; ** significant at 5%; *** significant at 1%
Separating schooling in its foreign and Canadian components permits us to
observe and provide further evidence in the same direction of Schaafsma and Sweetman
(2001) and Aydemir and Skuterud (2005). Like them, we find differences in the returns to
Canadian schooling among native-born and immigrants, being lower for the latter. In
addition, we also find that returns to foreign schooling are not different to the
immigrants’ returns to Canadian schooling. Nonetheless, sheepskin effects show their
importance, being the coefficients larger for immigrants the higher the diploma. The fact
that the results of schooling years are consistently smaller when controlling for sheepskin
effect for the last two specifications illustrates that assuming constant returns to schooling
and not controlling for sheepskin effects hides a non-linearity and merges different
information. Additionally, separating schooling effects from sheepskin effects shows that
schooling effects are lower for immigrants than for native-born whereas the sheepskin
14 test shclyrs_can+ shclyrs_can*imm1= shclyrs_foreign (1) F(1, 5) = 0.64 Prob > F = 0.4601 (2) F(1, 5) = 0.67 Prob > F = 0.4502 (3) F(1, 5) = 3.37 Prob > F = 0.1258 (4) F(1, 5) = 3.13 Prob > F = 0.1371
37
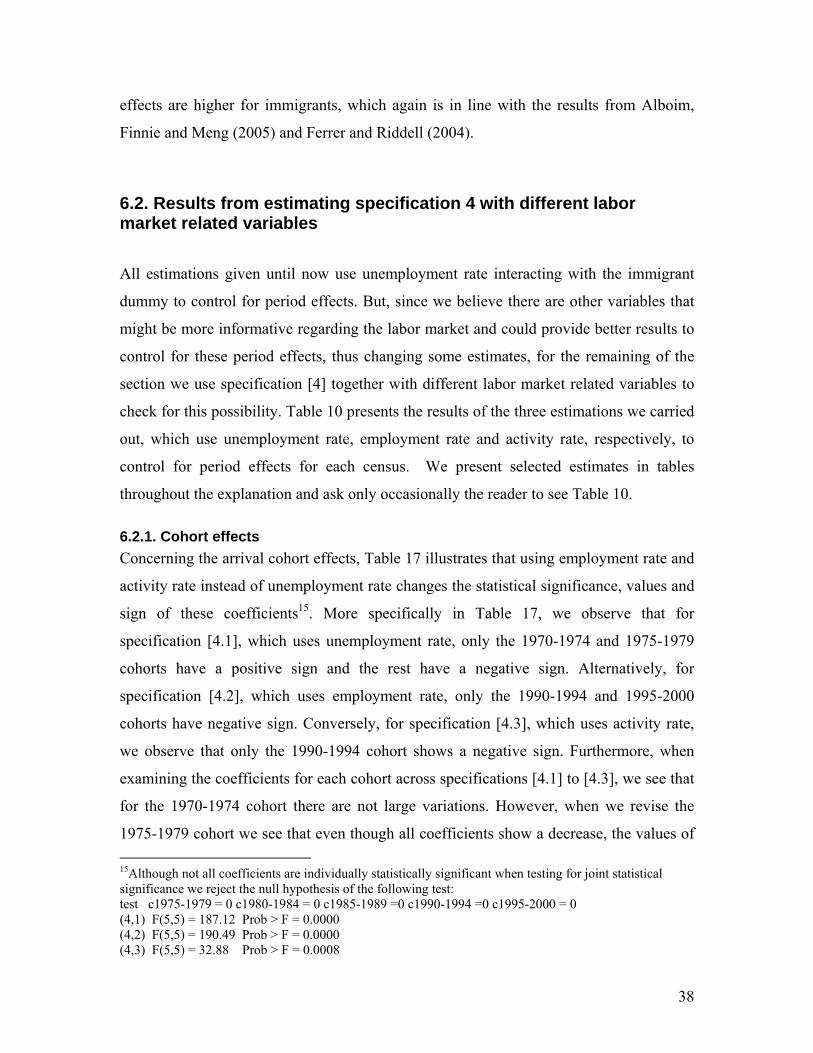
effects are higher for immigrants, which again is in line with the results from Alboim,
Finnie and Meng (2005) and Ferrer and Riddell (2004).
6.2. Results from estimating specification 4 with different labor market related variables
All estimations given until now use unemployment rate interacting with the immigrant
dummy to control for period effects. But, since we believe there are other variables that
might be more informative regarding the labor market and could provide better results to
control for these period effects, thus changing some estimates, for the remaining of the
section we use specification [4] together with different labor market related variables to
check for this possibility. Table 10 presents the results of the three estimations we carried
out, which use unemployment rate, employment rate and activity rate, respectively, to
control for period effects for each census. We present selected estimates in tables
throughout the explanation and ask only occasionally the reader to see Table 10.
6.2.1. Cohort effects Concerning the arrival cohort effects, Table 17 illustrates that using employment rate and
activity rate instead of unemployment rate changes the statistical significance, values and
sign of these coefficients15. More specifically in Table 17, we observe that for
specification [4.1], which uses unemployment rate, only the 1970-1974 and 1975-1979
cohorts have a positive sign and the rest have a negative sign. Alternatively, for
specification [4.2], which uses employment rate, only the 1990-1994 and 1995-2000
cohorts have negative sign. Conversely, for specification [4.3], which uses activity rate,
we observe that only the 1990-1994 cohort shows a negative sign. Furthermore, when
examining the coefficients for each cohort across specifications [4.1] to [4.3], we see that
for the 1970-1974 cohort there are not large variations. However, when we revise the
1975-1979 cohort we see that even though all coefficients show a decrease, the values of 15Although not all coefficients are individually statistically significant when testing for joint statistical significance we reject the null hypothesis of the following test: test c1975-1979 = 0 c1980-1984 = 0 c1985-1989 =0 c1990-1994 =0 c1995-2000 = 0 (4,1) F(5,5) = 187.12 Prob > F = 0.0000 (4,2) F(5,5) = 190.49 Prob > F = 0.0000 (4,3) F(5,5) = 32.88 Prob > F = 0.0008
38

the coefficients from specification [4.2] and [4.3] more than double the value of
coefficient of specification [4.1]. In the case of the 1980-1984 cohort we notice that while
for specification [4.1] the coefficient turns out to be negative, specifications [4.2] and
[4.3], although decreasing, remain positive. Moreover, for the 1985-1989 cohort the three
coefficients report a recovery but still, the result from specification [4.1] stays negative
while coefficients from specifications [4.2] and [4.3] remain positive. Conversely, for the
1990-1994 cohort we distinguish that for all specifications the coefficients show an
important decrease and are negative. Nevertheless, the estimate from specification [4.1]
shows the lowest entry effect relative to immigrants coming before 1970. Lastly, the
1995-2000 cohort shows a recovery for all specifications but still a negative value for
specifications [4.1] and [4.2].
Table 17
Cohort Effects Eq. 4.1 Eq. 4.2 Eq. 4.3 1970-1974 0.0864 0.0945 0.0907 (0.0140)*** (0.0131)*** (0.0129)***1975-1979 0.0154 0.0384 0.0434 (0.0160) (0.0162)* (0.0148)** 1980-1984 -0.0141 0.0187 0.0302 (0.0235) (0.0212) (0.0195) 1985-1989 -0.0069 0.0415 0.0656 (0.0265) (0.0235) (0.0179)** 1990-1994 -0.1880 -0.1061 -0.0698 (0.0211)*** (0.0282)** (0.0317)* 1995-2000 -0.1107 -0.0338 0.0274 (0.0462)* (0.0396) (0.0407) Labor market control variable unemployment rate YES NO NO employment rate NO YES NO Activity rate NO NO YES Robust standard errors in parentheses * significant at 10%; ** significant at 5%; *** significant at 1%
The use of different controls for period effects affect the sign, magnitude and
significance of the entry effects. Nonetheless, despite the labor market control variable,
all the specifications show the same downturns and upturns. Hence, as regards to cohort
effects, when using unemployment rate to control for period effects, like Aydemir and
Skuterud (2005), we find that there has been a deterioration of entry earnings which is in
39

line with the finding of most researchers. However, our results report positive coefficients
for the 1970-1974 and 1975-1979 cohorts and smaller negative effects for subsequent
cohorts than the results from Aydemir and Skuterud (2005), which report more important
and increasing negative effects. Nevertheless, our results, like theirs, show a strong
deterioration for the 1990-1994 cohort and a recovery for the 1995-2000 cohort. When
using other market labor related variables, however, we find negative entry effects to be
not as large and significant as when using unemployment rate.16
6.2.2. Returns to experience In table 18 we can see the estimates relative to Canadian and foreign years of working
experience. Regarding the return to Canadian years of experience for native-born
Canadians, we observe that it does not present important changes when using different
labor market related variables to control for period effects. Table 18 shows that the
returns to Canadian experience for native-born for all estimations is on average 4.44
percent. Once more, we can see that for immigrants there is no statistically significant
difference in the returns to Canadian experience relative to native-born. Nevertheless,
when looking at the returns to Canadian experience of different arrival cohorts relative to
the immigrants arriving before 1970, we can observe some similarities and differences
across specifications. Firstly, we remark for specifications [4.1] to [4.3] that in general
the returns to Canadian experience for immigrant cohorts between 1970 and 1989 seem
to be inferior to the returns for immigrants arriving before 1970. Secondly, we see that
the three specifications follow the same downturns and upturns. Nevertheless, when
looking at the magnitudes of the coefficients, the specification [4.1] shows larger
negative values than specifications [4.2] and [4.3].17
16 Differences from our results and others can be explained for many reasons. For instance, we only used 3 censuses from the 1990’s while Aydemir and Skuterud (2005) also use censuses from the 1980’s. Moreover, for our research, we use the Public users micro files, which have only a sample of the population and have variables that are top coded or grouped whereas Aydemir and Skuterud (2005) have access to the complete census files and less coding restrictions which could provoke miss-measurement biases in our results. Others source of differences are that we limit the scope of our research to investigate sheepskin effects and the sensibility of the results due to changes in the labor market related variable while Aydemir and Skuterud (2005) follow Green and Worswick (2003) in order to control for entry effects for native-born Canadians. 17 After performing a Wald test of joint significance for the three specifications we reject the null hypothesis at 1 percent for specifications 4,1 and 4,2 and at 10 percent for 4,3 of the following test: test can_exp*c1975-1979*imm1 = 0 can_exp*c1980-1984*imm1 = 0 can_exp*c1985-1989*imm1 = 0 can_exp*c1990-1994*imm1 = 0 can_exp*c1995-2000*imm1 = 0
40

Table 18
Returns to Canadian and Foreign Experience Eq.4.1 Eq.4.2 Eq.4.3 Canadian experience 0.0441 0.0444 0.0448 (0.0014)*** (0.0015)*** (0.0014)*** Canadian experienceXimmigrant -0.0050 -0.0029 -0.0025 (0.0034) (0.0033) (0.0036) Canadian experienceX1970-1974Ximmigrant -0.0051 -0.0046 -0.0036 (0.0005)*** (0.0004)*** (0.0005)*** Canadian experienceX1975-1979Ximmigrant -0.0020 -0.0017 -0.0006 (0.0004)*** (0.0004)*** (0.0003) Canadian experienceX1980-1984Ximmigrant -0.0023 -0.0018 -0.0002 (0.0013) (0.0015) (0.0014) Canadian experienceX1985_1989Ximmigrant -0.0065 -0.0063 -0.0044 (0.0017)** (0.0020)** (0.0018)* Canadian experienceX1990-1994Ximmigrant 0.0081 0.0050 0.0073 (0.0038)* (0.0041) (0.0038) Canadian experienceX1995_2000Ximmigrant 0.0051 0.0020 0.0023 (0.0089) (0.0095) (0.0095) Canadian experience2 -0.0007 -0.0007 -0.0007 (0.0000)*** (0.0000)*** (0.0000)*** Canadian experience2Ximmigrant 0.0000 0.0000 0.0000 (0.0001) (0.0001) (0.0001) ForeignXCanadian experienceXimmigrant -0.0005 -0.0005 -0.0005 (0.0000)*** (0.0000)*** (0.0000)*** Foreign experienceXimmigrant 0.0121 0.0118 0.0114 (0.0007)*** (0.0007)*** (0.0007)*** Foreign experience2Ximmigrant -0.0003 -0.0003 -0.0003 (0.0000)*** (0.0000)*** (0.0000)*** Labor market control variable Unemployment rate YES NO NO employment rate NO YES NO activity rate NO NO YES Robust standard errors in parentheses * significant at 10%; ** significant at 5%; *** significant at 1%
In this sense, the use of different labor market related variables to control for period
effects is affecting the magnitude of the coefficients and the statistical significance but
not the patterns of deterioration (and recovery).
With regards to the foreign experience coefficients in Table 18, we observe these
being statistically significant in all specifications and although the specifications [4.2] (4,1) F(5,5) = 190.58 Prob > F = 0.0000 (4,2) F(5,5) = 454.39 Prob > F = 0.0000 (4,3) F(5,5) = 4.34 Prob > F = 0.0666
41

and [4.3] show slightly lower returns than specification [4.1], the differences are very
tiny. In general we detect that returns to foreign experience are in all cases small
compared to immigrants’ returns to Canadian experience18. So, despite the changes in
labor market control variables, we still observe foreign experience has a lower impact in
wages than Canadian experience for immigrants.
6.2.3. Returns to schooling As to the coefficients of returns to schooling for specifications [4.1], [4.2] and [4.3],
Table 20 summarizes the results. We observe that the return to one more year of
Canadian schooling for native-born when using unemployment rate (specification [4.1])
or employment rate (specification [4.2]) is around 4.26 percent while for the estimation
using activity rate (specification [4.3]) the return is slightly higher. Conversely, for
immigrants the returns for Canadian schooling in specification [4.1] are about 1.77
percent whereas for specification 4.2 they are 1.98 percent and finally for specification
[4.3] they are 2.18 percent. Thus, when changing the labor market control variable we
observe immigrants’ returns to Canadian schooling increase. For instance, while for
specification [4.1] immigrants’ returns to Canadian schooling represent about 41.41
percent of the returns to a native-born, for specification [4.2] these represent 46.48
percent and for [4.3] these represent 50.20 percent. Finally, when we revise the return of
one more year of foreign schooling, we notice that these returns only present tinny
increases when changing the labor market control variable from unemployment rate to
employment rate or activity rate. Finally, although it seems that foreign returns are higher
than Canadian returns for immigrants, when testing for this possibility we fail to reject
the null hypothesis of equality19.
18 After performing a Wald test we reject the null hypothesis for all specifications of the following premise: Test canadian_exp+canadian_exp*imm1=foreign_exp (4,1) F(1,5) = 113.49 Prob > F = 0.0001 (4,2) F(1,5) = 187.65 Prob > F = 0.0000 (4,3) F(1,5) = 150.65 Prob > F = 0.0001 19 When testing equal immigrants’ returns to Canadian schooling and foreign schooling, we fail to reject the null hypothesis: test shclyrs_can+ shclyrs_can*imm1= shclyrs_foreign (4.1) F(1,5) = 3.13 Prob > F = 0.1371 (4.2) F(1,5) = 0.33 Prob > F = 0.5899 (4.3) F(1,5) = 0.96 Prob > F = 0.3727
42
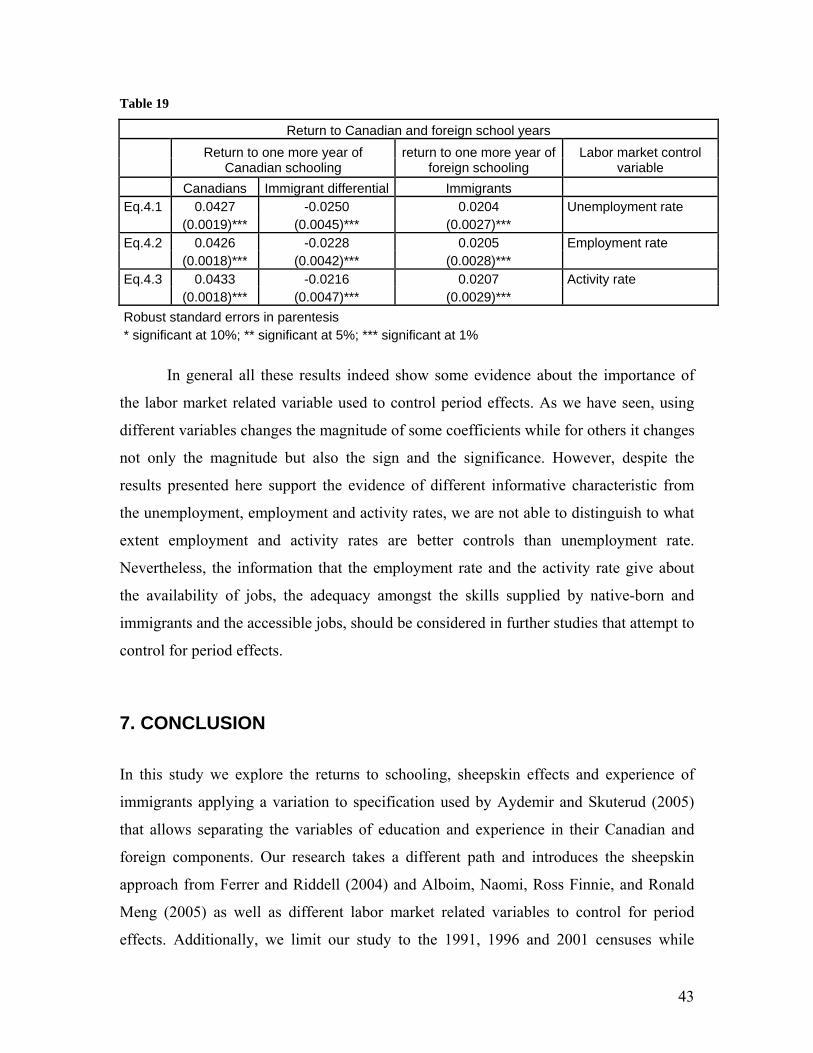
Table 19
Return to Canadian and foreign school years
Return to one more year of Canadian schooling
return to one more year of foreign schooling
Labor market control variable
Canadians Immigrant differential Immigrants Eq.4.1 0.0427 -0.0250 0.0204 Unemployment rate (0.0019)*** (0.0045)*** (0.0027)*** Eq.4.2 0.0426 -0.0228 0.0205 Employment rate (0.0018)*** (0.0042)*** (0.0028)*** Eq.4.3 0.0433 -0.0216 0.0207 Activity rate (0.0018)*** (0.0047)*** (0.0029)*** Robust standard errors in parentesis * significant at 10%; ** significant at 5%; *** significant at 1%
In general all these results indeed show some evidence about the importance of
the labor market related variable used to control period effects. As we have seen, using
different variables changes the magnitude of some coefficients while for others it changes
not only the magnitude but also the sign and the significance. However, despite the
results presented here support the evidence of different informative characteristic from
the unemployment, employment and activity rates, we are not able to distinguish to what
extent employment and activity rates are better controls than unemployment rate.
Nevertheless, the information that the employment rate and the activity rate give about
the availability of jobs, the adequacy amongst the skills supplied by native-born and
immigrants and the accessible jobs, should be considered in further studies that attempt to
control for period effects.
7. CONCLUSION
In this study we explore the returns to schooling, sheepskin effects and experience of
immigrants applying a variation to specification used by Aydemir and Skuterud (2005)
that allows separating the variables of education and experience in their Canadian and
foreign components. Our research takes a different path and introduces the sheepskin
approach from Ferrer and Riddell (2004) and Alboim, Naomi, Ross Finnie, and Ronald
Meng (2005) as well as different labor market related variables to control for period
effects. Additionally, we limit our study to the 1991, 1996 and 2001 censuses while
43

Ferrer and Riddell (2004) and Aydemir and Skuterud (2005) among others also use the
1980’s censuses. Nonetheless these differences and our data limitation to the 1990’s
censuses, our results are consistent with the literature. They show that regarding
experience, the return of one more year of Canadian experience is not lower for
immigrants than for native-born Canadians. Nonetheless, when we allow different
assimilation patterns for Canadian experience and include sheepskin effects, we observe
deterioration in the returns to Canadian experience relative to the returns for immigrants
arriving before 1970. We also observe a recovery in these returns for the two most recent
cohorts (1990-1994 and 1995-2000), where the return to one more year of Canadian
experience approaches the return of Canadian experience for immigrants arriving before
1970. On the other hand, the return to foreign experience for immigrants is small
compared to the returns to Canadian experience. Thus, our evidence plus the results
collected in the researches of Schaafsma and Sweetman (2001) and Aydemir and
Skuterud (2005) point out that returns to foreign experience are tiny, thus indicating a
low transferability of this kind of human capital. Furthermore, the estimates concerning
region of origin support the conclusions of Bloom, Gernier and Gunderson (1995) Green
and Worswick (2003, 2004), Ferrer and Riddell (2004), Sweetman (2004) and Aydemir
and Skuterud (2005) among others regarding the negative effects on wages from the shift
of traditional source countries to non-traditional source countries, particularly from Asia
and Latin America. Additionally, separating schooling effects from sheepskin effects
shows that returns to Canadian schooling are lower for immigrants than for native-born
whereas the sheepskin effects are higher for immigrants, which again is in line with the
results from Alboim, Finnie and Meng (2005) and Ferrer and Riddell (2004).
Furthermore, the fact of separating schooling in its foreign and Canadian components
permits us to observe and provide further evidence in the direction of Schaafsma and
Sweetman (2001) and Aydemir and Skuterud (2005). Like them, we find differences in
the returns to Canadian schooling among native-born and immigrants, being lower for the
latter. In addition, we also notice that returns to foreign schooling are not different to
immigrants’ returns to Canadian schooling across all specifications.
On the subject of sheepskin effects, we detect that diplomas have an important
effect on wages of natives and immigrants. Moreover, when allowing interactions of
44

sheepskin effects with the immigration dummy, we observe that for immigrants the
sheepskin effects are remarkably large for university diplomas. Although for native-born
we find no significant difference between the sheepskin effect of a master diploma and a
PhD, for immigrants we do find statistically different sheepskin effects at these levels.
As regards to cohort effects, when using unemployment rate to control for period
effects like Aydemir and Skuterud (2005), we find that there has been a deterioration of
entry earnings which is in line with the finding of most researches. Specifically, we find
results showing a strong deterioration for the 1990-1994 cohort and a recovery for the
most recent 1995-2000 cohort. However, when using other market labor related variables
we find negative entry effects to be not as large and significant as when using
unemployment rate. Additionally, we observe that when using unemployment,
employment and activity rates to control for period effects, results change notably
regarding estimates for province, cohorts and experience. Our results are an attempt to
encourage their use. Thus, we believe these variables should be employed in further
research. Nevertheless, since this study only uses the Public User Micro-data Files from
the last three Canadian censuses to construct a pooled sample, additional studies using
more censuses and more precision in some socio-economic and demographic variables
are needed.
45

8. TABLES
Table 1
Sample Means by immigrant status Variable Canadians Immigrants Earnings log (weekly wage)(*) 6.6912 6.6640 (0.6604) (0.7128) Potential experience years years of Canadian experience 20.4897 17.0644 (10.7796) (10.3876) years of foreign experience 6.9807 (8.0500) Canadian experience2 536.0264 399.0938 (504.0554) (407.4315) Foreign experience2 113.5310 (221.7315) Foreign experience*Canadian experience 95.4346 (124.7745) Schooling years Canadian schooling years 13.0709 2.9719 (2.7090) (5.0917) foreign schooling years 10.4093 (5.5590) Highest degree or diploma No diploma 0.2113 0.2118 (0.4082) (0.4086) secondary diploma 0.2380 0.1742 (0.4259) (0.3793) school of trades diploma 0.1628 0.1556 (0.3692) (0.3625) collegial diploma 0.1688 0.1541 (0.3746) (0.3610) University certificate 0.0214 0.0311 (0.1449) (0.1736) bachelor degree 0.1538 0.1793 (0.3607) (0.3836) Master degree 0.0369 0.0654 (0.1884) (0.2472) PhD degree 0.0070 0.0286 (0.0835) (0.1666)
46

(Table 1 continues…) Sample Means by immigrant status Variable Canadians Immigrants Province of residence Ontario 0.3974 0.5987 (0.4894) (0.4902) Quebec 0.2905 0.1168 (0.4540) (0.3212) Manitoba 0.0464 0.0312 (0.2103) (0.1737) Saskatchewan 0.0375 0.0097 (0.1900) (0.0978) Alberta 0.1133 0.0910 (0.3169) (0.2876) British Columbia 0.1150 0.1527 (0.3190) (0.3597) Other characteristics Age 39.5606 43.4263 (10.1069) (10.3946) Metropolitan area 0.6469 0.8793 (0.4779) (0.3258) Married 0.6275 0.7685 (0.4835) (0.4218) Knowledge of official languages Knowledge of English 0.6394 0.8242 (0.4802) (0.3807) Knowledge of French 0.1252 0.0208 (0.3309) (0.1429) Knowledge of both 0.2354 0.1353 (0.4243) (0.3421) Knowledge of neither 0.0000 0.0197 (0.0000) (0.1389)
47

(Table 1 continues…) Sample Means by immigrant status Variable Canadians Immigrants Region of birth US-England 0.2050 (0.4037) Europe 0.3438 (0.4750) Asia 0.2779 (0.4480) Africa 0.0492 (0.2162) Latin-America 0.1138 (0.3176) other regions 0.0103 (0.1011) Immigration cohort Before 1970 0.3067 (0.4611) 1970 - 1974 0.1398 (0.3468) 1975 - 1979 0.1935 (0.3951) 1980 - 1984 0.0900 (0.2861) 1985 - 1989 0.1264 (0.3323) 1990 - 1994 0.0954 (0.2938) 1995 - 2000 0.0482 (0.2142) Observations 195,348 48,699 (*) based on wages at constant prices (index, 2000=100) Standard Errors in parenthesis
48

Table 2
Schooling by immigrant status and Census year (%) (Males) Census 1991 Census 1996 Census 2001
Schooling Canadian immigrant Canadian immigrant Canadian immigrant No schooling 2.27 4.64 1.95 4.41 1.58 3.84
Primary 11.86 13.3 10 11.12 8.14 8.93 Secondary 27.61 16.36 26.24 15.96 23.62 13.96
College 28.64 25.21 29.14 24.97 30.82 25.39 University 22.93 28.72 25.29 30.77 26.94 31.81
Pos-university 6.69 11.76 7.38 12.77 8.9 16.07 Total 100 100 100 100 100 100
Source: Estimated by the author with data from the 1991, 1996 & 2001 Canadian Censuses
Table 3
Highest degree by immigrant status and Census year (%) (Males) Census 1991 Census 1996 Census 2001 Highest diploma Canadian Immigrant Canadian Immigrant Canadian Immigrant No diploma 40.93 36.41 37.76 33.15 34.65 29.77 Secondary 22.09 18.12 22.22 18.04 22.75 18.66 School of trades 14.23 15.74 13.86 14.01 14.46 12.87 Collegial 9.56 10.05 11.64 12.19 12.64 11.79 University certif. 1.45 2.29 1.65 2.95 1.72 3.21 Bachelor 9.44 12.06 10.22 13.57 10.93 16.18 Master 1.95 3.85 2.20 4.31 2.41 5.44 PhD 0.37 1.47 0.44 1.79 0.45 2.08 Total 100.00 100.00 100.00 100.00 100.00 100.00
Source: Estimated by the author with data from the 1991, 1996 & 2001 Canadian Censuses Table 4
Knowledge of official languages by immigrant status and Census year (%) (Males) Census 1991 Census 1996 Census 2001 languages Canadian Immigrant Canadian Immigrant Canadian Immigrant English 65.57 79.48 65.61 78.83 66.09 79.21 French 16.47 3.46 15.69 3.44 14.7 3.13 Both 17.6 12.52 18.27 12.42 18.89 12.89 Neither 0.36 4.54 0.43 5.31 0.32 4.77 Total 100 100 100 100 100 100
Source: Estimated by the author with data from the 1991, 1996 & 2001 Canadian Censuses
49

Table 5
Immigrants by birth region and Census year (%)(Males)
Birth region Census
1991 Census
1996 Census
2001 US-England 20.88 17.20 14.14Europe 39.48 34.92 31.78Asia 24.68 31.56 37.21Africa 4.30 4,92 5,64Latin-America 9.85 10,53 10,33Others 0.81 0.87 0.89Total 100.00 100.00 100.00
Source: Estimated by the author with data from the 1991, 1996 & 2001 Canadian Censuses
Table 6
Sample average weekly wages by schooling, immigrant status and census year 1991 1996 2001 Schooling Canadian immigrant Canadian immigrant Canadian immigrant no_schooling 599.90 690.21 629.55 611.57 609.63 595.85 Primary 722.53 738.52 712.57 693.71 696.55 716.87 Secondary 798.91 744.14 770.70 723.91 771.00 735.94 College 861.28 855.91 843.89 792.80 840.78 796.37 University 1025.97 1027.98 1022.25 981.03 1070.47 1007.49 Pos-university 1251.01 1261.54 1236.34 1216.94 1279.36 1210.06
Source: Estimated by the author with sample data from the 1991, 1996 & 2001 Canadian Censuses at constant prices (base year 2000) Table 7
Sample average weekly wages by highest degree, immigrant status and census year Highest 1991 1996 2001 Diploma Canadian immigrant Canadian immigrant Canadian immigrant No diploma 631.63 606.98 689.67 635.52 756.23 702.92 Secondary 708.42 677.00 765.03 696.82 836.68 773.46 School of trades 734.69 765.59 822.69 819.42 903.79 913.69 Collegial 782.41 831.66 870.64 864.07 988.53 969.41 University certif. 896.67 839.94 973.14 868.29 1119.03 920.43 Bachelor 989.40 965.85 1091.70 1029.60 1287.80 1149.39 Master 1145.63 1064.62 1273.34 1187.63 1482.45 1283.70 PhD_d 1226.71 1290.56 1351.12 1341.04 1508.80 1492.30
Source: Estimated by the author with sample data from the 1991, 1996 & 2001 Canadian Censuses at constant prices (base year 2000)
50

Table 8
Sample average weekly wages by region of origin and census year Region of origin 1991 1996 2001Canada 934.36 934.77 967.34US-England 1147.84 1152.79 1194.98Europe 959.81 951.69 991.74Asia 822.14 778.49 842.12Africa 957.38 919.64 962.63Latin-America 790.27 767.34 800.10Others 976.04 882.61 998.44
Source: Estimated by the author with sample data from the 1991, 1996 & 2001 Canadian Censuses at constant prices (base year 2000)
51

Table 9
Eq.1 Eq.2 Eq.3 Eq.4 log(weekly wage) log(weekly wage) log(weekly wage) log(weekly wage) Immigration status Immigrant 0.475486 0.4096334 0.3789304 0.5290844 (0.1050490)*** (0.1034589)** (0.0957303)** (0.1040340)*** Potential Experience Canadian experience 0.0430807 0.0430809 0.044148 0.0441039 (0.0013929)*** (0.0013935)*** (0.0013783)*** (0.0013870)*** Canadian experienceXimmigrant -0.0081983 -0.0037758 -0.004998 -0.0050084 (0.0032680)* (0.0030631) (0.0032807) (0.0034019) Foreign experienceXimmigrant 0.0111269 0.0110702 0.0119775 0.0121192 (0.0009180)*** (0.0009440)*** (0.0007928)*** (0.0006937)*** Canadian experience2 -0.0006428 -0.0006428 -0.0006884 -0.0006834 (0.0000412)*** (0.0000412)*** (0.0000388)*** (0.0000383)*** Canadian experience2Ximmigrant 0.0000658 -0.0000027 0.0000379 0.0000296 (0.0000723) (0.0000704) (0.0000708) (0.0000726) Foreign experience2Ximmigrant -0.000254 -0.0002546 -0.0002824 -0.0002905 (0.0000497)*** (0.0000501)*** (0.0000447)*** (0.0000419)*** ForeignXCanadian experienceXimmigrant -0.0003191 -0.0003118 -0.0004536 -0.0005026 (0.0000405)*** (0.0000442)*** (0.0000317)*** (0.0000314)*** Schooling years Canadian school years 0.0750454 0.0750465 0.0390367 0.0427388 (0.0034173)*** (0.0034164)*** (0.0014916)*** (0.0018676)*** Canadian school yearscXimmigrant -0.0142219 -0.0140764 -0.0117967 -0.025038 (0.0040118)** (0.0040674)** (0.0029146)*** (0.0044998)*** Foreign shool yearsXimmigrant 0.0618308 0.0619596 0.0297361 0.0203628 (0.0033871)*** (0.0033828)*** (0.0020402)*** (0.0027159)*** Province of residence Quebec -0.1169045 -0.1167184 -0.1135841 -0.1133766 (0.0137022)*** (0.0137354)*** (0.0155910)*** (0.0154205)*** Manitoba -0.1654308 -0.1653739 -0.1639273 -0.1641436 (0.0035170)*** (0.0035238)*** (0.0033940)*** (0.0033829)*** Saskatchewan -0.154914 -0.154891 -0.1539968 -0.1544714 (0.0074184)*** (0.0073893)*** (0.0072303)*** (0.0072380)*** Alberta -0.0359719 -0.0359903 -0.029257 -0.0299089 (0.0041088)*** (0.0041303)*** (0.0041948)*** (0.0042570)*** British columbia -0.0147425 -0.0146507 -0.0064007 -0.0063804 (0.0070880)* (0.0071491)* (0.0076128) (0.0075564) Living in urban area and marital status Metropolitan area 0.0859579 0.0859056 0.0798378 0.0802741 (0.0187863)*** (0.0187826)*** (0.0190464)*** (0.0191795)*** Married 0.1874859 0.1874611 0.1802386 0.1800489 (0.0104823)*** (0.0104718)*** (0.0097750)*** (0.0098848)*** Knowledge of official languages French -0.0660959 -0.0661397 -0.0809824 -0.0807558 (0.0157173)*** (0.0156368)*** (0.0144780)*** (0.0139952)***
52

(Table 9 continues…) Both 0.0383226 0.0382932 0.0175788 0.0176356 (0.0074129)*** (0.0073923)*** (0.0073717)* (0.0067800)** Neither -0.0721125 -0.0712956 -0.0907016 -0.0999973 (0.0175432)*** (0.0171659)*** (0.0200750)*** (0.0204764)*** Region of origin Europe -0.093373 -0.0939296 -0.0976189 -0.1006846 (0.0148293)*** (0.0143931)*** (0.0174872)*** (0.0174577)*** Asia -0.2507057 -0.2509272 -0.2665361 -0.269297 (0.0062918)*** (0.0061720)*** (0.0092448)*** (0.0110316)*** Africa -0.1846593 -0.1849718 -0.1954825 -0.198162 (0.0202648)*** (0.0200442)*** (0.0232830)*** (0.0244712)*** Latin-America -0.2542993 -0.2536614 -0.2419178 -0.23766 (0.0257443)*** (0.0255406)*** (0.0235320)*** (0.0229122)*** Other region -0.054994 -0.0534913 -0.0456871 -0.0416918 (0.0455520) (0.0457251) (0.0387751) (0.0365584) Arrival cohorts and interactions 1970-1974Ximmigrant -0.015613 0.0921053 0.0878406 0.0863636 (0.0133785) (0.0186922)*** (0.0147259)*** (0.0140230)*** 1975-1979Ximmigrant -0.0313334 0.0151721 0.0134045 0.015376 (0.0177945) (0.0190349) (0.0164212) (0.0159823) 1980-1984Xmmigrant -0.0586445 -0.0038274 -0.0127919 -0.0140845 (0.0238712)* (0.0238874) (0.0219967) (0.0234758) 1985-1989Ximmigrant -0.0768182 0.0177774 -0.002821 -0.0068527 (0.0334978)* (0.0286862) (0.0256851) (0.0264720) 1990-1994Ximmigrant -0.1639367 -0.1509315 -0.1808524 -0.187973 (0.0245238)*** (0.0248640)*** (0.0205285)*** (0.0210633)*** 1995-2000Ximmigrant -0.0966042 -0.0437321 -0.0949985 -0.1106869 (0.0304659)** (0.0412847) (0.0423511)* (0.0461700)* Canadian experienceX1970-1974Ximmigrant -0.0049958 -0.0050478 -0.0050602 (0.0006276)*** (0.0005268)*** (0.0005444)*** Canadian experienceX1975-1979Ximmigrant -0.0020247 -0.0019558 -0.0020407 (0.0003859)*** (0.0003980)*** (0.0004187)*** Canadian experienceX1980-1984Ximmigrant -0.0025961 -0.0022951 -0.002267 (0.0009941)** (0.0012023) (0.0013073) Canadian experienceX1985-1989Ximmigrant -0.0075399 -0.0066583 -0.0065029 (0.0012075)*** (0.0015707)*** (0.0017019)** Canadian experienceX1990-1994Ximmigrant 0.0055907 0.0075483 0.0080974 (0.0036654) (0.0037143)* (0.0037805)* Canadian experienceX1995_2000Ximmigrant 0.0006571 0.0038665 0.0051184 (0.0095665) (0.0089687) (0.0088601) Diplomas and interactions Secondary 0.0673904 0.068551 (0.0044641)*** (0.0040447)*** School of trades 0.1182988 0.1107573 (0.0097518)*** (0.0103901)***
53

(Table 9 continues…) College 0.1722678 0.1588403 (0.0186716)*** (0.0246099)*** University certificate 0.1948963 0.1892208 (0.0282901)*** (0.0294069)*** Bachelor 0.3289443 0.3040937 (0.0226160)*** (0.0250915)*** Master 0.3703099 0.3294834 (0.0274464)*** (0.0318596)*** PhD 0.4411679 0.3334241 (0.0258213)*** (0.0477652)*** Secondary diplomaXimmigrant -0.0189688 (0.0199591) School of tradesXimmigrant 0.0360156 (0.0126680)** CollegeXimmigrant 0.0558435 (0.0255129)* University certificateXimmigrant 0.0267437 (0.0240355) BachelorXimmigrant 0.0986741 (0.0228219)*** Master degreeXimmigrant 0.1451256 (0.0230383)*** PhDXimmigrant 0.2615553 (0.0396449)*** Labor market related variable Unemployment rate 0.0072992 0.0072771 0.0065102 0.0066396 (0.0039498) (0.0039562) (0.0041029) (0.0040547) Unemployment rateXimmigrant -0.0097693 -0.0099428 -0.0104171 -0.0112163 (0.0023084)*** (0.0023343)*** (0.0026139)** (0.0029077)** Constant 4.9881189 4.9882889 5.3447747 5.3027084 (0.0647721)*** (0.0646643)*** (0.0515744)*** (0.0534921)*** Observations 244047 244047 244047 244047 R-squared 0.2 0.2 0.21 0.21 Robust standard errors in parentheses * significant at 10%; ** significant at 5%; *** significant at 1%
The excluded categories for all regressions are: province: Ontario; Cohort: before 1970; Highest Degree: no diploma; Knowledge of Official Language: English; Civil status: Not married. The dependent variable is log weekly wage at constant prices of 2000. Sample is limited to fulltime male workers persons between 20-65 years old with positive wage that have worked at least 30 hours per week and 52 weeks per year in the reference year. Only permanent residents living in Quebec, Ontario and the western provinces were included in the group.
54
Table 10
Eq.4.1 Eq.4.2 4 3 log(weekly wage) log(weekly wage) log(weekly wage) Immigration status Immigrant 0.5290844 0.2424131 0.3680987 (0.1040340)*** (0.2256192) (0.2170860) Potential Experience Canadian expericne 0.0441039 0.0443624 0.0447727 (0.0013870)*** (0.0015459)*** (0.0014287)*** Canadian experienceXimmigrant -0.0050084 -0.0029051 -0.0025117 (0.0034019) (0.0032753) (0.0035854) Foreign experienceXimmigrant 0.0121192 0.0118004 0.0114128 (0.0006937)*** (0.0007275)*** (0.0007283)*** Canadian experience2 -0.0006834 -0.0006874 -0.0006924 (0.0000383)*** (0.0000405)*** (0.0000391)*** Canadian experience2Ximmigrant 0.0000296 0.0000164 0.0000302 (0.0000726) (0.0000749) (0.0000751) Foreign_experience2Ximmigrant -0.0002905 -0.0002867 -0.0002798 (0.0000419)*** (0.0000421)*** (0.0000419)*** ForeignXCanadian experienceXimmigrant -0.0005026 -0.0004874 -0.0004726 (0.0000314)*** (0.0000331)*** (0.0000349)*** Schooling years Canadian school years 0.0427388 0.0426343 0.0433364 (0.0018676)*** (0.0018484)*** (0.0018232)*** Canadian school yearsXimmigrant -0.025038 -0.0228178 -0.0215785 (0.0044998)*** (0.0042256)*** (0.0046899)*** Foreign school yearsXimmigrant 0.0203628 0.020493 0.0206569 (0.0027159)*** (0.0027895)*** (0.0028795)*** Province of residence Quebec -0.1133766 -0.0623368 -0.0729128 (0.0154205)*** (0.0137262)*** (0.0093696)*** Manitoba -0.1641436 -0.1615411 -0.1616728 (0.0033829)*** (0.0032312)*** (0.0027929)*** Saskatchewan -0.1544714 -0.181426 -0.1823214 (0.0072380)*** (0.0081927)*** (0.0091847)*** Alberta -0.0299089 -0.0939951 -0.1110107 (0.0042570)*** (0.0078137)*** (0.0113468)*** British Columbia -0.0063804 0.0254703 0.0184055 -0.0075564 (0.0039371)*** (0.0006965)*** Living in urban area and marital status Metropolitan area 0.0802741 0.0458835 0.0429745 (0.0191795)*** (0.0260958) (0.0259690) Married 0.1800489 0.1802503 0.1768015 (0.0098848)*** (0.0094097)*** (0.0105797)*** Knowledge of official languages French -0.0807558 -0.0707281 -0.0705499 (0.0139952)*** (0.0129927)*** (0.0122330)***
55

(Table 10 continues…) Both 0.0176356 0.0168025 0.016365 (0.0067800)** (0.0078268)* (0.0080613)* Neither -0.0999973 -0.0986953 -0.0981423 (0.0204764)*** (0.0206642)*** (0.0211473)*** Region of origin Europe -0.1006846 -0.1027562 -0.1042223 (0.0174577)*** (0.0179295)*** (0.0173063)*** Asia -0.269297 -0.2702423 -0.2694235 (0.0110316)*** (0.0112581)*** (0.0111418)*** Africa -0.198162 -0.2012857 -0.2014301 (0.0244712)*** (0.0256926)*** (0.0258228)*** Latin-America -0.23766 -0.2397863 -0.2402122 (0.0229122)*** (0.0241652)*** (0.0247181)*** Other region -0.0416918 -0.0442073 -0.0423675 (0.0365584) (0.0364101) (0.0368429) Arrival cohorts and interactions 1970_1974Ximmigrant 0.0863636 0.0945155 0.0907491 (0.0140230)*** (0.0130785)*** (0.0128513)*** 1975_1979 Ximmigrant 0.015376 0.0383587 0.0434067 (0.0159823) (0.0161787)* (0.0147556)** 1980_1984 Ximmigrant -0.0140845 0.018673 0.0301602 (0.0234758) (0.0212337) (0.0194936) 1985_1989 Ximmigrant -0.0068527 0.0414598 0.0656014 (0.0264720) (0.0234575) (0.0179253)** 1990_1994 Ximmigrant -0.187973 -0.1061264 -0.0697731 (0.0210633)*** (0.0282167)** (0.0317397)* 1995_2000 Ximmigrant -0.1106869 -0.0337887 0.0273635 (0.0461700)* -0.039561 (0.0407145) Canadian experienceX1970-1974Ximmigrant -0.0050602 -0.004576 -0.003596 (0.0005444)*** (0.0004108)*** (0.0005074)*** Canadian experienceX1975-1979Ximmigrant -0.0020407 -0.0017465 -0.0005653 (0.0004187)*** (0.0004292)*** (0.0003121) Canadian experienceX1980-1984Ximmigrant -0.002267 -0.0018466 -0.0002072 (0.0013073) (0.0015120) (0.0014319) Canadian experienceX1985-1989Ximmigrant -0.0065029 -0.0062733 -0.0043501 (0.0017019)** (0.0019721)** (0.0018029)* Canadian experienceX1990-1994Ximmigrant 0.0080974 0.0049811 0.007314 (0.0037805)* (0.0040628) (0.0037574) Canadian experienceX1995-2000Ximmigrant 0.0051184 0.0019561 0.0022623 (0.0088601) (0.0094615) (0.0094713) Diplomas and interactions Secondary 0.068551 0.0695341 0.0704239 (0.0040447)*** (0.0044778)*** (0.0048575)*** School of trades 0.1107573 0.1119178 0.1124221 (0.0103901)*** (0.0102812)*** (0.0106425)***
56
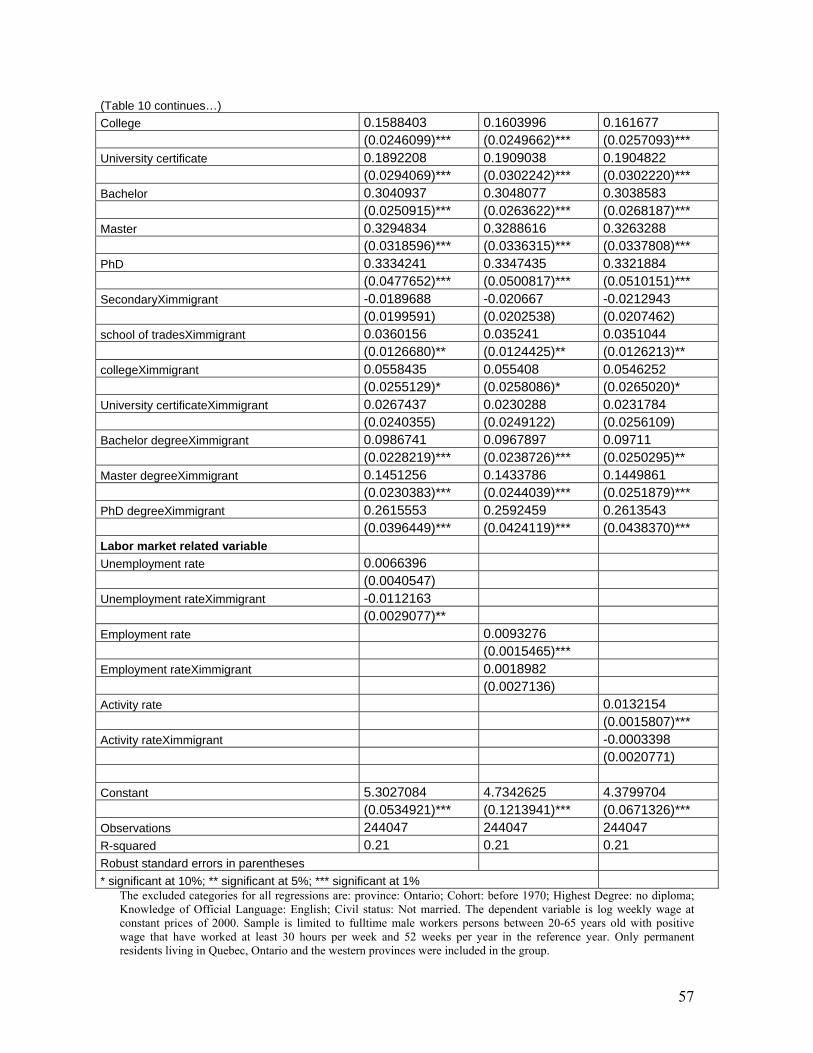
(Table 10 continues…) College 0.1588403 0.1603996 0.161677 (0.0246099)*** (0.0249662)*** (0.0257093)*** University certificate 0.1892208 0.1909038 0.1904822 (0.0294069)*** (0.0302242)*** (0.0302220)*** Bachelor 0.3040937 0.3048077 0.3038583 (0.0250915)*** (0.0263622)*** (0.0268187)*** Master 0.3294834 0.3288616 0.3263288 (0.0318596)*** (0.0336315)*** (0.0337808)*** PhD 0.3334241 0.3347435 0.3321884 (0.0477652)*** (0.0500817)*** (0.0510151)*** SecondaryXimmigrant -0.0189688 -0.020667 -0.0212943 (0.0199591) (0.0202538) (0.0207462) school of tradesXimmigrant 0.0360156 0.035241 0.0351044 (0.0126680)** (0.0124425)** (0.0126213)** collegeXimmigrant 0.0558435 0.055408 0.0546252 (0.0255129)* (0.0258086)* (0.0265020)* University certificateXimmigrant 0.0267437 0.0230288 0.0231784 (0.0240355) (0.0249122) (0.0256109) Bachelor degreeXimmigrant 0.0986741 0.0967897 0.09711 (0.0228219)*** (0.0238726)*** (0.0250295)** Master degreeXimmigrant 0.1451256 0.1433786 0.1449861 (0.0230383)*** (0.0244039)*** (0.0251879)*** PhD degreeXimmigrant 0.2615553 0.2592459 0.2613543 (0.0396449)*** (0.0424119)*** (0.0438370)*** Labor market related variable Unemployment rate 0.0066396 (0.0040547) Unemployment rateXimmigrant -0.0112163 (0.0029077)** Employment rate 0.0093276 (0.0015465)*** Employment rateXimmigrant 0.0018982 (0.0027136) Activity rate 0.0132154 (0.0015807)*** Activity rateXimmigrant -0.0003398 (0.0020771) Constant 5.3027084 4.7342625 4.3799704 (0.0534921)*** (0.1213941)*** (0.0671326)*** Observations 244047 244047 244047 R-squared 0.21 0.21 0.21 Robust standard errors in parentheses * significant at 10%; ** significant at 5%; *** significant at 1%
The excluded categories for all regressions are: province: Ontario; Cohort: before 1970; Highest Degree: no diploma; Knowledge of Official Language: English; Civil status: Not married. The dependent variable is log weekly wage at constant prices of 2000. Sample is limited to fulltime male workers persons between 20-65 years old with positive wage that have worked at least 30 hours per week and 52 weeks per year in the reference year. Only permanent residents living in Quebec, Ontario and the western provinces were included in the group.
57

9. REFERENCES
Abbott, Michael and Beach.M.C. (1993) “Immigrant Earnings Differentials and Birth-
Year Effects for Men in Canada: Post-War 1972” in The Canadian Journal of
Economics Vol.26, No.3, pp.505-524
Alboim, Naomi, R. Finnie, and R. Meng (2005) “The Discounting of Immigrants' Skills
in Canada: Evidence and Policy Recommendations" in IRPP Choices 11, No.2.
Arrow, K. (1973) “Higher Education as a Filter” in Journal of Public Economics, Vol.
2, pp.193- 216.
Aydemir, Abdurrahman and M.Skuterud (2005) “Explaining the Deteriorating Entry
Earnings of Canada’s Immigrant Cohorts: 1966-2000" in Canadian Journal of
Economics, 38(2), May 2005, pp.641-671
Baker, Michael and D.Benjamin (1994) “The Performance of Immigrants in the Canadian
Labor Market” in Journal of Labor Economics, Vol.12, No.3, pp.369-405
Becker, Gary (1964) Human Capital: A Theoretical and Empirical Analysis, with
Special Reference to Education, New York Colombia University Press
Berg, I. (1970) Education and Jobs: the Great Training Robbery, Praeger, New York.
Bloom, David E., G.Gernier and M.Gunderson (1995) “The Changing Labor Market
Position of Canadian Immigrants” in Canadian Journal of Economics, Vol.28,
No.4b, pp.987-1005
Borjas, George J. (1985) “Assimilation, Changes in Cohort Quality, and the Earnings of
Immigrants” in Journal of Labor Economics, Vol.3, No.4, Oct. 1985, pp.463-489
______________ (1995) “Assimilation, Changes in Cohort Quality Revisited: What
Happened to Immigrant Earnings in the 1980's?” in Journal of Labor Economics,
Vol.13, No.2, Apr. 1995, pp. 201-245
Brastberg, Bernt and T.Derek (2002) “School Quality and Returns to Education of U.S
Immigrants” in Economic Inquiry, Vol.40, No.2, April 2002, pp.177-198
Card, David (2000) “Estimating the return to schooling: progress on some persistent
economnetric problems” National Bureau of Economic Research, Working Paper
No.7769, pp.44
58

Citizen and Immigration Canada (August 2005), online
http://www.cic.gc.ca/english/skilled/qual-1.html
Chiswick, Barry R. (1978) “The Effect of Americanization on the Earnings of Foreign-
born men” in The Journal of Political Economy, Vol.86, No.5, Oct. 1978, pp.897-
921
Dolin, Benjamin and M.Young (2004) “Canada's Immigration Program” Background
paper (BP-190E), Library of Parliament, pp.54
Dore, R. (1975) La Fiebre de los Diplomas. Educación, Cualificación y Desarrollo,
Fondo de Cultura Económica. Versión en Castellano, (1983), México.
Ehrenberg, Ronald G., R.Smith and R.P.Chaykowski (2004) Modern Labor Economics
Theory and Public Policy. First Canadian Edition, Pearson-Addison Wesley,
Toronto
Ferrer, Anna. and W.C. Riddell, (2001) “Sheepskin Effects and Returns to Education”
unpublished
_________________________, (2004) “Education, Credentials and Immigrant
Earnings”, UBC working paper 03-07
Frenette, Marc and R.Morissette, (2003) “Will they ever converge? Earnings of
immigrant and Canadian-born workers ever the last two decades”, Statistics
Canada Research Paper, Catalogue no.11F0019MIE – No. 215
Grant, Hugh and A.Sweetman (2004) “Introduction to Economic and Urban Issues in
Canadian Immigration Policy” in Canadian Journal of Urban Research, Vol.13,
Issue 1, pp.1-24
Grant, M.L (1999) “Evidence of new immigrant assimilation in Canada” in Canadian
Journal of Economics, Vol.32, No.4, pp.930-955
Green D. and C.Worswick, (2003) “Immigrant Earnings Profiles in the Presence of
Human Capital Investment: Measuring Cohort and Macro Effects”, unpublished
_______________________, (2004) “Entry Earnings of Immigrant Men in Canada: The
Roles of Labor Market Entry Effects and Returns to Foreign Experience”,
University of British Columbia, prepared for Citizenship and Immigration
Canada.
59

Greene, William H. (1998) Análisis Econométrico, Tercera Edición Prentice Hall,
Version en Castellano, (1999), Madrid
Griliches, Zvi (1977) “Estimating the Returns to Schooling: some Econometric
Problems” in Econometrica, Vol. 45(1), Págs. 1-22.
Hanushek, E., and Kimko, D. (2000) “Schooling, Labor Force Quality, and the Growth
of Nations”. The American Economic Review, Vol.90, No.5, pp.1184-1208
Li, Peter S., (1997) “Self-Employment Among Visible Minority Immigrants, White
Immigrants, and Native-Born Persons in Secondary and Tertiary Industries of
Canada” in Canadian Journal of Regional Science, XX: 1,2, Spring-Summer
1997, pp.103-118.
Mincer, J. (1974) Schooling, Experience and Earnings, Columbia University Press: New
York.
Moulton, Brent R. (1990) “An Illustration of a Pitfall in Estimating the Effects of
Aggregate Variables in Micro Units” in Review of Economics and Statistics
72(2):334-338.
Oreopoulos, Philip “Labor Economics Notes for 14.661” Fall 2004-05, Lecture 11 in
http://ocw.mit.edu/index.html
Pons Blasco, Ana Maria (2004) “Determinación Salarial: Educación y Habilidad.
Análisis Teórico y Empírico del caso Espaniol” Tesis Doctoral, Universitat de
Valencia-Servei de Publicacions, pp.285
Reitz, Jeffery G. (2005) “Tapping Immigrants’ skills. New direction for Canadian
Immigration Policy in the Knowledge Economy” in IRPP Choices 11, No. 1
Rosen, S. (1977) “Human Capital: a Survey of Empirical Research” in Ehremberg R. ed.,
Research in Labor Economics, JAI Press, Greenwich
Rothschild, M. and J.Stiglizt (1976) “Equilibrium in Competitive Insurance Market:
an Essay on the Economics of Imperfect Information” in Quarterly Journal of
Economics, Vol. 60, pp.629-649
Schaafsma, Joseph and A.Sweetman (2001) “Immigrant earnings: age at immigration
matters” in Canadian Journal of Economics, Vol.42, No.4 pp.1067-1099
Spence, M. (1973) “Job Market Signalling” in Quarterly Journal of Economics, Vol. 87,
pp.355-374.
60

Stiglitz, Josheph (1975) “The Theory of Screening, Education and the Distribution of
Income” in American Economic Review, June, pp.283-300.
Sweetman A. (2004) “Immigrant Source Country Educational Quality and Canadian
Labor Market Outcomes”, Research Paper Series Statistics Canada catalogue
11F0019MIE No.234, Human Resources and Skills Development Canada
Tolley, Erin (2003) “The Skilled Worker Class Selection Criteria in the Immigration and
Refugee Protection Act” in Policy Brief, Metropolis Project, No.1, January 2003
Warman, Casey R. and C.Worswick (2004) “Immigrant Earnings Performance in
Canadian Cities: 1981 through 2001” in Canadian Journal of Urban Research,
Vol.13, Issue 1, pp.62-84
Williams, R. L. (2000) “A note on robust variance estimation for cluster-correlated data”
in Biometrics 56: 645–646
Willis, Robert J. (1986) “Wage Determinants: A Survey and Reinterpretation of Human
Capital Earnings Functions” in Orley and Ashenfelter and Richard Layard,
editors, Handbook of Labor Economics (North Holland, Amsterdam and New
York) Vol.1, pp.526-599
Wooldridge, Jeffrey M. (2003) Introductory Econometrics a Modern Approach, Second
Edition, Thomson South-Western
61