IMMIGRANT COLLEGE STUDENTS A Dissertation submitted to the ...
129
THE ROLE OF SOCIAL SUPPORT ON ACCULTURATION STRESS AND ALLOSTATIC LOAD AMONG FIRST- AND SECOND-GENERATION IMMIGRANT COLLEGE STUDENTS by LISA GARSMAN A Dissertation submitted to the Graduate School-Newark Rutgers, The State University of New Jersey In partial fulfillment of the requirements for the degree of Doctor of Philosophy Graduate Program in the School of Nursing written under the direction of Karen D’Alonzo, PhD, RN, APNC, FAAN and approved by ________________________________ ________________________________ ________________________________ ________________________________ Newark, New Jersey October 2017
Transcript of IMMIGRANT COLLEGE STUDENTS A Dissertation submitted to the ...

THE ROLE OF SOCIAL SUPPORT ON
ACCULTURATION STRESS AND ALLOSTATIC LOAD
AMONG FIRST- AND SECOND-GENERATION
IMMIGRANT COLLEGE STUDENTS
by
LISA GARSMAN
A Dissertation submitted to the
Graduate School-Newark
Rutgers, The State University of New Jersey
In partial fulfillment of the requirements
for the degree of
Doctor of Philosophy
Graduate Program in the School of Nursing
written under the direction of
Karen D’Alonzo, PhD, RN, APNC, FAAN
and approved by
________________________________
________________________________
________________________________
________________________________
Newark, New Jersey
October 2017

© 2017
Lisa Garsman
ALL RIGHTS RESERVED

ii
ABSTRACT OF THE DISSERTATION
The Role of Social Support on Acculturation Stress and Allostatic Load
Among First- and Second-Generation Immigrant College Students
By LISA GARSMAN
Dissertation Director:
Karen D’Alonzo, PhD, RN, APNC, FAAN
Purpose: This study examined the relationship between acculturation stress and allostatic
load, and the effect of social support on this relationship among first- and second-
generation immigrant college students.
Rationale: Research suggests acculturation stress may be a contributing factor to chronic
health problems such as obesity, hypertension, Type 2 diabetes, and cardiovascular
disease. Numerous studies have explored the effects of general stress on mental and
physical health, but less is known about the cumulative effect of acculturative stress on
the body’s physiologic processes, referred to as allostatic load. Previous studies have
indicated that factors such as cumulative exposure to chronic stress, age of arrival, and
time living in the United States all contribute to higher levels of allostatic load in new
immigrants. There is strong evidence of the stress-buffering effects of social support

iii
specifically regarding acculturative stress. However, to date little is known about the
effects of social support on acculturative stress and allostatic load.
Methods: A sample of 73 first- and second-generation immigrant undergraduate college
students were recruited from Saint Peter’s University, an ethnically diverse college in
Jersey City. Independent variables were measures of acculturative stress, level of
acculturation, perceived social support, and perceived general stress. Blood biomarkers
were collected and analyzed to calculate a composite score index as a measure of
allostatic load as the dependent variable. Results: Acculturation stress was lower among
individuals who indicated their level of acculturation as being either assimilation or
integration. Although the results of the regression with acculturative stress as the
predictor of total allostatic load was not significant, acculturative stress significantly
predicted systolic and diastolic blood pressure. Friends’ social support and acculturative
stress did significantly predict allostatic load, with higher levels of social support
decreasing allostatic load.
Conclusions: There is increasing evidence that immigrant students who are marginalized
may experience higher levels of acculturative stress compared to those who are more
integrated. The results of this study add to previous findings that higher social support is
associated with lower allostatic load. Future research using longitudinal designs is
necessary to examine health behaviors relating to immigration and their influence on
allostatic load.

iv
ACKNOWLEDGEMENTS
I would like to express my deepest gratitude to my dissertation chair, Dr. Karen
D’Alonzo, for allowing me the opportunity to assist you in your research study early on
in my graduate studies, consequently planting the seed for my research interest in
acculturative stress and allostatic load. Your enthusiasm and passion for immigrant
research truly inspired me. I would never have completed this degree without you as my
mentor. I am forever grateful for your steady guidance and unfailing support.
I am extremely grateful to my committee members, Drs. Btoush, Zha, and Munet-
Vilaro, for their expertise, time, and effort spent giving me feedback. Dr. Zha, thank you
for all of your encouragement and endless patience with me as we worked on the data
analysis.
I owe great thanks to Dr. Thomas Hawkins and Dr. Lucille Eller for helping me to
transition from my perspective as a clinician into the role of nurse scientist. To Dean
Holzemer, thank you for teaching us the “Role of the Nurse Scholar” and how to prepare
and submit a proposal for funding.
To my dear colleagues, Chuck Reuter and Nour Alayan, I thank you for your
friendship, constant encouragement, and emotional support. I feel so lucky to have met
both of you.
v
DEDICATION
To my husband Jay and my sons, Ian and Ethan, I dedicate this work, for their
endless love and support throughout this dissertation journey. I realize the sacrifices you
made, which allowed me to achieve my goals. Words cannot express how grateful and
proud I am to have my beautiful family who never stopped believing in me.

vi
TABLE OF CONTENTS
CHAPTER ONE: DISCUSSION OF THE PROBLEM .................................................. 1
Acculturative Stress, Generational Status, and Allostatic Load ............................. 4
Obesity and Allostatic Load........................................................................... 7
Acculturative Stress and Social Support ........................................................ 10
Acculturative Stress, Allostatic Load, and Immigrant College Students ....... 11
Statement of the Problem ........................................................................................ 12
Sub-problems ................................................................................................. 12
Definition of Terms................................................................................................. 13
Acculturation.................................................................................................. 13
Acculturative Stress ....................................................................................... 13
Allostatic Load ............................................................................................... 14
Social Support ................................................................................................ 15
Generation ...................................................................................................... 15
Delimitations ........................................................................................................... 15
Significance of the Study ........................................................................................ 16
CHAPTER TWO: REVIEW OF THE LITERATURE ................................................... 18
Theoretical Rationale .............................................................................................. 18
Acculturative Stress Model ............................................................................ 18
Allostasis and the Allostatic Load Framework .............................................. 21
Empirical Support for the Relationship Among Acculturation,
Acculturative Stress, and Generational Status ........................................... 24

vii
Empirical Support for the Relationship Between Acculturative
Stress and Allostatic Load ......................................................................... 26
Empirical Support for the Moderating Role of Social Support ..................... 27
Hypotheses .............................................................................................................. 29
CHAPTER THREE: METHODOLOGY ........................................................................ 30
Research Setting...................................................................................................... 30
Sample..................................................................................................................... 31
Measures ................................................................................................................. 31
Dependent Variables ...................................................................................... 31
Independent Variables ................................................................................... 33
Independent variables: Acculturation ................................................... 36
Independent variables: Perceived social support .................................. 37
Independent variables: Perceived stress ................................................ 39
Demographic Questionnaire .......................................................................... 40
Human Subjects Protection ..................................................................................... 43
Data Collection ....................................................................................................... 44
Data Analysis Plan .................................................................................................. 45
CHAPTER FOUR: ANALYSIS OF THE DATA ........................................................... 48
Descriptive Results ................................................................................................. 48
Biomarkers ..................................................................................................... 50
Acculturation.................................................................................................. 52
Acculturative Stress ....................................................................................... 53
Perceived Stress ............................................................................................. 53

viii
Social Support ................................................................................................ 54
Psychometric Properties of Instruments ................................................................. 55
Hypotheses .............................................................................................................. 56
Additional or Ancillary Findings and Analysis of Same ........................................ 67
CHAPTER FIVE: DISCUSSION OF THE FINDINGS ................................................. 68
Findings for Each Hypothesis ................................................................................. 68
Acculturation and Acculturative Stress ......................................................... 68
Acculturative Stress and Allostatic Load ....................................................... 70
Acculturative Stress, Allostatic Load, and Generation .................................. 73
Acculturative Stress, Social Support, and Allostatic Load ............................ 75
CHAPTER SIX: SUMMARY, CONCLUSIONS, IMPLICATIONS,
RECOMMENDATIONS ................................................................................................. 77
Summary ................................................................................................................. 77
Implications for Nursing ......................................................................................... 81
Recommendations ................................................................................................... 83
Limitations .............................................................................................................. 84
Conclusions ............................................................................................................. 85
REFERENCES ................................................................................................................ 86

ix
LIST OF TABLES
Table
1 Classification of Overweight and Obesity by SMI .............................................. 32
2 Description of Study Instruments ........................................................................ 41
3 Description of Dependent and Independent Variables ........................................ 42
4 Cut-off Points for AL Indicators .......................................................................... 43
5 Demographic Characteristics of the Sample ........................................................ 49
6 Gender, Racial Composition, and Generation of the Sample .............................. 50
7 Biological Markers of the Sample ....................................................................... 51
8 Biomarkers by Generation and Gender ................................................................ 52
9 Acculturative Stress, Perceived Stress, and Social Support by Generation
and Gender ........................................................................................................... 54
10 Study Sample Alpha Reliabilities ........................................................................ 56
11 Correlations Between Predictive Variables and Acculturative Stress ................. 57
12 Linear Regression Analysis for Acculturation Stress .......................................... 58
13 Hierarchical Linear Regression Analysis of Acculturative Stress ....................... 59

x
LIST OF FIGURES
Figure
1 The allostatic load model ..................................................................................... 7
2 Model of acculturative stress ............................................................................... 19
3 Lysgaard’s U-Curve of Cultural Adjustment ....................................................... 21
4 The stress response and development of allostatic load ...................................... 23

xi
LIST OF APPENDICES
Appendix
A Demographic Questionnaire .............................................................................105
B S.A.F.E. Acculturation Stress Scale ..................................................................106
C Acculturation, Habits, and Interests Multicultural Scale for Adolescents
(AHIMSA) ........................................................................................................108
D Multidimensional Scale of Perceived Social Support (SPSS) ..........................109
E Perceived Stress Scale .......................................................................................110
F Institutional Review Board Letter .....................................................................111
G Literature Review and Conclusions ..................................................................112

1
CHAPTER ONE: DISCUSSION OF THE PROBLEM
Increasing evidence has suggested that cumulative, persistent psychological and
physiological stress contributes to poor mental and physical health, chronic diseases, and
overall health disparities, especially among disadvantaged individuals (Beckie, Groer, &
Beckie, 2012). For the past 50 years, the United States has experienced multiple waves of
immigration from countries all over the world. The increasing globalization of the US
population is particularly evident in the changing face of today’s college student.
According to the National Center for Educational Statistics (NCES, 2015), the total
enrollment rate (defined as the percentage of 18-24 year-olds enrolled in colleges and
universities) at 2-4-year colleges/universities increased from 32% in 1990 to 40% in
2013. Of particular note, the total enrollment rate for Hispanic 18-to-24-year-olds during
this time period increased from 23% to 34%, with a 62% total college enrollment for
Asians. A significant percentage of students who are ethnic and/or racial minorities are
likely to be first- (foreign-born) or second-generation (children of foreign-born parents)
immigrants. In a study by Schwartz et al. (2011), among 30 diverse colleges and
universities across the U.S., the researchers found that 26% of the students surveyed
reported both of their parents were born outside of the U.S., and these figures may be
even higher in community colleges.
In the immigration literature, there is a strong argument that the term immigrant
should include not only individuals born in another country (first-generation), but also
US-born children of foreign parents or second-generation immigrants (Portes &
Rumbaut, 2001). There is ample evidence that immigrants of all ages may experience
higher levels of psychological stress as they encounter various environmental and social

2
stressors in the host country. These stressors include language barriers, racism and
discrimination, separation from family, and fear of deportation (Arbona et al., 2010).
Second-generation immigrants also face the challenges of balancing their cultural
heritage and customs with American cultural practices. These shared experiences may in
part be explained by the normative process of acculturation, defined as the cultural and
psychological changes that groups or individuals undergo when there is contact between
two or more cultural groups (Berry, 2005). Acculturation is further defined as a dynamic,
bidirectional process of adaptation to stress and the individual’s coping mechanisms in
response to stress (Berry, 2013). Immigrant individuals generally fall into one of four
patterns of acculturation: (a) assimilation—individuals replace the norms of their culture
of origin with the culture norms from the host culture; (b) separation—individuals reject
the host cultural orientation while preserving the culture of origin; (c) integration—
individuals combine aspects of both the culture of origin and the host culture; and (d)
marginalization—individuals become alienated from both the host culture and culture of
origin by rejecting both cultures (Berry, Kim, Minde, & Mok, 1987). In the process of
acculturation, negative experiences may become so unpleasant that they are no longer
viewed as normative and are more appropriately classified as examples of acculturation
stress.
Acculturative stress is a “more specific concept than acculturation” (Hovey,
2000a, n.p.) and refers to a “reduction in health status” resulting from the process of
acculturation (Berry et al., 1987, p. 492). Many first- and second-generation immigrants,
especially those who are adolescents and young adults, are conflicted between preserving
norms and values from their native country and adopting those of the host country,

3
resulting in acculturation stress. Conflicts may arise between such individuals and their
parents over retention of the language and practices of their culture. An immigrant
adolescent’s attempts to “fit in” can create a rift in the family and lead to a subsequent
breakdown in communication with his/her parents, ultimately leading to the teenager’s
engagement in risk-taking behaviors with peers. Unhealthy lifestyle behaviors such as
smoking, drug use, and alcohol use have been identified as coping mechanisms which
adolescents may adopt in an attempt to manage acculturation stress (Finch & Vega, 2003;
Kulis, Marsiglia, & Nieri, 2009; Zamboanga, Schwartz, Jarvis, & Van Tyne, 2009).
Although studies on the effects of general stress on mental and physical health are
found extensively throughout the literature, less is known about the cumulative effects of
acculturative stress on the body and its physiologic processes, referred to as allostatic
load (AL). Numerous studies have shown that factors such as cumulative exposure to
chronic stress, age of arrival, and time living in the United States all contribute to higher
levels of AL in new immigrants (Arevalo, Tucker, & Falcon, 2014; Kaestner, Pearson,
Keene, & Geronimus, 2009; McClure et al., 2015). While high levels of acculturative
stress are often associated with individuals who have newly arrived, their level of
acculturative stress may persist indefinitely if immigrants do not experience a better
quality of life than they had prior to migration (D'Alonzo, Johnson, & Fanfan, 2012).
Using a framework of allostatic load, acculturative stress may be a contributing factor to
chronic health problems such as obesity, hypertension, Type 2 diabetes, and
cardiovascular disease seen among immigrants (Finch, Hummer, Kol, & Vega, 2001;
Katz, Sprang, & Cooke, 2012; O’Brien, Alos, Davey, Bueno, & Whitaker, 2014).

4
Acculturative Stress, Generational Status, and Allostatic Load
Although the conceptual definitions of acculturation and acculturative stress are
clear, the operational definitions of the two terms are more ambiguous. Several studies
have used acculturation measures as a proxy for acculturative stress; others have argued
that the construct of acculturation is confounded with acculturative stress (Caplan, 2007;
Rudmin, 2009). In the early stages of concept development, stressors associated with the
process of acculturation were not perceived as either positive or negative. Subsequently,
the concept of acculturative stress was defined in general terms as the stress that directly
results from and has its source in the acculturation process. Accordingly, individuals who
perceive acculturative stressors as threatening tend to report greater levels of
acculturative stress, compared to those who view the negative experiences as
opportunities (Hovey & Magaña, 2002). Nonetheless, strong evidence throughout the
literature has supported the association of acculturative stress with both negative
psychological and physical health outcomes (Cervantes & Cordova, 2011; Hwang &
Ting, 2008; Torres, Driscoll, & Voell, 2012). Likewise, chronic stress has specifically
been linked with increased visceral adiposity and increased risk for metabolic syndrome
(Aschbacher et al., 2014; Marniemi et al., 2002; Pyykkonen et al., 2010). Abdominal
adiposity and insulin resistance, both key features of metabolic syndrome, markedly
increase an individual’s risk for cardiovascular disease and Type 2 diabetes. Results from
the 19-year Whitehall II study (Brunner, Chandola, & Marmot, 2007) showed that
chronic work stress predicted both general and central obesity. Therefore, persistent
acculturative stress may contribute to increased rates of obesity and metabolic syndrome
in first- and second-generation immigrants.

5
Several factors can affect the level of acculturative stress, including age at time of
immigration. Several early studies have shown that level of acculturative stress was
related to generational status, with first-generation individuals experiencing higher levels
of acculturative stress than second-generation (Hovey & King, 1996; Lueck & Wilson,
2011; Mena, Padilla, & Maldonado, 1987; Padilla, Alvarez, & Lindholm, 1986).
Although all immigrants experience varying degrees of acculturation stress, adolescents
who immigrated to the United States as young children (often referred to as the “1.5”
generation) and children of first-generation immigrants (also known as second-generation
immigrants) may experience acculturation stress in unique ways (Portes & Rumbaut,
2001). This is especially true for immigrant college students struggling to develop their
own social infrastructure and identity within the university setting (Gomez, Miranda, &
Polanco, 2011; Schwartz et al., 2011). Today more than ever, many immigrant college
students come from economically disadvantaged backgrounds and are likely to be the
first in their family to attend college. Consequently, these students experience greater
financial and academic stress, compounded by increased levels of acculturation stress.
All of these factors may contribute to the development of allostatic load.
There is strong evidence in the literature linking acculturation stress with
measures of AL. Kaestner et al. (2009) found that 45- to 60-year-old Mexican immigrants
had lower allostatic load scores upon arrival than US-born Mexican Americans, non-
Hispanic Whites, and non-Hispanic Blacks. Consistent with what has been labeled “the
Hispanic Paradox” (Corlin, Woodin, Thanikachalam, Lowe, & Brugge, 2014), this health
advantage lessened with duration of residence in the United States. An underlying
assumption is that immigrants have healthier lifestyles prior to coming to the United

6
States, but as their time here increases, this health advantage diminishes (Albrecht et al.,
2013; Doamekpor & Dinwiddie, 2015). A similar process, dubbed the “healthy
immigrant effect,” has been reported in several other immigrant populations (Kennedy,
Kidd, McDonald, & Biddle, 2015). Chronic stress does appear to play a role in the
deterioration of health outcomes seen in immigrant populations. Gallo, Jiménez,
Shivpuri, Espinosa de los Monteros, and Mills (2011) explored the relationship between
chronic stress and AL in middle-aged Mexican American women. The researchers
reported that Mexican American women with multiple stressors were significantly more
likely to have higher AL scores than Mexican American women without these stressors.
Theorists have proposed that the cumulative wear-and-tear of physiological responses
manifests across multiple systems (Gallo et al., 2011). As a result of this chronic
physiologic dysregulation, increased AL can lead to obesity, atherosclerosis,
hypertension, and cardiovascular disease. Because AL provides direct measures of
biological outcomes rather than relying on the individuals’ own self-report as a measure
of their health, it is thought to be a far better predictor of stress-related chronic disease.
The term allostasis refers to the ongoing adaptive efforts of the body to maintain
stability (homeostasis) in response to stressors (Juster, McEwen, & Lupien, 2010). In
order to maintain normal function and stability, an organism responds through multiple
physiologic systems. When an individual experiences real or perceived stress, acute and
chronic changes occur in the stress system. These repeated responses cause chronic
dysregulation of the HPA axis (hypothalamic-pituitary-adrenal axis), the autonomic
nervous system, and the immune system. This physiological wear-and-tear on the body as
a result of the constant response to stressors is referred to as allostatic load (AL)

7
(McEwen, 1998a). Individuals differ in how they perceive a stressful situation as a threat.
An individual’s physiologic response may be determined by different factors including
behavioral (coping mechanisms), life experiences (trauma/abuse, major life events), stage
of development, and genetics (Juster et al., 2010). AL can accumulate and increase in
several ways: (a) Frequent stress—the stressor is repeated for an extensive length of
time; (b) Inadequate response—the efficacy of the response diminishes over time as the
stress continues; and (c) Failed shut-down—the stressor response fails to recognize the
stressor has resolved (McEwen, 2008a). Any or all of these mechanisms may be
responsible for increased AL among first- and second-generation immigrants.
Fig. 1. The allostatic load model (McEwen, 1998a)
Obesity and Allostatic Load
Allostatic load is made up of a composite index of biomarkers, including
anthropometric measures (waist circumference, body mass index, waist-to-hip ratio)
which serve as indicators of obesity. Rates of obesity have been steadily increasing in the
United States (Ogden, Carroll, Kit, & Flegal, 2014), and stress has been identified as a
potential risk factor, particularly for new immigrants. Studies have shown that

8
immigrants are less likely to be overweight on arrival to the United States than native-
born individuals, but their risk for obesity increases over length of time here (Roshania,
Narayan, & Oza‐Frank, 2008). Rates of obesity among children and adolescents in the
United States have continued to rise, despite major efforts in the public health arena to
address this issue. Data from 2011-2012 have indicated that 31.8% of youth in the United
States were either overweight or obese, with 17% being obese (Ogden et al., 2014). There
are marked differences in adolescent obesity rates among certain racial and ethnic groups,
with non-Hispanic Black, Mexican American, and Hispanic adolescents having higher
obesity rates than non-Hispanic Whites (Fialkowski et al., 2015). Childhood obesity
predisposes children for several chronic diseases, including hypertension, Type 2 diabetes
mellitus, and cardiovascular disease (CVD).
Obesity in late adolescence is associated with a comparable mortality risk as an
adult to that of an individual who is a heavy smoker (Neovius, Sundström, & Rasmussen,
2009). Immigrant adolescents may adopt unhealthy behaviors (smoking, high-calorie diet
with excess sugar, sedentary lifestyle) as a means of coping with acculturation stress,
resulting in increased rates of obesity. The number of first- and second-generation
immigrant Hispanic and Asian groups is increasing, with Asian Americans becoming one
of the fastest growing minority groups in the United States. Studies looking at factors that
may contribute to increased rates of obesity among immigrant Hispanic youth are evident
in the literature, but little research has focused on causes of obesity among Asian
Americans (Fialkowski et al., 2015). Consistent with the “Healthy Immigrant Effect”
(Corlin et al., 2014), Asian immigrants appear to have much lower risks of developing
cardiovascular diseases and Type 2 diabetes on arrival. However, this protective effect

9
seems to decrease with time in the United States. Particularly with regard to weight gain,
some researchers refer to this post-immigration trend as “the negative acculturation
effect.” One premise is that immigrants may discard previous dietary preferences and
cultural practices from their home countries, and adopt “Western” diets and norms (Ro,
2014).
Past studies have shown that generational status and number of years of residing
in the United States are associated with a higher incidence of obesity and BMI (Bates,
Acevedo-Garcia, Alegría, & Krieger, 2008; Goel, McCarthy, Phillips, & Wee, 2004;
Roshania et al., 2008). In the process of acculturation, young immigrants may take on and
engage in their host countries’ cultural norms and values sooner than their parents
(Crockett et al., 2007). This may in part explain the disproportionate prevalence of
obesity among adolescent minority groups. A related factor that may contribute to the
increased rates of obesity is the pressure immigrant groups feel “to prove they belong.” A
study by Guendelman, Chervan, and Monin (2011) looked at food preferences and
choices made by Asian Americans who felt their American identity had been challenged
or threatened. Results from the two experiments showed that when faced with a threat to
their American identity, Asian Americans chose more prototypical American food, as
compared to Asian American participants whose American identity had not been
challenged. Individuals who experience subtle challenges to their emerging identity may
alter their traditional home country diet for a prototypical American diet as proof of their
commitment to their host country. Dietary changes are just one example of behavior
adaptation among immigrant adolescents and young adults who may feel pressured to
conform to gain acceptance by their US peers.

10
Sources of acculturation stress for immigrant college students may be more
focused on cultural self-consciousness and “fitting in” (Crockett et al., 2007). A more
recent study on second-generation US-born Hmong (one of 30 Asian American
subgroups) children found the group that was more acculturated in terms of diet and
language use had higher total acculturation scores and body mass index (BMI) measures
(Franzen-Castle & Smith, 2014).
Acculturative Stress and Social Support
The literature provides strong evidence for the stress-buffering effects of social
support (Cohen & Wills, 1985a), specifically with regard to acculturative stress (Crockett
et al., 2007; Yeh & Inose, 2003; Zhang & Goodson, 2011). The acculturative stress
model identifies social support as a variable that may serve as a “buffer” in reducing the
degree to which acculturative stress is experienced (Safdar, Lay, & Struthers, 2003;
Williams & Berry, 1991). For immigrants, social support provided by family, peers, and
the community can diminish the level of acculturative stress the individual experiences
(Finch & Vega, 2003; Martı́nez Garcı́a, Garcı́a Ramı́rez, & Maya Jariego, 2002). Several
studies have examined the relationship between acculturative stress and mental health
issues, including depression and suicidal ideation, with social support as a protective
factor (Ayers et al., 2009; Cho & Haslam, 2010; Lee, Koeske, & Sales, 2004). The study
by Lee, Koeske, and Sales (2004) looked at the relationship between acculturative stress
and mental health symptoms and the role of social support as a moderator in a sample of
Korean international students living in the United States. Their results demonstrated a
strong correlation between acculturative stress and mental health symptoms, with social
support as a moderator having a buffering effect on stress symptoms. A study by

11
Katsiaficas, Suárez-Orozco, Sirin, and Gupta (2013) examined the association between
acculturative stress, symptoms of anxiety and depression, and the role of perceived social
support in urban first- and second-generation immigrant adolescents. The results showed
that social support mediated the relationship between acculturative stress and symptoms
of anxiety and depression. To date, however, little is known about the moderating effects
of social support on acculturative stress and physical health.
Acculturative Stress, Allostatic Load, and Immigrant College Students
The number of immigrant students being admitted to American universities is
increasing (Schwartz et al., 2013). A large percentage of these students are the first in
their family to attend college, and lack both the financial and social support to succeed.
These students experience greater stress and difficulty adjusting to college life than those
who are not first generation to attend college (Rodriguez, Myers, Morris, & Cardoza,
2000; Smedley, Myers, & Harrell, 1993). College students in general deal with several
different forms of stress, which include adjusting to college life and academic and
economic stressors (Guo, Wang, Johnson, & Diaz, 2011). A study by Stephens,
Townsend, Markus, and Phillips (2012) showed increased cortisol levels in students who
were the first in their family to attend college, as compared with students whose parents
had completed a 4-year college degree. Immigrant college students also appear to be
vulnerable to many risky health behaviors, although it is not clearly understood if they
adopt these behaviors as a coping mechanism for stress, or if they reflect the individuals’
attempts to identify with their U.S. peers. Claudat, White, and Warren (2016) examined
acculturative stress, self-esteem, and eating disorders, including bulimic symptoms and
body dissatisfaction in Asian American and Latina female college students. Their results

12
suggested that acculturative stress is associated with increased eating pathology.
Acculturative stress among immigrant college students, compounded with academic and
general college-related stress, can impact the level of allostatic load and increase the
incidence of both psychological and physical health issues. High levels of stress
experienced by immigrant and minority college students may also contribute to increased
rates of attrition and lower academic performance (Zajacova, Lynch, & Espenshade,
2005). Acculturative stress may include feelings of alienation, isolation, depression, and
suicidal ideation (Hovey, 2000a; Hovey & King, 1996; Hovey & Magaña, 2000). This
can put added pressure on immigrant college students’ social support systems (Gomez et
al., 2011). Research has suggested that acculturative stress is associated with predictors
of suicidal behavior (Cho & Haslam, 2010), which underscores the need to study this
phenomenon among immigrant college students. The overarching aim of this study, then,
was to examine the factors associated between level of acculturation stress and allostatic
load (AL), and the effect of social support on the relationship between acculturative stress
and allostatic load among first- and second-generation immigrant college students.
Statement of the Problem
What are the relationships among acculturation stress, perceived social support,
and allostatic load for first- and second-generation immigrant college students?
Sub-problems
1. What is the relationship between acculturation stress and measures of
allostatic load among first and second generation immigrant college students?
2. What is the relationship between perceived social support and acculturation
stress among immigrant college students?

13
3. Does social support affect the relationship between acculturation stress and
allostatic load?
Definition of Terms
Acculturation
Acculturation can be defined in a more simplistic manner as the normative
changes that groups and individuals undergo when they come in contact with another
culture (Berry et al., 1987). As a concept, acculturation has been further explicated to
include psychological acculturation, which refers to “changes in an individual who is a
participant in a culture contact situation, being influenced both directly by the external
culture, and by the changing culture of which the individual is a member” (Berry, 2013,
p. 200). Acculturation is operationally defined as a participant’s score on the
Acculturation, Habits, and Interests Multicultural Scale for Adolescents (AHIMSA).
Acculturative Stress
Acculturative stress is a “more specific concept than acculturation” (Hovey,
2000a, n.p.) and refers to the stress reaction resulting from the process of acculturation
(Berry, 2005). For many individuals, the process of acculturation can be stressful due to
factors such as language barriers, discrimination, lower socioeconomic status, lack of
social support, and conflicts between family values and the new culture. Acculturative
stress can be defined as “a reduction in the health status of individuals, and may include
physical, psychological and social aspects,” of which the source of the stressors identified
result from the process of acculturation (Berry et al., 1987, p. 200). Acculturative stress is
operationally defined as a participant’s score on the Social, Attitudinal, Familial, and
Environmental Scale (S.A.F.E.).

14
Allostasis
Allostasis is defined as the ongoing process by which an organism adapts to
physical and psychological stressors to maintain homeostasis (McEwen & Gianaros,
2010). It was first described by Sterling and Eyer (1988) as the “regulatory process of
approximating biological functioning to environmental demands to preserve
physiological stability” (n.p.).
Allostatic Load
Allostatic load (AL) is described as cumulative wear-and-tear on the body’s
system as a result of repeated activation of allostatic responses to stressful situations,
which can lead to illness (Juster & Lupien, 2012; Juster et al., 2010; McEwen &
Gianaros, 2010). In stressful situations, several physiological responses are elicited,
which include the release of multiple stress hormones. The hypothalamic-pituitary-
adrenal (HPA) and sympathetic-adrenal-medullary (SAM) systems are activated when
exposed to real or perceived stressful situations. The release of catecholamines,
glucocorticoids, and stress hormones epinephrine, norepinephrine, and cortisol initiates
the “fight-or-flight response” (Juster et al., 2010). The physiologic parameters reflecting
AL are divided into primary mediators, secondary outcomes, and tertiary outcomes.
Norepinephrine, a primary mediator, increases blood pressure and heart rate, which are
defined as secondary outcomes. Hypertension, diabetes, and atherosclerosis are
considered tertiary outcomes which result from the cumulative effect of AL (Katz et al.,
2012). Allostatic load is operationally defined as a calculated total score index based on
cardiovascular, metabolic, and anthropometric biomarkers. Body mass index (BMI),

15
defined as weight in kilograms divided by height in meters squared and waist-to-hip ratio,
will serve as anthropometric biomarkers and indicators of obesity. National Institute of
Health (NIH) guidelines defines obesity as BMI ≥ 30 kg/m2 (NIH, National Heart, Lung,
and Blood Institute, & North American Association for the Study of Obesity, 2000).
Social Support
Perceived social support is theoretically defined as “the psychological and
material resources available from an individual’s interpersonal relationships” (Rodriguez
& Cohen, 1998, p. 535). Social support is operationally defined as a participant’s score
on the Multidimensional Scale of Perceived Social Support (MSPSS).
Generation
Individuals are defined as first-generation immigrants if born outside of the
United States; second-generation immigrant individuals are born in the United States
with at least one foreign-born parent (Rumbaut, 2004). Immigrant youth who arrived in
the United States as children or young adolescents are often referred to as the 1.5
generation (Almeida et al., 2015).
Delimitations
The literature indicates that chronic psychosocial stress and the physiological
dysregulations that occur can influence health risks. In children and young adults,
measurable allostatic load could be an early warning sign of accumulating health risks.
Young adulthood is therefore a pivotal time to make changes in lifestyle choices and
health behaviors that can dramatically impact an individual’s lifetime risk. Therefore, this
study included English-speaking, first- and second-generation immigrant undergraduate
college students between 18 to 28 years of age.

16

17
Significance of the Study
Although several studies on adolescents and allostatic load can be found in the
literature, there is a paucity of information on college-age students, particularly those
who are first- or second-generation immigrants. College students in general are required
to cope with multiple stressors, which include academic, economic, social, and
developmental issues. Many students are separated from sources of support such as
family and friends, compounding these stressors. Numerous studies have found that
college-related stress has an inverse relationship with academic performance, including
immigrant college students (Buddington, 2002). Many immigrant college students are at
increased cumulative risk due to both psychosocial factors (lower income and parent
education, separation from one or both parents, and exposure to violence) as well as
physical factors (substandard housing and crowding). A study by Evans (2003) showed
that allostatic load increased among school children exposed to similar elevated
cumulative risk factors. Allostatic load (AL) has been identified as a predictor of
cardiovascular disease (CVD) and an underlying risk for other co-morbidities and
mortality (Karlamangla, Singer, McEwen, Rowe, & Seeman, 2002; Seeman, McEwen,
Rowe, & Singer, 2001; Seeman et al., 2010). An additional stressor for many immigrant
students is that they are the first in their family to attend college, which may increase
their risk. A study by Stephens et al. (2012) compared college students who were first in
their family to attend college (first-generation students) with students who had at least
one parent who had attended college (continuing-generation). Study results demonstrated
greater increases in cortisol and negative psychosocial effects in first-generation students.
Young adults measures’ of allostatic load (AL) could be an early warning sign of
18
accumulating health risks; making early changes in lifestyle choices and health behaviors
could dramatically change a patient’s lifetime risk. By targeting the antecedents of AL for
adolescents and young adults at critical periods of development, researchers can develop
tailored interventions for reducing allostatic load.

19
CHAPTER TWO: REVIEW OF THE LITERATURE
The relationships among acculturative stress, social support, and allostatic load
were examined in this research. This chapter discusses the theoretical and empirical
support for these relationships. The model of acculturative stress is presented in the first
section. The second section discusses the concept and theoretical framework of allostatic
load. In the third section, theoretical support for the concept of social support is provided.
The last section presents empirical support for relationships among acculturative stress,
social support, and allostatic load, followed by the hypotheses that were tested in this
research.
The conceptual frameworks for acculturation stress and allostatic load were used
to examine the relationships among acculturation stress, social support, and allostatic
load among first- and second-generation immigrant college students. A review of
empirical literature is presented to support the cumulative impact of stress, particularly
acculturative stress on allostatic load, and the effect of social support.
Theoretical Rationale
Acculturative Stress Model
Berry and Kim (1988) developed a theoretical model of acculturative stress based
on cultural and psychological factors and the relationship among three concepts:
Acculturation Experience, Stressors, and Acculturative Stress. Their conceptual
framework posits that the level of acculturative stress experienced is influenced by
several moderating factors (Williams & Berry, 1991). In their model, the researchers
included factors such as family support, socioeconomic status, knowledge of the new
language, multiculturalism, and the ability to assimilate (Hovey, 2000b). On the left side

20
of the model (illustrated in Figure 2), individuals experience acculturation in varying
degrees and situations. The center of the model depicts the varying stressors that may
occur as a result of the acculturation experience. The right side indicates varying levels of
acculturative stress resulting from the acculturation experience and stressors (Berry et al.,
1987). Berry and Kim’s model includes five moderating factors that influence the
relationship among the three concepts. These moderating factors are: (a) Mode of
acculturation, (b) Phase of acculturation, (c) Nature of larger society, (d) Characteristics
of acculturating group, and (e) Characteristics of acculturating individual.
Figure 2. Model of acculturative stress (Berry et al., 1987)

21
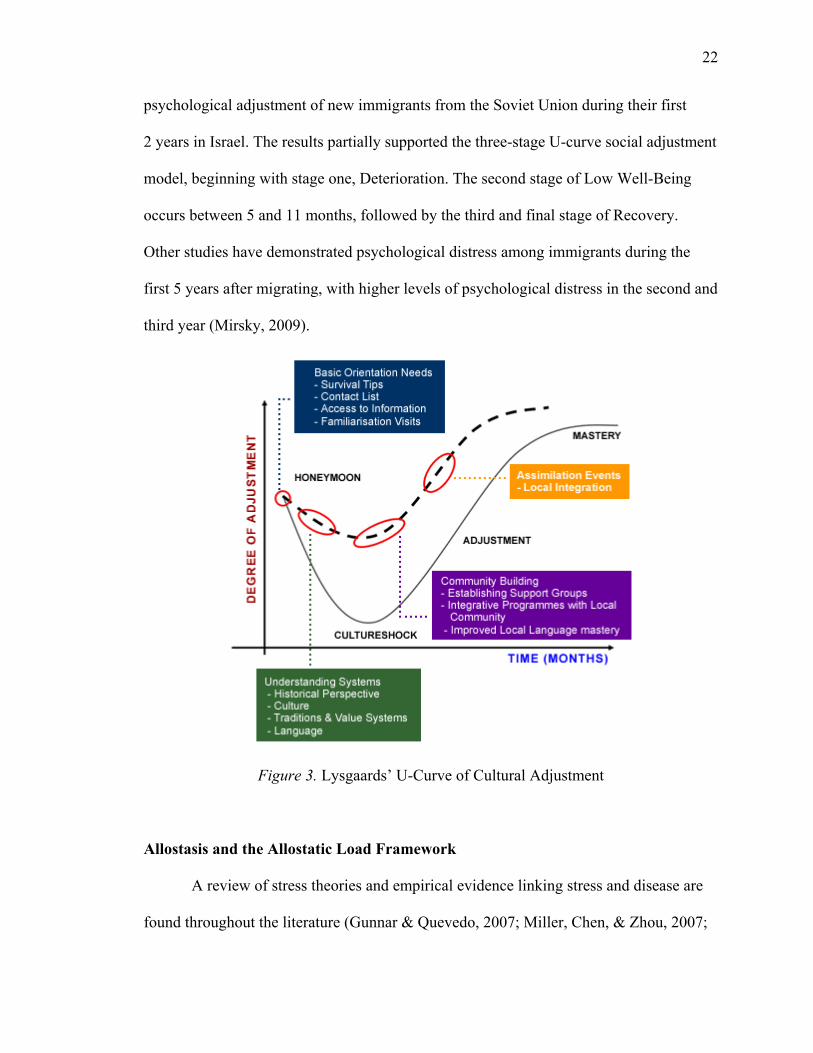
The acculturation process varies among individuals. For some, the process may
take months or years, while in others, the acculturation process may take several
generations. Berry and Kim (1988) described the stress building up over a period of time
until adaptation occurs, as proposed in the U-curve theory. Empirical work on the well-
known U-curve theory of cross-cultural adaptation initiated by Lysgaard (1955) stated:
Adjustment as a process over time seems to follow a U-shaped curve: adjustment is felt to be easy and successful to begin with; then follows a “crisis” in which one feels less well-adjusted, somewhat lonely and unhappy; finally one begins to feel better adjusted again, becoming more integrated into the foreign community. (p. 50)
Oberg (1960) further described the stages of the U-curve theory as four stages beginning
with: the “honeymoon” stage, followed by a period of “disillusionment” or “culture
shock.” The third stage is gradual adaptation or “transition” to the cultural norms of the
new culture, and the final stage is “adjustment” and integration into the new culture.
Despite numerous studies supporting the U-curve theory, many have criticized the theory
as being more descriptive of the four stages rather than a theoretical framework (Black &
Mendenhall, 1991; Ward, Okura, Kennedy, & Kojima, 1998). A study by Tartakovsky
(2009) explored the cultural identities of Jewish adolescents from Russia/Ukraine who
immigrated to Israel without their parents. The 3-year longitudinal study covered both the
pre-migration and post-migration period. The results of the study showed curvilinear
changes in cultural identity during immigration. Following a U-curve, psychological
well-being (self-esteem, body image, school competence, and social competence) was
highest during pre-migration, followed by a decline in the first year after immigration,
and improving in the third year after immigration. A similar study done by Markovizky
and Samid (2008) examined the relationship between length of residence and
22
psychological adjustment of new immigrants from the Soviet Union during their first
2 years in Israel. The results partially supported the three-stage U-curve social adjustment
model, beginning with stage one, Deterioration. The second stage of Low Well-Being
occurs between 5 and 11 months, followed by the third and final stage of Recovery.
Other studies have demonstrated psychological distress among immigrants during the
first 5 years after migrating, with higher levels of psychological distress in the second and
third year (Mirsky, 2009).
Figure 3. Lysgaards’ U-Curve of Cultural Adjustment
Allostasis and the Allostatic Load Framework
A review of stress theories and empirical evidence linking stress and disease are
found throughout the literature (Gunnar & Quevedo, 2007; Miller, Chen, & Zhou, 2007;

23
Schneiderman, Ironson, & Siegel, 2005; Segerstrom & Miller, 2004). Despite the
evolution of humans, the “fight or flight” response remains, even though the
environmental threats (e.g., predators) which threatened survival may no longer exist.
Situations that an individual finds mentally, physically or emotionally stressful may
trigger a broad array of physiological responses. Allostatic load can be used as a
conceptual framework (illustrated in Figure 4) to examine and measure the effects of
acculturative stress and social support among first- and second-generation immigrant
college students. The concept of allostasis as first presented by Sterling and Eyer (1988)
provided an explanation for the ill effects of prolonged stress, resulting in increased
morbidity and disease trajectories. The researchers described allostasis as the process by
which physiological stability is maintained by changing its “internal milieu” to match
environmental demands (Sterling & Eyer, 1988). Allostasis can be further defined as
“stability through change,” or adaptation when faced with real or perceived threat, which
activates neural, neuroendocrine, and neuroendocrine-immune systems (McEwen,
1998b). AL is described as cumulative wear-and-tear on the body’s system as a result of
repeated activation and deactivation of allostatic responses to stressful situations (Juster
et al., 2010; McEwen & Gianaros, 2010; McEwen & Wingfield, 2003). In stressful
situations, several physiological responses are elicited, which include the release of
multiple stress hormones. These stress hormones allow the body to respond to threatening
situations (e.g., the “fight or flight” response) (McEwen & Gianaros, 2010). Individuals
interpret and respond differently to stress, which ultimately determines resilience or
vulnerability to stress-related illness. The problem arises with individuals who experience
chronic stress and have allostatic systems that do not completely turn off, which results in

24
constant release of stress hormones (Kaestner et al., 2009). The impact of the chronic
stress and increase in allostatic load predisposes individuals to develop chronic illnesses
and health disparities. The AL model involves measuring multisystem interactions and
biomarkers, and incorporating an allostatic load index representing neuroendocrine,
immune, metabolic, and cardiovascular system functioning (Juster et al., 2010).
Examples of biomarkers that have been repeatedly used in AL studies include:
Neuroendocrine-cortisol, Dehydroepiandrosterone (DHEA-S); Immune-C-reactive
protein, fibrinogen; Metabolic-total cholesterol, triglycerides, glycosylated hemoglobin
(HbA1c); Cardiovascular-Systolic blood pressure, Diastolic blood pressure;
Anthropometric-waist-to-hip ratio (higher levels represent greater adipose fat
distribution); and body mass index (BMI, represents a proxy measure of an individual’s
relative body fat percentage with three different classifications of obesity) (Juster et al.,
2010).
Figure 4.The stress response and development of allostatic load. Adapted from McEwen (1998a) and Israel and Schuman (1990).
Adapted with permission from Massachusetts Medical Society, © 1998 and from Jossey-Bass, respectively.

25
Empirical Support for the Relationship Among Acculturation, Acculturative Stress, and Generational Status
As previously noted, several studies in the literature have demonstrated that
immigrants have better health on arrival to the United States yet experience a decline in
health as their length of residence increases (Albrecht et al., 2013; Bates et al., 2008;
Koya & Egede, 2007; Oza-Frank & Venkat Narayan, 2010; Ro, 2014; Roshania et al.,
2008). Research has also suggested that age of arrival to the United States is a strong
determinant for an individual’s risk of weight gain (Kaushal, 2009). In a study of
immigrant adults aged 18-74 years old, the researchers found the odds of being
overweight were three times higher in migrants from Mexico, South America, Europe,
Russia, Africa, and the Middle East who had lived in the U.S. for 15 years or more than
for individuals who had lived in the United States for less than 5 years (Oza-Frank &
Venkat Narayan, 2010). Previous studies found that immigrants who were 20 years old or
less at the time of immigration, and who had resided in the United States for 15 years or
more, were 11 times more likely to be overweight/obese than immigrants who arrived
before the age of 20 and resided in the U.S. less than 1 year (Roshania et al., 2008).
A study by Bates et al. (2008) explored the distribution of BMI and obesity
among first-, second-, and third-generation Latinos and Asian Americans. The results
from their study suggested that generational status is associated with increased BMI and
obesity. Patterns of obesity rates are particularly alarming among immigrant adolescents.
There is a disparity in adolescent obesity rates among certain racial and ethnic groups,
with non-Hispanic Black, Mexican American, and Hispanic adolescents having higher
obesity rates than non-Hispanic Whites. Childhood obesity predisposes children for
several chronic diseases, including hypertension and cardiovascular disease (CVD). Five

26
of the 12 articles reviewed explored the association of acculturation and obesity in
adolescents (Fialkowski et al., 2015; Franzen-Castle & Smith, 2014; Popkin & Udry,
1998; Schaefer et al., 2009). Popkin and Udry (1998) analyzed data from the National
Longitudinal Study of Adolescent Health survey. Their results showed that second-
generation (born in the United States) Asian American and Hispanic adolescents are more
than twice as likely to be obese as first-generation adolescents.
A more recent study explored environmental, personal, and behavioral influences
on BMI and acculturation status among second-generation Hmong children (Franzen-
Castle & Smith, 2014). Their results showed acculturation and BMI to be positively
associated. Although lower rates of obesity and overweight for Asian Americans have
been reported using the WHO global standard cutoff points (25kg/m2) when compared
with other groups, a study using the lower WHO-recommended BMI standard cutoff for
Asian Americans (23kg/m2) found that 32% of their sample of Vietnamese American
students were overweight (Choi, Hwang, & Yi, 2011). Moreover, nativity and years
living in the United States were significantly associated with weight. Foreign-born
Vietnamese American students were less likely to be overweight than the US-born;
however, as length of time of residence increased, the foreign-born students became more
overweight at a faster rate than the US-born.
Although acculturation is sometimes used as a proxy for acculturative stress
(Caplan, 2007), empirical evidence has suggested that it is not the acculturative process
itself, but the stress of adapting to life in a new country that has the greatest impact on the
physical and emotional health of Latino immigrants. Despite a general assumption by
many researchers of the inverse relationship between level of acculturation and

27
acculturative stress, several studies in the literature have disputed this association
(Cuellar, Bastida, & Braccio, 2004; Gil & Vega, 1996; Hovey & King, 1996).
Empirical Support for the Relationship Between Acculturative Stress and Allostatic Load
Immigrants of different racial/ethnic groups often experience significant
socioeconomic stressors upon arrival to the United States (Crimmins, Soldo, Ki Kim, &
Alley, 2005; Doamekpor & Dinwiddie, 2015; Peek et al., 2010). There is strong evidence
in the literature suggesting that social determinants such as race, ethnicity, education, and
income are related to allostatic load. In six of the nine studies reviewed, the findings
suggested that individuals who experience multiple socioeconomic stressors such as
chronic poverty, limited educational opportunities, and unemployment have higher
allostatic load indexes (Brody et al., 2013; Chao et al., 2014; Gruenewald et al., 2012;
Hickson et al., 2012; McEwen & Gianaros, 2010; T. Seeman, Epel, Gruenewald,
Karlamangla, & McEwen, 2010).
Hickson et al. (2012) looked at socioeconomic status (SES) patterning of
allostatic load in African American adults. Though not immigrants, their results
suggested lower education and income were associated with higher AL scores in African
American adults. Similarly, Gruenewald et al. (2010) examined whether AL levels were
higher in those adults who experienced disadvantaged SES from childhood through
adulthood. The researchers analyzed data from 1008 participants (92.2% White) from the
Biomarker Sub study of the Study of Midlife in the US (MIDUS). Their findings
suggested that individuals who experienced disadvantaged SES throughout the lifespan
had higher AL measures, resulting in increased risk of negative health outcomes and
development of chronic health conditions (Gruenewald et al., 2012).

28
The inverse association between socioeconomic status (SES) and chronic health
conditions such as cardiovascular disease, hypertension, and its associated risk factors
(obesity, Type 2 diabetes) is well documented in the literature (Myers, 2009). Likewise,
there is ample evidence that cardiovascular disease (CVD) begins early in life, but
individuals may not experience a major event until adulthood. This is concerning, as
obesity and Type 2 diabetes, two major risk factors for CVD, have been increasing in
children and adolescents (Goodman, McEwen, Huang, Dolan, & Adler, 2005). A study of
adolescents by Goodman et al. (2005) explored the associations between social status
(lower parent education) and biomarkers of cardiovascular risk. Their results suggested
that lower parent education is associated with increased cumulative risk in adolescents,
predisposing them to future cardiovascular risk as adults.
The literature supports early childhood poverty as a risk factor for obesity, linking
childhood obesity with negative health outcomes such as cardiovascular disease in adults
(Wells, Evans, Beavis, & Ong, 2010). In 2014, an estimated 9.5 million children of
immigrants lived below the poverty level. Children of immigrants are more likely to live
in poverty, experience food insecurity, and live in crowded housing. Today more than
ever, many immigrant college students come from economically disadvantaged
backgrounds and lack health insurance.
Empirical Support for the Moderating Role of Social Support
A plethora of evidence in the literature indicates that social support has a
beneficial effect on an individual’s well-being. The buffering model (Cohen & Wills,
1985a) posits that psychological support from family members, friends, and other social
resources “buffers” or protects the individual from the negative psychological and

29
physical health outcomes that can result from multiple stressful events. Evidence of both
parental and peer social support have been shown to have a buffering effect on
physiological stress reactions among adolescents (Adams, Santo, & Bukowski, 2011;
Brody et al., 2013; Brody et al., 2014). In adolescent development, the perception of
social support is vital for promoting psychological well-being, especially for adolescent
immigrants (Almedom, 2005; Portes & Zhou, 1993). The lack of adequate social
resources in addition to multiple environmental stressors can be detrimental for the health
of immigrant adolescents. Many immigrant youth live in urban areas and experience
overcrowding, noise pollution, crime, and violence, which compound daily stressful life
events (Ozer & McDonald, 2006).
Immigrant college students’ perceptions of social support may impact the level of
acculturative stress they experience. A study by Lee et al. (2004) examined the
relationship between acculturative stress and mental health symptoms and the moderating
effect of social support. Their results showed a strong correlation between acculturative
stress and mental health symptoms, with social support having a moderating and
buffering effect. Students with high levels of social support were significantly less likely
to report symptoms with increased levels of acculturative stress, as compared to students
with low levels of social support. Crockett et al. (2007) found acculturative stress had a
negative effect on internalizing symptoms in a sample of Mexican American youth who
perceived low social support, compared with individuals who perceived greater social
support. The results of their study showed lower levels of anxiety and depression in
response to acculturative stress for those who perceived greater social support.

30
Moreover, evidence in the literature supports the hypothesis that social support
and positive social experiences are associated with lower allostatic load (Seeman, Singer,
Ryff, Love, & Levy-Storms, 2002a). A more recent study by Seeman, Gruenewald,
Cohen, Williams, and Matthews (2014) examined associations between social
relationships (social ties, social support, and social strain) with levels of allostatic load.
Their results showed that social support and social strains were strongly related to total
AL scores, with social ties and emotional support negatively related to AL.
Hypotheses
The following hypotheses were tested to determine the relationships between
acculturation and acculturative stress and differences among various racial/ethnic groups:
1. Hypothesis 1: Individuals who have a higher degree of acculturation are more
likely to experience lower levels of acculturation stress.
2. Hypothesis 2: Individuals who experience increased levels of acculturation
stress will be more likely to have higher scores of total allostatic load.
3. Hypothesis 3: Individuals who are first-generation immigrants will have
higher acculturation stress levels and higher scores of total allostatic load than
second-generation immigrants.
4. Hypothesis 4: Perceptions of social support will affect the relationship
between acculturative stress and allostatic load.

31
CHAPTER THREE: METHODOLOGY
The first section of this chapter describes the study design, research setting,
sample, and sampling method. The instruments and procedure for data collection and
analysis used for this study are discussed in the second half of this chapter. This study
used a cross-sectional design to examine the relationships among acculturative stress,
allostatic load, and social support.
Research Setting
Subjects who met the eligibility requirements were recruited from among
undergraduates attending Saint Peter’s University through the Office of Student Life.
Saint Peter’s University is a Jesuit university located in Jersey City. In keeping with
Jersey City’s distinction as the most ethnically, racially, and linguistically diverse urban
area in the United States, the student body is ethnically, religiously, socioeconomically,
geographically, and culturally diverse, representing over 60 national origins. In the
undergraduate population, approximately 50% of the students are Federal PELL Grant
recipients (based on financial need), 25% are non-native English speakers, 50% are first-
generation college students, and 65% come from minority backgrounds (Middle States
Self-Study, 2013). The university was selected because of its student diversity evidenced
by its ethnically diverse cultural clubs (e.g., A Taste of Africa Student Association, Asian
American Student Union, Indian & Pakistan Culture Club, LASO, and Muslim Students
Association) and the inception of the Center for English Language Acquisition (CELAC).
Recruitment took place through subject pools from all major departments, including
CELAC.

32
Sample
All subjects were English-speaking, self-reported as first- or second-generation
immigrants, and were free of injury and chronic illnesses. Pregnant women were also
excluded, as fluctuations and elevated biomarker levels are considered normal during
pregnancy. A total of 70 subjects were recruited to participate in the study. A priori
power analysis was done using the G*Power analysis program (Faul, Erdfelder, Buchner,
& Lang, 2009). The necessary sample size was computed using t-tests between means:
differences between two independent groups, with a significance level α = 0.05, statistical
power 1 – β = 0.8 and effect size d = 0.7. In a meta-analysis of 33 intervention studies on
social support as a protective buffer (Renner, Laireiter, & Maier, 2012; Röhrle &
Sommer, 1998), the researchers found a mean effect size of d = .71. Thus, it was
determined that a convenience sample size of 68 total subjects would be needed for the
study (Tabachnick & Fidell, 2013).
Measures
Dependent Variables
The purpose of this study was to explore the association between acculturation
stress and allostatic load, and the effect of social support among first- and second-
generation immigrant students. The dependent variable of this study was allostatic load.
More specifically, the outcome for this study was allostatic load, operationally defined as
a calculated total score index based on cardiovascular (systolic and diastolic blood
pressure), metabolic (total cholesterol, lipid panel, and HgA1c), and anthropometric
biomarkers (waist circumference, body mass index, waist-to-hip ratio). Body mass index
(measured as weight in kilograms divided by the square of height in meters) served as an

33
indicator of obesity. NIH (2000) guidelines define obesity as BMI ≥ 30 kg/m2 (see Table
1, BMI classifications). Cholesterol measurements are used in the diagnosis and treatment
of disorders involving excess cholesterol in the blood and lipid disorders. Cholesterol is a
major cause of coronary heart disease, with the most recent guidelines recommending
lipoprotein profiles every 5 years in all adults aged 20 years and older (Expert Panel on
Detection, Evaluation, and Treatment of High Blood Cholesterol in Adults, 2001). The
percent of glycosylated hemoglobin (HbA1c), used to measure long-term blood glucose
control, was used as a marker of insulin resistance (Yoshinaga & Kosaka, 1996). A
composite AL index score was calculated based on the nine biomarkers. Each of the nine
biological parameters was divided into quartiles, based on the distribution of scores in the
sample. Participants’ values falling within the high-risk 75th percentile were
dichotomized as 1 = values in high-risk quartile), and those with normal ranges as
0 = values in low-risk quartile. The total AL score (range 0-9) was calculated by
summing the number of parameters for which the subjects fall into the highest-risk
quartile, with higher scores indicating greater dysregulation (Seeman et al., 2010).
Biomarker cutoff points are included in Table 4.
Table 1 Classification of Overweight and Obesity by BMI
BMI (kg/m2) Obesity Class
Underweight < 18.5
Normal 18.5-24.9
Overweight 25.0-29.9
Obesity 30.0-34.9 I
35.0-39.9 II
Extreme Obesity 40.0 + III

34
Independent Variables
In this study, acculturation stress was measured using the Social, Attitudinal,
Familial, and Environmental Acculturative Stress Scale (S.A.F.E.). The S.A.F.E. Scale
has been used extensively as a measure of acculturative stress (Mena et al., 1987; Padilla,
Wagatsuma, & Lindholm, 1985; Padilla et al., 1986). The S.A.F.E. scale consists of 24
items that measure acculturative stress in social, attitudinal, familial, and environmental
contexts, and perceived discrimination toward immigrants. The S.A.F.E. Scale uses a
5-point Likert-type scale (ranging from 1, not stressful to 5, extremely stressful). The sum
for each item is calculated for the total score and by domain. The scores can range from
0 to 120. An example of items includes the following: “I feel uncomfortable when others
make jokes about or put down people of my ethnic background”; “In looking for a good
job, I sometimes feel that my ethnicity is a limitation”; and “It bothers me that I have an
accent.” Higher scores indicate a higher level of acculturation stress. The scale is
sensitive to language and cultural stressors experienced by immigrant college students.
Based on Berry’s theoretical framework, the original S.A.F.E. Scale was
developed by Padilla, Alvarez, and Lindholm (1986). The steps required for scale
development as described by DeVellis (2012) are: (a) clearly define the
construct/concept; (b) generate an item pool and determine the format for measurement;
(c) conduct expert review of item pool and include validation items; (d) administer scale
to sample; and (e) evaluate the items. The original 60-item scale was developed based on
preliminary interviews with immigrant students who answered open-ended questions
about social and cultural difficulties they had experienced. The interview questions and
item construction were based on a literature review of studies that had shown difficulties

35
related to language, conflicting cultures, discrimination, and prejudice. A shorter version
of the scale (24-item) was developed by Mena, Padilla, and Maldonado (1987). Both
scales were designed to measure acculturative stress in four domains: social, attitudinal,
familial, and environmental contexts.
Adequate reliability measures for the scale have been demonstrated in various
populations both by gender and ethnicity (Asian Americans, Hispanic Americans,
African Americans, and Mexican Immigrants). Fuertes and Westbrook’s (1996) study on
Hispanic college students reexamined the reliability of the S.A.F.E. Scale. The results for
the overall S.A.F.E. Scale indicated reliability (21 items, Cronbach’s alpha = .89).
Specifically, the reliabilities for each of the four factors were: Factor 1-Environmental
(α = .88), Factor 2-Attitudinal (α =.73), Factor 3-Social (α = .71), and Factor 4-Familial
(α = .70). Additional subsequent studies showed acceptable reliabilities in African
American college students (α = .87; Perez et al., 2002; α = .89; Joiner & Walker, 2002);
Hispanic women (α = .86; Negy et al., 2010); and diverse ethnic groups of students
(α = .89; Gomez et al., 2011).
Construct validity of the S.A.F.E. Scale was assessed by Fuertes and Westbrook
(1996) using factor analysis. They conducted a principal component analysis and the
varimax rotation method, resulting in four factors explaining 55% of the overall variance.
Factor 1 accounted for 31% (eigenvalue of 7.46) of the variance, Factor 2 accounted for
9% (eigenvalue of 2.25), Factor 3 accounted for 8% (eigenvalue of 2.02), and Factor 4
accounted for 6% (eigenvalue of 1.52). Factor loadings with each item were included.
The number of factors resulting from the analysis corresponds with the four dimensions

36
(environmental, attitudinal, social, and familial) of the S.A.F.E. Scale, providing further
evidence of construct validity.
In their study, Fuertes and Westbrook (1996) included three open-ended questions
to allow participants to elaborate further on the stress they had experienced. Evidence of
convergent validity was demonstrated by correlating the responses from three open-ended
questions with the responses from the 21 items that make up the four factors of the
S.A.F.E. Scale. All three open-ended questions correlated moderately with Factor 1
(r = .40, .51, and .49).
A study by Joiner and Walker (2002) showed evidence of convergent and
discriminant validity. The correlation of acculturative stress (S.A.F.E.) and general life
stress measured with the Negative Life Events Questionnaire (NLEQ) was moderate
(r = .46, p < .01), suggesting discriminant validity.
Evidence of predictive validity was demonstrated in an early study by Padilla
et al. (1985); their results showed the S.A.F.E. Scale discriminated between generations
for both Japanese and Mexican American students. Subsequent studies (Mena et al.,
1987; Padilla et al., 1986) found the S.A.F.E. Scale discriminated between first, second,
and third generations, giving evidence of predictive validity. Their results also suggested
that acculturative stress levels decreased with later generation immigrants. Hovey and
Magaña (2002) found acculturative stress was a significant predictor of anxiety in a
sample of migrant workers (β = .57, t = 5.7, p < .0001). These findings were congruent
with their previous study suggesting that elevated levels of acculturative stress also had
high levels of anxiety and depression (Hovey & Magaña, 2000). Numerous studies have

37
suggested adequate predictive validity for the S.A.F.E. Scale on acculturative stress,
suicidal ideation, and depression (Cho & Haslam, 2010; Hovey & King, 1996; Hwang &
Ting, 2008). A study on Mexican immigrants by Hovey (2000) explored the relationship
between acculturative stress, depression, and suicidal ideation. The study results showed
the strongest predictor of depression was acculturative stress (β = .54, t = 5.5, p < .01),
which accounted for 29% of the variance in depression. In summary, this scale has been
widely used to measure acculturative stress. There is strong evidence of the reliability and
validity for this tool to be used in this study as a measure acculturative stress.
Independent variables: Acculturation. Acculturation was measured in this
study using the Acculturation, Habits, and Interests Multicultural Scale for Adolescents
(AHIMSA). Acculturation is defined as the normative changes that groups and
individuals undergo when they come in contact with another culture. Items for the
AHIMSA scale were generated by a diverse group of researchers (health psychologists,
developmental psychologists, sociologists, cultural studies researchers, and health
behavior researchers). Age-appropriate and multicultural relevant items were adapted
from existing scales (ARSMA-II, Suinn-Lew Ethnic-Identity Acculturation Scale, and the
Stephenson Multigroup Acculturation Scale). Newly written items were added to assess
multiple components of acculturation in adolescents. Items were written to be applicable
to any individual’s ethnic or cultural background (Unger et al., 2002). Adolescent focus
groups evaluated 30 potential items for relevance and ease of interpretation. In addition to
the focus groups, the researchers evaluated the items’ relevance to the concept of
acculturation. The scale consists of eight items with four response categories, generating
four sub-scores based on the four orientations: United States Orientation (indicating

38
Assimilation), Other Country Orientation (indicating Separation), Both Countries
Orientation (indicating Integration), and Neither Country Orientation (indicating
Marginalization). Examples of items include: “I am most comfortable being with people
from…,” “My best friends are from…,” and The people I fit in with best are from…”
Respondents select which of the four orientations best indicates their cultural preference.
The score for each orientation can range from 0 through 8. Validation of the AHIMSA
was conducted to evaluate the psychometric properties of the scale. This included
completion of a modified version of the ARSMA-II scale which represents a widely used,
standard, and comprehensive measure of acculturation. Exploratory factor analysis was
performed, with the scree test indicating a single-factor solution. Cronbach’s alpha for the
overall eight-item scale were adequate (United States Orientation, α = .79; Both
Countries Orientation, α = .79) (Unger et al., 2002). Subsequent studies showed the
Cronbach’s alphas were .76 for the US orientation subscale, .76 for the Other Country
subscale, and .74 for the Integration subscale (Unger, Ritt-Olson, Wagner, Soto, &
Baezconde-Garbanati, 2007). The AHIMSA subscales were positively correlated with the
ARSMA-II, giving evidence of construct validity. The AHIMSA scale has been used
extensively in diverse adolescent and emerging adult research populations, specifically
college students (Pedersen, Cruz, LaBrie, & Hummer, 2011; Santos, Hurtado-Ortiz, &
Sneed, 2009; Sirin et al., 2008).
Independent variables: Perceived social support. Perceived social support was
measured using the Multidimensional Scale of Perceived Social Support (MSPSS).
Perceived social support is defined as “the social resources that persons perceive to be
available or that are actually provided to them by nonprofessionals in the context of both

39
formal support groups and informal helping relationships” (Cohen, Gottlieb, &
Underwood, 2001, n.p.). The MSPSS is a widely used self-report measure of perceived
social support from three different dimensions (i.e., sources): family members, friends,
and significant others. The scale consists of 12 items designed to measure the individual’s
perception of support from family (Items 3, 4, 8, and 11): “I get the emotional help and
support from my family”; friends (Items 6, 7, 9, and 12): “I can count on my friends
when things go wrong”; and significant other (Items 1, 2, 5, and 10): “I have a special
person who is a real source of comfort to me” (Zimet, Powell, Farley, Werkman, &
Berkoff, 1990). Respondents use a 7-point Likert-type scale (ranging from very strongly
disagree to very strongly agree). Total composite MSPSS scale scores range from 12 to
84, with higher scores indicating higher levels of perceived social support. Items within
each subscale are summed to give total subscale score. To calculate the total scale, all 12
items are summed to obtain a composite MPSS scale score and then divided by 12 for the
total mean score. Mean total scale scores ranging from 1 to 2.9 are considered low
support; a score of 3 to 5 is considered moderate support; a score of 5.1 to 7 is considered
high support. To calculate each subscale: Significant Other subscale, items 1, 2, 5, and 10
are added together and divided by 4; Family Subscale, items 3, 4, 8, and 11 are added
together and divided by 4; Friends Subscale, items 6, 7, 9, and 12 are added and divided
by 4. A high total mean score on a specific subscale indicates high levels of perceived
social support from that source (i.e., friends). Confirmatory factor analysis confirmed the
three-factor structure with factor loadings changing from .77 to .89 and explaining
74.04% of the total variance (Duru, 2007). Good internal reliability is evident with
coefficient alphas for the subscales, a total scale ranging from .81 to .94, and test-retest

40
values of .72 to .88. Significant correlations between the MSPSS subscales and the
Depression and Anxiety subscales of the Hopkins Symptom Checklist indicate construct
validity. Concurrent validity was examined using the UCLA Loneliness Scale and the
Life Satisfaction Scale. Results showed significant correlations between the MSPSS total
score and measures of loneliness (r = -.59, p < .01, .79, large effect size of 2.5) and life
satisfaction (r = .37, p < .01, .90, large effect size of 4.2) (Duru, 2007). Discriminant
validity was demonstrated for the Family subscale of the MSPSS with the Adolescent
Family Caring Scale (AFCS). The correlation of the Family Support subscale with the
AFCS (t = 10.44, p < .001) was significantly stronger than the correlations of Friends
Support and Significant Other Support with the AFCS (t = 7.74, p < .001). This provided
evidence of the MSPSS scale’s ability to discriminate among Family, Friend, and
Significant Other Support in a sample of urban adolescents (Canty-Mitchell & Zimet,
2000). The MSPSS has been used to measure social support in different samples and
various cultures, and can be considered as a reliable and valid scale to measure perceived
social support. In this study, perceived social support was treated as a continuous
variable, with a total composite score calculated to measure overall perceived social
support.
Independent variables: Perceived stress. Perceived stress was measured using
the Perceived Stress Scale (PSS-10), developed by Cohen and Williamson (1988).The
PSS was originally constructed as a 14-item self-report instrument by Cohen, Kamarck,
and Mermelstein (1983). The PSS 10-item scale was designed to measure the individual’s
perception of his or her ability to manage stress, as well as the degree to which an
individual perceives aspects of his or her life as “uncontrollable, unpredictable, and

41
overloading” (Cohen et al., 1983, p. 314). Subjects are asked to respond to each question
on a 5-point Likert scale ranging from 0 (never) to 4 (very often). Scores ranging from
0-13 indicate low perceived stress, 14-26 indicate moderate stress, and scores from 27-40
indicate high perceived stress. The PSS-10 is a reliable and valid self-report measure of
perceived stress. Exploratory factor analysis revealed a two-factor model. Internal
consistency and interscale correlations were strong between the two factors (Roberti,
Harrington, & Storch, 2006). The scale has demonstrated good internal reliability with
Cronbach alpha reliability coefficient ranging from .84 to .89. Convergent validity was
supported with a high correlation between the PSS-10 total score and State-Trait Anxiety
Inventory (STAI) total score. Divergent validity was supported by weak correlations
between PSS-10 and several scales: Sensation Seeking Scale (SSS-V) and the Santa Clara
Strength of Religious Faith Questionnaire (SCSRFQ-SF), measuring constructs not
related to each other (Roberti et al., 2006). In this study, the PSS-10 score was treated as
a continuous variable, with higher scores indicating greater perceived stress.
Demographic Questionnaire
A demographic questionnaire was used to collect demographic data from study
participants. Individuals were asked to provide information on age, sex, race/ethnicity,
individuals’ and parents’ country of birth, individuals’ number of years living in the
United States, year in college, students’ GPA, socioeconomic status (household income)
and number of years of education completed by parent(s). Demographic variables were
considered as covariates in the study. Study instruments are described in Table 2. The
detailed descriptions of variables are presented in Table 3.

42
Table 2 Description of Study Instruments
Variable Instrument Level of
Measurement Number of Items
Acculturation Stress
Social, Attitudinal, Familial, and Environmental Scale (S.A.F.E.)
Continuous variable
24 items, 5-point Likert scale (ranging from 1 not stressful to 5 extremely stressful)
Acculturation The Acculturation, Habits, and Interests Multicultural Scale for Adolescents (AHIMSA)
Continuous variable
8 items with four response categories generating four sub-scores based on four orientations
Perceived Social Support
The Multidimensional Scale of Perceived Social Support (MSPSS)
Continuous variable
12 items with three subscales (family, friends, & significant others) Composite score on all 12 items
Perceived Stress The Perceived Stress Scale (PSS-10)
Continuous variable
10 items, 5-point Likert scale (ranging from 0 = never to 4 = very often)
Allostatic Load
Biomarkers Continuous variable
A calculated total score index based on nine biomarkers: systolic and diastolic blood pressure, body mass index (BMI), hip-to-waist ratio, total cholesterol, HDL, LDL, triglycerides, HgA1c

43
Table 3 Description of Dependent and Independent Variables
Variables Description
Dependent Variable
Allostatic Load
The physiological “wear and tear” on the body as a result of the constant response to stressors, resulting in chronic dysregulation of the HPA axis, the autonomic nervous system, and the immune system
Independent Variable
Acculturation Stress
Acculturation stress is defined as the stress reaction resulting from the process of acculturation.
Acculturation Acculturation is defined as the normative changes that groups and individuals undergo when they come in contact with another culture. It can be further defined as a dynamic, bidirectional process of adaptation to stress and the individuals’ coping mechanisms in response to stress.
Perceived Social Support Perceived social support is defined as “the psychological and material resources available from an individual’s interpersonal relationships” (Cohen Gottlieb, & Underwood, 2001, n.p.).
Perceived Stress Perceived stress is defined as the individuals’ perception of their ability to manage stress, as well as the degree to which an individual perceives aspects of their life as “uncontrollable, unpredictable, and overloading.
Demographic Variables
Age Age in years
Gender Male or Female
Racial Background American Indian or Alaska Native; Asian; Black or African American; Hispanic/Latino; Native Hawaiian or Other Pacific Islander; Other Race; White
Generation Status Individuals are defined as first-generation immigrants if born outside the US; second-generation immigrant individuals are born in the US with at least one foreign-born parent
Years Living in United States
(if applicable)
The number of years the individual has lived in the United States
Parent Education The number of years of education the parent(s) has completed
Household Income Less than $21,000/year; $21,000-$35,000/year; $35,000-$50,000/year; Greater than $50,000/year
Student’s GPA Cumulative GPA
Years Student Attended College
The number of years the student has attended college

44
Table 4 Cut-off Points for AL Indicators
Biological Parameters Highest Risk Quartile
Systolic blood pressure (mmHg) ≥ 120
Diastolic blood pressure (mmHg) ≥ 80
BMI (kg/m2) ≥ 30
Waist-to-hip ratio ≥ 0.90 in males, ≥ 0.85 in females
Total cholesterol (mg/dL) ≥ 240
Hemoglobin A1C (%) ≥ 5.7
Triglycerides (mg/dL) ≥ 200
Low density lipoproteins (mg/dL) ≥ 160
High density lipoproteins (mg/dL) ≤ 40mg/dL
Human Subjects Protection
To ensure the protection of human subjects prior to data collection, permission to
implement the study was obtained through the Institutional Review Boards of Saint
Peter’s University and Rutgers, The State University of New Jersey. There was little risk
for harm in the study. Subjects who completed the five questionnaires (Demographic
Tool, S.A.F.E., AHISMA, PSS, and MSPSS) and who reported feeling uncomfortable or
anxious were given the option of a referral for counseling and psychological services
through a local primary care center and/or Saint Peter’s University Personal Development
Center. Participants were advised there may be a small slight discomfort associated with
the finger stick.

45
Data Collection
Following completion of the questionnaires, each subject’s height and weight,
waist-to-hip ratio (waist circumference measured at its narrowest point between the ribs
and iliac crest, hip circumference measured at the maximal point of the buttocks), and
resting blood pressure were measured, and BMI was calculated. Height and weight were
measured using a Health O Meter 550KL Digital scale. Blood pressure was measured
with the subject in the seated positon, with the right arm elevated to heart level, using a
Welch Allyn Trim Line Reusable Cuff. Two measurements were taken 15 minutes apart
in the same arm with the patient in the same position, and the mean blood pressure was
recorded. Biomarker samples were collected and analyzed using Alere Afinion AS100
multi-assay analyzer system. Alere Afinion test cartridges for each analyte were used to
measure the following biomarkers: total cholesterol, high-density lipoproteins, low-
density lipoproteins, triglycerides, and glycosylated hemoglobin (HgA1c). Subjects were
instructed to wash their hands under warm water to help stimulate blood flow. The
subject’s fingertip was wiped with an alcohol pad, wiped dry with a sterile gauze pad,
and then pricked with a sterile, single-use 2.8mm/21 gauge lancet. The first drop of blood
is wiped away with sterile gauze pad to remove any tissue fluid from the sample,
followed by a gentle squeezing of the finger to obtain a large drop of blood,
approximately 40 µL (Lakshmy, Gupta, Prabhakaran, Snehi, & Reddy, 2010). Holding
the capillary tube horizontally, the tube was touched to the drop of blood without
touching the skin, and filled to the black mark within 10 seconds. Each test cartridge was
labeled with sample ID and then inserted into the analyzer. Individual test results were
recorded.

46
Data Analysis Plan
Sample characteristics were summarized and described using a descriptive
analysis, including ranges, means, standard deviations, and cut points/quartiles for each
of the biomarkers used to calculate the total AL index. Data were inspected for outliers
and anomalous data entries. Assumptions of normality and equal variances were tested
for. Acculturative stress scores were normally distributed for first generation as assessed
by Shapiro-Wilk’s test (p = .12), with a skewness of .835 (SE = 0.374) and kurtosis of
1.49 (SE = 0.733), but were non-normally distributed for second generation with a
skewness of 0.74 (SE = 0.40) and kurtosis of -0.268 (SE = 0.798). A “square root”
transformation was applied following the guidelines, as suggested by Tabachnik and
Fidell (2007). Social support scores were non-normally distributed for both first and
second generation, as assessed by Shapiro-Wilk’s test (p < .05), with a negative skewness
of -1.33 (SE = .374) and kurtosis of 2.53 (SE = 0.73) for first generation, and negative
skewness of -0.99 (SE = 0.40) and kurtosis of 0.47 (SE =0.798) for second generation. A
logarithmic transformation was applied. Pearson’s r-tests and regression analyses were
used to establish relationships between continuous variables, including acculturative
stress (S.A.F.E.), acculturation (AHIMSA), and perceived social support (MSPSS), to
determine if these are mediators of elevated AL. T-tests were used to examine differences
between first-generation and second-generation immigrant students for acculturative
stress, acculturation, perceived social support, and AL. Regression analysis was used to
examine Hypotheses 2, 3, and 4.
To test Hypothesis 1—Individuals who have a higher acculturation level are more
likely to experience lower levels of acculturation stress, Pearson’s r-test was conducted to

47
examine the correlation between acculturation (AHIMSA subscales) and acculturation
stress (S.A.F.E.). Linear regression analysis was used to test if level of acculturation
significantly predicted acculturative stress.
To test Hypothesis 2—Individuals who experience increased levels of
acculturation stress will be more likely to have higher scores of total AL, Pearson’s r-test
was used to examine the correlations between acculturative stress and AL. Linear
regression analysis was conducted to examine the association between acculturative
stress and AL. Demographic variables including age, gender, number of years residing in
the United States, student’s GPA, parent’s level of education, and income were
controlled.
To test Hypothesis 3—Individuals who are first-generation immigrants will have
higher acculturation stress levels and higher scores of total AL than second-generation
immigrants, Pearson’s r-tests were used to examine the correlations between
acculturative stress, generational status, and AL. Linear regression models were used to
test the best predictive association between acculturative stress, generational status, and
AL.
To test Hypothesis 4—Perceptions of social support will affect the relation
between acculturation stress and allostatic load, multiple regression analyses were
conducted. In the first step, a linear regression was used to examine the effect of
acculturative stress on AL. Next, a linear regression was used to examine the relationship
between perceived social support and AL. In the final step of the regression, acculturation
stress, social support, perceived general stress, generation status, gender, and parent’s
level of education were entered in a hierarchical regression analysis. The change in R2

48
was used to determine how much variance in AL was explained by each block of
predictors. Statistical analyses were carried out with Statistical Package for the Social
Sciences (SPSS) Version 24. All statistical tests were two-sided and p values less than
0.05 were considered as statistically significant.

49
CHAPTER FOUR: ANALYSIS OF THE DATA
The purpose of the study was to explore the association between acculturation
stress and allostatic load (AL) and the indirect effect of social support among first- and
second-generation immigrant college students. Data were collected from undergraduate
students attending Saint Peter’s University, who self-reported as first- or second-
generation immigrants. A demographic questionnaire was used to collect demographic
data from study participants. Acculturation stress was measured using the Social,
Attitudinal, Familial, and Environmental Acculturative Stress scale (S.A.F.E.). Level of
acculturation was measured using the Acculturation, Habits, and Interests Multicultural
Scale for Adolescents (AHIMSA). Perceived social support was measured using the
Multidimensional Scale of Perceived Social Support (MSPSS). To assess general
perceived stress, the Perceived Stress Scale (PSS-10) was administered. Biomarkers
representing metabolic (lipid panel and glycosylated hemoglobin) and cardiovascular
(systolic blood and diastolic blood pressure) system functions were obtained by finger
stick method and analyzed. Anthropometric biomarker measures consisted of body mass
index, waist circumference, and hip-to-waist ratio. The analysis of the data is presented in
this chapter.
Descriptive Results
Statistical analyses were carried out with SPSS, Version 24. The sample
characteristics are described in Table 5 and Table 6. The mean age of the subjects was
18.5 years (SD = .98). Almost 55% of the sample (54.8%, n = 40) were first-generation
immigrants and 45.2% (n = 33) were second-generation immigrants. First-generation
immigrant students had lived an average of 6.6 years (SD = 4.7) in the United States. The

50
sample consisted of 31.5% (n = 23) male and 68.5% (n = 50) female; 74% (n = 54) of the
sample self-identified as Hispanic/Latino, 13.7% (n = 10) Black/African American, 6.8%
(n = 5) Asian, and 4.1% of other race (n = 3). Statistical techniques applied in this study
included independent sample t-tests, and linear regression. The Mann-Whitney test and
chi-square tests were used to examine differences by generation and gender for first- and
second-generation immigrant students’ level of acculturation, acculturation stress,
perceived general stress, social support, and measures of allostatic load with individual
biomarkers. Pearson’s correlations and multiple linear regressions were used to establish
relationships between acculturation stress, level of acculturation, allostatic load (AL) with
individual biomarkers, and perceived social support. To determine whether there was a
significant difference in generation status for male and female participants, a Pearson chi-
square was conducted. The results were non-significant, χ2 (1, n = 73) = 2.96, p = .085.
The majority (82%) of the participants reported their family’s annual income of $35,000
or less. There was a non-statistically significant difference in level of income between
first and second generation, χ2 (3, n = 73) = 2.00, p = .572.
Table 5 Demographic Characteristics of the Sample (n = 73)
Characteristics Mean (SD) Range
Age (years) 18.52 (.988) 17-24
Number of Years in United States 6.6 (4.7) 1-18
Years in College 1.10 (.710) 1-7
GPA 3.33 (.493) 2.0-4.0
Years of Education of Mother 9.37 (5.27) 0-20
Years of Education of Father 10.16 (4.81) 0-20

51
Table 6
Gender, Racial Composition, and Generation of the Sample (n = 73) Group n %
Gender Male Female
23
50
31.5
68.5
Race/Ethnicity Asian
5
6.8 Black/African American
10 13.7
Hispanic/Latino
54 74.0
Native Hawaiian or Other Pacific Islander
1 1.4
Of Other Race
3 4.1
Generation First Generation
40 54.8
Second Generation
33
45.2
Family Income Less than $21,000/year $21,00-$35,00/year $36,000-$50,000/year Greater than $50,000/year
34 26 4 9
46.6 35.6 5.5 12.3
Biomarkers
Descriptive statistics for the nine biomarkers are described in Table 7.
Independent sample t-tests were run to determine if there were mean differences in
biomarkers between first and second generation. No statistical difference was found
between generations. However, a difference was found between male and female
participants. The total allostatic load mean scores significantly differed between males

52
and females, t (71) = 2.45, p = .016. The males showed higher AL scores than females.
HDL cholesterol levels were higher in females than males, a statistically significant
difference (t = -4.092, p = < .01). Mean systolic blood pressure was higher in male
subjects than female, a statistically significant difference (t = 2.42, p = .021). Results of
independent t-tests for biomarkers by generation and gender are shown in Table 8.
Table 7 Biological Markers of the Sample (n = 73)
Minimum Maximum Mean Std. Deviation
Systolic blood pressure, mmHg 88 151 116.4 13.07
Diastolic blood pressure, mmHg 50 110 74.7 10.08
Body Mass Index (BMI), kg/m2 17.2 47.7 26.29 6.00
Waist-hip ratio .72 1.28 .843 .079
HgA1c (%) 4.5 6.0 5.26 .267
Total cholesterol mg/dl 100 208 159.1 24.15
HDL cholesterol (HDL) 23 100 55.7 15.06
Triglycerides 45 595 125.3 84.4
LDL cholesterol (LDL) 0 124 76.47 30.12
Total AL score 0 6 1.42 1.40

53
Table 8 Biomarkers by Generation and Gender
Variable First
Generation Second
Generation t p Male Female t p
M(SD) M(SD) M(SD) M(SD)
AL 1.30(1.41) 1.58(1.39) -.834 .407 2(1.53) 1.16(1.26) 2.45 .02*
HDL 55.6(15.5) 55.9(14.7) -.094 .926 46.0(2.68) 60.1(1.97) -4.092 <.01*
SBP 118(13.8) 115(12.0) .933 .354 122(15.8) 113(1.50) 2.42 .021*
DBP 74.6(9.6) 74.9(10.7) -.142 .887 77(11.3) 74(9.3) 1.40 .166
BMI 25.36(6.0) 27.43(5.9) -1.48 .141 25.42(6.5) 26.7(5.7) -.845 .401
Waist-hip ratio
.844(.094) .848(.058) .142 .887 .843(.060) .841(.087) .359 .720
HgA1c%
5.26(.256) 5.27(.283) -.114 .910 5.3(.298) 5.2(.251) 1.22 .227
Tot Chol 159.3(21.3) 159.0(27.5) .043 .966 157.6(25.8) 159.9(23.5) -.381 .704
Trig 122.5(72.4) 128.6(98.2) -.304 .762 152.7(85.6) 112.6(81.7) 1.92 .059
LDL 78.5(26.5) 74.0(34.2) .634 .528 82.8(27.1) 73.5(31.3) 1.23 .233
Acculturation
Level of acculturation measured with the AHIMSA generated four subscales.
Respondents indicated which of the four orientations best reflected their cultural
preference. Frequencies were calculated for each AHIMSA item. Subscale scores were
calculated by summing the number of responses in each of the four categories
(Assimilation, Separation, Integration, and Marginalization). Responses for male 57.1%
(n = 12) and female 72.7% (n = 32), with a total of 67.7% (n = 44) of the sample,
identified with “Both Countries” subscale, indicating integration as their cultural
preference. A total of 21.5% (N = 14), both male and female, identified “US,” indicating

54
assimilation as their cultural orientation. Chi-square tests were performed to determine if
the relationship between generation and level of acculturation was statistically
significant. No statistically significant relationship was found between generation and
level of acculturation, χ2 (3, N = 65) = 6.15, p = .104, nor between gender and level of
acculturation, χ2 (3, N = 65) = 1.74, p = .62.
Acculturation Stress
Acculturation stress scores ranged from 7 to 94 (M = 36.9, SD = 16.3). Mean
scores indicated comparatively low levels of acculturative stress. There was no
significant difference in acculturative stress scores for first-generation and second-
generation immigrant students, t(71) = -.504, p = .616; however, there were significant
differences in levels of acculturative stress between female subjects and male subjects,
t (71) = -2.64, p = .01, with higher levels of perceived acculturative stress in female
subjects.
Perceived Stress
Responses to the 10 items of the Perceived Stress Scale were normally
distributed, with 75% (n = 55) of the respondents’ scores ranging from 14 to 26,
indicating moderate stress; the remaining 25% (n = 18) scored 27 to 40, indicating high
levels of perceived stress. Items 4, 5, 7, and 8 were reverse-scored. There was no
significant difference in perceived general stress scores for first-generation students and
second-generation immigrant students, t(71) = -1.26, p = .210, or between male and
female, t(71) = -1.62, p = .108.

55
Social Support
Social support (MSPSS) scores for the sample were non-normally distributed,
with skewness of -1.209 (SE = 0.28) and kurtosis of 1.69 (SE = 0.55), Shapiro-Wilk’s test
(p = .000). A Mann-Whitney U test was run to determine if there were differences in
social support scores between first- and second-generation students. Mean social support
for first-generation (5.18) and second-generation (5.35) was not statistically significantly
different (U = 702, z = .466, p = .641). An independent t-test was also run using the
transformed social support variable and showed no statistical difference in social support
between generations t (71) = .655, p = .515. A Mann-Whitney test was run to determine
if there was a statistically significant difference that social support was greater for male
than for female students. No statistical difference was found (U = 441.5, z = -1.587,
p = .112). The mean sample score (M = 5.26, SD = 1.20) indicated high levels of social
support. Results of independent t-tests are shown in Table 9.
Table 9 Acculturative Stress, Perceived Stress, and Social Support by Generation and Gender
Variable First
Generation Second
Generation t p Male Female t p
M(SD) M(SD) M(SD) M(SD)
S.A.F.E 36.0(17.7) 37.9(14.6) -.504 .616 29.7(13.1) 40.2(16.6) -2.64 .010*
PSS-10 22.8(3.6) 24.1(5.0) -1.26 .210 22.2(3.29) 23.9(4.7) -1.62 .108
U p
MSPSS 5.18(1.24) 5.35(1.16) 702 .641 5.5(1.12) 5.14(1.23) 441 .112

56
Psychometric Properties of Instruments
Cronbach’s alphas were calculated as a measure of internal consistency for each
of the four instruments and subscales. Internal consistency indicates how well all the
items in a scale measure the concept. The S.A.F.E. Scale was found to be highly reliable
(24 items; α = .84). The 12-item MSPSS had a high level of internal consistency, as
determined by Cronbach’s alpha .912. A very high reliability (0.95 or higher) may
indicate that items may be redundant. The four social support subscales, each consisting
of four items, were found to be highly reliable; friends social support (α = .89), family
social support (α = .88), and significant other social support (α = .90). Cronbach’s alphas
for the eight-item acculturation scale (AHIMSA) and the 10-item Perceived Stress Scale
(PSS-10) were .71 and .74, respectively. Recommended values are 0.7 or higher
(DeVellis, 2011).
Table 10 Study Sample Alpha Reliabilities
Instrument Cronbach’s alpha
SAFE .841
PSS-10 .742
AHIMSA .713
MSPSS .912
MSPSS-Friends subscale .896
MSPSS-Family subscale .880
MSPSS-Significant Other subscale .904

57

58
Hypotheses
Hypothesis 1: Individuals who have a higher acculturation level are more likely
to experience lower levels of acculturative stress.
Pearson’s r-tests were run to assess the relationships between level of
acculturation, generation, and acculturative stress. There was a significant negative
correlation between integration orientation and acculturative stress, r (73) = -.203,
p = .04, and a significant positive correlation between marginalization orientation and
acculturative stress, r (72) = .266, p = .012. Correlations for the predictor variables are
shown in Table 11. Multiple regression analysis was used to test if level of acculturation
significantly predicted acculturative stress. Although there was a significant positive
correlation between the subscale marginalization and acculturation stress, it was not a
significant predictor of acculturative stress. For model 1, there was linearity, as assessed
by partial regression plots and a plot of studentized residuals against the predicted values.
The data met the assumption of independent errors (Durbin-Watson value = 2.10). There
was no evidence of multicollinearity, as assessed by tolerance values greater than 0.1
(Field, 2009). A linear regression was calculated to predict acculturative stress based on
the four subscales for level of acculturation (assimilation, separation, integration, and
marginalization). The results showed F (4, 67) = 3.389, p = .014), with an R2 = .168.
Level of acculturation explained 16.8% of the variance in acculturative stress scores.
In model 2, generation was added as another predictor; the results showed that
both the level of acculturation and generation significantly predict acculturative stress
F (5, 66) = 2.886, p = .020, R2 = .179. There is strong evidence in the literature
suggesting that social determinants such as education and income are related to

59
acculturative stress; therefore, in model 3, perceived general stress, gender, family
income, and parents’ level of education were controlled as covariates. A significant
equation was found, (F (10, 61) = 2.078, p = .040), with an R2 = .254 (R2 change from
17.9 to 25.4). Acculturation stress decreased for those individuals who indicated their
level of acculturation as being either assimilated or integrated. The two subscales
indicating assimilation (p = .048) and integration (p = .046) were significant predictors of
acculturative stress. Hypothesis 1 was supported. Regression coefficients can be found in
Table 12. Model summaries of multiple regressions with R2 change are shown in Table
13.
Table 11 Correlations Between Predictive Variables and Acculturative Stress
Variable 1 2 3 4 5 6
1. Acculturative stress -
2. Generation .047 -
3. Assimilation -.093 .213 -
4. Separation .178 -.418 -.276 -
5. Integration -.203* .096 -.600 -.414 -
6. Marginalization .266* -.022 -.088 -.040 -.420 -
*p < .05

60
Table 12
Linear Regression Analysis for Acculturation Stress
Variable B SEβ β t p
Intercept 155.439 70.657 -2.066 2.380 .020
Assimilation -16.660 8.253 -2.066 -2.037 .046*
Separation -15.145 8.582 -1.477 -1.679 .098
Integration -17.001 8.350 -2.507 -2.016 .048*
Marginalization -13.309 8.365 -2.507 -1.535 .130
Generation 1.497 4.266 .046 .946 .348
Perceived stress .568 .429 .152 1.32 .191
Gender 7.357 4.48 .209 2.239 .029*
Years Education Mother .165 .698 .054 .490 .626
Years Education Father -.284 .751 -.084 -.852 .398
Family Income -.855 2.135 -.051 -.949 .346
R2 = .254
F = 2.078 .040*

61
Table 13 Hierarchical Linear Regression Analysis of Acculturative Stress
B SE B β t p
Model 1 Constant 170.3 61.9 2.75 .008 assimilation
separation integration marginalization
-17.2 -15.4 -17.3 -13.5
7.7 7.90 7.79 7.82
-2.13 -1.51 -2.55 -1.05
-2.23 -1.96 -2.22 -1.05
.029* .054 .030* .087
R2 = .168 ΔR2 by first block 16.8 %; F (4, 67) = 3.39, p = .014
Model 2
Constant 153.5 64.5 2.38 .020 assimilation
separation integration marginalization
-16.0 -13.6 -15.9 -12.21
7.8 8.14 7.92 7.96
-1.98 -1.33 -2.35 -9.48
-2.04 -1.68 -2.02 -1.54
.046* .098 .048* .130
generation 3.86 4.08 .119 .946 .348 R2 = .179 ΔR2 by second
block
17.9%; F (5, 66) = 2.88, p = .020
Model 3 Constant 142.8 70.8 2.01 .048 assimilation
separation integration marginalization
-16.5 -15.0 -16.8 -13.01
8.20 8.50 8.30 8.31
-2.05 -1.46 -2.48 -1.01
-2.02 -1.76 -2.03 -1.56
.048* .083 .046* .123
generation .957 4.26 .029 .255 .823 perceived stress
gender family income mother’s education father’s education R2 = .254
.568 6.53 -.623 .266 -.385
.429 4.46 2.13 .698 .751
.152
.186 -.037 .086 -.114
1.32 1.46 -.293 .380 -.513
.191
.149
.771
.705
.610
ΔR2 by third block 25.4%; F (10, 61) = 2.08, p = .04

62
Hypothesis 2: Individuals who experience increased levels of acculturation stress
will be more likely to have higher scores of allostatic load (AL)
Pearson correlations and multiple regressions were used to test Hypothesis 2. A
linear regression was used to examine the effect of acculturative stress on AL. The results
were statistically non-significant R2 = .000, F (1, 71) = .011, p = .915. Although there
was no statistical significant correlation between acculturative stress and total allostatic
load, there were significant correlations with individual biomarkers of systolic and
diastolic blood pressure and acculturative stress, with general stress controlled as a
covariate. Regression coefficients and standard errors can be found in Table 14. Linear
regressions were calculated to predict systolic blood pressure and diastolic blood pressure
based on acculturative stress. Results showed systolic blood pressure F (1, 71) = 5.97,
p = .017, with an R2 of .078, and diastolic blood pressure F (1, 71) = 5.68, p = .020, with
an R2 of .074. Acculturative stress was able to account for 7.8% and 7.4%, respectively,
of the variance in the systolic blood pressure and diastolic blood pressure. Hypothesis 2
was not supported. Table 15 shows regression results for individual biomarkers and
acculturative stress.
Table 14 Acculturative Stress Predicting Allostatic Load (N = 73)
Variable B SE B β t p
Acculturative Stress S.A.F.E.
.001 .010 .013 .107 .915
R2 .000
F .011

63
Table 15 Summary of Linear Regression Analyses for Acculturative Stress Predicting Biomarkers
Variable B SE B β t p
Systolic blood pressure
-.223 .091 -.278 -2.44 .017*
Diastolic blood pressure
-.168 .071 -.272 -2.38 .020*
Body mass index .035 .043 .095 .803 .425
Hip waist ratio .000 .001 .043 .360 .720
Hemoglobin A1c .002 .002 .106 .899 .372
Total cholesterol .013 .007 .223 1.93 .058
HDL cholesterol .165 .108 .179 1.530 .130
Triglycerides -.5540 .610 -.104 -.884 .380
LDL cholesterol .009 .219 .005 .041 .967
R2 (SBP)
R2 (DBP) .078 .074
F (SBP) 5.97
F (DBP) 5.68
Hypothesis 3: Individuals who are first-generation immigrants will have higher
acculturative stress levels and higher scores of total allostatic load than second-generation
immigrants.
Pearson correlations and multiple regressions were used to test Hypothesis 3. A
linear regression was used to examine the effect of generation on acculturative stress. The
results were statistically non-significant, R2 = .004, F (1, 71) = .254, p = .616. Then, total
AL was added as another predictor into the main model; the results showed that when
entered together, both generation and total AL were not statistically significant,
F (2, 70) = .127, p = .881, R2 = .004. Linear regressions were calculated to predict

64
acculturative stress based on systolic blood pressure and diastolic blood pressure.
Significant regression equations were found for both systolic blood pressure,
F (1, 71) = 5.97, p = .017, with an R2 of .078, and diastolic blood pressure,
F (1, 71) = 5.68, p = .020, with an R2 of .074. When systolic and diastolic blood pressures
were entered together, the results were statistically significant, R2 = .091, F (2, 70) =
3.48, p = .036. Regression coefficients and standard errors can be found in Table 16.
Hypothesis 3 was not supported.
Table 16 Generation and Biomarkers Predicting Acculturative Stress
Variable B SE B β t p
Generation 1.945 3.862 .060 .504 .616
Total AL .148 1.38 .013 .107 .915
Systolic blood pressure
-.348 .142 -.278 -2.44 .017*
Diastolic blood pressure
-.441 .185 -.272 -2.38 .020*
BMI .258 .321 .095 .803 .425
Hip-Waist ratio 8.748 24.29 .043 .360 .720
HgA1c 6.48 7.21 .106 .899 .372
Tot chol .133 .079 .197 1.69 .095
HDL chol .194 .217 .179 1.53 .130
triglycerides -.200 .023 -.104 -.884 .380
LDL chol .003 .064 .005 .041 .967
R2 (SBP)
.078
R2 (DBP) .074
F (SBP) 5.97
F (DBP) 5.86
*p < .05

65
Hypothesis 4: Perceptions of social support will affect the relationship between
acculturative stress and allostatic load.
Pearson correlations and multiple regressions were used to test Hypothesis 4. A
significant positive correlation was found between gender and acculturative stress,
r (73) = .300, p = .010. Significant negative correlations between gender and AL,
r (73) = -.280, p = .034, and between perceived social support and AL, r = -.248,
p = .036, were found. Correlations for the predictor variables are shown in Table 17. In
the first step, a linear regression was used to examine the effect of acculturative stress on
AL. The results, as stated previously in Hypothesis 3, were statistically non-significant,
R2 = 000 F (1, 71) = .011, p = .915. Next, a linear regression was used to examine the
relationship between total mean score of perceived social support and AL. The results
were statistically significant, R2 = .065, F (1, 71) = 4.94, p = .029. Linear regressions
were then performed separately for each of the three different social support subscales
(i.e., sources of social support) and AL. The family members social support subscale
(M = 5.20, SD = 1.44) had a significant negative correlation (r = -.212, p = .036), but was
not a significant predictor of AL, R2 = .045, F (1, 71) = 3.34, p = .072. The significant
others social support subscale (M = 5.49, SD = 1.50) was not significantly correlated
(r = -.087, p = .23) with AL and was not a significant predictor of AL, R2 = .008,
F (1, 71) = .542, p = .46. The friends social support subscale (M = 5.09, SD = 1.46) was
significantly negatively correlated with AL (r = -.304, p = .004); the results of the
regression indicated that the friends subscale significantly predicted AL and explained a
significant proportion of variance in AL scores, R2 = .093, F(1, 71) = 7.24, p = .009. To

66
examine the indirect relationship between AL and acculturative stress through social
support, a multiple regression was used. There was independence of residuals, as
assessed by a Durbin-Watson statistic of 2.110. There was no evidence of
multicollinearity, as assessed by tolerance values greater than 0.1. In model 2, total
perceived social support (MSPSS) and acculturative stress (S.A.F.E.) were entered as the
predictor variables, with AL as the outcome variable. The results were statistically non-
significant, R2 = .068, F (2, 70) = 2.56, p = .085.
In model 3, the MSPSS friends subscale and acculturative stress (S.A.F.E.) scales
were then entered as the predictor variables, with AL as the outcome variable. The results
were statistically significant, R2 = .093, F (2, 70) = 3.61, p = .032. In model 4, in addition
to MSPSS friends subscale and acculturative stress, control variables were entered into
the regression. The standardized coefficients for acculturation stress (S.A.F.E.) were
compared between model 1 (β = .013), model 2 (β = .056), model 3 (β = .031), and model
4 (β = .133). The analysis showed that friends social support and acculturative stress did
significantly predict AL. Total social support scores had a significant direct negative
relationship with AL and are a significant predictor for AL; however, social support did
not have an indirect effect on the association between acculturative stress and AL.
Hypothesis 4 was partially supported. Results for model 1, model 2, model 3, and model
4 are reported in Table 18.

67
Table 17
Correlations Between Predictive Variables and Allostatic Load (n = 73)
Variable 1 2 3 4 5 6 7 8
1. Allostatic Load -
2. Acculturative Stress
.013 -
3. Generation .098 .060 -
4. Gender -.280* .300* .202 -
5. Mother’s Education -.018 -.057 -.076 -.076 -
6. Father’s Education -.029 -.091 -.164 -.199 .845* -
7. Perceived Stress -.147 .181 .148 .189 -.088 -.044 -
8. Social Support -.248* .188 -.077 .155 .092 .071 -.157 -
*p < .05

68
Table 18 Hierarchical Regression Analysis of AL
B SE β t P
Model 1
Constant 1.38 .411 3.36 .001 SAFE .001 .010 .013 .107 .915 R2 .000 ΔR2 by first block 0%; F (1, 71) = .011, p = .915 Model 2
Constant 2.97 .810 3.67 .000 SAFE .005 .010 .056 .482 .631 Tot-MSPSS -1.07 .473 -.264 -2.26 .027* R2 .068 ΔR2 by second block 6.8%; F (2, 70) = 2.56, p = .085 Model 3
Constant 3.03 .731 4.15 .000 SAFE .003 .010 .031 .274 .785 MSPSS-Friends -1.04 .386 -.306 -2.68 .009* R2 .093 ΔR2 by third block 9.3%; F (2, 70) = 3.61, p = .032 Model 4
Constant 4.93 1.32 3.72 .000 SAFE .011 .010 .133 1.13 .261 MSPSS-friends -.921 .405 -.272 -2.27 .026* Gender -.816 .384 -.272 -2.13 .037* Generation .335 .328 .120 1.02 .312 Mother’s education .014 .057 .051 .238 .813 Father’s education -.023 .064 -.079 -.361 .719 Perceived stress -.060 .038 -.186 -1.57 .121 R2 .201 ΔR2 by fourth block 20.1%; F (7, 65) = 2.34, p = .034

69
Additional or Ancillary Findings and Analysis of Same
The purpose of this study was to assess the effect of social support on
acculturative stress and AL among first- and second-generation immigrant college
students. Although no statistical difference was found in AL scores between generations,
a statistical difference was found between male and female participants, with males
showing higher total AL scores and higher mean systolic blood pressure than females.
HDL cholesterol levels were higher in females than males and LDL cholesterol levels
were higher in males. This may be attributed to the role of the estrogen hormone, which
tends to increase HDL cholesterol in young women from puberty until menopause. LDL
cholesterol levels begin to increase in women after estrogen production declines with the
onset of menopause. Individuals exposed to even modest rises in levels of LDL (100-129
mg/dl) cholesterol or lower levels of HDL cholesterol during young adulthood are
associated with significantly higher risk of atherosclerosis (Navar-Boggan et al., 2015).
Mean scores indicated comparatively low levels of acculturative stress. Although there
was no significant difference in acculturative stress scores for first-generation and
second-generation immigrant students, there were significant differences in levels of
acculturative stress between female subjects and male subjects, with higher levels of
acculturative stress in females. Interestingly, although there was no significant correlation
between acculturative stress and social support, acculturative stress was lower in males,
with higher levels of social support for males than for females.

70
CHAPTER FIVE: DISCUSSION OF THE FINDINGS
The purpose of this study was to determine if acculturative stress predicts
allostatic load in first- and second-generation immigrant college students, and the effect
of social support on this relationship. This chapter presents a discussion of the results and
interpretations drawn from the previous analyses and the hypotheses based on the
theoretical propositions of the Model of Acculturative Stress (Berry et al., 1987) and the
Allostatic Load Model (McEwen, 1998a).
Findings for Each Hypothesis
Acculturation and Acculturative Stress
The first hypothesis proposed that individuals who have a higher acculturation
level are more likely to experience lower levels of acculturative stress. This hypothesis
was based on Berry’s theoretical model of acculturative stress (Berry & Kim, 1988). The
model was based on cultural and psychological factors and the relationship between
acculturation experience, stressors, and acculturative stress. The model posited that the
level of acculturative stress experienced is influenced by several acculturation factors.
According to Berry’s model, for many individuals, the process of acculturation can be
stressful due to factors such as language barriers, discrimination, lower socioeconomic
status, lack of social support, and conflicts between family values and the new host
culture. Immigrant individuals generally identify with one of four acculturation patterns
or orientations: (a) Assimilation—individual replace the norms of the home culture with
the norms of the host culture; (b) Separation—individuals reject the norms of the host
culture and maintains their home cultural norms; (c) Integration—individuals combine of
both cultures, choosing to keep their home cultural norms while at the same time

71
participating in and interacting with the host culture; and (d) Marginalization—
individuals become alienated from both cultures by rejecting the norms of both the home
and the host cultures (Berry, 2013).
There is substantial evidence in the literature of the relationship between level of
acculturation and acculturative stress (Berry, Phinney, Sam, & Vedder, 2006; Berry,
2013). Significant regression results supported the hypothesis, with the two subscales
indicating assimilation and integration as significant predictors of acculturative stress.
Acculturative stress decreased for those individuals who identified their orientation as
integrated or assimilated. These results supported previous studies on level of
acculturation and stress among different groups, suggesting that individuals who pursue
integration experience less discrimination than those who are marginalized or separated.
An earlier study by Berry (1989), which included university students, found that those
students who were less acculturated reported greater acculturative stress. Similar studies
found that those individuals who were more integrated reported better adjustment in
school and greater psychological well-being (Berry & Sabatier, 2010; Schwartz et al.,
2013). Similar findings from a study on international students found that students in the
acculturation category of integration reported lower levels of acculturative stress than
those in the separation or marginalization category (Sullivan & Kashubeck-West, 2015).
All of the participants in the study were able to meet college admission requirements for
reading and writing and spoke English. The majority (90%) identified their cultural
orientation as either integration (67.6%) or assimilation (21.5%). Knowledge of the new
language, multiculturalism in the college, and the ability to integrate/assimilate may have
influenced the level of acculturative stress experienced.

72
Another source of acculturation stress for immigrant college students is the
pressure of “fitting in.” The students in this sample were more acculturated, and therefore
may not have experienced “cultural self-consciousness.” Acculturative stress scores were
higher in females than males. Several studies in the literature showed an association
between gender and the acculturation process (Castillo, Perez, Castillo, & Ghosheh,
2010; Lorenzo-Blanco, Unger, Baezconde-Garbanati, Ritt-Olson, & Soto, 2012). A study
conducted by Cano et al. (2014) on Mexican American college students found similar
results, with higher acculturative stress levels in females than males. Although no
statistically significant relationship was found between gender and level of acculturation,
evidence in the literature has suggested that Latino male adolescents tend to acculturate
more quickly than girls (Schwartz et al., 2006).
Acculturation Stress and Allostatic Load
Hypothesis 2 proposed that individuals who experience increased levels of
acculturation stress will be more likely to have higher scores of total allostatic load. This
was derived from the theoretical constructs of allostasis and allostatic load (AL) and the
allostatic load model (McEwen, 1998a). The physiologic parameters reflecting AL are
divided into primary mediators (release of norepinephrine), secondary outcome (increases
in blood pressure and heart rate), and tertiary outcomes (hypertension, diabetes mellitus,
and atherosclerosis). There is strong evidence linking acculturation stress with measures
of AL. Although the results of the regression between acculturative stress and total
allostatic load were not significant, there were significant negative correlations between
acculturative stress and the individual biomarkers of systolic and diastolic blood pressure.
The results of the regression indicated that acculturative stress significantly predicted

73
systolic blood pressure and diastolic blood pressure. One explanation for the significant
correlation with systolic blood pressure may have been temporary elevations in blood
pressure for the participants related to the task of completing the tools and the collection
of the biomarkers. This has been suggested in previous study findings linking academic
stressors with increases in blood pressure (Conley & Lehman, 2012). Similar research
results have been found in cardiovascular reactivity and daily stress-symptom reactivity
(Hilmert, Ode, Zielke, & Robinson, 2010). There is also additional evidence in the
literature suggesting that gender may influence how an individual reacts to different
stressors, with men having greater blood pressure responses relative to women (Matthews
et al., 2004; Seeman et al., 2002a). A study that examined sex differences in blood
pressure in adolescence showed blood pressure in adolescent girls was lower than
adolescent boys, with differences being the greatest during a math-stress test
(Syme et al., 2009). The inclusion of additional biomarkers such as cortisol and
dehydroepiandrosterone (DHEA) may have provided a more complete picture of the
stress response. Previous studies have suggested that DHEA is able to diminish some of
the negative effects of chronic stress (Boudarene, Legros, & Timsit-Berthier, 2002;
Shirotsuki et al., 2009). There is evidence in the literature that college students who are
the first generation to attend college struggle due to lack of economic and academic
preparation. A study by Stephens et al. (2012) showed students who were first in their
family to attend college experienced a “cultural mismatch,” with higher increases in
cortisol and less positive/more negative emotions than those students who had at least
one parent with a 4-year degree. Again, the inclusion of neuroendocrine biomarkers, like

74
cortisol, epinephrine, and DHEA, may have reflected differences in cardiovascular and
sympathetic nervous system reactivity.
Students who are first in their family to attend college may question whether they
can be successful and if they will be able to fit in. In addition to participants being either
first- or second-generation immigrants, all but two were the first to attend college in their
families. Despite first-generation college students experiencing adversity and challenges
due to lack of financial resources and academic preparation, there was no significant
association between acculturative stress and AL nor between general perceived stress and
AL. This may be partially attributed to the amount of available resources and mentoring
environment to better bridge the gap and provide all students with equal opportunities for
success. Another possible explanation may be using a general measure of stress as
opposed to a tool that measures more specific sources of stress (i.e., economic stress,
financial burdens, and future employment opportunities). Social determinants such as
race, ethnicity, education, and income are associated with AL (Brody et al., 2013;
Chao et al., 2014; Gruenewald et al., 2012). Individuals who experience multiple
socioeconomic stressors such as lower education, chronic poverty, and unemployment
have higher AL levels. Although 82% of participants reported their family’s annual
income of $35,000 or less, study results showed total AL index scores were low, with
high levels of social support. The majority (75%) of the participants indicated moderate
levels of perceived stress, with the remaining 25% indicating high levels of perceived
general stress. The PSS-10 is designed to measure individuals’ perception of their ability
to manage stress and how they perceive aspects of their life as “uncontrollable or
unpredictable.” More than half of the participants indicated “sometimes” to “almost

75
never” on scale items indicating lack of sense of personal control over life events. These
results were similar to a study by Seeman et al. (2014), which found that individuals who
perceived a sense of low control over life events were associated with higher AL,
compared to individuals who perceived a higher sense of control.
Acculturation Stress, Allostatic Load, and Generation
Hypothesis 3 was derived from the Model of Acculturative Stress (Berry et al.,
1987) and the Allostatic Load Model (McEwen, 1998a). Berry’s model suggested that
negative experiences in the process of acculturation contribute to acculturative stress.
Hypothesis 3 states that individuals who are first-generation immigrants will have higher
acculturation stress levels and higher scores of total AL than second-generation
immigrants. Acculturation stress scores were comparatively low, with no significant
difference between first- and second-generation groups. This is in contrast to previous
studies which suggested that level of acculturation stress was related to generational
status, with first-generation individuals experiencing higher levels of acculturative stress
than second-generation immigrants (Hovey & King, 1996; Lueck & Wilson, 2011; Mena
et al., 1987). Although Hypothesis 3 was not supported, one possible explanation for the
non-significant results and comparatively low acculturative stress scores is that the study
was conducted in a racially and ethnically diverse university setting, with almost 68% of
the participants indicating integration as their cultural preference. The students may
experience less pressure to maintain their native cultural norms and the conflict of
adopting behaviors and values from the United States than those who indicated
marginalization as their cultural orientation. Another plausible explanation for the lower
acculturative stress scores is that all of the participants are college students enrolled in the

76
Center for English Language Acquisition (CELAC) program. This program provides a
wide range of resources to support and promote academic success through language
acquisition classes, language labs, conversation practice, and individual graduate tutoring
sessions. They also have access to counselors, faculty mentors, and peers who allow them
the opportunity to discuss negative acculturation experiences and express their feelings in
a supportive environment. Another possible explanation for the lack of difference in
acculturative stress scores between the two generations is that second-generation
immigrants also face the challenges of balancing two cultures, that of their cultural
heritage and those of the United States. In addition, 74% of the sample self-identified as
Latino/Hispanic; this may provide an environment in which they can speak their native
language without feeling pressured to speak only English. The comparatively low mean
acculturative stress scores and lack of statistical difference between the two generational
groups may also be partly explained by previous studies showing that second-generation
immigrant children also experience acculturative stress because they acculturate at a
faster pace than their parents, which may result in conflicts in the home and disconnect
with their less acculturated parents (Mena et al., 1987; Miranda, Bilot, Peluso, Berman, &
Van Meek, 2006).
The second part of Hypothesis 3 stated that first-generation immigrant students
would have higher levels of AL. Extensive research has shown that immigrants have
better health on arrival to the United States, yet experience a decline in health after living
here and may acquire unhealthy lifestyle practices (Albrecht et al., 2013). Although no
significant difference was found between the biomarkers and generation, the BMI for the
sample fell under the category of overweight (CDC, 2014). Lifestyle practices such as

77
exercise, smoking, and use of alcohol were not assessed in the sample, which may have
added some clarity to the results. Research has suggested that age of arrival and years
living in the United States are strong determinants for an individual’s risk of weight gain
(Kaushal, 2009; Oza-Frank & Venkat Narayan, 2010). There is evidence in the literature
that generation, older age at immigration, and more years in the United States were
associated with higher AL. In contrast to previous studies, total AL mean scores did not
differ significantly between first- and second-generation students. This may be partially
attributed to the relatively low mean number of years for first-generation students living
in the United States. Empirical support has shown that immigrant health declines with
longer residence in the United States due to acculturation and adoption of unhealthy
behaviors. Several studies have indicated that some immigrant groups have lower AL
scores upon arrival, but this health advantage disappears with longer residence in the
United States (Doamekpor & Dinwiddie, 2015; Kaestner et al., 2009; Peek et al., 2010).
One additional factor that may have impacted AL is that for the majority of the
participants, their families were also living in the United States so they were not faced
with separation from parents and siblings in their homeland. Family reunification has
been associated with lower AL levels and lower levels of stress hormones (Bingham et
al., 2016).
Acculturative Stress, Social Support, and Allostatic Load
Hypothesis 4 was derived from the stress-buffering model (Cohen, 2004; COhen
& WIlls, 1985b) and the AL model. The stress-buffering model posits that psychological
support from family members, friends, and other social resources “buffers” or protects
the individual from the negative psychological and physical health outcomes that can

78
result from multiple stressful events. Hypothesis 4 stated that perceptions of social
support will affect the relationship between acculturative stress, and allostatic load. This
hypothesis suggests that acculturative stress would have a direct effect on AL, and social
support would mediate the effect on acculturative stress on AL. This hypothesis was not
supported. Results showed there was no indirect relationship between AL and
acculturative stress through social support. However, social support was a negative
significant predictor of AL and has a direct significant relationship with AL. Social
support has been associated with lower activity of the autonomic nervous system and
HPA in response to stressors (Ditzen, Hoppmann, & Klumb, 2008). A previous study on
AL and social relationships showed that higher levels of spouse negativity, family
negativity, friend contact, and network level contacts were associated with higher AL
(Brooks et al., 2014). Their results also suggested that network negativity was associated
with higher AL among younger adults. The results of several other studies have
suggested that the type and quantity of social support are associated with AL. Individuals
with more social ties and higher levels of emotional support had lower AL scores
(Seeman, Singer, Ryff, Love, & Levy-Storms, 2002c; Seeman et al., 2004). In another
study of older Taiwanese adults, higher levels of perceived demands from others were
associated with higher levels of AL. The stress-buffering hypothesis (Cohen & Wills,
1985a) posits that perceived availability of social support resources is beneficial for
individuals experiencing stress. Perceived social support scores were high for the sample.
The results do build on existing literature and suggest that social support and social
relationships are associated with AL.

79
CHAPTER SIX: SUMMARY, CONCLUSIONS, IMPLICATIONS,
RECOMMENDATIONS
Summary
The purpose of this study was to examine the relationships among level of
acculturation, acculturative stress, social support, and allostatic load in a sample of first-
and second-generation immigrant college students. There is a significant amount of
evidence in the literature supporting the concept that cumulative, persistent stress—both
psychological and physiological—contributes to chronic disease and increased morbidity,
especially among vulnerable and disadvantaged populations, including immigrants.
Acculturation as defined by Berry (2013) is a dynamic, bidirectional process of
adaptation to stress and an individual’s coping mechanism. Individuals vary in how well
they adapt to the new culture, for some there are negative experiences which may be
more accurately defined as acculturative stress. Acculturative stress is a “more specific
concept than acculturation” and refers to a “reduction on health status” resulting from the
process of acculturation (Berry et al., 1987, p.200). The acculturative stress model by
Berry (1987) was based on the relationship between acculturation experience, stressors,
and acculturative stress.
The acculturation process varies among individuals, resulting in varying levels of
acculturative stress resulting from the acculturation experience. There is strong evidence
linking acculturation stress with measures of AL. This includes numerous studies which
have shown that the cumulative exposure to chronic stress and time living in the United
States all contribute to higher levels of AL in new immigrants. In McEwen’s allostatic
load model, AL is described as the cumulative wear-and-tear on the body’s system as a

80
result of repeated activation and deactivation of allostatic responses to stressful situations.
AL can accumulate and increase in several ways: (a) the stressor is repeated over an
extended period of time; (b) as a result of the continuous stress, the response to the stress
diminishes; and (c) the stressor response does not recognize that the stressor has resolved
and fails to shut down (McEwen, 2008). In response to perceived or actual stress,
catechol amines, glucorticoids, and stress hormones epinephrine, norepinephrine, and
cortisol are released. The physiological parameters reflecting AL are divided into primary
mediators, secondary outcomes, and tertiary outcomes. AL is calculated as a total score
index designed to summarize biomarkers across multiple systems (Seeman et al., 2010).
Many immigrant college students are at increased cumulative risk due to academic and
economic as well as social issues.
There is strong evidence of the stress-buffering effects of social support with
regard to acculturative stress (Crockett et al., 2007). The acculturative stress model
identifies social support as a variable that may serve as a “buffer” in reducing the level of
acculturative stress in individual experiences. Based on the conceptual frameworks for
acculturation stress, AL, and the effect of social support, the following hypotheses were
formulated:
1. Hypothesis 1: Individuals who have a higher degree of acculturation are more
likely to experience lower levels of acculturation stress.
2. Hypothesis 2: Individuals who experience increased levels of acculturation
stress will be more likely to have higher scores of total allostatic load.

81
3. Individuals who are first-generation immigrants will have higher
acculturative stress levels and higher scores of total allostatic load than
second-generation immigrants.
4. Hypothesis 4: Perceptions of social support will affect the relationship
between acculturative stress and allostatic load.
The sample (n = 73) included undergraduate students attending Saint Peter’s
University who were English-speaking, self-reported as first- or second-generation
immigrants, and did not have any injuries or chronic illnesses. The sample consisted of
31.5% male and 68.5% female, with 54.8% self-reporting as first-generation immigrants
and 45.2% reporting as second-generation immigrants. Hispanic/Latino made up 74% of
the sample, with the remaining sample consisting of 13.7% Black/African American,
6.8% Asian, and 4.1% other race. Participants completed a demographic questionnaire
and instruments for measuring level of acculturation, acculturative stress, perceived
stress, and perceived social support. Blood biomarkers were collected by finger stick. The
dependent variable of the study was AL, operationally defined as a calculated total score
index based on cardiovascular, metabolic, and anthropometric biomarkers. Acculturative
stress was measured using the Social, Attitudinal, Familial, and Environmental
Acculturative Stress (S.A.F.E.) Scale. General perceived stress was measured using the
Perceived Stress Scale (PSS-10). Acculturation was measured using the Acculturation,
Habits, and Interests Multicultural Scale for Adolescents (AHIMSA). Perceived social
support was measured using the Multidimensional Scale of Perceived Social Support
(MSPSS). Statistical analyses were carried out with Statistical Package for the Social
Sciences (SPSS) Version 24. The level of significance for hypothesis testing was

82
calculated at the .05 level. Data were first examined for outliers and anomalous data
entries. Tests for normality and equal variances were performed. Sample characteristics
were summarized using descriptive analysis. Tests for skewness and kurtosis were
performed. Pearson chi-squares were conducted to determine if there were differences
between gender and generation, and differences in level of income between first and
second generations.
The results were not statistically significant. The majority of the sample (67%)
indicated their acculturation orientation as integration. No significant difference was
found between generation and level of acculturation. Independent t-tests showed no
statistical difference in biomarkers between first- and second-generation students.
Acculturative stress scores and total AL scores were not significantly different between
generations; however, there was a significant difference in AL scores between male and
female, with males showing higher AL scores. The mean sample social support score
indicated high levels of social support; however, social support scores did not differ
significantly between first and second generations.
Hypothesis 1 was supported through the research findings. The results suggested
that level of acculturation was a significant predictor of acculturative stress.
Acculturation stress decreased for those individuals who indicated their level of
acculturation as being either one of assimilation or integration.
Hypothesis 2 was not supported through this research. However, there were
significant correlations between the individual biomarkers of systolic/diastolic blood
pressure and acculturative stress. The cross-sectional design, small sample size, the
recruitment of healthy college students with a mean age of 18 and relatively low

83
acculturative stress scores may have been limitations. Inclusion of neuroendocrine and
immune biomarkers should be considered.
Hypothesis 3 was not supported through this research. As stated above, the small
sample size, low acculturative stress scores, mean length of time in the United States (6.6
years) for first generation, and lack of neuroendocrine biomarkers may not reflect true
biological activities.
Hypothesis 4 was partially supported. The results as stated in Hypothesis 3
showed a non-significant correlation between acculturative stress and AL; however,
social support was a negative significant predictor of AL and had a direct significant
relationship with AL. Linear regressions were performed separately with each of the
social support subscales (friends, family, and significant other). Friends social support
subscale was significantly negatively correlated, and the results of the final regression
indicated that friends social support and acculturative stress did significantly predict AL.
Implications for Nursing
The findings in this study may provide important information for nurses and other
health care providers on the role of social support and AL, in addition to the association
between acculturative stress and level of acculturation. Immigrant students who are in the
marginalized or separated category of acculturation may experience higher levels of
acculturative stress, as compared to those who identify with integration. Acculturative
stress is associated with anxiety, depressive symptoms, and predictors of suicidal
behaviors, which underscore the importance of assessing acculturative stress in
immigrant college students. Developing interventions that address difficulties associated
with acculturative stress would be beneficial to the students. The measure of AL is

84
especially useful in young adults where single measures (i.e., blood pressure or glucose)
may not indicate the precursors to future cardiovascular disease. The evidence in the
literature is substantial, indicating that higher AL scores predict increased mortality
(Crimmins, Kim, Alley, Karlamangla, & Seeman, 2007; Geronimus, Hicken, Keene, &
Bound, 2006; Seeman, Singer, Ryff, Love, & Levy-Storms, 2002b; Seeman et al., 2004).
The results of this study add to the literature the significance of social support and
AL, particularly friends social support, among immigrant college students. Previous
studies have suggested that perceived social support significantly contributes to
psychological well-being. Higher social support and positive social relationships are
associated with lower AL. Using measures of AL in conjunction with measures of social
support could be extremely valuable in predicting both psychological and physical health
risks in young adults. Nurses in the college health setting and primary care clinics can be
instrumental in promoting annual health physical examinations, offering preventive
screenings and use of health services, and encouraging immigrant students to develop
social networks and identify major stressors that may result from both academic and
social pressures. Because AL provides direct measures of biological outcomes rather than
relying on individuals’ self-report as a measure of their health, it is a far better predictor
of risk for obesity and other stress-related chronic diseases such as atherosclerosis,
hypertension, and cardiovascular disease. In young adults, measurable AL could be an
early warning sign of accumulating health risks and useful in predicting potential poor
health outcomes.

85
Recommendations
As the data for this study came from one site, it may not be representative of
immigrant college students across the country. Future studies should include samples
from other geographic regions and private and public universities, especially institutions
that are less diverse and where the majority student population is Caucasian. It would be
important to include LGBT immigrant college students in future studies, as well as
immigrant young adults not attending college. For first-generation immigrant students, it
would have been beneficial to consider the reason for immigration, as possible pre-
migration trauma could be a factor. Previous research has suggested a relationship
between acculturative stress and risk for mental health issues. Future studies should
include measures of depression and anxiety, self-esteem, and the effect of stress-coping
resources on acculturative stress. Additional intermediate factors to examine may include
the effects of health behaviors—exercise, use of alcohol, smoking, sleep, and diet, as well
as measures of stress relief on AL. There is evidence that stress and sleep have a
reciprocal relationship, and that poor sleep and psychological stress combined can
contribute to AL. Sleep deprivation can be considered as an additional factor affecting
AL. To better understand the complex relationship of acculturative stress and AL, it
would be critical to include multiple psychological factors, such as coping skills and
resilience, and their impact on acculturative stress and AL.
In addition to biomarkers as measures of AL, heart rate variability (HRV), which
refers to the beat-to-beat changes in heart rate, has also been identified as a possible
marker of AL. HRV appears to be sensitive and responsive to acute stress and cumulative
stress due to autonomic nervous system activity (Tonello et al., 2007). Future studies
86
should be considered to examine the relationship between acculturative stress and AL
with HRV as a monitoring tool.
Limitations
There were several limitations to this study. The cross-sectional design was a
limitation to the study as only associations and not causation can be inferred. Studies on
AL are interested in chronic stress measures, with stressors accumulating over a number
of years. A longitudinal study would allow participants to be observed at multiple times.
One of the strengths of the study was the inclusion of a measure of general perceived
stress to better distinguish the specific effects of acculturative stress. The small sample
size and disproportionately low number of men compared to women as well as the lack of
information on health behaviors (i.e., diet, exercise, and smoking) were limitations.
Another potential limitation of the study was the number of biomarkers analyzed. There
are no single set of standardized biomarkers to calculate an index allostatic load;
however, evidence does support measuring biomarkers representing major biological
systems for assessing cumulative health risk (Seeman, Merkin, Karlamangla, Koretz, &
Seeman, 2014). The biomarkers in this study did include systolic and diastolic blood
pressure (indicators of cardiovascular activity), waist-to-hip ratio (a metabolism index
and adipose tissue deposition), total lipid profile (risk factors for development of
atherosclerosis), and glycosylated hemoglobin (HbA1c is a marker for glucose
metabolism). Due to logistics and financial restraints, this study did not include
neuroendocrine or immunological biomarkers, which would indicate inflammation,
clotting factors, and immune function, thus increasing the potential for false negative
findings (Galen Buckwalter et al., 2015).

87
Conclusions
There is increased evidence that integration as an acculturation strategy is
associated with more positive adaptions than either separation or marginalization (Berry,
2013), although some studies have seen poor health outcomes associated with individuals
who are less acculturated. The findings from this study reflected the complexity of the
acculturation process, the effect of the individuals’ experiences, and the role of
acculturative stress. More research is needed to better understand the relationship
between patterns of acculturation and AL. Future research should continue to examine
health behaviors relating to immigration and ethnicity and how they may influence AL.
Allostatic load provides a direct measure of biological outcomes rather than relying on
the individuals’ own self-reports as a measure of their health; therefore, it is a far better
predictor of stress-related chronic diseases. Future research using a longitudinal design is
necessary to examine the relationship between social support and AL. Young adulthood
is a key time to make lifestyle changes and promote health behaviors that can markedly
alter an individual’s lifetime risk.

88
REFERENCES Adams, R. E., Santo, J. B., & Bukowski, W. M. (2011). The presence of a best friend
buffers the effects of negative experiences. Developmental Psychology, 47(6), 1786. doi:10.1037/a0025401
Albrecht, S. S., Roux, A. V. D., Kandula, N. R., Osypuk, T. L., Ni, H., & Shrager, S.
(2013). Immigrant assimilation and BMI and waist size: A longitudinal examination among Hispanic and Chinese participants in the multi�ethnic study of atherosclerosis. Obesity, 21(8), 1695-1703. doi:10.1002/oby.20104
Almedom, A. M. (2005). Social capital and mental health: An interdisciplinary review of
primary evidence. Social Science and Medicine, 61(5), 943-964. https://doi.org/10.1016/j.socscimed.2004.12.025
Almeida, J., Duncan, D. T., Sonneville, K. R., Almeida, J., Duncan, D. T., & Sonneville,
K. R. (2015). Obesogenic behaviors among adolescents: The role of generation and time in the United States. Ethnicity and Disease, 25(1), 58-64. Retrieved from Scopus Database (Accession Number: edselc.2-52.0-84922710703)
Arbona, C., Olvera, N., Rodriguez, N., Hagan, J., Linares, A., & Wiesner, M. (2010).
Acculturative stress among documented and undocumented Latino immigrants in the United States. Hispanic Journal of Behavioral Sciences, 32(3), 362-384. doi:10.1177/0739986310373210
Arevalo, S. P., Tucker, K. L., & Falcon, L. M. (2014). Life events trajectories, allostatic
load, and the moderating role of age at arrival from Puerto Rico to the US mainland. Social Science and Medicine, 120, 301-310. https://doi.org/10.1016/ j.socscimed.2014.09.040
Aschbacher, K., Kornfeld, S., Picard, M., Puterman, E., Havel, P. J., Stanhope, K., . . .
Epel, E. (2014). Chronic stress increases vulnerability to diet-related abdominal fat, oxidative stress, and metabolic risk. Psychoneuroendocrinology, 46, 14-22. doi:10.1016/j.psyneuen.2014.04.003
Ayers, J. W., Hofstetter, C. R., Usita, P., Irvin, V. L., Kang, S., & Hovell, M. F. (2009).
Sorting out the competing effects of acculturation, immigrant stress, and social support on depression: A report on Korean women in California. The Journal of Nervous and Mental Disease, 197(10), 742-747. doi:10.1097/NMD.0b013e 3181b96e9e
Bates, L. M., Acevedo-Garcia, D., Alegría, M., & Krieger, N. (2008). Immigration and
generational trends in body mass index and obesity in the United States: Results of the National Latino and Asian American Survey, 2002-2003. American Journal of Public Health, 98(1), 70-77 (Accession Number: 28804942)

89
Beckie, T., Groer, M., & Beckie, T. M. (2012). A systematic review of allostatic load, health, and health disparities. Biological Research for Nursing, 14(4), 311-346. doi:10.1177/1099800412455688
Berry, J. W. (2005). Acculturation: Living successfully in two cultures. International
Journal of Intercultural Relations, 29(6), 697-712. https://doi.org/10.1016/ j.ijintrel.2005.07.013
Berry, J. W. (2013). Immigration, acculturation and adaptation. Applied Psychology,
46(1), 5-34. Berry, J. W., & Kim, U. (1988). Acculturation and mental health. In P. Dasen, J. W.
Berry, & N. Sartorius (Eds.), Health and cross-cultural psychology (pp. 207-236). Newbury Park, CA: Sage.
Berry, J. W., Kim, U., Minde, T., & Mok, D. (1987). Comparative studies of
acculturative stress. International Migration Review, 21(3, Special Issue: Migration and Health), 491-511. doi:10.2307/2546607
Berry, J. W., Kim, U., Power, S., Young, M., & Bujaki, M. (1989). Acculturation
attitudes in plural societies. Applied Psychology, 38, 185-206. Berry, J. W., Phinney, J. S., Sam, D. L., & Vedder, P. (2006). Immigrant youth:
Acculturation, identity, and adaptation. Applied Psychology, 55(3), 303-332. doi:10.1111/j.1464-0597.2006.00256
Berry, J. W., & Sabatier, C. (2010). Acculturation, discrimination, and adaptation among
second generation immigrant youth in Montreal and Paris. International Journal of Intercultural Relations, 34(3), 191-207. doi:http://dx.doi.org.proxy.libraries. rutgers.edu/10.1016/ j.ijintrel.2009.11.007
Bingham, B. A., Duong, M. T., Ricks, M., Mabundo, L. S., Baker Jr, R. L.,
Utumatwishima, J. N., . . . Sumner, A. E. (2016). The association between stress measured by allostatic load score and physiologic dysregulation in African immigrants: The Africans in America study. Frontiers in Public Health, 4, 265. doi:10.3389/fpubh.2016.00265
Black, J. S., & Mendenhall, M. (1991). The U-curve adjustment hypothesis revisited: A
review and theoretical framework. Journal of International Business Studies, 22(2), 225-247.
Boudarene, M., Legros, J. J., & Timsit-Berthier, M. (2002). Study of the stress response:
Role of anxiety, cortisol and DHEAs. [Etude de la reponse de stress: role de l'anxiete, du cortisol et du DHEAs]. L'Encephale, 28(2), 139-146. Retrieved from Science Citation Index Database, (Accession Number: 000177691800005)

90
Brody, G. H., Yu, T., Beach, S. R., Kogan, S. M., Windle, M., & Philibert, R. A. (2014). Harsh parenting and adolescent health: A longitudinal analysis with genetic moderation. Health Psychology, 33(5), 401. doi:10.1037/a0032686
Brody, G. H., Yu, T., Chen, Y., Kogan, S. M., Evans, G. W., Beach, S. R., . . . Gibbons,
F. X. (2013). Cumulative socioeconomic status risk, allostatic load, and adjustment: A prospective latent profile analysis with contextual and genetic protective factors. Developmental Psychology, 49(5), 913. doi:10.1037/a0028847
Brooks, K. P., Gruenewald, T., Karlamangla, A., Hu, P. F., Koretz, B., & Seeman, T. E.
(2014). Social relationships and allostatic load in the MIDUS study. Health Psychology, 33(11), 1373. doi:10.1037/a0034528
Brunner, E. J., Chandola, T., & Marmot, M. G. (2007). Prospective effect of job strain on
general and central obesity in the Whitehall II study. American Journal of Epidemiology, 165(7), 828-837. doi:https://doi.org/10.1093/aje/kwk058
Buddington, S. A. (2002). Acculturation, psychological adjustment (stress, depression,
self esteem) and the academic achievement of Jamaican immigrant college students. International Social Work, 45(4), 447-464.
Canty-Mitchell, J., & Zimet, G. D. (2000). Psychometric properties of the
multidimensional scale of perceived social support in urban adolescents. American Journal of Community Psychology, 28(3), 391-400. doi:10.1023/A:1005109522457
Caplan, S. (2007). Latinos, acculturation, and acculturative stress: A dimensional concept
analysis. Policy, Politics and Nursing Practice, 8(2), 93-106. doi:10.1177/ 1527154407301751
Castillo, L. G., Perez, F. V., Castillo, R., & Ghosheh, M. R. (2010). Construction and
initial validation of the Marianismo beliefs scale. Counselling Psychology Quarterly, 23(2), 163-175. Doi:http://dx.doi.org.proxy.libraries.rutgers.edu/ 10.1080/09515071003776036
Centers for Disease Control and Prevention (CDC). (2014). Healthy weight: Assessing
your Weight: BMI: About Adult BMI. Retreived from http://www.cdc.gov/ healthyweight/assessing/bmi/adult_bmi
Cervantes, R. C., & Cordova, D. (2011). Life experiences of Hispanic adolescents:
Developmental and language considerations in acculturation stress. Journal of Community Psychology, 39(3), 336-352. doi:10.1002/jcop.20436

91
Chao, C., Shih, C., Wang, C., Wu, J., Lu, F., Chang, C., & Yang, Y. (2014). Low socioeconomic status may increase the risk of central obesity in incoming university students in Taiwan. Obesity Research & Clinical Practice, 8(3), e212-e219. Doi:10.1016/j.orcp.2012.07.002
Cho, Y., & Haslam, N. (2010). Suicidal ideation and distress among immigrant adolescents: The role of acculturation, life stress, and social support. Journal of Youth and Adolescence, 39(4), 370-379. http://dx.doi.org/10.1016/j.orcp. 2012.07.002
Choi, J. Y., Hwang, J., & Yi, J. (2011). Acculturation, body perception, and weight status among Vietnamese American students. Journal of Immigrant and Minority Health, 13(6), 1116-1124. doi:10.1007/s10903-011-9468-3
Claudat, K., White, E. K., & Warren, C. S. (2016). Acculturative stress, self‐esteem, and eating pathology in Latina and Asian American female college students. Journal of Clinical Psychology, 72(1), 88-100. doi:10.1002/jclp.22234
Cohen, S. (2004). Social relationships and health. American Psychologist, 59(8), 676-
684. http://dx.doi.org/10.1037/0003-066X.59.8.676 Cohen, S., Gottlieb, B. H., & Underwood, L. G. (2001). Social relationships and health:
Challenges for measurement and intervention. Advances in Mind-Body Medicine, 17, 129-141. Retrieved from Medline Database (PMID:11335207)
Cohen, S., Kamarck, T., & Mermelstein, R. (1983). A global measure of perceived stress.
Journal of Health and Social Behavior, 24(4), 385-396. Retrieved from http://www.jstor.org.proxy.libraries.rutgers.edu/stable/2136404
Cohen, S., & Wills, T. A. (1985a). Stress, social support, and the buffering hypothesis.
Psychological Bulletin, 98(2), 310-357. http://dx.doi.org/10.1037/0033-2909. 98.2.310
Cohen, S., & Williamson, G. (1988). Perceived stress in a probability sample of the US
In S. Spacapam & S. Oskamp (Eds.), The social psychology of health: Claremont symposium on applied social psychology (pp. 31-67). Newbury Park, CA: Sage.
Conley, K. M., & Lehman, B. J. (2012). Test anxiety and cardiovascular responses to
daily academic stressors. Stress and Health, 28(1), 41-50. doi:10.1002/smi.1399 Corlin, L., Woodin, M., Thanikachalam, M., Lowe, L., & Brugge, D. (2014). Evidence
for the healthy immigrant effect in older Chinese immigrants: A cross-sectional study. BMC Public Health, 14(1), 1. doi:10.1186/1471-2458-14-603

92
Crimmins, E. M., Kim, J. K., Alley, D. E., Karlamangla, A., & Seeman, T. (2007). Hispanic paradox in biological risk profiles. American Journal of Public Health, 97(7), 1305-1310. doi:http://dx.doi.org.proxy.libraries.rutgers.edu/10.2105/ AJPH.2006.091892
Crimmins, E. M., Soldo, B. J., Ki Kim, J., & Alley, D. E. (2005). Using anthropometric indicators for Mexicans in the United States and Mexico to understand the selection of migrants and the “Hispanic paradox.” Social Biology, 52(3-4), 164-177. doi:10.2105/AJPH.2006.091892
Crockett, L. J., Iturbide, M. I., Torres Stone, R. A., McGinley, M., Raffaelli, M., & Carlo, G. (2007). Acculturative stress, social support, and coping: Relations to psychological adjustment among Mexican American college students. Cultural Diversity and Ethnic Minority Psychology, 13(4), 347. doi:10.1037/1099-9809. 13.4.347
Cuellar, I., Bastida, E., & Braccio, S. M. (2004). Residency in the United States, subjective well-being, and depression in an older Mexican-origin sample. Journal of Aging and Health, 16(4), 447-466. doi:10.1177/0898264304265764
D'Alonzo, K. T., Johnson, S., & Fanfan, D. (2012). A biobehavioral approach to understanding obesity and the development of obesogenic illnesses among Latino immigrants in the United States. Biological Research for Nursing, 14(4), 364-374. doi:1099800412457017
DeVellis, R. F. (2012). Scale development: Theory and application (3rd ed.). Thousand Oaks, CA: Sage.
Ditzen, B., Hoppmann, C., & Klumb, P. (2008). Positive couple interactions and daily
cortisol: On the stress-protecting role of intimacy. Psychosomatic Medicine, 70(8), 883-889. doi:10.1097/PSY.0b013e318185c4fc
Doamekpor, L. A., & Dinwiddie, G. Y. (2015). Allostatic load in foreign-born and
US-born blacks: Evidence from the 2001–2010 national health and nutrition examination survey. American Journal of Public Health, 105(3), 591-597. doi:10.2105/AJPH.2014.302285
Duru, E. (2007). Re-examination of the psychometric characteristics of the
multidimensional scale of perceived social support among Turkish university students. Social Behavior and Personality: An International Journal, 35(4), 443-451. doi:10.2224/sbp.2007.35.4.443
Evans, G. W. (2003). A multimethodological analysis of cumulative risk and allostatic
load among rural children. Developmental Psychology, 39(5), 924. Retrieved from Social Sciences Citation Index Database, (Accession Number: 000184790600011)

93
Expert Panel on Detection, Evaluation, and Treatment of High Blood Cholesterol in Adults. (2001). Executive summary of the third report of the national cholesterol education program (NCEP) expert panel on detection, evaluation, and treatment of high blood cholesterol in adults (adult treatment panel III). Journal of the American Medical Association, 285(19), 2486-2497. doi:jsc10094
Faul, F., Erdfelder, E., Buchner, A., & Lang, A. (2009). Statistical power analyses using
G* power 3.1: Tests for correlation and regression analyses. Behavior Research Methods, 41(4), 1149-1160. doi:10.3758/BRM.41.4.1149
Fialkowski, M., Ettienne, R., Shvetsov, Y., Rivera, R., Van Loan, M., Savaiano, D., . . .
Shvetsov, Y. B. (2015). Ethnicity and acculturation: Do they predict weight status in a longitudinal study among Asian, Hispanic, and non-Hispanic White early adolescent females? Clinical, Cosmetic and Investigational Dermatology, 8, 27-33. doi:https://doi.org/10.2147/AHMT.S67511
Field, A. (2009). Discovering statistics using SPSS. Thousand Oaks, CA: Sage. Finch, B. K., Hummer, R. A., Kol, B., & Vega, W. A. (2001). The role of discrimination
and acculturative stress in the physical health of Mexican-origin adults. Hispanic Journal of Behavioral Sciences, 23(4), 399-429. Retrieved from Social Sciences Citation Index. (Accession Number: 000176963700004)
Finch, B. K., & Vega, W. A. (2003). Acculturation stress, social support, and self-rated
health among Latinos in California. Journal of Immigrant Health, 5(3), 109-117. doi:10.1023/A:1023987717921
Franzen-Castle, L., & Smith, C. (2014). Environmental, personal, and behavioral
influences on BMI and acculturation of second generation Hmong children. Maternal and Child Health Journal, 18(1), 73-89. doi:10.1007/s10995-013- 1235-8
Fuertes, J. N., & Westbrook, F. D. (1996). Using the social, attitudinal, familial, and
environmental (S.A.F.E.) acculturation stress scale. Measurement and Evaluation in Counseling and Development (American Counseling Association), 29(2), 67. Retrieved from Academic Search Premier Database (Accession Number: 9607253687)
Galen Buckwalter, J., Castellani, B., Mcewen, B., Karlamangla, A. S., Rizzo, A. A.,
John, B., . . . Seeman, T. (2015). Allostatic load as a complex clinical construct: A case‐based computational modeling approach. Complexity, 1(21), 291-306. doi:10.1002/cplx.21743

94
Gallo, L. C., Jiménez, J. A., Shivpuri, S., Espinosa de los Monteros, K., & Mills, P. J. (2011). Domains of chronic stress, lifestyle factors, and allostatic load in middle-aged Mexican-American women. Annals of Behavioral Medicine, 41(1), 21-31. doi:10.1007/s12160-010-9233-1
Geronimus, A. T., Hicken, M., Keene, D., & Bound, J. (2006). “Weathering” and age
patterns of allostatic load scores among blacks and whites in the United States. American Journal of Public Health, 96(5), 826-833. doi:10.2105/AJPH. 2004.060749
Gil, A. G., & Vega, W. A. (1996). Two different worlds: Acculturation stress and adaptation among Cuban and Nicaraguan families. Journal of Social and Personal Relationships, 13(3), 435-456. Retrieved from Scopus database. (Accession Number: edselc.2-52.0-0030519163)
Goel, M. S., McCarthy, E. P., Phillips, R. S., & Wee, C. C. (2004). Obesity among US immigrant subgroups by duration of residence. Journal of the American Medical Association, 292(23), 2860-2867. doi:10.1001/jama.292.23.2860
Gomez, J., Miranda, R., & Polanco, L. (2011). Acculturative stress, perceived discrimination, and vulnerability to suicide attempts among emerging adults. Journal of Youth and Adolescence, 40(11), 1465-1476. doi:10.1007/s10964-011-9688-9
Goodman, E., McEwen, B. S., Huang, B., Dolan, L. M., & Adler, N. E. (2005). Social
inequalities in biomarkers of cardiovascular risk in adolescence. Psychosomatic Medicine, 67(1), 9-15. Retrieved from Science Citation Index. (Accession Number: 00006842-200501000-00002)
Gruenewald, T. L., Karlamangla, A. S., Hu, P., Stein-Merkin, S., Crandall, C., Koretz, B.,
& Seeman, T. E. (2012). History of socioeconomic disadvantage and allostatic load in later life. Social Science and Medicine, 74(1), 75-83. doi:10.1016/ j.socscimed.2011.09.037
Guendelman, M. D., Cheryan, S., & Monin, B. (2011). Fitting in but getting fat: Identity
threat and dietary choices among US immigrant groups. Psychological Science, 22(7), 959-967. doi:10.1177/0956797611411585
Gunnar, M., & Quevedo, K. (2007). The neurobiology of stress and development. Annual
Review of Psychology, 58, 145-173. doi:10.1146/annurev.psych.58.110405. 085605
Guo, Y., Wang, S., Johnson, V., & Diaz, M. (2011). College students' stress under
current economic downturn. College Student Journal, 45(3), 536. Retrieved from Academic Search Premier. (Accession Number: 66893530)

95
Hickson, D. A., Diez Roux, A. V., Gebreab, S. Y., Wyatt, S. B., Dubbert, P. M., Sarpong, D. F., . . . Taylor, H. A. (2012). Social patterning of cumulative biological risk by education and income among African Americans. American Journal of Public Health, 102(7), 1362-1369. doi:10.2105/AJPH.2011.300444
Hilmert, C. J., Ode, S., Zielke, D. J., & Robinson, M. D. (2010). Blood pressure reactivity
predicts somatic reactivity to stress in daily life. Journal of Behavioral Medicine, 33(4), 282-292. doi:10.1007/s10865-010-9256-x
Hovey, J. D., & King, C. A. (1996). Acculturative stress, depression, and suicidal
ideation among immigrant and second-generation Latino adolescents. Journal of the American Academy of Child and Adolescent Psychiatry, 35(9), 1183-1192. https://doi.org/10.1097/00004583-199609000-00016
Hovey, J. D., & Magaña, C. (2000). Acculturative stress, anxiety, and depression among
Mexican immigrant farmworkers in the Midwest United States. Journal of Immigrant Health, 2(3), 119-131. doi:1096-4045/00/0700-0119
Hovey, J. D., & Magaña, C. G. (2002). Psychosocial predictors of anxiety among
immigrant Mexican migrant farmworkers: Implications for prevention and treatment. Cultural Diversity and Ethnic Minority Psychology, 8(3), 274. doi:10.1037//1099-9809.8.3.274
Hovey, J. D. (2000a). Acculturative stress, depression, and suicidal ideation in Mexican
immigrants. Cultural Diversity and Ethnic Minority Psychology, 6(2), 134-151. http://dx.doi.org/10.1037/1099-9809.6.2.134
Hovey, J. D. (2000b). Psychosocial predictors of acculturative stress in Mexican
immigrants. The Journal of Psychology, 134(5), 490-502. Retrieved from Business Source Premier. (Accession Number: 3644722)
Hwang, W., & Ting, J. Y. (2008). Disaggregating the effects of acculturation and
acculturative stress on the mental health of Asian Americans. Cultural Diversity and Ethnic Minority Psychology, 14(2), 147. doi:10.1037/1099-9809.14.2.147
Israel, B. A., & Schurman, S. J. (1990). Social support, control and the stress process. In
K. Lewis, F. Marcus & B. K. Rimer (Eds.), Health behavior and health education: Theory, research and practice (pp. 187–215). San Francisco, CA: Jossey-Bass.
Joiner Jr, T. E., & Walker, R. L. (2002). Construct validity of a measure of acculturative
stress in African Americans. Psychological Assessment, 14(4), 462. doi: 10.1037/1040-3590.14.4.462

96
Juster, R., & Lupien, S. (2012). A sex-and gender-based analysis of allostatic load and physical complaints. Gender Medicine, 9(6), 511-523. doi:10.1016/j.genm. 2012.10.008
Juster, R., McEwen, B. S., & Lupien, S. J. (2010). Allostatic load biomarkers of chronic
stress and impact on health and cognition. Neuroscience and Biobehavioral Reviews, 35(1), 2-16. doi:10.1016/j.neubiorev.2009.10.002
Kaestner, R., Pearson, J. A., Keene, D., & Geronimus, A. T. (2009). Stress, allostatic
load, and health of Mexican immigrants. Social Science Quarterly, 90(5), 1089-1111. doi:10.1111/j.1540-6237.2009.00648.x
Karlamangla, A. S., Singer, B. H., McEwen, B. S., Rowe, J. W., & Seeman, T. E. (2002).
Allostatic load as a predictor of functional decline: MacArthur studies of successful aging. Journal of Clinical Epidemiology, 55(7), 696-710. doi: 10.1016/S0895-4356(02)00399-2
Katsiaficas, D., Suárez-Orozco, C., Sirin, S. R., & Gupta, T. (2013). Mediators of the
relationship between acculturative stress and internalization symptoms for immigrant origin youth. Cultural Diversity and Ethnic Minority Psychology, 19(1), 27. doi:10.1037/a0031094
Katz, D. A., Sprang, G., & Cooke, C. (2012). The cost of chronic stress in childhood:
Understanding and applying the concept of allostatic load. Psychodynamic Psychiatry, 40(3), 469-480. doi:10.1521/pdps.2012.40.3.469
Kaushal, N. (2009). Adversities of acculturation? Prevalence of obesity among
immigrants. Health Economics, 18(3), 291-303. doi:10.1002/hec.1368 Kennedy, S., Kidd, M. P., McDonald, J. T., & Biddle, N. (2015). The healthy immigrant
effect: Patterns and evidence from four countries. Journal of International Migration and Integration, 16(2), 317-332. doi:10.1007/s12134-014-0340-x
Koya, D. L., & Egede, L. E. (2007). Association between length of residence and
cardiovascular disease risk factors among an ethnically diverse group of United States immigrants. Journal of General Internal Medicine, 22(6), 841-846. doi:10.1007/s11606-007-0163-y
Kulis, S., Marsiglia, F. F., & Nieri, T. (2009). Perceived ethnic discrimination versus
acculturation stress: Influences on substance use among Latino youth in the southwest. Journal of Health and Social Behavior, 50(4), 443-59. Retrieved from http://www.jstor.org.proxy.libraries.rutgers.edu/stable/20617654

97
Lakshmy, R., Gupta, R., Prabhakaran, D., Snehi, U., & Reddy, K. S. (2010). Utility of dried blood spots for measurement of cholesterol and triglycerides in a surveillance study. Journal of Diabetes Science and Technology, 4(2), 258-262. doi:10.1177/193229681000400206
Lee, J., Koeske, G. F., & Sales, E. (2004). Social support buffering of acculturative
stress: A study of mental health symptoms among Korean international students. International Journal of Intercultural Relations, 28(5), 399-414. https://doi.org/10.1016/j.ijintrel.2004.08.005
Lorenzo-Blanco, E. I., Unger, J. B., Baezconde-Garbanati, L., Ritt-Olson, A., & Soto, D.
(2012). Acculturation, enculturation, and symptoms of depression in Hispanic youth: The roles of gender, Hispanic cultural values, and family functioning. Journal of Youth and Adolescence, 41(10), 1350-1365. doi:10.1007/s10964-012-9774-7
Lueck, K., & Wilson, M. (2011). Acculturative stress in Latino immigrants: The impact
of social, socio-psychological and migration-related factors. International Journal of Intercultural Relations, 35(2), 186-195. doi:10.1016/j.ijintrel.2010.11.016
Lysgaard, S. (1955). U-Curve of Cultural Adjustment. Science, 7, 45-51. Markovizky, G., & Samid, Y. (2008). The process of immigrant adjustment: The role of
time in determining psychological adjustment. Journal of Cross-Cultural Psychology, 39(6), 782-798. doi:10.1177/0022022108323790
Marniemi, J., Kronholm, E., Aunola, S., Toikka, T., Mattlar, C., Koskenvuo, M., &
Rönnemaa, T. (2002). Visceral fat and psychosocial stress in identical twins discordant for obesity. Journal of Internal Medicine, 251(1), 35-43. doi: 10.1046/j.1365-2796.2002.00921.x
Martı́nez Garcı́a, M. F., Garcı́a Ramı́rez, M., & Maya Jariego, I. (2002). Social support
and locus of control as predictors of psychological well-being in Moroccan and Peruvian immigrant women in Spain. International Journal of Intercultural Relations, 26(3), 287-310. doi:http://dx.doi.org.proxy.libraries.rutgers.edu/ 10.1016/S0147-1767(02)00005-6
Matthews, K. A., Katholi, C. R., McCreath, H., Whooley, M. A., Williams, D. R., Zhu,
S., & Markovitz, J. H. (2004). Blood pressure reactivity to psychological stress predicts hypertension in the CARDIA study. Circulation, 110(1), 74-78. doi:10.1161/01.CIR. 0000133415.37578.E4
McClure, H. H., Snodgrass, J. J., Martinez, C. R., Squires, E. C., Jimenez, R. A., Isiordia,
L. E., . . . Small, J. (2015). Stress, place, and allostatic load among Mexican immigrant farmworkers in Oregon. Journal of Immigrant and Minority Health, 17(5), 1518-1525. doi:10.1007/s10903-014-0066-z

98
McEwen, B. S. (1998a). Protective and damaging effects of stress mediators. New
England Journal of Medicine, 338(3), 171-179. doi:10.1016/S0079-6123 (08)62128-7
McEwen, B. S. (1998b). Stress, adaptation, and disease: Allostasis and allostatic load.
Annals of the New York Academy of Sciences, 840(1), 33-44. doi:10.1111/j.1749 6632.1998.tb09546.x
McEwen, B. S., & Gianaros, P. J. (2010). Central role of the brain in stress and
adaptation: Links to socioeconomic status, health, and disease. Annals of the New York Academy of Sciences, 1186(1), 190-222. doi:10.1111/j.1749-6632.2009. 05331.x
McEwen, B. S. (2008). Central effects of stress hormones in health and disease:
Understanding the protective and damaging effects of stress and stress mediators. European Journal of Pharmacology, 583(2–3), 174-185. doi:http://dx.doi.org. proxy.libraries.rutgers.edu/ 10.1016/j.ejphar.2007.11.071
McEwen, B. S., & Wingfield, J. C. (2003). The concept of allostasis in biology and
biomedicine. Hormones and Behavior, 43(1), 2-15. doi:http://dx.doi.org/10.1016/ S0018-506X(02)00024-7
Mena, F. J., Padilla, A. M., & Maldonado, M. (1987). Acculturative stress and specific
coping strategies among immigrant and later generation college students. Hispanic Journal of Behavioral Sciences, 9(2), 207-225. Retrieved from Complementary Index Database (Accession Number: 53243169)
Miller, G. E., Chen, E., & Zhou, E. S. (2007). If it goes up, must it come down? Chronic
stress and the hypothalamic-pituitary-adrenocortical axis in humans. Psychological Bulletin, 133(1), 25. doi:10.1037/0033-2909.133.1.25
Miranda, A. O., Bilot, J. M., Peluso, P. R., Berman, K., & Van Meek, L. G. (2006).
Latino families: The relevance of the connection among acculturation, family dynamics, and health for family counseling research and practice. The Family Journal, 14(3), 268-273. doi:10.1177/1066480706287805
Mirsky, J. (2009). Mental health implications of migration. Social Psychiatry and
Psychiatric Epidemiology, 44(3), 179. doi:10.1007/s00127-008-0430-1 Myers, H. F. (2009). Ethnicity-and socio-economic status-related stresses in context: An
integrative review and conceptual model. Journal of Behavioral Medicine, 32(1), 9-19. doi:10.1007/s10865-008-9181-4

99
Navar-Boggan, A. M., Peterson, E. D., D'Agostino RB, S., Neely, B., Sniderman, A. D., & Pencina, M. J. (2015). Hyperlipidemia in early adulthood increases long-term risk of coronary heart disease. Circulation, 131(5), 451-458. doi:10.1161/ CIRCULATIONAHA. 114.012477
National Center of Educational Statistics (NCES). (2015). Digest of Education Statistics,
2015. Washington, DC: U.S. Department of Education. Retrieved from https://nces.ed.gov/pubs2016/2016014.pdf
Negy, C., Hammons, M. E., Reig-Ferrer, A., & Carper, T. M. (2010). The importance of
addressing acculturative stress in marital therapy with Hispanic immigrant women. International Journal of Clinical and Health Psychology, 10, 5-21. Retrieved from Social Sciences Citation Index Database (Accession Number: 000272522900001)
Neovius, M., Sundström, J., & Rasmussen, F. (2009). Combined effects of overweight
and smoking in late adolescence on subsequent mortality: Nationwide cohort study. BMJ: British Medical Journal, 338(7695), 635-638. doi:10.1136/bmj.b496
National Institutes of Health, National Heart, Lung, and Blood Institute, & North
American Association for the Study of Obesity. (2000). The practical guide identification, evaluation, and treatment of overweight and obesity in adults. NIH Publication Number DO-4084, 35-38. doi:10.1016/S0002-8223(98)00276-4
O’Brien, M. J., Alos, V. A., Davey, A., Bueno, A., & Whitaker, R. C. (2014, June).
Acculturation and the prevalence of diabetes in US Latino adults, National Health and Nutrition Examination Survey 2007-2010. Diabetes, 63, A638-A638. doi:10.5888/pcd11.140142
Ogden, C. L., Carroll, M. D., Kit, B. K., & Flegal, K. M. (2014). Prevalence of childhood
and adult obesity in the United States, 2011-2012. Journal of the American Medical Association. doi:10.1001/jama.2014.732
Oza-Frank, R., & Venkat Narayan, K. (2010). Effect of length of residence on
overweight by region of birth and age at arrival among US immigrants. Public Health Nutrition, 13(06), 868-875. doi: https://doi.org/10.1017/ S1368980009992084
Ozer, E. J., & McDonald, K. L. (2006). Exposure to violence and mental health among
Chinese American urban adolescents. Journal of Adolescent Health, 39(1), 73-79. doi:http://dx.doi.org/10.1016/j.jadohealth.2005.09.015
Padilla, A. M., Alvarez, M., & Lindholm, K. J. (1986). Generational status and
personality factors as predictors of stress in students. Hispanic Journal of Behavioral Sciences, 8(3), 275-288. Retrieved from Complementary Index Database (Accession Number: 53243151)

100
Padilla, A. M., Wagatsuma, Y., & Lindholm, K. J. (1985). Acculturation and personality
as predictors of stress in Japanese and Japanese-Americans. The Journal of Social Psychology, 125(3), 295-305. Retrieved from Bibliography of Asian Studies Database. (Accession Number: BAS522353)
Pedersen, E. R., Cruz, R. A., LaBrie, J. W., & Hummer, J. F. (2011). Examining the
relationships between acculturation orientations, perceived and actual norms, and drinking behaviors of short-term American sojourners in foreign environments. Prevention Science, 12(4), 401-410. doi:10.1007/s11121-011-0232-7
Peek, M. K., Cutchin, M. P., Salinas, J. J., Sheffield, K. M., Eschbach, K., Stowe, R. P.,
& Goodwin, J. S. (2010). Allostatic load among non-Hispanic whites, non-Hispanic blacks, and people of Mexican origin: Effects of ethnicity, nativity, and acculturation. American Journal of Public Health, 100(5), 940-946. doi:10.2105/AJPH.2007.129312
Perez et al. (2002) - Perez, M., Voelz, Z. R., Pettit, J. W., & Joiner Jr., T. E. (2002). The
role of acculturative stress and body dissatisfaction in predicting bulimic symptomatology across ethnic groups. International Journal of Eating Disorders, 31(4), 442-454.doi:10.1002/eat.10006
Popkin, B. M., & Udry, J. R. (1998). Adolescent obesity increases significantly in second
and third generation U.S. immigrants: The national longitudinal study of adolescent health. The Journal of Nutrition, 128(4), 701-706.
Portes, A., & Rumbaut, R. G. (2001). Legacies: The story of the immigrant second
generation. Berkeley, CA: University of California Press. Portes, A., & Zhou, M. (1993). The new second generation: Segmented assimilation and
its variants. The Annals of the American Academy of Political and Social Science, 530(1), 74-96. http://www.jstor.org/stable/1047678
Pyykkonen, A. J., Raikkonen, K., Tuomi, T., Eriksson, J. G., Groop, L., & Isomaa, B.
(2010). Stressful life events and the metabolic syndrome. Diabetes Care, 33(2), 378-384. Retrieved from https://search-proquest-com.proxy.libraries.rutgers. edu/docview/223033912?accountid=13626
Renner, W., Laireiter, A. R., & Maier, M. J. (2012). Social support from sponsorships as
a moderator of acculturative stress: Predictors of effects on refugees and asylum seekers. Social Behavior and Personality, 40(1), 129-146. http://dx.doi.org/ 10.2224/sbp.2012.40.1.129

101
Ro, A. (2014). The longer you stay, the worse your health? A critical review of the negative acculturation theory among Asian immigrants. International Journal of Environmental Research and Public Health, 11(8), 8038-8057.doi:10.3390/ ijerph110808038
Roberti, J. W., Harrington, L. N., & Storch, E. A. (2006). Further psychometric support
for the 10-item version of the perceived stress scale. Journal of College Counseling, 9(2), 135. Retrieved from Academic Search Premier Database. (Accession Number: 23124392)
Rodriguez, M. S., & Cohen, S. (1998). Social support. Encyclopedia of Mental Health, 3,
535-544. San Francisco, CA: Academic Press. Rodriguez, N., Myers, H. F., Morris, J. K., & Cardoza, D. (2000). Latino college student
adjustment: Does an increased presence offset minority‐status and acculturative stresses? 1. Journal of Applied Social Psychology, 30(7), 1523-1550. doi:10.1111/j.1559-1816.2000.tb02534.x
Röhrle, B., & Sommer, G. (1998). Zur effektivität netzwerkorientierter interventionen.
Netzwerkinterventionen (pp. 13-47). Tübingen: DGVT-Verlag Hintermair: Salutogenetische Und Empowerment-Konzepte, 191.
Roshania, R., Narayan, K., & Oza‐Frank, R. (2008). Age at arrival and risk of obesity
among US immigrants. Obesity, 16(12), 2669-2675. doi:10.1038/oby.2008.425 Rudmin, F. (2009). Constructs, measurements and models of acculturation and
acculturative stress. International Journal of Intercultural Relations, 33(2), 106-123. doi:http://dx.doi.org.proxy.libraries.rutgers.edu/10.1016/j.ijintrel.2008. 12.001
Rumbaut, R. G. (2004). Ages, life stages, and generational cohorts: Decomposing the
immigrant first and second generations in the United States. International Migration Review, 38(3), 1160-1205. Retrieved from http://www.jstor.org.proxy. libraries.rutgers.edu/stable/27645429
Safdar, S., Lay, C., & Struthers, W. (2003). The process of acculturation and basic goals:
Testing a multidimensional individual difference acculturation model with Iranian immigrants in Canada. Applied Psychology: An International Review, 52(4), 555-579. doi:10.1111/1464-0597.00151
Santos, S. J., Hurtado-Ortiz, M., & Sneed, C. D. (2009). Illness beliefs regarding the
causes of diabetes among Latino college students: An exploratory factor analysis. Hispanic Journal of Behavioral Sciences, 31(3), 395-412. doi:10.1177/ 0739986309339911

102
Schaefer, S. E., Salazar, M., Bruhn, C., Saviano, D., Boushey, C., & Van Loan, M. D. (2009). Influence of race, acculturation, and socioeconomic status on tendency toward overweight in Asian-American and Mexican-American early adolescent females. Journal of Immigrant and Minority Health, 11(3), 188-197. doi: 10.1007/s10903-008-9150-6
Schneiderman, N., Ironson, G., & Siegel, S. D. (2005). Stress and health: Psychological,
behavioral, and biological determinants. Annual Review of Clinical Psychology, 1, 607-628. doi:10.1146/annurev.clinpsy.1.102803.144141
Schwartz, S. J., Coatsworth, J. D., Pantin, H., Prado, G., Sharp, E. H., & Szapocznik, J.
(2006). The role of ecodevelopmental context and self-concept in depressive and externalizing symptoms in Hispanic adolescents. International Journal of Behavioral Development, 30(4), 359-370. doi:10.1177/0165025406066779
Schwartz, S. J., Weisskirch, R. S., Zamboanga, B. L., Castillo, L. G., Ham, L. S., Huynh,
Q., . . . Vernon, M. (2011). Dimensions of acculturation: Associations with health risk behaviors among college students from immigrant families. Journal of Counseling Psychology, 58(1), 27. doi:10.1037/a0021356
Schwartz, S. J., Waterman, A. S., Umaña-Taylor, A. J., Lee, R. M., Kim, S. Y., Vazsonyi,
A. T., . . . Williams, M. K. (2013). Acculturation and well-being among college students from immigrant families. Journal of Clinical Psychology, 69(4), 298-318. doi:10.1002/jclp.21847
Seeman, T. E., Crimmins, E., Huang, M., Singer, B., Bucur, A., Gruenewald, T., . . .
Reuben, D. B. (2004). Cumulative biological risk and socio-economic differences in mortality: MacArthur studies of successful aging. Social Science and Medicine, 58(10), 1985-1997. doi:10.1016/S0277-9536(03)00402-7
Seeman, T. E., Gruenewald, T. L., Cohen, S., Williams, D. R., & Matthews, K. A.
(2014). Social relationships and their biological correlates: Coronary artery risk development in young adults (CARDIA) study. Psychoneuroendocrinology, 43, 126-138. doi:10.1016/j.psyneuen.2014.02.008
Seeman, T. E., Singer, B. H., Ryff, C. D., Love, G. D., & Levy-Storms, L. (2002b).
Social relationships, gender, and allostatic load across two age cohorts. Psychosomatic Medicine, 64(3), 395-406. Retrieved from Science Citation Index Database. (Accession Number: 000175791700004
Seeman, T., Epel, E., Gruenewald, T., Karlamangla, A., & McEwen, B. S. (2010). Socio‐
economic differentials in peripheral biology: Cumulative allostatic load. Annals of the New York Academy of Sciences, 1186(1), 223-239. Retrieved from Science Citation Index Database. (Accession Number: 000277908000012)

103
Seeman, T., Gruenewald, T., Karlamangla, A., Sidney, S., Liu, K., McEwen, B., & Schwartz, J. (2010). Modeling multisystem biological risk in young adults: The coronary artery risk development in young adults study. American Journal of Human Biology, 22(4), 463-472. doi:10.1111/j.1749-6632.2009.05341.x
Seeman, M., Merkin, S. S., Karlamangla, A., Koretz, B., & Seeman, T. (2014). Social
status and biological dysregulation: The "status syndrome" and allostatic load. Social Science & Medicine, 118, 143-151. https://doi.org/10.1016/j.socscimed. 2014.08.002
Seeman, T. E., McEwen, B. S., Rowe, J. W., & Singer, B. H. (2001). Allostatic load as a
marker of cumulative biological risk: MacArthur studies of successful aging. Proceedings of the National Academy of Sciences of the United States of America, 98(8), 4770-4775. doi:10.1073/pnas.081072698
Seeman, T. E., Singer, B. H., Ryff, C. D., Love, G. D., & Levy-Storms, L. (2002c).
Social relationships, gender, and allostatic load across two age cohorts. Psychosomatic Medicine, 64(3), 395-406.
Seeman, T., Glei, D., Goldman, N., Weinstein, M., Singer, B., & Lin, Y. (2004). Social
relationships and allostatic load in Taiwanese elderly and near elderly. Social Science and Medicine, 59(11), 2245-2257. doi:http://dx.doi.org.proxy.libraries. rutgers.edu/10.1016/ j.socscimed.2004.03.027
Segerstrom, S. C., & Miller, G. E. (2004). Psychological stress and the human immune
system: A meta-analytic study of 30 years of inquiry. Psychological Bulletin, 130(4), 601-630. doi:10.1037/0033-2909.130.4.601
Shirotsuki, K., Izawa, S., Sugaya, N., Yamada, K. C., Ogawa, N., Ouchi, Y., . . . Nomura,
S. (2009). Salivary cortisol and DHEA reactivity to psychosocial stress in socially anxious males. International Journal of Psychophysiology, 72(2), 198-203. doi:10.1016/j.ijpsycho.2008.12.010
Sirin, S. R., Bikmen, N., Mir, M., Fine, M., Zaal, M., & Katsiaficas, D. (2008). Exploring
dual identification among Muslim-American emerging adults: A mixed methods study. Journal of Adolescence, 31, 259-279. doi:10.1016/j.adolescence.2007. 10.009
Smedley, B. D., Myers, H. F., & Harrell, S. P. (1993). Minority-status stresses and the
college adjustment of ethnic minority freshmen. Journal of Higher Education, (4). 434-452. doi:10.2307/2960051

104
Stephens, N. M., Townsend, S. S., Markus, H. R., & Phillips, L. T. (2012). A cultural mismatch: Independent cultural norms produce greater increases in cortisol and more negative emotions among first-generation college students. Journal of Experimental Social Psychology, 48(6), 1389-1393. doi:10.1016/j.jesp.2012. 07.008
Sterling P., & Eyer J. (1988). Allostasis: a new paradigm to explain arousal pathology.
In S. Fisher & J. Reason (Eds.), Handbook of life stress, cognition and health (pp. 629-649). New York, NY: John Wiley & Sons.
Sullivan, C., & Kashubeck-West, S. (2015). The interplay of international students'
acculturative stress, social support, and acculturation modes. Journal of International Students, 5(1), 1-11. Retrieved from https://search-proquest-com.proxy.libraries.rutgers.edu/docview/1644294304?accountid=13626
Syme, C., Abrahamowicz, M., Leonard, G. T., Perron, M., Richer, L., Veillette, S., . . .
Pausova, Z. (2009). Sex differences in blood pressure and its relationship to body composition and metabolism in adolescence. Archives of Pediatrics and Adolescent Medicine, 163(9), 818-825. doi:10.1001/archpediatrics.2009.92
Tabachnick, B., & Fidell, L. (2007). Multivariate analysis of variance and covariance. In
S. Hartman (Eds.), Using multivariate statistics (pp. 243-310). Boston: Allyn & Bacon.
Tabachnick, B., & Fidell, L. (2013). Using multivariate statistics (6th ed.) Boston/MA:
Pearson Education. Tartakovsky, E. (2009). The psychological well-being of unaccompanied minors: A
longitudinal study of adolescents immigrating from Russia and Ukraine to Israel without parents. Journal of Research on Adolescence, 19(2), 177-204. doi:10.1111/j.1532-7795.2009.00589.x
Tonello, L., Rodrigues, F. B., Souza, J. W., Campbell, C. S., Leicht, A. S., & Boullosa,
D. A. (2007). The role of physical activity and heart rate variability for the control of work related stress. Frontiers in Physiology, 5, 67.
Torres, L., Driscoll, M. W., & Voell, M. (2012). Discrimination, acculturation,
acculturative stress, and Latino psychological distress: A moderated mediational model. Cultural Diversity and Ethnic Minority Psychology, 18(1), 17. doi:10.1037/a0026710.
Unger, J. B., Gallaher, P., Shakib, S., Ritt-Olson, A., Palmer, P. H., & Johnson, C. A.
(2002). The AHIMSA acculturation scale: A new measure of acculturation for adolescents in a multicultural society. The Journal of Early Adolescence, 22(3), 225-251. doi:10.1177/02731602022003001

105
Unger, J. B., Ritt-Olson, A., Wagner, K., Soto, D., & Baezconde-Garbanati, L. (2007). A comparison of acculturation measures among Hispanic/Latino adolescents. Journal of Youth and Adolescence, 36(4), 555-565. doi:10.1007/s10964-007-9184-4
Ward, C., Okura, Y., Kennedy, A., & Kojima, T. (1998). The U-curve on trial: A
longitudinal study of psychological and sociocultural adjustment during cross-cultural transition. International Journal of Intercultural Relations, 22(3), 277-291. https://doi.org/10.1016/S0147-1767(98)00008-X
Wells, N. M., Evans, G. W., Beavis, A., & Ong, A. D. (2010). Early childhood poverty,
cumulative risk exposure, and body mass index trajectories through young adulthood. American Journal of Public Health, 100(12), 2507-2512. doi:10.2105/AJPH. 2009.184291
Williams, C. L., & Berry, J. W. (1991). Primary prevention of acculturative stress among
refugees: Application of psychological theory and practice. American Psychologist, 46(6), 632. doi:10.1037/0003-066X.46.6.632
Yeh, C. J., & Inose, M. (2003). International students' reported English fluency, social
support satisfaction, and social connectedness as predictors of acculturative stress. Counselling Psychology Quarterly, 16(1), 15-28. doi:10.1080/0951507 031000114058
Yoshinaga, H., & Kosaka, K. (1996). High glycosylated hemoglobin levels increase the
risk of progression to diabetes mellitus in subjects with glucose intolerance. Diabetes Research and Clinical Practice, 31(1-3), 71-79. https://doi.org/10. 1016/0168-8227(96)01195-3
Zajacova, A., Lynch, S. M., & Espenshade, T. J. (2005). Self-efficacy, stress, and
academic success in college. Research in Higher Education, 46(6), 677-706. doi: 10.1007/s11162-004-4139-z
Zamboanga, B. L., Schwartz, S. J., Jarvis, L. H., & Van Tyne, K. (2009). Acculturation
and substance use among Hispanic early adolescents: Investigating the mediating roles of acculturative stress and self-esteem. Journal of Primary Prevention, 30(3-4), 315-333. doi:10.1007/s10935-009-0182-z
Zhang, J., & Goodson, P. (2011). Predictors of international students’ psychosocial
adjustment to life in the United States: A systematic review. International Journal of Intercultural Relations, 35(2), 139-162. doi:http://dx.doi.org.proxy.libraries. rutgers.edu/10.1016/ j.ijintrel.2010.11.011

106
Zimet, G. D., Powell, S. S., Farley, G. K., Werkman, S., & Berkoff, K. A. (1990). Psychometric characteristics of the multidimensional scale of perceived social support. Journal of Personality Assessment, 55(3), 610-617. Retrieved from Business Source Premier Database (Accession Number: 6392221)

107
Appendix A
Demographic Questionnaire

108
Appendix B
S.A.F.E. Acculturation Stress Scale

109

110
Appendix C
Acculturation, Habits, and Interests Multicultural Scale for Adolescents (AHIMSA)

111
Appendix D
Multidimensional Scale of Perceived Social Support (MSPSS)

112
Appendix E
Perceived Stress Scale
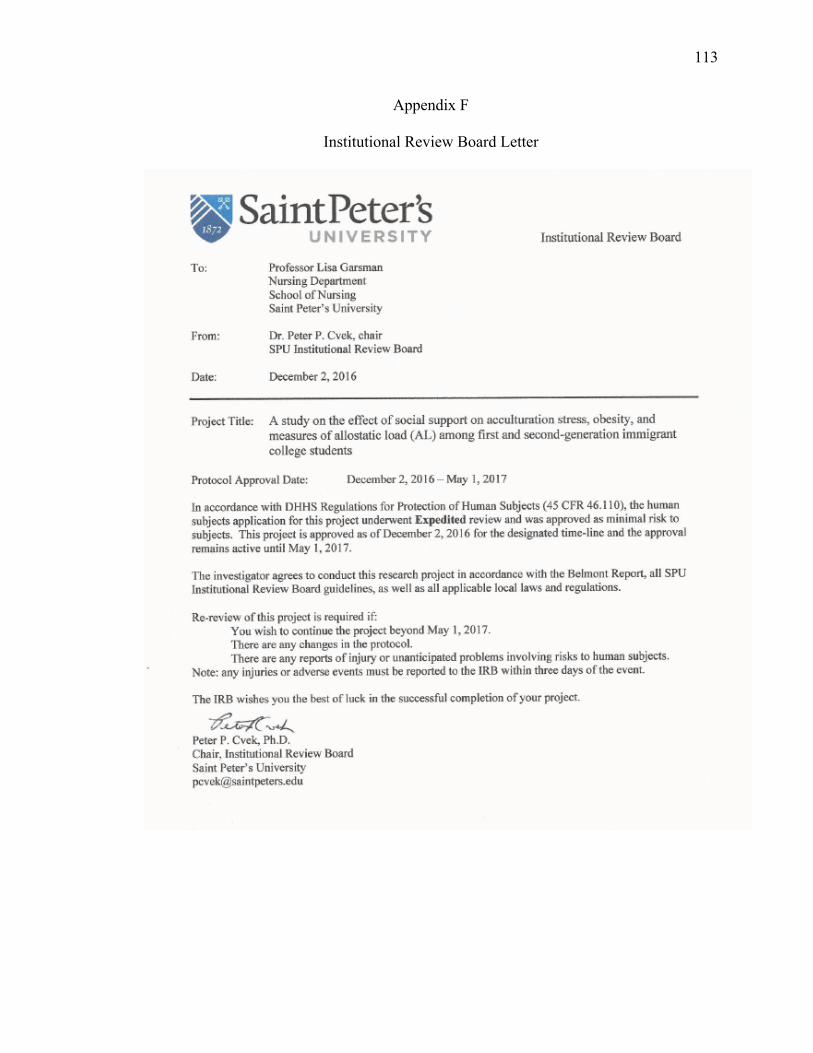
113
Appendix F
Institutional Review Board Letter

114
Appendix G
Literature Review and Conclusions
Author/Year Participants Relevant Conclusions Albrecht et al. ( 2013)
Data was collected on 1, 486 Hispanic and 802 Chinese Adults to examine whether foreign-born participants experienced greater increases in BMI and waist circumference (WC) than US born
The foreign-born had a lower adjusted mean BMI and WC than the US-born. Longer time in the US may be linked to adverse anthropometric changes in some immigrant groups
Bates, Acevedo-Garcia, Alegria, & Krieger (2008)
Data was collected on a nationally representative sample of first-, second-, and third generation Latinos and Asian Americans to look at the association between BMI and nativity
Generational status is associated with increased BMI and obesity among Latinos and Asian Americans
Choi, Hwang, & Yi (2011)
Data was collected from 600 Vietnamese university students to examine the effects of acculturation, body perception, and health behaviors on weight.
Nativity and length of US residence were significant predictors of weight status. Foreign-born individuals were less likely to be overweight than US-Born.
Fialkowski et al. (2015)
Secondary analyses, with a longitudinal design, was done on data from early adolescent girls to examine if the changes in development of overweight/obesity was associated with acculturation
Demonstrated race/ethnic groups possess significantly different overweight profiles. Hispanic adolescent girls had a higher probability of being overweight compared to Asian/non-Hispanic whites
Franzen-Castle & Smith (2014)
Data collected from 300 second generation born Hmong children was used to explore environmental, personal, and behavioral influences on BMI and acculturation
50% of children were classified as over/weight/obese. Across age and gender sub-groups, acculturation scores were predictive of variances in BMI percentiles.
Kaushal (2009)
Data from the National Health Interview Survey (1990-2004) looked at prevalence of obesity and length of stay among immigrants
Immigrants with a BA degree did not experience any change in obesity as length of stay increased, as opposed to those without BA, with increased obesity within first 5 years of residence and earlier age of arrival.
Koya & Egede (2007)
Cross-sectional study using data on 5,230 immigrant adults from the 2002 National Health Interview Survey (NHIS). Explored the association between length of US residence and major cardiovascular risk factors (CVD).
Results suggest that length of residence (a proxy for acculturation) is associated with increased odds of CVD risk factors among US immigrants. Longer length of residence is associated with obesity and hyperlipidemia.
Oza-Frank & Venkat Narayan (2010)
Cross-sectional design using 2005 NHIS data from immigrant adults (18-74 years of age). Explored the association between length of residence and being overweight by birth and age of arrival.
Results showed the odds of being overweight were 3 times higher in migrants from Mexico, South America, Europe, Russia, Africa and the Middle East residing in the US > 15 years than their counterparts residing in the US < 5 years

115
Popkin & Udry (1998)
Data from The National Longitudinal Study of Adolescent Heath Survey of 13,783 adolescents was used to explore ethnicity, age, gender, and intergenerational patterns of adolescent obesity
Obesity rates: white non-Hispanics, 24.2%, black non-Hispanics, 30.9%; all Hispanics, 30.4% all Asian- American, 20.6%. Asian-American and Hispanic adolescents born in the US are more than twice as likely to be obese as are first generation.
Ro (2014)
Empirical review of the negative acculturation theory among Asian immigrants
Length of residence is an important aspect of Asian immigrant health
Schaefer et al. (2009)
Data from 144 Asian American and Mexican American female adolescents was used to explore the relationship between acculturation, socioeconomics, BMI and % Body Fat (BF).
Mexican-American female adolescents had a greater tendency toward overweight (p < 0.01) than Asian-American. Income and acculturation may predispose towed chronic disease.

116
Author/Year Participants Relevant Conclusions Brody et al., 2013
Longitudinal study of 443 African American youths. Cumulative SES risk and protective processes were assessed at ages 11-13, 14-18. Genotyping done at age 16, and allostatic load measured at age 19.
Psychosocial stressors impact African American adolescents, suggesting that it increases their vulnerability to poor health by eliciting a cascade of biological responses that overtime damage the body’s stress response (AL)
Chao et al., 2014
Cross-sectional design, 4552 Taiwanese university students evaluated parental socioeconomic status (SES) with BMI, systolic/diastolic blood pressure
Low SES (parental education, occupation, household incomes) is associated with the risk of central obesity. Students with central obesity had higher BMI, higher blood pressure, and family history of DM, HTN, and low SES.
Doamefpor & Dinwiddie, 2015
Data from 2001-2010 National Health and Nutrition Examination Survey was used to compare allostatic load (AL) scores for US-born (n = 2745) and foreign-born (n = 152)
For foreign-born Blacks, length of stay and age were powerful predictors of AL. Foreign-born Blacks have a health advantage in AL.
Goodman et al., 2005
Cross-sectional design, data from758 adolescent non-Hispanic black and white high school students was used to explore the associations between socioeconomic status, biomarkers reflective of CV risks, and cumulative physiological risk score.
Lower parent education was associated with higher insulin, higher glucose/insulin resistance, higher LDL/lower HDL, higher BMI. Suggest a strong intergenerational transfer of educations influence on CV risks.
Gruenwald et al., 2012
Data from the Biomarker Sub study of the Study of Midlife in the US (MIDUS). 1008 adults (92.2% White) explored SES adversity and AL across adulthood
Multiple indicators of SES adversity in childhood, and 2 points in adulthood were used to construct SES adversity measures for each phase. Results indicated higher AL with greater SES adversity as each phase, and cumulatively across the life course.
Hickson et al., 2012
Cross-sectional design, sample of 4048 middle-aged and elderly African American (AA) adults. Examined the social patterning of cumulative dysregulation of multiple systems (AL)
Lower SES (income/education) were associated with higher AL scores, metabolic/immune components in AA women; neuroendocrine component in AA men.
Peek et al., 2010
Data from Texas City Stress and Health Study 2004-2006. Sample size n = 1410 Whites, Blacks, Mexican origin (foreign/US born). Examined the relationship between ethnicity, nativity and acculturation in adults.
Results found that Blacks had higher total AL scores, CV and inflammatory marker scores. Significant advantages in AL among foreign-born Mexicans, even when accounting for acculturation.
Seeman et al., 2010
Data from Coronary Artery Risk Development in Young Adults Study (CARDIA, 2000). 782 men/women aged 32-47. Biomarkers included: blood pressure, metabolic parameters, inflammation markers, heart rate variability, and sympathetic nervous system activity.
Operationalized AL as a multisystem index of biological dysregulation. Providing support for the AL model.

117
Author/Year Participants Relevant Conclusions Adams, Santo, & Bukowski, 2011
Saliva samples were collected from 103 adolescents to examine how the presence of a best friend might serve as protection against the effect of negative experiences on self-worth and HPA axis.
Having a best friend present significantly buffered the effect of the negativity of the experience on cortisol and self-worth.
Brody et al., 2013
The association between allostatic load, cumulative socioeconomic status risk, genetic and contextual protective factors (i.e. social support) from 443 African American youths.
Genotyping and receiving less peer support distinguished the physical health vulnerability profile from the resilient profile. Suggesting the importance of peer support in reducing the effects of chronic stress in adolescence.
Brody et al., 2014
A longitudinal analysis of the relationship between harsh parenting, adolescent anger, and C-Reactive Protein, depressive symptoms, and health problems (AL) in late adolescence in African American youths (n = 368)
Harsher parenting was associated positively with anger and cumulative poor health (AL).
Lee, Koeske, & Sales, 2004
Data from Korean international students (n = 74) examined the relationship between acculturative stress and mental health symptoms and the role of social support as a moderator
Acculturative stress was strongly correlated with mental health symptoms. Social support moderated and buffered the effect of stress on symptoms.
Ozer & McDonald, 2006
Cross-sectional study examined exposure to violence as predictor of mental health in a sample of 71 Chinese American young adolescents
Adolescents who experienced more violence reported more symptoms of depression and PTSD. Daily stress was also strongly associated with self-reported depression.
Seeman et al., 2002
AL and the effect of social integration/support on morbidity and mortality risks was assessed in two cohorts of older adults (n = 106, n= 765).
Men with positive social experiences and more frequent emotional support had lower AL scores.
Seeman et al., 2014
Data from the Coronary Artery Risk Development in Young Adults (CARDIA) longitudinal study (N = 5115) was used to examine the association of social relationships with differences in levels of allostatic load.
Social strains were positively related to overall AL (Cohen’s d = .79). Social ties and emotional support were negatively related to AL (Cohen’s d = .33 and d = .44 for lowest vs. highest quartiles of ties and support). Findings suggest a strong relationship between social strains and biological risk, and the cumulative impact of social factors on biological risk.