IMM Quarterly Report: Winter 2016 · 2017-02-07 · Michael Wander Potomac Economics March 22, 2016...
32
MISO Independent Market Monitor Michael Wander Potomac Economics March 22, 2016 IMM Quarterly Report: Winter 2016
Transcript of IMM Quarterly Report: Winter 2016 · 2017-02-07 · Michael Wander Potomac Economics March 22, 2016...

MISO Independent Market Monitor
Michael Wander
Potomac Economics
March 22, 2016
IMM Quarterly Report:
Winter 2016

Quarterly Summary
- 2 -
Value
Prior
Qtr.
Prior
Year Value
Prior
Qtr.
Prior
Year
RT Energy Prices ($/MWh) $21.80 -13% -29% FTR Funding (%) 102% 95% 99%
Fuel Prices ($/MMBtu) Wind Output (MW/hr) 5,731 6% 11%
Natural Gas - Chicago $2.10 -13% -40% Guarantee Payments ($M)4
Natural Gas - Henry Hub $2.04 -13% -34% Real-Time RSG $6.5 -63% -55%
Western Coal $0.55 -7% -16% Day-Ahead RSG $10.0 -17% -60%
Eastern Coal $1.36 -8% -28% Day-Ahead Margin Assurance $6.4 -20% -36%
Load (GW)2 Real-Time Offer Rev. Sufficiency $1.7 -41% -48%
Average Load 74.0 2% -8% Price Convergence5
Peak Load 98.2 -14% -8% Market-wide DA Premium 2.0% 1.0% 1.2%
% Scheduled DA (Peak Hour) 98.9% 98.3% 99.5% Virtual Trading
Transmission Congestion ($M) Cleared Quantity (MW/hr) 11,995 9% 31%
Real-Time Congestion Value $200.7 -36% -41% % Price Insensitive 28% 32% 38%
Day-Ahead Congestion Revenue $138.4 -20% -31% % Screened for Review 1% 1% 1%
Balancing Congestion Revenue3 -$11.1 -$7.4 $1.8 Profitability ($/MW) $0.58 $0.76 $0.74
Ancillary Service Prices ($/MWh) Dispatch of Peaking Units (MW/hr) 535 979 416
Regulation $5.46 -17% -29% Output Gap- Low Thresh. (MW/hr) 42 85 97
Spinning Reserves $1.14 -17% -10% Other:
Supplemental Reserves $0.44 -60% -5%
Key: Expected Notes:
Monitor/Discuss
Concern
4. Includes effects of market power mitigation.
Change1
Change1
1. Values not in italics are the value for the past period rather than the change.
2. Comparisons adjusted for any change in membership.
5. Values include allocation of RSG.
3. Net real-time congestion collection, unadjusted for M2M settlements.
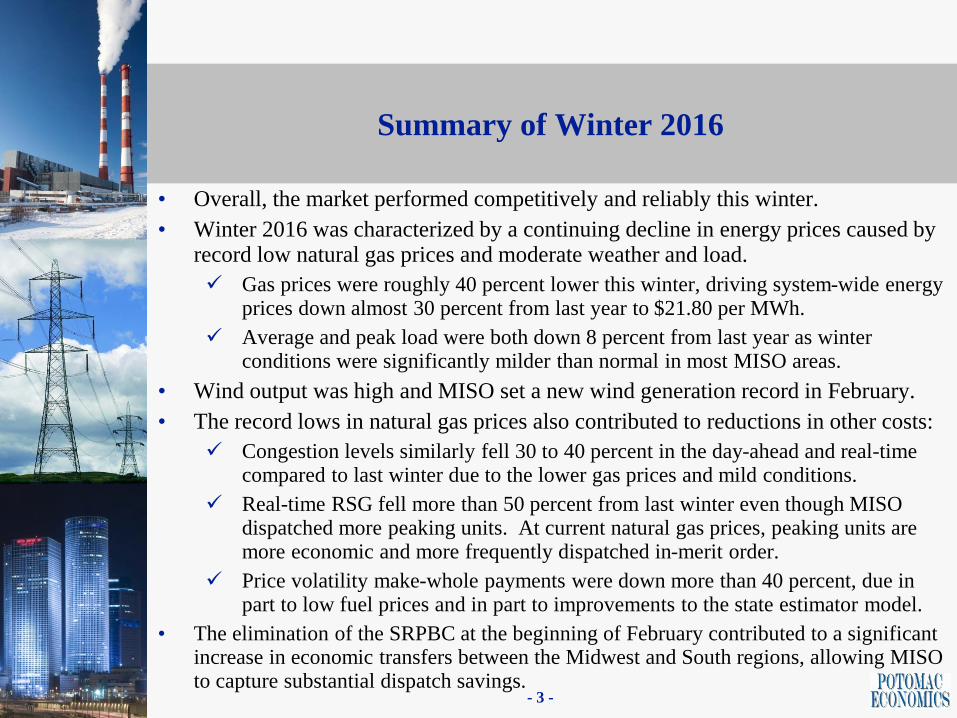
• Overall, the market performed competitively and reliably this winter.
• Winter 2016 was characterized by a continuing decline in energy prices caused by record low natural gas prices and moderate weather and load.
Gas prices were roughly 40 percent lower this winter, driving system-wide energy prices down almost 30 percent from last year to $21.80 per MWh.
Average and peak load were both down 8 percent from last year as winter conditions were significantly milder than normal in most MISO areas.
• Wind output was high and MISO set a new wind generation record in February.
• The record lows in natural gas prices also contributed to reductions in other costs:
Congestion levels similarly fell 30 to 40 percent in the day-ahead and real-time compared to last winter due to the lower gas prices and mild conditions.
Real-time RSG fell more than 50 percent from last winter even though MISO dispatched more peaking units. At current natural gas prices, peaking units are more economic and more frequently dispatched in-merit order.
Price volatility make-whole payments were down more than 40 percent, due in part to low fuel prices and in part to improvements to the state estimator model.
• The elimination of the SRPBC at the beginning of February contributed to a significant increase in economic transfers between the Midwest and South regions, allowing MISO to capture substantial dispatch savings.
Summary of Winter 2016
- 3 -

Decline in Fuel and Energy Prices (Slides 9, 11, 12, 20, 21, 25-27)
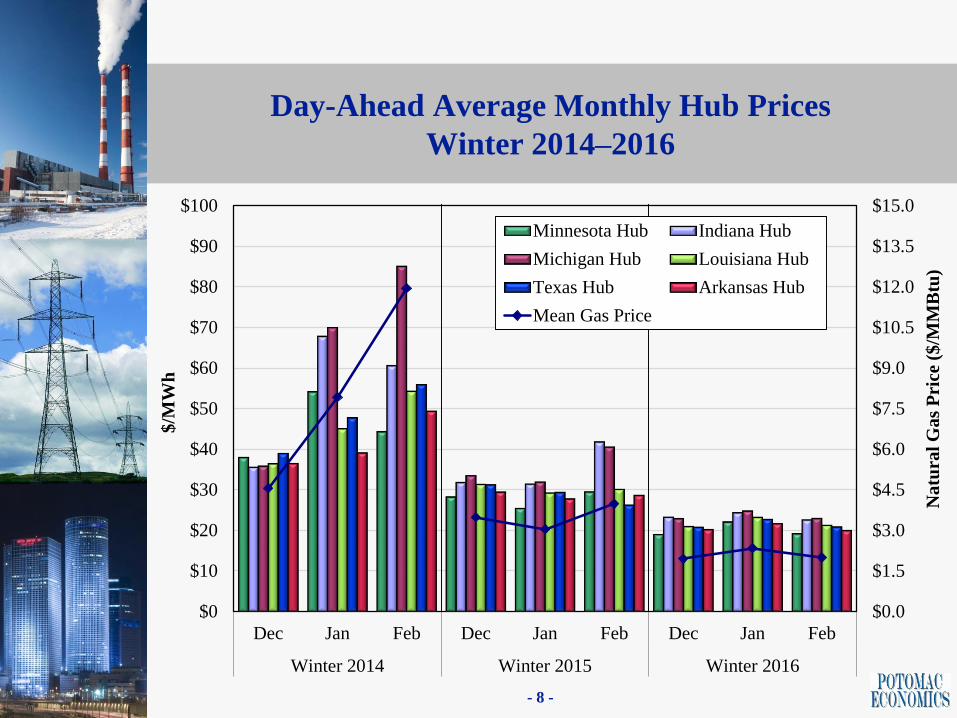
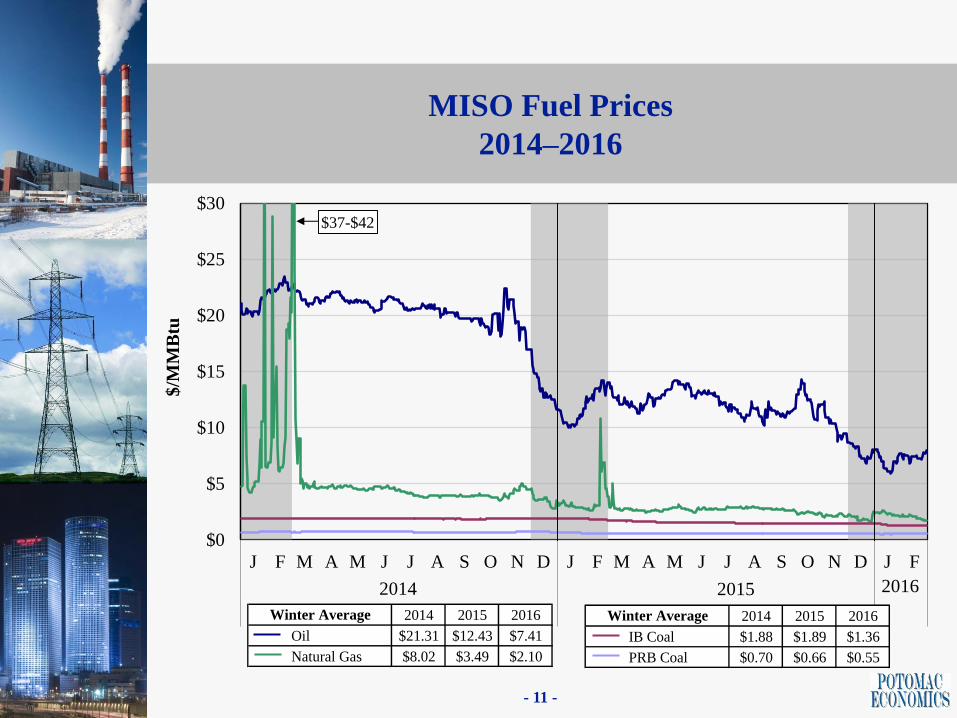
• Mild winter conditions and the shale gas supplies caused the downward trend in gas prices to continue, affecting many aspects of the market this quarter.
The Chicago and Henry Hub natural gas prices both ended February well below $2 and are the lowest since the start of the market.
• Lower gas and coal prices led to broad reductions in prices and costs this quarter.
Energy prices fell almost 30 percent to the lowest levels since the markets began.
RSG and PVMWP fell 40 to 60 percent as energy prices and volatility decreased. These costs also fell as lower gas prices reduced the spread in costs between gas-fired peaking resources and other types of units.
Congestion also fell 30-40 percent as gas-fired units became more economic to re-dispatch to manage network flows.
• Low gas prices increased utilization of gas-fired units, displacing coal-fired units.
Capacity factors of combined-cycle units averaged 45 percent this quarter, compared to 39 and 26 percent over the past two winters, respectively.
Likewise, capacity factors of MISO’s peaking resources averaged 18 percent, up from 14 and 12 percent over the past two winters.
Coal capacity factors averaged roughly 50 percent, down from almost 70 percent two winters ago as they were increasingly displaced by gas and wind.
Highlights from Winter 2015
- 4 -
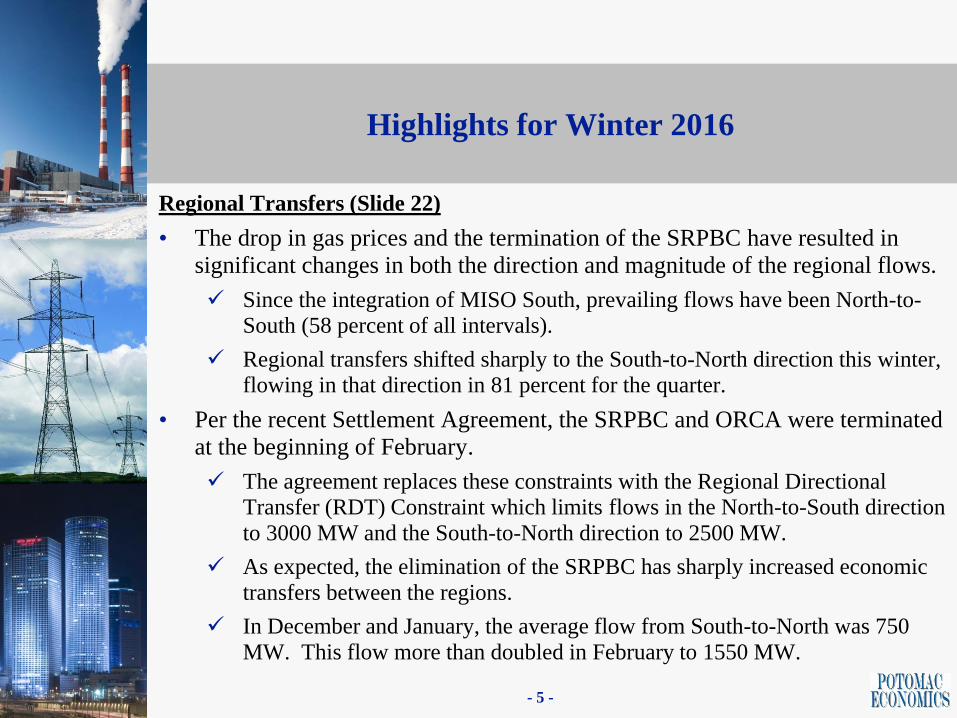
Regional Transfers (Slide 22)
• The drop in gas prices and the termination of the SRPBC have resulted in
significant changes in both the direction and magnitude of the regional flows.
Since the integration of MISO South, prevailing flows have been North-to-South (58 percent of all intervals).
Regional transfers shifted sharply to the South-to-North direction this winter, flowing in that direction in 81 percent for the quarter.
• Per the recent Settlement Agreement, the SRPBC and ORCA were terminated
at the beginning of February.
The agreement replaces these constraints with the Regional Directional Transfer (RDT) Constraint which limits flows in the North-to-South direction
to 3000 MW and the South-to-North direction to 2500 MW.
As expected, the elimination of the SRPBC has sharply increased economic
transfers between the regions.
In December and January, the average flow from South-to-North was 750
MW. This flow more than doubled in February to 1550 MW.
Highlights for Winter 2016
- 5 -

• We responded to FERC questions related to prior referrals regarding resources
failing to update real-time offers and continued to meet with FERC staff on a weekly and monthly basis to discuss market outcomes.
• We filed comments on the MISO and PJM Coordinated Transaction Scheduling proposal. We supported the CTS filing, but asked FERC to mandate a change.
We presented market results from the CTS provisions implementation between
NYISO and both PJM and ISO-NE. The results show that the CTS is much more
liquid and effective with ISO-NE than with PJM.
We attribute this partly to the charges to CTS transactions, so we recommended
that FERC order PJM to eliminate all charges (MISO proposed no charges).
• We presented our Fall Quarterly Report to stakeholders at the MSC.
• We participated in the FERC technical conference on alternative approaches FTR
funding and allocating FTR shortfalls.
• We provided comments to MISO and stakeholders on the Ramp Product, and will
are working closely with MISO during testing.
• We continued working with MISO and customers to improve transmission ratings
provided by transmission owners in order to more fully utilize the network.
Submittals to External Entities and Other Issues
- 6 -

• In December, FERC issued an Order requiring significant changes to the PRA Auction and Module D Reference Methodology.
We worked with MISO to prepare tariff revisions and its compliance filing.
• We continued to work with MISO and PJM to develop proposals for firm capacity delivery procedures as an alternative to pseudo-tying resources to PJM.
The procedures would guarantee the delivery of energy from external capacity resources that have been exported to PJM.
The proposal would provide benefits to all of the parties and address the economic and reliability concerns raised by large quantities of pseudo-ties.
• We continued to work with MISO, PJM and its customers to evaluate near-term improvements that could be made to improve the RTO’s interface prices.
We conducted a comparative analysis of two alternatives that have been proposed.
We also comments on a collaborative analysis performed by the RTOs.
• We commented on the capacity market alternatives for competitive retail areas and
provided a proposal that would integrate well into MISO’s current market.
We recommended that MISO adopt a sloped demand curve and modified limits
into the area, and not adopt a mandatory forward procurement structure.
Submittals to External Entities and Other Issues
- 7 -
Day-Ahead Average Monthly Hub Prices
Winter 2014–2016
- 8 -
$0.0
$1.5
$3.0
$4.5
$6.0
$7.5
$9.0
$10.5
$12.0
$13.5
$15.0
$0
$10
$20
$30
$40
$50
$60
$70
$80
$90
$100
Dec Jan Feb Dec Jan Feb Dec Jan Feb
Winter 2014 Winter 2015 Winter 2016
Na
tura
l G
as
Pri
ce (
$/M
MB
tu)
$/M
Wh
Minnesota Hub Indiana Hub
Michigan Hub Louisiana Hub
Texas Hub Arkansas Hub
Mean Gas Price

All-In Price
2014 –2016
- 9 -
$0
$15
$30
$45
$60
$75
$0
$4
$8
$12
$16
$20
14 15 16 J F M A M J J A S O N D J F M A M J J A S O N D J F
Winter 2014 2015 2016
All
in
Pri
ce (
$/W
Mh
)
Na
tura
l G
as
Pri
ce (
$/M
MB
tu)
Capacity
Ancillary Services
Uplift
Energy (Shortage)
Energy (Non-shortage)
Natural Gas Price

Monthly Average Ancillary Service Prices
December 2014 to February 2016
- 10 -
-$2
$0
$2
$4
$6
$8
$10
D J F MAM J J A S O N D J F D J F MAM J J A S O N D J F D J F MAM J J A S O N D J F
14 2015 2016 14 2015 2016 14 2015 2016
Regulation Spinning Reserve Supplemental Reserve
$/M
Wh
Regulation Price (exclude shortages)
MCP Impact from Reg Shortages
Spinning Reserve Price (exclude shortages)
MCP Impact from Spin Shortages
Supp Reserve Price (exclude shortages)
MCP Impact from OR Shortages
Day-Ahead Premium
MISO Fuel Prices
2014–2016
- 11 -
$0
$5
$10
$15
$20
$25
$30
J F M A M J J A S O N D J F M A M J J A S O N D J F
2014 2015
$/M
MB
tu
2014 2015
$37-$42
2016
2014 2015 2016
Oil $21.31 $12.43 $7.41
Natural Gas $8.02 $3.49 $2.10
Winter Average 2014 2015 2016
IB Coal $1.88 $1.89 $1.36
PRB Coal $0.70 $0.66 $0.55
Winter Average

Capacity Factors By Fuel Type
Winter 2014–2016
- 12 -
0%
10%
20%
30%
40%
50%
60%
70%
80%
MAM J J A S O N D J F MAM J J A S O N D J F MAM J J A S O N D J F MAM J J A S O N D J F
Coal Steam Combined Cycle Combustion Turbine Wind
Ca
pa
city
Fa
cto
r
2015-2016
2014-2015
2013-2014

Load and Weather Patterns
Winter 2014–2016
- 13 -Note: Midwest degree day calculations include four representative cities in the Midwest: Indianapolis, Detroit, Milwaukee and
Minneapolis. The South region includes Little Rock and New Orleans.
0
25,000
50,000
75,000
100,000
125,000
0
250
500
750
1,000
1,250
14 15 16 13 14 15 14 15 16 14 15 16
Winter Dec Jan Feb
Lo
ad
(M
W)
Ad
just
ed D
egre
e D
ay
s
Average Load
Peak Load
CDD
HDD
Historical Avg.

Day-Ahead and Real-Time Price Convergence
2015–2016
- 14 -
-$10
$0
$10
$20
$30
$40
$50
$60
DA RT DA RT DA RT DA RT DA RT DA RT DA RT DA RT DA RT DA RT DA RT DA RT DA RT DA RT DA RT DA RT
15 16 J F M A M J J A S O N D J F
Win. Avg. 2015 2016
$/M
Wh
Average Price Difference
Absolute Difference
RT RSG Rate DA RSG Rate
Average RT Price Average DA Price
Indiana Hub 1 1 1 1 0 1 2 3 1 2 0 3 2 -2 3 1Michigan Hub 7 2 7 6 -1 2 0 0 0 0 -3 2 3 0 4 3Minnesota Hub 0 4 -1 0 -1 2 3 -1 3 0 -2 14 5 3 4 5WUMS Area 0 2 1 0 2 4 1 3 3 0 1 1 -1 0 4 3Arkansas Hub 0 3 -3 3 -3 4 3 3 -3 0 0 0 6 4 2 2Louisiana Hub 1 3 0 2 -10 -2 0 -10 1 -5 0 0 -1 4 2 3Texas Hub 0 3 -1 1 -5 4 -10 4 0 -7 -2 -12 -15 3 1 6
Average DA-RT Price Difference Including RSG (% of Real-Time Price)

Wind Output in Real-Time and Day-Ahead Markets
Monthly and Daily Average
- 15 -
-1,000
0
1,000
2,000
3,000
4,000
5,000
6,000
7,000
8,000
9,000
10,000
11,000
12,000
13,000
14,000
J F M A M J J A S O N D J F 1-7 8-14 15-
21
22-31 1-7 8-14 15-
21
22-30 1-7 8-14 15-
21
22-29
2015 2016 Dec. 2015 Jan. 2016 Feb. 2016
Monthly Average Daily Average
Qu
an
tity
(M
W)
Net Virtual Supply
Day-Ahead Wind
Real-Time Wind

Day-Ahead Peak Hour Load Scheduling
2015–2016
- 16 -
80%
84%
88%
92%
96%
100%
104%
14 15 16 J F M A M J J A S O N D J F
Winter 2015 2016
Sh
are
of
Act
ua
l L
oa
d
Net Virtual Supply Net Virtual Load
Net Real-Time NSI (Negative) Net Real-Time NSI (Positive)
Price Based Load Fixed Load
Share of Actual Load (%)
All Hours
Peak Hours
Midwest
Peak Hours
South
100.7
99.1
98.6
99.9
98.9
98.6
99.3
99.4
98.5
99.4
99.6
98.5
98.2
97.9
98.4
99.0
98.2
100.7
99.1
98.6
99.8
99.3
98.6
99.1
98.6
98.3
97.9
98.2
97.0
98.6
99.2
99.7
99.2
98.8
100.7
99.1
98.6
101.8
98.3
101.3
102.6
101.8
98.1
100.6
101.4
99.9
101.0
96.8
99.5
99.1
98.9

Virtual Load and Supply
2015–2016
- 17 -
24,000
21,000
18,000
15,000
12,000
9,000
6,000
3,000
0
3,000
6,000
9,000
12,000
15,000
18,000
21,000
14 15 16 J F M A M J J A S O N D J F 14 15 16 J F M A M J J A S O N D J F
Winter 2015 2016 Winter 2015 2016
Midwest South
Av
era
ge
Ho
url
y V
olu
me
(MW
)
← S
up
ply
Dem
an
d →
Uncleared
Cleared, Price Sensitive
Cleared, Price Insensitive
Cleared, Screened Transactions

Virtual Load and Supply by Participant Type
2015–2016
- 18 -
30,000
27,000
24,000
21,000
18,000
15,000
12,000
9,000
6,000
3,000
0
3,000
6,000
9,000
12,000
15,000
18,000
21,000
14 15 16 J F M A M J J A S O N D J F 14 15 16 J F M A M J J A S O N D J F
Winter 2015 2016 Winter 2015 2016
Financial-Only Participants Generators / LSEs
Av
era
ge
Ho
url
y V
olu
me
(MW
)
← S
up
ply
Dem
an
d →
Uncleared
Cleared, Price Sensitive
Cleared, Price Insensitive
Cleared, Screened Transactions

Virtual Profitability
2015–2016
- 19 -
-$2
$0
$2
$4-$15 M
-$10 M
-$5 M
$0 M
$5 M
$10 M
$15 M
$20 M
$25 M
$30 M
14 15 16 J F M A M J J A S O N D J F
Winter 2015 2016
Pro
fits
per
MW
To
tal
Pro
fits Supply
Demand
Gross
Percent Screened
Demand 6.4 1.9 0.8 1.6 3.0 1.7 1.0 1.7 1.6 1.6 1.7 1.0 1.1 1.4 0.6 0.8 1.0
Supply 2.0 0.9 0.4 0.6 1.0 1.0 0.9 1.0 0.4 0.4 0.2 0.5 0.5 0.4 0.2 0.4 0.5
Total 4.7 1.4 0.6 1.1 2.1 1.4 1.0 1.4 0.9 1.0 1.0 0.8 0.8 0.8 0.4 0.6 0.7
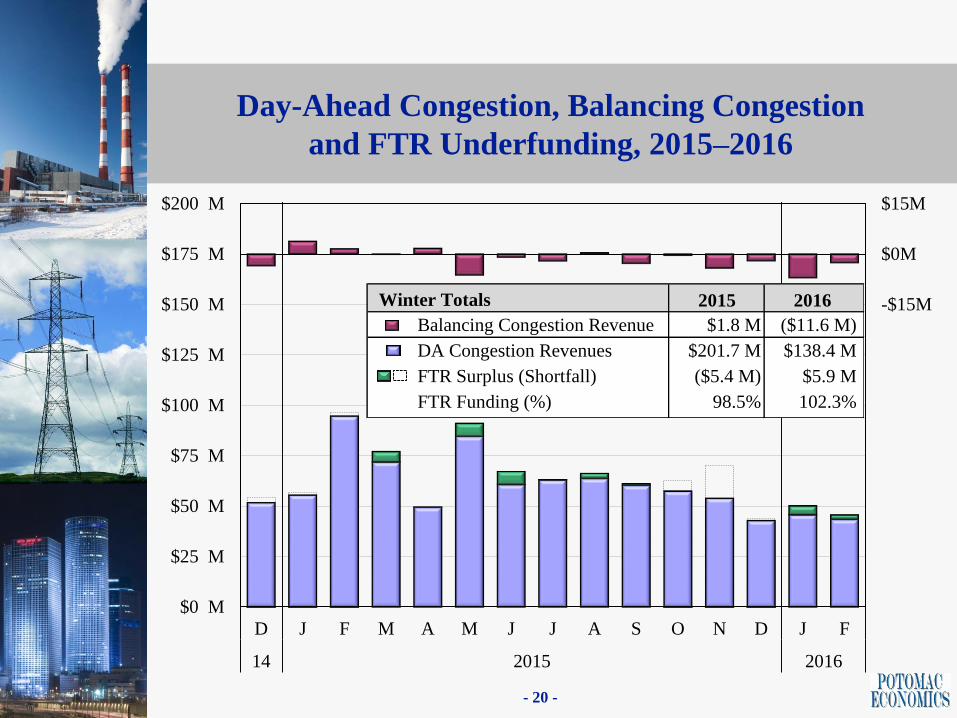
Day-Ahead Congestion, Balancing Congestion
and FTR Underfunding, 2015–2016
- 20 -
-$15M
$0M
$15M
$0 M
$25 M
$50 M
$75 M
$100 M
$125 M
$150 M
$175 M
$200 M
D J F M A M J J A S O N D J F
14 2015 2016
2015 2016
Balancing Congestion Revenue $1.8 M ($11.6 M)
DA Congestion Revenues $201.7 M $138.4 M
FTR Surplus (Shortfall) ($5.4 M) $5.9 M
FTR Funding (%) 98.5% 102.3%
Winter Totals

Value of Real-Time Congestion
2015–2016
- 21 -
$0
$50
$100
$150
$200
$250
$300
14 15 16 J F M A M J J A S O N D J F
Win. Mo. Avg. 2015 2016
Co
ng
esti
on
Va
lue
($ M
illi
on
s)
Win. 15 Fall 15 Win. 16
Midwest 289.6 M 227.2 M 167.0 M
Transfer Constraints 7.8 M 10.0 M 4.5 M
South 43.1 M 78.9 M 29.2 M
Total RT Value 340.5 M 316.1 M 200.7 M
DA Congestion Revenue 201.7 M 172.4 M 138.4 M

Real-Time Hourly Interregional Flows
Nov. 2015 - Feb. 2016
- 22 -
-4000
-3000
-2000
-1000
0
1000
2000
3000
4000
OR
CA
/RD
T F
low
No
rth
to
So
uth
(M
W) 3000 MW ORCA/RDT Limit
-3000/-2500 MW ORCA/RDT Limit
Shares of Flow Total Dec.-Feb. Feb.
North to South 58% 19% 13%
South to North 42% 81% 87%

Congestion Costs on SPP Flowgates
2014–2016
- 23 -
0%
10%
20%
30%
-$4
-$2
$0
$2
$4
$6
$8
$10
J F M A M J J A S O N D J F M A M J J A S O N D J F
2014 2015 2016
Sh
are
of
Eff
ect
on
LM
P
Co
ng
esti
on
Va
lue
($ M
illi
on
s)
JOA Payments
Balancing Congestion Cost
Day-Ahead Congestion Cost
Share of Effect on Generation LMP

Peaking Resource Dispatch
2015–2016
- 24 -
0%
10%
20%
30%
40%
50%
60%
70%
80%
90%
100%
0
250
500
750
1,000
1,250
1,500
1,750
2,000
2,250
2,500
2,750
14 15 16 J F M A M J J A S O N D J F
Winter 2015 2016
In-M
erit
MW
(%
)
Av
era
ge
Ho
url
y M
W
Real-Time Local Voltage
Real-Time Congestion
Real-Time Capacity
Committed Day-Ahead
Percent In-Merit

Day-Ahead RSG Payments
2015–2016
- 25 -
$0
$10
$20
$30
$40
$50
$60
14 15 16 J F M A M J J A S O N D J F
Winter 2015 2016
RS
G P
ay
men
ts (
$ M
illi
on
s)
Midwest South Total
Fuel-Adjusted RSG: VLR $3.5 M $6.8 M $10.3 M
Fuel-Adjusted RSG: Capacity $2.7 M $3.2 M $5.9 M
VLR RSG not Allocated $0.9 M $0.9 M
Other Capacity RSG $2.7 M $2.4 M $5.1 M
Total Nominal RSG $4.5 M $5.5 M $10.0 M
RSG Mitigation $0.1 M
RSG Distribution: Winter 2016

Real-Time RSG Payments
2015–2016
- 26 -
$0
$10
$20
$30
$40
$50
$60
14 15 16 J F M A M J J A S O N D J F
Winter 2015 2016
RS
G P
ay
men
ts (
$ M
illi
on
s)
RSG Distribution: Winter 2016 Midwest South Total
Fuel-Adjusted RSG: VLR $0.3 M $0.3 M $0.5 M
Fuel-Adjusted RSG: Congestion $3.0 M $2.1 M $5.1 M
Fuel-Adjusted RSG: Capacity $5.7 M $0.8 M $6.5 M
Total Nominal RSG $2.7 M $3.8 M $6.5 M
RSG Mitigation $0.0 M $0.0 M $0.0 M

Price Volatility Make Whole Payments
2015–2016
- 27 -
$0
$3
$6
$9
$12
$15
$0
$3
$6
$9
$12
$15
14 15 16 J F M A M J J A S O N D J F
Win. Avg. 2015 2016
Vo
lati
lity
(Av
era
ge
Inte
rva
l P
rice
Ch
an
ge)
Up
lift
Pa
ym
ents
($
Mil
lio
ns)
DAMAP (Midwest) RTORSGP (Midwest)
DAMAP (South) RTORSGP (South)
SMP Volatility LMP Volatility

Generation Outage Rates
2015–2016
- 28 -
0%
5%
10%
15%
20%
25%
14 15 16 J F M A M J J A S O N D J F
Winter 2015 2016
Sh
are
of
Ca
pa
city
Winter 2014 2015 2016
Short-Term Forced Outages 3.4% 1.9% 1.7%
Long-Term Forced Outages 5.3% 2.5% 3.7%
Planned Outages 9.3% 5.7% 5.4%
Total 17.9% 10.0% 10.7%

Monthly Output Gap
2015–2016
- 29 -
0.0%
0.1%
0.2%
0.3%
0.4%
0.5%
0
50
100
150
200
250
300
350
400
14 15 16 J F M A M J J A S O N D J F
Winter 2015 2016
Sh
are
of
Act
ua
l L
oa
d
Ou
tpu
t G
ap
(M
W)
Low Threshold
High Threshold
Share of Actual Load
Low Threshold Results by Unit Status (MW)
High Threshold Results by Unit Status (MW)
Offline
Online
Offline
Online
201 12 7 11 17 5 3 11 34 49 58 50 25 0 7 5 10
81 13 5 6 24 16 10 19 24 9 14 16 14 6 8 6 5
235 18 8 12 32 5 4 15 43 54 66 57 32 0 10 6 11
186 46 33 34 71 53 46 90 68 43 56 57 63 45 34 36 31

Day-Ahead And Real-Time Energy Mitigation
2015–2016
- 30 -
0
200
400
600
800
1000
1200
0
400
800
1200
1600
2000
2400
14 15 16 J F M A M J J A S O N D J F 14 15 16 J F M A M J J A S O N D J F
Win.
Tot.
2015 2016 Win.
Tot.
2015 2016
BCA NCA
MW
Mit
iga
ted
Ho
urs
DA Hours Mitigated, NCA
RT Hours Mitigated, NCA
DA Hours Mitigated, BCA
RT Hours Mitigated, BCA
Combined MW Mitigated

Day-Ahead and Real-Time RSG Mitigation
2015–2016
- 31 -
0
30
60
90
120
150
180
210
$0.0 M
$0.5 M
$1.0 M
$1.5 M
$2.0 M
$2.5 M
$3.0 M
$3.5 M
14 15 16 J F M A M J J A S O N D J F
Win. Avg. 2015 2016
Mit
iga
ted
Un
it-D
ay
s
RS
G M
itig
ati
on
Do
lla
rs
DA RSG Mitigated
RT RSG Mitigated
Combined Unit-Days

AMP Automated Mitigation Procedures
BCA Broad Constrained Area
CDD Cooling Degree Days
CMC Constraint Management Charge
DAMAP Day-Ahead Margin Assurance
Payment
DDC Day-Ahead Deviation & Headroom
Charge
DIR Dispatchable Intermittent Resource
HDD Heating Degree Days
JCM Joint and Common Market Initiative
JOA Joint Operating Agreement
LAC Look-Ahead Commitment
LSE Load-Serving Entities
M2M Market-to-Market
MSC MISO Market Subcommittee
NCA Narrow Constrained Area
ORCA Operations Reliability Coordination
Agreement
ORDC Operating Reserve Demand Curve
PITT Pseudo-Tie Issues Task Team
List of Acronyms
- 32 -
PRA Planning Resource Auction
PVMWP Price Volatility Make Whole
Payment
RAC Resource Adequacy Construct
RDT Regional Directional Transfer
RSG Revenue Sufficiency Guarantee
RTORSGP Real-Time Offer Revenue
Sufficiency Guarantee Payment
SMP System Marginal Price
SOM State of the Market
SRPBC Sub-Regional Power Balance
Constraint
TLR Transmission Line Loading
Relief
TCDC Transmission Constraint
Demand Curve
VCA Voluntary Capacity Auction
VLR Voltage and Local Reliability
WPP Weekly Procurement Process
WUMS Wisconsin Upper Michigan
System