IMF Diversity Annual Report 2015uncover new and creative ways of addressing today’s global...
85
ANNUAL REPORT 2015
Transcript of IMF Diversity Annual Report 2015uncover new and creative ways of addressing today’s global...

ANNUAL REPORT 2015

At the Fund, our commitment to diversity and inclusion is
crucial to fulfilling our mission.
As an international organization, we are committed to having a staff that reflects
the diversity of our membership. A diverse staff allows us to effectively draw on
different perspectives to enhance the quality of the decision making, deepen
the relevance of our policy advice, and enhance our efficiency and effective-
ness. Diversity thereby strengthens the legitimacy and relevance of the Fund in
delivering services to our member countries. Accordingly, we strive to attract,
retain, and develop a pool of talent that is diverse along many dimensions, and
to leverage the diverse knowledge and experiences of all our employees.
To this end, our staff diversity benchmarks remain a key element of
the diversity and inclusion strategy directed at increasing the
numbers and seniority of staff from underrepresented groups
(women and nationals from underrepresented regions).
An inclusive work environment encourages different
perspectives to be presented and given a fair hear-
ing, and accepts diversity of thought as valuable
and consequential. We welcome the wide range of
experiences and viewpoints that employees bring
to the Fund, including those based on nationali-
ty, gender, culture, educational and professional
backgrounds, race, ethnicity, sexual orientation,
gender identity and expression, disability, and age
differences, job classification and religion. In our
inclusive workplace, all employees at every level
of the institution are valued members of the Fund
community, regardless of their employment status as
staff or contractual, and everyone is assured the right of
equitable, fair, and respectful treatment.
We seek to leverage the proven benefits of enhanced innovation
and creativity, greater productivity and employee satisfaction that derive
from a well-managed, diverse, and inclusive workplace, in delivering value to
our stakeholders. Consequently, we are committed to ensuring that the Fund is
diverse and inclusive.
ng the
ups
Statement on Diversity and Inclusion

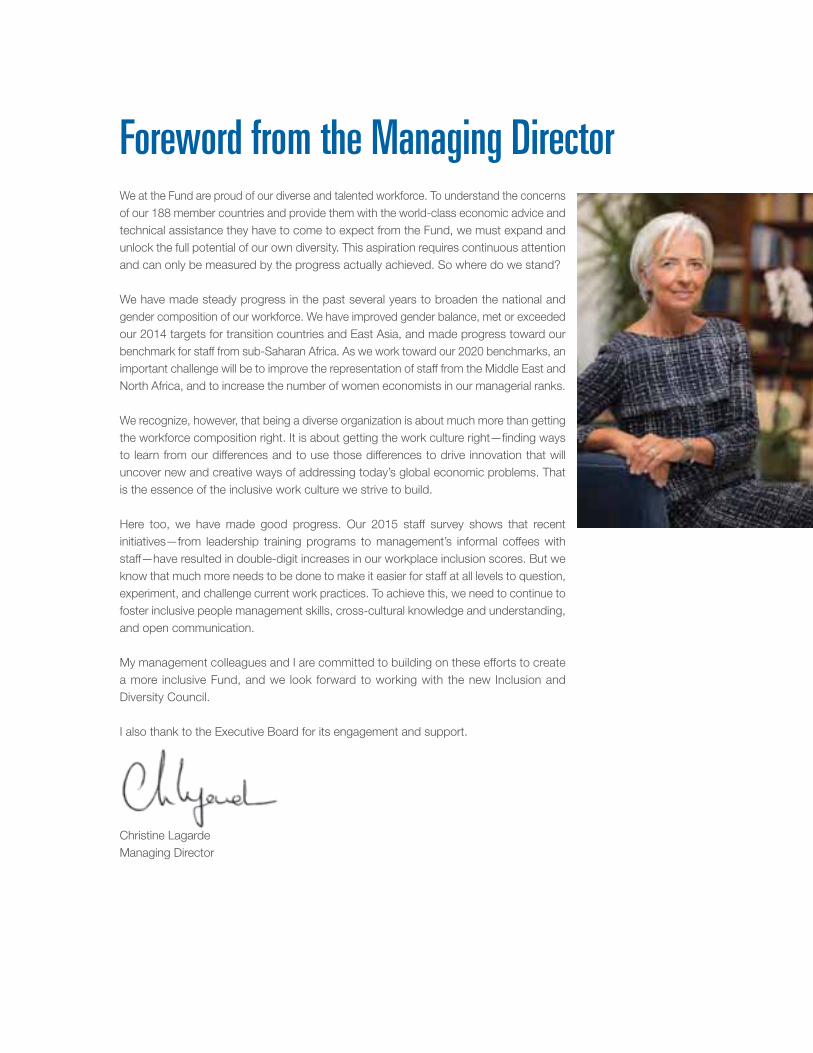
We at the Fund are proud of our diverse and talented workforce. To understand the concerns
of our 188 member countries and provide them with the world-class economic advice and
technical assistance they have to come to expect from the Fund, we must expand and
unlock the full potential of our own diversity. This aspiration requires continuous attention
and can only be measured by the progress actually achieved. So where do we stand?
We have made steady progress in the past several years to broaden the national and
gender composition of our workforce. We have improved gender balance, met or exceeded
our 2014 targets for transition countries and East Asia, and made progress toward our
benchmark for staff from sub-Saharan Africa. As we work toward our 2020 benchmarks, an
important challenge will be to improve the representation of staff from the Middle East and
North Africa, and to increase the number of women economists in our managerial ranks.
We recognize, however, that being a diverse organization is about much more than getting
the workforce composition right. It is about getting the work culture right—finding ways
to learn from our differences and to use those differences to drive innovation that will
uncover new and creative ways of addressing today’s global economic problems. That
is the essence of the inclusive work culture we strive to build.
Here too, we have made good progress. Our 2015 staff survey shows that recent
initiatives—from leadership training programs to management’s informal coffees with
staff—have resulted in double-digit increases in our workplace inclusion scores. But we
know that much more needs to be done to make it easier for staff at all levels to question,
experiment, and challenge current work practices. To achieve this, we need to continue to
foster inclusive people management skills, cross-cultural knowledge and understanding,
and open communication.
My management colleagues and I are committed to building on these efforts to create
a more inclusive Fund, and we look forward to working with the new Inclusion and
Diversity Council.
I also thank to the Executive Board for its engagement and support.
Christine Lagarde
Managing Director
Foreword from the Managing Director

Executive SummaryBUSINESS CASE
The Fund’s diversity and inclusion initiatives add value
to the organization in ways that benefit both staff and
member countries. This report opens with examples of
that impact and clear, concise definitions for diversity,
inclusion and cultural competence—elements needed
to unlock the full potential of diversity at the Fund.
PROGRESS IN DIVERSITY
The charts in this report summarize progress made
against the 2020 diversity benchmarks. It includes
best practices drawn from external gender diversity
campaigns for their potential application to Fund
initiatives. Findings include:
■ Progress toward underrepresented region (URR) bench-
marks is uneven and being addressed.
■ Since FY 2012, Transition Countries have exceeded
the benchmark for professional level staff.
■ Consistent progress led to meeting the East Asia
benchmark for professional staff in FY 2015.
■ Africa (Sub-Saharan) has made steady progress toward
professional and senior level benchmarks.
■ Middle East and North Africa + (MENA+) display patterns
that need significant improvement.
■ Gender progress improved more within specialized
career streams than economist departments.
■ External gender diversity best practices reveal key
success factors to help meet all benchmarks.
■ Understanding key assumptions, opinions, and biases
can help drive sustainable progress.
STRENGTHENING INCLUSION
This section reviews Fund inclusion efforts and blends
insights from external sources.
■ Solid progress in inclusion grew from strengthening
collaboration, inclusive people management skills,
cultural competence and open communication;
efforts will be continued.
■ A summary of inter-generational focus groups
enriches the inclusion discussion.
■ A set of inclusive leadership characteristics, when
mastered, will help embed inclusion firmly in the
culture.
THE ROAD TO CONTINUING PROGRESS
Leaders across the Fund are becoming more active
and engaged in leading diversity and inclusion efforts.
The revised Inclusion and Diversity Council and
associated governance will help drive progress. The
Diversity Office, Human Resources and staff groups
have important roles to play in supporting leadership
and facilitating change. It is the consistent actions of
leaders across all departments that will accelerate
progress further. The top areas to address in FY2016
will be: 1) laying out a plan for each benchmark to
help meet the new 2020 benchmarks; 2) engaging
the Council and other key groups in the design of a
3–5 year diversity and inclusion strategy; 3) integrating
diversity and inclusion further into the leadership
framework and learning and development offerings.

IMF Diversity and Inclusion Annual Report | 2015 1
ContentsIntroduction . . . . . . . . . . . . . . . . . . . . . . . . . . . . . . . . . . . . . . . . . . . . . . 2
Business Case . . . . . . . . . . . . . . . . . . . . . . . . . . . . . . . . . . . . . . . . . . . . . 3
Progress In Diversity . . . . . . . . . . . . . . . . . . . . . . . . . . . . . . . . . . . . . . . . . 7
Strengthening Inclusion . . . . . . . . . . . . . . . . . . . . . . . . . . . . . . . . . . . . . . . .26
The Road To Continuing Progress. . . . . . . . . . . . . . . . . . . . . . . . . . . . . . . . . . .30
Conclusion . . . . . . . . . . . . . . . . . . . . . . . . . . . . . . . . . . . . . . . . . . . . . . .32
Boxes
1. Why gender?. . . . . . . . . . . . . . . . . . . . . . . . . . . . . . . . . . . . . . . . . . . . . . . . . . 21
2. Lessons from pioneers in gender diversity . . . . . . . . . . . . . . . . . . . . . . . . . . . . . . . . . . . 22
3. Bias in assessing competency must be mitigated and this reaches beyond gender . . . . . . . . . . . . . . 24
4. Focus group members’ views of assumptions informing talent issues . . . . . . . . . . . . . . . . . . . . . 25
Figures
1. Diversity and inclusion contribute to Management’s key goals for FY 2016 . . . . . . . . . . . . . . . . . . . . 4
2. Monetary and Capital Markets (MCM) Department’s inclusion by design: creative thinkers group. . . . . . . . . 5
3. Japanese women in the workforce: from diversity to inclusion . . . . . . . . . . . . . . . . . . . . . . . . . . 6
4. Diversity and Inclusion Maturity Model . . . . . . . . . . . . . . . . . . . . . . . . . . . . . . . . . . . . . . 7
5. Fund’s progress towards benchmarks . . . . . . . . . . . . . . . . . . . . . . . . . . . . . . . . . . . . . . 9
6. IMF department classification . . . . . . . . . . . . . . . . . . . . . . . . . . . . . . . . . . . . . . . . . 10
7. URR staff as a share of B level and A9-B5 staff in area departments . . . . . . . . . . . . . . . . . . . . . . 11
8. URR staff as a share of B level and A9-B5 staff in other departments . . . . . . . . . . . . . . . . . . . . . 12
9. 2020 benchmarks for underrepresented countries by region . . . . . . . . . . . . . . . . . . . . . . . . . . 13
10. Progress towards benchmarks: staff from Transition Countries as a share of A9–B5 staff . . . . . . . . . . . 15
11. Progress towards benchmarks: staff from Transition Countries as a share of B level staff . . . . . . . . . . . 15
12. Progress towards benchmarks: staff from East Asia as a share of A9–B5 staff . . . . . . . . . . . . . . . . 16
13. Progress towards benchmarks: staff from East Asia as a share of B level staff . . . . . . . . . . . . . . . . 16
14. Progress towards benchmarks: staff from Africa (Sub-Saharan) as a share of A9–B5 staff . . . . . . . . . . 17
15. Progress towards benchmarks: staff from Africa (Sub-Saharan) as a share of B level staff . . . . . . . . . . 17
16. Progress towards benchmarks: staff from MENA+ as a share of A9-B5 staff . . . . . . . . . . . . . . . . . 18
17. Progress towards benchmarks: staff from MENA+ as a share of B level staff . . . . . . . . . . . . . . . . . 18
18. Progress towards benchmarks: women as a share of all B level staff . . . . . . . . . . . . . . . . . . . . . 19
19. Women as a share of B level staff in economist departments . . . . . . . . . . . . . . . . . . . . . . . . . 20
20. Doctoral degrees earned by women in selected social sciences . . . . . . . . . . . . . . . . . . . . . . . 22
21. Governance structure for inclusion and diversity . . . . . . . . . . . . . . . . . . . . . . . . . . . . . . . 30
Table
1. Benchmarks for 2020 . . . . . . . . . . . . . . . . . . . . . . . . . . . . . . . . . . . . . . . . . . . . . . 8
Supplementary Information . . . . . . . . . . . . . . . . . . . . . . . . . . . . . . . . . . . . . .33

2 IMF Diversity and Inclusion Annual Report | 2015
IntroductionGlobal institutions need to apply global
mindsets. Diversity and inclusion, when managed
well, will help us develop and apply our unique
knowledge set across our member countries. This
strength of the Fund—its long-term work with
highly diverse members and staff—cannot be
easily replicated. We draw on this diversity to raise
our collective intelligence and to better advise our
member countries.
This diversity across our member countries helps
drive the increased need for broader diversity in
our staff. Each drives the other, reinforcing the
core strengths and differentiating advantages
of the Fund. Diversity alone is a necessary,
but insufficient step. Diversity progress is
unsustainable if inclusion is not a pervasive part
of our institutional culture. Without inclusion,
valuable contributions from talented staff remain
untapped or underutilized and insights from our
member countries are not shared across cultures
and geographies. The purpose of this report is
to chart our progress in diversity, while broadly
defining in a preliminary fashion, the strategies,
competencies and actions required to drive a
culture of inclusion and cross-cultural agility.
Fleshing these out in greater detail with leaders
recently appointed by the Managing Director to
the 2016 Inclusion and Diversity Council and
staff from all departments and diverse groups will
mark our work together in the next few years.
The skills of inclusion and cross-cultural
agility serve us inside and out. Our mission is
to provide the best policy and technical advice
and foster economic stability and growth. This
is increasingly challenging because economic
problems are becoming more complex in an
increasingly interconnected world marked by
deepening and constantly innovating financial
markets. We need a diverse and inclusive
workforce to ensure that we possess the cross-
cultural agility required to find the creative
solutions our times demand.

IMF Diversity and Inclusion Annual Report | 2015 3
Business Case
Diversity provides the essential mix, while
inclusion makes the most of it. If diversity is the
mix of differences in our workforce, inclusion is
about how well we make this mix work together.
Inclusion means seeing differences as a way to
add value.
Tapping into these differences is a way to raise
the bar on what we can achieve together—not
a step in lowering the bar as opponents of
diversity often argue. We can become even
more proficient at getting the full contributions
from staff in all diversity dimensions such
as nationality, gender, generations, skill-sets,
cultural and religious backgrounds, language
abilities and sexual orientation.
DIVERSITYThe mix
INCLUSION Ensuring all of the mix is included and encouraged to mix
CULTURAL COMPETENCEBeing able and willing to mix well,
regardless of the mixture
Definitions
To inspire and draw out this potential requires
strong management and leadership skills—as
well as a commitment to fostering more open,
unbiased, and non-judgmental approach to
different ways of thinking, communicating, and
collaborating across cultures. Getting the best
outcomes from our teams and for our member
countries is our common goal. But our own
human tendencies, habits and cultural upbringings
can trip us up along the way.
Maximizing the gain means minimizing any
biases that lead us to recruit and promote
people who resemble rather than constructively
challenge our teams. Such practices can translate
into hiring for short-term comfort rather
than what is best for the Fund in the longer
term, to drive the outcomes we want. Greater
diversity and inclusion is served by hiring to
complement our teams with the people, skill-
sets and perspectives that expand their existing
capabilities rather than replicate them.
Enhanced efforts both in diversity and inclusion
can help attract, develop, advance and retain
the mix of talent that we need. While there are
continuing challenges to address in increasing
workforce diversity, creating a culture of inclusion,
in particular, will require focused effort and
leadership to gain the full benefits of effective
collaboration and innovation.
“”
The Fund has many examples of
connecting diversity and inclusion to
our business in ways that benefit both
staff and member countries.
“
”
We must foster a culture where
challenging the thinking and
established ways of working
is welcomed and viewed as a way
to respectfully and continuously
improve our individual and
collective outputs.

4 IMF Diversity and Inclusion Annual Report | 2015
Diversity and inclusion contribute to
Management’s key goals for FY 2016 and
beyond. Our diversity and inclusion efforts are
in step with serving the longer-term role of the
Fund in helping sustain and enable economic
and financial stability for the whole of the global
system and its parts. The overarching objective
currently is to help the global recovery gain
strength in a sustainable way. The way diversity
and inclusion contribute towards each of the
FY 2016 goals is shown in Figure 1.
There are many internal and external business
case examples of why diversity and inclusion are
important to the work of the Fund. We include
some examples that illustrate the importance of
what “inclusion” looks like in the broader context
of the Fund in Figures 2–3.1
1 Additional case studies are included in the supplementary
information section of this report.
FIGURE 1. Diversity and inclusion contribute to Management’s key goals for FY 2016
■ Internal
governance
around diversity
and inclusion
helps ensure a
strong talent pipeline
■ An increasingly
inclusive Fund will strengthen
its profile and reputation in member
countries
■ Provide a
safe and
inclusive
workplace,
enable speak-up
culture
■ Manage resources
more effectively through
greater collaboration
■ Strengthen our people management
and workforce planning skills
■ Understand local, political and cultural
contexts when promoting capacity
development to increased abilities and
willingness to implement policy advice
■ Openly share knowledge
and cross-country policy
experience
■ Collaboration across differences
maximizes knowledge transfer and
leads to better solutions to global
economic challenges (could be #1
differentiator)
■ Including more diverse
perspectives leads
to outside-the-box
thinking needed
to stay relevant
in a changing
world
GOAL 1Provide policy
solutions for our
membership
GOAL 3Create an enabling
environment for staff
GOAL 2Improve our core outputs
GOAL 4Strengthen governance and boost resources
IMF Diversity and Inclusion Annual Report | 2015 5
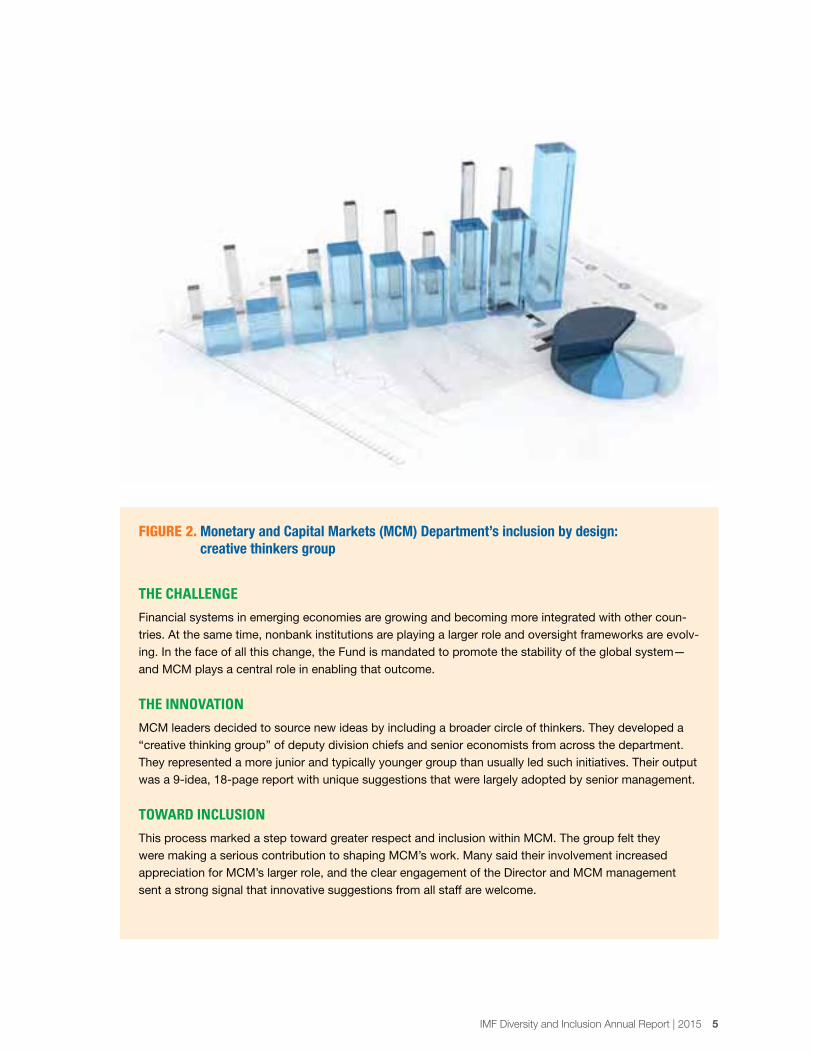
FIGURE 2. Monetary and Capital Markets (MCM) Department’s inclusion by design: creative thinkers group
THE CHALLENGE
Financial systems in emerging economies are growing and becoming more integrated with other coun-
tries. At the same time, nonbank institutions are playing a larger role and oversight frameworks are evolv-
ing. In the face of all this change, the Fund is mandated to promote the stability of the global system—
and MCM plays a central role in enabling that outcome.
THE INNOVATION
MCM leaders decided to source new ideas by including a broader circle of thinkers. They developed a
“creative thinking group” of deputy division chiefs and senior economists from across the department.
They represented a more junior and typically younger group than usually led such initiatives. Their output
was a 9-idea, 18-page report with unique suggestions that were largely adopted by senior management.
TOWARD INCLUSION
This process marked a step toward greater respect and inclusion within MCM. The group felt they
were making a serious contribution to shaping MCM’s work. Many said their involvement increased
appreciation for MCM’s larger role, and the clear engagement of the Director and MCM management
sent a strong signal that innovative suggestions from all staff are welcome.
6 IMF Diversity and Inclusion Annual Report | 2015
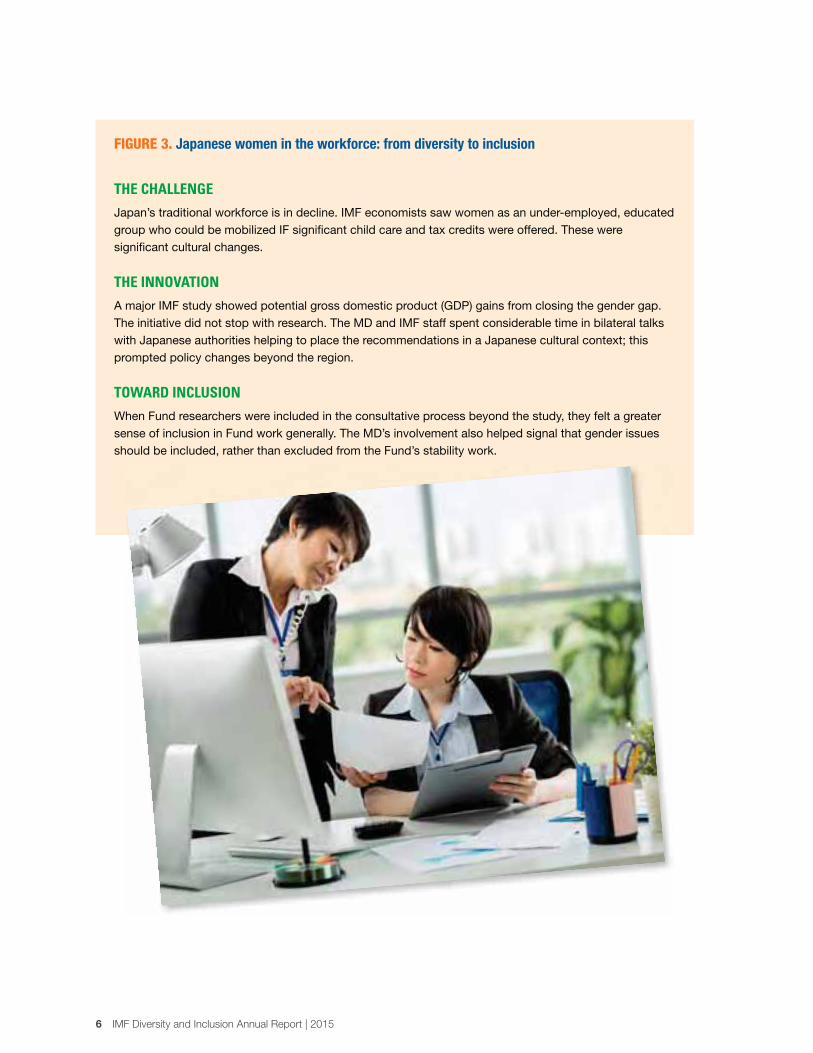
FIGURE 3. Japanese women in the workforce: from diversity to inclusion
THE CHALLENGE
Japan’s traditional workforce is in decline. IMF economists saw women as an under-employed, educated
group who could be mobilized IF significant child care and tax credits were offered. These were
significant cultural changes.
THE INNOVATION
A major IMF study showed potential gross domestic product (GDP) gains from closing the gender gap.
The initiative did not stop with research. The MD and IMF staff spent considerable time in bilateral talks
with Japanese authorities helping to place the recommendations in a Japanese cultural context; this
prompted policy changes beyond the region.
TOWARD INCLUSION
When Fund researchers were included in the consultative process beyond the study, they felt a greater
sense of inclusion in Fund work generally. The MD’s involvement also helped signal that gender issues
should be included, rather than excluded from the Fund’s stability work.

IMF Diversity and Inclusion Annual Report | 2015 7
Progress In DiversityA summary of the progress made against the 2020 diversity benchmarks is provided in
this section. Lessons learned from external gender efforts are also reviewed with an eye to
what could be further developed internally to accelerate progress across all benchmarks.
Our emphasis on diversity will continue. The
ongoing search for superior talent around the
world is a significant driver toward enhanced
diversity. This value at the Fund has remained
constant. The need to expand the diversity
of our talent and leadership pipeline and
strengthen our performance in inclusion is the
next evolutionary step. We have made a lot of
progress in these areas. But to move toward our
full potential we are building a more consistent
and integrated approach to the diversity
and inclusion efforts at the Fund. Through
collective leadership across these issues—led by
example from the top—we are working to drive
sustainable progress.
The setting of diversity benchmarks is practiced
across industries. Many organizations have spent
decades trying to diversify their workforces. Some
have done it to comply with strict legislation or
out of fear of lawsuits, penalties or reputational
damage. Others have looked at the changing
demographics of their clients, key stakeholders
or customer bases and sought greater internal
representation of their external clients.
In more mature organizational initiatives, diversity
and inclusion practices are fully integrated into
the human resource policies and practices as well
as into core business practices. Organizations that
reach these more mature stages typically do so
8 IMF Diversity and Inclusion Annual Report | 2015
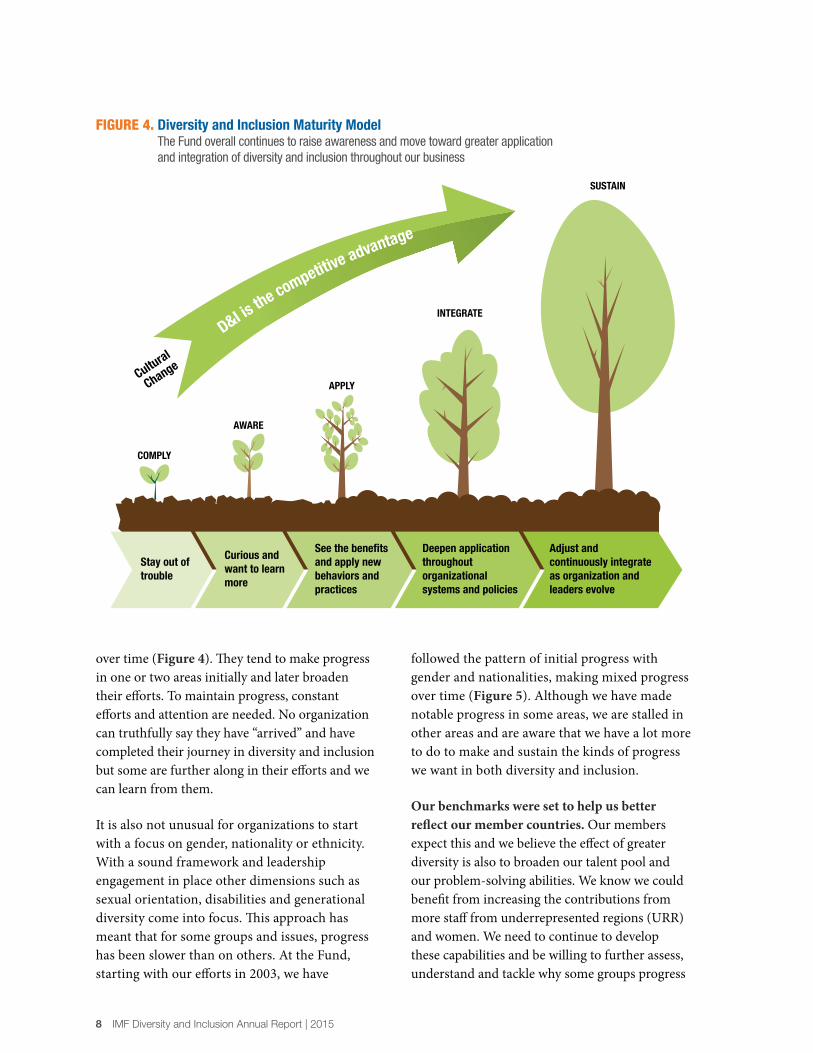
over time (Figure 4). They tend to make progress
in one or two areas initially and later broaden
their efforts. To maintain progress, constant
efforts and attention are needed. No organization
can truthfully say they have “arrived” and have
completed their journey in diversity and inclusion
but some are further along in their efforts and we
can learn from them.
It is also not unusual for organizations to start
with a focus on gender, nationality or ethnicity.
With a sound framework and leadership
engagement in place other dimensions such as
sexual orientation, disabilities and generational
diversity come into focus. This approach has
meant that for some groups and issues, progress
has been slower than on others. At the Fund,
starting with our efforts in 2003, we have
followed the pattern of initial progress with
gender and nationalities, making mixed progress
over time (Figure 5). Although we have made
notable progress in some areas, we are stalled in
other areas and are aware that we have a lot more
to do to make and sustain the kinds of progress
we want in both diversity and inclusion.
Our benchmarks were set to help us better
reflect our member countries. Our members
expect this and we believe the effect of greater
diversity is also to broaden our talent pool and
our problem-solving abilities. We know we could
benefit from increasing the contributions from
more staff from underrepresented regions (URR)
and women. We need to continue to develop
these capabilities and be willing to further assess,
understand and tackle why some groups progress
SUSTAIN
INTEGRATE
COMPLY
AWARE
APPLY
Stay out of
trouble
Curious and
want to learn
more
See the benefits
and apply new
behaviors and
practices
Deepen application
throughout
organizational
systems and policies
Adjust and
continuously integrate
as organization and
leaders evolve
is th
e competitive advantage
Change
D&I
Cultural
FIGURE 4. Diversity and Inclusion Maturity Model The Fund overall continues to raise awareness and move toward greater application
and integration of diversity and inclusion throughout our business

IMF Diversity and Inclusion Annual Report | 2015 9
FIGURE 5. Fund’s progress towards benchmarks Benchmarks help drive progress and keep us focused; they are determined based
on country quota and extent of activity across regions. The diversity benchmarks
aim to increase the share of women and underrepresented regions (URR).
Benchmarks
target date
Benchmarks established for:
A9-B5 staff from Africa
(Sub-Saharan), Transition
Countries, and Middle East
and North Africa + (MENA+)
B-level women
2003
2009
2011
2015
2020
Benchmarks
extended to cover:
East Asia
B level staff from URR
B-level gender
benchmarks
achieved early
Gender benchmarks
increased
Recruitment
benchmark
instituted
URR progress mixed
Transition Countries
removed from URR
due to significant
progress in hiring &
building a pipeline
Greater emphasis
needed to make progress
against higher benchmarks
for Africa (Sub-Saharan),
East Asia, and MENA+
TABLE 1. Benchmarks for 2020
2014 2020
Share of A9-B5 staff (in percent)
REGION
Africa (Sub-Saharan) 8.0 8.0
East Asia 12.0 15.0
Transition Countries1 8.0 n.a.
Middle East and North Africa+ (MENA+) 8.0 8.0
Share of A9-B5 recruitment (in percent)
REGION
Africa (Sub-Saharan) n.a. 10.0
Middle East and North Africa+ (MENA+) n.a. 10.0
GENDER
Women 50.0 50.0
Share of B-level staff (in percent)
REGION
Africa (Sub-Saharan) 6.0 7.0
East Asia 7.0 8.0
Transition Countries1 4.0 n.a.
Middle East and North Africa + (MENA+) 5.0 6.0
WOMEN
All B-Level 25-30 30.0
B-Level in Economist Departments 20-25 25.0
B-Level in SCS Departments 40-45 45.0
Source: Diversity Working Group Report (August 2014)1 Benchmarks for transition countries removed effective May 1, 2015
faster than others. In doing this we will need to
have some tough discussions and prioritize what
actions we will need to take in order to make
our 2020 benchmarks. Among just a few of these
tough discussions will be determining the right
mix of talent developed internally or brought
in from the outside, whether or not fast-track
programs will be deployed to help level the playing
field for staff from URR and women and how we
will address implicit bias and other challenges that
confront most large, diversifying organizations.
Progress toward URR benchmarks remains
uneven. Since 2003, we have had benchmarks
for staff from Africa (Sub-Saharan), Transition
Countries and MENA+ regions. These were
collectively represented in a benchmark for URR.
In 2009, we extended the benchmarks to include
staff from East Asia and senior (B-level) staff
from URR.2
2 Source of data and references to benchmarks: Staff Recruit-ment and Retention Experience in CY2014 paper (TAO, March
2015), and the Diversity Office.

10 IMF Diversity and Inclusion Annual Report | 2015
Area Type
AFR African ECON
APD Asia & Pacific, includes: ECON
OAP Regional Office for Asia & the Pacific
EUR European, includes: ECON
EUO Offices in Europe
MCD Middle Eastern & Central Asia ECON
WHD Western Hemisphere ECON
Functional Type
COM Communications SCS
FIN Finance ECON
RES Research ECON
SPR Strategy, Policy & Review ECON
Technical Assistance (TA) Functional Type
FAD Fiscal Affairs ECON
ICD Institute for Capacity Development, includes: ECON
ATI African Training Institute
CEF Middle East Center for Economics & Finance
JVI Joint Vienna Institute
STI Singapore Regional Training Institute
LEG Legal SCS
MCM Monetary & Capital Markets ECON
STA Statistics ECON
Support Type
HRD Human Resources SCS
OMD Office of the Managing Director, includes DMD and: ECON
INV Investment Office
OBP Office of Budget & Planning
OIA Office of Internal Audit & Inspection
SEC Secretary’s SCS
TGS Technology & General Services SCS1 Department type classification reflects career stream distribution at the B-level. Excludes OED and IEO. CON = economics,
SCS = specialized career stream
FIGURE 6. IMF department classification1
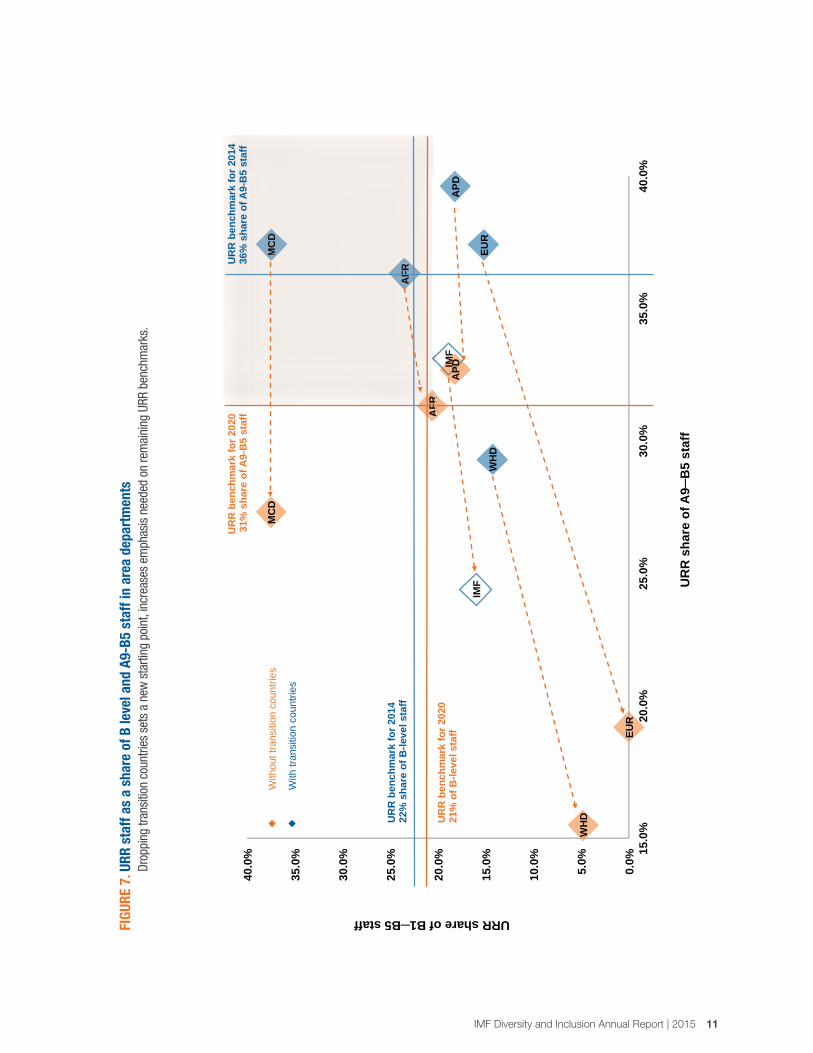
In 2015, new benchmarks were established in
which we removed the Transition Countries and
raised the benchmarks for Africa (Sub-Saharan),
East Asia, and MENA+ (Table 1). The Fund as a
whole and individual departments (Figure 6) are
far away from the 2020 benchmarks (Figures 7–8),
significant efforts will be needed to make progress
in the remaining URR.
There will need to be increased emphasis on
recruiting, developing and retaining staff from
the remaining URR beginning in FY 2016. To
support this effort, recruitment targets have
been set for Africa (Sub-Saharan) and MENA+
(Figure 9). A recruitment benchmark for East
Asia was not set as finding talent from this region
poses less of a challenge.
More fundamentally, the root causes of the
challenges facing the Fund and staff from Africa
(Sub-Saharan), East Asia and (MENA+) will need
to be more fully understood and addressed. This
will be done in conjunction with Fund leadership
and staff from these regions and all across the
Fund as we look to develop additional concrete
actions aimed at removing what are identified as
the top barriers and obstacles facing staff from
these regions.
IMF Diversity and Inclusion Annual Report | 2015 11
AFR
APD
EUR
MC
D
WH
D
IMF
AFR
APD
EUR
MC
D
WH
D
IMF
0.0%
5.0%
10.0
%
15.0
%
20.0
%
25.0
%
30.0
%
35.0
%
40.0
% 15
.0%
20
.0%
25
.0%
30
.0%
35
.0%
40
.0%
URR share of B1B5 staff
UR
R s
hare
of A
9B
5 st
aff
AFR
AFR
MC
D
UR
R b
ench
mar
k fo
r 202
0 21
% o
f B-le
vel s
taff
UR
R b
ench
mar
k fo
r 202
0 31
% s
hare
of A
9-B
5 st
aff
UR
R b
ench
mar
k fo
r 201
4
36%
sha
re o
f A9-
B5
staf
f
UR
R b
ench
mar
k fo
r 201
4 22
% s
hare
of B
-leve
l sta
ff
With
tran
sitio
n co
untri
es
With
out t
rans
ition
cou
ntrie
s
FIG
UR
E 7
. UR
R s
taff
as
a s
ha
re o
f B
lev
el a
nd
A9-B
5 s
taff
in
are
a d
epa
rtm
ents
D
ropp
ing
tran
sitio
n co
untr
ies
sets
a n
ew s
tart
ing
poin
t, in
crea
ses
emph
asis
nee
ded
on r
emai
ning
UR
R b
ench
mar
ks.

12 IMF Diversity and Inclusion Annual Report | 2015
IMF
TGS
STA
SPR
SEC
RES
OM
D
MC
M
LEG
ICD
HR
D
FIN
FAD
CO
M
IMF
TGS
STA
SPR
SEC
RES
OM
D
MC
M
LEG
ICD
HR
D
FIN
FAD
CO
M
0.0%
5.0%
10.0
%
15.0
%
20.0
%
25.0
%
30.0
%
35.0
%
40.0
% 15
.0%
20
.0%
25
.0%
30
.0%
35
.0%
40
.0%
URR share of B1B5 staff
UR
R s
hare
of A
9B
5 st
aff
UR
R b
ench
mar
k fo
r 202
0 21
% s
hare
of B
-leve
l sta
ff
UR
R b
ench
mar
k fo
r 202
0 31
% s
hare
of A
9-B
5 st
aff 0 f
TGS
UR
R b
ench
mar
k fo
r 201
4 36
% s
hare
of A
9-B
5 st
aff
UR
R b
ench
mar
k fo
r 201
4
22%
sha
re o
f B-le
vel s
taff
With
tran
sitio
n co
untri
es
With
out t
rans
ition
cou
ntrie
s
HR
D s
taye
d in
the
sam
e pl
ace
FIG
UR
E 8
. UR
R s
taff
as
a s
ha
re o
f B
lev
el a
nd
A9-B
5 s
taff
in
oth
er d
epa
rtm
ents
D
ropp
ing
tran
sitio
n co
untr
ies
sets
new
sta
rtin
g po
int,
incr
ease
s em
phas
is n
eede
d on
rem
aini
ng U
RR
ben
chm
arks
.
Not
e: H
RD
did
not
mov
e, t
here
fore
, onl
y on
e di
amon
d is
vis
ible
.

IMF Diversity and Inclusion Annual Report | 2015 13
FIG
UR
E 9
. 2020 b
ench
ma
rks
for
un
der
rep
rese
nte
d c
ou
ntr
ies
by
reg
ion
7%
sha
re o
f B
-lev
el s
taff
8%
sha
re o
f A9–
B5 s
taff
10%
sha
re o
f A9–
B5 r
ecru
itmen
t
Dro
pped
fro
m
benc
hmar
ks in
FY
20
16
6%
sha
re o
f B
-lev
el s
taff
8%
sha
re o
f A9–
B5 s
taff
10%
sha
re o
f A9–
B5 r
ecru
itmen
t8
% s
hare
of
B-l
evel
sta
ff
15
% s
hare
of A
9–
B5
sta
ff
No
A9
–B
5 r
ecru
itmen
t be
nchm
ark
set
Mid
dle
East
&N
orth
Afr
ica
(MEN
A+
)
Su
b-S
ah
ara
n
Afr
ica
(S
SA
)
Ea
st A
sia
Tra
nsi
tio
n
Co
un
trie
s

14 IMF Diversity and Inclusion Annual Report | 2015
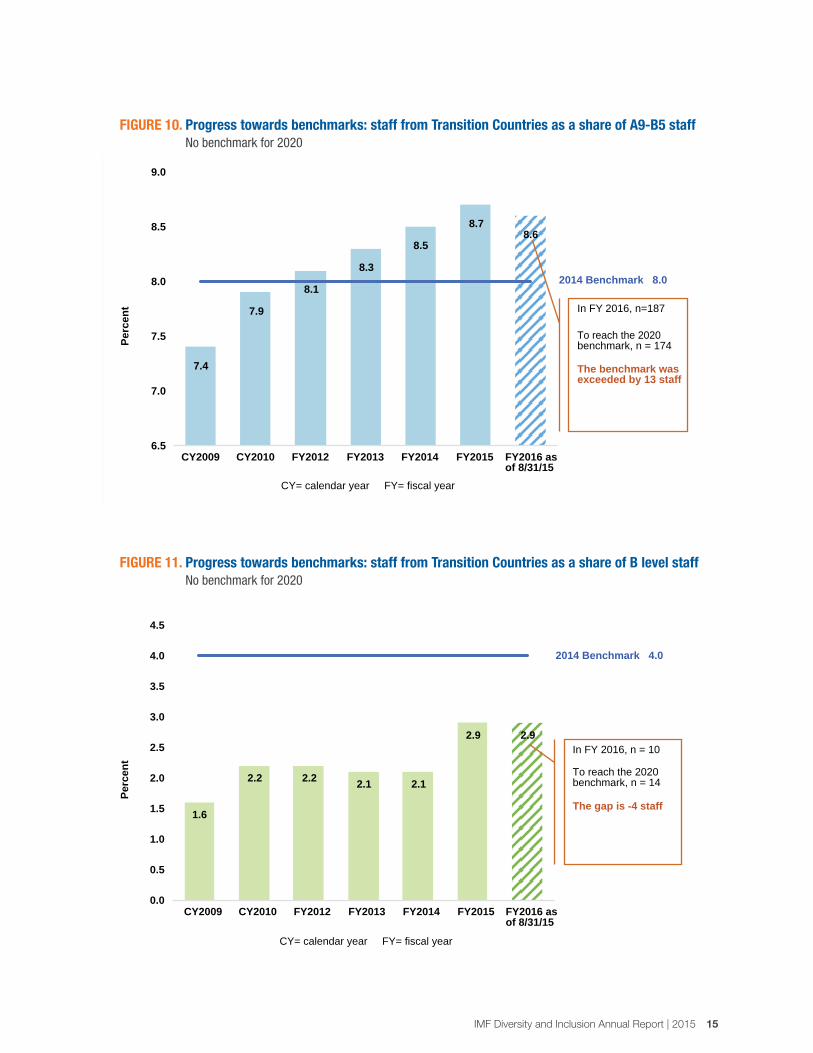
Good progress made with Transition
Countries. Our efforts to recruit and develop
staff from Transition Countries are paying off
as evidenced through stronger pipeline and
promotion representation. Although we dropped
this benchmark moving forward, we will need
to ensure these results can continue and be
maintained over time (Figures 10–11). Why this
progress has been more rapid than with other
groups may be due to the comparative ease and
cultural fit to the broader institution that staff
from these countries have as opposed to other
groups. But further review will be needed to fully
understand and sustain progress with this region.
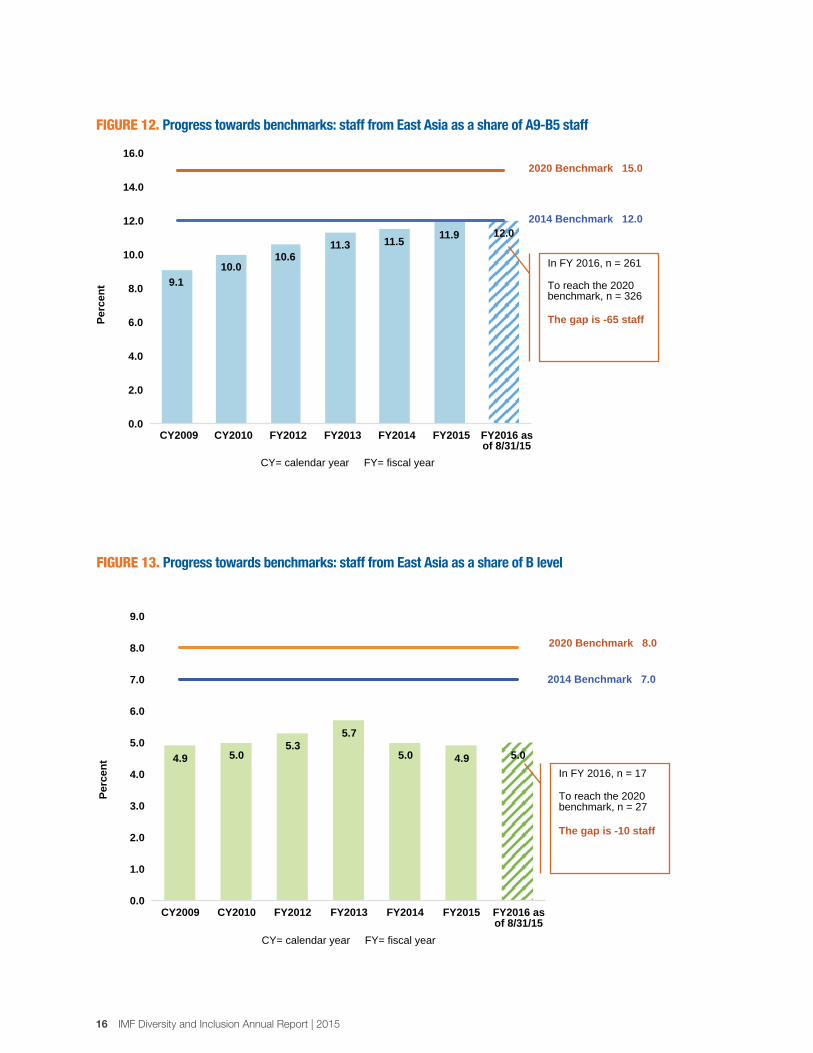
Progress in East Asian pipeline warrants raising
benchmark for 2020. In further examining our East
Asia benchmark, recruiting staff from the region has
not been the main challenge. The more significant
challenges for this group have been in the areas of
development and retention. Looking to the future
and in collaboration with East Asian staff, we need
to deepen our understanding of the cultural and/
or systemic barriers that may be getting in the way
and plan a more effective path forward. Lowering
turnover and increasing developmental opportunities
that allow for further progression into the senior
levels should be a focus for this group. Because we
have made progress against this benchmark (Figures
12–13), it has been raised for 2020.
Africa (Sub-Saharan) is on track to make the 2020
benchmarks and we need to sustain that progress
(Figures 14–15). This year has been largely about
assessing and understanding the scope of the
challenges as set against the new 2020 benchmarks
and in the context of continued steps to improve
the work environment. Additional efforts, in
collaboration with staff from the region, will need
to be planned for the next fiscal year and beyond.
MENA+ staff has remained the most difficult
benchmark for which to build a pipeline
(Figure 16). An increased understanding of why
this is the case and the formulation of stronger and
more targeted actions are required by leadership in
collaboration with staff from this region. We will
need to better understand and change this pattern
in the future if we are to achieve this benchmark
in 2020 and get the full contributions from talent
from this region.
Strong recent gains for MENA+ in senior roles may
prove difficult to maintain. In the MENA region,
good progress was made in FY 2015 in the senior
levels (Figure 17), largely due to a centrally funded
senior level hiring program targeting external talent
from URR. Staff from the MENA region were hired
under this program and this has helped forge initial
progress. Staff hired under this program, however,
need to be absorbed by departmental budgets after
three years. If this does not happen, we risk sliding
backward against this target area. Understanding
how to set up staff from this program for success
along with developing existing MENA+ staff for
future senior roles is also needed to sustain progress.
Overall, each URR benchmark group may need
slightly different approaches and actions in order
to continue to make and sustain progress. But for
all benchmark groups, a more thorough review of
the specific cultural, organizational and systemic
barriers will need to be completed. Looking to
our gender benchmarks, we can report a slightly
different story and one where good progress has
been made.
Gender progress has been steady but a stronger
focus in the economist career stream and in senior
leadership positions is needed. We have made
good progress in gender against our benchmarks,
set initially in 2003 and then re-set at a higher level
in 2011 when we achieved the benchmark early.
While we recognize that the 30 percent benchmark
for women may be harder to achieve in some career
streams than others, this still should be achievable
with the proper focus and attention (Figure 18).
For economist departments in particular, an in-
creased focus on developing women leaders and
building a more gender-balanced leadership pipeline
is needed (Figure 19). The first step is for department
IMF Diversity and Inclusion Annual Report | 2015 15
7.4
7.9
8.1
8.3
8.5
8.7 8.6
2014 Benchmark 8.0
6.5
7.0
7.5
8.0
8.5
9.0
CY2009 CY2010 FY2012 FY2013 FY2014 FY2015 FY2016 as of 8/31/15
Perc
ent
CY= calendar year FY= fiscal year
To reach the 2020 benchmark, n = 174
The benchmark was exceeded by 13 staff
In FY 2016, n=187
FIGURE 10. Progress towards benchmarks: staff from Transition Countries as a share of A9-B5 staff No benchmark for 2020
1.6
2.2 2.2 2.1 2.1
2.9 2.9
2014 Benchmark 4.0
0.0
0.5
1.0
1.5
2.0
2.5
3.0
3.5
4.0
4.5
CY2009 CY2010 FY2012 FY2013 FY2014 FY2015 FY2016 as of 8/31/15
Perc
ent
CY= calendar year FY= fiscal year
In FY 2016, n = 10 To reach the 2020 benchmark, n = 14 The gap is -4 staff
FIGURE 11. Progress towards benchmarks: staff from Transition Countries as a share of B level staff No benchmark for 2020
16 IMF Diversity and Inclusion Annual Report | 2015
9.1 10.0
10.6 11.3 11.5 11.9 12.0
2014 Benchmark 12.0
2020 Benchmark 15.0
0.0
2.0
4.0
6.0
8.0
10.0
12.0
14.0
16.0
CY2009 CY2010 FY2012 FY2013 FY2014 FY2015 FY2016 as of 8/31/15
Perc
ent
CY= calendar year FY= fiscal year
In FY 2016, n = 261 To reach the 2020 benchmark, n = 326 The gap is -65 staff
4.9 5.0 5.3
5.7
5.0 4.9 5.0
2014 Benchmark 7.0
2020 Benchmark 8.0
0.0
1.0
2.0
3.0
4.0
5.0
6.0
7.0
8.0
9.0
CY2009 CY2010 FY2012 FY2013 FY2014 FY2015 FY2016 as of 8/31/15
Perc
ent
CY= calendar year FY= fiscal year
In FY 2016, n = 17 To reach the 2020 benchmark, n = 27 The gap is -10 staff
FIGURE 13. Progress towards benchmarks: staff from East Asia as a share of B level
FIGURE 12. Progress towards benchmarks: staff from East Asia as a share of A9-B5 staff

IMF Diversity and Inclusion Annual Report | 2015 17
4.6 5.0
4.7 4.8 5.0
5.8 5.6
2014 Benchmark 6.0
2020 Benchmark 7.0
0.0
1.0
2.0
3.0
4.0
5.0
6.0
7.0
8.0
CY2009 CY2010 FY2012 FY2013 FY2014 FY2015 FY2016 as of 8/31/15
Perc
ent
CY= calendar year FY= fiscal year
In FY 2016, n = 19 To reach the 2020 benchmark, n = 24 The gap is –5 staff
6.5 6.5 6.8 6.8
7.1 7.7 7.7
2014 & 2020 Benchmark 8.0
0.0
1.0
2.0
3.0
4.0
5.0
6.0
7.0
8.0
9.0
CY2009 CY2010 FY2012 FY2013 FY2014 FY2015 FY2016 as of 8/31/15
Perc
ent
CY= calendar year FY= fiscal year
In FY 2016, n = 167 To reach the 2020 benchmark, n = 174 The gap is –7 staff
FIGURE 14. Progress towards benchmarks: staff from Africa (Sub-Saharan) as a share of A9-B5 staff
FIGURE 15. Progress towards benchmarks: staff from Africa (Sub-Saharan) as a share of B level staff

18 IMF Diversity and Inclusion Annual Report | 2015
2.6 2.8
3.8
5.4 5.3 5.2 5.3 2014 Benchmark 5.0
2020 Benchmark 6.0
0.0
1.0
2.0
3.0
4.0
5.0
6.0
7.0
CY2009 CY2010 FY2012 FY2013 FY2014 FY2015 FY2016 as of 8/31/15
Perc
ent
CY= calendar year FY= fiscal year
In FY 2016, n = 18 To reach the 2020 benchmark, n = 20 The gap is –2 staff
4.2 4.3 4.2 4.5 4.6 4.7 4.9
2014 & 2020 Benchmark 8.0
0.0
1.0
2.0
3.0
4.0
5.0
6.0
7.0
8.0
9.0
CY2009 CY2010 FY2012 FY2013 FY2014 FY2015 FY2016 as of 8/31/15
Perc
ent
CY= calendar year FY= fiscal year
In FY 2016, n = 107 To reach the 2020 benchmark, n = 175 The gap is –68 staff
FIGURE 16. Progress towards benchmarks: staff from MENA+ as a share of A9-B5 staff
FIGURE 17. Progress towards benchmarks: staff from MENA+ as a share of B level staff

IMF Diversity and Inclusion Annual Report | 2015 19
2.6 2.8
3.8
5.4 5.3 5.2 5.3 [SERIES NAME]
[VALUE]
2020 benchmark 6.0
0.0
1.0
2.0
3.0
4.0
5.0
6.0
7.0
CY2009 CY2010 FY2012 FY2013 FY2014 FY2015 FY2016 as of 8/31/15
Perc
ent
CY= calendar year FY= fiscal year
In FY 2016, n = 18 To reach the 2020 benchmark, n = 20 The gap is -2 staff 2.6 2.8
3.8
5.45.4 5.35 3 5.2 2 5.3 555555.33333335[SERIES NAME]
[VALUE] VV
2020 benchmark 6.0
0.0
1.0
2.0
3.0
4.0
5.0
6.0
7.0
CY2009 CY2010 FY2012 FY2013 FY2014 FY2015 FY2016 as of 8/31/15
Perc
ent
CY= calendar year FY= fiscal year
In FY 2016, n = 18
To reach the 2020 benchmark, n = 20
The gap is -2 staff
18.4
21.5 20.9 21.9 23.6 23.6 23.8
2014 Benchmark 25.0–30.0
2020 benchmark 30.0
0.0
5.0
10.0
15.0
20.0
25.0
30.0
35.0
CY2009 CY2010 FY2012 FY2013 FY2014 FY2015 FY2016 as of 8/31/15
Perc
ent
CY= calendar year FY= fiscal year
In FY 2016, n = 81 To reach the 2020 benchmark, n = 102 The gap is –21 staff
leaders to know who the women economists are
that are already in the pipeline and then ensure their
inclusion in formal and informal networks, visible
assignments and projects that will help them grow.
Although fundamental to the need to develop all staff, these good management practices along with
having development plans in place and providing
regular feedback needs to be reinforced. To help
make progress against all benchmarks beyond the
individual department level—where most of our
internal tracking and monitoring have been in the
past—an increased focus on net gains across the
Fund will need to be incorporated moving forward.
Sharpening focus by learning from others: what
gender initiatives can teach us. Many countries
and hundreds of organizations have pursued gender
diversity strategies for years for reasons outlined in
Box 1. Gender efforts outside the Fund offer many
useful lessons and have been widely implemented
with varying results. This report includes only a
sampling of research and a few of the lessons we
can learn and apply from global gender initiatives.
Looking outside of the Fund for examples and
learning from others can help expedite our own
progress. The lessons we can learn go beyond
gender diversity and can also be applied toward
other dimensions, in particular nationality.
According to the 2014 World Economic Forum’s
Global Gender Gap Report, the strong presence
of women in tertiary education is another clear
global trend identifying female talent as an
untapped opportunity for any talent strategy in the
21st century. Forward-looking diversity strategies
aim to increase women’s participation in all labor
markets. Women, in most countries and most
technical fields, are still an under-utilized resource
but their numbers are growing. Continuing to
leave their contributions on the table makes little
economic sense to organizations or within the
larger economic context.
Catalyst, a leading nonprofit organization with
a mission to expand opportunities for women
in business, has conducted global research on
gender equity topics and awarded the highest
recognition to organizations that make and
sustain measurable progress, particularly with
women in leadership roles.
FIGURE 18. Progress towards benchmarks: women as a share of all B level staff

20 IMF Diversity and Inclusion Annual Report | 2015
FIG
UR
E 1
9. W
om
en a
s a
sh
are
of
B lev
el s
taff
in
eco
nom
ist
dep
art
men
ts
AFR
APD
EUR
M
CD
W
HD
IM
F
FAD
FIN
ICD
MC
M
OM
D
RES
SPR
STA
0.0%
5.0%
10.0
%
15.0
%
20.0
%
25.0
%
30.0
%
35.0
%
40.0
% 20
.0%
25
.0%
30
.0%
35
.0%
40
.0%
45
.0%
50
.0%
Women as a share of B1B5 staff
Wom
en a
s a
shar
e of
A9
B5
staf
f
B
ench
mar
k fo
r 202
0 25
% s
hare
of B
leve
l sta
ff (w
omen
in e
cono
mis
t de
part
men
ts)
EUR
MC
DM
CD
(i
it
MC
DM
CD
ICD
BBBen
chm
ark
for 2
020
B2525
%% ss
hhararee
ofofBB
llevev
elel s
taff
hh

IMF Diversity and Inclusion Annual Report | 2015 21
Their research shows that five criteria need to be
in place to drive progress (Box 2). Companies
meeting these criteria consistently show
measurable results—particularly when strong
leadership recognition and accountability systems
are in place.
At the Fund we are putting these lessons into
practice with the aim of increasing the inclusion
of gender, regional representation and other
dimensions of diversity over time.
Understanding how other industries and
organization make and sustain progress is important
as we shape our own initiatives moving forward.
But learning from their progress is only a start.
Understanding the obstacles and barriers they faced
is also helpful. One such obstacle most organizations
face—especially when trying to source and develop
technical talent—is the prevalent supply myth.
Sharpening focus by looking at the “Supply
Myth.” Conversations about leveling the playing
field for women and other URR groups often plunge
quickly into the question of “pipeline”—questioning
whether there is or is not an adequate flow of
desired talent. The Fund has also wrestled with this
issue and will continue to do so as we energetically
pursue an inclusion agenda. What follows are a few
studies that shed light on this issue and can help us
challenge our thinking as we move forward.
While the rate of women earning Economics
Ph.D. degrees is lower than in other sciences
(Figure 20), the trajectory is steadily trending
upward. The number of available women
economists is also on the rise as evidenced by
graduation rates at universities. Many of the staff
with Ph.D.s received them from US universities
so this trend upward is one to watch. The Fund
also hires many staff at the entry and mid-
career levels without Ph.D.s and with degrees
from other countries in both the economist and
specialized career streams. The combination
of these trends may make the “weak pipeline”
arguments even less compelling over time.
BOX 1. Why gender?
■ It is the most measured and tracked diversity dimension
worldwide.
■ Women are an increasing proportion of the labor force
in many countries.
■ It is a common dimension across ALL countries.
■ It is the largest category—talent numbers, business impact.
■ An overwhelming body of research shows gender balance has been linked with improving financial performance
and corporate governance, improving problem solving facility and innovation outcomes.1
■ There is government & public attention on gender balance—in some countries, targets and/or quotas are
set for gender balance.
■ Gender incorporates other diversity dimensions (i.e., women come in all nationalities, abilities, etc.).
■ Gender inclusion stimulates further inclusion in other areas.
■ Improved women’s status strengthens societal development.
1 McKinsey & Company, Women Matter: Gender diversity, a corporate performance driver (October 2007), Women Matter 2: Female leadership, a competitive edge for the future (October 2008), Women Matter 3: Women leaders, a competitive edge in and after the crisis (December 2009).

22 IMF Diversity and Inclusion Annual Report | 2015
BOX 2. Lessons from pioneers in gender diversity
5
CRITERIA CATALYST AWARD WINNERS MEET
No
1Diversity & Inclusion is positioned as part of business strategy
No
2There is demonstrated CEO and Executive commitment
No
3Accountability systems such as targets or goals are tied to incentives
and/or performance objectives
No
4Standardized dashboards/metrics are established
No
5There is effective communication about why diversity & inclusion matter
to the business
THEY INVEST THE TIME
The average time maturing an initiative
before winning the award is 7–9 years after
performance objective implementation.
THEY SPAN INDUSTRIES
Organizations showing strong progress have
traditionally been in the consumer-focused
sectors with financial and STEM industries
lagging behind. Only 16% of the last decade’s
winners were from the financial sector making
gender one of the largest areas of opportunity
for improvement among our sector.
THEY CHANGE BEHAVIORSWinners typically share these approaches:
■ Strong senior leader involvement and
accountability
■ Targeted efforts to engage men
■ A willingness to see and address male-
dominated cultural and behavioral patterns
that unintentionally exclude women
■ Commitment to building the female pipeline
■ Pursuit of a positive bias in sponsoring
women’s advancement
■ Linking diversity and inclusion to the
organization’s client strategy
■ Support for gender-neutral flexible working
■ Investing financial and dedicated diversity
and inclusion resources

IMF Diversity and Inclusion Annual Report | 2015 23
In addition to the supply myth, biases and
assumptions often undermine efforts to be fair
and objective (Box 3).
To accompany the discussion and lessons
learned from a variety of gender initiatives and
trends, a growing interest in biases and how
these impact women as well as other groups is
increasingly mentioned in research studies and
addressed in training. Deepening our efforts in
inclusion and supporting our diversity goals will
require us to deepen our understanding of the
implicit biases at the Fund and what we can do
to better mitigate and minimize them.
We are sharpening focus by considering more
closely Fund assumptions. As we strive to increase
the contributions and representation of staff from
URR and women, we must confront dominant
assumptions about current and future talent and
prospects that impact their groups as well as
assumptions that can impact all staff. There is no
definitive catalog of the assumptions that people
within the Fund hold in this area. But assumptions
can either decrease or increase the pressure to
diversify and make newcomers feel welcome.
The Fund is not immune to the power of
assumptions in its core processes. In spring 2015,
5.5
9.0
15.3 19.9 25.1
32.0
5.7 9.0
14.3
19.8 17.5
28.9
9.4 15.8
23.9 28.6 28.1
42.3
12.4
20.6
30.6
38.8 45.5
56.9
18.2
31.4 42.3
48.3 47.8
60.9
21.3 26.2
47.0
58.0
65.970.6
1966–1972 1973–1979 1980–1986 1987–1993 1994–2001* 2002–2011
Shar
e of
wom
en (i
n pe
rcen
t)
Calendar Year
9
Psychology
Sociology
Life Sciences
Political Science and Public Administration
Physical Sciences
Economics
FIGURE 20. Doctoral degrees earned by women in selected social sciences This chart shows the increasing share of women awarded doctorates in several of the sciences over the
last forty years in the US. Economics and Physical Sciences awarded the fewest doctoral degrees to women
among this group of selected disciplines but the trend is still moving steadily upward. Although a global da-
tabase may show different trajectories, the majority of the Fund’s PhD economists, originating from a variety
of regions, have graduated from US universities so this trend is very relevant to our workforce.
*Note: 1999 data not available.
Source: 1966-2011 Data: U.S. Department of Education, National Center for Education Statistics (NCES), Integrated Post-secondary Education
Data System (IPEDS) Completions, 1996-2011 (Washington, DC: NCES, 2012).

24 IMF Diversity and Inclusion Annual Report | 2015
a sketch of the Fund’s underlying assumptions
emerged from an IdeaSciences’ study.3 It
summarized the outcome of nine focus groups
conducted across three Fund staff generations at
work. During the focus group process, participants
identified the assumptions in Box 4 as the current
and seemingly dominant drivers of strategic
human capital decisions.
These are certainly positive, perhaps hopeful
assumptions about the Fund’s future in a rapidly
changing talent landscape. Achievement of many
of them will depend on how well our diversity and
inclusion strategies can be integrated into broader
cultural change and workforce planning efforts.
It is important not to be complacent and to remain
vigilant because in the future we need to be more
agile and better prepared to adapt to the changes
3 The Diversity Office engaged a consulting firm, IdeaSciences, to
conduct a study of inclusion and generations at work in April 2015.
happening in economies all around the world. To
stimulate our thinking on this issue, it is worth
reflecting on just a few of the undermining opin-
ions that can stand in the way of the rosy future
projected above.
Opinion #1: Meritocracy prevails. Meritocracy
is likely a widely shared ideal among Fund leaders
and staff. Achieving and maintaining it requires
constant vigilance in identifying and overcoming
biases. Assuming that merit reigns without active
monitoring and development will undercut the
Fund’s essential commitments.
Opinion #2: Diversity lowers standards. The long
march of diversity and inclusion has been dogged
many times by the assumption that casting a wider
net for talent and opening an organization to
differences means watering down the levels of skill
and knowledge. Done well, diversity and inclusion
programs expand the skills, knowledge and
perspectives of an organization. We need to make
BOX 3. Bias in assessing competency must be mitigated and this reaches beyond gender
A growing body of academic and employer studies have pointed to a range of
biases in peer review and hiring. They found that a female postdoctoral appli-
cant had to publish at least three more papers in a prestigious science journal
or an additional 20 papers in lesser-known specialty journals to be considered
as productive as a male applicant. The systematic underrating of female appli-
cants could help explain the lower success rate of female scientists in achiev-
ing high academic ranks1.
Recent research shows that resumes and journal articles were rated lower by male and female reviewers
when they were told the author was a woman. These findings have been replicated across racial and
ethnic groups as well.
“ An impressive body of controlled experimental [research]…shows that, on average, people are less
likely to hire a woman than a man with identical qualifications, are less likely to ascribe credit to a
woman than to a man for identical accomplishments2…”According to a 2014 Center for Talent Innovation study, “at companies with non-diverse leadership,
straight white men are 28 percent more likely to win endorsement for their ideas than women, 34 percent
more likely than people of color and 24 percent more likely than LGBT employees.”
1 Wenneras, C, Wold, A, Peer Review in Hiring, in Nature 387, May 19972 Stephen J. Ceci, PNAS vol. 108 no. 8, December 2010

IMF Diversity and Inclusion Annual Report | 2015 25
BOX 4. Focus group members’ views of assumptions informing talent issues
IT IS LIKELY THAT THE FUND:■ Will be able to recruit the best and brightest;
■ Will be the financial industry employer of choice;
■ Will remain a unique employment opportunity—there will not be competing organizations
to fulfill a similar mission;
■ Will be able to transfer institutional knowledge when the Baby Boomers retire;
■ Will be able to develop Millennial leaders;
■ Is a learning organization;
■ Has a current approach to assessing economies that will remain valid;
■ Will be viewed as relevant in 2020; and
■ Will retain enough millennial staff to ensure institutional memory transfer over time.
hiring and promotional decisions objectively and
with an eye to minimizing biases while increasing
key competencies, complementary skill sets and
a variety of perspectives so that diversity actually
raises standards.
Opinion #3: Quality is in limited supply. When
one casts a small net or does so in limited bodies
of water, the “catch” may seem modest. The
broader the target and the more open to talent
from additional sources beyond the same select
few, the more plentiful the result will be. The
Fund seeks many sources for qualified talent to
serve its mission and the goals of greater diversity
and quality.
Opinion #4: Diversity invites reverse
discrimination. Skeptics often assert that
widening the talent pool represents favoritism for
candidates reflecting “difference.” Leaving aside
whether current practices might inadvertently
favor those embodying “sameness,” diverse and
inclusive hiring practices rather represent new
levels of rigor and discipline. Diversity and
inclusion stand above all for the elimination of all
forms of discrimination.
26 IMF Diversity and Inclusion Annual Report | 2015
Strengthening Inclusion
To help strengthen our inclusion efforts at the
Fund, work to continuously improve three key
areas is underway; data and governance, capability
and skill building and learning from others. These
efforts will help build a framework to support
greater inclusion and collaboration.
Having the right data and governance structures
in place to both track progress and guide future
actions will help improve our efforts in both
diversity and inclusion. Along with our internal
efforts at improving our metrics and analysis, we
are also connecting leaders and existing diversity
champion groups across the Fund. These diversity
champion groups, such as our business resource
groups organized around a variety of demographic
and cultural differences and departmental diversity
reference groups across the Fund share their diverse
perspectives and experiences and are helping to
build a more connected and collaborative approach
to the overall diversity and inclusion strategy.
In order to continue to build and sustain an
inclusive culture, we have increased the educational
offerings and invested in building the capabilities
of staff and managers. Courses to foster more open
communication, cross-cultural competence and
understanding biases are a few of the offerings
targeting important skills for any Fund staff.
Mentoring programs targeting diverse staff and
tools that help give managers more direct feedback
from their staff and colleagues are other learning
and development resources aimed to support
our on-going efforts. Finally, many organizations
are working toward improving in diversity and
inclusion. We will continue to benchmark and learn
from others outside the Fund to help accelerate our
own progress4.
While this is not meant to be a comprehensive
list of all of the activities undertaken in all of the
departments, it is clearly evidence that significant
efforts toward building a more inclusive workplace
are underway. It will take time to see the effects of
these efforts and we know there is more to do.
Tackling any differences that can divide is
important. There is a generally shared view within
the Fund of what constitutes “diversity.” As we
have seen, there has been progress in areas of
difference that are primarily visible such as gender
and ethnicity. These apparent differences may
mask other deeper differences that are often not
as visible such as religious background, certain
disabilities, sexual orientation, marital or parental
status, and educational background.
When deeper differences exist, individuals can
often feel unintentionally excluded. We are just
beginning to develop a shared understanding of the
elements of exclusion that have a negative impact
on our workforce. With that can come a definition
of “inclusion” to guide us in our ongoing efforts.
There is a link between inclusion and cross-
cultural agility. We have approximately 150 distinct
4 For a more detailed summary of our efforts from FY 2015
through mid-year FY 2016, refer to the supplemental information
section of this report.
Diversity lays the groundwork while inclusion
enables the benefits. If diversity is the mix
of gender, nationalities, skills, etc. in our
workforce, inclusion is about how well we
make this mix work together. Inclusion
means seeing differences as a way to add
value and increase contributions. It does not
mean just accepting or tolerating difference;
it means embracing the opportunities
presented by difference and managing
through the inherent challenges.
“
”
IMF Diversity and Inclusion Annual Report | 2015 27
nationalities currently tracked among our staff, and
16 percent of them have 2 or more nationalities.
Having this high level of difference within the
Fund does not automatically lead to facility in
dealing across cultures. It is precisely because of our
diversity that cross-cultural competency—aimed at
helping internal teams and highly diverse mission
teams work effectively together and with country
officials—is a critical skillset to develop at the
Fund. Our staff make-up, truly global operations
and experience with the many nuances of cultures
position us to adapt in ways that foster inclusion.
This can only improve our work together and the
quality of service to our members.
Strengthening our knowledge, skills and
capabilities in cross-cultural agility must be
woven into how we select, develop and engage our
leaders and staff. Staff who participated in some
early efforts to integrate cross-cultural learning
and assessment into team and leadership training
found this a valuable addition to existing courses.
The training received helped them understand
how they might adapt their communication and
interpersonal strategies to be more effective in
working with colleagues from other cultures. More
will be done in the coming years to embed this
into existing offerings and build this capability
further across all staff.
Voices across generations: internal focus group feedback
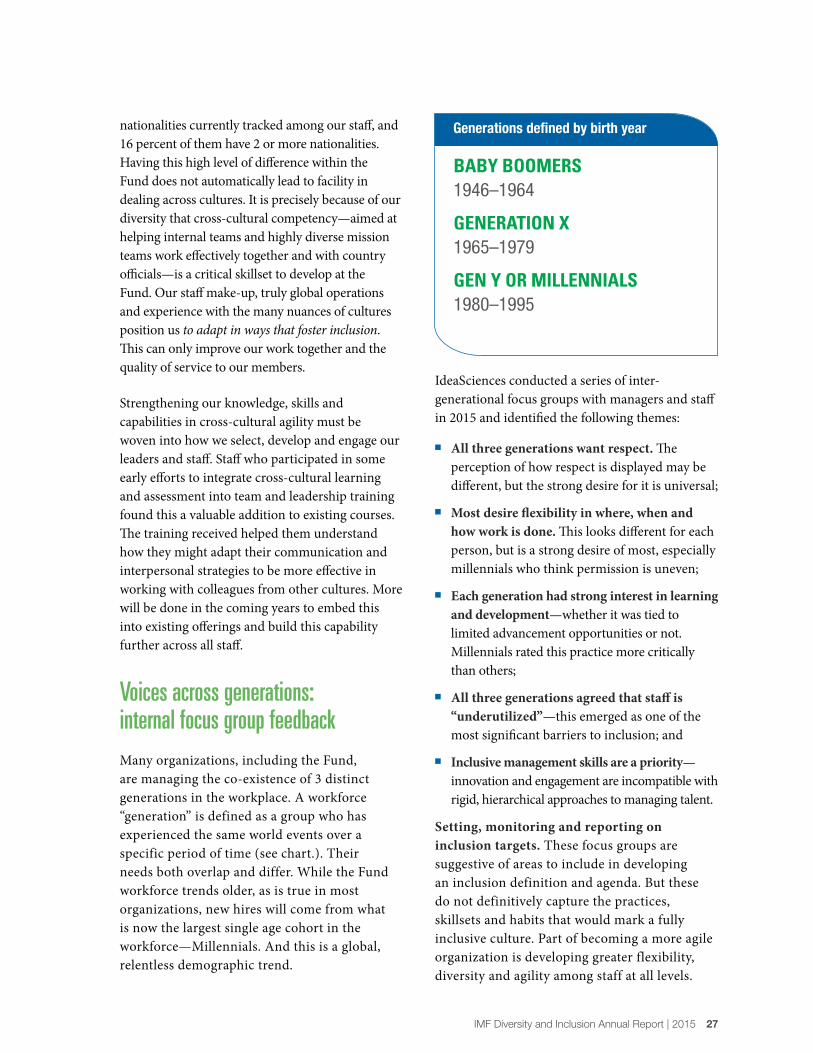
Many organizations, including the Fund,
are managing the co-existence of 3 distinct
generations in the workplace. A workforce
“generation” is defined as a group who has
experienced the same world events over a
specific period of time (see chart.). Their
needs both overlap and differ. While the Fund
workforce trends older, as is true in most
organizations, new hires will come from what
is now the largest single age cohort in the
workforce—Millennials. And this is a global,
relentless demographic trend.
IdeaSciences conducted a series of inter-
generational focus groups with managers and staff
in 2015 and identified the following themes:
■ All three generations want respect. The
perception of how respect is displayed may be
different, but the strong desire for it is universal;
■ Most desire flexibility in where, when and
how work is done. This looks different for each
person, but is a strong desire of most, especially
millennials who think permission is uneven;
■ Each generation had strong interest in learning
and development—whether it was tied to
limited advancement opportunities or not.
Millennials rated this practice more critically
than others;
■ All three generations agreed that staff is
“underutilized”—this emerged as one of the
most significant barriers to inclusion; and
■ Inclusive management skills are a priority—
innovation and engagement are incompatible with
rigid, hierarchical approaches to managing talent.
Setting, monitoring and reporting on
inclusion targets. These focus groups are
suggestive of areas to include in developing
an inclusion definition and agenda. But these
do not definitively capture the practices,
skillsets and habits that would mark a fully
inclusive culture. Part of becoming a more agile
organization is developing greater flexibility,
diversity and agility among staff at all levels.
BABY BOOMERS1946–1964
GENERATION X1965–1979
GEN Y OR MILLENNIALS1980–1995
Generations defined by birth year

28 IMF Diversity and Inclusion Annual Report | 2015
In the year ahead we will be setting and
monitoring, through a collaborative process
with key stakeholders, clear inclusion targets
and additional metrics. This process will
include ongoing reviews throughout the year by
management and senior leaders.
To achieve the overarching Fund benchmarks
and any future diversity and inclusion goals,
departments will need to first take into
consideration what the Fund is trying to
accomplish overall and align their individual efforts
accordingly. Further steps will also be needed to
align and integrate our diversity and inclusion
efforts into our workforce planning, leadership
framework and cultural efforts aimed at increasing
our organizational agility and collaboration across
the Fund and strengthening our relationships and
reputation with our member countries.
The credibility of our efforts and our leadership on
the issues of diversity and inclusion will continue to
increase as we convert intention into action.
Inclusive Leadership assures an inclusive
organization. It is widely held that a
fundamental function of leaders is to be “keepers
of the culture”—and guides and drivers of serious
culture shifts. It is not possible to conceive
or effectively implement basic changes in the
culture without active, committed and creative
leadership from the top.
Powerful leaders possess a broad range of
attitudes, skills and traits that make them effective.
However, for them to have a positive impact on
the environment, unique attributes are required.
Leading by example from a set of inclusive
management behaviors is essential to get the most
out of diversity through inclusion.
The following ten inclusive behaviors offer an
instructive starting point for the Fund. Drawing
on this list will help guide our long term efforts by
making more explicit the behavioral expectations
we set for leaders and staff.
“”
The Baby Boomer view of the employment contract is: ‘You are loyal to the Fund and the
Fund will be loyal to you.’ The Millennial commitment is to build competency and skill in
the profession that is aligned with the profession, not a specific institution.

IMF Diversity and Inclusion Annual Report | 2015 29
BEHAVIORS THAT FOSTER INCLUSION
1. FULLY EMBRACE INCLUSION AGENDAThe first and most crucial step of inclusive leadership is identifying, endorsing and implementing a
consistent agenda.
2. MAKE INCLUSIVE BEHAVIOR STANDARDS EXPLICITLeaders at all levels need to name and embrace the values and behaviors that animate the inclusive workplace.
These cannot be just words in a brochure or elements of presentations.
3. CHALLENGE TRADITIONAL ASSUMPTIONS, HABITSLeaders are uniquely positioned to challenge prevailing assumptions and adopt new habits.
4. INSIST UPON MUTUAL RESPECTRespect is important in all interactions, especially in multicultural settings.
5. ASSUME GREAT CAPABILITY AND DEVELOP ALLAvoiding biases, preconceptions and prior judgments about who is capable of what is essential.
6. PERSIST WITH TARGETED TRAINING Investing in training in core inclusive skills such as avoiding prejudgment is imperative.
7. BE COACHED, COACH OTHERS IN DIVERSITY AND INCLUSION ESSENTIALSCoaching is required to bring people up to the necessary skill levels.
8. BUILD A RESULTS-ORIENTED ENVIRONMENT THROUGH ABUNDANT FEEDBACKLeaders and line managers must serve as “mirrors” to staff, reinforcing desired behaviors and correcting errors.
9. FOSTER CREATIVE CONFLICT RESOLUTIONLearn the skills and train teams in routine conflict resolution rather than avoiding conflict.
10. ENCOURAGE AGILITYAgility is best achieved in a pervasive flexible
environment that features two-way
commitments and contributions.

The Road to Continuing Progress
To effectively accelerate progress in inclusion and
diversity, leaders need to be driving consistent
efforts across the Fund and within their
departments. To facilitate this, the Managing
Director recently nominated a new cohort of
leaders to lead the design and implementation
of the next stage of the Fund’s Inclusion and
Diversity efforts. The Inclusion and Diversity
Council will be led by Deputy Managing
Director, Carla Grasso and is primarily made
up of senior executives who will be asked to
co-design with the Diversity Office a 3–5 year
strategy for inclusion and diversity for the
Fund and implement key actions within their
departments that move this strategy forward.
The Diversity Advisor will advise the Council
and Management and collaborate widely across
the Fund to ensure the voices and ideas from all
departments and a wide variety of Fund staff and
stakeholders inform the strategy and actions.
The departments, through coordinated efforts
between their leadership teams, council members,
human resource managers and diversity reference
groups will develop department specific plans to
improve both diversity and inclusion. These plans
will align with the overarching Fund strategy and
be frequently monitored within their departments
as well as by the Council and Management.
Through collaboration with the Diversity Office,
Diversity Champion groups will also provide
feedback to the Council to help inform and
prioritize the inclusion and diversity strategy as
it evolves and gets implemented. Along with the
departmental diversity reference groups there are a
variety of staff groups organized around regional,
national, gender, generational, religious and sexual
orientation diversity dimensions. These groups,
along with the Staff Association Committee, will
help provide the council and management with
diverse perspectives on how to continuously
improve in our diversity and inclusion efforts.
The Board of Directors will help inform our efforts
and keep us focused on our member country needs.
This governance structure will begin in the Fall of
2015 with the aim of having a 3–5 year inclusion and
diversity strategy designed and approved sometime
in the next fiscal year.
“”
Building a governance structure that aligns
leaders and staff across the Fund in our
inclusion and diversity efforts will help
accelerate and sustain progress.
30 IMF Diversity and Inclusion Annual Report | 2015
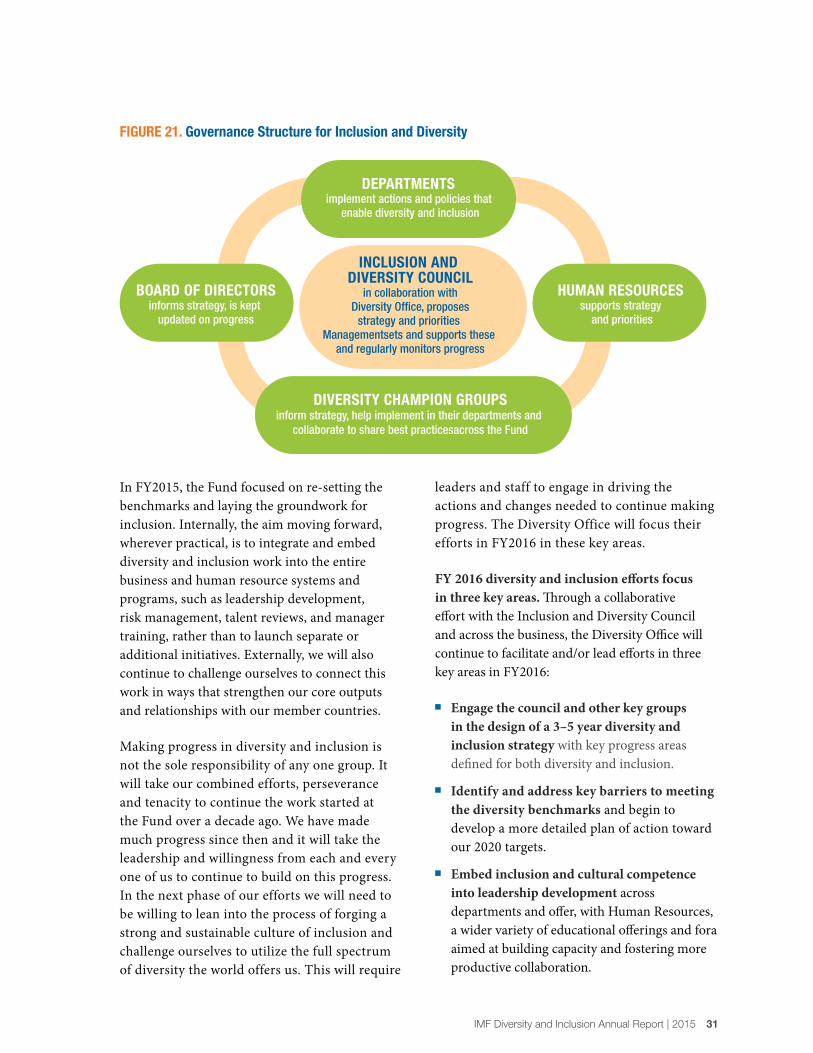
IMF Diversity and Inclusion Annual Report | 2015 31
In FY2015, the Fund focused on re-setting the
benchmarks and laying the groundwork for
inclusion. Internally, the aim moving forward,
wherever practical, is to integrate and embed
diversity and inclusion work into the entire
business and human resource systems and
programs, such as leadership development,
risk management, talent reviews, and manager
training, rather than to launch separate or
additional initiatives. Externally, we will also
continue to challenge ourselves to connect this
work in ways that strengthen our core outputs
and relationships with our member countries.
Making progress in diversity and inclusion is
not the sole responsibility of any one group. It
will take our combined efforts, perseverance
and tenacity to continue the work started at
the Fund over a decade ago. We have made
much progress since then and it will take the
leadership and willingness from each and every
one of us to continue to build on this progress.
In the next phase of our efforts we will need to
be willing to lean into the process of forging a
strong and sustainable culture of inclusion and
challenge ourselves to utilize the full spectrum
of diversity the world offers us. This will require
leaders and staff to engage in driving the
actions and changes needed to continue making
progress. The Diversity Office will focus their
efforts in FY2016 in these key areas.
FY 2016 diversity and inclusion efforts focus
in three key areas. Through a collaborative
effort with the Inclusion and Diversity Council
and across the business, the Diversity Office will
continue to facilitate and/or lead efforts in three
key areas in FY2016:
■ Engage the council and other key groups
in the design of a 3–5 year diversity and
inclusion strategy with key progress areas
defined for both diversity and inclusion.
■ Identify and address key barriers to meeting
the diversity benchmarks and begin to
develop a more detailed plan of action toward
our 2020 targets.
■ Embed inclusion and cultural competence
into leadership development across
departments and offer, with Human Resources,
a wider variety of educational offerings and fora
aimed at building capacity and fostering more
productive collaboration.
FIGURE 21. Governance Structure for Inclusion and Diversity
DEPARTMENTS implement actions and policies that
enable diversity and inclusion
HUMAN RESOURCES supports strategy
and priorities
BOARD OF DIRECTORSinforms strategy, is kept
updated on progress
DIVERSITY CHAMPION GROUPSinform strategy, help implement in their departments and
collaborate to share best practicesacross the Fund
INCLUSION AND DIVERSITY COUNCIL
in collaboration withDiversity Office, proposes
strategy and priorities Managementsets and supports these
and regularly monitors progress

“
”
ConclusionOur future success requires us to find creative and innovative
approaches for attracting, developing and retaining the best
talent the world produces. This talent provides assurance
that we will continue to be positioned to better understand,
support and advise our member countries in an increasingly
interconnected and complex environment.
Furthermore, continuing to integrate inclusion efforts across the Fund
will help us be more agile and utilize our strongest asset—the collective
intelligence and experiences of our staff and member countries. This will
make us an even stronger and smarter institution that remains ready and
equipped to serve our members. When there is economic stability in the
world, people’s lives improve and this, in its purest essence, is why our
work in diversity and inclusion remains vital to our mission.
It will take institutional perseverance and the efforts of leadership and
every staff member to make sustainable progress. Although we have
already taken many steps toward a more diverse and inclusive Fund, we
know we have farther to go to realize our full potential as an institution
and diversity and inclusion are the keys to unlocking it.

IMF Diversity and Inclusion Annual Report | 2015 Supplementary Information 33
FY 2015 ANNUAL REPORTSUPPLEMENTARY INFORMATION
Executive SummaryThis supplement to the FY 2015 Diversity and Inclusion Annual Report includes
additional case studies that support the business case for diversity and
inclusion in the work of the Fund.
The highlights for FY 2015 through mid-year FY 2016 represent a partial list of
priorities and actions to occur in FY 2016 and those already being planned or
underway. Some of these priorities may change with the business needs and
priorities that will be laid out by the Executive Diversity and Inclusion Council
but a clear plan of action will be further communicated in FY 2016.
As in previous years, data has been updated for FY 2015 in a number of tables
that support the content in the report.

34 IMF Diversity and Inclusion Annual Report | 2015 Supplementary Information
Examples Of Internal And External Initiatives . . . . . . . . . . . . . . . . . . . . . . . . . . . . . . . . . . . . . . . . . . . . . . . . . . . . 35
Box
1. Highlights From FY 2015 Through Mid-year FY 2016 . . . . . . . . . . . . . . . . . . . . . . . . . . . . . . . . . . . . . . . . . 38
Figures
1. Saudi Arabian job market opening to women: laying groundwork for change . . . . . . . . . . . . . . . . . . . . . . . . . . . 35
2. Financial Statistics Report: strengthening weekly preparation . . . . . . . . . . . . . . . . . . . . . . . . . . . . . . . . . . . . . . . . . . 35
3. Technology and General Services (TGS) Department’s women in IT initiative . . . . . . . . . . . . . . . . . . . . . . . . . . . . . 36
4. Equal opportunities for women may improve outcomes in Sub-Saharan Africa . . . . . . . . . . . . . . . . . . . . . . . . . . . . 36
5. CREATE mentoring builds inclusion for staff from underrepresented regions . . . . . . . . . . . . . . . . . . . . . . . . . . . . . 37
6. More inclusive decision-making structure in Asia Pacific Department (APD) . . . . . . . . . . . . . . . . . . . . . . . . . . . . . . 37
Tables
1. New Benchmarks for 2020 Effective May 1, 2015 . . . . . . . . . . . . . . . . . . . . . . . . . . . . . . . . . . . . . . . . . 39
2. Geographic and Gender Benchmark Indicators and Staff Representation. . . . . . . . . . . . . . . . . . . . . . . . . . . . . . . 40
3. Staff Appointments by Diversity Category FY 2015 . . . . . . . . . . . . . . . . . . . . . . . . . . . . . . . . . . . . . . . . . . 41
4. Economist Program Class Year 2015 Regional Diversity by Nationality and University . . . . . . . . . . . . . . . . . . . . . . . . 42
5. Mid-Career Staff Appointments (Grades A9–B5) FY 2015. . . . . . . . . . . . . . . . . . . . . . . . . . . . . . . . . . . . . . . 43
6. Mid-Career Staff Appointments from Previous Contractuals (Grades A9–B5) FY 2015 . . . . . . . . . . . . . . . . . . . . . . . . 44
7. Promotion Rates, A15 to A15 and A15 to B1 . . . . . . . . . . . . . . . . . . . . . . . . . . . . . . . . . . . . . . . . . . . . . 44
8. Pipeline and Promotions . . . . . . . . . . . . . . . . . . . . . . . . . . . . . . . . . . . . . . . . . . . . . . . . . . . . . . . 45
9. Staff Turnover by Gender and Diversity Category FY 2015 . . . . . . . . . . . . . . . . . . . . . . . . . . . . . . . . . . . . . . 46
10. The Fund’s Senior Management Profile . . . . . . . . . . . . . . . . . . . . . . . . . . . . . . . . . . . . . . . . . . . . . . . . 47
11. Dual Nationality Status of Fund Staff and Contractuals by Region. . . . . . . . . . . . . . . . . . . . . . . . . . . . . . . . . . . 48
12. Matrix of Staff Dual Nationality as of August 31, 2015 . . . . . . . . . . . . . . . . . . . . . . . . . . . . . . . . . . . . . . . . 49
13. Educational Diversity in the Fund: Bachelor Degrees as of April 30, 2015 . . . . . . . . . . . . . . . . . . . . . . . . . . . . . . . 50
14. Educational Diversity in the Fund: Master’s Degrees as of April 30, 2015 . . . . . . . . . . . . . . . . . . . . . . . . . . . . . . . 50
15. Educational Diversity in the Fund: Ph.D. Degrees as of April 30, 2015 . . . . . . . . . . . . . . . . . . . . . . . . . . . . . . . . 51
16. Staff Nationality by Region, Gender, Career Stream and Grade Grouping as of April 30, 2015 . . . . . . . . . . . . . . . . . . . . 52
17. Nationality of Contractual Employees By Region, Gender, Career Stream and Grade Grouping as of April 30, 2015 . . . . . . . . . 55
18. Nationality Distribution List: Staff and Contractual Employees as of April 30, 2015 . . . . . . . . . . . . . . . . . . . . . . . . . . 56
19. Distribution of Pipeline Grade A9-B5, Share of Grade by Gender and Region as of April 30, 2015 . . . . . . . . . . . . . . . . . . 67
20. Historical Share of Women and Men by Career Stream and Grade Grouping as of April 30, 2015 for Each Fiscal Year . . . . . . . . 70
21. Distribution of A9-B5 Staff by Region by Department as of April 30, 2015 . . . . . . . . . . . . . . . . . . . . . . . . . . . . . . 71
22. Share of Women by Department and Grade Grouping as of April 30, 2015 . . . . . . . . . . . . . . . . . . . . . . . . . . . . . . 72
23. Recruitment by Region, Gender, Career Stream, and Grade Grouping May 1, 2014–April 30, 2015. . . . . . . . . . . . . . . . . . 73
24. Five Year History: Recruitment by Region, Gender, Career Stream, and Grade Grouping May 1, 2010–April 30, 2015 . . . . . . . . 74
25. Staff Promoted By region, Career Stream, and Grade Grouping May 1, 2014–April 30, 2015 . . . . . . . . . . . . . . . . . . . . . 75
26. Economist Program (EP): Diversity Breakdown of Appointments Class Year 2010–2015 . . . . . . . . . . . . . . . . . . . . . . . 77
27. EP Recruitment Missions by University 2008–2014 . . . . . . . . . . . . . . . . . . . . . . . . . . . . . . . . . . . . . . . . . . 78
Contents

IMF Diversity and Inclusion Annual Report | 2015 Supplementary Information 35
Examples Of Internal And External Initiatives
Figure 1. Saudi Arabian job market opening to women: laying groundwork for change
THE CHALLENGE
More than 50 percent of Saudi Arabia’s university
graduates are female, yet the female unemployment rate
is high at 33 percent. This compares to 6 percent for men.
Women’s working is discouraged by cultural norms, lack
of child care and the inability to drive. This means that the
economy is foregoing the benefits of employing a well-
educated and productive part of the population.
THE INNOVATION
The Fund’s team brought several insights to the issue
within the context of a broad labor market assessment.
To ensure they understood the cultural context, the use
of a comparator group of emerging market countries
with majority Muslim populations was used. Having two
female members on the team brought credibility to the
articulation of women’s issues. Staff work contributed to
the analysis that labor force participation rates needed to
be raised, reinforcing reform efforts that were underway.
TOWARD INCLUSION
Some of the policy recommendations were designed
to help increase the inclusion of women from the
mainstream of Saudi Arabia’s economic life. They
included access to better transportation, improved
childcare services and flexible work arrangements such
as teleworking. These changes are a step in the direction
of greater inclusion for women.
Figure 2. Financial Statistics Report: strengthening weekly preparation
THE CHALLENGE
This weekly report, published for external consumption,
is time sensitive and the result of a long, cascaded review
process with multiple high level sign-offs. Its volume,
complexity and sensitivity require good institutional
knowledge and judgment.
THE INNOVATION
Ensuring that the contributor team includes a diverse
staff from different generations and job ladders created
a more productive and efficient process. Younger
Millennials, who are technologically savvy, optimized the
reporting process. More mature tenured staff with greater
institutional knowledge and subject matter expertise
addressed key questions and bureaucratic procedures.
TOWARD INCLUSION
The inclusion of the broader staff and their growth
as a team has improved their interactions, enhanced
communication, brought new attitudes to the job,
increased staff adaptability, broadened the range of
services offered and mitigated resistance to change.

36 IMF Diversity and Inclusion Annual Report | 2015 Supplementary Information
Figure 3. Technology and General Services (TGS) Department’s women in IT initiative
THE CHALLENGE
Women played a minor role in IT as recently as 2012. They
made up 28 percent of TGS IT staff, and only one female
staff person held a key role at that time. Some believed
that these low numbers reflected the general shortage of
women in Science-Technology-Engineering-Math (STEM)
disciplines.
THE INNOVATION
TGS launched a unique and aggressive series of diversity
and inclusion steps to change the dynamics. They
monitored the number/ratio of women for recruitment
activities and promotion, held a woman’s networking
event twice a year and used periodic fora to reach
prospects. The results: an increase in women in key
roles from 5.8 percent to 16.7 percent in FY 2014;
approximately 90 percent of all TGS positions have
female shortlisted candidates; and 50 percent of TGS
interns are female every year.
TOWARD INCLUSION
Having expanded the female workforce, TGS took
numerous steps to create an inclusive workplace. These
included a group mentoring program, communication and
gender bias training for all, assertive communication
training, securing buy-in from managers and supervisors
and creating a safe place for support and networking.
Figure 4. Equal opportunities for women may improve outcomes in Sub-Saharan Africa.
THE CHALLENGE
Gender inequality in education, health status, financial
access and legal constraints is high in some Sub-Saharan
African countries. It declined more slowly compared to
other regions over the last two decades. While this gap
is slowly shrinking, Sub-Saharan Africa remains one of
the regions with the highest gender inequality, just behind
the Middle East and North Africa. It may be linked to the
macro challenge of growth.
THE INNOVATION
The October 2015 sub-Saharan African Regional
Economic Outlook (REO) analyzes empirically the impact
of gender inequality and gender-based legal restrictions
on the region’s growth performance. The REO noted
that reducing legal restrictions and gender inequality
to levels observed in five fast-growing Asian countries
(Indonesia, Malaysia, Philippines, Thailand and Vietnam)
could boost annual real GDP per capita growth of the
region’s countries by on average more than ½ percentage
points.
TOWARD INCLUSION
The results of this work will be presented in outreach
events during and after the Annual Meetings and the
sharing of this cross-country and regional knowledge will
be used to inform discussions with policy makers going
forward. The findings support the message that reducing
gender inequality is both smart economics and right from
an inclusion, development and human rights perspective.

IMF Diversity and Inclusion Annual Report | 2015 Supplementary Information 37
Figure 5. CREATE mentoring builds inclusion for staff from underrepresented regions
THE CHALLENGE
Advancement in the URR is challenged when staff
members are unfamiliar with the hiring process, feel
excluded from formal and informal networks, do not
understand how management thinks and are not trained
in the most effective ways to interview.
THE INNOVATION
A program to provide mutual mentoring and support in a
group setting was piloted in 2015. Participants included
manager “guides” and staff from under represented
regions. Among its strengths were bringing people
together from diverse backgrounds and work streams,
exposing differences at multiple levels and widening
professional networks.
TOWARD INCLUSION
The group process led to a level of sharing and mutual
support that participants had rarely experienced.
Participants “got exposure to how other departments
handle different issues, liked the blend of staff from
various regions and appreciated the practical advice and
practice in preparing for career development discussions
and interviews.” One participant noted that the mock
interview process used in their group helped them
have a stronger interview that they felt ultimately led
to their promotion. Manager guides also benefitted by
becoming more aware of the challenges staff from under
represented regions face and were able to raise their own
awareness while providing valuable coaching.
Figure 6. More inclusive decision-making structure in Asia Pacific Department (APD)
THE CHALLENGE
Staff members felt that they lacked adequate input to
the running of the organization. Staff in general and
junior staff in particular felt that the Fund’s organizational
structure was not conducive for speaking truth to power
and channeling new ideas and solutions into decision-
making circles.
THE INNOVATION
APD introduced new consultative structures to
strengthen the voices of more junior staff. A Junior
Management Board of economists balanced for grade,
gender, regional diversity, and division—was chosen
for a defined period. Consultative groups were also set
up to include Research Officers, Research Assistants
and Coordinators. They meet with the department’s
management periodically and provide additional
perspectives to the decision-making process.
TOWARD INCLUSION
This structural change has enhanced the diversity
dimension of decision-making. Representation from every
grade level has helped harness multiple perspectives
that arise from various aspects of diversity—including,
to some degree, generational diversity—within the
department. This innovation increases the likelihood of
the best ideas being brought to the fore and helps further
the department’s inclusion agenda.

38 IMF Diversity and Inclusion Annual Report | 2015 Supplementary Information
Box 1. Highlights From FY 2015 Through Mid-year FY 2016
LAYING THE FOUNDATION
• Revising Diversity and Inclusion Council to include senior leaders from all departments
• Using additional data sets to tell a compelling story and inform future actions
• Diversity Reference Groups in departments continued to offering awareness sessions on a wide variety of diversity and inclusion topics
• Implemented “Peers for Respectful Workplace” program in multiple departments
DEVELOPING STAFF
• Piloted CREATE group mentoring program to aid in development of URR staff
• Offered departmental efforts to build capabilities to improve collaboration
• Piloted intercultural assessment and training with more than 150 staff
• Offered a variety of communication training for managers and staff
• Integrating URR and women’s development more consciously into development planning and programs
DEVELOPING LEADER
• Piloted B-level hiring program targeting hires from underrepresented regions
• Integrated cross-cultural competency assessment into leadership development programs
• Engaging senior women and men to champion change and help frame and develop effective gender balance and equity strategies across the Fund
• Introduced feedback tools: Direct Report Inventory (DRI) and 360 degree feedback
CHECKING FOR BIAS
• Conducted an internal salary and career progression study that did not reveal large, systemic issues but that will require follow-up in a few select areas in FY 2016
• Piloted training and multiple awareness sessions in “unconscious bias”
• Launched Inclusion Begins with I series to broaden the inclusion efforts beyond nationality and gender
• Session 1 on Building Allies to support LGBT staff in partnership with the IMF GLOBE group, Session 2 on Microinequities
LEARNING FROM OTHERS
• Conducted a cross-generational focus group on inclusion
• Hosted International Women’s Day event featuring the MD and Lloyd Blankfein, CEO of Goldman Sachs
• Increased collaboration across diversity reference groups and staff clubs
• Former Secretary of the Australian Treasury, Martin Parkinson, presented to Board, Council and other executives on their gender progress
• Sub-Saharan African Group and the IMF Arab group each sponsored economic forums featuring busi-ness issues in their regions

IMF Diversity and Inclusion Annual Report | 2015 Supplementary Information 39
Table 1. New Benchmarks for 2020
Effective May 1, 2015
2014 2020
Share of A9-B5 staff (in percent)
REGION
Africa (Sub-Saharan) 8.0 8.0
East Asia 12.0 15.0
Transition Countries1 8.0 n.a.
Middle East and North Africa+ (MENA+) 8.0 8.0
Share of A9-B5 recruitment (in percent)
REGION
Africa (Sub-Saharan) n.a. 10.0
Middle East and North Africa+ (MENA+) n.a. 10.0
GENDER
Women 50.0 50.0
Share of B-level staff (in percent)
REGION
Africa (Sub-Saharan) 6.0 7.0
East Asia 7.0 8.0
Transition Countries1 4.0 n.a.
Middle East and North Africa + (MENA+) 5.0 6.0
WOMEN
All B-Level 25-30 30.0
B-Level in Economist Departments 20-25 25.0
B-Level in SCS Departments 40-45 45.0
Source: Diversity Working Group Report (August 2014)1Benchmarks for transition countries removed effective May 1, 2015

40 IMF Diversity and Inclusion Annual Report | 2015 Supplementary Information
Table 2. Geographic and Gender Benchmark Indicators and Staff Representation1
CY2009 CY2010 FY2012 FY2013 FY2014 FY2015
2014
Benchmarks
Share of A9-B5 level staff (in percent)
REGIONS
Africa (Sub-Saharan) 6.5 6.5 6.8 6.8 7.1 7.7 8.0
Asia 16.9 17.7 18.2 18.8 19.1 19.4 n.a.
East Asia 9.1 10.0 10.6 11.3 11.5 11.9 12.0
Europe 37.6 37.7 37.2 37.0 37.3 36.9 n.a.
Transition Countries 7.4 7.9 8.1 8.3 8.5 8.7 8.0
Middle East and North Africa+ (MENA+) 4.2 4.3 4.2 4.5 4.6 4.7 8.0
Western Hemisphere 34.8 33.7 33.6 32.9 31.9 11.3
Share of B-level staff (in percent)
REGIONS
Africa (Sub-Saharan) 4.6 5.0 4.7 4.8 5.0 5.8 6.0
Asia 15.4 14.8 15.3 15.0 14.5 14.1
East Asia 4.9 5.0 5.3 5.7 5.0 4.9 7.0
Europe 41.5 44.5 43.4 42.9 43.7 45.0
Transition Countries 1.6 2.2 2.2 2.1 2.1 2.9 4.0
Middle East and North Africa+ (MENA+) 2.6 2.8 3.8 5.4 5.3 5.2 5.0
Western Hemisphere 35.9 32.5 32.8 31.8 31.8 7.2
Share of B-level staff (in percent)
WOMEN
All B-Level 18.4 21.5 20.9 21.9 23.6 23.6 25-30
B-Level in Economist Departments 15.3 17.6 17.5 19.0 20.0 18.8 20-25
B-Level in SCS Departments 31.0 34.7 33.8 34.4 37.7 41.3 40-45
MEN
All B-Level 81.6 78.5 79.1 78.1 76.4 63.9
B-Level in Economist Departments 84.7 82.4 82.5 81.0 80.0 81.3
B-Level in SCS Departments 69.0 65.3 66.2 65.6 62.3 58.7
Source: PeopleSoft HRMS; Report ID: DAR_007.SQR1Excludes OED and IEO
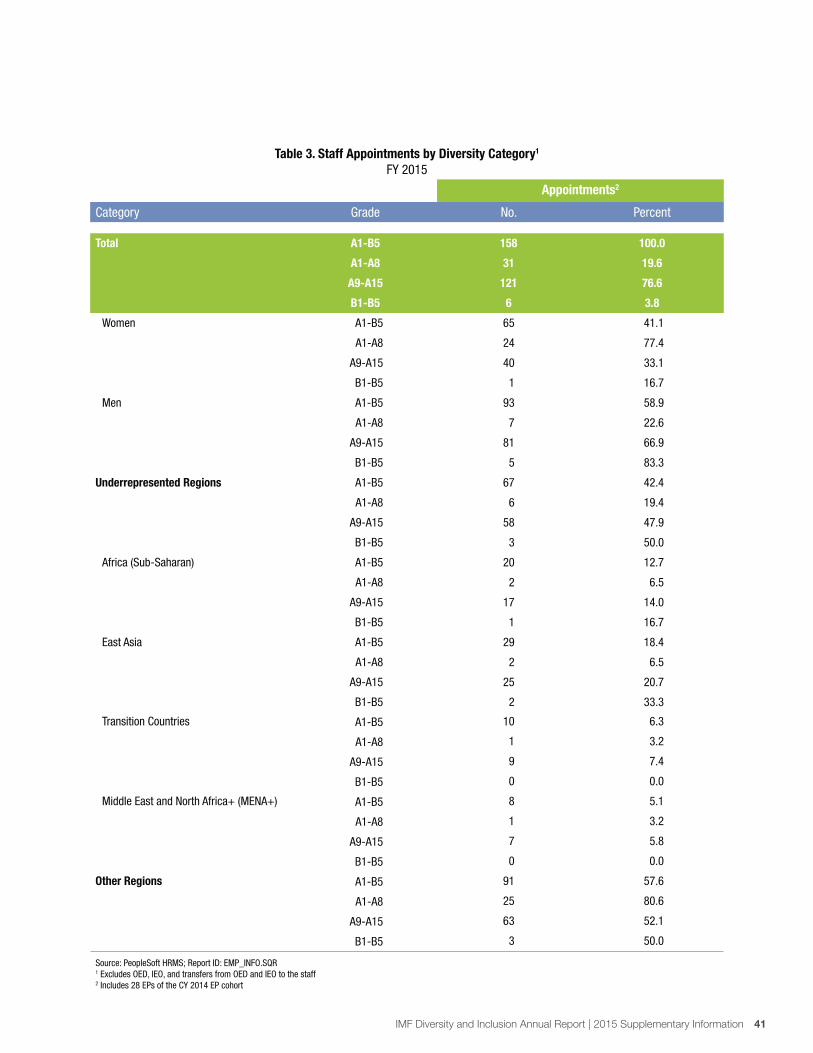
IMF Diversity and Inclusion Annual Report | 2015 Supplementary Information 41
Table 3. Staff Appointments by Diversity Category1
FY 2015
Appointments2
Category Grade No. Percent
Total A1-B5 158 100.0
A1-A8 31 19.6
A9-A15 121 76.6
B1-B5 6 3.8
Women A1-B5 65 41.1
A1-A8 24 77.4
A9-A15 40 33.1
B1-B5 1 16.7
Men A1-B5 93 58.9
A1-A8 7 22.6
A9-A15 81 66.9
B1-B5 5 83.3
Underrepresented Regions A1-B5 67 42.4
A1-A8 6 19.4
A9-A15 58 47.9
B1-B5 3 50.0
Africa (Sub-Saharan) A1-B5 20 12.7
A1-A8 2 6.5
A9-A15 17 14.0
B1-B5 1 16.7
East Asia A1-B5 29 18.4
A1-A8 2 6.5
A9-A15 25 20.7
B1-B5 2 33.3
Transition Countries A1-B5 10 6.3
A1-A8 1 3.2
A9-A15 9 7.4
B1-B5 0 0.0
Middle East and North Africa+ (MENA+) A1-B5 8 5.1
A1-A8 1 3.2
A9-A15 7 5.8
B1-B5 0 0.0
Other Regions A1-B5 91 57.6
A1-A8 25 80.6
A9-A15 63 52.1
B1-B5 3 50.0
Source: PeopleSoft HRMS; Report ID: EMP_INFO.SQR1 Excludes OED, IEO, and transfers from OED and IEO to the staff 2 Includes 28 EPs of the CY 2014 EP cohort

IMF Diversity and Inclusion Annual Report | 2015 Supplementary Information 42
Table 4. Economist Program Class Year 2015
Regional Diversity by Nationality and University
Nationality University
Region No. Percent No. Percent
Total Appointments 20 100.0 20 100.0
Underrepresented Regions 9 45.0 0 0.0
Africa (Sub-Saharan) 3 15.0 0 0.0
East Asia 2 10.0 0 0.0
Transition Countries 3 15.0 0 0.0
Middle East and North Africa+ (MENA+) 1 5.0 0 0.0
Other Regions 10 50.0 20 100.0
Asia (Other) 1 5.0 0 0.0
Europe (Other) 5 25.0 11 55.0
of which United Kingdom 1 5.0 5 25.0
US and Canada 1 5.0 9 45.0
Other Western Hemisphere 3 15.0 0 0.0
Source: HRD/TAO
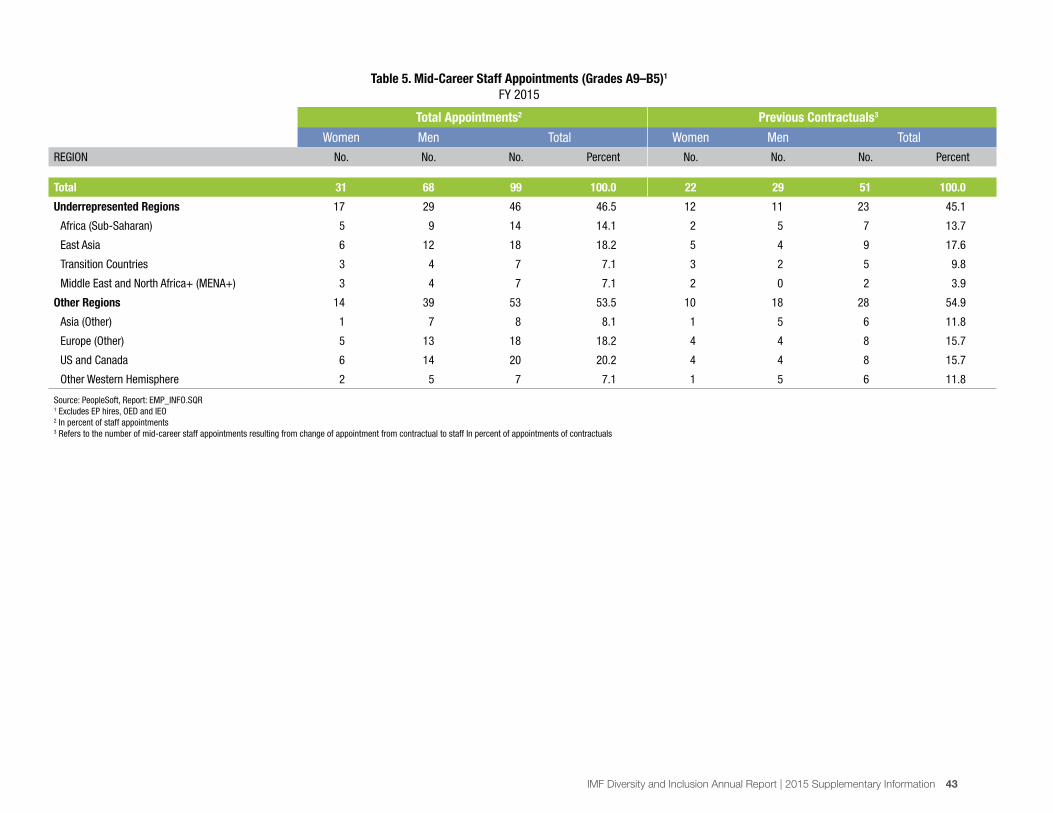
Table 5. Mid-Career Staff Appointments (Grades A9–B5)1
FY 2015
Total Appointments2 Previous Contractuals3
Women Men Total Women Men Total
REGION No. No. No. Percent No. No. No. Percent
Total 31 68 99 100.0 22 29 51 100.0
Underrepresented Regions 17 29 46 46.5 12 11 23 45.1
Africa (Sub-Saharan) 5 9 14 14.1 2 5 7 13.7
East Asia 6 12 18 18.2 5 4 9 17.6
Transition Countries 3 4 7 7.1 3 2 5 9.8
Middle East and North Africa+ (MENA+) 3 4 7 7.1 2 0 2 3.9
Other Regions 14 39 53 53.5 10 18 28 54.9
Asia (Other) 1 7 8 8.1 1 5 6 11.8
Europe (Other) 5 13 18 18.2 4 4 8 15.7
US and Canada 6 14 20 20.2 4 4 8 15.7
Other Western Hemisphere 2 5 7 7.1 1 5 6 11.8
Source: PeopleSoft, Report: EMP_INFO.SQR1 Excludes EP hires, OED and IEO 2 In percent of staff appointments 3 Refers to the number of mid-career staff appointments resulting from change of appointment from contractual to staff In percent of appointments of contractuals
IMF Diversity and Inclusion Annual Report | 2015 Supplementary Information 43

Table 6. Mid-Career Staff Appointments from Previous Contractuals (Grades A9–B5)1
FY 2015
Total Economist SCS
No. Percent No. Percent No. Percent
Fund staff appointments: previous contractuals2 51 100.0 29 56.9 22 43.1
Underrepresented Regions 23 45.1 11 37.9 12 54.5
Other Regions 28 54.9 18 62.1 10 45.5
Women 22 43.1 10 34.5 12 54.5
Men 29 56.9 19 65.5 10 45.5
Source: PeopleSoft, Report: EMP_INFO.SQR1 Excludes EP hires, OED and IEO 2 Captures the percent of mid-career staff appointments resulting from staff appointments from previous contractuals
Table 7. Promotion Rates, A14 to A15 and A15 to B11
Stock as of May 1, 2014 Promotions in FY 2015
A14 A15 A14 to A15 A15 to B1
REGION No No. No.
Rate
(in percent) No.
Rate
(in percent)
Total 607 252 32 5.3 25 9.9
Underrepresented Regions 189 48 9 4.8 7 14.6
Africa (Sub-Saharan) 47 12 3 6.4 2 16.7
East Asia 61 11 0 0.0 1 9.1
Transition Countries 57 18 2 3.5 3 16.7
Middle East and North Africa+ (MENA+) 24 7 4 16.7 1 14.3
Other regions 418 204 23 5.5 18 8.8
Women 168 68 12 7.1 7 10.3
Men 439 184 20 4.6 18 9.8
Sources: PeopleSoft HRMS; Report ID: EMP_INFO.SQR, DM#5673027, “Pivots_Promotions”1 Excludes OED and IEO. Promotion rate is the number of promotions as a percentage of stock of staff in preceding grade in previous year.
44 IMF Diversity and Inclusion Annual Report | 2015 Supplementary Information

Table 8. Pipeline and Promotions1
Stock – April 30, 2015 2014
B-Level
Benchmark
Promotions to B1
in FY 2015A14 A15 B1
No. Percent No. Percent No. Percent No. Percent
Total 590 100.0 245 100.0 63 100.0 25 100.0
REGION
Underrepresented Regions 192 32.5 47 19.2 18 28.6 22 7 28.0
Other Regions 398 67.5 198 80.8 45 71.4 n.a. 18 72.0
GENDER
Women 162 27.5 70 28.6 21 33.3 25-30 7 28.0
Men 428 72.5 175 71.4 42 66.7 n.a. 18 72.0
Sources: PeopleSoft HRMS; Report ID: EMP_INFO.SQR, PROM_03.SQR, and DM#5673027, “Pivots_Stock as of April30 2015”1 Excludes OED and IEO
IMF Diversity and Inclusion Annual Report | 2015 Supplementary Information 45
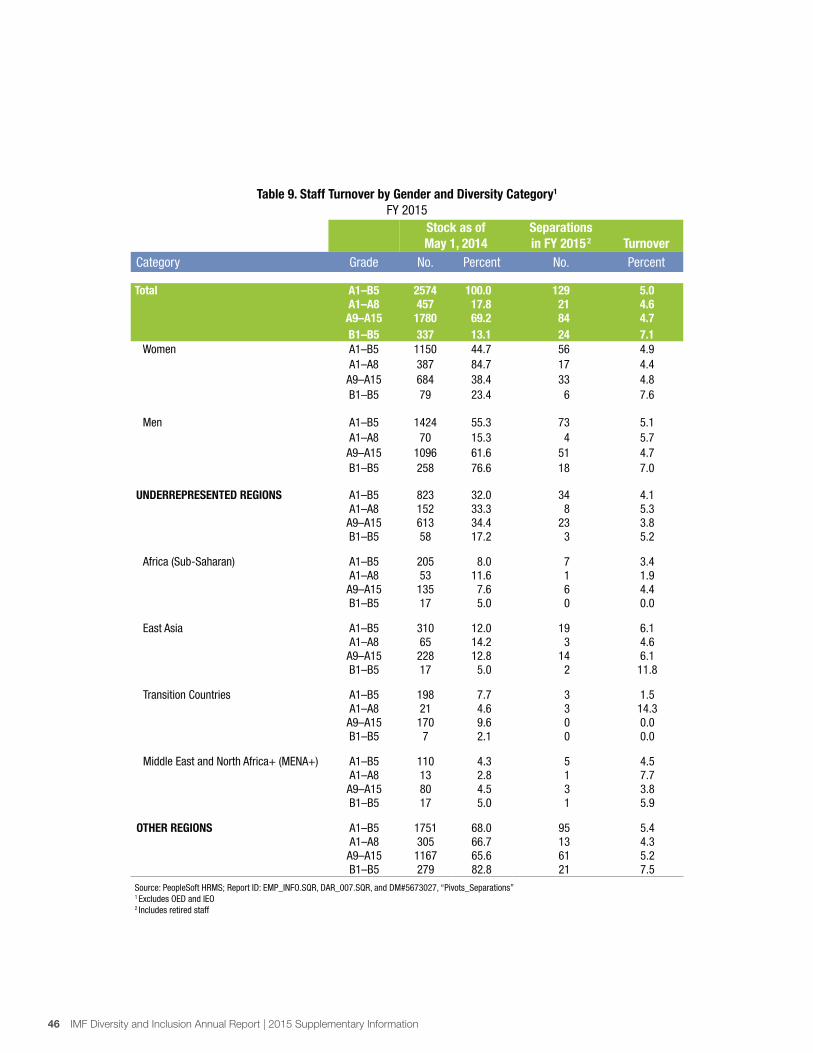
Table 9. Staff Turnover by Gender and Diversity Category1
FY 2015
Stock as of
May 1, 2014
Separations
in FY 2015 2 Turnover
Category Grade No. Percent No. Percent
Total A1–B5 2574 100.0 129 5.0A1–A8 457 17.8 21 4.6A9–A15 1780 69.2 84 4.7
B1–B5 337 13.1 24 7.1
Women A1–B5 1150 44.7 56 4.9
A1–A8 387 84.7 17 4.4
A9–A15 684 38.4 33 4.8
B1–B5 79 23.4 6 7.6
Men A1–B5 1424 55.3 73 5.1
A1–A8 70 15.3 4 5.7
A9–A15 1096 61.6 51 4.7
B1–B5 258 76.6 18 7.0
UNDERREPRESENTED REGIONS A1–B5 823 32.0 34 4.1A1–A8 152 33.3 8 5.3A9–A15 613 34.4 23 3.8B1–B5 58 17.2 3 5.2
Africa (Sub-Saharan) A1–B5 205 8.0 7 3.4A1–A8 53 11.6 1 1.9A9–A15 135 7.6 6 4.4B1–B5 17 5.0 0 0.0
East Asia A1–B5 310 12.0 19 6.1A1–A8 65 14.2 3 4.6A9–A15 228 12.8 14 6.1B1–B5 17 5.0 2 11.8
Transition Countries A1–B5 198 7.7 3 1.5A1–A8 21 4.6 3 14.3A9–A15 170 9.6 0 0.0B1–B5 7 2.1 0 0.0
Middle East and North Africa+ (MENA+) A1–B5 110 4.3 5 4.5A1–A8 13 2.8 1 7.7A9–A15 80 4.5 3 3.8B1–B5 17 5.0 1 5.9
OTHER REGIONS A1–B5 1751 68.0 95 5.4A1–A8 305 66.7 13 4.3A9–A15 1167 65.6 61 5.2B1–B5 279 82.8 21 7.5
Source: PeopleSoft HRMS; Report ID: EMP_INFO.SQR, DAR_007.SQR, and DM#5673027, “Pivots_Separations”1 Excludes OED and IEO2 Includes retired staff
46 IMF Diversity and Inclusion Annual Report | 2015 Supplementary Information

Table 10. The Fund’s Senior Management Profile1
Total Women Men Underrepresented Regions Other Regions
No. No. Percent No. Percent No. Percent No. Percent
Department Heads and Directors
FY2015 21 4 19.0 17 81.0 3 14.3 18 85.7
FY2014 21 4 19.0 17 81.0 4 19.0 17 81.0
FY2013 21 3 14.3 18 85.7 2 9.5 19 90.5
FY20122 20 3 15.0 17 85.0 2 10.0 18 90.0
CY2010 21 4 19.0 17 81.0 3 14.3 18 85.7
Senior Personnel Managers3
FY2015 21 9 42.9 12 57.1 4 19.0 17 81.0
FY2014 20 10 50.0 10 50.0 3 15.0 17 85.0
FY2013 19 9 47.4 10 52.6 3 15.8 16 84.2
FY2012 19 7 36.8 12 63.2 2 10.5 17 89.5
CY2010 20 5 25.0 15 75.0 2 10.0 18 90.0
Division Chiefs3
FY2015 74 16 21.6 58 78.4 11 14.9 63 85.1
FY2014 131 31 23.7 100 76.3 22 16.8 109 83.2
FY2013 130 29 22.3 101 77.7 19 14.6 111 85.4
FY2012 128 24 18.8 104 81.3 16 12.5 112 87.5
CY2010 122 22 18.0 100 82.0 18 14.8 104 85.2
Source: PeopleSoft HRMS; Report ID: STFA14B5.SQR, DPT_HEAD.SQR, EMP_INFO.SQR; HRD (SPM list)1 Excluding OED and IEO
2 Starting with the FY 2011 Diversity Annual Report, the reporting period changed from calendar year to fiscal year
3 Based upon best available data, as job titles vary for these position
IMF Diversity and Inclusion Annual Report | 2015 Supplementary Information 47

Table 11. Dual Nationality Status of Fund Staff and Contractuals by Region1
as of August 31, 2015
Staff Contractuals
A1–A8 A9–A15 B1–B5 Professional Support
Region of Second Nationality No. No. No. No. No.
Total 73 248 35 28 28
UNDERREPRESENTED REGIONS 36 73 8 7 3
Africa (Sub-Saharan) 10 23 1 3 0
East Asia 5 8 0 0 0
Transition Countries 9 18 2 2 2
Middle East and North Africa+ (MENA+) 12 24 5 2 1
OTHER REGIONS 37 175 27 21 25
Asia (Other) 1 7 3 1 0
Europe (Other) 18 113 18 9 3
US and Canada 1 21 3 6 21
Other Western Hemisphere 17 34 3 5 1
Source: PeopleSoft HRMS; REPORT ID: EMP_INFO.SQR, NAT_DUAL.SQR; data as of August 31, 2015 (self-reported)1 Excludes OED, IEO, and SBF
48 IMF Diversity and Inclusion Annual Report | 2015 Supplementary Information

Table 12. Matrix of Staff Dual Nationality1
as of August 31, 2015
Secondary Nationality
Underrepresented Regions Other Regions
Primary Nationality
Africa
(Sub-Saharan) East Asia
Transition
Countries
Middle East and North
Africa+ (MENA+)
Underrepresented
Regions
Asia
(Other)
Europe
(Other)
US and
Canada
Other Western
Hemisphere
Other
Regions Total
Total 30 13 28 38 109 9 154 27 55 245 354
UNDERREPRESENTED REGIONS 3 3 7 2 15 0 24 14 1 39 54
Africa (Sub-Saharan) 3 0 2 0 5 0 10 1 0 11 16
East Asia 0 3 0 0 3 0 1 2 1 4 7
Transition Countries 0 0 3 0 3 0 5 4 0 9 12
Middle East and North Africa+
(MENA+)
0 0 2 2 4 0 8 7 0 15 19
OTHER REGIONS 27 10 21 36 94 9 130 13 54 206 300
Asia (Other) 0 0 0 0 0 0 9 0 0 9 9
Europe (Other) 8 1 2 13 24 4 31 5 18 58 82
US and Canada 19 9 19 22 69 5 51 4 27 87 156
Other Western Hemisphere 0 0 0 1 1 0 39 4 9 52 53
Source: PeopleSoft HRMS Report EMP_INFO.SQR1Excludes OED and independent offices.
IMF Diversity and Inclusion Annual Report | 2015 Supplementary Information 49

Table 13. Educational Diversity in the Fund: Bachelor Degrees1
as of April 30, 2015
Degrees Earned
Region/Country2 No. Percent
Total 2067 100.0
Africa (Sub-Saharan) 97 4.7
China 88 4.3
East Asia3 145 7.0
India 106 5.1
Asia (Other)4 34 1.6
Transition Countries 94 4.5
France 59 2.9
Germany 32 1.5
Italy 37 1.8
United Kingdom 139 6.7
Europe (Other )5 128 6.2
Middle East and North Africa + (MENA+) 64 3.1
United States 771 37.3
Canada 73 3.5
Other Western Hemisphere 200 9.7
Source: PeopleSoft, Report: DIV_EDU. SQR, EMP_INFO.SQR1 Excludes OED and IEO2 Based on the country where the university is located3 Excluding China4 Excluding India5 Excluding France, Germany, Italy, and United Kingdom
Table 14. Educational Diversity in the Fund: Master’s Degrees1
as of April 30, 2015
Degrees Earned
Region/Country2 No. Percent
Total 2276 100.0
Africa (Sub-Saharan) 48 2.1
China 35 1.5
East Asia3 38 1.7
India 60 2.6
Asia (Other)4 24 1.1
Transition Countries 122 5.4
France 156 6.9
Germany 64 2.8
Italy 36
United Kingdom 266 11.7
Europe (Other )5 177 7.8
Middle East and North Africa + (MENA+) 27 1.2
United States 1062 46.7
Canada 82 3.6
Other Western Hemisphere 79 3.5
Source: PeopleSoft, Report: DIV_EDU. SQR, EMP_INFO.SQR1 Excludes OED and IEO2 Based on the country where the university is located3 Excluding China4 Excluding India5 Excluding France, Germany, Italy, and United Kingdom
50 IMF Diversity and Inclusion Annual Report | 2015 Supplementary Information

Table 15. Educational Diversity in the Fund: Ph.D. Degrees1
as of April 30, 2015
Degrees Earned
Region/Country2 No. Percent
Total 775 100.0
Africa (Sub-Saharan) 6 0.8
China 7 0.9
East Asia3 5 0.6
India 2 0.3
Asia (Other)4 2 0.3
Transition Countries 28 3.6
France 31 4.0
Germany 21 2.7
Italy 23 3.0
United Kingdom 77 9.9
Europe (Other)5 66 8.5
Middle East and North Africa+ (MENA+) 2 0.3
United States 485 62.6
Canada 18 2.3
Other Western Hemisphere 2 0.3
Source: PeopleSoft, Report: DIV_EDU. SQR, EMP_INFO.SQR1 Excludes OED and IEO 2 Based on the country where the university is located3 Excluding China4 Excluding India5 Excluding France, Germany, Italy, and United Kingdom
IMF Diversity and Inclusion Annual Report | 2015 Supplementary Information 51

Table 16. Staff Nationality by Region, Gender, Career Stream and Grade Grouping1
as of April 30, 2015
Total
A1–A8 A9–A15 B1–B5 A9–B5 TOTAL
Region No. Percent No. Percent No. Percent No. Percent No. Percent
AFRICA (SUB-SAHARAN) 52 11.5 147 8.1 20 5.8 167 7.7 219 8.4
ASIA 97 21.4 369 20.4 49 14.1 418 19.4 515 19.7
Australia & New Zealand 3 0.7 29 1.6 8 2.3 37 1.7 40 1.5
India 22 4.8 83 4.6 20 5.8 103 4.8 125 4.8
East Asia 62 13.7 240 13.2 17 4.9 257 11.9 319 12.2
Japan 2 0.4 48 2.6 5 1.4 53 2.5 55 2.1
Asia (Other) 10 2.2 17 0.9 4 1.2 21 1.0 31 1.2
EUROPE 63 13.9 640 35.3 156 45.0 796 36.9 859 32.9
United Kingdom 21 4.6 66 3.6 38 11.0 104 4.8 125 4.8
Transition Countries 17 3.7 178 9.8 10 2.9 188 8.7 205 7.8
Europe (Other) 25 5.5 396 21.9 108 31.1 504 23.3 529 20.2
MIDDLE EAST AND NORTH AFRICA + (MENA+) 12 2.6 84 4.6 18 5.2 102 4.7 114 4.4
Saudi Arabia 0 0.0 5 0.3 3 0.9 8 0.4 8 0.3
Arab Countries (Other) 8 1.8 58 3.2 12 3.5 70 3.2 78 3.0
Middle East (Other) 4 0.9 21 1.2 3 0.9 24 1.1 28 1.1
US & CANADA 150 33.0 352 19.4 79 22.8 431 20.0 581 22.2
United States 146 32.2 300 16.6 66 19.0 366 17.0 512 19.6
Canada 4 0.9 52 2.9 13 3.7 65 3.0 69 2.6
OTHER WESTERN HEMISPHERE 80 17.6 220 12.1 25 7.2 245 11.3 325 12.4
Total 454 100.0 1812 100.0 347 100.0 2159 100.0 2613 100.0
Women 384 84.6 698 38.5 82 23.6 780 36.1 1164 44.5
Men 70 15.4 1114 61.5 265 76.4 1379 63.9 1449 55.5
Source: PeopleSoft HRMS, Report ID: DAR_007.SQR1 Excludes OED and IEO
52 IMF Diversity and Inclusion Annual Report | 2015 Supplementary Information

Table 16. Staff Nationality by Region, Gender, Career Stream and Grade Grouping1 (continued)
as of April 30, 2015
Economists
A9–A15 B1–B5 A9–B5 TOTAL
Region No. Percent No. Percent No. Percent No. Percent
AFRICA (SUB-SAHARAN) 87 7.6 13 4.8 100 7.1 111 7.2
ASIA 224 19.6 37 13.6 261 18.4 261 18.4
Australia & New Zealand 21 1.8 7 2.6 28 2.0 36 2.3
India 33 2.9 15 5.5 48 3.4 48 3.1
East Asia 160 14.0 11 4.0 171 12.1 190 12.3
Japan 40 3.5 5 1.8 45 3.2 53 3.4
Asia (Other) 10 0.9 4 1.5 14 1.0 288 18.6
EUROPE 484 42.3 133 48.9 617 43.6 681 44.0
United Kingdom 38 3.3 28 10.3 66 4.7 75 4.9
Transition Countries 133 11.6 10 3.7 143 10.1 152 9.8
Europe (Other) 313 27.4 95 34.9 408 28.8 454 29.4
MIDDLE EAST AND NORTH AFRICA + (MENA+) 54 4.7 15 5.5 69 4.9 75 4.9
Saudi Arabia 4 0.3 1 0.4 5 0.4 7 0.5
Arab Countries (Other) 34 3.0 11 4.0 45 3.2 48 3.1
Middle East (Other) 16 1.4 3 1.1 19 1.3 20 1.3
US & CANADA 142 12.4 55 20.2 197 13.9 208 13.5
United States 109 9.5 45 16.5 154 10.9 161 10.4
Canada 33 2.9 10 3.7 43 3.0 47 3.0
OTHER WESTERN HEMISPHERE 152 13.3 19 7.0 171 12.1 183 11.8
Total 1143 100.0 272 100.0 1415 100.0 1546 100.0
Women 343 30.0 51 18.8 394 27.8 419 27.1
Men 800 70.0 221 81.3 1021 72.2 1127 72.9
Source: PeopleSoft HRMS, Report ID: DAR_007.SQR1 Excludes OED and IEO
IMF Diversity and Inclusion Annual Report | 2015 Supplementary Information 53
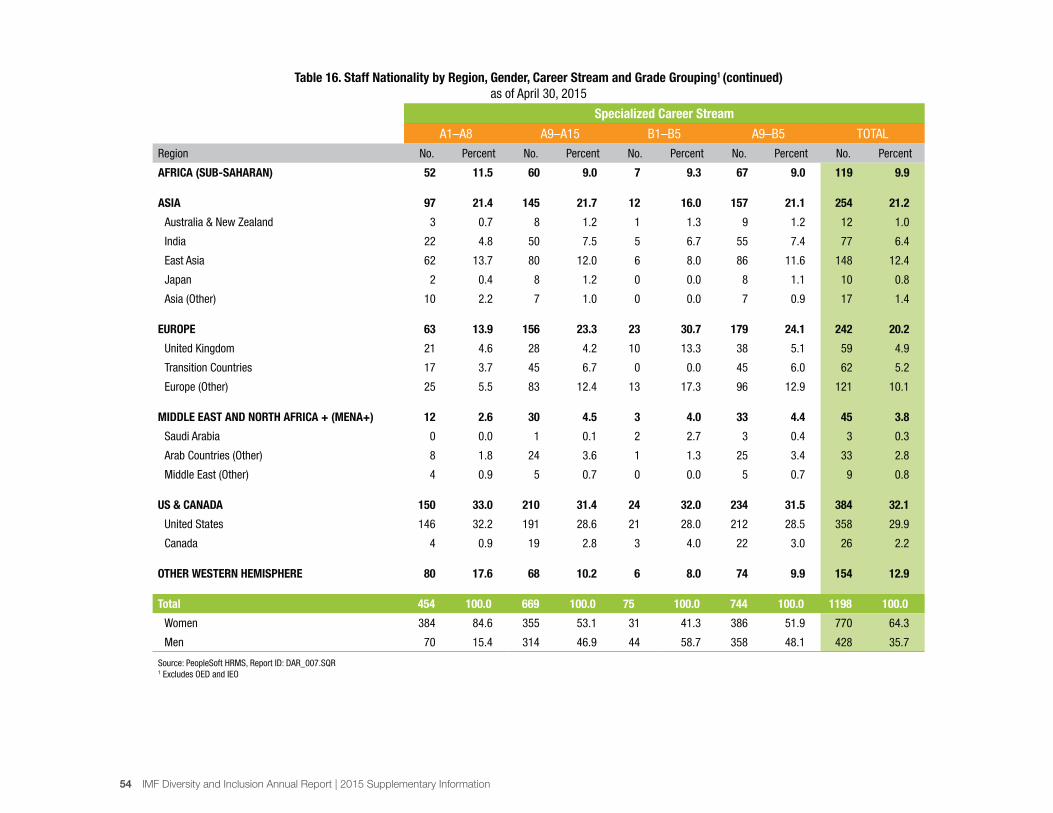
Table 16. Staff Nationality by Region, Gender, Career Stream and Grade Grouping1 (continued)
as of April 30, 2015
Specialized Career Stream
A1–A8 A9–A15 B1–B5 A9–B5 TOTAL
Region No. Percent No. Percent No. Percent No. Percent No. Percent
AFRICA (SUB-SAHARAN) 52 11.5 60 9.0 7 9.3 67 9.0 119 9.9
ASIA 97 21.4 145 21.7 12 16.0 157 21.1 254 21.2
Australia & New Zealand 3 0.7 8 1.2 1 1.3 9 1.2 12 1.0
India 22 4.8 50 7.5 5 6.7 55 7.4 77 6.4
East Asia 62 13.7 80 12.0 6 8.0 86 11.6 148 12.4
Japan 2 0.4 8 1.2 0 0.0 8 1.1 10 0.8
Asia (Other) 10 2.2 7 1.0 0 0.0 7 0.9 17 1.4
EUROPE 63 13.9 156 23.3 23 30.7 179 24.1 242 20.2
United Kingdom 21 4.6 28 4.2 10 13.3 38 5.1 59 4.9
Transition Countries 17 3.7 45 6.7 0 0.0 45 6.0 62 5.2
Europe (Other) 25 5.5 83 12.4 13 17.3 96 12.9 121 10.1
MIDDLE EAST AND NORTH AFRICA + (MENA+) 12 2.6 30 4.5 3 4.0 33 4.4 45 3.8
Saudi Arabia 0 0.0 1 0.1 2 2.7 3 0.4 3 0.3
Arab Countries (Other) 8 1.8 24 3.6 1 1.3 25 3.4 33 2.8
Middle East (Other) 4 0.9 5 0.7 0 0.0 5 0.7 9 0.8
US & CANADA 150 33.0 210 31.4 24 32.0 234 31.5 384 32.1
United States 146 32.2 191 28.6 21 28.0 212 28.5 358 29.9
Canada 4 0.9 19 2.8 3 4.0 22 3.0 26 2.2
OTHER WESTERN HEMISPHERE 80 17.6 68 10.2 6 8.0 74 9.9 154 12.9
Total 454 100.0 669 100.0 75 100.0 744 100.0 1198 100.0
Women 384 84.6 355 53.1 31 41.3 386 51.9 770 64.3
Men 70 15.4 314 46.9 44 58.7 358 48.1 428 35.7
Source: PeopleSoft HRMS, Report ID: DAR_007.SQR1 Excludes OED and IEO
54 IMF Diversity and Inclusion Annual Report | 2015 Supplementary Information

Table 17. Nationality of Contractual Employees By Region, Gender, Career Stream and Grade Grouping1
as of April 30, 2015
Total Economists Specialized Career Stream
Professional Support Total Professional Support Professional Support Total
Region No. Percent No. Percent No. Percent No. Percent No. Percent No. Percent No. Percent No. Percent
AFRICA (SUB-SAHARAN) 18 5.3 19 5.6 37 5.5 11 8.4 n.a. n.a. 7 3.4 19 5.6 26 4.8
ASIA 53 15.6 67 19.8 120 17.7 27 20.6 n.a. n.a. 26 12.5 67 19.8 93 17.0
Australia & New Zealand 11 3.2 2 0.6 13 1.9 8 6.1 n.a. n.a. 3 1.4 2 0.6 5 0.9
India 8 2.4 9 2.7 17 2.5 0 0.0 n.a. n.a. 8 3.8 9 2.7 17 3.1
East Asia 34 10.0 54 16.0 88 13.0 19 14.5 n.a. n.a. 15 7.2 54 16.0 69 12.6
Japan 11 3.2 5 1.5 16 2.4 8 6.1 n.a. n.a. 3 1.4 5 1.5 8 1.5
Asia (Other) 0 2 0.6 2 0.3 0 0.0 n.a. n.a. 0 0.0 2 0.6 2 0.4
EUROPE 121 35.7 36 10.7 157 23.2 64 48.9 n.a. n.a. 57 27.4 36 10.7 93 17.0
United Kingdom 19 5.6 3 0.9 22 3.2 9 6.9 n.a. n.a. 10 4.8 3 0.9 13 2.4
Transition Countries 28 8.3 17 5.0 45 6.6 9 6.9 n.a. n.a. 19 9.1 17 5.0 36 6.6
Europe (Other) 74 21.8 16 4.7 90 13.3 46 35.1 n.a. n.a. 28 13.5 16 4.7 44 8.1
MIDDLE EAST AND NORTH AFRICA + (MENA+) 16 4.7 12 3.6 28 4.1 6 4.6 n.a. n.a. 10 4.8 12 3.6 22 4.0
Saudi Arabia 3 0.9 1 0.3 4 0.6 2 1.5 n.a. n.a. 1 0.5 1 0.3 2 0.4
Arab Countries (Other) 11 3.2 8 2.4 19 2.8 3 2.3 n.a. n.a. 8 3.8 8 2.4 16 2.9
Middle East (Other) 2 0.6 3 0.9 5 0.7 1 0.8 n.a. n.a. 1 0.5 3 0.9 4 0.7
US & CANADA 94 27.7 161 47.6 255 37.7 11 8.4 n.a. n.a. 83 39.9 161 47.6 244 44.7
United States 81 23.9 156 46.2 237 35.0 7 5.3 n.a. n.a. 74 35.6 156 46.2 230 42.1
Canada 13 3.8 5 1.5 18 2.7 4 3.1 n.a. n.a. 9 4.3 5 1.5 14 2.6
OTHER WESTERN HEMISPHERE 37 10.9 43 12.7 80 11.8 12 9.2 n.a. n.a. 25 12.0 43 12.7 68 12.5
Total 339 100.0 338 100.0 677 100.0 131 100.0 n.a. n.a. 208 100.0 338 100.0 546 100.0
Women 114 33.6 201 59.5 315 46.5 25 19.1 n.a. n.a. 89 42.8 201 59.5 290 53.1
Men 225 66.4 137 40.5 362 53.5 106 80.9 n.a. n.a. 119 57.2 137 40.5 256 46.9
Source: PeopleSoft HRMS, Report ID: DAR_007.SQR1 Excludes OED, IEO, and Fund Technical Assistance Officers
IMF Diversity and Inclusion Annual Report | 2015 Supplementary Information 55

Table 18. Nationality Distribution List: Staff and Contractual Employees1
as of April 30, 2015
Staff Contractual
Total A01–A08 A09–A15 B01–B05 Professional Support
Country No. Percent No. Percent No. Percent No. Percent No. Percent No. Percent
Angola 0 0.0 0 0.0 0 0.0 0 0.0 0 0.0 0 0.0
Benin 8 0.2 2 0.4 5 0.3 1 0.3 0 0.0 0 0.0
Botswana 1 0.0 0 0.0 1 0.1 0 0.0 0 0.0 0 0.0
Burkina Faso 9 0.3 2 0.4 6 0.3 0 0.0 1 0.3 0 0.0
Burundi 1 0.0 0 0.0 1 0.1 0 0.0 0 0.0 0 0.0
Cameroon 15 0.4 1 0.2 10 0.6 0 0.0 1 0.3 3 0.9
Cape Verde 0 0.0 0 0.0 0 0.0 0 0.0 0 0.0 0 0.0
Central African Republic 1 0.0 0 0.0 1 0.1 0 0.0 0 0.0 0 0.0
Chad 0 0.0 0 0.0 0 0.0 0 0.0 0 0.0 0 0.0
Comoros 1 0.0 1 0.2 0 0.0 0 0.0 0 0.0 0 0.0
Congo, Dem. Republic 7 0.2 2 0.4 5 0.3 0 0.0 0 0.0 0 0.0
Congo, Rep. 1 0.0 0 0.0 1 0.1 0 0.0 0 0.0 0 0.0
Cote D’Ivoire 8 0.2 4 0.9 3 0.2 0 0.0 0 0.0 1 0.3
Equatorial Guinea 0 0.0 0 0.0 0 0.0 0 0.0 0 0.0 0 0.0
Eritrea 0 0.0 0 0.0 0 0.0 0 0.0 0 0.0 0 0.0
Ethiopia 8 0.2 2 0.4 5 0.3 1 0.3 0 0.0 0 0.0
Gabon 2 0.1 0 0.0 0 0.0 0 0.0 1 0.3 1 0.3
Gambia, The 4 0.1 0 0.0 0 0.0 2 0.6 1 0.3 1 0.3
Ghana 23 0.7 11 2.4 9 0.5 1 0.3 0 0.0 2 0.6
Guinea 4 0.1 0 0.0 2 0.1 0 0.0 1 0.3 1 0.3
Guinea-Bissau 2 0.1 0 0.0 1 0.1 0 0.0 1 0.3 0 0.0
Kenya 21 0.6 4 0.9 11 0.6 3 0.9 0 0.0 3 0.9
Lesotho 0 0.0 0 0.0 0 0.0 0 0.0 0 0.0 0 0.0
Liberia 4 0.1 1 0.2 1 0.1 2 0.6 0 0.0 0 0.0
Madagascar 3 0.1 2 0.4 1 0.1 0 0.0 0 0.0 0 0.0
Malawi 7 0.2 1 0.2 3 0.2 1 0.3 0 0.0 2 0.6
Mali 2 0.1 0 0.0 2 0.1 0 0.0 0 0.0 0 0.0
Mauritius 12 0.4 5 1.1 4 0.2 2 0.6 0 0.0 1 0.3
Mozambique 2 0.1 0 0.0 2 0.1 0 0.0 0 0.0 0 0.0
56 IMF Diversity and Inclusion Annual Report | 2015 Supplementary Information

Table 18. Nationality Distribution List: Staff and Contractual Employees1 (continued)
as of April 30, 2015
Staff Contractual
Total A01–A08 A09–A15 B01–B05 Professional Support
Country No. Percent No. Percent No. Percent No. Percent No. Percent No. Percent
Namibia 1 0.0 0 0.0 1 0.1 0 0.0 0 0.0 0 0.0
Niger 1 0.0 0 0.0 1 0.1 0 0.0 0 0.0 0 0.0
Nigeria 15 0.4 3 0.7 10 0.6 0 0.0 1 0.3 1 0.3
Rwanda 4 0.1 0 0.0 3 0.2 0 0.0 1 0.3 0 0.0
Sao Tome and Principe 0 0.0 0 0.0 0 0.0 0 0.0 0 0.0 0 0.0
Senegal 15 0.4 1 0.2 12 0.7 0 0.0 2 0.5 0 0.0
Seychelles 0 0.0 0 0.0 0 0.0 0 0.0 0 0.0 0 0.0
Sierra Leone 9 0.3 4 0.9 5 0.3 0 0.0 0 0.0 0 0.0
South Africa 27 0.8 0 0.0 21 1.2 3 0.9 3 0.8 0 0.0
South Sudan 0 0.0 0 0.0 0 0.0 0 0.0 0 0.0 0 0.0
Swaziland 0 0.0 0 0.0 0 0.0 0 0.0 0 0.0 0 0.0
Tanzania 3 0.1 1 0.2 1 0.1 0 0.0 1 0.3 0 0.0
Togo 4 0.1 2 0.4 2 0.1 0 0.0 0 0.0 0 0.0
Uganda 11 0.3 1 0.2 8 0.4 1 0.3 1 0.3 0 0.0
Zambia 6 0.2 0 0.0 3 0.2 2 0.6 1 0.3 0 0.0
Zimbabwe 11 0.3 1 0.2 5 0.3 0 0.0 2 0.5 3 0.9
Africa (Sub-Saharan) 253 7.5 51 11.2 146 8.1 19 5.5 18 4.6 19 5.5
Source: PeopleSoft HRMS, Report ID: NAT_001.SQR1 Excludes OED and IEO
IMF Diversity and Inclusion Annual Report | 2015 Supplementary Information 57

Table 18. Nationality Distribution List: Staff and Contractual Employees1 (continued)
as of April 30, 2015
Staff Contractual
Total A01–A08 A09–A15 B01–B05 Professional Support
Country No. Percent No. Percent No. Percent No. Percent No. Percent No. Percent
Australia 33 1.0 2 0.4 16 0.9 4 1.2 9 2.3 2 0.6
Bangladesh 11 0.3 2 0.4 8 0.4 1 0.3 0 0.0 0 0.0
Bhutan 0 0.0 0 0.0 0 0.0 0 0.0 0 0.0 0 0.0
Brunei Darussalam 0 0.0 0 0.0 0 0.0 0 0.0 0 0.0 0 0.0
Cambodia 4 0.1 0 0.0 4 0.2 0 0.0 0 0.0 0 0.0
China 146 4.4 8 1.8 93 5.1 6 1.7 11 2.8 28 8.1
Fiji 0 0.0 0 0.0 0 0.0 0 0.0 0 0.0 0 0.0
Hong Kong SAR 5 0.2 0 0.0 4 0.2 0 0.0 0 0.0 1 0.3
India 144 4.3 22 4.9 83 4.6 20 5.8 9 2.3 10 2.9
Indonesia 11 0.3 3 0.7 5 0.3 0 0.0 3 0.8 0 0.0
Japan 71 2.1 2 0.4 48 2.7 5 1.4 11 2.8 5 1.5
Kiribati 0 0.0 0 0.0 0 0.0 0 0.0 0 0.0 0 0.0
Korea, Republic Of 37 1.1 3 0.7 24 1.3 2 0.6 3 0.8 5 1.5
Lao PDR 0 0.0 0 0.0 0 0.0 0 0.0 0 0.0 0 0.0
Macau SAR 0 0.0 0 0.0 0 0.0 0 0.0 0 0.0 0 0.0
Malaysia 19 0.6 0 0.0 16 0.9 2 0.6 1 0.3 0 0.0
Maldives 0 0.0 0 0.0 0 0.0 0 0.0 0 0.0 0 0.0
Marshall Is. 0 0.0 0 0.0 0 0.0 0 0.0 0 0.0 0 0.0
Micronesia 0 0.0 0 0.0 0 0.0 0 0.0 0 0.0 0 0.0
Mongolia 2 0.1 1 0.2 0 0.0 0 0.0 0 0.0 1 0.3
Myanmar 2 0.1 1 0.2 1 0.1 0 0.0 0 0.0 0 0.0
Nepal 7 0.2 2 0.4 2 0.1 2 0.6 0 0.0 1 0.3
New Zealand 20 0.6 1 0.2 13 0.7 4 1.2 2 0.5 0 0.0
Palau 0 0.0 0 0.0 0 0.0 0 0.0 0 0.0 0 0.0
Papua New Guinea 0 0.0 0 0.0 0 0.0 0 0.0 0 0.0 0 0.0
Philippines 68 2.0 42 9.3 18 1.0 0 0.0 2 0.5 6 1.7
Samoa 0 0.0 0 0.0 0 0.0 0 0.0 0 0.0 0 0.0
Singapore 17 0.5 0 0.0 7 0.4 2 0.6 2 0.5 6 1.7
Solomon Is 0 0.0 0 0.0 0 0.0 0 0.0 0 0.0 0 0.0
58 IMF Diversity and Inclusion Annual Report | 2015 Supplementary Information
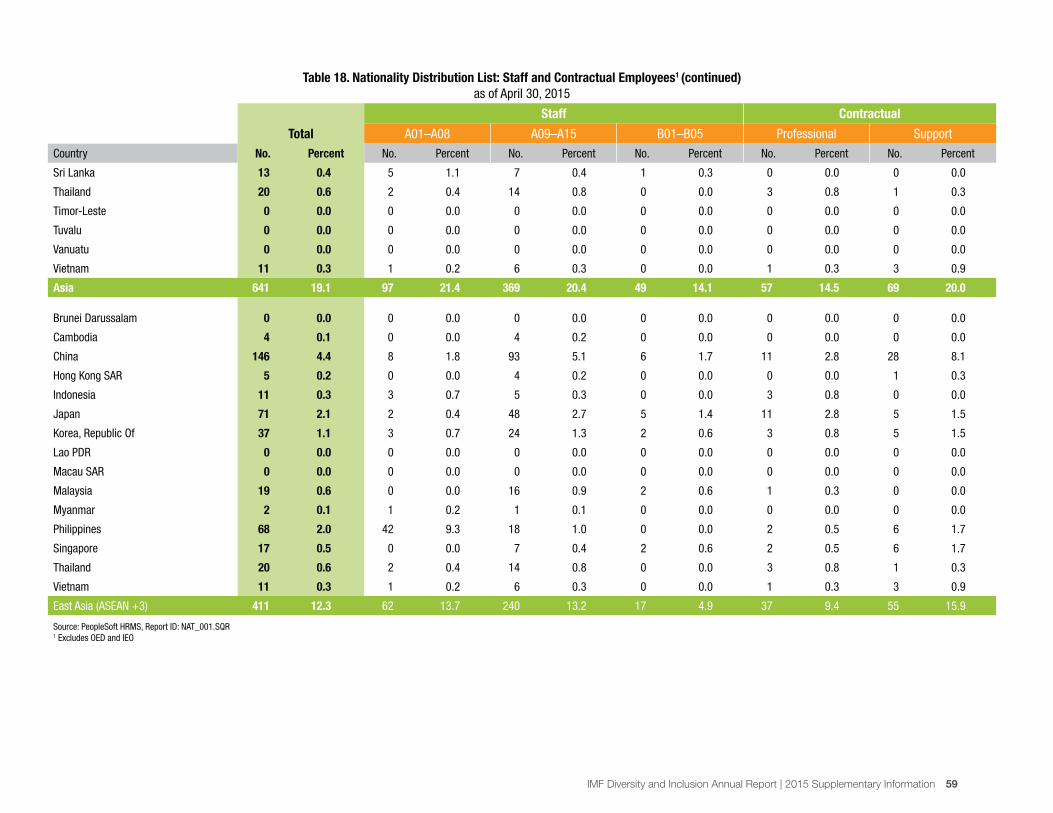
Table 18. Nationality Distribution List: Staff and Contractual Employees1 (continued)
as of April 30, 2015
Staff Contractual
Total A01–A08 A09–A15 B01–B05 Professional Support
Country No. Percent No. Percent No. Percent No. Percent No. Percent No. Percent
Sri Lanka 13 0.4 5 1.1 7 0.4 1 0.3 0 0.0 0 0.0
Thailand 20 0.6 2 0.4 14 0.8 0 0.0 3 0.8 1 0.3
Timor-Leste 0 0.0 0 0.0 0 0.0 0 0.0 0 0.0 0 0.0
Tuvalu 0 0.0 0 0.0 0 0.0 0 0.0 0 0.0 0 0.0
Vanuatu 0 0.0 0 0.0 0 0.0 0 0.0 0 0.0 0 0.0
Vietnam 11 0.3 1 0.2 6 0.3 0 0.0 1 0.3 3 0.9
Asia 641 19.1 97 21.4 369 20.4 49 14.1 57 14.5 69 20.0
Brunei Darussalam 0 0.0 0 0.0 0 0.0 0 0.0 0 0.0 0 0.0
Cambodia 4 0.1 0 0.0 4 0.2 0 0.0 0 0.0 0 0.0
China 146 4.4 8 1.8 93 5.1 6 1.7 11 2.8 28 8.1
Hong Kong SAR 5 0.2 0 0.0 4 0.2 0 0.0 0 0.0 1 0.3
Indonesia 11 0.3 3 0.7 5 0.3 0 0.0 3 0.8 0 0.0
Japan 71 2.1 2 0.4 48 2.7 5 1.4 11 2.8 5 1.5
Korea, Republic Of 37 1.1 3 0.7 24 1.3 2 0.6 3 0.8 5 1.5
Lao PDR 0 0.0 0 0.0 0 0.0 0 0.0 0 0.0 0 0.0
Macau SAR 0 0.0 0 0.0 0 0.0 0 0.0 0 0.0 0 0.0
Malaysia 19 0.6 0 0.0 16 0.9 2 0.6 1 0.3 0 0.0
Myanmar 2 0.1 1 0.2 1 0.1 0 0.0 0 0.0 0 0.0
Philippines 68 2.0 42 9.3 18 1.0 0 0.0 2 0.5 6 1.7
Singapore 17 0.5 0 0.0 7 0.4 2 0.6 2 0.5 6 1.7
Thailand 20 0.6 2 0.4 14 0.8 0 0.0 3 0.8 1 0.3
Vietnam 11 0.3 1 0.2 6 0.3 0 0.0 1 0.3 3 0.9
East Asia (ASEAN +3) 411 12.3 62 13.7 240 13.2 17 4.9 37 9.4 55 15.9
Source: PeopleSoft HRMS, Report ID: NAT_001.SQR1 Excludes OED and IEO
IMF Diversity and Inclusion Annual Report | 2015 Supplementary Information 59

Table 18. Nationality Distribution List: Staff and Contractual Employees1 (continued)
as of April 30, 2015
Staff Contractual
Total A01–A08 A09–A15 B01–B05 Professional Support
Country No. Percent No. Percent No. Percent No. Percent No. Percent No. Percent
Albania 8 0.2 0 0.0 6 0.3 0 0.0 0 0.0 2 0.6
Armenia 17 0.5 1 0.2 13 0.7 0 0.0 2 0.5 1 0.3
Aruba 0 0.0 0 0.0 0 0.0 0 0.0 0 0.0 0 0.0
Austria 12 0.4 1 0.2 6 0.3 3 0.9 2 0.5 0 0.0
Azerbaijan 4 0.1 0 0.0 4 0.2 0 0.0 0 0.0 0 0.0
Belarus 8 0.2 3 0.7 5 0.3 0 0.0 0 0.0 0 0.0
Belgium 39 1.2 2 0.4 25 1.4 6 1.7 4 1.0 2 0.6
Bermuda 0 0.0 0 0.0 0 0.0 0 0.0 0 0.0 0 0.0
Bosnia and Herzegovina 0 0.0 0 0.0 0 0.0 0 0.0 0 0.0 0 0.0
British Virg 0 0.0 0 0.0 0 0.0 0 0.0 0 0.0 0 0.0
Bulgaria 25 0.8 2 0.4 16 0.9 3 0.9 0 0.0 4 1.2
Cayman Islds 0 0.0 0 0.0 0 0.0 0 0.0 0 0.0 0 0.0
Croatia 5 0.2 0 0.0 4 0.2 0 0.0 1 0.3 0 0.0
Cyprus 7 0.2 0 0.0 7 0.4 0 0.0 0 0.0 0 0.0
Czech Republic 19 0.6 0 0.0 12 0.7 2 0.6 5 1.3 0 0.0
Denmark 17 0.5 0 0.0 11 0.6 3 0.9 3 0.8 0 0.0
Estonia 6 0.2 1 0.2 4 0.2 0 0.0 1 0.3 0 0.0
Finland 10 0.3 0 0.0 5 0.3 1 0.3 1 0.3 3 0.9
France 136 4.1 8 1.8 81 4.5 15 4.3 28 7.1 4 1.2
Georgia 8 0.2 0 0.0 6 0.3 0 0.0 2 0.5 0 0.0
Germany 103 3.1 1 0.2 67 3.7 28 8.1 5 1.3 2 0.6
Greece 12 0.4 0 0.0 5 0.3 6 1.7 0 0.0 1 0.3
Hungary 8 0.2 0 0.0 6 0.3 0 0.0 2 0.5 0 0.0
Iceland 6 0.2 0 0.0 5 0.3 0 0.0 1 0.3 0 0.0
Ireland 25 0.8 4 0.9 11 0.6 5 1.4 5 1.3 0 0.0
Israel 3 0.1 0 0.0 2 0.1 0 0.0 1 0.3 0 0.0
Italy 88 2.6 4 0.9 53 2.9 19 5.5 12 3.1 0 0.0
Kazakhstan 5 0.2 0 0.0 4 0.2 0 0.0 0 0.0 1 0.3
Kosovo 0 0.0 0 0.0 0 0.0 0 0.0 0 0.0 0 0.0
60 IMF Diversity and Inclusion Annual Report | 2015 Supplementary Information

Table 18. Nationality Distribution List: Staff and Contractual Employees1 (continued)
as of April 30, 2015
Staff Contractual
Total A01–A08 A09–A15 B01–B05 Professional Support
Country No. Percent No. Percent No. Percent No. Percent No. Percent No. Percent
Kyrgyz Republic 2 0.1 0 0.0 2 0.1 0 0.0 0 0.0 0 0.0
Latvia 4 0.1 0 0.0 3 0.2 0 0.0 1 0.3 0 0.0
Lithuania 1 0.0 0 0.0 0 0.0 0 0.0 0 0.0 1 0.3
Luxembourg 1 0.0 0 0.0 1 0.1 0 0.0 0 0.0 0 0.0
Macedonia 2 0.1 0 0.0 1 0.1 0 0.0 0 0.0 1 0.3
Malta 3 0.1 0 0.0 3 0.2 0 0.0 0 0.0 0 0.0
Moldova 9 0.3 1 0.2 6 0.3 0 0.0 1 0.3 1 0.3
Montenegro 2 0.1 0 0.0 1 0.1 0 0.0 0 0.0 1 0.3
Netherlands 35 1.0 1 0.2 18 1.0 9 2.6 6 1.5 1 0.3
Nethr Antil 0 0.0 0 0.0 0 0.0 0 0.0 0 0.0 0 0.0
Norway 10 0.3 0 0.0 6 0.3 2 0.6 2 0.5 0 0.0
Poland 25 0.8 4 0.9 18 1.0 1 0.3 2 0.5 0 0.0
Portugal 13 0.4 1 0.2 8 0.4 1 0.3 3 0.8 0 0.0
Romania 18 0.5 1 0.2 17 0.9 0 0.0 0 0.0 0 0.0
Russia 54 1.6 3 0.7 33 1.8 2 0.6 12 3.1 4 1.2
San Marino 0 0.0 0 0.0 0 0.0 0 0.0 0 0.0 0 0.0
Serbia 2 0.1 1 0.2 1 0.1 0 0.0 0 0.0 0 0.0
Slovak Republic 5 0.2 0 0.0 2 0.1 1 0.3 2 0.5 0 0.0
Slovenia 1 0.0 0 0.0 1 0.1 0 0.0 0 0.0 0 0.0
Spain 48 1.4 1 0.2 36 2.0 5 1.4 6 1.5 0 0.0
Sweden 14 0.4 1 0.2 8 0.4 1 0.3 3 0.8 1 0.3
Switzerland 12 0.4 1 0.2 9 0.5 1 0.3 1 0.3 0 0.0
Tajikistan 2 0.1 0 0.0 2 0.1 0 0.0 0 0.0 0 0.0
Turkey 33 1.0 0 0.0 28 1.6 3 0.9 1 0.3 1 0.3
Turkmenistan 1 0.0 0 0.0 0 0.0 0 0.0 1 0.3 0 0.0
U.K. 147 4.4 21 4.6 66 3.6 38 11.0 19 4.8 3 0.9
Ukraine 11 0.3 0 0.0 7 0.4 1 0.3 2 0.5 1 0.3
Uzbekistan 4 0.1 0 0.0 3 0.2 0 0.0 0 0.0 1 0.3
Europe 1,030 30.7 63 13.9 638 35.2 156 45.0 137 34.8 36 10.4
Source: PeopleSoft HRMS, Report ID: NAT_001.SQR1 Excludes OED and IEO
IMF Diversity and Inclusion Annual Report | 2015 Supplementary Information 61
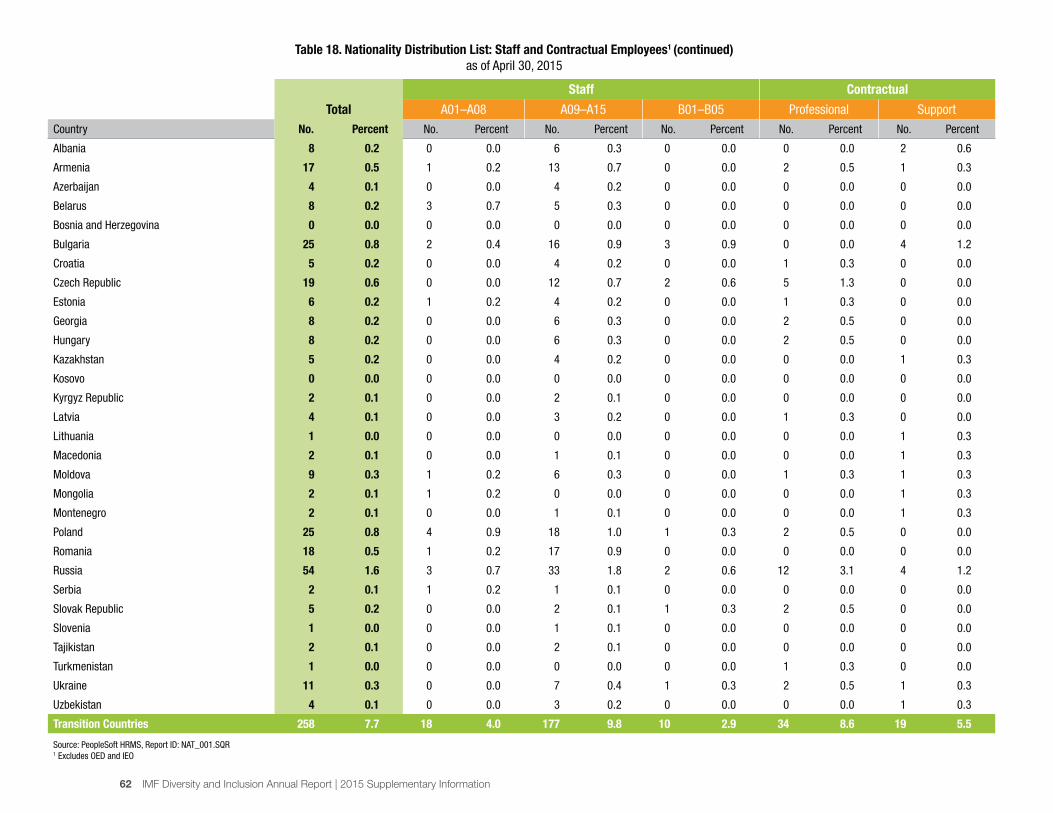
Table 18. Nationality Distribution List: Staff and Contractual Employees1 (continued)
as of April 30, 2015
Staff Contractual
Total A01–A08 A09–A15 B01–B05 Professional Support
Country No. Percent No. Percent No. Percent No. Percent No. Percent No. Percent
Albania 8 0.2 0 0.0 6 0.3 0 0.0 0 0.0 2 0.6
Armenia 17 0.5 1 0.2 13 0.7 0 0.0 2 0.5 1 0.3
Azerbaijan 4 0.1 0 0.0 4 0.2 0 0.0 0 0.0 0 0.0
Belarus 8 0.2 3 0.7 5 0.3 0 0.0 0 0.0 0 0.0
Bosnia and Herzegovina 0 0.0 0 0.0 0 0.0 0 0.0 0 0.0 0 0.0
Bulgaria 25 0.8 2 0.4 16 0.9 3 0.9 0 0.0 4 1.2
Croatia 5 0.2 0 0.0 4 0.2 0 0.0 1 0.3 0 0.0
Czech Republic 19 0.6 0 0.0 12 0.7 2 0.6 5 1.3 0 0.0
Estonia 6 0.2 1 0.2 4 0.2 0 0.0 1 0.3 0 0.0
Georgia 8 0.2 0 0.0 6 0.3 0 0.0 2 0.5 0 0.0
Hungary 8 0.2 0 0.0 6 0.3 0 0.0 2 0.5 0 0.0
Kazakhstan 5 0.2 0 0.0 4 0.2 0 0.0 0 0.0 1 0.3
Kosovo 0 0.0 0 0.0 0 0.0 0 0.0 0 0.0 0 0.0
Kyrgyz Republic 2 0.1 0 0.0 2 0.1 0 0.0 0 0.0 0 0.0
Latvia 4 0.1 0 0.0 3 0.2 0 0.0 1 0.3 0 0.0
Lithuania 1 0.0 0 0.0 0 0.0 0 0.0 0 0.0 1 0.3
Macedonia 2 0.1 0 0.0 1 0.1 0 0.0 0 0.0 1 0.3
Moldova 9 0.3 1 0.2 6 0.3 0 0.0 1 0.3 1 0.3
Mongolia 2 0.1 1 0.2 0 0.0 0 0.0 0 0.0 1 0.3
Montenegro 2 0.1 0 0.0 1 0.1 0 0.0 0 0.0 1 0.3
Poland 25 0.8 4 0.9 18 1.0 1 0.3 2 0.5 0 0.0
Romania 18 0.5 1 0.2 17 0.9 0 0.0 0 0.0 0 0.0
Russia 54 1.6 3 0.7 33 1.8 2 0.6 12 3.1 4 1.2
Serbia 2 0.1 1 0.2 1 0.1 0 0.0 0 0.0 0 0.0
Slovak Republic 5 0.2 0 0.0 2 0.1 1 0.3 2 0.5 0 0.0
Slovenia 1 0.0 0 0.0 1 0.1 0 0.0 0 0.0 0 0.0
Tajikistan 2 0.1 0 0.0 2 0.1 0 0.0 0 0.0 0 0.0
Turkmenistan 1 0.0 0 0.0 0 0.0 0 0.0 1 0.3 0 0.0
Ukraine 11 0.3 0 0.0 7 0.4 1 0.3 2 0.5 1 0.3
Uzbekistan 4 0.1 0 0.0 3 0.2 0 0.0 0 0.0 1 0.3
Transition Countries 258 7.7 18 4.0 177 9.8 10 2.9 34 8.6 19 5.5
Source: PeopleSoft HRMS, Report ID: NAT_001.SQR1 Excludes OED and IEO
62 IMF Diversity and Inclusion Annual Report | 2015 Supplementary Information

Table 18. Nationality Distribution List: Staff and Contractual Employees1 (continued)
as of April 30, 2015
Staff Contractual
Total A01–A08 A09–A15 B01–B05 Professional Support
Country No. Percent No. Percent No. Percent No. Percent No. Percent No. Percent
Afghanistan 2 0.1 2 0.4 0 0.0 0 0.0 0 0.0 0 0.0
Algeria 10 0.3 2 0.4 5 0.3 1 0.3 1 0.3 1 0.3
Bahrain 0 0.0 0 0.0 0 0.0 0 0.0 0 0.0 0 0.0
Djibouti 0 0.0 0 0.0 0 0.0 0 0.0 0 0.0 0 0.0
Egypt 26 0.8 0 0.0 17 0.9 2 0.6 4 1.0 3 0.9
Iran 15 0.5 1 0.2 11 0.6 1 0.3 0 0.0 2 0.6
Iraq 0 0.0 0 0.0 0 0.0 0 0.0 0 0.0 0 0.0
Jordan 12 0.4 0 0.0 9 0.5 2 0.6 1 0.3 0 0.0
Kuwait 0 0.0 0 0.0 0 0.0 0 0.0 0 0.0 0 0.0
Lebanon 22 0.7 1 0.2 14 0.8 2 0.6 5 1.3 0 0.0
Libya 1 0.0 1 0.2 0 0.0 0 0.0 0 0.0 0 0.0
Mauritania 3 0.1 1 0.2 1 0.1 1 0.3 0 0.0 0 0.0
Morocco 15 0.5 2 0.4 6 0.3 3 0.9 2 0.5 2 0.6
Oman 0 0.0 0 0.0 0 0.0 0 0.0 0 0.0 0 0.0
Pakistan 16 0.5 1 0.2 10 0.6 2 0.6 2 0.5 1 0.3
Qatar 0 0.0 0 0.0 0 0.0 0 0.0 0 0.0 0 0.0
Saudi Arabia 12 0.4 0 0.0 5 0.3 3 0.9 3 0.8 1 0.3
Somalia 0 0.0 0 0.0 0 0.0 0 0.0 0 0.0 0 0.0
Sudan 2 0.1 0 0.0 1 0.1 0 0.0 0 0.0 1 0.3
Syrian Arab Republic 3 0.1 1 0.2 0 0.0 2 0.6 0 0.0 0 0.0
Tunisia 6 0.2 0 0.0 6 0.3 0 0.0 0 0.0 0 0.0
United Arab Emirates 0 0.0 0 0.0 0 0.0 0 0.0 0 0.0 0 0.0
Yemen 1 0.0 0 0.0 0 0.0 0 0.0 0 0.0 1 0.3
Middle East and North Africa + (MENA+) 146 4.4 12 2.6 85 4.7 19 5.5 18 4.6 12 3.5
Source: PeopleSoft HRMS, Report ID: NAT_001.SQR1 Excludes OED and IEO
IMF Diversity and Inclusion Annual Report | 2015 Supplementary Information 63

Table 18. Nationality Distribution List: Staff and Contractual Employees1 (continued)
as of April 30, 2015
Staff Contractual
Total A01–A08 A09–A15 B01–B05 Professional Support
Country No. Percent No. Percent No. Percent No. Percent No. Percent No. Percent
United States 774 23.1 146 32.2 300 16.6 66 19.0 104 26.4 158 45.8
Canada 93 2.8 4 0.9 52 2.9 13 3.8 18 4.6 6 1.7
US and Canada 867 25.9 150 33.0 352 19.4 79 22.8 122 31.0 164 47.5
Source: PeopleSoft HRMS, Report ID: NAT_001.SQR1 Excludes OED and IEO
64 IMF Diversity and Inclusion Annual Report | 2015 Supplementary Information

Table 18. Nationality Distribution List: Staff and Contractual Employees1 (continued)
as of April 30, 2015
Staff Contractual
Total A01–A08 A09–A15 B01–B05 Professional Support
Country No. Percent No. Percent No. Percent No. Percent No. Percent No. Percent
Anguilla 0 0.0 0 0.0 0 0.0 0 0.0 0 0.0 0 0.0
Antigua 0 0.0 0 0.0 0 0.0 0 0.0 0 0.0 0 0.0
Argentina 61 1.8 5 1.1 41 2.3 3 0.9 8 2.0 4 1.2
Bahamas 3 0.1 2 0.4 0 0.0 0 0.0 0 0.0 1 0.3
Barbados 4 0.1 0 0.0 3 0.2 0 0.0 1 0.3 0 0.0
Belize 1 0.0 0 0.0 1 0.1 0 0.0 0 0.0 0 0.0
Bolivia 18 0.5 7 1.5 4 0.2 1 0.3 3 0.8 3 0.9
Brazil 70 2.1 13 2.9 39 2.2 2 0.6 11 2.8 5 1.5
Chile 11 0.3 1 0.2 4 0.2 2 0.6 3 0.8 1 0.3
Colombia 38 1.1 2 0.4 27 1.5 0 0.0 2 0.5 7 2.0
Costa Rica 7 0.2 2 0.4 4 0.2 0 0.0 0 0.0 1 0.3
Dominic Rep 3 0.1 0 0.0 1 0.1 0 0.0 1 0.3 1 0.3
Dominica 0 0.0 0 0.0 0 0.0 0 0.0 0 0.0 0 0.0
Ecuador 11 0.3 2 0.4 8 0.4 1 0.3 0 0.0 0 0.0
El Salvador 9 0.3 3 0.7 5 0.3 1 0.3 0 0.0 0 0.0
Grenada 3 0.1 1 0.2 2 0.1 0 0.0 0 0.0 0 0.0
Guatemala 8 0.2 5 1.1 2 0.1 0 0.0 0 0.0 1 0.3
Guyana 4 0.1 1 0.2 1 0.1 0 0.0 1 0.3 1 0.3
Haiti 7 0.2 4 0.9 2 0.1 0 0.0 0 0.0 1 0.3
Honduras 10 0.3 3 0.7 2 0.1 0 0.0 0 0.0 5 1.5
Jamaica 16 0.5 5 1.1 5 0.3 4 1.2 1 0.3 1 0.3
Mexico 30 0.9 0 0.0 15 0.8 4 1.2 5 1.3 6 1.7
Montserrat 0 0.0 0 0.0 0 0.0 0 0.0 0 0.0 0 0.0
Nicaragua 1 0.0 0 0.0 1 0.1 0 0.0 0 0.0 0 0.0
Panama 2 0.1 0 0.0 2 0.1 0 0.0 0 0.0 0 0.0
Paraguay 2 0.1 0 0.0 1 0.1 1 0.3 0 0.0 0 0.0
Peru 55 1.6 19 4.2 27 1.5 3 0.9 1 0.3 5 1.5
St. Kitts 1 0.0 0 0.0 1 0.1 0 0.0 0 0.0 0 0.0
St. Lucia 2 0.1 0 0.0 2 0.1 0 0.0 0 0.0 0 0.0
St. Vincent 3 0.1 0 0.0 3 0.2 0 0.0 0 0.0 0 0.0
Suriname 0 0.0 0 0.0 0 0.0 0 0.0 0 0.0 0 0.0
Trin-Tobago 4 0.1 0 0.0 4 0.2 0 0.0 0 0.0 0 0.0
IMF Diversity and Inclusion Annual Report | 2015 Supplementary Information 65

Table 18. Nationality Distribution List: Staff and Contractual Employees1 (concluded)
as of April 30, 2015
Staff Contractual
Total A01–A08 A09–A15 B01–B05 Professional Support
Country No. Percent No. Percent No. Percent No. Percent No. Percent No. Percent
Uruguay 17 0.5 3 0.7 9 0.5 2 0.6 3 0.8 0 0.0
Venezuela 10 0.3 2 0.4 4 0.2 1 0.3 1 0.3 2 0.6
Other Western Hemisphere 411 12.3 80 17.6 220 12.1 25 7.2 41 10.4 45 13.0
Source: PeopleSoft HRMS, Report ID: NAT_001.SQR1 Excludes OED and IEO
66 IMF Diversity and Inclusion Annual Report | 2015 Supplementary Information

Table 19. Distribution of Pipeline Grade A9–B5, Share of Grade by Gender and Region1
as of April 30, 2015
Women Men All Fund
Africa
(Sub-Saharan) Asia East Asia
Grade No. Percent No. Percent No. Percent No. Percent No. Percent No. Percent
ECONOMISTS
A09 n.a. n.a. n.a. n.a. n.a. n.a. n.a. n.a. n.a. n.a. n.a. n.a.
A10 n.a. n.a. n.a. n.a. n.a. n.a. n.a. n.a. n.a. n.a. n.a. n.a.
A11 46 11.7 78 7.6 124 8.8 10 10.0 44 16.9 33 19.3
A12 58 14.7 73 7.1 131 9.3 16 16.0 35 13.4 34 19.9
A13 57 14.5 117 11.5 174 12.3 10 10.0 38 14.6 31 18.1
A14 124 31.5 373 36.5 497 35.1 40 40.0 75 28.7 54 31.6
A15 58 14.7 159 15.6 217 15.3 11 11.0 32 12.3 8 4.7
B01 10 2.5 31 3.0 41 2.9 2 2.0 7 2.7 3 1.8
B02 19 4.8 84 8.2 103 7.3 6 6.0 8 3.1 3 1.8
B03 13 3.3 47 4.6 60 4.2 2 2.0 9 3.4 2 1.2
B04 7 1.8 48 4.7 55 3.9 2 2.0 9 3.4 2 1.2
B05 2 0.5 11 1.1 13 0.9 1 1.0 4 1.5 1 0.6
Total 394 100.0 1,021 100.0 1,415 100.0 100 100.0 261 100.0 171 100.0
SPECIALIZED CAREER STREAM
A09 59 15.3 17 4.7 76 10.2 6 9.0 20 12.7 13 15.1
A10 60 15.5 32 8.9 92 12.4 8 11.9 15 9.6 12 14.0
A11 66 17.1 50 14.0 116 15.6 10 14.9 27 17.2 13 15.1
A12 57 14.8 72 20.1 129 17.3 15 22.4 35 22.3 17 19.8
A13 62 16.1 71 19.8 133 17.9 12 17.9 27 17.2 16 18.6
A14 39 10.1 54 15.1 93 12.5 9 13.4 15 9.6 8 9.3
A15 12 3.1 18 5.0 30 4.0 0 0.0 6 3.8 1 1.2
B01 11 2.8 11 3.1 22 3.0 2 3.0 4 2.5 1 1.2
B02 8 2.1 15 4.2 23 3.1 1 1.5 6 3.8 3 3.5
B03 7 1.8 5 1.4 12 1.6 1 1.5 1 0.6 1 1.2
B04 3 0.8 7 2.0 10 1.3 3 4.5 0 0.0 0 0.0
B05 2 0.5 6 1.7 8 1.1 0 0.0 1 0.6 1 1.2
Total 386 100.0 358 100.0 744 100.0 67 100.0 157 100.0 86 100.0
Source: PeopleSoft HRMS; Report ID: DAR_017.SQR1 Excludes OED and IEO
IMF Diversity and Inclusion Annual Report | 2015 Supplementary Information 67

Table 19. Distribution of Pipeline Grade A9–B5, Share of Grade by Gender and Region1 (continued)
as of April 30, 2015
Europe United Kingdom
Middle East and
North Africa + (MENA+) Arab Countries US & Canada
Other Western
Hemisphere
Grade No. Percent No. Percent No. Percent No. Percent No. Percent No. Percent
ECONOMISTS
A09 n.a. n.a. n.a. n.a. n.a. n.a. n.a. n.a. n.a. n.a. n.a. n.a.
A10 n.a. n.a. n.a. n.a. n.a. n.a. n.a. n.a. n.a. n.a. n.a. n.a.
A11 45 7.3 3 4.5 7 10.1 4 8.0 6 3.0 12 7.0
A12 53 8.6 4 6.1 9 13.0 6 12.0 10 5.1 8 4.7
A13 78 12.6 3 4.5 11 15.9 10 20.0 16 8.1 21 12.3
A14 209 33.9 18 27.3 19 27.5 14 28.0 73 37.1 81 47.4
A15 99 16.0 10 15.2 8 11.6 4 8.0 37 18.8 30 17.5
B01 21 3.4 4 6.1 4 5.8 3 6.0 6 3.0 1 0.6
B02 48 7.8 7 10.6 5 7.2 5 10.0 28 14.2 8 4.7
B03 25 4.1 4 6.1 4 5.8 4 8.0 13 6.6 7 4.1
B04 34 5.5 12 18.2 2 2.9 0 0.0 6 3.0 2 1.2
B05 5 0.8 1 1.5 0 0.0 0 0.0 2 1.0 1 0.6
Total 617 100.0 66 100.0 69 100.0 50 100.0 197 100.0 171 100.0
SPECIALIZED CAREER STREAM
A09 22 12.3 3 7.9 4 12.1 4 14.3 13 5.6 11 14.9
A10 15 8.4 5 13.2 6 18.2 5 17.9 32 13.7 16 21.6
A11 25 14.0 1 2.6 2 6.1 0 0.0 38 16.2 14 18.9
A12 23 12.8 5 13.2 5 15.2 5 17.9 42 17.9 9 12.2
A13 33 18.4 9 23.7 5 15.2 4 14.3 46 19.7 10 13.5
A14 28 15.6 5 13.2 6 18.2 5 17.9 28 12.0 7 9.5
A15 10 5.6 0 0.0 2 6.1 2 7.1 11 4.7 1 1.4
B01 5 2.8 0 0.0 2 6.1 2 7.1 7 3.0 2 2.7
B02 7 3.9 4 10.5 0 0.0 0 0.0 8 3.4 1 1.4
B03 3 1.7 0 0.0 1 3.0 1 3.6 5 2.1 1 1.4
B04 4 2.2 3 7.9 0 0.0 0 0.0 1 0.4 2 2.7
B05 4 2.2 3 7.9 0 0.0 0 0.0 3 1.3 0 0.0
Total 179 100.0 38 100.0 33 100.0 28 100.0 234 100.0 74 100.0
Source: PeopleSoft HRMS; Report ID: DAR_017.SQR1 Excludes OED and IEO
68 IMF Diversity and Inclusion Annual Report | 2015 Supplementary Information

Table 20. Historical Share of Women and Men by Career Stream and Grade Grouping1
as of April 30, 2015 for each fiscal year
Total A1–A8 A9–A15 B1–B5
Women Men Women Men Women Men Women Men
No. Percent No. Percent No. Percent No. Percent No. Percent No. Percent No. Percent No. Percent
ECONOMISTS
2015 394 27.8 1,021 72.2 n.a. n.a. n.a. n.a. 343 30.0 800 70.0 51 18.8 221 81.3
2014 390 27.9 1,008 72.1 n.a. n.a. n.a. n.a. 336 29.8 792 70.2 54 20.0 216 80.0
2013 374 27.5 988 72.5 n.a. n.a. n.a. n.a. 322 29.5 770 70.5 52 19.3 218 80.7
2012 350 26.1 991 73.9 n.a. n.a. n.a. n.a. 306 28.1 783 71.9 44 17.5 208 82.5
2011 336 25.6 977 74.4 n.a. n.a. n.a. n.a. 293 27.4 775 72.6 43 17.6 202 82.4
2010 319 25.1 953 74.9 n.a. n.a. n.a. n.a. 278 27.3 741 72.7 41 16.2 212 83.8
2009 297 24.2 930 75.8 n.a. n.a. n.a. n.a. 261 27.1 703 72.9 36 13.7 227 86.3
2008 295 22.9 993 77.1 n.a. n.a. n.a. n.a. 262 26.0 746 74.0 33 11.8 247 88.2
2007 292 22.4 1,012 77.6 n.a. n.a. n.a. n.a. 259 25.5 757 74.5 33 11.5 255 88.5
2006 288 21.9 1,029 78.1 n.a. n.a. n.a. n.a. 254 24.7 773 75.3 34 11.7 256 88.3
2005 282 21.6 1,025 78.4 n.a. n.a. n.a. n.a. 250 24.9 756 75.1 32 10.6 269 89.4
SPECIALIZED CAREER STREAM
2015 770 64.3 428 35.7 384 84.6 70 15.4 355 53.1 314 46.9 31 41.3 44 58.7
2014 763 64.6 418 35.4 388 84.7 70 15.3 349 53.4 305 46.6 26 37.7 43 62.3
2013 745 64.5 410 35.5 390 85.5 66 14.5 334 52.5 302 47.5 21 33.3 42 66.7
2012 740 64.2 412 35.8 400 85.8 66 14.2 317 51.3 301 48.7 23 33.8 45 66.2
2011 732 65.1 393 34.9 405 86.0 66 14.0 302 51.9 280 48.1 25 34.7 47 65.3
2010 736 66.1 377 33.9 419 85.9 69 14.1 294 52.5 266 47.5 23 35.4 42 64.6
2009 813 68.5 373 31.5 496 87.2 73 12.8 295 53.2 259 46.8 22 34.9 41 65.1
2008 894 69.0 402 31.0 558 87.7 78 12.3 314 53.1 277 46.9 22 31.9 47 68.1
2007 934 68.7 426 31.3 589 87.1 87 12.9 320 52.1 294 47.9 25 35.7 45 64.3
2006 950 68.2 442 31.8 604 86.5 94 13.5 322 51.6 302 48.4 24 34.3 46 65.7
2005 956 68.5 440 31.5 603 85.4 103 14.6 330 53.2 290 46.8 23 32.9 47 67.1
TOTAL
2015 1,164 44.5 1,449 55.5 384 84.6 70 15.4 698 38.5 1,114 61.5 82 23.6 265 76.4
2014 1,153 44.7 1,426 55.3 388 84.7 70 15.3 685 38.4 1,097 61.6 80 23.6 259 76.4
2013 1,119 44.5 1,398 55.5 390 85.5 66 14.5 656 38.0 1,072 62.0 73 21.9 260 78.1
2012 1,090 43.7 1,403 56.3 400 85.8 66 14.2 623 36.5 1,084 63.5 67 20.9 253 79.1
2011 1,068 43.8 1,370 56.2 405 86.0 66 14.0 595 36.1 1,055 63.9 68 21.5 249 78.5
2010 1,055 44.2 1,330 55.8 419 85.9 69 14.1 572 36.2 1,007 63.8 64 20.1 254 79.9
2009 1,110 46.0 1,303 54.0 496 87.2 73 12.8 556 36.6 962 63.4 58 17.8 268 82.2
2008 1,189 46.0 1,395 54.0 558 87.7 78 12.3 576 36.0 1,023 64.0 55 15.8 294 84.2
2007 1,226 46.0 1,438 54.0 589 87.1 87 12.9 579 35.5 1,051 64.5 58 16.2 300 83.8
2006 1,238 45.7 1,471 54.3 604 86.5 94 13.5 576 34.9 1,075 65.1 58 16.1 302 83.9
2005 1,238 45.8 1,465 54.2 603 85.4 103 14.6 580 35.7 1,046 64.3 55 14.8 316 85.2
Source: PeopleSoft HRMS, Report ID: DAR_8N9.SQR1 Excludes OED and IEO
69 IMF Diversity and Inclusion Annual Report | 2015 Supplementary Information

Table 21. Distribution of A9-B5 Staff by Region by Department1
as of April 30, 2015
Total A9–B5 A9–A15 B1–B5
Africa Asia Europe
Middle
East
US and
Canada
Other
Western
Hemisphere Africa Asia Europe
Middle
East
US and
Canada
Other
Western
Hemisphere Africa Asia Europe
Middle
East
US and
Canada
Other
Western
Hemisphere
Percent Percent Percent Percent Percent Percent Percent Percent Percent Percent Percent Percent Percent Percent Percent Percent Percent Percent
Fund All 7.7 19.4 36.9 4.7 20.0 11.3 8.1 20.4 35.3 4.6 19.4 12.1 5.8 14.1 45.0 5.2 22.8 7.2
AREA
DEPARTMENTS
AFR 19.9 9.9 42.4 3.1 9.9 14.7 19.9 12.2 38.5 3.8 9.6 16.0 20.0 0.0 60.0 0.0 11.4 8.6
APD2 1.0 45.5 32.7 1.0 10.9 8.9 1.3 49.4 31.6 1.3 6.3 10.1 0.0 31.8 36.4 0.0 27.3 4.5
EUR3 1.6 19.7 54.6 3.8 14.8 5.5 2.0 22.1 52.3 4.7 12.1 6.7 0.0 8.8 64.7 0.0 26.5 0.0
MCD 8.9 7.3 45.5 16.3 12.2 9.8 9.1 9.1 45.5 13.1 12.1 11.1 8.3 0.0 45.8 29.2 12.5 4.2
WHD 5.6 13.7 40.3 1.6 15.3 23.4 6.8 12.6 39.8 1.9 15.5 23.3 0.0 19.0 42.9 0.0 14.3 23.8
FUNCTIONAL
DEPARTMENTS
FAD 12.6 16.1 44.8 2.1 14.0 10.5 13.8 16.3 43.9 1.6 13.0 11.4 5.0 15.0 50.0 5.0 20.0 5.0
FIN 10.4 19.8 37.5 3.1 20.8 8.3 10.8 19.3 34.9 3.6 21.7 9.6 7.7 23.1 53.8 0.0 15.4 0.0
ICD4 4.3 14.9 37.2 6.4 20.2 17.0 5.1 15.2 38.0 6.3 15.2 20.3 0.0 13.3 33.3 6.7 46.7 0.0
LEG 4.8 15.9 33.3 4.8 25.4 15.9 3.7 16.7 33.3 5.6 25.9 14.8 11.1 11.1 33.3 0.0 22.2 22.2
MCM 2.4 22.8 37.9 4.4 19.4 13.1 2.8 23.9 35.8 4.5 19.9 13.1 0.0 16.7 50.0 3.3 16.7 13.3
RES 1.1 23.2 40.0 3.2 17.9 14.7 1.3 23.8 41.3 3.8 12.5 17.5 0.0 20.0 33.3 0.0 46.7 0.0
SPR5 8.1 26.2 34.9 6.0 13.4 11.4 8.1 26.8 35.0 5.7 13.0 11.4 7.7 23.1 34.6 7.7 15.4 11.5
STA 7.7 22.2 31.6 0.9 23.1 14.5 8.7 23.3 30.1 1.0 21.4 15.5 0.0 14.3 42.9 0.0 35.7 7.1
SUPPORT
DEPARTMENTS
CEF 0.0 0.0 0.0 100.0 0.0 0.0 0.0 0.0 0.0 100.0 0.0 0.0 0.0 0.0 0.0 100.0 0.0 0.0
COM 12.8 11.5 32.1 5.1 30.8 7.7 12.5 9.4 29.7 6.3 32.8 9.4 14.3 21.4 42.9 0.0 21.4 0.0
ETO 0.0 0.0 0.0 0.0 100.0 0.0 0.0 0.0 0.0 0.0 0.0 0.0 0.0 0.0 0.0 0.0 100.0 0.0
HRD 10.2 13.6 32.2 5.1 27.1 11.9 12.0 14.0 30.0 4.0 28.0 12.0 0.0 11.1 44.4 11.1 22.2 11.1
OMD6 4.8 19.0 42.9 2.4 31.0 0.0 3.7 25.9 40.7 0.0 29.6 0.0 6.7 6.7 46.7 6.7 33.3 0.0
SEC 2.6 23.7 18.4 5.3 34.2 15.8 3.4 27.6 13.8 3.4 34.5 17.2 0.0 11.1 33.3 11.1 33.3 11.1
TGS 9.6 23.3 17.1 7.1 37.5 5.4 9.4 23.2 17.0 6.7 38.4 5.4 12.5 25.0 18.8 12.5 25.0 6.3
Source: PeopleSoft HRMS, Report ID: DAR_004.SQR1 Excludes OED and IEO
2 APD Includes OAP 3 EUR Includes EUO
4 ICD Includes JAI, JVI and STI 5 SPR Includes UNO
6 OMD Includes DMD,INV,OBP,and OIAIMF Diversity and Inclusion Annual Report | 2015 Supplementary Information 70

Table 22. Share of Women by Department and Grade Grouping1
as of April 30, 2015
Staff Contractual
A1–A8 A09–A15 B01–B05 A09–B05 Professional Support Total Women Fund All Share of Women
No. Percent No. Percent No. Percent No. Percent No. Percent No. Percent No. No. Percent
Fund All 384 84.6 698 38.5 81 23.4 779 36.1 129 33.1 204 59.3 1,496 3,346 44.7
Area Departments 97 90.7 175 29.9 31 22.8 206 28.5 12 54.5 49 52.7 364 944 38.6
AFR 24 85.7 34 21.8 8 22.9 42 22.0 0 0.0 9 37.5 75 249 30.1
APD2 15 93.8 24 30.4 4 18.2 28 27.7 7 77.8 15 83.3 65 144 45.1
EUR3 29 87.9 53 35.6 8 23.5 61 33.3 0 0.0 8 72.7 98 228 43.0
MCD 14 93.3 31 31.3 6 25.0 37 30.1 5 83.3 11 52.4 67 165 40.6
WHD 15 100.0 33 32.0 5 23.8 38 30.6 0 0.0 6 31.6 59 158 37.3
Functional Departments 167 84.8 330 40.2 28 19.7 358 37.2 51 23.8 109 60.2 685 1,555 44.1
FAD 16 84.2 42 34.1 3 15.0 45 31.5 12 24.0 24 58.5 97 253 38.3
FIN 26 89.7 43 51.8 3 23.1 46 47.9 2 28.6 10 62.5 84 148 56.8
ICD4 34 87.2 26 32.9 6 40.0 32 34.0 7 41.2 21 61.8 94 184 51.1
LEG 12 100.0 27 50.0 4 44.4 31 49.2 8 38.1 5 71.4 56 103 54.4
MCM 24 88.9 70 39.8 5 16.7 75 36.4 6 14.6 15 62.5 120 298 40.3
RES 11 84.6 27 33.8 0 0.0 27 28.4 9 17.3 15 62.5 62 184 33.7
SPR5 25 92.6 52 42.3 4 15.4 56 37.6 3 60.0 10 52.6 94 200 47.0
STA 19 61.3 43 41.7 3 21.4 46 39.3 4 19.0 9 56.3 78 185 42.2
Support Departments 120 80.0 193 47.7 22 32.4 215 45.5 66 42.9 46 65.7 447 847 52.8
ATB 0 0.0 0 0.0 0 0.0 0 0.0 1 100.0 1 100.0 2 2 100.0
ATI 0 0.0 0 0.0 0 0.0 0 0.0 0 0.0 0 0.0 0 0 0.0
COM 16 94.1 41 64.1 6 42.9 47 60.3 6 54.5 5 62.5 74 114 64.9
GRC 0 0.0 0 0.0 0 0.0 0 0.0 0 0.0 1 100.0 1 2 50.0
HRD 26 78.8 28 56.0 5 55.6 33 55.9 5 100.0 25 67.6 89 134 66.4
MDT 0 0.0 0 0.0 0 0.0 0 0.0 1 100.0 1 100.0 2 2 100.0
OMB 0 0.0 0 0.0 0 0.0 0 0.0 1 100.0 0 0.0 1 1 100.0
OMD6 18 90.0 14 51.9 3 20.0 17 40.5 2 50.0 1 33.3 38 69 55.1
SEC 14 77.8 18 62.1 1 11.1 19 50.0 3 42.9 2 33.3 38 69 55.1
TGS 44 73.3 87 38.8 7 43.8 94 39.2 42 38.9 8 80.0 188 418 45.0
Source: PeopleSoft HRMS, Report ID: DAR_004.SQR1 Excludes OED and IEO 2 APD Includes OAP
3 EUR Includes EUO 4 ICD Includes JAI, JVI and STI 5 SPR Includes UNO 6 OMD Includes DMD,INV,OBP,and OIA
71 IMF Diversity and Inclusion Annual Report | 2015 Supplementary Information
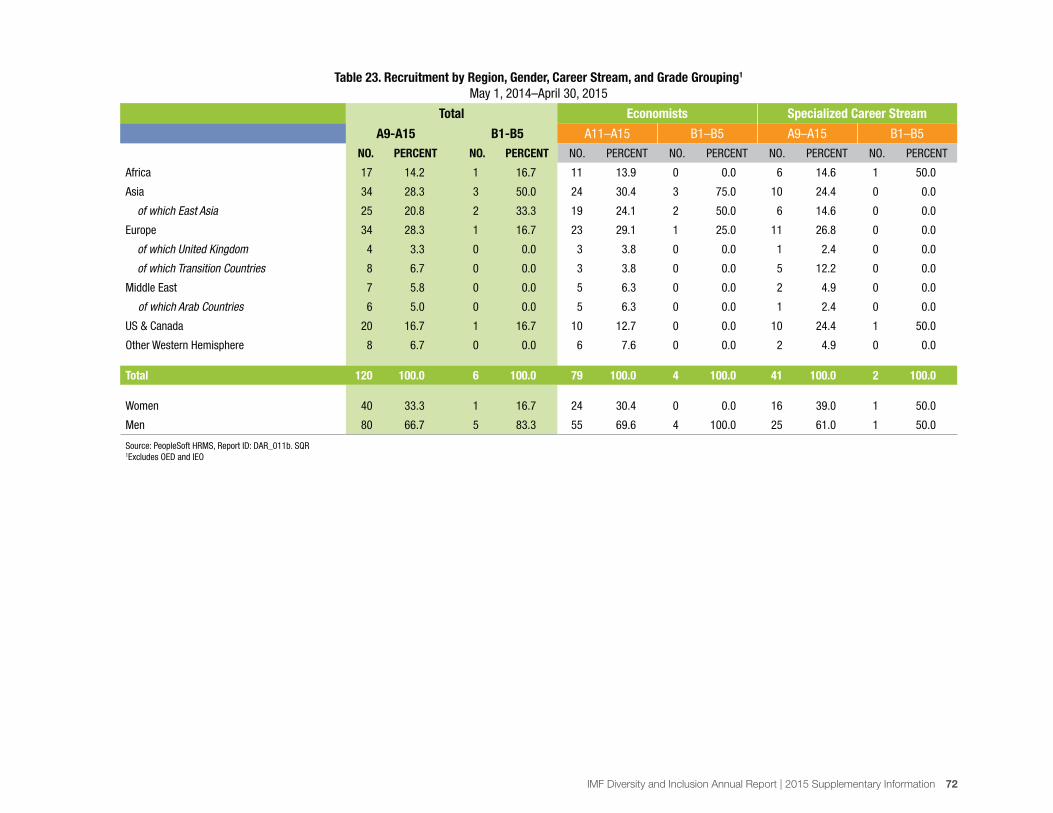
Table 23. Recruitment by Region, Gender, Career Stream, and Grade Grouping1
May 1, 2014–April 30, 2015
Total Economists Specialized Career Stream
A9-A15 B1-B5 A11–A15 B1–B5 A9–A15 B1–B5
NO. PERCENT NO. PERCENT NO. PERCENT NO. PERCENT NO. PERCENT NO. PERCENT
Africa 17 14.2 1 16.7 11 13.9 0 0.0 6 14.6 1 50.0
Asia 34 28.3 3 50.0 24 30.4 3 75.0 10 24.4 0 0.0
of which East Asia 25 20.8 2 33.3 19 24.1 2 50.0 6 14.6 0 0.0
Europe 34 28.3 1 16.7 23 29.1 1 25.0 11 26.8 0 0.0
of which United Kingdom 4 3.3 0 0.0 3 3.8 0 0.0 1 2.4 0 0.0
of which Transition Countries 8 6.7 0 0.0 3 3.8 0 0.0 5 12.2 0 0.0
Middle East 7 5.8 0 0.0 5 6.3 0 0.0 2 4.9 0 0.0
of which Arab Countries 6 5.0 0 0.0 5 6.3 0 0.0 1 2.4 0 0.0
US & Canada 20 16.7 1 16.7 10 12.7 0 0.0 10 24.4 1 50.0
Other Western Hemisphere 8 6.7 0 0.0 6 7.6 0 0.0 2 4.9 0 0.0
Total 120 100.0 6 100.0 79 100.0 4 100.0 41 100.0 2 100.0
Women 40 33.3 1 16.7 24 30.4 0 0.0 16 39.0 1 50.0
Men 80 66.7 5 83.3 55 69.6 4 100.0 25 61.0 1 50.0
Source: PeopleSoft HRMS, Report ID: DAR_011b. SQR1Excludes OED and IEO
IMF Diversity and Inclusion Annual Report | 2015 Supplementary Information 72

Table 24. Five Year History: Recruitment by Region, Gender, Career Stream, and Grade Grouping1
May 1, 2010–April 30, 2015
Total Economists Specialized Career Stream
A9–A15 B1–B5 A11–A15 B1–B5 A9–A15 B1–B5
No. Percent No. Percent No. Percent No. Percent No. Percent No. Percent
Africa 60 9.6 5 13.9 31 7.6 2 8.0 29 13.6 3 27.3
Asia 165 26.5 13 36.1 117 28.7 13 52.0 48 22.4 0 0.0
of which East Asia 126 20.3 12 33.3 95 23.3 12 48.0 31 14.5 0 0.0
Europe 207 33.3 8 22.2 148 36.3 6 24.0 59 27.6 2 18.2
of which United Kingdom 22 3.5 0 0.0 12 2.9 0 0.0 10 4.7 0 0.0
of which Transition Countries 54 8.7 1 2.8 35 8.6 1 4.0 19 8.9 0 0.0
Middle East 37 5.9 4 11.1 25 6.1 1 4.0 12 5.6 3 27.3
of which Arab Countries 30 4.8 4 11.1 19 4.7 1 4.0 11 5.1 3 27.3
US & Canada 92 14.8 5 13.9 43 10.5 2 8.0 49 22.9 3 27.3
Other Western Hemisphere 61 9.8 1 2.8 44 10.8 1 4.0 17 7.9 0 0.0
Total 622 100.0 36 100.0 408 100.0 25 100.0 214 100.0 11 100.0
Women 221 35.5 8 22.2 125 30.6 2 8.0 96 44.9 6 54.5
Men 401 64.5 28 77.8 283 69.4 23 92.0 118 55.1 5 45.5
Source: PeopleSoft HRMS, Report ID: DAR_011b. SQR1 Excludes OED and IEO
73 IMF Diversity and Inclusion Annual Report | 2015 Supplementary Information

Table 25. Staff Promoted By region, Career Stream, and Grade Grouping1
May 1, 2014–April 30, 2015
A1–A8 A9–A12 A13–A15 B1–B5
Stock2 Promotions Stock Promotions Stock Promotions Stock Promotions
No. No. Percent 3 No. No. Percent No. No. Percent No. No. Percent
TOTAL ECONOMISTS AND SPECIALIZED CAREER STREAM
Africa (Sub-Saharan) 52 8 15.4 65 10 15.4 82 9 11.0 20 6 30.0
Asia 97 14 14.4 176 19 10.8 193 25 13.0 49 10 20.4
East Asia 62 11 17.7 122 14 11.5 118 13 11.0 17 4 23.5
Europe 63 4 6.3 183 22 12.0 457 50 10.9 156 29 18.6
of which United Kingdom 21 1 4.8 21 4 19.0 45 3 6.7 38 4 10.5
Middle East and North Africa + (MENA+) 12 0 0.0 33 4 12.1 51 13 25.5 18 5 27.8
of which Arab Countries 8 0 0.0 24 4 16.7 39 8 20.5 15 5 33.3
US & Canada 150 7 4.7 141 14 9.9 211 23 10.9 79 19 24.1
Other Western Hemisphere 80 8 10.0 70 9 12.9 150 14 9.3 25 5 20.0
Total 454 41 9.0 668 78 11.7 1,144 134 11.7 347 74 21.3
Women 384 35 9.1 346 52 15.0 352 60 17.0 82 24 29.3
Men 70 6 8.6 322 26 8.1 792 74 9.3 265 50 18.9
ECONOMISTS
Africa (Sub-Saharan) n.a. n.a. n.a. 26 3 11.5 61 6 9.8 13 4 30.8
Asia n.a. n.a. n.a. 79 11 13.9 145 16 11.0 37 6 16.2
East Asia n.a. n.a. n.a. 67 9 13.4 93 9 9.7 11 1 9.1
Europe n.a. n.a. n.a. 98 8 8.2 386 40 10.4 133 25 18.8
of which United Kingdom n.a. n.a. n.a. 7 0 0.0 31 0 0.0 28 3 10.7
Middle East and North Africa + (MENA+) n.a. n.a. n.a. 16 2 12.5 38 9 23.7 15 5 33.3
of which Arab Countries n.a. n.a. n.a. 10 2 20.0 28 5 17.9 12 5 41.7
US & Canada n.a. n.a. n.a. 16 2 12.5 126 11 8.7 55 14 25.5
Other Western Hemisphere n.a. n.a. n.a. 20 1 5.0 132 10 7.6 19 3 15.8
Total n.a. n.a. n.a. 255 27 10.6 888 92 10.4 272 57 21.0
Women n.a. n.a. n.a. 104 15 14.4 239 34 14.2 51 14 27.5
Men n.a. n.a. n.a. 151 12 7.9 649 58 8.9 221 43 19.5
IMF Diversity and Inclusion Annual Report | 2015 Supplementary Information 74

Table 25. Staff Promoted By region, Career Stream, and Grade Grouping1 (continued)
May 1, 2014–April 30, 2015
A1–A8 A9–A12 A13–A15 B1–B5
Stock2 Promotions Stock Promotions Stock Promotions Stock Promotions
No. No. Percent 3 No. No. Percent No. No. Percent No. No. Percent
SPECIALIZED CAREER STREAM
Africa 52 8 15.4 39 7 17.9 21 3 14.3 7 2 28.6
Asia 97 14 14.4 97 8 8.2 48 9 18.8 12 4 33.3
East Asia 62 11 17.7 55 5 9.1 25 4 16.0 6 3 50.0
Europe 63 4 6.3 85 14 16.5 71 10 14.1 23 4 17.4
of which United Kingdom 21 1 4.8 14 4 28.6 14 3 21.4 10 1 10.0
Middle East 12 0 0.0 17 2 11.8 13 4 30.8 3 0 0.0
of which Arab Countries 8 0 0.0 14 2 14.3 11 3 27.3 3 0 0.0
US & Canada 150 7 4.7 125 12 9.6 85 12 14.1 24 5 20.8
Other Western Hemisphere 80 8 10.0 50 8 16.0 18 4 22.2 6 2 33.3
Total 454 41 9.0 413 51 12.3 256 42 16.4 75 17 22.7
Women 384 35 9.1 242 37 15.3 113 26 23.0 31 10 32.3
Men 70 6 8.6 171 14 8.2 143 16 11.2 44 7 15.9
Source: PeopleSoft HRMS, Report ID: DAR_016b.SQR1 Excludes OED and IEO 2 Total number of staff from each region at each grade group as of 04/30/2015 3 Percent of staff promoted of stock from that region
75 IMF Diversity and Inclusion Annual Report | 2015 Supplementary Information
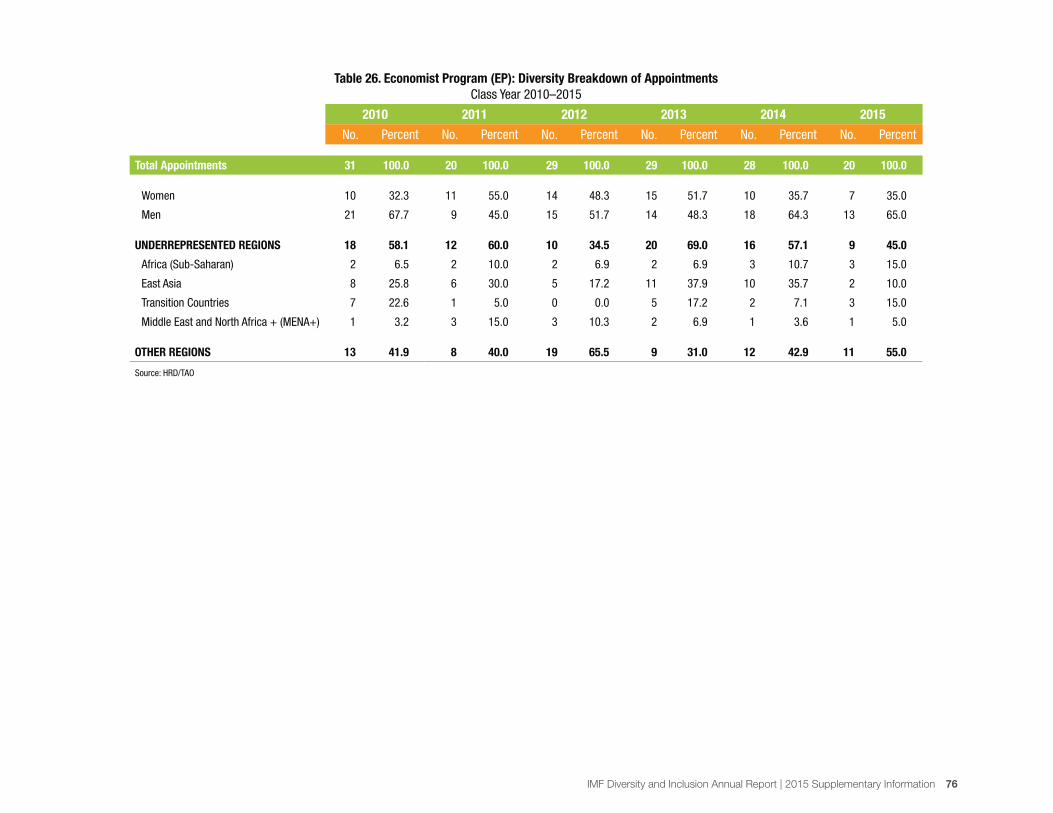
Table 26. Economist Program (EP): Diversity Breakdown of Appointments
Class Year 2010–2015
2010 2011 2012 2013 2014 2015
No. Percent No. Percent No. Percent No. Percent No. Percent No. Percent
Total Appointments 31 100.0 20 100.0 29 100.0 29 100.0 28 100.0 20 100.0
Women 10 32.3 11 55.0 14 48.3 15 51.7 10 35.7 7 35.0
Men 21 67.7 9 45.0 15 51.7 14 48.3 18 64.3 13 65.0
UNDERREPRESENTED REGIONS 18 58.1 12 60.0 10 34.5 20 69.0 16 57.1 9 45.0
Africa (Sub-Saharan) 2 6.5 2 10.0 2 6.9 2 6.9 3 10.7 3 15.0
East Asia 8 25.8 6 30.0 5 17.2 11 37.9 10 35.7 2 10.0
Transition Countries 7 22.6 1 5.0 0 0.0 5 17.2 2 7.1 3 15.0
Middle East and North Africa + (MENA+) 1 3.2 3 15.0 3 10.3 2 6.9 1 3.6 1 5.0
OTHER REGIONS 13 41.9 8 40.0 19 65.5 9 31.0 12 42.9 11 55.0
Source: HRD/TAO
IMF Diversity and Inclusion Annual Report | 2015 Supplementary Information 76

Table 27. EP Recruitment Missions by University
2008–2014
Mission Year
Region University 2008 2009 2010 2011 2012 2013 2014
Africa Univ. of Lagos, Univ. of Ibadan ✓ ✓
University of Cape Town, South Africa ✓ ✓ ✓
University of Dakar ✓ ✓
University of Ibadan, Nigeria ✓
University of Nairobi ✓
University of Pretoria, South Africa ✓ ✓ ✓
Yaounde II University ✓
Addis Ababa University New ✓
Universit of Johannesburg New ✓
Witwatersrand University New ✓
Stellenbosch University New ✓
Asia Chinese University of Hong Kong ✓
International Financial Institutions Career Fair, Seoul, South Korea ✓ ✓ ✓
Fudan University (Shanghai) ✓ ✓ ✓
Hong University of Science and Technology ✓
Korea University ✓ ✓
Kyoto University ✓
Monash University ✓
Peking University (Beijing) ✓ ✓ ✓ ✓ ✓
Seoul National University ✓ ✓
Shanghai University ✓ ✓ ✓
Tokyo University ✓ ✓
Tsinghua University ✓ ✓ ✓
Renmin University New ✓
Keio University New ✓
Hitotsubashi University New ✓
National University of Singapore New ✓
University of Malaysia New ✓
University of Indonesia New ✓
Gadja-Mada University Indonesia New ✓
Middle East King Saud University, Riyadh, Saudi Arabia ✓ ✓
King Abdulaziz University, Jeddah, Saudi Arabia ✓ ✓
University of Kuwait New ✓
American University Sharjah New ✓
Source: Talent Acquisition and Operations Division, HRD
77 IMF Diversity and Inclusion Annual Report | 2015 Supplementary Information

Table 27. EP Recruitment Missions by University (continued)
2008–2014
Mission Year
Region University 2008 2009 2010 2011 2012 2013 2014
Europe Bocconni University ✓ ✓ ✓
Catholic University Louvain ✓
Center for Economic Research and Graduate Education (CERGE-EI) ✓ ✓ ✓
Central European University ✓ ✓ ✓
CERDI (Centre d’etudes et de recherches en developpement international) ✓ ✓ ✓ ✓
Corvinius University ✓ ✓ ✓
Erasmus Rotterdam ✓
European University Institute ✓ ✓ ✓
Goethe Univeristy ✓ ✓ ✓ ✓ ✓ ✓
Graduate Institute of International Studies ✓ ✓ ✓ ✓ ✓
Higher School of Economics, Moscow ✓ ✓ ✓
Institut d’Études Politiques de Paris ✓
Kiel Institute ✓ ✓
Maastricht University ✓
Moscow State University New ✓
New Economics School of Moscow New ✓
Moscow State Institute of International Relations ✓ ✓
Paris Dauphine University ✓ ✓ ✓
Paris School of Economics (ENSAE) ✓ ✓ ✓ ✓
Pompeu Fabra ✓ ✓ ✓
Rhenish Friedrich - Wilhelm University Bonn ✓ ✓ ✓
Tilburg University (Netherlands) ✓ ✓ ✓
Universitat Konstanz ✓
University of Amsterdam ✓ ✓
University of Mannheim ✓ ✓
University of St. Gallen ✓
University of Toulouse I ✓ ✓ ✓
University of Warsaw ✓ ✓
University of Zurich ✓
Warsaw School of Economics ✓ ✓
WHU, Otto Beisheim School of Management ✓
United Kingdom London Business School ✓
London School of Economics ✓ ✓ ✓ ✓ ✓ ✓ ✓
University of Cambridge ✓ ✓ ✓ ✓ ✓ ✓ ✓
University of Oxford ✓ ✓ ✓ ✓ ✓ ✓ ✓
University of Warwick ✓ ✓
Source: Talent Acquisition and Operations Division, HRD
IMF Diversity and Inclusion Annual Report | 2015 Supplementary Information 78

Table 27. EP Recruitment Missions by University (concluded)
2008–2014
Mission Year
Region University 2008 2009 2010 2011 2012 2013 2014
South America Escola de Pós-Graduação em Economia (EPGE), Fundação Getulio Vargas ✓ ✓
Pontifícia Universidade Católica do Rio de Janeiro, Rio de Janeiro, Brazil ✓
Universidade de São Paulo, São Paulo, Brazil ✓ ✓
Centro de Investigación y Docencias Económicas (CIDE) (México) New ✓
Instituto Tecnológico Autónomo de México (ITAM) New ✓
United States American Association of Economics ✓ ✓
Boston University ✓ ✓ ✓ ✓ ✓ ✓
Brown University ✓
Columbia University ✓ ✓ ✓ ✓ ✓
Cornell University ✓
Harvard University ✓ ✓ ✓ ✓ ✓ ✓
MIT ✓ ✓ ✓ ✓ ✓ ✓
New York University ✓ ✓ ✓ ✓ ✓
Northwestern University ✓ ✓ ✓ ✓ ✓
Presentation at IMF Headquarters, Washington D.C. for local Universities ✓
Princeton University ✓ ✓ ✓ ✓ ✓
Stanford University ✓ ✓ ✓ ✓ ✓
UC Berkeley ✓ ✓ ✓ ✓ ✓
UCLA ✓ ✓ ✓ ✓ ✓
University of Chicago ✓ ✓ ✓ ✓ ✓
University of Michigan Ann Arbor ✓ ✓ ✓
University of Minnesota ✓ ✓
University of Pennsylvania ✓ ✓ ✓
University of Wisconsin - Milwaukee ✓ ✓ ✓
Yale University ✓ ✓ ✓ ✓
Canada Canadian Economics Employment Exchange including
Franco-phone African students from University of Montreal
✓
McGill University ✓ ✓ ✓
University of British Columbia New ✓
Université de Montréal ✓ ✓ ✓
University of Toronto ✓ ✓ ✓
Source: Talent Acquisition and Operations Division, HRD
79 IMF Diversity and Inclusion Annual Report | 2015 Supplementary Information


![The IMF [Interoperable Master Format]€¦ · IMF Basic Level Essence Up to HD 1920x1080/30/1:1 Stereoscopic Image Support Multi-Channel Audio Data Essence Captions Subtitles Wrapping](https://static.fdocuments.in/doc/165x107/5f33462e25abc14195249f50/the-imf-interoperable-master-format-imf-basic-level-essence-up-to-hd-1920x10803011.jpg)