IMF Country Report No. 16/359 MEXICO · IMF Country Report No. 16/359 MEXICO ... Gross domestic...
77
© 2016 International Monetary Fund IMF Country Report No. 16/359 MEXICO 2016 ARTICLE IV CONSULTATION Under Article IV of the IMF’s Articles of Agreement, the IMF holds bilateral discussions with members, usually every year. In the context of the 2016 Article IV consultation with Mexico, the following documents have been released and are included in this package: A Press Release summarizing the views of the Executive Board as expressed during its November 16, 2016 consideration of the staff report that concluded the Article IV consultation with Mexico. The Staff Report prepared by a staff team of the IMF for the Executive Board’s consideration on November 16, 2016, following discussions that ended on September 30, 2016, with the officials of Mexico on economic developments and policies. Based on information available at the time of these discussions, the staff report was completed on November 4, 2016. An Informational Annex prepared by the IMF staff. A Debt Sustainability Analysis prepared by the staff of the IMF. A Staff Statement of November 11, 2016 updating information on recent developments. The documents listed below have been or will be separately released. Selected Issues The IMF’s transparency policy allows for the deletion of market-sensitive information and premature disclosure of the authorities’ policy intentions in published staff reports and other documents. Copies of this report are available to the public from International Monetary Fund Publication Services PO Box 92780 Washington, D.C. 20090 Telephone: (202) 623-7430 Fax: (202) 623-7201 E-mail: [email protected] Web: http://www.imf.org Price: $18.00 per printed copy International Monetary Fund Washington, D.C. November 2016
Transcript of IMF Country Report No. 16/359 MEXICO · IMF Country Report No. 16/359 MEXICO ... Gross domestic...

© 2016 International Monetary Fund
IMF Country Report No. 16/359
MEXICO 2016 ARTICLE IV CONSULTATION
Under Article IV of the IMF’s Articles of Agreement, the IMF holds bilateral discussions
with members, usually every year. In the context of the 2016 Article IV consultation with
Mexico, the following documents have been released and are included in this package:
A Press Release summarizing the views of the Executive Board as expressed during its
November 16, 2016 consideration of the staff report that concluded the Article IV
consultation with Mexico.
The Staff Report prepared by a staff team of the IMF for the Executive Board’s
consideration on November 16, 2016, following discussions that ended on
September 30, 2016, with the officials of Mexico on economic developments and
policies. Based on information available at the time of these discussions, the staff
report was completed on November 4, 2016.
An Informational Annex prepared by the IMF staff.
A Debt Sustainability Analysis prepared by the staff of the IMF.
A Staff Statement of November 11, 2016 updating information on recent
developments.
The documents listed below have been or will be separately released.
Selected Issues
The IMF’s transparency policy allows for the deletion of market-sensitive information and
premature disclosure of the authorities’ policy intentions in published staff reports and
other documents.
Copies of this report are available to the public from
International Monetary Fund Publication Services
PO Box 92780 Washington, D.C. 20090
Telephone: (202) 623-7430 Fax: (202) 623-7201
E-mail: [email protected] Web: http://www.imf.org
Price: $18.00 per printed copy
International Monetary Fund
Washington, D.C.
November 2016

Press Release No. 16/520
FOR IMMEDIATE RELEASE
November 22, 2016
IMF Executive Board Concludes Article IV Consultation with Mexico
On November 16, 2016, the Executive Board of the International Monetary Fund (IMF)
concluded the Article IV consultation1 with Mexico.
Mexico has navigated successfully a complex external environment, characterized by heightened
global financial market volatility. The economy continues to grow at a moderate pace and
inflation is close to the target. The flexible exchange rate is playing a central role in helping the
economy adjust to external shocks. Macroeconomic policies remain focused on maintaining
strong fundamentals. Continued implementation of the structural reforms agenda should help lift
potential growth over the medium term.
The economy is projected to grow by 2.1 percent in 2016. The main driver of activity remained
private consumption, supported by a rise in remittances and improving labor market conditions.
Weakness on U.S. industrial activity led to lower demand for Mexico’s manufacturing exports,
and a slowdown of investment in machinery and equipment. Growth is expected to remain at a
similar level in 2017, supported by strengthening external demand. Year-on-year headline and
core inflation are close the 3-percent target. There is no evidence of second-round effects from
the exchange rate depreciation and medium-term inflation expectations remain well anchored.
The stance of macroeconomic policies has turned more restrictive. Since last November, the
Bank of Mexico increased the monetary policy rate by cumulative 175 basis points to 4.75
percent. The public sector fiscal deficit will be reduced from 4.1 percent of GDP in 2015 to
3 percent of GDP this year. The authorities are taking measures to strengthen PEMEX’s financial
position through sizable permanent expenditure cuts, a reform of its pension scheme, and
financial assistance from the federal government.
The external sector position remains broadly consistent with medium-term fundamentals and
desirable policy settings. The current account deficit is projected to remain unchanged at about 3
percent of GDP in 2016, as the reduction in the hydrocarbons trade balance has been offset by
1 Under Article IV of the IMF's Articles of Agreement, the IMF holds bilateral discussions with members, usually
every year. A staff team visits the country, collects economic and financial information, and discusses with officials
the country's economic developments and policies. On return to headquarters, the staff prepares a report, which
forms the basis for discussion by the Executive Board.
International Monetary Fund
700 19th Street, NW
Washington, D. C. 20431 USA

2
stronger remittances and net service exports. The net international investment liability position is
sustainable and foreign exchange reserves remain adequate.
Executive Board Assessment2
Executive Directors noted that Mexico continues to grow at a moderate pace despite a
challenging external environment. However, the country remains exposed to external
shocks, including risks of growing protectionism, given its strong financial and trade
linkages with the rest of the world. Directors expressed confidence that Mexico’s strong
fundamentals and policy frameworks will continue to underpin the economy’s resilience,
but urged vigilance to potential shocks. They noted that the Flexible Credit Line
arrangement with the Fund provides additional insurance against tail risks. Continued
implementation of the structural reform agenda and further progress in improving security
and the rule of law should help lift potential growth in the medium term.
Directors welcomed the authorities’ commitment to continued fiscal consolidation.
They emphasized that adhering to the planned fiscal consolidation is critical in order to bring
the ratio of public debt to GDP on a downward path. They welcomed the ongoing efforts to
strengthen the financial viability of the petroleum company (PEMEX), which is an important
element of the consolidation plan. They generally urged the authorities to take advantage of
revenue windfalls, including any future transfers of surplus from the Bank of Mexico, to reduce
the public sector borrowing requirement below target. They also encouraged elimination of
electricity subsidies while protecting vulnerable households through targeted social assistance
programs.
Directors recommended that the authorities consider boosting fiscal revenues in the medium
term to avoid constraining capital spending excessively. Raising pension contributions under
the defined-contribution system would help ensure adequate pension replacement rates and
diminish pressures on public social spending in the future. Directors also encouraged the
authorities to further strengthen the fiscal framework, including improving the link between
desirable levels of public debt and medium-term fiscal deficit targets, and reducing discretion
under the exceptional circumstances clause.
Directors agreed that future monetary policy decisions should remain data-driven and urged the
authorities to be vigilant. Clear communication by the central bank will remain important in
guiding market expectations. Directors emphasized that the flexible exchange rate should
continue to act as the key shock absorber to help the economy adjust to external shocks.
2 At the conclusion of the discussion, the Managing Director, as Chairman of the Board, summarizes the views of
Executive Directors, and this summary is transmitted to the country's authorities. An explanation of any qualifiers
used in summings up can be found here: http://www.imf.org/external/np/sec/misc/qualifiers.htm.

3
Directors welcomed the conclusion of the 2016 Financial Sector Assessment Program that the
balance sheets of financial and non-financial corporations are resilient to adverse shocks. They
noted that enhancing some elements of the crisis-preparedness and deposit insurance frameworks
would ensure an agile and well-coordinated response in times of stress. Strengthening the
independence of the supervisory agencies would also be important. Directors welcomed the staff
clarification that decisions of the Financial Stability Council (CESF) have not been hampered by
political considerations and encouraged the authorities to maintain their efforts in this regard.
Some Directors noted that the appropriate structure and governance of the regulatory and
supervisory framework depends on each country’s circumstances and that there is no one-size-
fits-all model.
Directors welcomed the authorities’ progress on structural reforms. They encouraged continued
efforts to reduce poverty and inequality, increase female labor force participation, and enhance
access to financial services. They supported efforts to improve the efficiency of social spending,
increase access to child-care services, and better enforce anti-discrimination laws in the labor
market. They looked forward to the implementation of the new national strategy for financial
inclusion to improve access to financial services for low-income households and small
enterprises. They also recommended continued efforts to tackle corruption and strengthen the
anti-money laundering framework.

4
Mexico: Selected Economic and Financial Indicators 1/
2012 2013 2014 2015 20162/ 20172/
(Annual percentage changes, unless otherwise indicated)
National accounts and prices Real GDP 4.0 1.4 2.2 2.5 2.1 2.2
GDP per capita in U.S. dollars 3/ 10,137 10,659 10,844 9,452 … …
Gross domestic investment (in percent of GDP) 23.1 21.7 21.5 22.7 22.8 22.7
Gross domestic savings (in percent of GDP) 21.6 19.2 19.5 19.9 19.9 19.9
Consumer price index (period average) 4.1 3.8 4.0 2.7 2.8 3.4
External sector
Exports, f.o.b. 6.1 2.5 4.4 -4.2 -5.2 7.7
Imports, f.o.b. 5.7 2.8 4.9 -1.2 -3.7 7.3
External current account balance (in percent of GDP) -1.4 -2.5 -2.0 -2.9 -2.9 -2.8
Change in net international reserves (end of period, billions of U.S. dollars) 17.8 13.2 15.5 -18.1 -2.2 0.2
Outstanding external debt (in percent of GDP) 29.1 31.4 32.8 36.5 42.0 42.4
Nonfinancial public sector (in percent of GDP)
Government Revenue 23.9 24.3 23.4 23.3 22.5 21.2
Government Expenditure 27.7 28.0 27.9 27.3 25.5 24.1
Augmented overall balance -3.8 -3.7 -4.6 -4.1 -3.0 -2.9
Money and credit
Financial system credit to the non-financial private sector 10.0 9.2 8.7 14.6 13.5 12.0
Broad money (M2a) 8.7 8.3 10.2 7.9 9.8 8.7
1/ Methodological differences mean that the figures in this table may differ from those published by the authorities. 2/ Staff projections. 3/ IMF staff estimates.

MEXICO STAFF REPORT FOR THE 2016 ARTICLE IV CONSULTATION
KEY ISSUES Outlook and Risks: Mexico is confronting a complex external environment characterized by heightened risk of trade protectionism and financial markets volatility. Real GDP growth is projected to moderate to 2.1 percent in 2016, with inflation remaining close to the 3-percent target. Looking ahead, the expected recovery in external demand and investment should support economic activity. The main risks include a rise in global protectionist tendencies, weaker-than-projected growth in the United States, renewed surge in capital flow volatility, and further decline in domestic oil production.
Macroeconomic Policies: Policies and policy frameworks remain very strong. It is critical to continue adhering to the fiscal consolidation plan to maintain market confidence and put the public debt-to-GDP ratio on a downward path. To achieve this goal, the government has to control effectively the growth of public spending and save one-off revenues. Turning PEMEX into a profitable company through a focus on improving the efficiency of core business activities should remain a critical element of the consolidation plan. A pause in monetary policy tightening appears warranted in the near term, given the moderation in economic activity, absence of second-round effects from the depreciation, and limited wage pressures. On the structural front, strengthening the rule of law and raising female labor force participation would help boost potential output and reduce inequality.
Financial System Stability Assessment: The 2016 FSAP recommended strengthening consolidated supervision and the governance of the financial supervisory agencies and the deposit insurance institute. Developing formal contingency plans and simulation exercises will help enhance the crisis preparedness framework. Quantitative credit targets for development banks should be eliminated, and performance should be based in part on indicators of financial inclusion and private sector crowding in.
Advice from previous Article IV Consultations: Consistent with past Fund advice, the authorities maintained their commitment to the fiscal consolidation path over 2015–18. In 2016, they started liberalizing fixed fuel prices, with implied excises near the optimal carbon tax levels proposed by staff. The authorities also discontinued rules-based foreign exchange interventions in favor of discretionary intervention, in line with staff advice.
November 4, 2016

MEXICO
2 INTERNATIONAL MONETARY FUND
Approved By Robert Rennhack and Vivek Arora
Discussions took place in Mexico City during September 19–30, 2016. The team comprised Dora Iakova (head), Alex Klemm, Damien Puy, Fabian Valencia (WHD), Charlotte Lundgren (SPR), Julian Chow (MCM), and Marina Marinkov (FAD). Daniela Muhaj (WHD) contributed from headquarters. Robert Rennhack (WHD) and Ghiath Shabsigh (MCM) attended the concluding meetings. Messrs. Hurtado and Zuñiga-Villaseñor (OED) also participated in the meetings.
CONTENTS
CONTEXT __________________________________________________________________________________________ 4
RECENT DEVELOPMENTS _________________________________________________________________________ 4
OUTLOOK AND RISKS __________________________________________________________________________ 11
KEY POLICY ISSUES _____________________________________________________________________________ 13
A. Fiscal Policy____________________________________________________________________________________ 13
B. Monetary and Exchange Rate Policies _________________________________________________________ 17
C. Financial Stability ______________________________________________________________________________ 19
D. Raising potential output and fostering inclusive growth ______________________________________ 24
SAFEGUARDS ASSESSMENT____________________________________________________________________ 27
STAFF APPRAISAL ______________________________________________________________________________ 27
BOXES 1. Exchange Rate Pass-through Estimates _________________________________________________________ 7 2. Pemex: Key Reforms and Recent Developments ______________________________________________ 10 3. Pension Issues _________________________________________________________________________________ 16 4. Evaluating Mexico’s Monetary Policy Stance __________________________________________________ 18 5. Household and Corporate Sector Balance Sheets: A Health Check ____________________________ 20 6. Results from stress tests of the financial system from the 2016 FSAP _________________________ 23 7. Female Labor Force Participation ______________________________________________________________ 26
FIGURES 1. Real Sector ____________________________________________________________________________________ 30 2. Prices and Inflation ____________________________________________________________________________ 31 3. Financial Sector ________________________________________________________________________________ 32 4. External Sector _________________________________________________________________________________ 33
INTERNATIONAL MONETARY FUND 3
5. Reserve Coverage in an International Perspective, 2015 ______________________________________ 34 6. Banking System ________________________________________________________________________________ 36 7. Labor Market Indicators _______________________________________________________________________ 37 8. Nonfinancial Corporate Sector ________________________________________________________________ 38 9. Fiscal Sector ___________________________________________________________________________________ 39
TABLES 1. Selected Economic, Financial and Social Indicators ____________________________________________ 40 2a. Financial Operations of the Public Sector, Authorities’ Presentation _________________________ 41 2b. Financial Operations of the Public Sector, GFSM 2001 Presentation _________________________ 42 3. Public Sector Financial Balance Sheet _________________________________________________________ 43 4. Summary Balance of Payments ________________________________________________________________ 44 5. Financial Soundness Indicators ________________________________________________________________ 45 6. Financial Indicators and Measures of External Vulnerabilities _________________________________ 46 7. Baseline Medium-Term Projections ___________________________________________________________ 47 8. Net Intersectoral Asset and Liability Positions, 2015 __________________________________________ 48
ANNEXES I. Risk Assessment Matrix ________________________________________________________________________ 49 II. External Sector Assessment ____________________________________________________________________ 50
MEXICO
4 INTERNATIONAL MONETARY FUND
CONTEXT 1. Mexico continues to navigate a complex external environment. The exchange rate has been affected by heightened risks of a rise in protectionism in major trading partners. In the context of elevated external risks, policies in Mexico remain focused on maintaining strong fundamentals and financial stability. The flexible exchange rate continues to play a key role in facilitating adjustment to external shocks. The authorities remain committed to a gradual reduction in the public sector borrowing requirement (PSBR). Financial and non-financial companies’ sector balance sheets are resilient to downside risks, in part due to strong financial sector supervision and regulation.
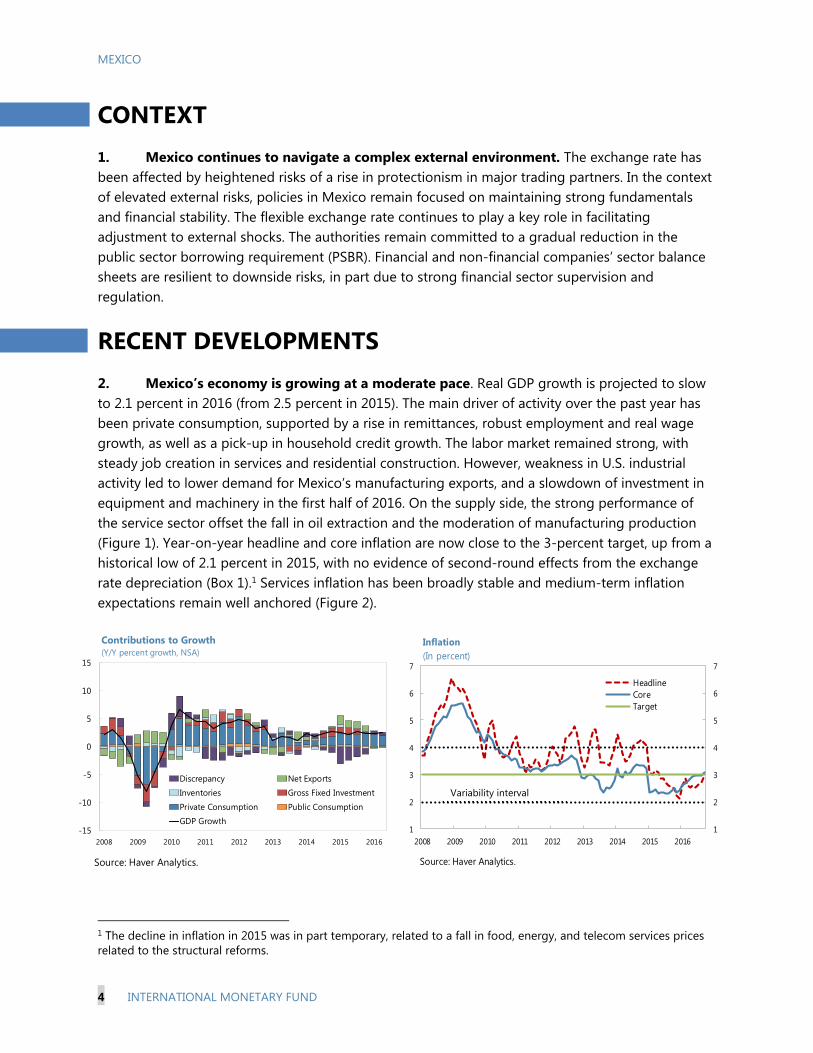
RECENT DEVELOPMENTS 2. Mexico’s economy is growing at a moderate pace. Real GDP growth is projected to slow to 2.1 percent in 2016 (from 2.5 percent in 2015). The main driver of activity over the past year has been private consumption, supported by a rise in remittances, robust employment and real wage growth, as well as a pick-up in household credit growth. The labor market remained strong, with steady job creation in services and residential construction. However, weakness in U.S. industrial activity led to lower demand for Mexico’s manufacturing exports, and a slowdown of investment in equipment and machinery in the first half of 2016. On the supply side, the strong performance of the service sector offset the fall in oil extraction and the moderation of manufacturing production (Figure 1). Year-on-year headline and core inflation are now close to the 3-percent target, up from a historical low of 2.1 percent in 2015, with no evidence of second-round effects from the exchange rate depreciation (Box 1).1 Services inflation has been broadly stable and medium-term inflation expectations remain well anchored (Figure 2).
1 The decline in inflation in 2015 was in part temporary, related to a fall in food, energy, and telecom services prices related to the structural reforms.
-15
-10
-5
0
5
10
15
2008 2009 2010 2011 2012 2013 2014 2015 2016
Discrepancy Net ExportsInventories Gross Fixed Investment
Private Consumption Public ConsumptionGDP Growth
Contributions to Growth(Y/Y percent growth, NSA)
Source: Haver Analytics.
1
2
3
4
5
6
7
1
2
3
4
5
6
7
2008 2009 2010 2011 2012 2013 2014 2015 2016
Inflation(In percent)
HeadlineCoreTarget
Source: Haver Analytics.
Variability interval

MEXICO
INTERNATIONAL MONETARY FUND 5
3. Asset prices in Mexico have been affected by the heightened volatility in global financial markets and uncertainties related to the risk of rising protectionism. As of end-September, the peso had depreciated by about 25 percent vis-à-vis the U.S. dollar over the 2015 average. Foreign exchange implied volatility and bid-ask spreads have also increased. Net portfolio inflows into Mexico turned negative in the second quarter as non-resident investment in short-term government securities declined. More recently, Mexico has benefitted from the strong recovery of capital flows in emerging markets, although the exchange rate remains volatile. The yields on local-currency long-term government bonds have remained broadly stable, and Mexico continues to place sovereign and corporate bonds in international capital markets at low interest rates (Figure 3).2
2 In August, Mexico issued US$2.76 billion bonds at yields of 3.04 percent (10-year) and 4.37 percent (30-year). In February, EUR 2.5 billion were issued at yields of 1.98 (6-year bonds) and 3.42 (15-year bonds).
Source: National authorities; Haver Analytics; Bloomberg, L.P.; and IMF staff calculations.1/ The index is constructed as the weighted average of a set of financial indicators with weights given by the inverse of thestandard deviation of the corresponding variable. The indicators used to construct the index include the bilateral exchange rate, 3-month option implied volatility, net international reserves, 28-day interbank rate, overnight interbank rate, CEMBI spreads, EMBIG spreads, 5-year sovereign CDS spreads, 5-year PEMEX CDS spreads, IPC stock price index, VIMEX index, 2-year government bond yield, 10-year government bond yield, 10-year government bond yield bid-ask spread, exchange rate bid-ask spread, EPFR bond flows, and EPFR equity flows.
0.00
0.05
0.10
0.15
0.20
0.25
0.30
2008 2009 2010 2011 2012 2013 2014 2015 2016
b) Exchange Rate Bid-Ask Spread(Pesos per U.S. dollar; as of October 31, 2016)
0
5
10
15
20
25
30
2010 2011 2012 2013 2014 2015 2016
MexicoEM avg. ex. MEX
c) Exchange Rate 3-Month Implied Volatility(Index; as of October 31, 2016)
-3
-2
-1
0
1
2
3
4
5
6
7
2008 2009 2010 2011 2012 2013 2014 2015 2016
Stan
dard
dev
iatio
ns a
way
from
the
mea
n
d) Financial Conditions Index 1/(As of October 28, 2016)
-15
-10
-5
0
5
10
15
20
25
80
90
100
110
120
130
140
150
160
Jun-14 Jun-15 Jun-16
Gap (RHS)
Mexican peso
Emerging marketcurrencies (average)
a) Exchange Rates(Index: Jun. 2014=100; as of October 28, 2016)
MEXICO
6 INTERNATIONAL MONETARY FUND
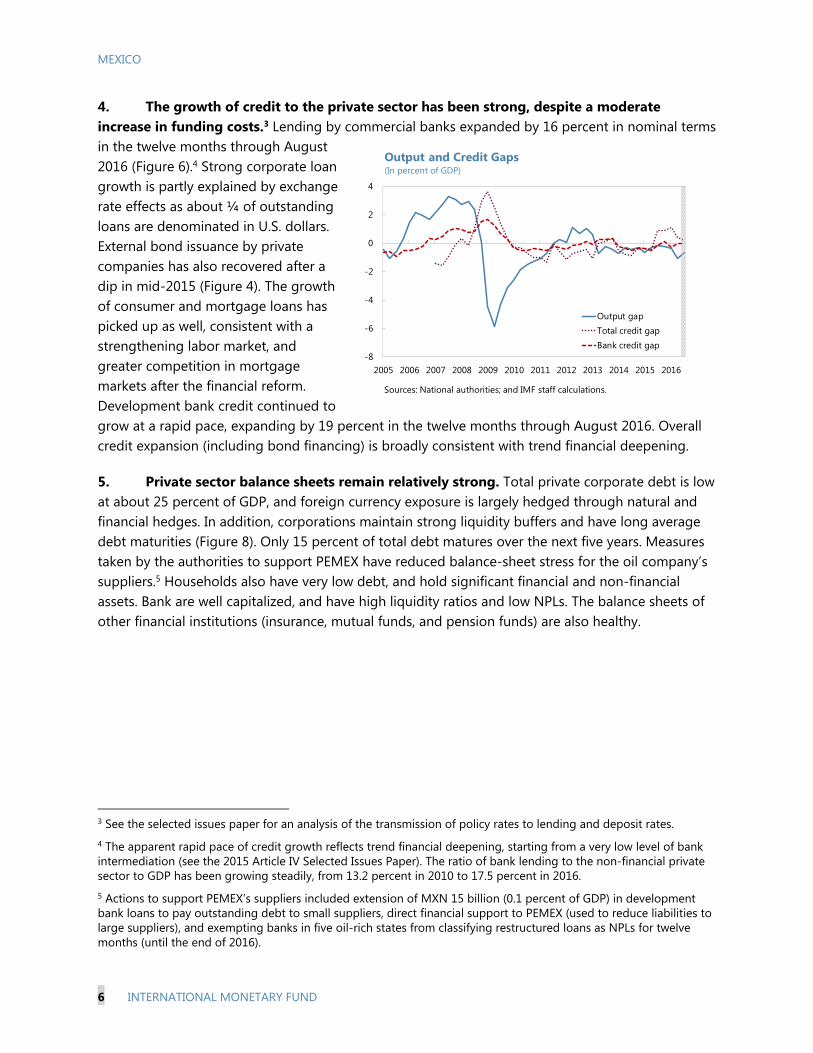
4. The growth of credit to the private sector has been strong, despite a moderate increase in funding costs.3 Lending by commercial banks expanded by 16 percent in nominal terms in the twelve months through August 2016 (Figure 6).4 Strong corporate loan growth is partly explained by exchange rate effects as about ¼ of outstanding loans are denominated in U.S. dollars. External bond issuance by private companies has also recovered after a dip in mid-2015 (Figure 4). The growth of consumer and mortgage loans has picked up as well, consistent with a strengthening labor market, and greater competition in mortgage markets after the financial reform. Development bank credit continued to grow at a rapid pace, expanding by 19 percent in the twelve months through August 2016. Overall credit expansion (including bond financing) is broadly consistent with trend financial deepening.
5. Private sector balance sheets remain relatively strong. Total private corporate debt is low at about 25 percent of GDP, and foreign currency exposure is largely hedged through natural and financial hedges. In addition, corporations maintain strong liquidity buffers and have long average debt maturities (Figure 8). Only 15 percent of total debt matures over the next five years. Measures taken by the authorities to support PEMEX have reduced balance-sheet stress for the oil company’s suppliers.5 Households also have very low debt, and hold significant financial and non-financial assets. Bank are well capitalized, and have high liquidity ratios and low NPLs. The balance sheets of other financial institutions (insurance, mutual funds, and pension funds) are also healthy.
3 See the selected issues paper for an analysis of the transmission of policy rates to lending and deposit rates. 4 The apparent rapid pace of credit growth reflects trend financial deepening, starting from a very low level of bank intermediation (see the 2015 Article IV Selected Issues Paper). The ratio of bank lending to the non-financial private sector to GDP has been growing steadily, from 13.2 percent in 2010 to 17.5 percent in 2016. 5 Actions to support PEMEX’s suppliers included extension of MXN 15 billion (0.1 percent of GDP) in development bank loans to pay outstanding debt to small suppliers, direct financial support to PEMEX (used to reduce liabilities to large suppliers), and exempting banks in five oil-rich states from classifying restructured loans as NPLs for twelve months (until the end of 2016).
-8
-6
-4
-2
0
2
4
2005 2006 2007 2008 2009 2010 2011 2012 2013 2014 2015 2016
Output gapTotal credit gapBank credit gap
Sources: National authorities; and IMF staff calculations.
Output and Credit Gaps(In percent of GDP)

MEXICO
INTERNATIONAL MONETARY FUND 7
Box 1. Exchange Rate Pass-through Estimates Estimates of the exchange rate pass-through to headline consumer prices for Mexico show no evidence of second-round effects. The estimation was based on monthly data over 2000-15, using as explanatory variables the import-weighted nominal effective exchange rate, international oil and food prices, production costs in trading partners, and the output gap.1 If absence of second-round effects, the pass-through should be close to the import content of household consumption since the response of inflation to a currency depreciation would only reflect the relative-price adjustment between tradable and non-tradable goods and services.
The pass-through in Mexico is low owing to a low import content of consumption and well-anchored inflation expectations. The 2-year cumulative pass-through from nominal effective exchange rate depreciation to headline consumer prices is about 7 percent, slightly below the import content of consumption. In a cross-country comparison, countries with better anchored expectations—and hence with more credible central banks—have empirical estimates of pass-through that are close or even below the import content of consumption, suggesting an absence of second-round effects.
A temporary increase in inflation due to the exchange rate depreciation would not necessarily warrant a policy response. Even with a low exchange rate pass-through coefficient, a large depreciation would lead to an increase in inflation due to the relative price adjustment between tradable and non-tradable goods and services. However, with well-anchored medium-term inflation expectations, such an increase in inflation is likely to be temporary. Credible central banks may have space to allow the price adjustments to take place without an aggressive response to the increase in inflation. 1 Further details are provided in Ch. 4 of the WHD Regional Economic Outlook (2016) and Carriere-Swallow and others, 2016, “Monetary Policy Credibility and Exchange Rate Pass-through.”
6. The external sector position remains broadly consistent with medium-term fundamentals and desirable policy settings. The current account deficit is projected to remain unchanged at about 3 percent of GDP in 2016, as the reduction in the hydrocarbons trade balance has been offset by stronger remittances and net service exports. The cyclically-adjusted current account deficit is broadly in line with fundamentals and desirable policy settings (Annex II). In real effective terms, the peso has depreciated by about 12 percent in 2016 relative to its 2015 average, reflecting lower oil production and exports, weaker domestic growth prospects, further deterioration in the terms of trade, and increased uncertainty related to rising protectionism risks. In the staff’s
0
10
20
30
40
50
60
MEX LA5 EME Asia LA (other) EME Europe
Exchange Rate Pass-through and Import Content(In percent)
Exchange Rate Pass-through, Cumulative After 2 Years
Import Content of Household Consumption
Source: Carriere-Swallow and others (2016).

MEXICO
8 INTERNATIONAL MONETARY FUND
assessment, the peso is broadly in line with fundamentals (with a gap of 0-10 percent).6 Looking ahead, portfolio flows are expected to recover in the baseline: inflows into domestic government paper have already increased in the third quarter of 2016. The net international investment liability position is sustainable at about 40 percent of GDP in 2016, and foreign exchange reserves are adequate according to a range of indicators (Figure 5 and Table 6).
7. The stance of macroeconomic policies has tightened. The Bank of Mexico increased its policy rate cumulatively by 175 basis points to 4¾ percent over the past twelve months. The first rate increase of 25 basis points took place in December, 2015, as Banxico matched the move by the Federal Reserve. Subsequently, the policy rate was increased by 50 basis points each in February (outside the normal meeting schedule), June and September 2016. Long-term yields on local currency bonds have remained broadly stable resulting in a flattening of the yield curve. In February, Bank of Mexico shifted to a discretionary foreign exchange intervention strategy and has intervened only once since then.7 The authorities project that the headline fiscal deficit (PSBR) will narrow to 3 percent of GDP in 2016 (compared with an original PSBR target of 3.5 percent), helped by a one-off transfer of Bank of Mexico’s surplus (amounting to 1.2 percent of GDP) to the federal government.8 Excluding the Bank of Mexico transfer, revenues are projected to be broadly on target, with the decline in oil income offset by stronger-than-expected VAT, income, and excise tax revenues and the oil-price hedge. The structural primary deficit is projected to improve by about ¾ percentage points of GDP.
6 This judgement is consistent with the overall results from the external balance assessment, which finds that the current account deficit is close to the norm (0.8 percentage points of GDP wider than the norm, see text chart), and the real effective exchange rate level approach, which shows a small undervaluation of 11.5 percent. 7 Mexico had two rules-based intervention schemes in place in 2015: preannounced daily auctions of U.S dollars and additional auctions when the daily exchange rate depreciation exceeded a certain threshold. The first scheme was suspended on November 19, 2015, and the second was discontinued on February 17, 2016. Discretionary intervention was used only on one occasion in February. 8 The central bank law requires the Bank of Mexico to transfer to the federal government its surplus (including from exchange rate valuation gains) after increasing its capital sufficiently to ensure that it grows at least at the projected growth rate of nominal GDP. When the profits are from unrealized asset price gains (such as unrealized gains on FX reserves), the Bank of Mexico Board has discretion to increase its capital by more than that. The Bank of Mexico is not consolidated in the public sector fiscal accounts, so these one-off transfers affect the headline fiscal deficit.
Current account gap -0.8(Percent of GDP)REER gap, level regression -11.5(Percent)
Source: IMF Staff estimates
External Balance Assessment Results
2
3
4
5
6
7
8
1 3 6 1 2 3 5 10 20 30
Dec. 31, 2015
Jun. 30, 2016
Oct. 31, 2016
Yield Curve of Local Government Bonds(In percent)
Months Years
Source: Bloomberg
MEXICO
INTERNATIONAL MONETARY FUND 9
8. PEMEX is adapting to the new reality of persistently lower oil prices. The company’s balance sheet has been affected by a decline in oil production and prices, resulting in a significant increase in its outstanding debt to suppliers (Box 2). The rating agency Moody’s downgraded PEMEX’s debt to the lowest investment grade level (Baa3) in early 2016.9 A new management team was appointed in February and several measures to strengthen the finances of the state-owned oil producer have been taken in the course of this year. The Federal Government provided financial assistance to PEMEX to improve its liquidity. PEMEX announced permanent expenditure cuts of about 20 percent of its budget in early 2016. The company also restructured its pension scheme, generating savings of 1 percentage point of GDP in net present value terms.10 In addition, the federal government assumed a fraction of PEMEX’s pension liabilities in an amount equal to the savings from the reform.
9. Implementation of the key structural reforms is broadly on track. On the energy front, auctions of oil fields and electricity permits for generation are proceeding as planned (the first two auctions for electricity permits are expected to lead to an increase of electricity generation capacity of 10 percent). Three rounds of auctions of oil contracts have been completed successfully. The next milestones are the auctions for deep water oil fields and for PEMEX’s first joint venture, scheduled to take place in December. Some positive results from the reforms are already visible. Private investment in natural gas pipelines, electricity generation, and telecommunications has picked up, and the financial reform has helped spur competition in the banking sector. Increased competition in telecommunication services has led to a significant reduction in prices. The education reform is also in the process of implementation, although it has faced resistance in some states.
10. The authorities are taking steps to improve the rule of law. A 2015 constitutional reform created a new National Anticorruption System, the main goal of which is improved coordination among the relevant authorities in the prevention, detection, and penalization of acts of corruption. Secondary legislation, promulgated in July 2016, included financial disclosure requirements for recipients of public funds, creation of a specialized federal court for corruption cases, and stricter penalties and statutes of limitations.
9 PEMEX’s woes have also affected the assessment of the sovereign credit. In March, Moody’s revised the outlook for Mexico’s sovereign credit rating from stable to negative, citing subdued economic growth, continued external headwinds, and the deterioration in PEMEX’s finances. The current sovereign credit rating by Moody’s is A3 (one notch above the BBB+ rating of S&P and Fitch). In August, S&P also changed the outlook for Mexico from stable to negative, while reaffirming its BBB+ rating. 10 The state-owned electricity company (CFE) also reformed its pension scheme this year. The estimated savings from this reform are 0.8 percent of GDP in net present value terms. Similar to the arrangement with PEMEX, the federal government will assume a fraction of pension liabilities equal to the amount of savings from the reform.

MEXICO
10 INTERNATIONAL MONETARY FUND
Box 2. Pemex: Key Reforms and Recent Developments Declining oil production and prices have affected PEMEX’s liquidity and profitability in 2015 and early 2016. PEMEX’s equity shrank by 7 percent of GDP between 2013 and 2016Q1 due to rising losses. Its market debt increased from 5 percent of GDP to around 9 percent of GDP over the same period. Moreover, the company accumulated significant debt to suppliers: 0.9 percent of GDP as of end-2015, up from an average of 0.4 percent of GDP over 2009-12. In addition, PEMEX had significant unfunded pension liabilities (8½ percent of GDP as of June 2015). Similar to other oil producers, PEMEX had to undertake an adjustment to return to profitability. The federal government provided financial support to the company in 2016 to ease the immediate liquidity problems, while PEMEX restructured its pension scheme and announced permanent expenditure adjustments.
Federal government support. In April, the authorities announced a capital injection, liquidity support, and a reduction of the fiscal burden on PEMEX. Altogether, these measures amounted to 0.6 percent of GDP. Pemex announced in June that it had settled 0.5 percent of GDP of debt to suppliers.
Pemex pension reform. Pemex modified its defined benefit pension regime in November 2015, reducing the net present value of its pension liabilities by 1 percent of GDP.1 In the context of the energy reform, the federal government had agreed to assume a portion of Pemex’s pension-related debt equivalent to the savings generated by the reform (promissory notes were issued to PEMEX in 2015-16 to honor this agreement).
Spending adjustment. In February, PEMEX announced cuts of about 0.5 percent of GDP—roughly 20 percent of its 2016 budget. Two thirds of the cuts will be implemented through suspending investment projects. In addition, operating and personnel costs were reduced (the workforce was reduced by 7 percent).
It will be important for PEMEX to strengthen its efficiency and profitability. Compared to other oil companies, PEMEX has a relatively low pre-tax profitability. The company should therefore focus on more profitable activities and use the opportunity provided by the energy reform to engage in joint ventures to improve productivity and efficiency. Operating margins differ substantially among its various operations: PEMEX’s petrochemicals and refining subsidiaries had a negative EBITDA over 2010-2015, while the EBITDA for Exploration and Production was 105 percent.
1 The retirement age for workers with less than 15 years of service was raised from 55 to 60 years, with full benefits received only by employees with minimum 30 years of service. More senior employees were grandfathered, while new employees will be under individual defined contribution accounts.
Sources: Wall Street Journal, Forbes, and staff calculations.
Note: Asset turnover is calculated as a ratio of total sales (revenue) to total assets. Pre-tax margin is calculated as a ratio of pre-tax income to total assets.
13.1
1.8
0.8
13.1
0.2
1.8
35.4
27.5 6.2
0 10 20 30 40 50
Corporate
Other Subsidiary Companies
Logistics
Industrial Transformation
Exploration and Production
Pemex: 2016 Budget Adjustment(in billions of pesos)
Generate efficiencies and reduce costs
Defer / reconsider investment
Adjust capex and opex

MEXICO
INTERNATIONAL MONETARY FUND 11
OUTLOOK AND RISKS 11. Real GDP growth is projected to remain moderate at around 2¼ percent in 2017. The baseline projections are predicated on a continued steady recovery of the U.S. economy. The impact of tighter domestic macroeconomic policies on Mexico’s growth is expected to be offset by a boost to manufacturing production and exports due to stronger U.S. industrial production, the depreciation of the peso, and lower electricity prices.11 Machinery and equipment investment and export-related services are also expected to firm up in line with the recovery in external demand. Strong labor market conditions and robust credit growth will continue to underpin private consumption. Staff projections are within the authorities’ projected range for 2017 growth of 2-3 percent.
12. Financing conditions are expected to remain supportive in the baseline scenario. Commercial banks can support continued credit expansion as they remain well capitalized, liquid, and profitable. Banks’ capital adequacy ratio stood at 15 percent, among the highest in emerging markets, and non-performing loans are low. The financial reform has led to greater competition among banks and lower interest rates in some sectors (such as mortgages), although there is room to strengthen competition further. In the baseline, the overall nominal credit growth is projected to remain healthy at around 12 percent in the medium term, reflecting trend financial deepening and strong credit demand. Global financial conditions have eased in recent months and corporations have been able to continue to issue FX bonds at relatively low interest rates.
13. In the baseline, export growth is projected to recover in line with the recovery of manufacturing production in the United States. Historically, exports have been a key growth engine for the economy, with strong spillovers to domestic demand. Due to Mexico’s integration in the North-American manufacturing value chain, the slowdown of global trade could have affected Mexico’s non-oil exports over the last year.12 The depreciation of the peso
11 The macroeconomic effects of fiscal policy tightening should be manageable with output close to potential and low energy prices (staff estimates the fiscal multiplier to be about 0.7 when the output gap at its current level). A 1-percent decline in electricity costs, a 1-percent increase in U.S. industrial production, and a 1-percent depreciation of the currency in real effective terms lead to an increase in manufacturing output in Mexico by 0.3 percent, 0.5 percent, and 0.3 percent respectively within one year (Alvarez and Valencia, IMF working paper 2015). 12 Analysis presented in Bank of Mexico’s August 2016 Inflation Report suggests that Mexico’s non-auto manufacturing exports to the U.S. are affected not only by U.S. domestic demand but also by the performance of U.S.

MEXICO
12 INTERNATIONAL MONETARY FUND
should help boost exports, but the effects could take some time to materialize as it takes time to put in place new production capacity. There are substantial risks around the projected recovery in exports, related to increased protectionism. If export performance remains weak, it is likely to have negative spillovers to domestic demand.
14. Inflation is projected to converge to the 3-percent target by end-2018. Rising fuel prices, in the context of a gradual liberalization of domestic fuel markets, and continued pass-through from the depreciation of the currency are expected to push consumer prices temporarily above the target in the near term. However, inflation is expected to converge to the target by end-2018 as the effects of these factors taper off. A faster-than-expected dissipation of slack in the economy or a rebound in food prices could lead to a larger overshooting of the inflation target. On the downside, a slower economic growth or further decreases in telecom services prices would put downward pressure on inflation.
15. Growth is projected to strengthen in the medium term due to the positive effect of structural reforms. The implementation of structural reforms in the areas of energy, education, labor markets, competition, telecommunications, and the financial sector is projected to boost growth by about ½ percentage point over the medium term through higher investment, productivity, and improved access to finance. 13 As private investment related to the reforms accelerates, the current account deficit could remain elevated, but should decline gradually in the longer term as oil production and exports increase.
16. There was agreement between staff and the authorities that there are substantial risks around the baseline growth projections.
Rise in protectionism. In the near term, uncertainty about the likelihood of increased barriers to trade and financial flows is likely to cause a delay in investment projects. A materialization of this risk could have a major impact on Mexico: exports, FDI in the manufacturing sector, and portfolio inflows could decline, with a negative impact on growth (see Annex 1).
Weaker-than-expected global growth, and particularly U.S. growth. Mexico’s outlook is heavily influenced by U.S. growth prospects given the close ties between the two economies. The persistent appreciation of the dollar and weak global demand pose downside risks to the recovery of manufacturing production in the United States.
Renewed volatility in global financial markets. Capital flows to emerging markets have rebounded in recent months. However, the risk of sharp reversals remains elevated. Renewed
non-auto manufacturing exports, probably due to integration through the North-American production value chain. Therefore, weak global demand and the strong dollar could have an indirect negative impact on Mexico’s exports to the U.S., reducing the positive effects of a weaker peso on export demand. 13 The medium-term growth projections have been revised down by ½ percentage point since the last Article IV consultation in line with the downward revisions in domestic oil production and medium-term growth in the US.
MEXICO
INTERNATIONAL MONETARY FUND 13
concerns about a greater-than-expected slowdown in China or other large economies could also lead to a pullback of capital from emerging markets, including Mexico.14
A lower-than-expected path for oil prices or domestic oil production. A slower-than-expected reversal of global supply factors could lead to persistently lower oil prices. A materialization of this risk would increase the fiscal consolidation burden and discourage private investment in the oil sector. Further declines in PEMEX’s oil production is an important domestic risk.
On the upside, a dissipation of the risk of increased protectionism, a stronger recovery in U.S. manufacturing activity, or a faster-than-expected recovery in oil prices could lead to a rebound in exports and stronger growth.15
KEY POLICY ISSUES
A. Fiscal Policy
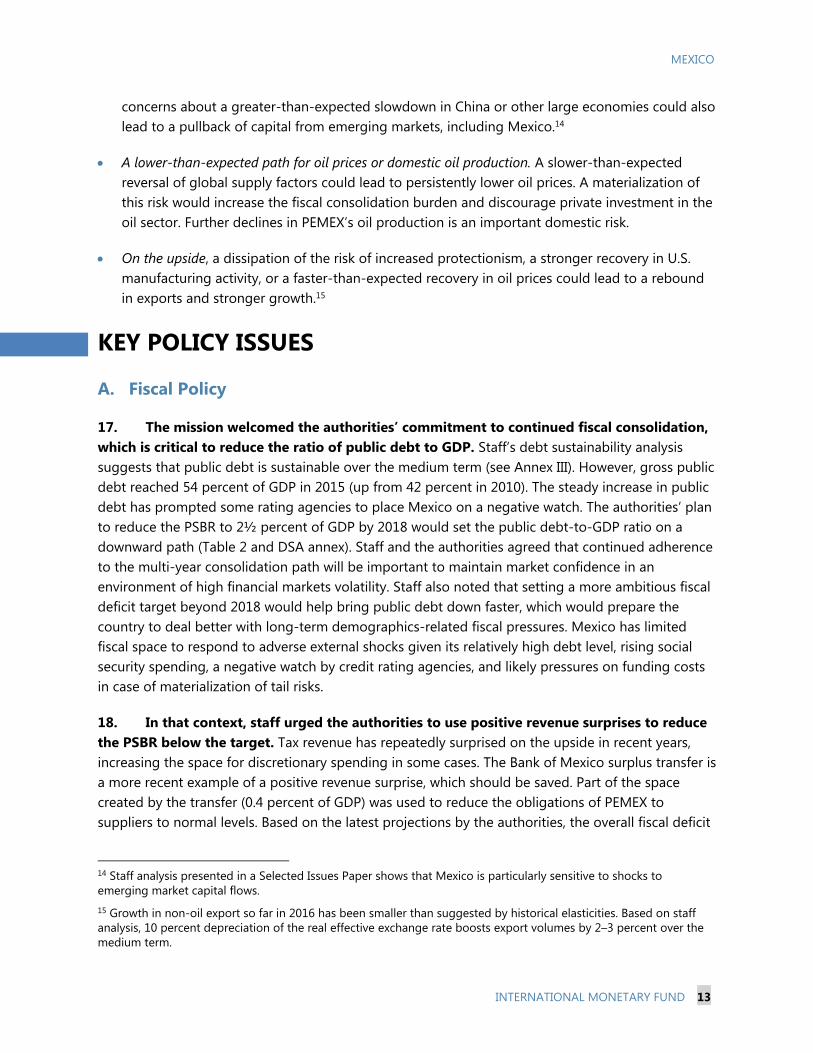
17. The mission welcomed the authorities’ commitment to continued fiscal consolidation, which is critical to reduce the ratio of public debt to GDP. Staff’s debt sustainability analysis suggests that public debt is sustainable over the medium term (see Annex III). However, gross public debt reached 54 percent of GDP in 2015 (up from 42 percent in 2010). The steady increase in public debt has prompted some rating agencies to place Mexico on a negative watch. The authorities’ plan to reduce the PSBR to 2½ percent of GDP by 2018 would set the public debt-to-GDP ratio on a downward path (Table 2 and DSA annex). Staff and the authorities agreed that continued adherence to the multi-year consolidation path will be important to maintain market confidence in an environment of high financial markets volatility. Staff also noted that setting a more ambitious fiscal deficit target beyond 2018 would help bring public debt down faster, which would prepare the country to deal better with long-term demographics-related fiscal pressures. Mexico has limited fiscal space to respond to adverse external shocks given its relatively high debt level, rising social security spending, a negative watch by credit rating agencies, and likely pressures on funding costs in case of materialization of tail risks.
18. In that context, staff urged the authorities to use positive revenue surprises to reduce the PSBR below the target. Tax revenue has repeatedly surprised on the upside in recent years, increasing the space for discretionary spending in some cases. The Bank of Mexico surplus transfer is a more recent example of a positive revenue surprise, which should be saved. Part of the space created by the transfer (0.4 percent of GDP) was used to reduce the obligations of PEMEX to suppliers to normal levels. Based on the latest projections by the authorities, the overall fiscal deficit
14 Staff analysis presented in a Selected Issues Paper shows that Mexico is particularly sensitive to shocks to emerging market capital flows. 15 Growth in non-oil export so far in 2016 has been smaller than suggested by historical elasticities. Based on staff analysis, 10 percent depreciation of the real effective exchange rate boosts export volumes by 2–3 percent over the medium term.

MEXICO
14 INTERNATIONAL MONETARY FUND
in 2016 will improve by ½ percentage point of GDP relative to the original target, implying that part of the windfall will be used to relax the overall budget spending limit. Staff recommended adhering to the budget for overall spending during the remainder of 2016, and using the remaining portion of the transfer (0.3 percent of GDP) to further reduce the 2016 PSBR. This would be consistent with the Fiscal Responsibility Law (FRL), according to which public savings should increase by the full amount of the transfer. It would also ease the adjustment necessary to achieve the fiscal target in 2017 and help maintain investors’ trust in the credibility of fiscal commitments. Any additional profit transfer from the Bank of Mexico in 2017 should be used in its entirety for a net reduction of the PSBR. The authorities noted that a large fraction of the 2016 transfer is already being saved for the first time in history, and explained that the rest of the windfall was being used to meet an unanticipated increase in non-discretionary spending (PEMEX support, interest and pension payments, and tax revenue sharing with local governments). They stated that they will follow the FRL regarding the use of future transfers of surplus from the Bank of Mexico, if any.
19. The 2017 budget envisages a further reduction of the fiscal deficit to 2.9 percent of GDP, which is in line with the medium-term consolidation path. The consolidation will be achieved through an ambitious rationalization of expenditure, since overall revenue in percent of GDP is projected to decline in 2017 due to lower oil income and one-off revenues. PEMEX accounts for a large share of the projected decline in public capital spending, and will rely increasingly on production and exploration partnerships with private companies to maintain production levels. More generally, public-private partnerships are envisaged to play a greater role going forward, especially in infrastructure development. This strategy is expected to offset in part the effects of the compression in capital spending envisaged in the fiscal consolidation plan. Staff noted that further revenue measures could be considered in the medium term to avoid constraining capital spending excessively. 16 The authorities explained that the current administration had committed to not raising taxes further to allow the economy to adjust to the 2013 tax reform.
20. Staff suggested that the current low energy prices present an opportunity to eliminate the non-targeted electricity subsidies, estimated at about ¼ percent of GDP. Low-income households could be compensated through well-targeted cash transfers. The authorities noted that the ongoing restructuring of the state-owned electricity company (CFE) will allow a more precise measurement of the subsidies and an assessment of the possibility to make them more targeted. Staff supported the proposed further liberalization of gasoline prices, which will allow them to move
16 IMF technical assistance has identified significant scope for increasing revenues through better tax collection enforcement given large compliance gaps.

MEXICO
INTERNATIONAL MONETARY FUND 15
fully in line with international prices.17 There was agreement that it would be useful to evaluate the benefits and costs of expanding the hedging program to cover oil-price risk from domestic sales.18
21. Turning PEMEX into a profitable and efficient company would be critical to maintain market confidence. Staff and the authorities agreed that it is important to present a multi-year business plan, focused on improving efficiency, strengthening core business activities, and divestment of non-core assets and subsidiaries. The board of PEMEX recently approved a business plan which will be made public in the coming weeks. The energy reform increased the autonomy of PEMEX, allowing it to enter into joint ventures with the private sector and shift resources toward more profitable activities. The first auction for a joint venture with the private sector in deep water exploration and production will take place in December, and a second joint venture for shallow water production will be auctioned in March 2017. Additional joint ventures in refining activities and onshore fields are expected to be part of the business plan.
22. Staff welcomed the approval of a fiscal responsibility law for state and local governments. The law strengthens data reporting requirements and is expected to impose greater fiscal discipline at the state and municipal levels. Staff noted that regulations supporting the implementation of the law have to be issued in a timely manner. Continued capacity building at the state and municipal level (including auditing capacity), together with consistent enforcement, are crucial for effective implementation.
23. As discussed in the 2015 Article IV, further enhancements of the fiscal framework would strengthen its credibility. Staff reiterated its recommendation to create a non-partisan fiscal council with a formal mandate to provide an independent expert evaluation of fiscal policy and compliance with the FRL. Staff also noted that it is desirable to have a tighter link between the desired level of public debt and PSBR targets. The use of the exceptional circumstances clauses should be limited to cases of large output or oil price shocks to constrain discretion. The fiscal framework needs to have explicit rules to bring the PSBR to the medium-term target after an exceptional circumstance clause is invoked. The authorities responded that, in their view, the best way to maintain credibility is to deliver consistently on fiscal commitments. Starting in mid-2016, they will publish quarterly updates of the forecast for key fiscal indicators for the current year, which should increase transparency.
24. Population aging will put additional pressure on fiscal spending in the long term. The ongoing shift from a defined-benefit to a defined-contribution pension system will reduce fiscal liabilities over the long term. However, in the transition period, the public pension deficit will increase until about 2040, before gradually coming down (Box 3). Health spending will put
17 In 2015, the authorities introduced a price band of -/+3 percent for gasoline and diesel, as a first step toward a liberalization of the domestic fuel markets. The budget proposes a full liberalization of oil prices starting in January 2017, with some remaining restrictions on charges for transportation costs to be phased out over the next two years. 18 Staff analysis in a Selected Issues Paper finds that the hedging program has led to welfare gains, mostly through lowering borrowing costs for the sovereign. Insuring a larger fraction of the oil production could be beneficial since the volatility of oil revenues will increase once domestic fuel prices are fully liberalized.
MEXICO
16 INTERNATIONAL MONETARY FUND
additional pressure on the budget over the long term as the old-age dependency ratio increases. Staff encouraged the authorities to periodically publish long-term projections of age-related spending, and take them explicitly into account when setting medium-term budget targets. Reducing more aggressively public debt levels in the medium term would provide a buffer for addressing long-term demographic pressures. Staff also suggested that the defined-benefit system could be closed to further accumulation of rights in order to save public resources and gradually reduce the inequity between the replacement rates under the two pension systems.
Box 3. Pension Issues Mexico has adopted a defined-contribution pension system since the late 1990s. The traditional pay-as-you-go defined-benefit (DB) pension system was replaced with a defined-contribution (DC) system with individual accounts managed by pension fund administrators (in 1997 for private sector workers and in 2007 for most public sector workers).1 However, individuals who were already participants in the DB system prior to the reform were grandfathered, allowing them not only to retain the entitlements already accumulated at the time of the reform, but also to continue accumulating entitlements thereafter. Mexico’s pension system also includes the national housing fund (unused balances in which are converted to pension savings) and a means-tested noncontributory pension for the poorest.
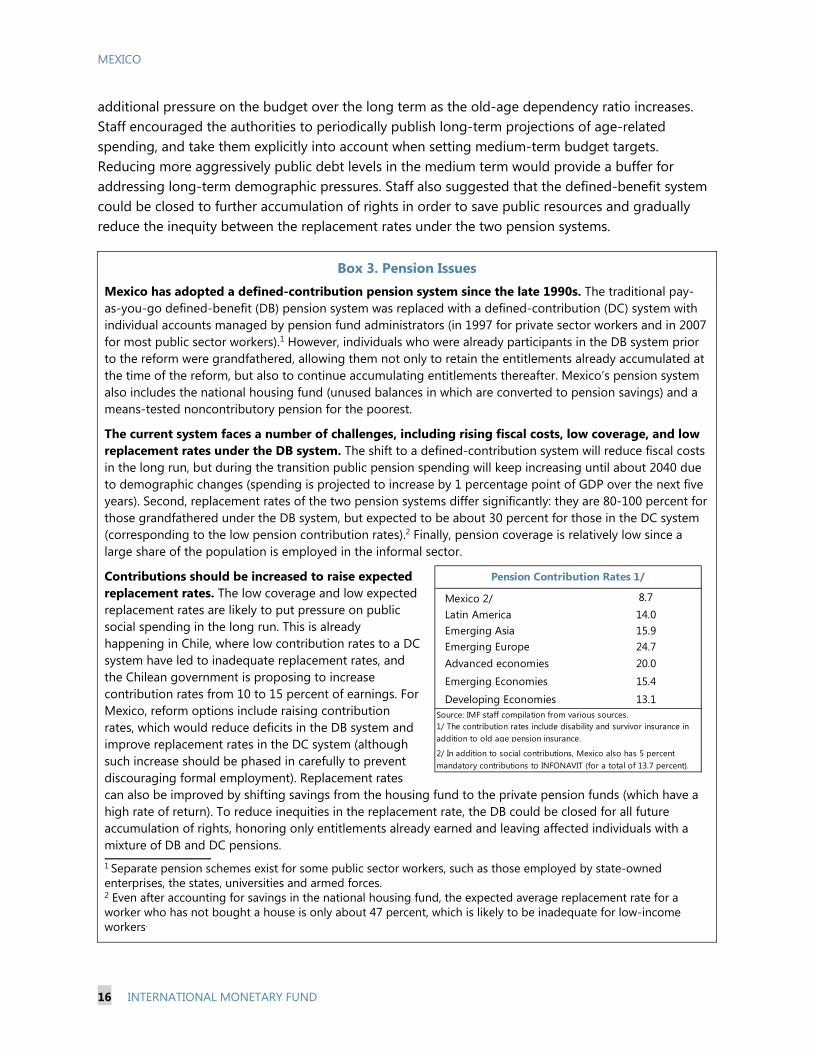
The current system faces a number of challenges, including rising fiscal costs, low coverage, and low replacement rates under the DB system. The shift to a defined-contribution system will reduce fiscal costs in the long run, but during the transition public pension spending will keep increasing until about 2040 due to demographic changes (spending is projected to increase by 1 percentage point of GDP over the next five years). Second, replacement rates of the two pension systems differ significantly: they are 80-100 percent for those grandfathered under the DB system, but expected to be about 30 percent for those in the DC system (corresponding to the low pension contribution rates).2 Finally, pension coverage is relatively low since a large share of the population is employed in the informal sector.
Contributions should be increased to raise expected replacement rates. The low coverage and low expected replacement rates are likely to put pressure on public social spending in the long run. This is already happening in Chile, where low contribution rates to a DC system have led to inadequate replacement rates, and the Chilean government is proposing to increase contribution rates from 10 to 15 percent of earnings. For Mexico, reform options include raising contribution rates, which would reduce deficits in the DB system and improve replacement rates in the DC system (although such increase should be phased in carefully to prevent discouraging formal employment). Replacement rates can also be improved by shifting savings from the housing fund to the private pension funds (which have a high rate of return). To reduce inequities in the replacement rate, the DB could be closed for all future accumulation of rights, honoring only entitlements already earned and leaving affected individuals with a mixture of DB and DC pensions. 1 Separate pension schemes exist for some public sector workers, such as those employed by state-owned enterprises, the states, universities and armed forces. 2 Even after accounting for savings in the national housing fund, the expected average replacement rate for a worker who has not bought a house is only about 47 percent, which is likely to be inadequate for low-income workers.
Mexico 2/ 8.7Latin America 14.0Emerging Asia 15.9Emerging Europe 24.7Advanced economies 20.0
Emerging Economies 15.4
Developing Economies 13.1
Pension Contribution Rates 1/
1/ The contribution rates include disability and survivor insurance in addition to old age pension insurance.
Source: IMF staff compilation from various sources.
2/ In addition to social contributions, Mexico also has 5 percent mandatory contributions to INFONAVIT (for a total of 13.7 percent).

MEXICO
INTERNATIONAL MONETARY FUND 17
25. Staff recommended raising pension contributions to boost replacement rates under the defined-contribution system. The projected replacement rates under the new defined-contribution system are very low (about 30 percent, or up to 47 percent including additional savings through Infonavit, the national housing fund).19 The low retirement income is likely to put pressure on public social spending in the long term. Staff recommended considering different policy options to raise the pension contribution rate from its current low level of 6.5 percent of earnings in order to achieve an adequate replacement rate in retirement. The authorities agreed that this was an important long-term issue and that it would be desirable to increase replacement rates, while being careful to avoid discouraging formal employment. They suggested as one option strengthening the integration between the mandatory contributions to Infonavit and the pension system, which would increase investment returns. Staff noted that recent proposals by CONSAR to increase the voluntary retirement savings rate, including through an automatic enrollment of new employees in plans with higher pension contribution rates with an opt-out clause, could also be very effective in increasing pension savings.
B. Monetary and Exchange Rate Policies
26. Monetary policy accommodation has been withdrawn steadily over the past year. Staff analysis suggests that Mexico’s policy rate is currently close to the estimated neutral rate, which is consistent with a small output gap, headline and core inflation at the target, moderate wage increases, and anchored inflation expectations (Box 4). In the baseline projection, demand pressures are expected to remain subdued over the next year, while inflation would rise temporarily above 3 percent due to relative price changes before converging to the inflation target in 2018. Staff argued that under the baseline forecast for output and inflation, a pause in monetary policy tightening is warranted. Risks to the inflation outlook are broadly balanced. Upside risks to the inflation outlook include a greater-than-expected increase in fuel prices and a possible intensification of pass-through effects from the currency depreciation. However, second-round effects are likely to remain limited as demand pressures are subdued and medium-term inflation expectations are well-anchored. In that context, a temporary move of inflation above the target due to relative price changes in tradable versus non-tradable goods would not necessarily warrant a policy response. On the downside, risks to the growth outlook have increased. If these risks materialize, increasing slack in the economy would ease wage and inflation pressures. Future monetary policy decisions should remain data driven, and clear communication by the central bank will continue to be important in guiding market expectations.
19 OECD (2015) estimates a replacement rate from the defined-contribution pension system of about 30 percent. Formal employers in Mexico are required to contribute 5 percent of their worker’s salary to the national housing fund. In return, employees are entitled to get a mortgage from Infonavit at relatively low rates. Workers may also use their contributions as retirement savings, although the returns have been substantially lower than the returns of private pension funds in recent years. CONSAR estimates that the expected replacement rate from Infonavit savings is about 17 percent for contributors who have not taken out a mortgage loan, bringing the overall replacement rate to 47 percent for these workers.
MEXICO
18 INTERNATIONAL MONETARY FUND
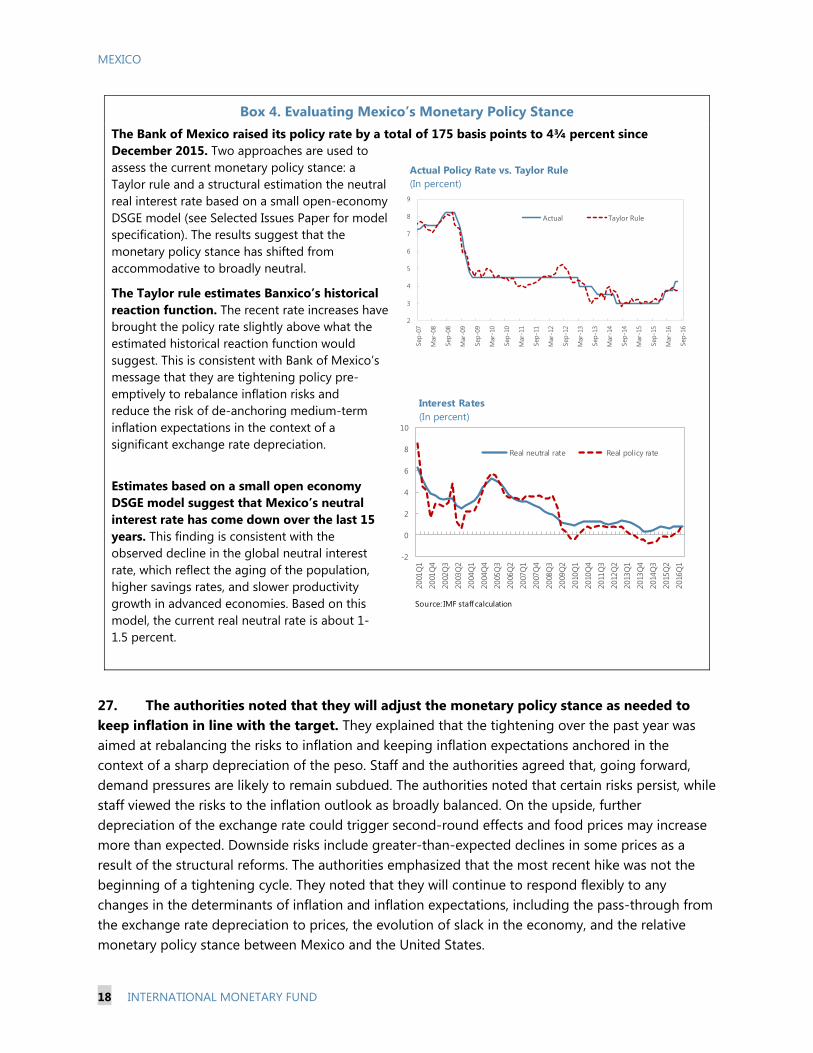
Box 4. Evaluating Mexico’s Monetary Policy Stance The Bank of Mexico raised its policy rate by a total of 175 basis points to 4¾ percent since December 2015. Two approaches are used to assess the current monetary policy stance: a Taylor rule and a structural estimation the neutral real interest rate based on a small open-economy DSGE model (see Selected Issues Paper for model specification). The results suggest that the monetary policy stance has shifted from accommodative to broadly neutral.
The Taylor rule estimates Banxico’s historical reaction function. The recent rate increases have brought the policy rate slightly above what the estimated historical reaction function would suggest. This is consistent with Bank of Mexico’s message that they are tightening policy pre-emptively to rebalance inflation risks and reduce the risk of de-anchoring medium-term inflation expectations in the context of a significant exchange rate depreciation.
Estimates based on a small open economy DSGE model suggest that Mexico’s neutral interest rate has come down over the last 15 years. This finding is consistent with the observed decline in the global neutral interest rate, which reflect the aging of the population, higher savings rates, and slower productivity growth in advanced economies. Based on this model, the current real neutral rate is about 1-1.5 percent.
27. The authorities noted that they will adjust the monetary policy stance as needed to keep inflation in line with the target. They explained that the tightening over the past year was aimed at rebalancing the risks to inflation and keeping inflation expectations anchored in the context of a sharp depreciation of the peso. Staff and the authorities agreed that, going forward, demand pressures are likely to remain subdued. The authorities noted that certain risks persist, while staff viewed the risks to the inflation outlook as broadly balanced. On the upside, further depreciation of the exchange rate could trigger second-round effects and food prices may increase more than expected. Downside risks include greater-than-expected declines in some prices as a result of the structural reforms. The authorities emphasized that the most recent hike was not the beginning of a tightening cycle. They noted that they will continue to respond flexibly to any changes in the determinants of inflation and inflation expectations, including the pass-through from the exchange rate depreciation to prices, the evolution of slack in the economy, and the relative monetary policy stance between Mexico and the United States.
2
3
4
5
6
7
8
9
Sep-
07
Mar
-08
Sep-
08
Mar
-09
Sep-
09
Mar
-10
Sep-
10
Mar
-11
Sep-
11
Mar
-12
Sep-
12
Mar
-13
Sep-
13
Mar
-14
Sep-
14
Mar
-15
Sep-
15
Mar
-16
Sep-
16
Actual Policy Rate vs. Taylor Rule (In percent)
Actual Taylor Rule
-2
0
2
4
6
8
1020
01Q
1
2001
Q4
2002
Q3
2003
Q2
2004
Q1
2004
Q4
2005
Q3
2006
Q2
2007
Q1
2007
Q4
2008
Q3
2009
Q2
2010
Q1
2010
Q4
2011
Q3
2012
Q2
2013
Q1
2013
Q4
2014
Q3
2015
Q2
2016
Q1
Interest Rates (In percent)
Real neutral rate Real policy rate
Source: IMF staff calculation

MEXICO
INTERNATIONAL MONETARY FUND 19
28. There was agreement that the flexible exchange rate should continue to play the role of a key shock absorber should tail risks materialize. A flexible adjustment of the exchange rate will be indispensable to restore equilibrium in response to a permanent shock arising from increased protectionism and rising barriers to trade. The authorities have a wide range of tools to prevent disorderly market conditions, including discretionary foreign exchange interventions, targeted liquidity provision, and debt duration management. The FCL arrangement, which the authorities continue to treat as precautionary, remains an important complement to reserve buffers, providing protection against tail risks.
C. Financial Stability
29. Balance sheet analysis suggests that the financial system is broadly resilient to shocks. The materialization of some of the downside risks discussed earlier could lead to heightened volatility, pressures on asset prices, deteriorating liquidity conditions, and funding cost increases. Negative feedback loops between tighter financial conditions and weak growth could strain corporate and bank balance sheets. Nonetheless, the recent Financial Sector Assessment Program (FSAP) found that the balance sheets of financial institutions and non-financial corporations would be resilient to severe shocks given high initial capital levels (Boxes 5 and 6). Specifically, a sensitivity analysis of the largest 50 corporations found that only for a handful of companies the interest coverage ratio would fall below one in a scenario of significant further currency depreciation, increase in funding rates, and a decline in earnings. Household indebtedness remains low, although the recent rapid pace of credit growth could create pockets of vulnerabilities if income growth decelerates sharply and unemployment increases. The banking sector stress tests confirmed that banks have adequate capital and reserves buffers to absorb an increase in credit risks from corporate and household lending in a stress scenario. Banks are also resilient to market and liquidity risks. The authorities continue to closely monitor corporate leverage and advise firms to strengthen their balance sheets when needed.

MEXICO
20 INTERNATIONAL MONETARY FUND
Box 5. Household and Corporate Sector Balance Sheets: A Health Check Households have low debt and significant positive net assets. The ratio of household debt to income is only 22 percent, and households hold large financial and non-financial assets. Lending to households’ accounts for 37 percent of total bank loans (of which 60 percent are personal loans and credit cards and the rest are housing loans). Consumer loan provisioning is high at 200 percent of NPLs. Household borrowing is denominated entirely in local currency. House prices have increased broadly in line with income growth on average over the last five years, and there is no evidence of an overvaluation.
Corporate debt is also relatively low, although about half of it is denominated in foreign currency. Total corporate debt (including that of public corporations) is 35 percent of GDP, lower than in most other
emerging economies (Figure 7). While FX debt is high, comprising half of total debt, most large corporations reduce their exchange rate risks through a combination of natural hedges (sales in foreign currency) and financial derivatives. Financial derivatives provide mostly a temporary protection against exchange rate movements, but stress tests suggest that balance sheets would be relatively resilient even in the absence of financial hedges.
Although corporate profitability has weakened in line with the slowing economy, debt servicing capacity remains strong. For the median firm, the interest coverage ratio (earnings/interest expense) is around four.1 Corporate bonds have long maturities and only 15 percent of total bonds are maturing in 2016-18. In addition, on average, cash buffers increased and the ratio of net debt to earnings declined in 2015. Commercial banks’ provisions are high at 140 percent of NPLs. Banks’ exposure to the commodities sector is small (6 percent of total loans, most of which to PEMEX) and provisions are above 1000 percent of sectoral NPLs.
1 Only one medium-sized company (Empresas ICA) and a small oil services provider (Oro Negro) missed debt interest payments last year. The ICRs for other large companies have not declined notably over the last year.
8
10
12
14
16
18
20
22
2009 2010 2011 2012 2013 2014 2015
Household Debt and Consumer Loans(In percent)
Household Debt/GDP
Household Debt/Income
G7 Banks: Share of Consumer Loans to Total Loans
Source: Banco de Mexico
-4
-2
0
2
4
6
8
10
2006 2007 2008 2009 2010 2011 2012 2013 2014 2015 2016
Nominal Real
House Price Index(Y/Y quarterly growth)
Source: Haver Analytics
MEXICO
INTERNATIONAL MONETARY FUND 21
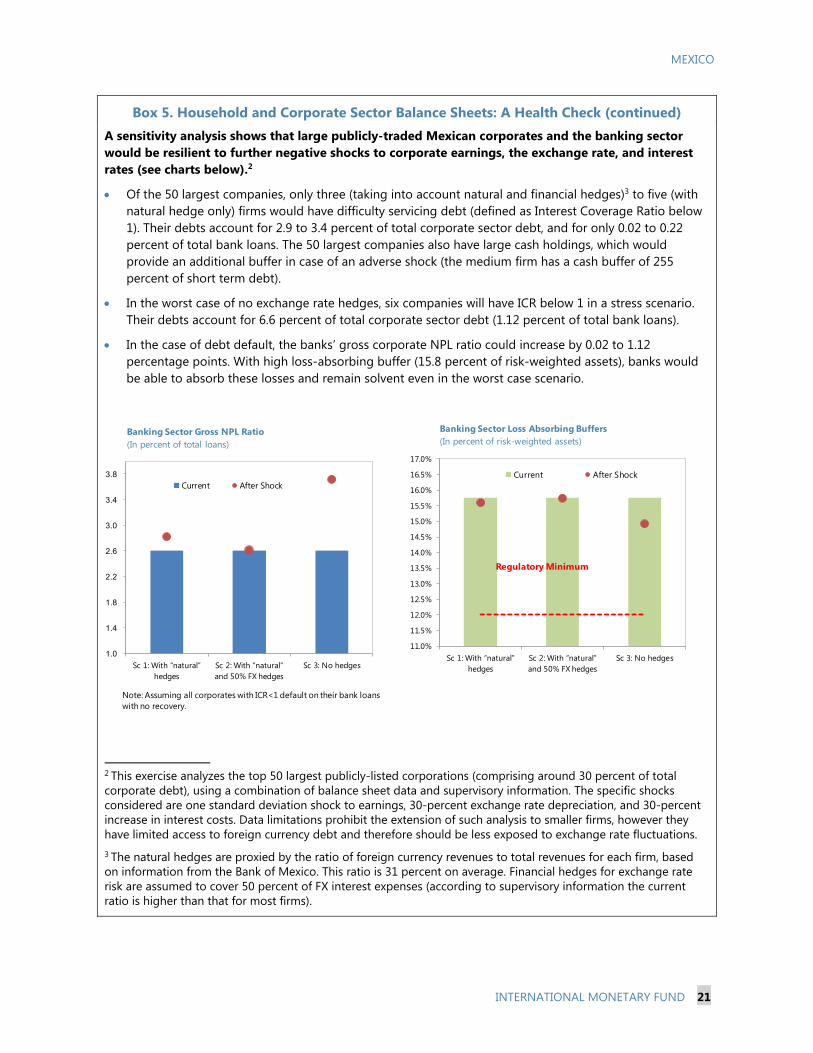
Box 5. Household and Corporate Sector Balance Sheets: A Health Check (continued) A sensitivity analysis shows that large publicly-traded Mexican corporates and the banking sector would be resilient to further negative shocks to corporate earnings, the exchange rate, and interest rates (see charts below).2
Of the 50 largest companies, only three (taking into account natural and financial hedges)3 to five (with natural hedge only) firms would have difficulty servicing debt (defined as Interest Coverage Ratio below 1). Their debts account for 2.9 to 3.4 percent of total corporate sector debt, and for only 0.02 to 0.22 percent of total bank loans. The 50 largest companies also have large cash holdings, which would provide an additional buffer in case of an adverse shock (the medium firm has a cash buffer of 255 percent of short term debt).
In the worst case of no exchange rate hedges, six companies will have ICR below 1 in a stress scenario. Their debts account for 6.6 percent of total corporate sector debt (1.12 percent of total bank loans).
In the case of debt default, the banks’ gross corporate NPL ratio could increase by 0.02 to 1.12 percentage points. With high loss-absorbing buffer (15.8 percent of risk-weighted assets), banks would be able to absorb these losses and remain solvent even in the worst case scenario.
2 This exercise analyzes the top 50 largest publicly-listed corporations (comprising around 30 percent of total corporate debt), using a combination of balance sheet data and supervisory information. The specific shocks considered are one standard deviation shock to earnings, 30-percent exchange rate depreciation, and 30-percent increase in interest costs. Data limitations prohibit the extension of such analysis to smaller firms, however they have limited access to foreign currency debt and therefore should be less exposed to exchange rate fluctuations.
3 The natural hedges are proxied by the ratio of foreign currency revenues to total revenues for each firm, based on information from the Bank of Mexico. This ratio is 31 percent on average. Financial hedges for exchange rate risk are assumed to cover 50 percent of FX interest expenses (according to supervisory information the current ratio is higher than that for most firms).
1.0
1.4
1.8
2.2
2.6
3.0
3.4
3.8
Sc 1: With “natural” hedges
Sc 2: With “natural” and 50% FX hedges
Sc 3: No hedges
Current After Shock
Note: Assuming all corporates with ICR<1 default on their bank loans with no recovery.
Banking Sector Gross NPL Ratio(In percent of total loans)
11.0%
11.5%
12.0%
12.5%
13.0%
13.5%
14.0%
14.5%
15.0%
15.5%
16.0%
16.5%
17.0%
Sc 1: With “natural” hedges
Sc 2: With “natural” and 50% FX hedges
Sc 3: No hedges
Current After Shock
Regulatory Minimum
Banking Sector Loss Absorbing Buffers(In percent of risk-weighted assets)
MEXICO
22 INTERNATIONAL MONETARY FUND
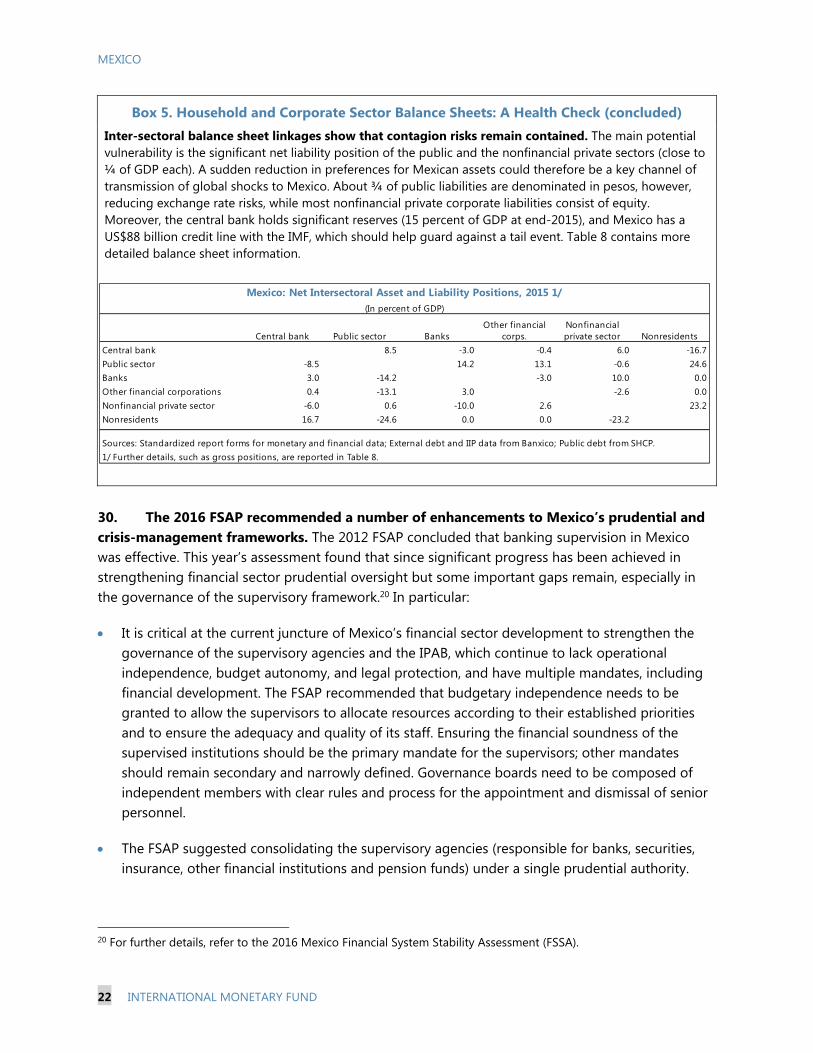
Box 5. Household and Corporate Sector Balance Sheets: A Health Check (concluded) Inter-sectoral balance sheet linkages show that contagion risks remain contained. The main potential vulnerability is the significant net liability position of the public and the nonfinancial private sectors (close to ¼ of GDP each). A sudden reduction in preferences for Mexican assets could therefore be a key channel of transmission of global shocks to Mexico. About ¾ of public liabilities are denominated in pesos, however, reducing exchange rate risks, while most nonfinancial private corporate liabilities consist of equity. Moreover, the central bank holds significant reserves (15 percent of GDP at end-2015), and Mexico has a US$88 billion credit line with the IMF, which should help guard against a tail event. Table 8 contains more detailed balance sheet information.
30. The 2016 FSAP recommended a number of enhancements to Mexico’s prudential and crisis-management frameworks. The 2012 FSAP concluded that banking supervision in Mexico was effective. This year’s assessment found that since significant progress has been achieved in strengthening financial sector prudential oversight but some important gaps remain, especially in the governance of the supervisory framework.20 In particular:
It is critical at the current juncture of Mexico’s financial sector development to strengthen the governance of the supervisory agencies and the IPAB, which continue to lack operational independence, budget autonomy, and legal protection, and have multiple mandates, including financial development. The FSAP recommended that budgetary independence needs to be granted to allow the supervisors to allocate resources according to their established priorities and to ensure the adequacy and quality of its staff. Ensuring the financial soundness of the supervised institutions should be the primary mandate for the supervisors; other mandates should remain secondary and narrowly defined. Governance boards need to be composed of independent members with clear rules and process for the appointment and dismissal of senior personnel.
The FSAP suggested consolidating the supervisory agencies (responsible for banks, securities, insurance, other financial institutions and pension funds) under a single prudential authority.
20 For further details, refer to the 2016 Mexico Financial System Stability Assessment (FSSA).
Central bank 8.5 -3.0 -0.4 6.0 -16.7Public sector -8.5 14.2 13.1 -0.6 24.6Banks 3.0 -14.2 -3.0 10.0 0.0Other financial corporations 0.4 -13.1 3.0 -2.6 0.0Nonfinancial private sector -6.0 0.6 -10.0 2.6 23.2Nonresidents 16.7 -24.6 0.0 0.0 -23.2
Sources: Standardized report forms for monetary and financial data; External debt and IIP data from Banxico; Public debt from SHCP.1/ Further details, such as gross positions, are reported in Table 8.
Mexico: Net Intersectoral Asset and Liability Positions, 2015 1/(In percent of GDP)
Central bank Public sector BanksOther financial
corps.Nonfinancial private sector Nonresidents
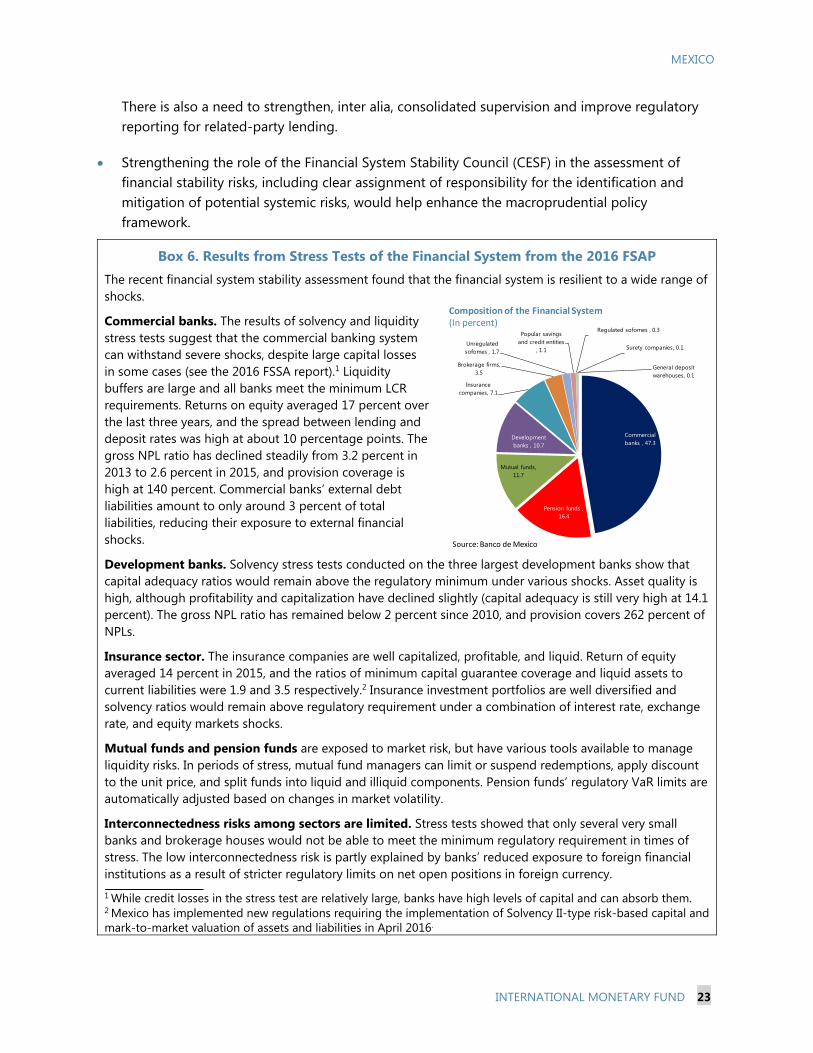
MEXICO
INTERNATIONAL MONETARY FUND 23
There is also a need to strengthen, inter alia, consolidated supervision and improve regulatory reporting for related-party lending.
Strengthening the role of the Financial System Stability Council (CESF) in the assessment of financial stability risks, including clear assignment of responsibility for the identification and mitigation of potential systemic risks, would help enhance the macroprudential policy framework.
Box 6. Results from Stress Tests of the Financial System from the 2016 FSAP The recent financial system stability assessment found that the financial system is resilient to a wide range of shocks.
Commercial banks. The results of solvency and liquidity stress tests suggest that the commercial banking system can withstand severe shocks, despite large capital losses in some cases (see the 2016 FSSA report).1 Liquidity buffers are large and all banks meet the minimum LCR requirements. Returns on equity averaged 17 percent over the last three years, and the spread between lending and deposit rates was high at about 10 percentage points. The gross NPL ratio has declined steadily from 3.2 percent in 2013 to 2.6 percent in 2015, and provision coverage is high at 140 percent. Commercial banks’ external debt liabilities amount to only around 3 percent of total liabilities, reducing their exposure to external financial shocks.
Development banks. Solvency stress tests conducted on the three largest development banks show that capital adequacy ratios would remain above the regulatory minimum under various shocks. Asset quality is high, although profitability and capitalization have declined slightly (capital adequacy is still very high at 14.1 percent). The gross NPL ratio has remained below 2 percent since 2010, and provision covers 262 percent of NPLs.
Insurance sector. The insurance companies are well capitalized, profitable, and liquid. Return of equity averaged 14 percent in 2015, and the ratios of minimum capital guarantee coverage and liquid assets to current liabilities were 1.9 and 3.5 respectively.2 Insurance investment portfolios are well diversified and solvency ratios would remain above regulatory requirement under a combination of interest rate, exchange rate, and equity markets shocks.
Mutual funds and pension funds are exposed to market risk, but have various tools available to manage liquidity risks. In periods of stress, mutual fund managers can limit or suspend redemptions, apply discount to the unit price, and split funds into liquid and illiquid components. Pension funds’ regulatory VaR limits are automatically adjusted based on changes in market volatility.
Interconnectedness risks among sectors are limited. Stress tests showed that only several very small banks and brokerage houses would not be able to meet the minimum regulatory requirement in times of stress. The low interconnectedness risk is partly explained by banks’ reduced exposure to foreign financial institutions as a result of stricter regulatory limits on net open positions in foreign currency. 1 While credit losses in the stress test are relatively large, banks have high levels of capital and can absorb them. 2 Mexico has implemented new regulations requiring the implementation of Solvency II-type risk-based capital and mark-to-market valuation of assets and liabilities in April 2016.
Commercial banks , 47.3
Pension funds , 16.4
Mutual funds, 11.7
Development banks , 10.7
Insurance companies, 7.1
Brokerage firms, 3.5
Unregulated sofomes , 1.7
Popular savings and credit entities
, 1.1
Regulated sofomes , 0.3
Surety companies, 0.1
General deposit warehouses, 0.1
Composition of the Financial System(In percent)
Source: Banco de Mexico
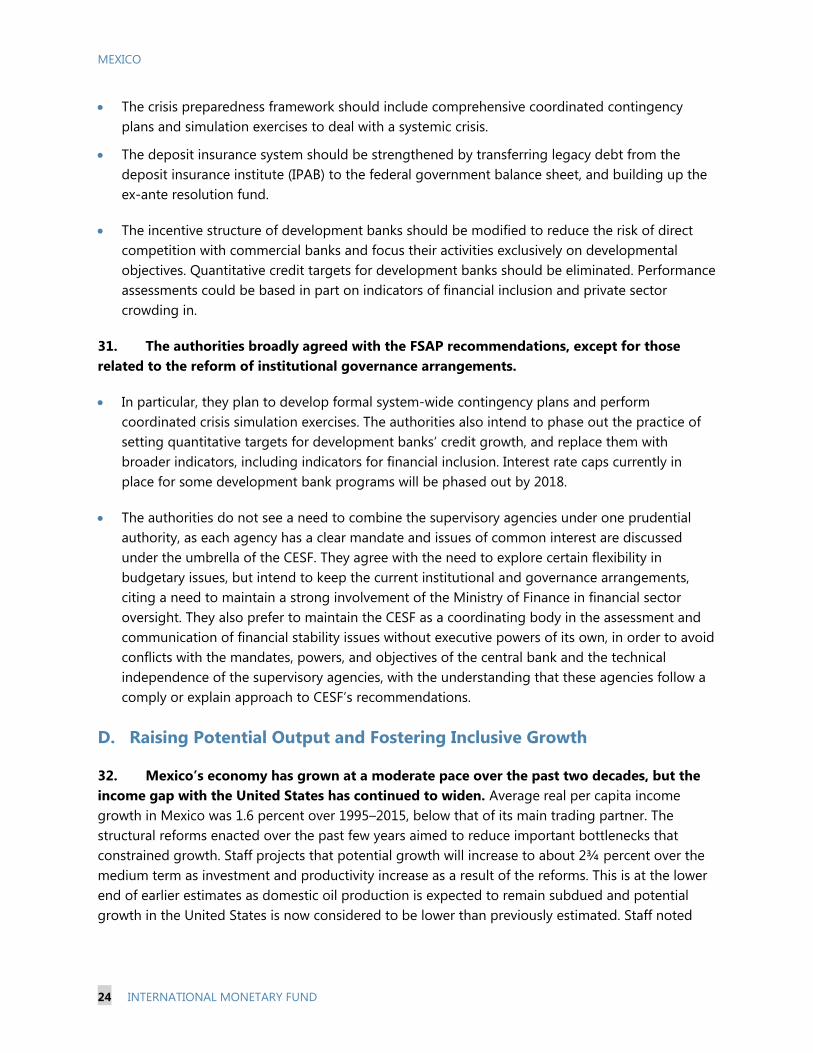
MEXICO
24 INTERNATIONAL MONETARY FUND
The crisis preparedness framework should include comprehensive coordinated contingency plans and simulation exercises to deal with a systemic crisis.
The deposit insurance system should be strengthened by transferring legacy debt from the deposit insurance institute (IPAB) to the federal government balance sheet, and building up the ex-ante resolution fund.
The incentive structure of development banks should be modified to reduce the risk of direct competition with commercial banks and focus their activities exclusively on developmental objectives. Quantitative credit targets for development banks should be eliminated. Performance assessments could be based in part on indicators of financial inclusion and private sector crowding in.
31. The authorities broadly agreed with the FSAP recommendations, except for those related to the reform of institutional governance arrangements.
In particular, they plan to develop formal system-wide contingency plans and perform coordinated crisis simulation exercises. The authorities also intend to phase out the practice of setting quantitative targets for development banks’ credit growth, and replace them with broader indicators, including indicators for financial inclusion. Interest rate caps currently in place for some development bank programs will be phased out by 2018.
The authorities do not see a need to combine the supervisory agencies under one prudential authority, as each agency has a clear mandate and issues of common interest are discussed under the umbrella of the CESF. They agree with the need to explore certain flexibility in budgetary issues, but intend to keep the current institutional and governance arrangements, citing a need to maintain a strong involvement of the Ministry of Finance in financial sector oversight. They also prefer to maintain the CESF as a coordinating body in the assessment and communication of financial stability issues without executive powers of its own, in order to avoid conflicts with the mandates, powers, and objectives of the central bank and the technical independence of the supervisory agencies, with the understanding that these agencies follow a comply or explain approach to CESF’s recommendations.
D. Raising Potential Output and Fostering Inclusive Growth
32. Mexico’s economy has grown at a moderate pace over the past two decades, but the income gap with the United States has continued to widen. Average real per capita income growth in Mexico was 1.6 percent over 1995–2015, below that of its main trading partner. The structural reforms enacted over the past few years aimed to reduce important bottlenecks that constrained growth. Staff projects that potential growth will increase to about 2¾ percent over the medium term as investment and productivity increase as a result of the reforms. This is at the lower end of earlier estimates as domestic oil production is expected to remain subdued and potential growth in the United States is now considered to be lower than previously estimated. Staff noted
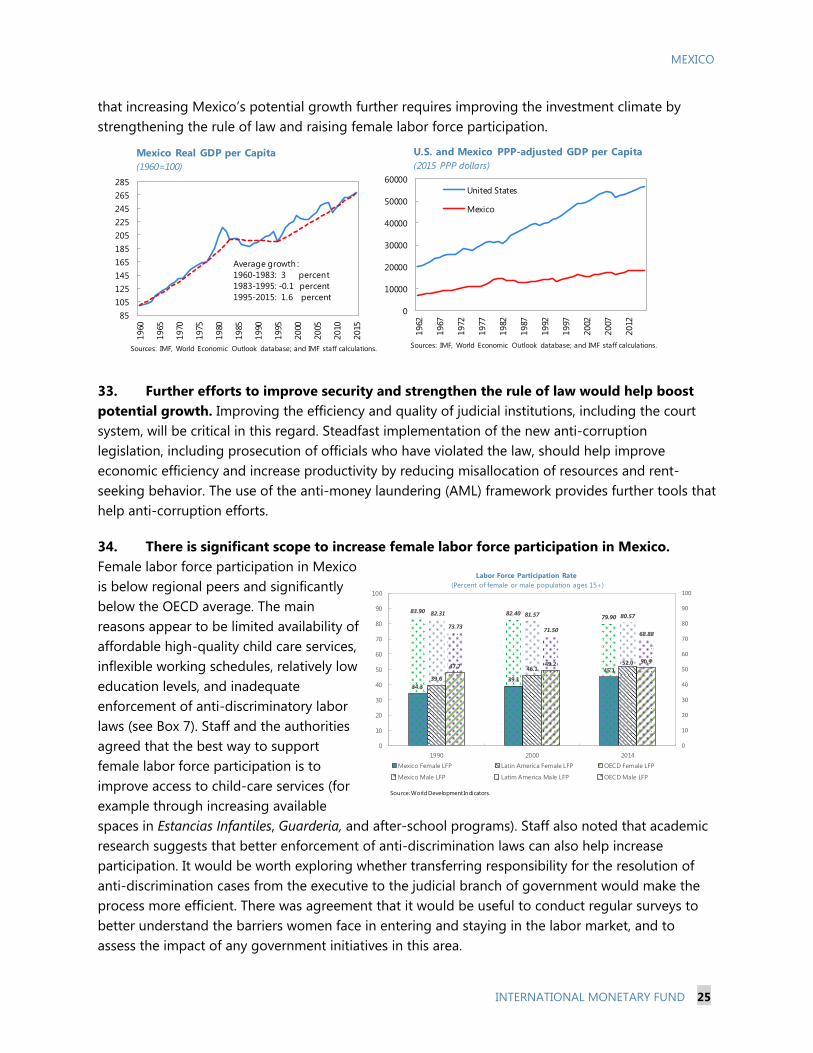
MEXICO
INTERNATIONAL MONETARY FUND 25
that increasing Mexico’s potential growth further requires improving the investment climate by strengthening the rule of law and raising female labor force participation.
33. Further efforts to improve security and strengthen the rule of law would help boost potential growth. Improving the efficiency and quality of judicial institutions, including the court system, will be critical in this regard. Steadfast implementation of the new anti-corruption legislation, including prosecution of officials who have violated the law, should help improve economic efficiency and increase productivity by reducing misallocation of resources and rent-seeking behavior. The use of the anti-money laundering (AML) framework provides further tools that help anti-corruption efforts.
34. There is significant scope to increase female labor force participation in Mexico. Female labor force participation in Mexico is below regional peers and significantly below the OECD average. The main reasons appear to be limited availability of affordable high-quality child care services, inflexible working schedules, relatively low education levels, and inadequate enforcement of anti-discriminatory labor laws (see Box 7). Staff and the authorities agreed that the best way to support female labor force participation is to improve access to child-care services (for example through increasing available spaces in Estancias Infantiles, Guarderia, and after-school programs). Staff also noted that academic research suggests that better enforcement of anti-discrimination laws can also help increase participation. It would be worth exploring whether transferring responsibility for the resolution of anti-discrimination cases from the executive to the judicial branch of government would make the process more efficient. There was agreement that it would be useful to conduct regular surveys to better understand the barriers women face in entering and staying in the labor market, and to assess the impact of any government initiatives in this area.
34.339.1
45.139.6
46.152.047.7 49.2 50.9
83.90 82.40 79.9082.31 81.57 80.57
73.73 71.5068.88
0
10
20
30
40
50
60
70
80
90
100
0
10
20
30
40
50
60
70
80
90
100
1990 2000 2014
Labor Force Participation Rate(Percent of female or male population ages 15+)
Mexico Female LFP Latin America Female LFP OECD Female LFP
Mexico Male LFP Latim America Male LFP OECD Male LFP
Source: World Development Indicators.
0
10000
20000
30000
40000
50000
60000
1962
1967
1972
1977
1982
1987
1992
1997
2002
2007
2012
United States
Mexico
U.S. and Mexico PPP-adjusted GDP per Capita (2015 PPP dollars)
Sources: IMF, World Economic Outlook database; and IMF staff calculations.
85105125145165185205225245265285
1960
1965
1970
1975
1980
1985
1990
1995
2000
2005
2010
2015
Average growth :1960-1983: 3 percent1983-1995: -0.1 percent1995-2015: 1.6 percent
Mexico Real GDP per Capita(1960=100)
Sources: IMF, World Economic Outlook database; and IMF staff calculations.

MEXICO
26 INTERNATIONAL MONETARY FUND
Box 7. Female Labor Force Participation Mexico has low female labor force participation (FLFP) compared to regional peers and OECD countries. Only 45 percent of Mexican women work outside the home—one woman for every two men—compared to an average of slightly over 50 percent in Latin America and in the OECD. Improvements in FLFP in Mexico over the past two decades have been noteworthy: female labor force participation increased by 6 percentage points in the last 15 years, and more than 10 percentage points since 1990. Nonetheless, there is significant room to boost to potential growth by increasing FLFP further.
Several factors appear to play a role in explaining the low FLFP in Mexico. Cultural attitudes, limited availability of affordable child care, low educational attainment, and poor enforcement of anti-discrimination laws all have been identified as important determinants of the low FLFP rate in the literature.
Limited availability of affordable, high-quality child-care services appears to be a major obstacle to participation in the labor market. There are two main child care programs: Estancias Infantiles (EI) and Guarderias. EI is a social means-tested program, providing child care for mothers outside the formal sector. Empirical evidence suggests that the program has been successful in increasing a woman’s probability of working, getting more stable jobs, and increasing their income (Calderon, 2014). Guarderias is a child-care program for mothers and single fathers employed in the formal sector. Both programs currently have spaces for only a small fraction of the eligible population.
A national survey done in 2010 (Encuesta Nacional sobre Discriminación en México) found that close to 40 percent of men believed that women should work only in traditional gender-appropriate jobs, and 25 percent thought that it is acceptable for female job applicants to be administered pregnancy tests. Discriminatory practices in hiring and employment have been outlawed in the 2013 labor reform, but enforcement appears to be challenging. Labor legislation disputes are adjudicated by arbitration boards associated with the Ministry of Labor. Arbitration often takes a long time, and workers who have won a dispute have been unable to collect their payment in 56 percent of the cases (Kaplan and Sadka 2008).
Labor force participation rates are lower for women than men at every level of education, but the difference narrows significantly at higher levels of education (the gap is only about 15 percentage points for those with college education or higher). Since the younger generations have higher education levels, the participation gap should narrow down gradually over time.
35. Mexico has made some progress in fostering inclusive growth, but significant challenges remain. Extreme poverty has declined since the mid-1990s, while education levels and access to health care have increased substantially. Access to basic services such as drinking water and electricity has also increased significantly. Programs such as Prospera (a successor of Oportunidades) and Seguro Popular have been credited with reducing poverty. Prospera is a conditional cash transfer program, which encourages school attendance, preventive health check-ups, and labor force participation. Seguro Popular has ensured nearly universal low-cost health-care coverage. Poverty among the elderly is being addressed through a means-tested social pension, the qualifying minimum age for which was reduced from 70 to 65 years in 2013. Despite these efforts, significant challenges remain. While the rates of poverty and income inequality have declined since the mid-1990s, they remain at very high levels (poverty rates have increased after the 2008 financial crisis). In the near term, policies should focus on improving the efficiency of social spending so that a larger share of the population could be served with the same resources. For example, the equity and efficiency of education spending could be strengthened by refocusing it on early education and

MEXICO
INTERNATIONAL MONETARY FUND 27
improving the quality of teaching. Access to quality health care could be improved through better coordination across health institutions to reduce redundancies, and promoting exchange of services between health-care networks. In the longer term, new initiatives aimed at increasing the labor force participation of women, better targeted labor training programs, and greater financial inclusion are needed to help foster inclusive growth.
36. The new National Strategy for Financial Inclusion paves the way to greater access to financial services by low-income households. The authorities have already taken a number of measures to promote financial inclusion. In particular, mobile transfers and payments have been made widely available. Increased access to ATM infrastructure has been ensured through sharing agreements. Basic banking services are being provided in rural areas through a network of authorized agents, including stores and cooperative saving societies. The National Financial Inclusion strategy, launched in June 2016, proposes a number of additional actions, including mandatory financial literacy education in schools, increasing the network of agents in underserved areas, designing incentives for retailers to increase the use of electronic payments, expanding the services provided by development banks in areas with no private financial institutions, and further strengthening of consumer protection.
37. The authorities noted that they will continue to devote significant efforts to reducing poverty and inequality and strengthening the position of women in society. They argued that the existing social programs have been effective in reducing extreme poverty; however, an important remaining challenge is to ensure that the beneficiaries of these programs eventually graduate and become part of the formal economy. The authorities agreed with the need to strengthen further the rule of law and noted that new anti-corruption legislation will help in that effort.
SAFEGUARDS ASSESSMENT 38. Staff has completed the safeguards procedures for Mexico’s 2016 FCL arrangement. The authorities provided the necessary authorization for Fund staff to communicate directly with Banco de Mexico’s external auditor, Mancera, S.C. (EY México). EY México issued an unqualified audit opinion on the Bank de Mexico’s 2015 financial statements. Staff reviewed the 2015 audit results and discussed these with EY México. Staff noted improvements in the quality and transparency of the annual financial statements, including commencement of their publication on the bank’s website. While no significant issues emerged from the conduct of the safeguards procedures, the authorities are taking steps to enhance the independence of the Audit Committee.
STAFF APPRAISAL 39. Mexico’s policies and policy frameworks remain very strong. The authorities are committed to a further gradual reduction in the fiscal deficit. The flexible exchange rate is helping facilitate the adjustment of the economy to external shocks, and monetary policy is focused on

MEXICO
28 INTERNATIONAL MONETARY FUND
maintaining price stability. The resilience of the financial system to shocks is supported by strong financial regulation and supervision. Mexico’s external position is broadly in line with macroeconomic fundamentals and desirable policy settings.
40. Moderate economic growth continues, accompanied by low and stable inflation. Real GDP growth is projected to grow by 2.1 percent in 2016 and 2¼ percent in 2017. Year-on-year headline and core inflation are at the 3-percent target and medium-term inflation expectations remain anchored. Continued implementation of structural reforms should lift potential growth in the medium term to about 2¾ percent.
41. However, Mexico’s economy is vulnerable to external shocks. The main risks include a rise in protectionism in key trading partners, weaker-than-expected growth in the U.S., renewed episodes of global financial market volatility, and lower oil production and prices. The flexible exchange rate and Mexico’s strong fundamentals provide resilience against adverse shocks. Targeted liquidity provision, debt duration management strategies, and temporary foreign exchange intervention can be used to prevent disorderly market conditions. The Flexible Credit Line remains an important complement to reserve buffers, providing insurance against tail risks.
42. Reducing the ratio of public debt to GDP is critical to maintain investor confidence. Public debt has increased steadily in recent years, reaching 54 percent of GDP in 2015. The authorities have committed to reduce the PSBR from 4.1 percent of GDP in 2015 to 2½ percent of GDP in 2018, which would put the public debt-to-GDP ratio on a downward trajectory in the medium term. The projected reduction of the fiscal deficit to 2.9 percent in 2017 is consistent with this commitment. Any future profit transfers from the Bank of Mexico and other positive revenue surprises should be used in full to bring the PSBR below the target and reduce net public debt. Further revenue measures could be considered in the medium term to avoid constraining capital spending excessively.
43. Increasing the profitability and efficiency of PEMEX is an important element of the fiscal consolidation plan. The company should take advantage of the increased autonomy and flexibility provided by the energy reform to focus on profitable core business activities. The intention to leverage its investment and increase efficiency through joint ventures with the private sector is welcome.
44. The current low energy prices provide an opportunity to eliminate non-targeted electricity subsidies. Low-income households could be compensated through the existing well-targeted cash transfer programs. The proposed early liberalization of gasoline prices in 2017 is welcome. The authorities could consider expanding the oil-price hedging program to reduce the volatility of revenue from domestic sales of oil.
45. Further enhancements to the fiscal framework could strengthen fiscal discipline. Establishing a non-partisan fiscal council would improve accountability and help inform the public debate on fiscal policy. It is desirable to have a tighter link between the desired level of public debt and medium-term PSBR targets. The exceptional circumstance clause should be used only in cases

MEXICO
INTERNATIONAL MONETARY FUND 29
of large output or oil price shocks and, once invoked, the return of the PSBR to the medium-term target should be explicitly defined in the law.
46. There is a need to address the challenges related to long-term demographic changes. Reducing public debt levels more aggressively in the medium term will provide space to accommodate higher spending pressures as the old-age dependency ratio rises in the longer term. Moreover, it is necessary to raise pension contributions to boost replacement rates under the defined-contribution system and reduce pressures on public social spending in the future.
47. Future monetary policy decisions will remain data-driven. In the absence of new shocks, there is a case for a pause in monetary policy tightening in the near term. Economic activity is expected to remain slightly below potential, wage pressures are subdued, and medium-term inflation expectations remain close to the inflation target. A temporary move of inflation above the target to accommodate relative price adjustments would not warrant a policy response, unless there is evidence of second round effects. Clear communication by the central bank will remain important in guiding market expectations.
48. The 2016 Financial Sector Assessment Program found that the balance sheets of financial institutions and non-financial corporations remain broadly resilient. Commercial banks are well capitalized and resilient to market, liquidity, and credit risks due to high capital buffers. Corporations would be able to weather further large shocks to the exchange rate or interest rates. While prudential oversight has improved since the 2012 FSAP, the latest assessment recommended strengthening consolidated supervision and enhancing some elements of the crisis-preparedness and deposits insurance frameworks. In addition, it would be critical to strengthen the governance of the financial supervisory agencies.
49. Further progress on improving security and the rule of law is critical to boost potential growth. In particular, it is important to enhance the efficiency and quality of judicial institutions, including the court system. Steadfast implementation and strong enforcement of the new anti-corruption legislation, as well as the AML framework, will be critical to improve governance.
50. Despite significant efforts to enhance social and economic inclusion, important challenges remain. Poverty and inequality remain high, female labor force participation is low by international comparison, and access to financial services is limited. In the near term, improving the efficiency of social spending would help ensure that a larger share of the population is reached with the same resources. Increased access to child-care services and better enforcement of anti-discrimination laws can help reduce gender imbalances and raise female labor force participation. The implementation of the new national strategy for financial inclusion would improve access to financial services for low-income households and small enterprises.
51. It is proposed that the next Article IV Consultation with Mexico take place on the standard 12-month cycle.

MEXICO
30 INTERNATIONAL MONETARY FUND
Figure 1. Mexico: Real Sector

MEXICO
INTERNATIONAL MONETARY FUND 31
Figure 2. Mexico: Prices and Inflation

MEXICO
32 INTERNATIONAL MONETARY FUND
Figure 3. Mexico: Financial Sector
Foreign ownership of domestic debt is significant...
.
(As of October 2016)
Sources: Bloomberg; National authorities; and Haver Analytics .
The peso has depreciated sharply vis-à-vis the U.S. dollar
and in real effective terms over the last two years.
ETF and mutual funds' inflows have recovered since the
decline in 2015 and early 2016.
Foreign holdings of local sovereign debt have fallen as a share of
GDP, and for CETES also in nominal terms.
...and corporate debt have declined in recent months.Risk credit spreads on sovereign dollar-denominated debt...
0
100
200
300
400
500
600
2008 2009 2010 2011 2012 2013 2014 2015 2016
Brazil
Colombia
Poland
Turkey
Mexico
Sovereign Risk Spreads
(5 year CDS spread, in basis points)
Nonetheless, long-term and government bond yields in
local currency have remained stable.
0
200
400
600
800
1,000
1,200
2008 2009 2010 2011 2012 2013 2014 2015 2016
Global
Latin America
Mexico
Corporate Risk Spread
(CEMBI spread, in basis points)
0
5
10
15
20
25
30
35
40
45
0
2
4
6
8
10
12
14
2008 2009 2010 2011 2012 2013 2014 2015 2016
Short-term (CETES)
Long-term
Foreign Holdings,
percent of tota l
debt (RHS)
Non-Residents' Holdings of Local Sovereign Debt
(In percent of GDP: as of September 2016)
80
90
100
110
120
130
140
8
10
12
14
16
18
20
2008 2009 2010 2011 2012 2013 2014 2015 2016
Nominal (MXN/USD)
Real effective exchange rate
(Index 2010=100, RHS)
Exchange Rate
-2.5
-2.0
-1.5
-1.0
-0.5
0.0
0.5
1.0
1.5
2.0
2.5
2010 2011 2012 2013 2014 2015 2016
Bonds
Equity
ETFs and Mutual Fund Flows
(USD, billions; as of September 2016 )
2
3
4
5
6
7
8
9
10
11
12
2008 2009 2010 2011 2012 2013 2014 2015 2016
1-year
5-year
10-year
20-year
Local Government Bond Yields
(In percent)

MEXICO
INTERNATIONAL MONETARY FUND 33
Figure 4. Mexico: External Sector
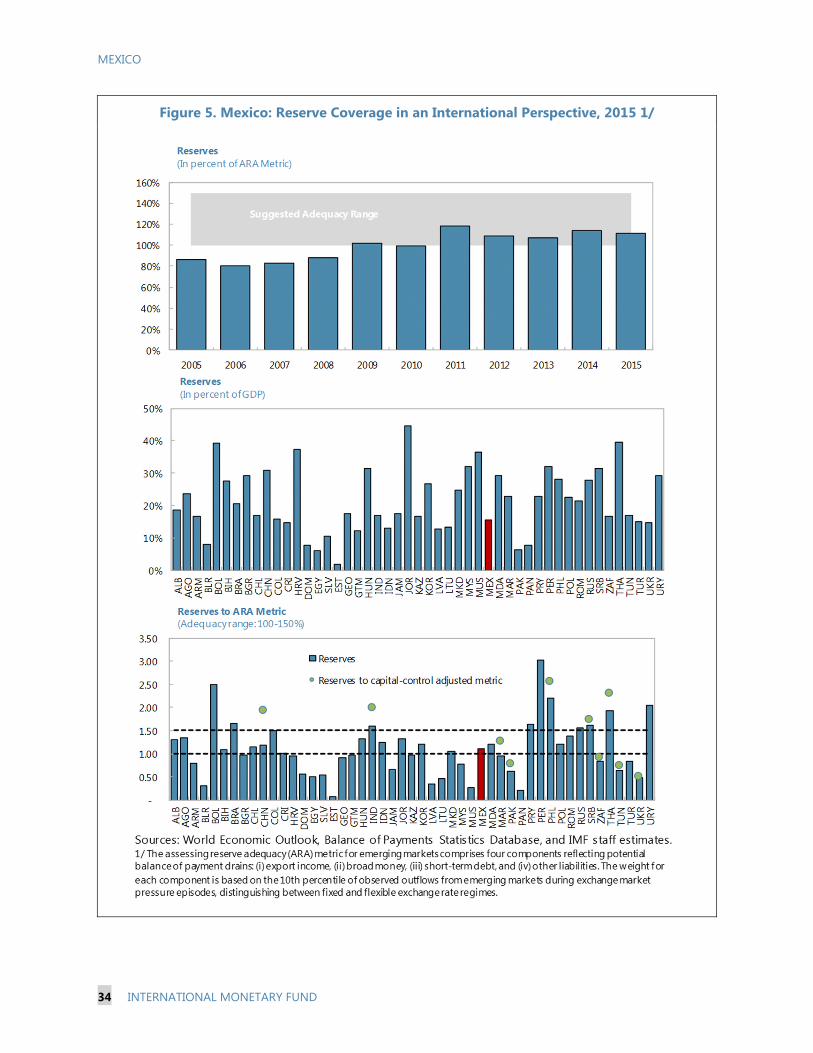
MEXICO
34 INTERNATIONAL MONETARY FUND
Figure 5. Mexico: Reserve Coverage in an International Perspective, 2015 1/

MEXICO
INTERNATIONAL MONETARY FUND 35
Figure 5. Mexico: Reserve Coverage in an International Perspective, 2015 (Concluded)

MEXICO
36 INTERNATIONAL MONETARY FUND
Figure 6. Mexico: Banking System

MEXICO
INTERNATIONAL MONETARY FUND 37
Figure 7. Mexico: Labor Market Indicators

MEXICO
38 INTERNATIONAL MONETARY FUND
Figure 8. Mexico: Nonfinancial Corporate Sector
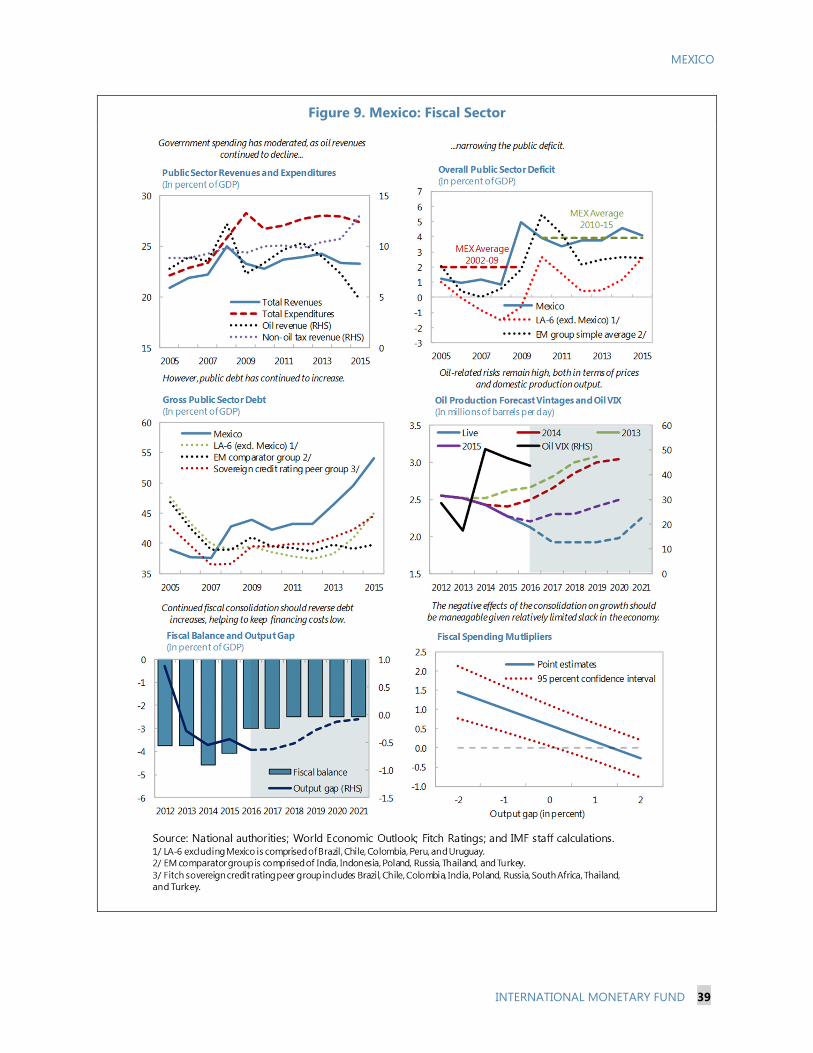
MEXICO
INTERNATIONAL MONETARY FUND 39
Figure 9. Mexico: Fiscal Sector
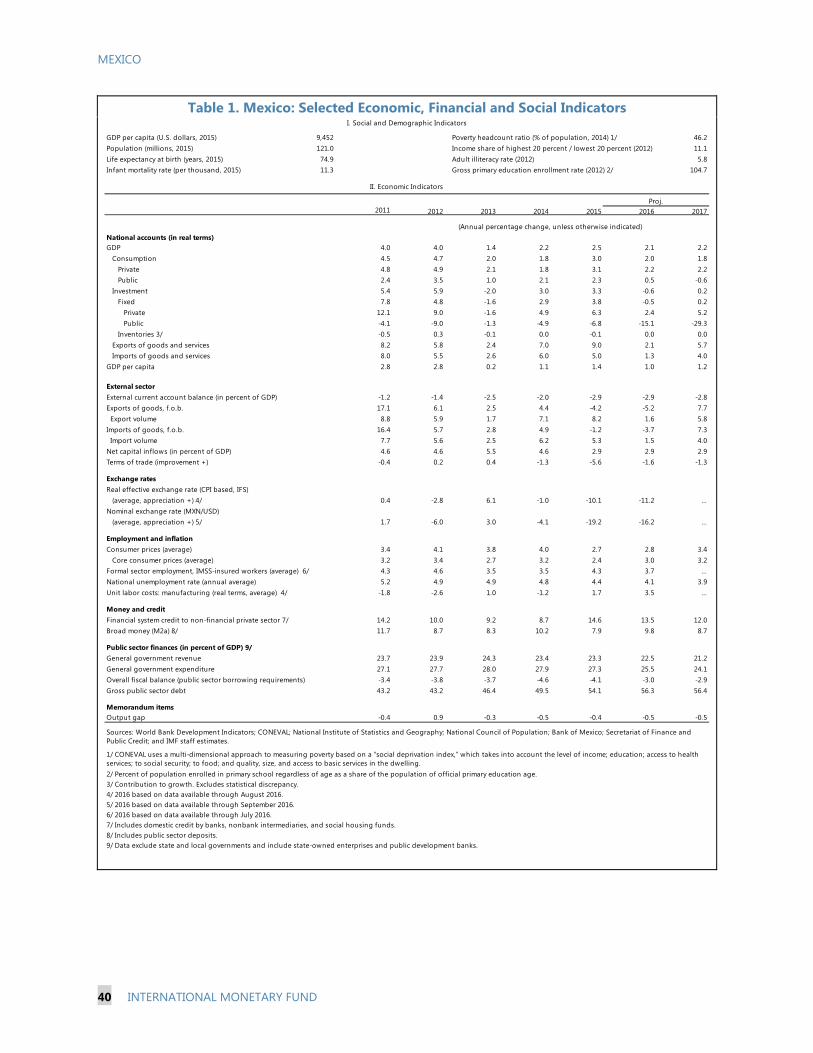
MEXICO
40 INTERNATIONAL MONETARY FUND
Table 1. Mexico: Selected Economic, Financial and Social Indicators
GDP per capita (U.S. dollars, 2015) 9,452 Poverty headcount ratio (% of population, 2014) 1/ 46.2Population (millions, 2015) 121.0 Income share of highest 20 percent / lowest 20 percent (2012) 11.1Life expectancy at birth (years, 2015) 74.9 Adult illiteracy rate (2012) 5.8Infant mortality rate (per thousand, 2015) 11.3 Gross primary education enrollment rate (2012) 2/ 104.7
2011 2012 2013 2014 2015 2016 2017
National accounts (in real terms)GDP 4.0 4.0 1.4 2.2 2.5 2.1 2.2
Consumption 4.5 4.7 2.0 1.8 3.0 2.0 1.8Private 4.8 4.9 2.1 1.8 3.1 2.2 2.2Public 2.4 3.5 1.0 2.1 2.3 0.5 -0.6
Investment 5.4 5.9 -2.0 3.0 3.3 -0.6 0.2Fixed 7.8 4.8 -1.6 2.9 3.8 -0.5 0.2
Private 12.1 9.0 -1.6 4.9 6.3 2.4 5.2Public -4.1 -9.0 -1.3 -4.9 -6.8 -15.1 -29.3
Inventories 3/ -0.5 0.3 -0.1 0.0 -0.1 0.0 0.0Exports of goods and services 8.2 5.8 2.4 7.0 9.0 2.1 5.7Imports of goods and services 8.0 5.5 2.6 6.0 5.0 1.3 4.0
GDP per capita 2.8 2.8 0.2 1.1 1.4 1.0 1.2
External sectorExternal current account balance (in percent of GDP) -1.2 -1.4 -2.5 -2.0 -2.9 -2.9 -2.8Exports of goods, f.o.b. 17.1 6.1 2.5 4.4 -4.2 -5.2 7.7 Export volume 8.8 5.9 1.7 7.1 8.2 1.6 5.8Imports of goods, f.o.b. 16.4 5.7 2.8 4.9 -1.2 -3.7 7.3 Import volume 7.7 5.6 2.5 6.2 5.3 1.5 4.0Net capital inflows (in percent of GDP) 4.6 4.6 5.5 4.6 2.9 2.9 2.9Terms of trade (improvement +) -0.4 0.2 0.4 -1.3 -5.6 -1.6 -1.3
Exchange ratesReal effective exchange rate (CPI based, IFS) (average, appreciation +) 4/ 0.4 -2.8 6.1 -1.0 -10.1 -11.2 …Nominal exchange rate (MXN/USD) (average, appreciation +) 5/ 1.7 -6.0 3.0 -4.1 -19.2 -16.2 …
Employment and inflationConsumer prices (average) 3.4 4.1 3.8 4.0 2.7 2.8 3.4
Core consumer prices (average) 3.2 3.4 2.7 3.2 2.4 3.0 3.2Formal sector employment, IMSS-insured workers (average) 6/ 4.3 4.6 3.5 3.5 4.3 3.7 …National unemployment rate (annual average) 5.2 4.9 4.9 4.8 4.4 4.1 3.9Unit labor costs: manufacturing (real terms, average) 4/ -1.8 -2.6 1.0 -1.2 1.7 3.5 …
Money and creditFinancial system credit to non-financial private sector 7/ 14.2 10.0 9.2 8.7 14.6 13.5 12.0Broad money (M2a) 8/ 11.7 8.7 8.3 10.2 7.9 9.8 8.7
Public sector finances (in percent of GDP) 9/General government revenue 23.7 23.9 24.3 23.4 23.3 22.5 21.2General government expenditure 27.1 27.7 28.0 27.9 27.3 25.5 24.1Overall fiscal balance (public sector borrowing requirements) -3.4 -3.8 -3.7 -4.6 -4.1 -3.0 -2.9Gross public sector debt 43.2 43.2 46.4 49.5 54.1 56.3 56.4
Memorandum itemsOutput gap -0.4 0.9 -0.3 -0.5 -0.4 -0.5 -0.5
2/ Percent of population enrolled in primary school regardless of age as a share of the population of official primary education age.3/ Contribution to growth. Excludes statistical discrepancy.4/ 2016 based on data available through August 2016.5/ 2016 based on data available through September 2016.6/ 2016 based on data available through July 2016.7/ Includes domestic credit by banks, nonbank intermediaries, and social housing funds.8/ Includes public sector deposits.9/ Data exclude state and local governments and include state-owned enterprises and public development banks.
I. Social and Demographic Indicators
Proj.
Sources: World Bank Development Indicators; CONEVAL; National Institute of Statistics and Geography; National Council of Population; Bank of Mexico; Secretariat of Finance and Public Credit; and IMF staff estimates.
1/ CONEVAL uses a multi-dimensional approach to measuring poverty based on a “social deprivation index,” which takes into account the level of income; education; access to health services; to social security; to food; and quality, size, and access to basic services in the dwelling.
(Annual percentage change, unless otherwise indicated)
II. Economic Indicators
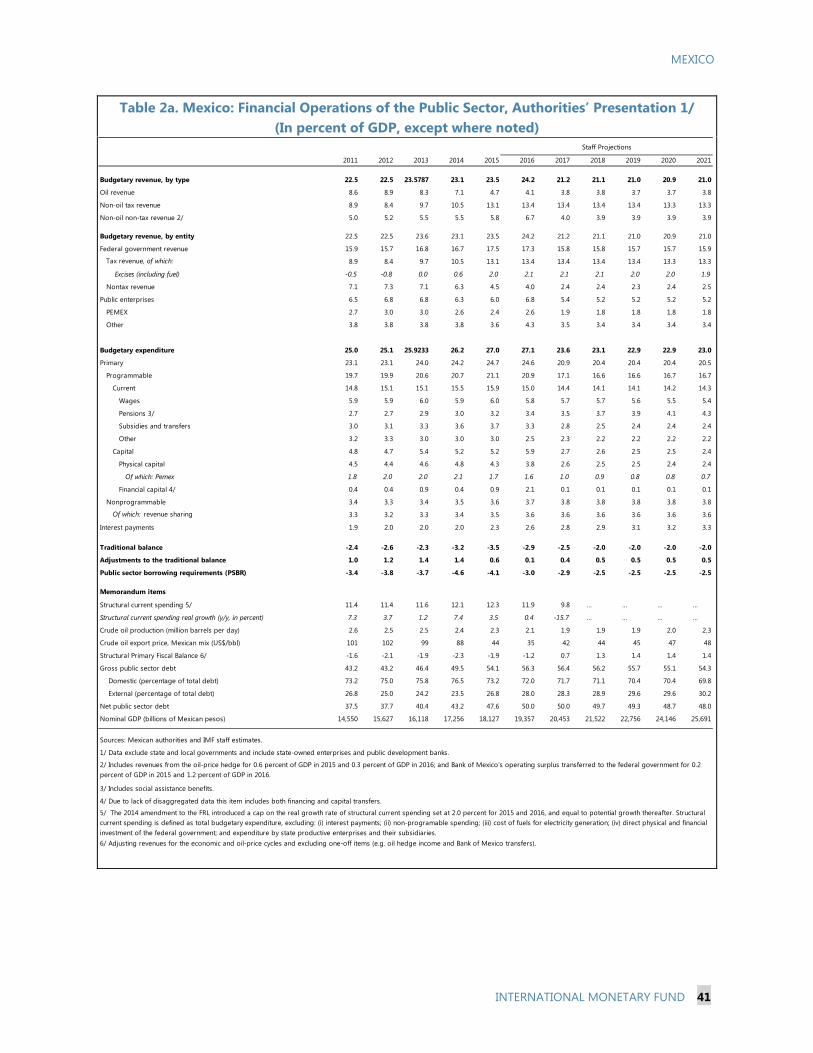
MEXICO
INTERNATIONAL MONETARY FUND 41
Table 2a. Mexico: Financial Operations of the Public Sector, Authorities’ Presentation 1/ (In percent of GDP, except where noted)
2011 2012 2013 2014 2015 2016 2017 2018 2019 2020 2021
Budgetary revenue, by type 22.5 22.5 23.5787 23.1 23.5 24.2 21.2 21.1 21.0 20.9 21.0
Oil revenue 8.6 8.9 8.3 7.1 4.7 4.1 3.8 3.8 3.7 3.7 3.8
Non-oil tax revenue 8.9 8.4 9.7 10.5 13.1 13.4 13.4 13.4 13.4 13.3 13.3
Non-oil non-tax revenue 2/ 5.0 5.2 5.5 5.5 5.8 6.7 4.0 3.9 3.9 3.9 3.9
Budgetary revenue, by entity 22.5 22.5 23.6 23.1 23.5 24.2 21.2 21.1 21.0 20.9 21.0
Federal government revenue 15.9 15.7 16.8 16.7 17.5 17.3 15.8 15.8 15.7 15.7 15.9
Tax revenue, of which: 8.9 8.4 9.7 10.5 13.1 13.4 13.4 13.4 13.4 13.3 13.3
Excises (including fuel) -0.5 -0.8 0.0 0.6 2.0 2.1 2.1 2.1 2.0 2.0 1.9
Nontax revenue 7.1 7.3 7.1 6.3 4.5 4.0 2.4 2.4 2.3 2.4 2.5
Public enterprises 6.5 6.8 6.8 6.3 6.0 6.8 5.4 5.2 5.2 5.2 5.2
PEMEX 2.7 3.0 3.0 2.6 2.4 2.6 1.9 1.8 1.8 1.8 1.8
Other 3.8 3.8 3.8 3.8 3.6 4.3 3.5 3.4 3.4 3.4 3.4
Budgetary expenditure 25.0 25.1 25.9233 26.2 27.0 27.1 23.6 23.1 22.9 22.9 23.0
Primary 23.1 23.1 24.0 24.2 24.7 24.6 20.9 20.4 20.4 20.4 20.5
Programmable 19.7 19.9 20.6 20.7 21.1 20.9 17.1 16.6 16.6 16.7 16.7
Current 14.8 15.1 15.1 15.5 15.9 15.0 14.4 14.1 14.1 14.2 14.3
Wages 5.9 5.9 6.0 5.9 6.0 5.8 5.7 5.7 5.6 5.5 5.4
Pensions 3/ 2.7 2.7 2.9 3.0 3.2 3.4 3.5 3.7 3.9 4.1 4.3
Subsidies and transfers 3.0 3.1 3.3 3.6 3.7 3.3 2.8 2.5 2.4 2.4 2.4
Other 3.2 3.3 3.0 3.0 3.0 2.5 2.3 2.2 2.2 2.2 2.2
Capital 4.8 4.7 5.4 5.2 5.2 5.9 2.7 2.6 2.5 2.5 2.4
Physical capital 4.5 4.4 4.6 4.8 4.3 3.8 2.6 2.5 2.5 2.4 2.4
Of which: Pemex 1.8 2.0 2.0 2.1 1.7 1.6 1.0 0.9 0.8 0.8 0.7
Financial capital 4/ 0.4 0.4 0.9 0.4 0.9 2.1 0.1 0.1 0.1 0.1 0.1
Nonprogrammable 3.4 3.3 3.4 3.5 3.6 3.7 3.8 3.8 3.8 3.8 3.8
Of which: revenue sharing 3.3 3.2 3.3 3.4 3.5 3.6 3.6 3.6 3.6 3.6 3.6
Interest payments 1.9 2.0 2.0 2.0 2.3 2.6 2.8 2.9 3.1 3.2 3.3
Traditional balance -2.4 -2.6 -2.3 -3.2 -3.5 -2.9 -2.5 -2.0 -2.0 -2.0 -2.0
Adjustments to the traditional balance 1.0 1.2 1.4 1.4 0.6 0.1 0.4 0.5 0.5 0.5 0.5
Public sector borrowing requirements (PSBR) -3.4 -3.8 -3.7 -4.6 -4.1 -3.0 -2.9 -2.5 -2.5 -2.5 -2.5
Memorandum items
Structural current spending 5/ 11.4 11.4 11.6 12.1 12.3 11.9 9.8 … … … …
Structural current spending real growth (y/y, in percent) 7.3 3.7 1.2 7.4 3.5 0.4 -15.7 … … … …
Crude oil production (million barrels per day) 2.6 2.5 2.5 2.4 2.3 2.1 1.9 1.9 1.9 2.0 2.3
Crude oil export price, Mexican mix (US$/bbl) 101 102 99 88 44 35 42 44 45 47 48
Structural Primary Fiscal Balance 6/ -1.6 -2.1 -1.9 -2.3 -1.9 -1.2 0.7 1.3 1.4 1.4 1.4
Gross public sector debt 43.2 43.2 46.4 49.5 54.1 56.3 56.4 56.2 55.7 55.1 54.3
Domestic (percentage of total debt) 73.2 75.0 75.8 76.5 73.2 72.0 71.7 71.1 70.4 70.4 69.8
External (percentage of total debt) 26.8 25.0 24.2 23.5 26.8 28.0 28.3 28.9 29.6 29.6 30.2
Net public sector debt 37.5 37.7 40.4 43.2 47.6 50.0 50.0 49.7 49.3 48.7 48.0
Nominal GDP (billions of Mexican pesos) 14,550 15,627 16,118 17,256 18,127 19,357 20,453 21,522 22,756 24,146 25,691
3/ Includes social assistance benefits.
4/ Due to lack of disaggregated data this item includes both financing and capital transfers.
6/ Adjusting revenues for the economic and oil-price cycles and excluding one-off items (e.g. oil hedge income and Bank of Mexico transfers).
1/ Data exclude state and local governments and include state-owned enterprises and public development banks.
Sources: Mexican authorities and IMF staff estimates.
Staff Projections
2/ Includes revenues from the oil-price hedge for 0.6 percent of GDP in 2015 and 0.3 percent of GDP in 2016; and Bank of Mexico's operating surplus transferred to the federal government for 0.2 percent of GDP in 2015 and 1.2 percent of GDP in 2016.
5/ The 2014 amendment to the FRL introduced a cap on the real growth rate of structural current spending set at 2.0 percent for 2015 and 2016, and equal to potential growth thereafter. Structural current spending is defined as total budgetary expenditure, excluding: (i) interest payments; (ii) non-programable spending; (iii) cost of fuels for electricity generation; (iv) direct physical and financial investment of the federal government; and expenditure by state productive enterprises and their subsidiaries.
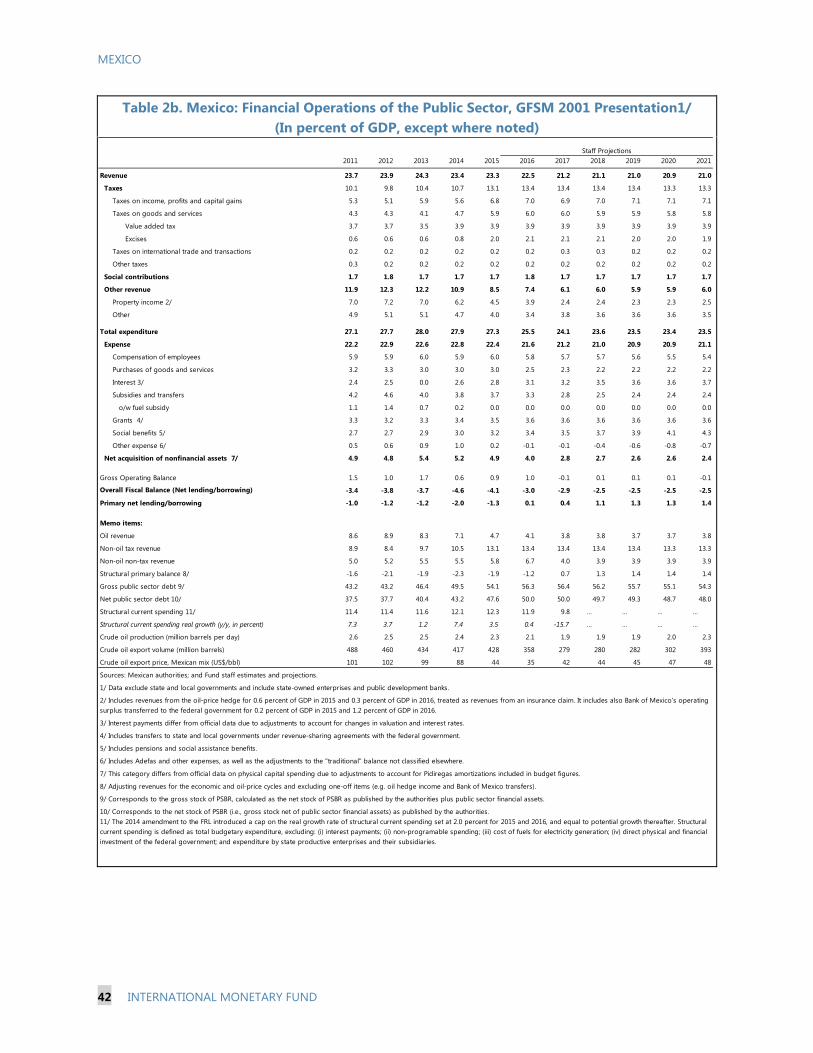
MEXICO
42 INTERNATIONAL MONETARY FUND
Table 2b. Mexico: Financial Operations of the Public Sector, GFSM 2001 Presentation1/ (In percent of GDP, except where noted)
2011 2012 2013 2014 2015 2016 2017 2018 2019 2020 2021
Revenue 23.7 23.9 24.3 23.4 23.3 22.5 21.2 21.1 21.0 20.9 21.0
Taxes 10.1 9.8 10.4 10.7 13.1 13.4 13.4 13.4 13.4 13.3 13.3
Taxes on income, profits and capital gains 5.3 5.1 5.9 5.6 6.8 7.0 6.9 7.0 7.1 7.1 7.1
Taxes on goods and services 4.3 4.3 4.1 4.7 5.9 6.0 6.0 5.9 5.9 5.8 5.8
Value added tax 3.7 3.7 3.5 3.9 3.9 3.9 3.9 3.9 3.9 3.9 3.9
Excises 0.6 0.6 0.6 0.8 2.0 2.1 2.1 2.1 2.0 2.0 1.9
Taxes on international trade and transactions 0.2 0.2 0.2 0.2 0.2 0.2 0.3 0.3 0.2 0.2 0.2
Other taxes 0.3 0.2 0.2 0.2 0.2 0.2 0.2 0.2 0.2 0.2 0.2
Social contributions 1.7 1.8 1.7 1.7 1.7 1.8 1.7 1.7 1.7 1.7 1.7
Other revenue 11.9 12.3 12.2 10.9 8.5 7.4 6.1 6.0 5.9 5.9 6.0
Property income 2/ 7.0 7.2 7.0 6.2 4.5 3.9 2.4 2.4 2.3 2.3 2.5
Other 4.9 5.1 5.1 4.7 4.0 3.4 3.8 3.6 3.6 3.6 3.5
Total expenditure 27.1 27.7 28.0 27.9 27.3 25.5 24.1 23.6 23.5 23.4 23.5
Expense 22.2 22.9 22.6 22.8 22.4 21.6 21.2 21.0 20.9 20.9 21.1
Compensation of employees 5.9 5.9 6.0 5.9 6.0 5.8 5.7 5.7 5.6 5.5 5.4
Purchases of goods and services 3.2 3.3 3.0 3.0 3.0 2.5 2.3 2.2 2.2 2.2 2.2
Interest 3/ 2.4 2.5 0.0 2.6 2.8 3.1 3.2 3.5 3.6 3.6 3.7
Subsidies and transfers 4.2 4.6 4.0 3.8 3.7 3.3 2.8 2.5 2.4 2.4 2.4
o/w fuel subsidy 1.1 1.4 0.7 0.2 0.0 0.0 0.0 0.0 0.0 0.0 0.0
Grants 4/ 3.3 3.2 3.3 3.4 3.5 3.6 3.6 3.6 3.6 3.6 3.6
Social benefits 5/ 2.7 2.7 2.9 3.0 3.2 3.4 3.5 3.7 3.9 4.1 4.3
Other expense 6/ 0.5 0.6 0.9 1.0 0.2 -0.1 -0.1 -0.4 -0.6 -0.8 -0.7
Net acquisition of nonfinancial assets 7/ 4.9 4.8 5.4 5.2 4.9 4.0 2.8 2.7 2.6 2.6 2.4
Gross Operating Balance 1.5 1.0 1.7 0.6 0.9 1.0 -0.1 0.1 0.1 0.1 -0.1
Overall Fiscal Balance (Net lending/borrowing) -3.4 -3.8 -3.7 -4.6 -4.1 -3.0 -2.9 -2.5 -2.5 -2.5 -2.5
Primary net lending/borrowing -1.0 -1.2 -1.2 -2.0 -1.3 0.1 0.4 1.1 1.3 1.3 1.4
Memo items:
Oil revenue 8.6 8.9 8.3 7.1 4.7 4.1 3.8 3.8 3.7 3.7 3.8
Non-oil tax revenue 8.9 8.4 9.7 10.5 13.1 13.4 13.4 13.4 13.4 13.3 13.3
Non-oil non-tax revenue 5.0 5.2 5.5 5.5 5.8 6.7 4.0 3.9 3.9 3.9 3.9
Structural primary balance 8/ -1.6 -2.1 -1.9 -2.3 -1.9 -1.2 0.7 1.3 1.4 1.4 1.4
Gross public sector debt 9/ 43.2 43.2 46.4 49.5 54.1 56.3 56.4 56.2 55.7 55.1 54.3
Net public sector debt 10/ 37.5 37.7 40.4 43.2 47.6 50.0 50.0 49.7 49.3 48.7 48.0
Structural current spending 11/ 11.4 11.4 11.6 12.1 12.3 11.9 9.8 … … … …
Structural current spending real growth (y/y, in percent) 7.3 3.7 1.2 7.4 3.5 0.4 -15.7 … … … …
Crude oil production (million barrels per day) 2.6 2.5 2.5 2.4 2.3 2.1 1.9 1.9 1.9 2.0 2.3
Crude oil export volume (million barrels) 488 460 434 417 428 358 279 280 282 302 393
Crude oil export price, Mexican mix (US$/bbl) 101 102 99 88 44 35 42 44 45 47 48
Sources: Mexican authorities; and Fund staff estimates and projections.
1/ Data exclude state and local governments and include state-owned enterprises and public development banks.
3/ Interest payments differ from official data due to adjustments to account for changes in valuation and interest rates.
4/ Includes transfers to state and local governments under revenue-sharing agreements with the federal government.
5/ Includes pensions and social assistance benefits.
6/ Includes Adefas and other expenses, as well as the adjustments to the "traditional" balance not classified elsewhere.
7/ This category differs from official data on physical capital spending due to adjustments to account for Pidiregas amortizations included in budget figures.
10/ Corresponds to the net stock of PSBR (i.e., gross stock net of public sector financial assets) as published by the authorities.
9/ Corresponds to the gross stock of PSBR, calculated as the net stock of PSBR as published by the authorities plus public sector financial assets.
8/ Adjusting revenues for the economic and oil-price cycles and excluding one-off items (e.g. oil hedge income and Bank of Mexico transfers).
Staff Projections
2/ Includes revenues from the oil-price hedge for 0.6 percent of GDP in 2015 and 0.3 percent of GDP in 2016, treated as revenues from an insurance claim. It includes also Bank of Mexico's operating surplus transferred to the federal government for 0.2 percent of GDP in 2015 and 1.2 percent of GDP in 2016.
11/ The 2014 amendment to the FRL introduced a cap on the real growth rate of structural current spending set at 2.0 percent for 2015 and 2016, and equal to potential growth thereafter. Structural current spending is defined as total budgetary expenditure, excluding: (i) interest payments; (ii) non-programable spending; (iii) cost of fuels for electricity generation; (iv) direct physical and financial investment of the federal government; and expenditure by state productive enterprises and their subsidiaries.
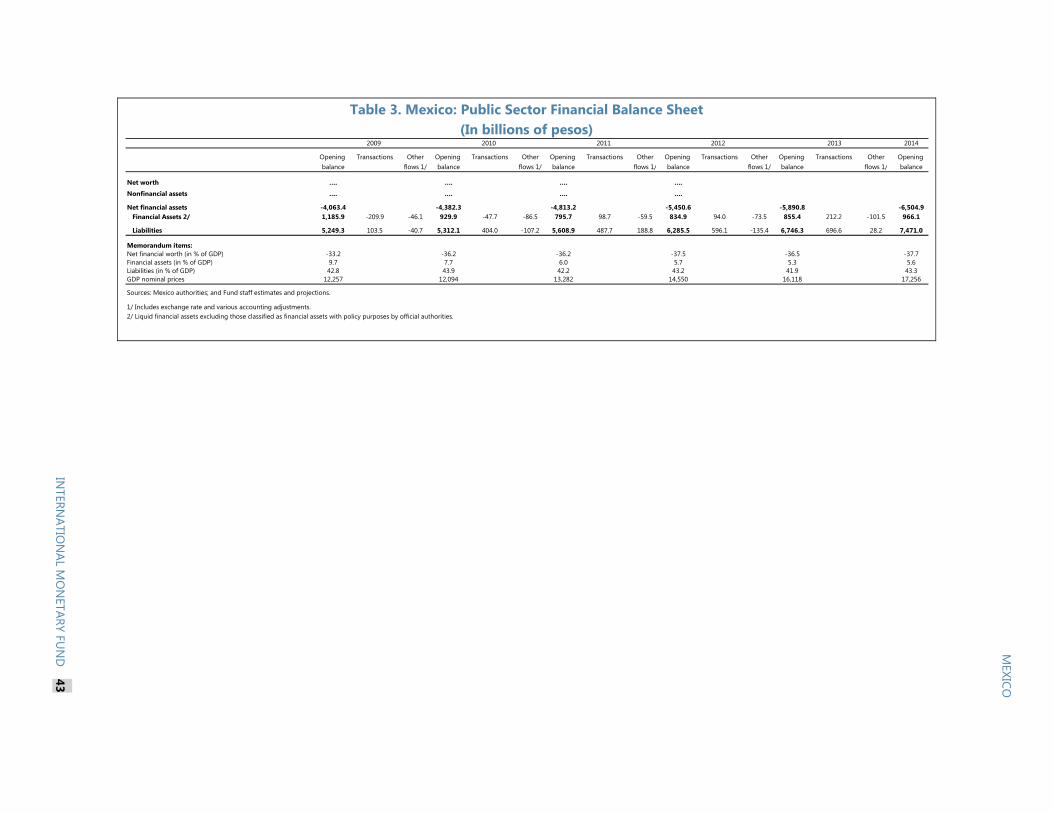
MEXICO
MEXICO
Table 3. Mexico: Public Sector Financial Balance Sheet (In billions of pesos)
MEXICO
INTERN
ATION
AL MO
NETARY FU
ND
43
2014
Opening Transactions Other Opening Transactions Other Opening Transactions Other Opening Transactions Other Opening Transactions Other Opening balance flows 1/ balance flows 1/ balance flows 1/ balance flows 1/ balance flows 1/ balance
Net worth …. …. …. ….
Nonfinancial assets …. …. …. ….
Net financial assets -4,063.4 -4,382.3 -4,813.2 -5,450.6 -5,890.8 -6,504.9 Financial Assets 2/ 1,185.9 -209.9 -46.1 929.9 -47.7 -86.5 795.7 98.7 -59.5 834.9 94.0 -73.5 855.4 212.2 -101.5 966.1
Liabilities 5,249.3 103.5 -40.7 5,312.1 404.0 -107.2 5,608.9 487.7 188.8 6,285.5 596.1 -135.4 6,746.3 696.6 28.2 7,471.0
Memorandum items:Net financial worth (in % of GDP) -33.2 -36.2 -36.2 -37.5 -36.5 -37.7Financial assets (in % of GDP) 9.7 7.7 6.0 5.7 5.3 5.6Liabilities (in % of GDP) 42.8 43.9 42.2 43.2 41.9 43.3GDP nominal prices 12,257 12,094 13,282 14,550 16,118 17,256
Sources: Mexico authorities; and Fund staff estimates and projections.
1/ Includes exchange rate and various accounting adjustments. 2/ Liquid financial assets excluding those classified as financial assets with policy purposes by official authorities.
2009 2010 2011 2012 2013
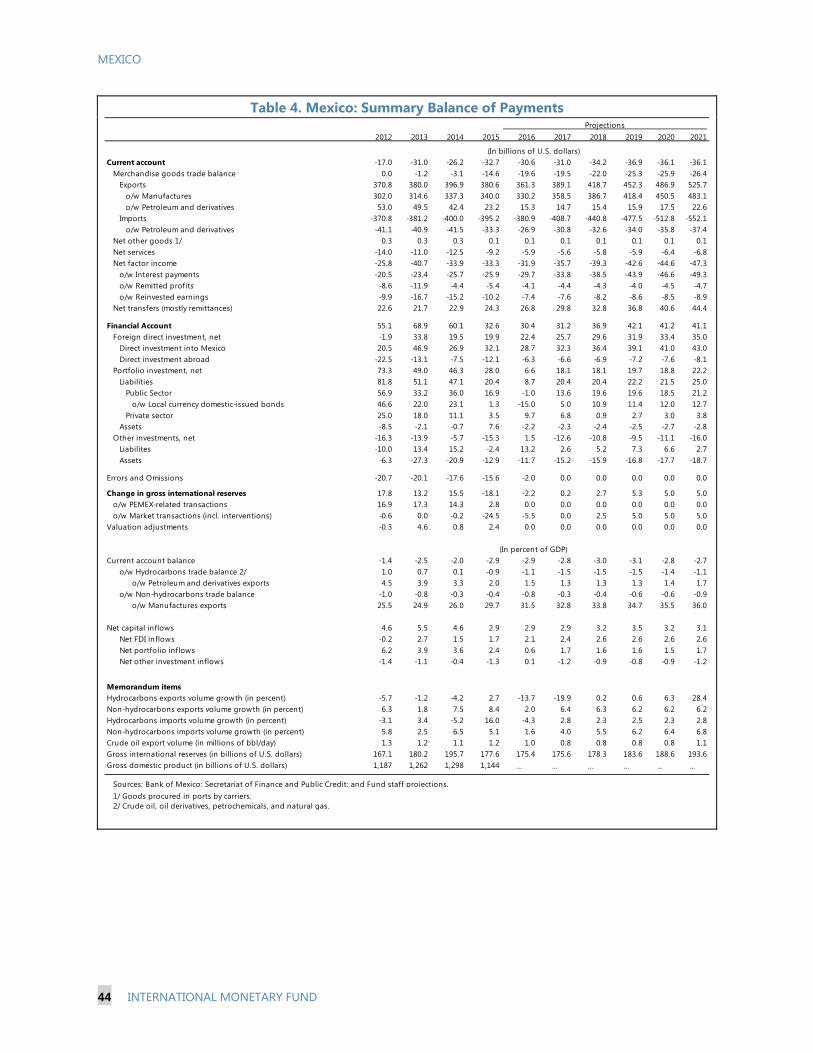
MEXICO
44 INTERNATIONAL MONETARY FUND
Table 4. Mexico: Summary Balance of Payments
2012 2013 2014 2015 2016 2017 2018 2019 2020 2021
Current account -17.0 -31.0 -26.2 -32.7 -30.6 -31.0 -34.2 -36.9 -36.1 -36.1Merchandise goods trade balance 0.0 -1.2 -3.1 -14.6 -19.6 -19.5 -22.0 -25.3 -25.9 -26.4
Exports 370.8 380.0 396.9 380.6 361.3 389.1 418.7 452.3 486.9 525.7o/w Manufactures 302.0 314.6 337.3 340.0 330.2 358.5 386.7 418.4 450.5 483.1o/w Petroleum and derivatives 53.0 49.5 42.4 23.2 15.3 14.7 15.4 15.9 17.5 22.6
Imports -370.8 -381.2 -400.0 -395.2 -380.9 -408.7 -440.8 -477.5 -512.8 -552.1o/w Petroleum and derivatives -41.1 -40.9 -41.5 -33.3 -26.9 -30.8 -32.6 -34.0 -35.8 -37.4
Net other goods 1/ 0.3 0.3 0.3 0.1 0.1 0.1 0.1 0.1 0.1 0.1Net services -14.0 -11.0 -12.5 -9.2 -5.9 -5.6 -5.8 -5.9 -6.4 -6.8Net factor income -25.8 -40.7 -33.9 -33.3 -31.9 -35.7 -39.3 -42.6 -44.6 -47.3
o/w Interest payments -20.5 -23.4 -25.7 -25.9 -29.7 -33.8 -38.5 -43.9 -46.6 -49.3o/w Remitted profits -8.6 -11.9 -4.4 -5.4 -4.1 -4.4 -4.3 -4.0 -4.5 -4.7o/w Reinvested earnings -9.9 -16.7 -15.2 -10.2 -7.4 -7.6 -8.2 -8.6 -8.5 -8.9
Net transfers (mostly remittances) 22.6 21.7 22.9 24.3 26.8 29.8 32.8 36.8 40.6 44.4
Financial Account 55.1 68.9 60.1 32.6 30.4 31.2 36.9 42.1 41.2 41.1Foreign direct investment, net -1.9 33.8 19.5 19.9 22.4 25.7 29.6 31.9 33.4 35.0
Direct investment into Mexico 20.5 46.9 26.9 32.1 28.7 32.3 36.4 39.1 41.0 43.0Direct investment abroad -22.5 -13.1 -7.5 -12.1 -6.3 -6.6 -6.9 -7.2 -7.6 -8.1
Portfolio investment, net 73.3 49.0 46.3 28.0 6.6 18.1 18.1 19.7 18.8 22.2Liabilities 81.8 51.1 47.1 20.4 8.7 20.4 20.4 22.2 21.5 25.0
Public Sector 56.9 33.2 36.0 16.9 -1.0 13.6 19.6 19.6 18.5 21.2o/w Local currency domestic-issued bonds 46.6 22.0 23.1 1.3 -15.0 5.0 10.9 11.4 12.0 12.7
Private sector 25.0 18.0 11.1 3.5 9.7 6.8 0.9 2.7 3.0 3.8Assets -8.5 -2.1 -0.7 7.6 -2.2 -2.3 -2.4 -2.5 -2.7 -2.8
Other investments, net -16.3 -13.9 -5.7 -15.3 1.5 -12.6 -10.8 -9.5 -11.1 -16.0Liabilites -10.0 13.4 15.2 -2.4 13.2 2.6 5.2 7.3 6.6 2.7Assets -6.3 -27.3 -20.9 -12.9 -11.7 -15.2 -15.9 -16.8 -17.7 -18.7
Errors and Omissions -20.7 -20.1 -17.6 -15.6 -2.0 0.0 0.0 0.0 0.0 0.0
Change in gross international reserves 17.8 13.2 15.5 -18.1 -2.2 0.2 2.7 5.3 5.0 5.0o/w PEMEX-related transactions 16.9 17.3 14.3 2.8 0.0 0.0 0.0 0.0 0.0 0.0o/w Market transactions (incl. interventions) -0.6 0.0 -0.2 -24.5 -5.5 0.0 2.5 5.0 5.0 5.0
Valuation adjustments -0.3 4.6 0.8 2.4 0.0 0.0 0.0 0.0 0.0 0.0
Current account balance -1.4 -2.5 -2.0 -2.9 -2.9 -2.8 -3.0 -3.1 -2.8 -2.7o/w Hydrocarbons trade balance 2/ 1.0 0.7 0.1 -0.9 -1.1 -1.5 -1.5 -1.5 -1.4 -1.1
o/w Petroleum and derivatives exports 4.5 3.9 3.3 2.0 1.5 1.3 1.3 1.3 1.4 1.7o/w Non-hydrocarbons trade balance -1.0 -0.8 -0.3 -0.4 -0.8 -0.3 -0.4 -0.6 -0.6 -0.9
o/w Manufactures exports 25.5 24.9 26.0 29.7 31.5 32.8 33.8 34.7 35.5 36.0
Net capital inflows 4.6 5.5 4.6 2.9 2.9 2.9 3.2 3.5 3.2 3.1Net FDI inflows -0.2 2.7 1.5 1.7 2.1 2.4 2.6 2.6 2.6 2.6Net portfolio inflows 6.2 3.9 3.6 2.4 0.6 1.7 1.6 1.6 1.5 1.7Net other investment inflows -1.4 -1.1 -0.4 -1.3 0.1 -1.2 -0.9 -0.8 -0.9 -1.2
Memorandum itemsHydrocarbons exports volume growth (in percent) -5.7 -1.2 -4.2 2.7 -13.7 -19.9 0.2 0.6 6.3 28.4Non-hydrocarbons exports volume growth (in percent) 6.3 1.8 7.5 8.4 2.0 6.4 6.3 6.2 6.2 6.2Hydrocarbons imports volume growth (in percent) -3.1 3.4 -5.2 16.0 -4.3 2.8 2.3 2.5 2.3 2.8Non-hydrocarbons imports volume growth (in percent) 5.8 2.5 6.5 5.1 1.6 4.0 5.5 6.2 6.4 6.8Crude oil export volume (in millions of bbl/day) 1.3 1.2 1.1 1.2 1.0 0.8 0.8 0.8 0.8 1.1Gross international reserves (in billions of U.S. dollars) 167.1 180.2 195.7 177.6 175.4 175.6 178.3 183.6 188.6 193.6Gross domestic product (in billions of U.S. dollars) 1,187 1,262 1,298 1,144 … … … … … …
Sources: Bank of Mexico; Secretariat of Finance and Public Credit; and Fund staff projections. 1/ Goods procured in ports by carriers. 2/ Crude oil, oil derivatives, petrochemicals, and natural gas.
Projections
(In percent of GDP)
(In billions of U.S. dollars)

Table 5. Mexico: Financial Soundness Indicators 1/ (In percent)
INTERN
ATION
AL MO
NETARY FU
ND
45
MEXICO
2010 2011 2012 2013 2014 2015 2016
Capital Adequacy
Regulatory capital to risk-weighted assets 2/ 16.9 15.7 15.9 15.6 15.8 15.0 14.8
Regulatory Tier 1 capital to risk-weighted assets 2/ 14.9 13.6 13.8 13.4 13.8 13.3 13.3
Capital to assets 10.4 9.9 10.6 10.4 10.8 10.4 10.7
Gross asset position in financial derivatives to capital 56.5 77.5 77.1 73.5 56.0 61.1 71.0
Gross liability position in financial derivatives to capital 55.6 79.6 76.1 72.7 59.6 65.1 76.9
Asset Quality
Nonperforming loans to total gross loans 2.0 2.1 2.4 3.2 3.0 2.5 2.3
Provisions to Nonperforming loans 200.6 189.6 185.2 147.5 132.7 140.5 147.7
Earnings and Profitability
Return on assets 1.8 1.5 1.8 2.1 1.7 1.6 1.7
Return on equity 16.8 15.5 17.5 19.3 15.9 15.4 16.5
Liquidity
Liquid assets to short-term liabilities 58.2 55.3 49.5 47.7 47.1 45.5 43.3
Liquid assets to total assets 43.3 41.7 36.3 36.0 36.0 34.6 32.3
Customer deposits to total (noninterbank) loans 94.4 89.7 88.5 88.7 89.5 87.7 87.2
Trading income to total income 5.0 3.6 4.8 7.4 4.0 3.3 4.1
Sources: Financial Soundness Indicators
1/ Latest data as of July 2016 unless otherwise indicated.2/ Latest data as of June 2016.
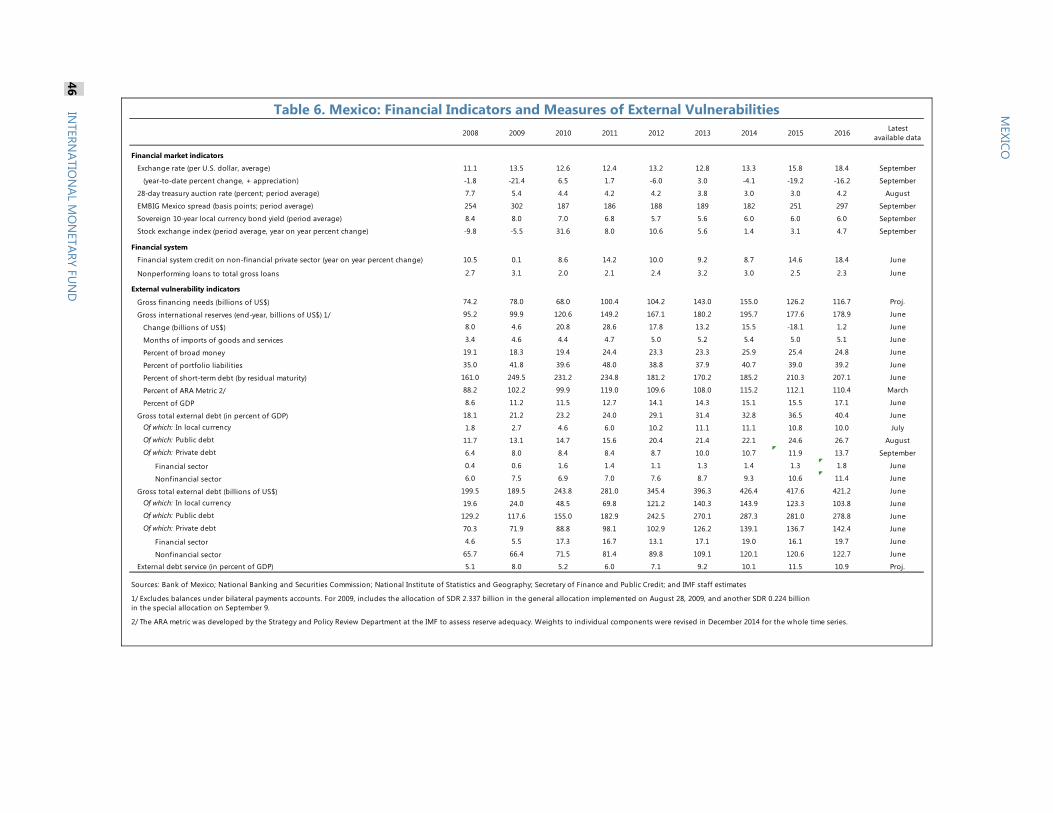
MEXICO
Table 6. Mexico: Financial Indicators and Measures of External Vulnerabilities 2008 2009 2010 2011 2012 2013 2014 2015 2016 Latest
available data
Financial market indicators
Exchange rate (per U.S. dollar, average) 11.1 13.5 12.6 12.4 13.2 12.8 13.3 15.8 18.4 September
(year-to-date percent change, + appreciation) -1.8 -21.4 6.5 1.7 -6.0 3.0 -4.1 -19.2 -16.2 September
28-day treasury auction rate (percent; period average) 7.7 5.4 4.4 4.2 4.2 3.8 3.0 3.0 4.2 August
EMBIG Mexico spread (basis points; period average) 254 302 187 186 188 189 182 251 297 September
Sovereign 10-year local currency bond yield (period average) 8.4 8.0 7.0 6.8 5.7 5.6 6.0 6.0 6.0 September
Stock exchange index (period average, year on year percent change) -9.8 -5.5 31.6 8.0 10.6 5.6 1.4 3.1 4.7 September
Financial system
Financial system credit on non-financial private sector (year on year percent change) 10.5 0.1 8.6 14.2 10.0 9.2 8.7 14.6 18.4 June
Nonperforming loans to total gross loans 2.7 3.1 2.0 2.1 2.4 3.2 3.0 2.5 2.3 June
External vulnerability indicators
Gross financing needs (billions of US$) 74.2 78.0 68.0 100.4 104.2 143.0 155.0 126.2 116.7 Proj.
Gross international reserves (end-year, billions of US$) 1/ 95.2 99.9 120.6 149.2 167.1 180.2 195.7 177.6 178.9 June
Change (billions of US$) 8.0 4.6 20.8 28.6 17.8 13.2 15.5 -18.1 1.2 June
Months of imports of goods and services 3.4 4.6 4.4 4.7 5.0 5.2 5.4 5.0 5.1 June
Percent of broad money 19.1 18.3 19.4 24.4 23.3 23.3 25.9 25.4 24.8 June
Percent of portfolio liabilities 35.0 41.8 39.6 48.0 38.8 37.9 40.7 39.0 39.2 June
Percent of short-term debt (by residual maturity) 161.0 249.5 231.2 234.8 181.2 170.2 185.2 210.3 207.1 June
Percent of ARA Metric 2/ 88.2 102.2 99.9 119.0 109.6 108.0 115.2 112.1 110.4 March
Percent of GDP 8.6 11.2 11.5 12.7 14.1 14.3 15.1 15.5 17.1 June
Gross total external debt (in percent of GDP) 18.1 21.2 23.2 24.0 29.1 31.4 32.8 36.5 40.4 June
Of which: In local currency 1.8 2.7 4.6 6.0 10.2 11.1 11.1 10.8 10.0 July
Of which: Public debt 11.7 13.1 14.7 15.6 20.4 21.4 22.1 24.6 26.7 August
Of which: Private debt 6.4 8.0 8.4 8.4 8.7 10.0 10.7 11.9 13.7 September
Financial sector 0.4 0.6 1.6 1.4 1.1 1.3 1.4 1.3 1.8 June
Nonfinancial sector 6.0 7.5 6.9 7.0 7.6 8.7 9.3 10.6 11.4 June
Gross total external debt (billions of US$) 199.5 189.5 243.8 281.0 345.4 396.3 426.4 417.6 421.2 June
Of which: In local currency 19.6 24.0 48.5 69.8 121.2 140.3 143.9 123.3 103.8 June
Of which: Public debt 129.2 117.6 155.0 182.9 242.5 270.1 287.3 281.0 278.8 June
Of which: Private debt 70.3 71.9 88.8 98.1 102.9 126.2 139.1 136.7 142.4 June
Financial sector 4.6 5.5 17.3 16.7 13.1 17.1 19.0 16.1 19.7 June
Nonfinancial sector 65.7 66.4 71.5 81.4 89.8 109.1 120.1 120.6 122.7 June
External debt service (in percent of GDP) 5.1 8.0 5.2 6.0 7.1 9.2 10.1 11.5 10.9 Proj.
2/ The ARA metric was developed by the Strategy and Policy Review Department at the IMF to assess reserve adequacy. Weights to individual components were revised in December 2014 for the whole time series.
Sources: Bank of Mexico; National Banking and Securities Commission; National Institute of Statistics and Geography; Secretary of Finance and Public Credit; and IMF staff estimates
1/ Excludes balances under bilateral payments accounts. For 2009, includes the allocation of SDR 2.337 billion in the general allocation implemented on August 28, 2009, and another SDR 0.224 billion in the special allocation on September 9.
46 IN
TERNATIO
NAL M
ON
ETARY FUN
D
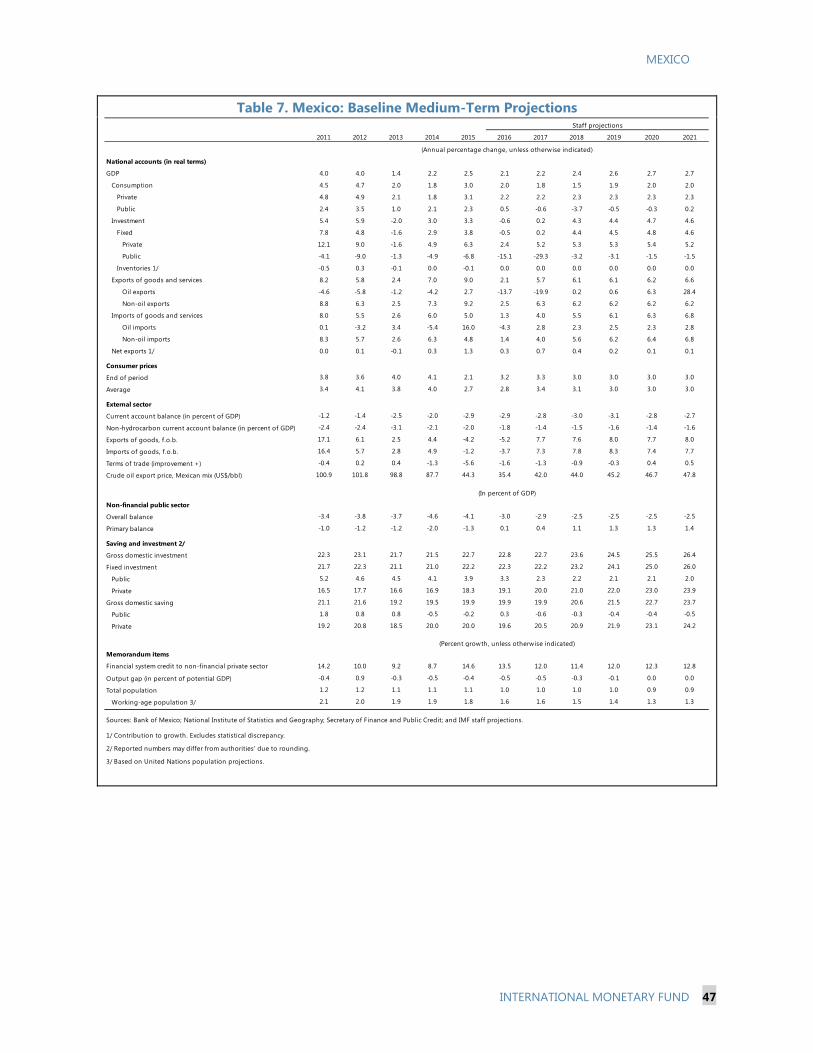
MEXICO
INTERNATIONAL MONETARY FUND 47
Table 7. Mexico: Baseline Medium-Term Projections
2011 2012 2013 2014 2015 2016 2017 2018 2019 2020 2021
National accounts (in real terms)
GDP 4.0 4.0 1.4 2.2 2.5 2.1 2.2 2.4 2.6 2.7 2.7
Consumption 4.5 4.7 2.0 1.8 3.0 2.0 1.8 1.5 1.9 2.0 2.0
Private 4.8 4.9 2.1 1.8 3.1 2.2 2.2 2.3 2.3 2.3 2.3
Public 2.4 3.5 1.0 2.1 2.3 0.5 -0.6 -3.7 -0.5 -0.3 0.2
Investment 5.4 5.9 -2.0 3.0 3.3 -0.6 0.2 4.3 4.4 4.7 4.6
Fixed 7.8 4.8 -1.6 2.9 3.8 -0.5 0.2 4.4 4.5 4.8 4.6
Private 12.1 9.0 -1.6 4.9 6.3 2.4 5.2 5.3 5.3 5.4 5.2
Public -4.1 -9.0 -1.3 -4.9 -6.8 -15.1 -29.3 -3.2 -3.1 -1.5 -1.5
Inventories 1/ -0.5 0.3 -0.1 0.0 -0.1 0.0 0.0 0.0 0.0 0.0 0.0
Exports of goods and services 8.2 5.8 2.4 7.0 9.0 2.1 5.7 6.1 6.1 6.2 6.6
Oil exports -4.6 -5.8 -1.2 -4.2 2.7 -13.7 -19.9 0.2 0.6 6.3 28.4
Non-oil exports 8.8 6.3 2.5 7.3 9.2 2.5 6.3 6.2 6.2 6.2 6.2
Imports of goods and services 8.0 5.5 2.6 6.0 5.0 1.3 4.0 5.5 6.1 6.3 6.8
Oil imports 0.1 -3.2 3.4 -5.4 16.0 -4.3 2.8 2.3 2.5 2.3 2.8
Non-oil imports 8.3 5.7 2.6 6.3 4.8 1.4 4.0 5.6 6.2 6.4 6.8
Net exports 1/ 0.0 0.1 -0.1 0.3 1.3 0.3 0.7 0.4 0.2 0.1 0.1
Consumer prices
End of period 3.8 3.6 4.0 4.1 2.1 3.2 3.3 3.0 3.0 3.0 3.0
Average 3.4 4.1 3.8 4.0 2.7 2.8 3.4 3.1 3.0 3.0 3.0
External sector
Current account balance (in percent of GDP) -1.2 -1.4 -2.5 -2.0 -2.9 -2.9 -2.8 -3.0 -3.1 -2.8 -2.7
Non-hydrocarbon current account balance (in percent of GDP) -2.4 -2.4 -3.1 -2.1 -2.0 -1.8 -1.4 -1.5 -1.6 -1.4 -1.6
Exports of goods, f.o.b. 17.1 6.1 2.5 4.4 -4.2 -5.2 7.7 7.6 8.0 7.7 8.0
Imports of goods, f.o.b. 16.4 5.7 2.8 4.9 -1.2 -3.7 7.3 7.8 8.3 7.4 7.7
Terms of trade (improvement +) -0.4 0.2 0.4 -1.3 -5.6 -1.6 -1.3 -0.9 -0.3 0.4 0.5
Crude oil export price, Mexican mix (US$/bbl) 100.9 101.8 98.8 87.7 44.3 35.4 42.0 44.0 45.2 46.7 47.8
Non-financial public sector
Overall balance -3.4 -3.8 -3.7 -4.6 -4.1 -3.0 -2.9 -2.5 -2.5 -2.5 -2.5
Primary balance -1.0 -1.2 -1.2 -2.0 -1.3 0.1 0.4 1.1 1.3 1.3 1.4
Saving and investment 2/
Gross domestic investment 22.3 23.1 21.7 21.5 22.7 22.8 22.7 23.6 24.5 25.5 26.4
Fixed investment 21.7 22.3 21.1 21.0 22.2 22.3 22.2 23.2 24.1 25.0 26.0
Public 5.2 4.6 4.5 4.1 3.9 3.3 2.3 2.2 2.1 2.1 2.0
Private 16.5 17.7 16.6 16.9 18.3 19.1 20.0 21.0 22.0 23.0 23.9
Gross domestic saving 21.1 21.6 19.2 19.5 19.9 19.9 19.9 20.6 21.5 22.7 23.7
Public 1.8 0.8 0.8 -0.5 -0.2 0.3 -0.6 -0.3 -0.4 -0.4 -0.5
Private 19.2 20.8 18.5 20.0 20.0 19.6 20.5 20.9 21.9 23.1 24.2
Memorandum items
Financial system credit to non-financial private sector 14.2 10.0 9.2 8.7 14.6 13.5 12.0 11.4 12.0 12.3 12.8
Output gap (in percent of potential GDP) -0.4 0.9 -0.3 -0.5 -0.4 -0.5 -0.5 -0.3 -0.1 0.0 0.0
Total population 1.2 1.2 1.1 1.1 1.1 1.0 1.0 1.0 1.0 0.9 0.9
Working-age population 3/ 2.1 2.0 1.9 1.9 1.8 1.6 1.6 1.5 1.4 1.3 1.3
Sources: Bank of Mexico; National Institute of Statistics and Geography; Secretary of Finance and Public Credit; and IMF staff projections.
1/ Contribution to growth. Excludes statistical discrepancy.
2/ Reported numbers may differ from authorities' due to rounding.
3/ Based on United Nations population projections.
(Annual percentage change, unless otherwise indicated)
(In percent of GDP)
(Percent growth, unless otherwise indicated)
Staff projections

MEXICO
Table 8. Mexico: Net Intersectoral Asset and Liability Positions, 2015 (In percent)
Claims Liabilities Net pos. Claims Liabilities Net pos. Claims Liabilities Net pos. Claims Liabilities Net pos. Claims Liabilities Net pos. Claims Liabilities Net pos.Central bank 8.5 0.0 8.5 2.8 5.8 -3.0 0.0 0.4 -0.4 6.0 0.0 6.0 0.4 17.0 -16.7 In domestic currency 8.4 0.0 8.4 2.8 3.3 -0.6 0.0 0.4 -0.4 6.0 0.0 6.0 0.0 0.0 0.0
Currency and deposits 8.4 ... 8.4 2.5 0.0 2.5 0.0 0.0 0.0 6.0 ... 6.0 0.0 0.0 0.0 Securities other than shares 0.0 0.0 0.0 0.3 0.0 0.3 0.0 0.0 0.0 0.0 0.0 0.0 0.0 0.0 0.0 Loans 0.0 0.0 0.0 0.0 3.3 -3.3 0.0 0.0 0.0 0.0 0.0 0.0 0.0 0.0 0.0 Other accounts receivable 0.0 0.0 0.0 0.0 0.0 0.0 0.0 0.4 -0.4 0.0 0.0 0.0 0.0 0.0 0.0
In foreign currency 0.1 0.0 0.1 0.0 2.5 -2.5 0.0 0.0 0.0 0.0 0.0 0.0 0.4 17.0 -16.6 Monetary Gold & SDRs ... ... ... ... ... ... ... ... ... ... ... ... ... 0.7 -0.7 Currency and deposits 0.1 ... 0.1 0.0 2.5 -2.5 0.0 0.0 0.0 0.0 ... 0.0 0.0 16.3 -16.3 Securities other than shares 0.0 0.0 0.0 0.0 0.0 0.0 0.0 0.0 0.0 0.0 0.0 0.0 0.0 0.0 0.0 Loans 0.0 0.0 0.0 0.0 0.0 0.0 0.0 0.0 0.0 0.0 0.0 0.0 0.0 0.0 0.0 SDR Allocations ... ... ... ... ... ... ... ... ... ... ... ... 0.4 ... 0.4 Other accounts receivable 0.0 0.0 0.0 0.0 0.0 0.0 0.0 0.0 0.0 0.0 0.0 0.0 0.0 0.0 0.0
Public sector 0.0 8.5 -8.5 17.7 3.6 14.2 13.1 0.0 13.1 -0.6 ... -0.6 24.6 0.0 24.6 In domestic currency 0.0 8.4 -8.4 17.2 3.5 13.7 13.1 0.0 13.1 -0.6 ... -0.6 10.8 0.0 10.8
Currency and deposits ... 8.4 -8.4 ... 2.0 -2.0 ... 0.0 0.0 ... ... ... 0.0 ... 0.0 Securities other than shares 0.0 0.0 0.0 12.3 0.0 12.3 13.1 0.0 13.1 -0.6 ... -0.6 10.8 ... 10.8 Loans 0.0 0.0 0.0 4.0 1.1 3.0 0.0 0.0 0.0 ... ... ... ... ... ... Other accounts receivable 0.0 0.0 0.0 0.8 0.4 0.4 0.0 0.0 0.0 ... ... ... ... ... ...
In foreign currency 0.0 0.1 -0.1 0.6 0.1 0.5 0.1 0.0 0.1 0.0 ... 0.0 13.8 0.0 13.8 Currency and deposits ... 0.1 -0.1 ... 0.1 -0.1 ... 0.0 0.0 ... ... ... ... ... ... Securities other than shares 0.0 0.0 0.0 0.3 0.0 0.3 0.1 0.0 0.1 ... ... ... 13.8 … 13.8 Loans 0.0 0.0 0.0 0.2 0.0 0.2 0.0 0.0 0.0 ... ... ... ... ... ... Other accounts receivable 0.0 0.0 0.0 0.0 0.0 0.0 0.0 0.0 0.0 ... ... ... ... ... ...
Other depository corporations 5.8 2.8 3.0 3.6 17.7 -14.2 2.4 5.5 -3.0 33.2 23.2 10.0 3.8 3.9 0.0 In domestic currency 3.3 2.8 0.6 3.5 17.2 -13.7 2.3 5.4 -3.1 31.0 20.0 11.0 1.9 0.9 1.0
Currency and deposits 0.0 2.5 -2.5 2.0 ... 2.0 0.1 0.0 0.1 27.4 ... 27.4 0.2 0.0 0.2 Securities other than shares 0.0 0.3 -0.3 0.0 12.3 -12.3 0.0 4.9 -4.9 0.2 0.9 -0.7 0.0 0.0 0.0 Loans 3.3 0.0 3.3 1.1 4.0 -3.0 2.2 0.5 1.7 2.5 17.2 -14.8 0.3 0.0 0.2 Shares and Other Equity 0.0 ... 0.0 ... 0.0 0.0 ... 0.0 0.0 ... 1.8 -1.8 ... 0.0 0.0 Other accounts receivable 0.0 0.0 0.0 0.4 0.8 -0.4 0.0 0.0 0.0 0.9 0.0 0.9 1.4 0.8 0.6
In foreign currency 2.5 0.0 2.5 0.1 0.6 -0.5 0.1 0.1 0.1 2.2 3.3 -1.0 1.9 2.9 -1.0 Currency and deposits 2.5 0.0 2.5 0.1 ... 0.1 0.0 0.0 0.0 2.0 ... 2.0 0.4 1.9 -1.6 Securities other than shares 0.0 0.0 0.0 0.0 0.3 -0.3 0.0 0.0 0.0 0.0 0.0 0.0 0.0 0.4 -0.4 Loans 0.0 0.0 0.0 0.0 0.2 -0.2 0.1 0.1 0.1 0.0 3.2 -3.2 1.5 0.3 1.2 Other accounts receivable 0.0 0.0 0.0 0.0 0.0 0.0 0.0 0.0 0.0 0.2 0.0 0.1 0.0 0.3 -0.3
Other financial corporations 0.4 0.0 0.4 0.0 13.1 -13.1 5.5 2.4 3.0 5.7 8.3 -2.6 0.0 0.0 0.0 In domestic currency 0.4 0.0 0.4 0.0 13.1 -13.1 5.4 2.3 3.1 5.6 8.2 -2.6 0.0 0.0 0.0
Currency and deposits 0.0 0.0 0.0 0.0 ... 0.0 0.0 0.1 -0.1 0.0 ... 0.0 0.0 0.0 0.0 Securities other than shares 0.0 0.0 0.0 0.0 13.1 -13.1 4.9 0.0 4.9 0.0 6.2 -6.2 0.0 0.0 0.0 Loans 0.0 0.0 0.0 0.0 0.0 0.0 0.5 2.2 -1.7 0.0 0.8 -0.8 0.0 0.0 0.0 Shares and Other Equity 0.0 ... 0.0 ... 0.0 0.0 0.0 ... 0.0 ... 0.2 -0.2 ... 0.0 0.0 Insurance technical reserves 0.0 ... 0.0 0.0 ... 0.0 0.0 0.0 0.0 5.1 ... 5.1 0.0 0.0 0.0 Other accounts receivable 0.4 0.0 0.4 0.0 0.0 0.0 0.0 0.0 0.0 0.4 1.0 -0.6 0.0 0.0 0.0
In foreign currency 0.0 0.0 0.0 0.0 0.1 -0.1 0.1 0.1 -0.1 0.1 0.1 0.1 0.0 0.0 0.0 Currency and deposits 0.0 0.0 0.0 0.0 ... 0.0 0.0 0.0 0.0 0.0 ... 0.0 0.0 0.0 0.0 Securities other than shares 0.0 0.0 0.0 0.0 0.1 -0.1 0.0 0.0 0.0 0.0 0.0 0.0 0.0 0.0 0.0 Loans 0.0 0.0 0.0 0.0 0.0 0.0 0.1 0.1 -0.1 0.0 0.0 0.0 0.0 0.0 0.0 Other accounts receivable 0.0 0.0 0.0 0.0 0.0 0.0 0.0 0.0 0.0 0.1 0.1 0.1 0.0 0.0 0.0
Nonfinancial private sector 0.0 6.0 -6.0 ... -0.6 0.6 23.2 33.2 -10.0 8.3 5.7 2.6 53.4 30.1 23.2 In domestic currency 0.0 6.0 -6.0 ... -0.6 0.6 20.0 31.0 -11.0 8.2 5.6 2.6 42.9 0.0 42.9
Currency and deposits ... 6.0 -6.0 ... ... ... ... 27.4 -27.4 ... 0.0 0.0 ... ... ... Securities other than shares 0.0 0.0 0.0 ... -0.6 0.6 0.9 0.2 0.7 6.2 0.0 6.2 ... ... ... Loans 0.0 0.0 0.0 ... ... ... 17.2 2.5 14.8 0.8 0.0 0.8 ... ... ... Shares and Other Equity 0.0 ... 0.0 ... ... ... 1.8 ... 1.8 0.2 ... 0.2 42.9 ... 42.9 Insurance technical reserves ... ... ... ... ... ... ... 0.0 0.0 ... 5.1 -5.1 ... ... ... Other accounts receivable 0.0 0.0 0.0 ... ... ... 0.0 0.9 -0.9 1.0 0.4 0.6 ... ... ...
In foreign currency 0.0 0.0 0.0 ... 0.0 0.0 3.3 2.2 1.0 0.1 0.1 -0.1 10.5 30.1 -19.7 Currency and deposits ... 0.0 0.0 ... ... ... ... 2.0 -2.0 ... 0.0 0.0 ... ... ... Securities other than shares 0.0 0.0 0.0 ... ... ... 0.0 0.0 0.0 0.0 0.0 0.0 6.8 4.5 2.4 Loans 0.0 0.0 0.0 ... ... ... 3.2 0.0 3.2 0.0 0.0 0.0 2.7 13.2 -10.5 Shares and Other Equity 0.0 ... 0.0 ... ... ... 0.0 ... 0.0 0.0 ... 0.0 0.0 12.5 -12.5 Other accounts receivable 0.0 0.0 0.0 ... ... ... 0.0 0.2 -0.1 0.1 0.1 -0.1 1.0 ... 1.0
Nonresidents 17.0 0.4 16.7 0.0 24.6 -24.6 3.9 3.8 0.0 0.0 0.0 0.0 30.1 53.4 -23.2 In domestic currency 0.0 0.0 0.0 0.0 10.8 -10.8 0.9 1.9 -1.0 0.0 0.0 0.0 0.0 42.9 -42.9
Currency and deposits 0.0 0.0 0.0 ... 0.0 0.0 0.0 0.2 -0.2 0.0 0.0 0.0 ... ... ... Securities other than shares 0.0 0.0 0.0 ... 10.8 -10.8 0.0 0.0 0.0 0.0 0.0 0.0 ... ... ... Loans 0.0 0.0 0.0 ... ... ... 0.0 0.3 -0.2 0.0 0.0 0.0 ... ... ... Shares and Other Equity 0.0 ... 0.0 ... ... ... 0.0 ... 0.0 0.0 ... 0.0 ... 42.9 -42.9 Other accounts receivable 0.0 0.0 0.0 ... ... ... 0.8 1.4 -0.6 0.0 0.0 0.0 ... ... ...
In foreign currency 17.0 0.4 16.6 0.0 13.8 -13.8 2.9 1.9 1.0 0.0 0.0 0.0 30.1 10.5 19.7 Monetary Gold & SDRs 0.7 ... 0.7 0.0 0.0 0.0 ... ... ... ... ... ... ... ... ... Currency and deposits 16.3 0.0 16.3 ... ... ... 1.9 0.4 1.6 0.0 0.0 0.0 ... ... ... Securities other than shares 0.0 0.0 0.0 … 13.8 -13.8 0.4 0.0 0.4 0.0 0.0 0.0 4.5 6.8 -2.4 Loans 0.0 0.0 0.0 ... ... ... 0.3 1.5 -1.2 0.0 0.0 0.0 13.2 2.7 10.5 Shares and Other Equity 0.0 ... 0.0 ... ... ... 0.0 ... 0.0 0.0 ... 0.0 12.5 0.0 12.5 SDR Allocations ... 0.4 -0.4 … … … … … … … … … … … … Other accounts receivable 0.0 0.0 0.0 ... ... ... 0.3 0.0 0.3 0.0 0.0 0.0 ... 1.0 -1.0
Sources: Standardized report forms for monetary and financial data; External debt and IIP data from Banxico; Public debt from SHCP.
Central bank Public sector Other depository corps. Other financial corps. Nonfinancial Private Sector Nonresidents
48 IN
TERNATIO
NAL M
ON
ETARY FUN
D

MEXICO
INTERNATIONAL MONETARY FUND 49
Annex I. Risk Assessment Matrix 1/ Potential Deviations from Baseline
Source of Risk Up/ Downside
Relative Likelihood2
Impact2 Policy Response
Sharp rise in risk premiums with flight to safety. Investors reassess underlying economic and financial risks in large economies, or respond to unanticipated Fed tightening, and increases in U.S. term premiums, with poor market liquidity amplifying volatility. Safe haven currencies’ surge—especially the US dollar—strains balance sheets for FX debtors.
M H
Exchange rate flexibility and provision of liquidity to mitigate disorderly market conditions.
Rise in populism and nationalism in large economies—especially those with near-term elections—could slow down or even reverse policy coordination and collaboration, international trade liberalization, financial and labor flows, and lead to unsustainable policies, weighing on global growth and exacerbating financial market volatility.
H H
Exchange rate flexibility would be critical to restore equilibrium. Temporary FX interventions and liquidity provision could help smooth extreme volatility.
Structurally weak growth in key advanced and emerging economies. H/M H
Steadfast implementation of structural reforms to increase competitiveness.
Persistently lower energy prices, triggered by supply factors reversing more gradually than expected.
L L
Exchange rate flexibility and fiscal adjustment.
Further declines in oil production at PEMEX. L M
Implement joint ventures to benefit from technology transfer.
Slower-than-anticipated fiscal consolidation in the context of the forthcoming electoral cycle, leading to further steady increase in public debt and an increase in country risk premiums.
M/L M
Maintain the consolidation effort. Use positive revenue surprises to reduce the deficit faster.
1/ The Risk Assessment Matrix (RAM) shows events that could materially alter the baseline path (the scenario most likely to materialize in the view of IMF staff). The relative likelihood is the staff’s subjective assessment of the risks surrounding the baseline (“low” is meant to indicate a probability below 10 percent, “medium” a probability between 10 and 30 percent, and “high” a probability between 30 and 50 percent). The RAM reflects staff views on the source of risks and overall level of concern as of the time of discussions with the authorities. Non-mutually exclusive risks may interact and materialize jointly. “Short term” and “medium term” are meant to indicate that the risk could materialize within 1 year and 3 years, respectively. 2/ Low (L), Medium (M), High (H).

MEXICO
50 INTERNATIONAL MONETARY FUND
Annex II. External Sector Assessment
Mexico Overall AssessmentForeign asset and liability position and trajectory
Background. Mexico’s NIIP was -36 percent of GDP in 2015 (gross foreign assets and liabilities were 48 percent and 84 percent of GDP, respectively). Portfolio liabilities were 40 percent of GDP, of which around one third are holdings of local-currency government bonds. The ratio of NIIP to GDP is projected to rise slightly and then stabilize over the medium term. Assessment. While the NIIP is sustainable, the large gross foreign portfolio liabilities holdings could be a source of vulnerability to global financial volatility.
Overall Assessment: In 2015, Mexico’s external sector position was broadly consistent with medium-term fundamentals and desirable policy settings. The depreciation of the peso so far this year has reflected reduction in oil production and exports, further deterioration in the terms of trade, weaker medium-term growth prospects, and uncertainties in the global economy, including risks of rising protectionism. Overall, the REER appears to be broadly in line with fundamentals (with a gap of 0-10 percent). The positive effects of the weaker exchange rate on the current account is likely to materialize with a lag. Potential policy responses: The external sector position is broadly consistent with medium-term fundamentals and desirable policy settings Therefore, there is no reason to alter the planned policy settings. The authorities have committed to reducing the public sector borrowing requirement from 4.6 percent of GDP in 2014 to 2.5 percent of GDP in 2018. They have met the corresponding 2015 target and are expected to meet the 2016 target too. The central bank sets monetary policy to ensure that the inflation remains close to the 3-percent target. The authorities have a free-floating exchange rate policy, and use foreign exchange intervention occasionally to prevent disorderly market conditions. The FCL provides an added buffer against global tail risks.
Current account
Background. In 2016, the current account deficit is projected at 2.9 percent of GDP, similar to the previous year, with stronger services and income balances making up for a weaker oil and nonoil goods balance. The cyclically-adjusted current account deficit is estimated at 2.4 percent of GDP. Over the medium term, private investment related to the structural reforms is expected to rise, matched by greater private sector savings as consumption growth moderates. Assessment. Mexico’s CA deficit is broadly in line with the level consistent with medium term fundamentals and desirable policy settings. The EBA model estimates a cyclically-adjusted current account norm of -1.6 percent in 2016, implying a CA gap of -0.8 percent of GDP in 2016. The staff assessment is similar, with a gap between -1 and 0 percent of GDP.
Real exchange rate
Background. The average REER in 2016 through September was 12 percent weaker than the 2015 average. The depreciation reflects a reduction in oil production and net oil exports, further deterioration in the terms of trade, weaker medium-term growth prospects, and uncertainties in the global economy, including risks of rising protectionism. The free-floating exchange rate has been a key shock absorber in an unsettled global environment. Assessment. The EBA level REER regression estimates an undervaluation of 11.5 percent in 2016. The index approach yields higher undervaluation (29 percent). Staff puts less weight on the index approach as it has shown the peso to be persistently undervalued for the last 8 years. Considering all estimates and the uncertainties around them, staff assesses Mexico’s real effective exchange rate to be broadly in line with fundamentals (with a gap of 0-10 percent, reflecting mild undervaluation which is likely to be reversed as risks of rising protectionism recede).
Capital and financial accounts: flows and policy measures
Background. During 2010-14, a large share of capital inflows has gone into purchases of locally-issued government paper and other portfolio investments. In 2015-16 gross portfolio inflows slowed markedly, and there have been net outflows from local currency government paper in the first half of 2016. Going forward, the structural reforms are expected to lead to higher FDI, while portfolio inflows are unlikely to return to the previous high growth rates. Assessment. The long duration of sovereign debt and the high share of local currency financing reduce the exposure of government finances to depreciation risks. However, the strong presence of foreign investors leaves Mexico exposed to a reversal of capital flows and an increase in risk premiums. The authorities have refrained from capital flow management measures, in line with their view that an open capital account reduces policy uncertainty and supports long-term growth. Capital flow risks are also mitigated by prudent macroeconomic policies.
FX intervention and reserves level
Background. The central bank remains committed to a free-floating exchange rate, using discretionary intervention only to prevent disorderly market conditions.1/ The central bank usually builds up reserves through purchases of the net foreign currency proceeds of the state oil company, but at current oil prices this is minimal. Occasionally the central bank also used auctions to build up reserves as needed. In 2015, FX reserves declined to US$178 billion (15.5 percent of GDP), mostly due to FX intervention totaling US$24.5 billion to address disorderly market conditions. Assessment. At 112 percent of the ARA metric and 191 percent of short-term debt (at remaining maturity), the current level of foreign reserves remains adequate for normal times. The FCL arrangement has been an effective complement to international reserves, providing protection against global tail risks.
Mexico (concluded) Technical Background Notes
1/ Rules-based intervention mechanisms were in place between December 8, 2014 and February 17, 2016. During this time, pre-announced amounts were automatically offered for auction when the exchange rate depreciated by more than a threshold (1 or 1.5 percent) on a given day. Regular auctions with no minimum price were also used. Since February 17, 2016, the authorities moved to discretionary intervention and have used it only once through mid-September. Data on intervention amounts are published weekly.

MEXICO STAFF REPORT FOR THE 2016 ARTICLE IV CONSULTATION—INFORMATIONAL ANNEX
Prepared By The Western Hemisphere Department
FUND RELATIONS _____________________________________________________________________ 2
RELATIONS WITH THE WORLD BANK ________________________________________________ 4
STATISTICAL ISSUES ___________________________________________________________________ 5
CONTENTS
November 4, 2016

MEXICO
2 INTERNATIONAL MONETARY FUND
FUND RELATIONS (As of September 2016)
The 2016 Article IV discussions were held in Mexico City during September 19–30. The staff team comprised Dora Iakova (head), Alexander Klemm, Damien Puy, Fabian Valencia (all WHD); Julian Chow (MCM); Marina Marinkov (FAD); and Charlotte Lundgren (SPR). Daniela Muhaj (WHD) contributed from headquarters. Robert Rennhack (WHD) and Ghiath Shabsigh (MCM) participated in the concluding meetings. The mission met with the Minister of Finance, the Governor of the Bank of Mexico, senior staff of several government ministries and agencies, representatives of regulatory agencies, and private sector representatives. Messrs. Carlos Hurtado and Gerardo Zúñiga (OED) attended most meetings. Mexico has accepted the obligations of Article VIII, sections 2, 3, and 4. Comprehensive economic data are available for Mexico on a timely basis. It subscribes to the SDDS, and economic data are adequate to conduct surveillance. Membership Status: Joined December 31, 1945 General Resources Account: SDR Million Percent of QuotaQuota 8,912.70 100.00Fund holdings of currency 8,018.15 89.96Reserve position in Fund 894.59 10.04 New Arrangement to Borrow
443.89
SDR Department:
SDR Million
Percent of Allocation
Net cumulative allocation 2,851.20 100.00Holdings 1,844.87 64.71
Outstanding Purchases and Loans: None Latest Financial Arrangements Type Arrangement
Date Expiration
DateAmount Approved
(SDR Million) Amount Drawn
(SDR Million)FCL May 27, 2016 May 26, 2018 62,388.90 0.00FCL Nov 26, 2014 May 26, 2016 47,292.00 0.00FCL Nov 30, 2012 Nov. 25, 2014 47,292.00 0.00FCL Jan 10, 2011 Nov 29, 2012 47,292.00 0.00FCL Mar 25,2010 Jan 09, 2011 31,528.00 0.00FCL Apr 17, 2009 Mar 24, 2010 31,528.00 0.00

MEXICO
INTERNATIONAL MONETARY FUND 3
Projected Payments to the Fund (SDR million): Forthcoming
2016 2017 2018 2019 2020Principal Charges / Interest 0.13 0.60 0.60 0.60 0.60Total 0.13 0.60 0.60 0.60 0.60
Exchange Rate Arrangement: Mexico has a free floating exchange rate, although it temporarily shifted to a floating arrangement between May and November 2015. Mexico maintains an exchange system that is free of multiple currency practices and restrictions on the making of payments and transfers for current international transactions.
Article IV Consultation: The last Article IV consultation was concluded by the Executive Board on November 9, 2015. The staff report was published as IMF Country Report No. 15/313.
Technical Assistance
Year Dept. Purpose
2016 FAD Revenue Administration
2015 STA Balance of Payments
2015 FAD Supervision of Subnational Finances
2014 2014 2014 2014 2013 2012 2012 20122011
FAD STA STA STA MCM FAD FAD FAD FAD
Tax Policy and Compliance Sectoral Balance Sheets National Accounts Balance of Payments Post-FSAP Follow Up Pension and Health Systems Treasury Tax Regimes for PEMEX Custom Administration
2011 FAD Tax Policy
2010 FAD Fiscal Risks Management
2010 FAD Treasury
2010 LEG AML/CFT Risk Based Supervision
Resident Representative: None

MEXICO
4 INTERNATIONAL MONETARY FUND
RELATIONS WITH THE WORLD BANK Mexico has had a longstanding partnership with the World Bank Group. The Country Partnership Strategy (CPS) FY14–19—which was jointly prepared with the Government of Mexico—focuses on the World Bank Group’s twin goals (ending extreme poverty and promoting shared prosperity) and is fully aligned with the Mexico's National Development Plan (NDP) for 2013–18. The four key areas of engagement supported by the CPS are: (i) Unleashing Productivity; (ii) Increasing Social Prosperity; (iii) Strengthening Public Finances and Government Efficiency; and (iv) Promoting Green and Inclusive Growth. It describes the Bank’s engagement with Mexico as a partnership to achieve development results through selective and tailored packages of financial, knowledge, and convening services. IBRD lending has remained an important part of this engagement throughout the years. The Performance and Learning Report (PLR) of the CPS is currently under preparation. No major adjustments to the strategy are expected. As a member of the OECD and the G20, Mexico has maintained economic stability through times of recent crisis, and increased economic and social well-being over the last two decades. As of August 2016, the IBRD’s exposure was US$15.0 billion which has positioned Mexico as the World Bank’s third largest IBRD borrower in terms of debt outstanding. The increase of the Single Borrower Limit up to US$19.0 billion provides the IBRD with further financial space to support Mexico's efforts in achieving its development agenda, albeit at additional cost. The active portfolio consists of 14 IBRD projects (including 4 full GEF operations) for a net commitment of US$2.2 billion and an undisbursed balance of US$1.4 billion. The Bank has an active trust fund portfolio comprising 43 trust funds for a total net commitment of US$271 million. This includes a large Clean Technology Fund implemented in conjunction with the national Urban Transport Program project and a Forest Investment Program (FIP) fund. In FY15-16, the Mexico Public Expenditure Review (PER) enhanced the Government’s capacity to manage medium-term fiscal challenges at national and subnational levels and was a valued input to the Government’s budget discussion and deepened the policy dialogue in many areas such as subnational borrowing regulations, and improvements in the targeting of social protection programs. The Government has requested the WBG to explore the possibility of providing more technical assistance in this area, specifically on fiscal consolidation policies for highly indebted states and a better use of federal transfers to state level. In response to the Government’s intention to better link its social protection system to productive programs, the Bank has provided support to the re-design of Mexico’s CCT program—now known as PROSPERA—in further improving investments in human capital for the poor. The Bank has specifically contributed to linking the poor to a broader set of income generating programs and to better targeting the supply of social programs to areas and beneficiaries with the greatest needs.

MEXICO
INTERNATIONAL MONETARY FUND 5
At the request of Government, the Bank is supporting the development of the new Special Economic Zones regime through a series of high-profile workshops and TA on the SEZ law, drawing on the WBG’s global experience with SEZs. After more than a year of collaboration, the Government looks at the WBG as the partner of choice on SEZs.
Other areas of support to Mexico’s productivity and inclusive growth agenda include projects to improve the country’s agricultural storage and information systems to enhance food security and competitiveness as well as to strengthen the efforts of the Government to improve solid waste management and launch an Inner-City affordable housing program.
The IFC investment portfolio reached US$1.3 billion at the end of FY16, representing the second largest portfolio in the Latin America and Caribbean (LAC) region and the 7th largest portfolio at IFC. The portfolio represents investments across 54 companies, mostly in the chemicals sector (22 percent), followed by ports (20 percent), financial markets (9.5 percent), cement (9.3 percent), construction and real estate (8.8 percent), agribusiness and forestry (5.2 percent), oil & gas (4.6 percent) and others (21 percent).
To support the structural reform agenda, the Government of Mexico has chosen IFC’s Asset Management Company (AMC) to manage the newly established China-Mexico Fund (CMF). The purpose of the CMF is to attract commercial risk capital to support Mexico’s reform agenda by “crowding in” equity investors into the infrastructure, oil and gas, manufacturing, agribusiness, services and banking sectors. The CMF was established as a US$1.2 billion fund in 2014 and is consistent with IFC’s role in mobilizing capital to support private sector growth in middle income countries.
MIGA remains open to explore opportunities to support private sector in the areas of infrastructure and energy via its political risk insurance and credit enhancement products.
STATISTICAL ISSUES Data provision is adequate for surveillance. Mexico observes the Special Data Dissemination Standards (SDDS) and its metadata are posted on the Dissemination Standards Bulletin Board (DSBB). In a number of cases, the periodicity and timeliness of disseminated data exceed SDDS requirements. A data ROSC update was completed on June 24, 2015 and was published as IMF Country Report No. 15/176. There are various areas where improvements could be made, as detailed below. The authorities are aware of this situation and are continuing work in this regard.
The national accounts statistics generally follow the recommendations of the System of National Accounts, 2008 (2008 SNA). Source data and statistical techniques are sound and most statistical outputs sufficiently portray reality. A broad range of source data are available, with economic censuses every five years and a vast program of monthly and annual surveys. For most surveys, scientific sampling techniques are used. Nonetheless, most samples exclude a random sample of

MEXICO
6 INTERNATIONAL MONETARY FUND
small enterprises. Some statistical techniques need enhancement. For example, taxes and subsidies on products at constant prices are estimated by applying the GDP growth rate, a deviation from best practice. During 2014 STA conducted a reassessment of the data module of the ROSC that covered national accounts. As compared with the 2010 ROSC, the reassessment was based on the newest (May 2012) vintage of the Data Quality Assessment Framework (DQAF) and against those specified in the Special Data Dissemination Standard (SDDS). The data ROSC reassessment found that national accounts statistics are generally of a high quality, adequate to conduct effective surveillance and adequately meet users’ needs. Since 2010, Mexico has made significant improvements on the methodological and dissemination aspects of data quality. Nevertheless, areas for further improvement and refinement exist, in particular, on the resources devoted to collecting state and local government source data and seasonally-adjusted data, explaining data revisions, and on compiling data on changes in inventories and on the volume of taxes on products. INEGI has published annual sectoral accounts and balance sheets following the System of National Accounts 2008 (2008 SNA) classifications of assets and sectors for the period 2003–2012 in November 2013. These accounts were revised recently and published on June 30, 2014. STA conducted a mission during 2014 to assess the possibility for developing quarterly sectoral accounts and balance sheets and agreed with the Mexican authorities on a work plan for developing these accounts. INEGI and Banxico agreed to collaborate in the compilation of quarterly stocks and flows of financial assets and liabilities by institutional sectors. The concepts and definitions for both the CPI and PPI meet international standards. The PPI is only compiled by product and not by economic activity. A ROSC mission on prices was conducted in November 2012. Although some items of the balance of payments statistics conform to the Fifth edition of the Balance of Payments Manual, a full transition has not yet been completed.1 Several measures to improve external debt statistics have been carried out, including the compilation of data on external liabilities of the private sector and publicly traded companies registered with the Mexican stock exchange (external debt outstanding, annual amortization schedule for the next four years broken down by maturity, and type of instrument). In 2014, STA conducted a technical assistance on external sector statistics. The main purpose of the mission was to assist the balance of payment statistics compilers in further strengthening their data collection and compilation system for external sector statistics. In particular, the mission focused on foreign direct investment, financial derivatives, bank accounts used in foreign exchange operations, capital account, and financial intermediation services indirectly measured. The mission also assisted in addressing specific issues related to the
1 Since the release of the balance of payments figures for the second quarter of 2010 (August, 25, 2010), Banco de Mexico has been publishing a new format that follows the guidelines of the Fifth edition of the Balance of Payments Manual.
MEXICO
INTERNATIONAL MONETARY FUND 7
adoption of the methodology of the sixth edition of the Balance of Payments and International Investment Position Manual (BPM6).
The authorities compile fiscal statistics following national concepts, definitions, and classifications that make international comparison difficult. The statistics are comprehensive and timely, except for states and municipalities. The new government accounting law mandates accounting standards that follow international standards for all levels of government, and that take into account the information needs of international organizations and national accounts. A full adoption of uniform accounting standards at the sub-national level will be crucial to obtain a precise measure of public fixed investment in national accounts, among others.
The authorities are committed to reporting government financial statistics in GFSM 2001 format, as well as data for the GFS Yearbook.
The methodological foundations of monetary statistics are generally sound. However, the recording of financial derivative and, to a lesser extent, repurchase agreements transactions are overstating the aggregated other depository corporations (ODC) balance sheet and survey. Availability of data on other financial intermediaries such as insurance companies and pension funds allow for the construction of a financial corporation’s survey with full coverage of the Mexican financial system, which is published on a monthly basis in International Financial Statistics.
Mexico is reporting Financial Soundness Indicators (FSIs) for Deposit Takers on a monthly basis.
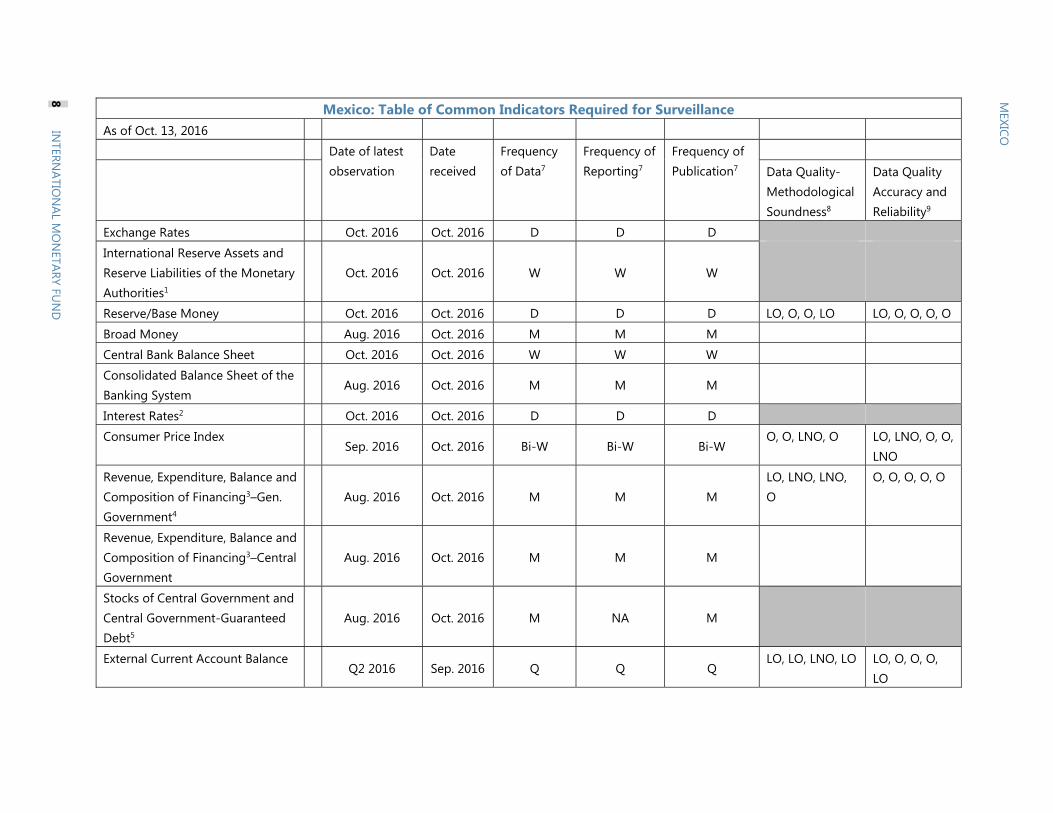
Mexico: Table of Common Indicators Required for Surveillance As of Oct. 13, 2016
Date of latest observation
Date received
Frequency of Data7
Frequency of Reporting7
Frequency of Publication7
Data Quality-Methodological Soundness8
Data Quality Accuracy and Reliability9
Exchange Rates Oct. 2016 Oct. 2016 D D D
International Reserve Assets and Reserve Liabilities of the Monetary Authorities1
Oct. 2016 Oct. 2016 W W W
Reserve/Base Money Oct. 2016 Oct. 2016 D D D LO, O, O, LO LO, O, O, O, O
Broad Money Aug. 2016 Oct. 2016 M M M
Central Bank Balance Sheet Oct. 2016 Oct. 2016 W W W
Consolidated Balance Sheet of the Banking System
Aug. 2016 Oct. 2016 M M M
Interest Rates2 Oct. 2016 Oct. 2016 D D D
Consumer Price Index Sep. 2016 Oct. 2016 Bi-W Bi-W Bi-W
O, O, LNO, O LO, LNO, O, O, LNO
Revenue, Expenditure, Balance and Composition of Financing3–Gen. Government4
Aug. 2016 Oct. 2016 M M M
LO, LNO, LNO, O
O, O, O, O, O
Revenue, Expenditure, Balance and Composition of Financing3–Central Government
Aug. 2016 Oct. 2016 M M M
Stocks of Central Government and Central Government-Guaranteed Debt5
Aug. 2016 Oct. 2016 M NA M
External Current Account Balance Q2 2016 Sep. 2016 Q Q Q
LO, LO, LNO, LO LO, O, O, O, LO
MEXICO
8 IN
TERNATIO
NAL M
ON
ETARY FUN
D

Mexico: Table of Common Indicators Required for Surveillance (continued)
Exports and Imports of Goods and Services
Aug. 2015 Sep. 2016 M M M
GDP/GNPQ2 2016 Aug. 2016 Q Q Q
O, O, O, LO LO, O, LO, LO, O
Gross External Debt Q2 2016 Sep. 2016 Q Q Q
International Investment Position6 Q2 2016 Sep. 2016 Q Q Q 1 Any reserve assets that are pledged or otherwise encumbered should be specified separately. Also, data should comprise short-term liabilities linked to a foreign currency but settled by other means as well as the notional values of financial derivatives to pay and to receive foreign currency, including those linked to a foreign currency but settled by other means. 2 Both market-based and officially determined, including discount rates, money market rates, rates on treasury bills, notes, and bonds.3 Foreign, domestic bank, and domestic nonbank financing.4 The general government consists of the central government (budgetary funds, extra budgetary funds, and social security funds) and state and local governments.5 Including currency and maturity composition.6 Includes external gross financial asset and liability positions vis-à-vis nonresidents.7 Daily (D); Weekly (W); Monthly (M); Quarterly (Q); Annually (A); Irregular (I); Not Available (NA). 8 Reflects the assessment provided in the data ROSC completed on July, 2014, except consumer prices which is based on the ROSC completed on 2012.For the dataset corresponding to the variable in each row, the assessment indicates whether international standards concerning (respectively) concepts and definitions, scope, classification/sectorization, and basis for recording are fully observed (O), largely observed (LO), largely not observed (LNO), or not observed (NO).9 Same as footnote 8, except referring to international standards concerning source data, assessment and validation of source data, statistical techniques, assessment and validation of intermediate data and statistical outputs, and revision studies.
INTERN
ATION
AL MO
NETARY FU
ND
9
MEXICO

MEXICO STAFF REPORT FOR THE 2016 ARTICLE IV CONSULTATION—DEBT SUSTAINABILITY ANALYSIS
Public debt1 is expected to remain sustainable over the medium term, despite a slightly worse growth outlook. Under the baseline scenario, the public debt-to-GDP ratio is projected to decline to 54.3 percent by 2021 from the current level of 56.3 percent. Gross financing needs (projected at around 6 percent of GDP in 2016) are expected to remain contained below 10 percent over the medium term. The DSA also suggests that public debt is sustainable under various negative shocks. Only a drop in real GDP growth shifts the debt trajectory up significantly, but even under such a scenario, gross debt remains contained around 66 percent and begins to decline in 2021. With the exception of the share of debt held by non-residents (49 percent of total debt), public debt profile indicators remain below the upper early warning benchmarks. However, the risk from a high foreign ownership of debt is mitigated by the long maturity of this debt.
1 Public debt reported in this annex excludes state and local governments, but includes central government, social security, state-owned enterprises and public development banks. As of June 2016, the stock of subnational debt was reported at around 530 billion pesos, or about 2.7 percent of GDP, and therefore does not pose a systemic risk to debt sustainability.
Prepared By
Staff of the International Monetary Fund
November 4, 2016
MEXICO
2 INTERNATIONAL MONETARY FUND
PUBLIC DEBT SUSTAINABILITY ANALYSIS A. Comparison with the Previous Assessment
The baseline debt projection is somewhat higher relative to last year’s DSA (2015 Mexico Article IV staff report). Gross public debt is 4.3 percentage points higher in 2016 relative to previous projections (from 52 to 56.3 percent to GDP) and 3.8 percentage points higher by the end of the projection period. The main factors explaining the higher debt path are:
Higher initial level of debt. While the previous DSA projected a debt to GDP ratio of51.9 percent of GDP in 2015, the actual outcome was 54.1 percent of GDP. This was mainly dueto the greater-than-anticipated peso depreciation and a 0.3 percent of GDP in PEMEX’s pensionliability assumption by the federal government.
The government has assumed portions of PEMEX and CFE pension liabilities in 2016. Theseoperations are estimated to add about 1.6 percentage points of GDP to the total stock of debt,in addition to the 0.3 percent of GDP assumed in 2015.
Lower growth over the medium term. The real GDP growth path is lower compared to lastyear’s projection over the entire projection period.
B. Baseline and Realism of Projections
Debt levels. Under the planned fiscal consolidation, gross debt levels are projected to declinefrom a peak of 56.4 percent of GDP in 2017 to 54.3 percent of GDP by 2021 (Figures 3 and 4).Gross financing needs over the medium-term are projected to average around 8 percent of GDP.
Fiscal adjustment. The structural primary balance (adjusted by the cycle and oil prices)improves between 2016 and 2021 in the baseline projection. On the revenue side, the decline inone-offs observed in 2016 from the Bank of Mexico transfer and the hedging income would leadto lower revenues in 2017, which would then stabilize at a similar level over the medium term.On the spending side, projections assume compliance with the consolidation plan spelled out inthe 2017 budget documents, which envisaged reducing the public sector borrowingrequirement (PSBR) from 3 percent of GDP in 2016 to 2.5 percent of GDP in 2018. To this end,the plan encompasses compression of capital and current spending. Compared to thedistribution of fiscal adjustment episodes provided in the DSA template (Figure 2), the projected3-year adjustment of the cyclically-adjusted primary balance of around 1.5 percent of GDPseems feasible.
Growth. Past projections of growth outcomes suggest moderate forecast errors, with themedian forecast error in line with other emerging markets. Hence, even though Mexico’s debtdynamics continue to be highly sensitive to surprises in GDP growth, there seems to be noevidence of a systematic projection bias in the baseline assumption for growth that couldundermine the DSA assessment. The current output growth projection of 2.2 percent for 2017 is

MEXICO
INTERNATIONAL MONETARY FUND 3
within the authorities’ projected growth rate range of 2-3 percent for 2017. Medium-term growth is expected to pick up gradually as the effects from structural reforms take hold, stabilizing at 2.7 percent of GDP in the second half of the projection horizon. The boom-bust analysis is triggered (Figure 2) because the three-year cumulative change in the credit-to-GDP ratio exceeds 15 percent in Mexico. This is due to the strong growth in private sector credit, which is driven by financial reform measures and broadly consistent with trend financial deepening.
Sovereign yields. Despite the volatility observed in most emerging markets in recent months, Mexico’s sovereign yields remain low, with the 10-year local-currency bond yield remaining stable and reaching 6.1 percent as of mid-October. The spread with U.S. government bonds yields of the same maturity has remained on average at 436 basis points for the last three months, while spreads on foreign-currency denominated bonds have averaged 287 basis points over the same period. Taking into account the upward projections for the medium-term U.S. Libor rates, the effective nominal interest rate on Mexico’s sovereign debt is projected to rise from 6 percent in 2015 to 7.1 percent by 2021.
C. Debt profile
Rollover and exchange rate risks. Under the current debt structure2, the immediate effect of interest rate changes on the budget is very low. The long maturity structure also reduces rollover risks, including for public debt held by non-residents that is relatively high for Mexico. As illustrated in Figure 5, the real interest rate and real exchange rate shocks would have a relatively small impact on the debt stock, given the low direct interest pass-through to the budget and the large share of debt denominated in local currency (some 75 percent).
D. Stochastic Simulations
Fan charts. The fan charts illustrate the possible evolution of the debt ratio over the medium term and are based on both the symmetric and asymmetric distributions of risk (Figure 1). Under the symmetric distribution of risk, there is a 75 percent probability that debt will be below 60 percent of GDP over the medium term. If restrictions are imposed on the primary balance (i.e., the asymmetric scenario, where it is assumed that there are no positive shocks to the primary balance), there is still 50 percent chance that the debt path will remain below 60 percent of GDP over the projection horizon.
E. Stress Tests
Real GDP growth shock. The debt ratio would remain below 60 percent of GDP under all scenarios except the growth shock where it peaks at 62.6 percent of GDP in 2018 before
2 Average maturity is about 8 years, more than 80 percent of government securities have been issued at fixed interest rates, and around 25 percent of debt is denominated in foreign currency.

MEXICO
4 INTERNATIONAL MONETARY FUND
reaching 60.9 percent by the end of the projection period. This scenario also results in a drastic increase in public gross financing needs in the period 2017-2019, in excess of 10 percent.
Real exchange rate shock.3 A permanent real exchange rate depreciation of 15 percentincreases debt by around 2 percentage points of GDP. As a result, gross financing needsincrease by an average 0.2 percentage points of GDP.
Combined shock. A combined shock incorporates the largest effect of individual shocks on allrelevant variables (real GDP growth, inflation, primary balance, exchange rate and interest rate).Under this scenario, debt would stabilize at around 66 percent of GDP, without showing anexplosive trajectory. Gross financing needs would peak at around 12 percent of GDP in 2019,before stabilizing at around 11 percent by the end of the period.
F. Authorities’ Views
The authorities recognize the risks posed by the rising debt burden and are committed toputting public debt on a declining trajectory over the medium term. They agreed that it iscritical to adhere to the fiscal consolidation plan, maintain strong debt management practices,and to continue undertaking structural reforms to boost growth.
3This shock uses a pass-through elasticity of 7 percent (staff estimate) rather than the default value of 25 percent.

MEXICO
INTERNATIONAL MONETARY FUND 5
Mexico
Source: IMF staff.
4/ An average over the last 3 months, 13-Jul-16 through 11-Oct-16.
Real GDP Growth Shock
2/ The cell is highlighted in green if gross financing needs benchmark of 15% is not exceeded under the specific shock or baseline, yellow if exceeded under specific shock but not baseline, red if benchmark is exceeded under baseline, white if stress test is not relevant.
Figure 1. Mexico Public DSA Risk Assessment
1/ The cell is highlighted in green if debt burden benchmark of 70% is not exceeded under the specific shock or baseline, yellow if exceeded under specific shock but not baseline, red if benchmark is exceeded under baseline, white if stress test is not relevant.
Real Interest Rate Shock
External Financing
Requirements
Real GDP Growth Shock
Heat Map
Upper early warning
Evolution of Predictive Densities of Gross Nominal Public Debt(in percent of GDP)
Debt profile 3/
Lower early warning
200 and 600 basis points for bond spreads; 5 and 15 percent of GDP for external financing requirement; 0.5 and 1 percent for change in the share of short-term debt; 15 and 45 percent for the public debt held by non-residents; and 20 and 60 percent for the share of foreign-currency denominated debt.
Foreign Currency
Debt
Public Debt Held by Non-
Residents
(Indicators vis-à-vis risk assessment benchmarks)
Market Perception
Gross financing needs 2/ Primary Balance Shock
Real Interest Rate Shock
Exchange Rate Shock
Contingent Liability Shock
Primary Balance Shock
Debt Profile Vulnerabilities
3/ The cell is highlighted in green if country value is less than the lower risk-assessment benchmark, red if country value exceeds the upper risk-assessment benchmark, yellow if country value is between the lower and upper risk-assessment benchmarks. If data are unavailable or indicator is not relevant, cell is white. Lower and upper risk-assessment benchmarks are:
Change in the Share of Short-
Term Debt
Exchange Rate Shock
Contingent Liability shock
Debt level 1/
20
6027%
1 2
200
600272 bp
1 2
5
1514%
1 2
0.5
1
-2.7%
1 2
EMBI External Financing Requirement
Annual Change in Short-Term Public
Debt
Public Debt in Foreign Currency
(in basis points) 4/ (in percent of GDP) (in percent of total) (in percent of total)
0
10
20
30
40
50
60
70
2014 2015 2016 2017 2018 2019 2020 2021
10th-25th 25th-75th 75th-90thPercentiles:Baseline
Symmetric Distribution
0
10
20
30
40
50
60
70
80
2014 2015 2016 2017 2018 2019 2020 2021
Restricted (Asymmetric) Distribution
no restriction on the growth rate shockno restriction on the interest rate shock0 is the max positive pb shock (percent GDP)no restriction on the exchange rate shock
Restrictions on upside shocks:
15
4549%
1 2
Public Debt Held by Non-Residents
(in percent of total)
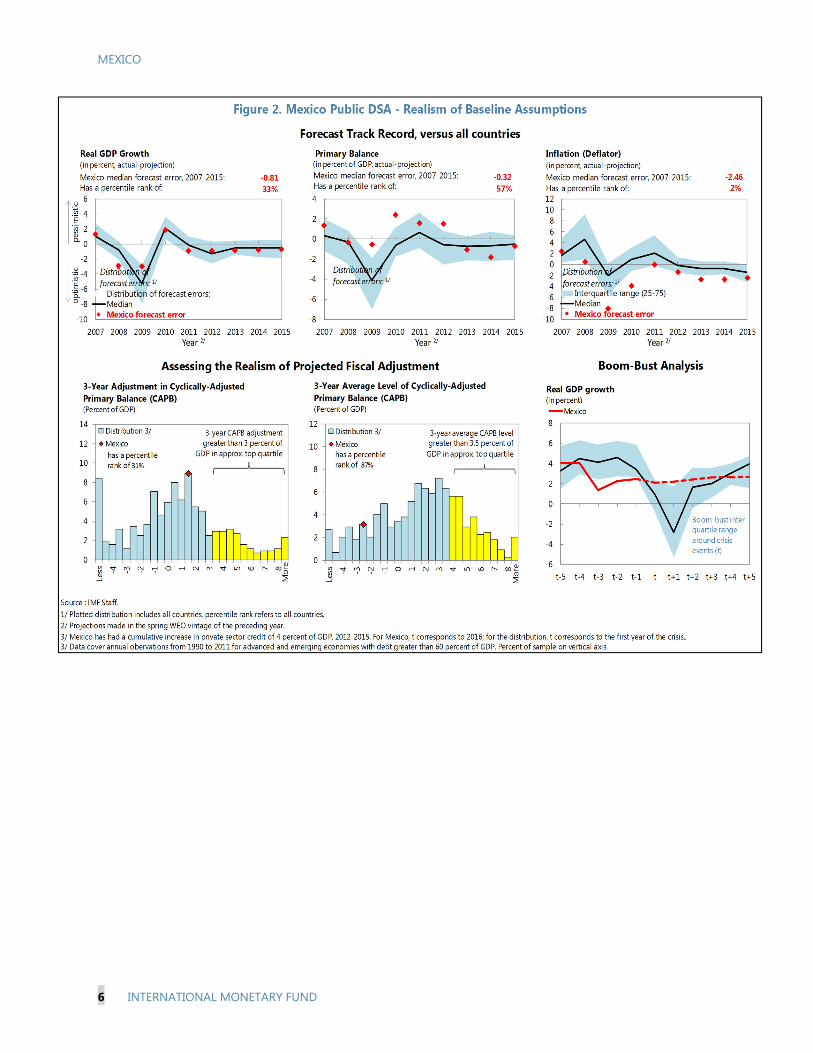
MEXICO
6 INTERNATIONAL MONETARY FUND
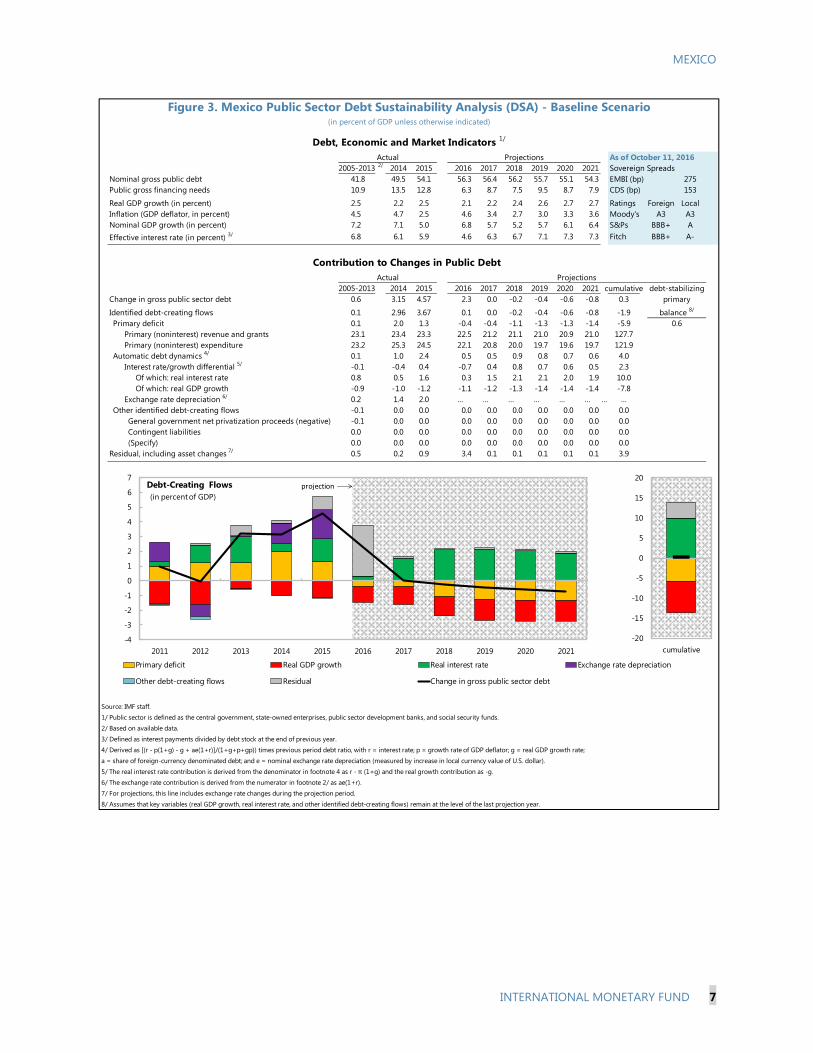
MEXICO
INTERNATIONAL MONETARY FUND 7
As of October 11, 20162/ 2014 2015 2016 2017 2018 2019 2020 2021 Sovereign Spreads
Nominal gross public debt 41.8 49.5 54.1 56.3 56.4 56.2 55.7 55.1 54.3 EMBI (bp) 275Public gross financing needs 10.9 13.5 12.8 6.3 8.7 7.5 9.5 8.7 7.9 CDS (bp) 153
Real GDP growth (in percent) 2.5 2.2 2.5 2.1 2.2 2.4 2.6 2.7 2.7 Ratings Foreign LocalInflation (GDP deflator, in percent) 4.5 4.7 2.5 4.6 3.4 2.7 3.0 3.3 3.6 Moody's A3 A3Nominal GDP growth (in percent) 7.2 7.1 5.0 6.8 5.7 5.2 5.7 6.1 6.4 S&Ps BBB+ AEffective interest rate (in percent) 3/ 6.8 6.1 5.9 4.6 6.3 6.7 7.1 7.3 7.3 Fitch BBB+ A-
2014 2015 2016 2017 2018 2019 2020 2021 cumulativeChange in gross public sector debt 0.6 3.15 4.57 2.3 0.0 -0.2 -0.4 -0.6 -0.8 0.3
Identified debt-creating flows 0.1 2.96 3.67 0.1 0.0 -0.2 -0.4 -0.6 -0.8 -1.9Primary deficit 0.1 2.0 1.3 -0.4 -0.4 -1.1 -1.3 -1.3 -1.4 -5.9
Primary (noninterest) revenue and grants 23.1 23.4 23.3 22.5 21.2 21.1 21.0 20.9 21.0 127.7Primary (noninterest) expenditure 23.2 25.3 24.5 22.1 20.8 20.0 19.7 19.6 19.7 121.9
Automatic debt dynamics 4/ 0.1 1.0 2.4 0.5 0.5 0.9 0.8 0.7 0.6 4.0Interest rate/growth differential 5/ -0.1 -0.4 0.4 -0.7 0.4 0.8 0.7 0.6 0.5 2.3
Of which: real interest rate 0.8 0.5 1.6 0.3 1.5 2.1 2.1 2.0 1.9 10.0Of which: real GDP growth -0.9 -1.0 -1.2 -1.1 -1.2 -1.3 -1.4 -1.4 -1.4 -7.8
Exchange rate depreciation 6/ 0.2 1.4 2.0 … … … … … … … …Other identified debt-creating flows -0.1 0.0 0.0 0.0 0.0 0.0 0.0 0.0 0.0 0.0
General government net privatization proceeds (negative) -0.1 0.0 0.0 0.0 0.0 0.0 0.0 0.0 0.0 0.0Contingent liabilities 0.0 0.0 0.0 0.0 0.0 0.0 0.0 0.0 0.0 0.0(Specify) 0.0 0.0 0.0 0.0 0.0 0.0 0.0 0.0 0.0 0.0
Residual, including asset changes 7/ 0.5 0.2 0.9 3.4 0.1 0.1 0.1 0.1 0.1 3.9
Source: IMF staff.
1/ Public sector is defined as the central government, state-owned enterprises, public sector development banks, and social security funds.
2/ Based on available data.
3/ Defined as interest payments divided by debt stock at the end of previous year.
4/ Derived as [(r - p(1+g) - g + ae(1+r)]/(1+g+p+gp)) times previous period debt ratio, with r = interest rate; p = growth rate of GDP deflator; g = real GDP growth rate;
a = share of foreign-currency denominated debt; and e = nominal exchange rate depreciation (measured by increase in local currency value of U.S. dollar).
5/ The real interest rate contribution is derived from the denominator in footnote 4 as r - π (1+g) and the real growth contribution as -g.
6/ The exchange rate contribution is derived from the numerator in footnote 2/ as ae(1+r).
7/ For projections, this line includes exchange rate changes during the projection period.
8/ Assumes that key variables (real GDP growth, real interest rate, and other identified debt-creating flows) remain at the level of the last projection year.
Figure 3. Mexico Public Sector Debt Sustainability Analysis (DSA) - Baseline Scenario
0.6balance 8/
primary
(in percent of GDP unless otherwise indicated)
Debt, Economic and Market Indicators 1/
2005-2013Actual
Projections
Contribution to Changes in Public DebtProjections
2005-2013Actual
debt-stabilizing
-20
-15
-10
-5
0
5
10
15
20
cumulative-4
-3
-2
-1
0
1
2
3
4
5
6
7
2011 2012 2013 2014 2015 2016 2017 2018 2019 2020 2021
Debt-Creating Flows
Primary deficit Real GDP growth Real interest rate Exchange rate depreciation
Other debt-creating flows Residual Change in gross public sector debt
projection
(in percent of GDP)
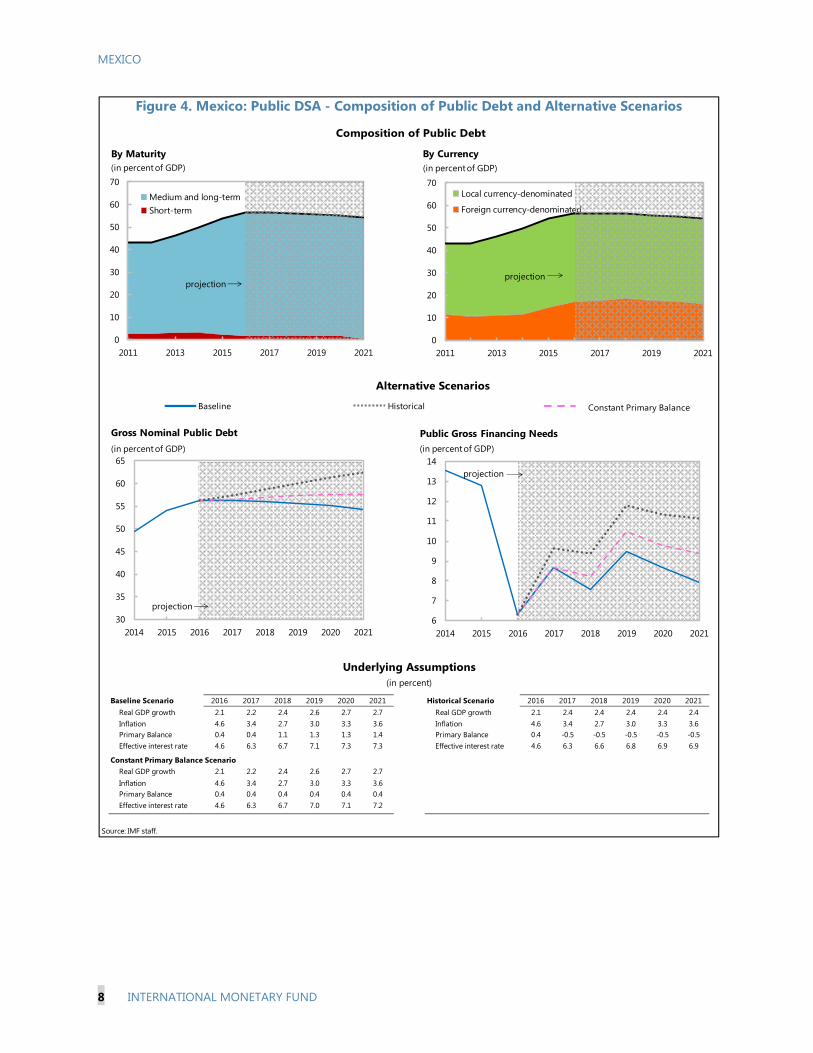
MEXICO
8 INTERNATIONAL MONETARY FUND
Baseline Scenario 2016 2017 2018 2019 2020 2021 Historical Scenario 2016 2017 2018 2019 2020 2021Real GDP growth 2.1 2.2 2.4 2.6 2.7 2.7 Real GDP growth 2.1 2.4 2.4 2.4 2.4 2.4Inflation 4.6 3.4 2.7 3.0 3.3 3.6 Inflation 4.6 3.4 2.7 3.0 3.3 3.6Primary Balance 0.4 0.4 1.1 1.3 1.3 1.4 Primary Balance 0.4 -0.5 -0.5 -0.5 -0.5 -0.5Effective interest rate 4.6 6.3 6.7 7.1 7.3 7.3 Effective interest rate 4.6 6.3 6.6 6.8 6.9 6.9
Constant Primary Balance ScenarioReal GDP growth 2.1 2.2 2.4 2.6 2.7 2.7Inflation 4.6 3.4 2.7 3.0 3.3 3.6Primary Balance 0.4 0.4 0.4 0.4 0.4 0.4Effective interest rate 4.6 6.3 6.7 7.0 7.1 7.2
Source: IMF staff.
Underlying Assumptions(in percent)
Figure 4. Mexico: Public DSA - Composition of Public Debt and Alternative Scenarios
30
35
40
45
50
55
60
65
2014 2015 2016 2017 2018 2019 2020 2021
Gross Nominal Public Debt(in percent of GDP)
projection6
7
8
9
10
11
12
13
14
2014 2015 2016 2017 2018 2019 2020 2021
Public Gross Financing Needs(in percent of GDP)
projection
0
10
20
30
40
50
60
70
2011 2013 2015 2017 2019 2021
By Maturity
Medium and long-termShort-term
projection
(in percent of GDP)
0
10
20
30
40
50
60
70
2011 2013 2015 2017 2019 2021
By Currency
Local currency-denominated
Foreign currency-denominated
projection
(in percent of GDP)
Alternative Scenarios
Baseline Historical Constant Primary Balance
Composition of Public Debt

MEXICO
INTERNATIONAL MONETARY FUND 9
Primary Balance Shock 2016 2017 2018 2019 2020 2021 Real GDP Growth Shock 2016 2017 2018 2019 2020 2021Real GDP growth 2.1 2.2 2.4 2.6 2.7 2.7 Real GDP growth 2.1 -0.6 -0.4 2.6 2.7 2.7Inflation 4.6 3.4 2.7 3.0 3.3 3.6 Inflation 4.6 2.7 2.0 3.0 3.3 3.6Primary balance 0.4 -0.4 0.3 1.3 1.3 1.4 Primary balance 0.4 -0.3 -0.4 1.3 1.3 1.4Effective interest rate 4.6 6.3 6.8 7.0 7.1 7.2 Effective interest rate 4.6 6.3 6.8 7.1 7.2 7.2
Real Interest Rate Shock Real Exchange Rate ShockReal GDP growth 2.1 2.2 2.4 2.6 2.7 2.7 Real GDP growth 2.1 2.2 2.4 2.6 2.7 2.7Inflation 4.6 3.4 2.7 3.0 3.3 3.6 Inflation 4.6 4.5 2.7 3.0 3.3 3.6Primary balance 0.4 0.4 1.1 1.3 1.3 1.4 Primary balance 0.4 0.4 1.1 1.3 1.3 1.4Effective interest rate 4.6 6.3 7.1 7.5 7.8 8.0 Effective interest rate 4.6 6.6 6.7 6.9 7.0 7.1
Combined ShockReal GDP growth 2.1 -0.6 -0.4 2.6 2.7 2.7Inflation 4.6 2.7 2.0 3.0 3.3 3.6Primary balance 0.4 -0.4 -0.4 1.3 1.3 1.4Effective interest rate 4.6 6.6 7.0 7.5 7.9 8.1
Source: IMF staff.
Figure 5. Mexico: Public DSA - Stress Tests
Macro-Fiscal Stress Tests
(in percent)
Combined Macro-Fiscal Shock
Additional Stress Tests
Baseline
Underlying Assumptions
Real Interest Rate ShockReal GDP Growth Shock
Primary Balance ShockBaselineReal Exchange Rate Shock
40
45
50
55
60
65
2016 2017 2018 2019 2020 2021
Gross Nominal Public Debt(in percent of GDP)
190
210
230
250
270
290
310
2016 2017 2018 2019 2020 2021
Gross Nominal Public Debt(in percent of Revenue)
6
7
8
9
10
11
12
2016 2017 2018 2019 2020 2021
Public Gross Financing Needs(in percent of GDP)
40
45
50
55
60
65
70
2016 2017 2018 2019 2020 2021
Gross Nominal Public Debt(in percent of GDP)
190
210
230
250
270
290
310
330
2016 2017 2018 2019 2020 2021
Gross Nominal Public Debt(in percent of Revenue)
6
7
8
9
10
11
12
13
2016 2017 2018 2019 2020 2021
Public Gross Financing Needs(in percent of GDP)

MEXICO
10 INTERNATIONAL MONETARY FUND
EXTERNAL DEBT SUSTAINABILITY ANALYSIS Mexico’s external-debt-to GDP ratio continues to be low and sustainable (expected at 42 percent projected for end-2016), and is expected to remain stable over the medium term. Most shock scenarios would increase external debt by just a few percentage points. The largest increase would occur under a depreciation scenario. However, even in the unlikely event of a further 30 percent real exchange rate depreciation, the debt-to-GDP ratio would increase to 58 percent, which would still be manageable. The reason for this contained increase is that 42 percent of Mexico’s public external debt is denominated in pesos (this is less than before the recent depreciation, though, when the ratio stood at around half). Debt dynamics also benefit from the low interest rates and long maturities of the existing debt.

MEXICO
INTERNATIONAL MONETARY FUND 11
i-rate shock
44
Baseline43
15
20
25
30
35
40
45
50
2011 2013 2015 2017 2019 2021
Interest rate shock (in percent)
Figure 8. Mexico: External Debt Sustainability: Bound Tests 1/ 2/(External debt in percent of GDP)
Sources: International Monetary Fund, Country desk data, and staff estimates.1/ Shaded areas represent actual data. Individual shocks are permanent one-half standard deviation shocks. Figures in the boxes represent average projections for the respective variables in the baseline and scenario being presented. Ten-year historical average for the variable is also shown. 2/ For historical scenarios, the historical averages are calculated over the ten-year period, and the information is used to project debt dynamics five years ahead.3/ Permanent 1/4 standard deviation shocks applied to real interest rate, growth rate, and current account balance.4/ One-time real depreciation of 30 percent occurs in 2016.
Historical53
Baseline
43
0
2
4
6
8
10
12
14
16
18
20
15
20
25
30
35
40
45
50
55
2011 2013 2015 2017 2019 2021
Baseline and historical scenarios
CA shock 44
Baseline43
15
20
25
30
35
40
45
50
2011 2013 2015 2017 2019 2021
Combined shock
46
Baseline43
15
20
25
30
35
40
45
50
2011 2013 2015 2017 2019 2021
Combined shock 3/
30 % depreciation
58
Baseline43
15
20
25
30
35
40
45
50
55
60
2011 2013 2015 2017 2019 2021
Real depreciation shock 4/
Gross financing need under baseline
(right scale)
Non-interest current account shock (in percent of GDP)
Growth shock 46
Baseline 43
15
20
25
30
35
40
45
50
2011 2013 2015 2017 2019 2021
Baseline:
Scenario:
Historical:
8.69.2
7.4
Baseline:
Scenario:
Historical:
2.51.1
2.4
Baseline:
Scenario:
Historical:
0.60.3
0.1
Growth shock (in percent per year)
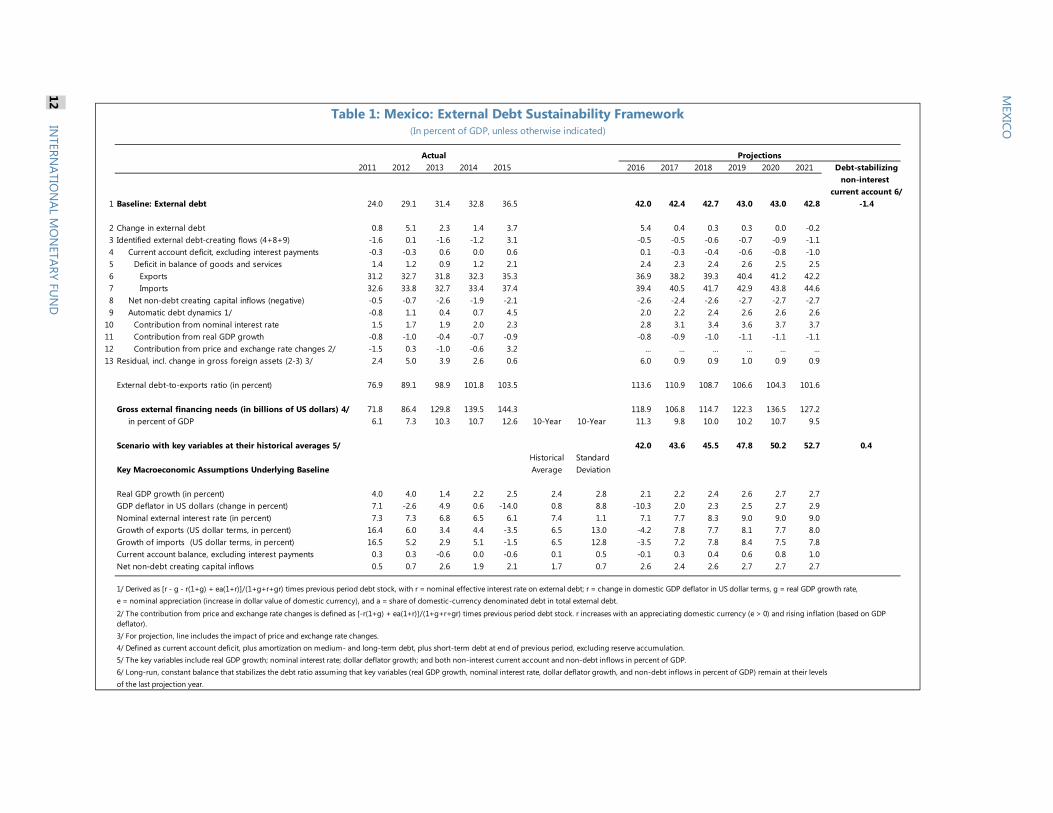
Projections2011 2012 2013 2014 2015 2016 2017 2018 2019 2020 2021 Debt-stabilizing
non-interest current account 6/
1 Baseline: External debt 24.0 29.1 31.4 32.8 36.5 42.0 42.4 42.7 43.0 43.0 42.8 -1.4
2 Change in external debt 0.8 5.1 2.3 1.4 3.7 5.4 0.4 0.3 0.3 0.0 -0.23 Identified external debt-creating flows (4+8+9) -1.6 0.1 -1.6 -1.2 3.1 -0.5 -0.5 -0.6 -0.7 -0.9 -1.14 Current account deficit, excluding interest payments -0.3 -0.3 0.6 0.0 0.6 0.1 -0.3 -0.4 -0.6 -0.8 -1.05 Deficit in balance of goods and services 1.4 1.2 0.9 1.2 2.1 2.4 2.3 2.4 2.6 2.5 2.56 Exports 31.2 32.7 31.8 32.3 35.3 36.9 38.2 39.3 40.4 41.2 42.27 Imports 32.6 33.8 32.7 33.4 37.4 39.4 40.5 41.7 42.9 43.8 44.68 Net non-debt creating capital inflows (negative) -0.5 -0.7 -2.6 -1.9 -2.1 -2.6 -2.4 -2.6 -2.7 -2.7 -2.79 Automatic debt dynamics 1/ -0.8 1.1 0.4 0.7 4.5 2.0 2.2 2.4 2.6 2.6 2.6
10 Contribution from nominal interest rate 1.5 1.7 1.9 2.0 2.3 2.8 3.1 3.4 3.6 3.7 3.711 Contribution from real GDP growth -0.8 -1.0 -0.4 -0.7 -0.9 -0.8 -0.9 -1.0 -1.1 -1.1 -1.112 Contribution from price and exchange rate changes 2/ -1.5 0.3 -1.0 -0.6 3.2 ... ... ... ... ... ...13 Residual, incl. change in gross foreign assets (2-3) 3/ 2.4 5.0 3.9 2.6 0.6 6.0 0.9 0.9 1.0 0.9 0.9
External debt-to-exports ratio (in percent) 76.9 89.1 98.9 101.8 103.5 113.6 110.9 108.7 106.6 104.3 101.6
Gross external financing needs (in billions of US dollars) 4/ 71.8 86.4 129.8 139.5 144.3 118.9 106.8 114.7 122.3 136.5 127.2in percent of GDP 6.1 7.3 10.3 10.7 12.6 10-Year 10-Year 11.3 9.8 10.0 10.2 10.7 9.5
Scenario with key variables at their historical averages 5/ 42.0 43.6 45.5 47.8 50.2 52.7 0.4Historical Standard
Key Macroeconomic Assumptions Underlying Baseline Average Deviation
Real GDP growth (in percent) 4.0 4.0 1.4 2.2 2.5 2.4 2.8 2.1 2.2 2.4 2.6 2.7 2.7GDP deflator in US dollars (change in percent) 7.1 -2.6 4.9 0.6 -14.0 0.8 8.8 -10.3 2.0 2.3 2.5 2.7 2.9Nominal external interest rate (in percent) 7.3 7.3 6.8 6.5 6.1 7.4 1.1 7.1 7.7 8.3 9.0 9.0 9.0Growth of exports (US dollar terms, in percent) 16.4 6.0 3.4 4.4 -3.5 6.5 13.0 -4.2 7.8 7.7 8.1 7.7 8.0Growth of imports (US dollar terms, in percent) 16.5 5.2 2.9 5.1 -1.5 6.5 12.8 -3.5 7.2 7.8 8.4 7.5 7.8Current account balance, excluding interest payments 0.3 0.3 -0.6 0.0 -0.6 0.1 0.5 -0.1 0.3 0.4 0.6 0.8 1.0Net non-debt creating capital inflows 0.5 0.7 2.6 1.9 2.1 1.7 0.7 2.6 2.4 2.6 2.7 2.7 2.7
1/ Derived as [r - g - r(1+g) + ea(1+r)]/(1+g+r+gr) times previous period debt stock, with r = nominal effective interest rate on external debt; r = change in domestic GDP deflator in US dollar terms, g = real GDP growth rate, e = nominal appreciation (increase in dollar value of domestic currency), and a = share of domestic-currency denominated debt in total external debt.
3/ For projection, line includes the impact of price and exchange rate changes.4/ Defined as current account deficit, plus amortization on medium- and long-term debt, plus short-term debt at end of previous period, excluding reserve accumulation. 5/ The key variables include real GDP growth; nominal interest rate; dollar deflator growth; and both non-interest current account and non-debt inflows in percent of GDP.6/ Long-run, constant balance that stabilizes the debt ratio assuming that key variables (real GDP growth, nominal interest rate, dollar deflator growth, and non-debt inflows in percent of GDP) remain at their levels of the last projection year.
Table 1: Mexico: External Debt Sustainability Framework(In percent of GDP, unless otherwise indicated)
Actual
2/ The contribution from price and exchange rate changes is defined as [-r(1+g) + ea(1+r)]/(1+g+r+gr) times previous period debt stock. r increases with an appreciating domestic currency (e > 0) and rising inflation (based on GDP deflator).
MEXICO
12 IN
TERNATIO
NAL M
ON
ETARY FUN
D

Statement by the IMF Staff Representative on November 16, 2016
1. This supplement provides an update on economic and market developments since theissuance of the staff report on November 4, 2016. It does not change the thrust of the staff appraisal.
2. There have been some movements in Mexico’s financial markets in recent days.The Mexican peso depreciated by about 14 percent between November 8 and November 11, following the U.S. election. Over the same period, the 10-year local currency sovereign bond yield increased by about 100 basis points, compared to a 30 basis point increase in the U.S. 10-year bond yield, and the stock market declined 7.5 percent in local currency terms. On November 9, the authorities held a press conference emphasizing that Mexico’s fundamentals remained strong, underpinned by the structural reforms underway, sound fiscal management, and the credible inflation targeting framework, supported by exchange rate flexibility. They added that net international reserves remained adequate and in addition the country was eligible to draw up to US$86 billion under the Flexible Credit Line. No policy actions were required, although they would continue to monitor the situation closely.
3. The state-owned oil company PEMEX released a five-year business plan in earlyNovember. The plan envisages the company will return to a primary surplus in 2017 and will have a balanced budget by 2020. In the short term, the focus will be on improving efficiency and profitability by focusing investment on high-return activities. In the medium term, PEMEX will rely increasingly on partnerships with the private sector to increase investment and production, and improve the efficiency of operations in certain business areas. The company has already announced three auctions for joint oil exploration and production, to be completed by April 2017. PEMEX has also pursued an active debt management strategy in recent months, extending its average debt maturity.