IMF Country Report No. 15/349 ISLAMIC REPUBLIC OF IRAN · PDF fileIMF Country Report No....
67
© 2015 International Monetary Fund IMF Country Report No. 15/349 ISLAMIC REPUBLIC OF IRAN 2015 ARTICLE IV CONSULTATION—PRESS RELEASE; STAFF REPORT; AND STATEMENT BY THE EXECUTIVE DIRECTOR FOR THE ISLAMIC REPUBLIC OF IRAN Under Article IV of the IMF’s Articles of Agreement, the IMF holds bilateral discussions with members, usually every year. In the context of the 2015 Article IV consultation with the Islamic Republic of Iran, the following documents have been released and are included in this package: A Press Release summarizing the views of the Executive Board as expressed during its December 7, 2015 consideration of the staff report that concluded the Article IV consultation with the Islamic Republic of Iran. The Staff Report prepared by a staff team of the IMF for the Executive Board’s consideration on December 7, 2015, following discussions that ended on September 30, 2015, with the officials of the Islamic Republic of Iran on economic developments and policies. Based on information available at the time of these discussions, the staff report was completed on November 18, 2015. An Informational Annex prepared by the IMF staff. A Statement by the Executive Director for the Islamic Republic of Iran. The documents listed below have been or will be separately released. Selected Issues The IMF’s transparency policy allows for the deletion of market-sensitive information and premature disclosure of the authorities’ policy intentions in published staff reports and other documents. Copies of this report are available to the public from International Monetary Fund Publication Services PO Box 92780 Washington, D.C. 20090 Telephone: (202) 623-7430 Fax: (202) 623-7201 E-mail: [email protected] Web: http://www.imf.org Price: $18.00 per printed copy International Monetary Fund Washington, D.C. December 2015
Transcript of IMF Country Report No. 15/349 ISLAMIC REPUBLIC OF IRAN · PDF fileIMF Country Report No....

© 2015 International Monetary Fund
IMF Country Report No. 15/349
ISLAMIC REPUBLIC OF IRAN 2015 ARTICLE IV CONSULTATION—PRESS RELEASE; STAFF REPORT; AND STATEMENT BY THE EXECUTIVE DIRECTOR FOR THE ISLAMIC REPUBLIC OF IRAN
Under Article IV of the IMF’s Articles of Agreement, the IMF holds bilateral discussions
with members, usually every year. In the context of the 2015 Article IV consultation with
the Islamic Republic of Iran, the following documents have been released and are included
in this package:
A Press Release summarizing the views of the Executive Board as expressed during its
December 7, 2015 consideration of the staff report that concluded the Article IV
consultation with the Islamic Republic of Iran.
The Staff Report prepared by a staff team of the IMF for the Executive Board’s
consideration on December 7, 2015, following discussions that ended on
September 30, 2015, with the officials of the Islamic Republic of Iran on economic
developments and policies. Based on information available at the time of these
discussions, the staff report was completed on November 18, 2015.
An Informational Annex prepared by the IMF staff.
A Statement by the Executive Director for the Islamic Republic of Iran.
The documents listed below have been or will be separately released.
Selected Issues
The IMF’s transparency policy allows for the deletion of market-sensitive information and
premature disclosure of the authorities’ policy intentions in published staff reports and
other documents.
Copies of this report are available to the public from
International Monetary Fund Publication Services
PO Box 92780 Washington, D.C. 20090
Telephone: (202) 623-7430 Fax: (202) 623-7201
E-mail: [email protected] Web: http://www.imf.org
Price: $18.00 per printed copy
International Monetary Fund
Washington, D.C.
December 2015

Press Release No. 15/581
FOR IMMEDIATE RELEASE
December 21, 2015
IMF Executive Board Concludes 2015 Article IV Consultation with Iran
On December 7, 2015, the Executive Board of the International Monetary Fund (IMF)
concluded the Article IV consultation1 with Iran.
The sharp decline in global oil prices, tight corporate and bank balance sheets, and postponed
consumption and investment decisions ahead of the expected lifting of economic sanctions, have
significantly slowed down economic activity since the fourth quarter of 2014/15. Real GDP
growth is projected to decline from 3 percent in 2014/152 to somewhere between 0.5
to -0.5 percent in 2015/16. Twelve-month (point-to-point) inflation has declined to around
10 percent in recent months, largely reflecting lower food and beverage inflation, and the
inflation rate is expected to remain close to 14 percent by year-end.
Prospects for 2016/17 are brighter, owing to the prospective lifting of economic sanctions.
Higher oil production, lower costs for trade and financial transactions, and restored access to
foreign assets, are expected to lift real GDP to about 4–5.5 percent next year. Much of the
acceleration in growth will also depend on the spillovers from increased oil production to the
rest of the economy. Higher oil revenue and terms of trade, and renewed access to foreign assets
and capital can lead to appreciation pressures on the real exchange rate. Continued gradual fiscal
consolidation—including by sustaining tax revenue mobilization and subsidy reform efforts—
1 Under Article IV of the IMF's Articles of Agreement, the IMF holds bilateral discussions with members, usually every year. A staff team visits the country, collects economic and financial information, and discusses with officials the country's economic developments and policies. On return to headquarters, the staff prepares a report, which forms the basis for discussion by the Executive Board.
2 Iran fiscal year ends March 20.
International Monetary Fund
700 19th Street, NW
Washington, D. C. 20431 USA

2
and prudent monetary policy, anchored by the authorities’ goal of achieving single-digit inflation
by the end of 2016/17, can mitigate these upward pressures. With reforms to the policy
framework, bank balance sheets, and taxation, real GDP growth would stabilize at around
4 percent over the medium term. Comprehensive reforms to the business environment are
needed over the medium term to ensure that the expected lifting of economic sanctions has a
significant impact on confidence and investment and places the economy on a higher and more
inclusive growth trajectory.
Executive Board Assessment3
Directors commended the authorities for the progress in improving macroeconomic conditions in
a difficult economic environment. Notwithstanding the sharp drop in global oil prices, Directors
noted that economic conditions should improve in 2016 and beyond, with the expected lifting of
economic sanctions. However, they stressed the need to advance comprehensive reforms to the
policy framework and the economy to sustain progress on macroeconomic stability and to
improve growth prospects.
Directors encouraged the authorities to maintain their focus on disinflation. While
acknowledging the current weaknesses in the economy, they urged the authorities to implement
the recent stimulus package cautiously and to support it by announcing broad money and
inflation objectives for 2016/17 to better anchor inflation expectations and the exchange rate.
Directors looked forward to the enactment of the new Money and Banking law to strengthen the
central bank’s legal mandate on price stability, and encouraged efforts to improve
communication and transparency.
Directors underlined the importance of prompt and comprehensive reforms to address financial
sector challenges. They welcomed the steps taken to assess the financial health of banks and the
draft bill to strengthen the prudential supervision framework. Directors stressed the need for a
steadfast restructuring of nonperforming loans and banks and addressing unlicensed financial
institutions, which would also help lower the high levels of real interest rates. Decisive action on
addressing government arrears would also help strengthen banks’ balance sheets. Directors
3 At the conclusion of the discussion, the Managing Director, as Chairman of the Board, summarizes the views of Executive Directors, and this summary is transmitted to the country's authorities. An explanation of any qualifiers used in summings up can be found here: http://www.imf.org/external/np/sec/misc/qualifiers.htm.

3
urged the authorities to bolster the AML/CFT framework to facilitate the re-integration of the
domestic financial system into the global economy.
Directors welcomed the commitment to fiscal consolidation, noting the progress in mobilizing
domestic revenue and advancing the subsidy reform agenda. Looking forward, they stressed the
importance of public finance management reform, and encouraged the authorities to establish a
medium-term perspective to fiscal policy formulation, targeting the non-oil balance, rebuilding
buffers, and enhancing transparency. Directors underlined that bringing the non-oil fiscal deficit
closer to its long-run sustainable level would also support the disinflation objective. To achieve
this goal, continued efforts to mobilize domestic revenue will be needed, as well as further
adjustment in domestic fuel prices to help contain the deficit of the Targeted Subsidy
Organization.
Directors encouraged the authorities to press ahead with an ambitious structural reform agenda,
including by fostering conditions for more inclusive growth, particularly for youth and female
employment. These efforts will require further development of the private sector, reforms to
unlock productivity, including by lifting price and administrative controls, and greater
transparency and accountability. With comprehensive reforms, the expected lifting of sanctions
should help place the economy on a higher growth trajectory.
Directors welcomed the authorities’ commitment to unify the foreign exchange market by
end-September 2016, and encouraged the prompt removal of the foreign exchange restriction
and multiple currency practices. While welcoming recent progress, Directors advised further
improving the timeliness and quality of official statistics.

4
Table 1. Islamic Republic of Iran: Selected Macroeconomic Indicators, 2013/14–2020/21 1/
Est. Proj. Proj. Proj. Proj. Proj. Proj.
2013/14 2014/15 2015/16 2016/17 2017/18 2018/19 2019/20 2020/21
(Annual change, in percent, unless otherwise indicated)
National accounts
Nominal GDP at market prices (in billions of Iranian rials)
9,421,216 11,033,666 11,992,122 14,042,908 15,934,661 17,694,609 19,371,763 21,150,347
Real GDP at factor cost -1.9 3.0 0.0 4.3 4.0 4.1 4.4 4.4
Real oil and gas GDP -8.9 4.8 0.5 16.9 8.8 2.9 2.5 2.5
Real nonoil GDP -1.1 2.8 -0.1 2.8 3.4 4.3 4.6 4.6
CPI inflation (average) 34.7 15.5 15.1 11.5 8.3 6.3 5.0 5.0
CPI inflation (end of period) 19.7 16.2 14.0 9.0 7.5 5.0 5.0 5.0
GDP deflator at factor cost 34.3 12.2 8.7 12.3 9.1 6.6 4.9 4.6
Unemployment rate (in percent of labor force) 10.4 10.6 11.9 12.5 12.6 12.4 12.2 11.9
(In percent of GDP)
Budgetary operations
Revenue 14.1 14.6 13.2 14.5 15.5 15.4 15.4 15.4
Taxes 5.2 6.4 6.8 7.2 7.6 7.7 7.9 8.1
Other revenue 8.8 8.1 6.4 7.3 7.9 7.7 7.6 7.3
Of which: oil revenue 6.5 5.7 3.9 4.9 5.6 5.5 5.4 5.2
Expenditure 15.0 15.7 15.4 15.9 15.8 15.7 15.6 15.6
Expense 12.7 13.0 12.8 12.7 12.5 12.3 12.2 11.9
Net acquisition of nonfinancial assets 2.3 2.7 2.7 3.2 3.3 3.4 3.5 3.7
Net lending/borrowing (overall balance) -2.2 -1.2 -2.5 -1.3 -0.3 -0.3 -0.2 -0.2
Net lending/borrowing (budget) -0.9 -1.2 -2.2 -1.3 -0.3 -0.3 -0.2 -0.2
Balance of Targeted Subsidy Organization -1.3 0.0 -0.3 0.0 0.0 0.0 0.0 0.0
Non-oil net lending/borrowing (in percent of non-oil GDP)
-10.6 -8.2 -7.2 -7.1 -6.9 -6.7 -6.5 -6.3
Financial assets -0.5 -1.0 -1.1 -0.5 0.4 0.4 -0.1 0.0
Liabilities 1.7 0.2 1.4 0.9 0.7 0.7 0.1 0.1
(Annual change in percent, unless otherwise indicated)
Monetary sector
Net foreign assets 131.0 1.3 31.2 15.0 14.6 11.8 10.5 9.5
Net domestic assets -5.4 43.4 8.2 18.0 14.7 14.3 14.8 15.3
Credit to the private sector in rials 30.7 16.7 17.3 18.2 17.5 16.0 15.7 14.5
Base money 18.8 14.5 21.0 18.2 15.4 13.7 13.1 12.8
Narrow money (M1) 8.1 1.6 10.5 13.7 14.3 11.7 12.7 12.8
Broad money (M2) 39.5 22.4 20.0 17.1 15.4 13.7 13.1 12.8
(In billions of U.S. dollars, unless otherwise indicated)
External sector
Current account balance 26.5 15.9 4.5 8.5 11.7 13.2 12.5 12.1
In percent of GDP at market prices 7.8 4.1 1.3 2.1 2.6 2.8 2.4 2.2
Exports of goods and services 100.1 93.9 74.3 90.5 104.0 111.9 117.8 124.4
Imports of goods and services -75.2 -80.1 -72.5 -85.9 -97.5 -104.6 -111.1 -118.1
External and publicly guaranteed debt 6.7 5.1 8.9 10.7 13.3 15.9 18.7 21.8
Of which: short-term debt 0.8 0.4 4.6 6.2 7.8 9.3 10.7 12.2
Gross official assets/reserves 117.6 126.2 128.9 142.1 159.9 179.3 198.2 217.2
Oil and gas sector
Total oil and gas exports (billions) 64.9 55.4 35.3 48.6 59.8 65.3 68.6 71.2
WEO Oil Price adjusted for Iranian year (per barrel)
103.7 83.3 50.7 52.9 57.6 61.0 62.6 63.0
Average oil export price (per barrel) 101.1 79.1 49.7 52.9 57.6 61.0 62.6 63.0
Crude oil exports (in millions of barrels/day) 1.13 1.16 1.24 1.81 2.13 2.22 2.29 2.38
Crude oil production (in millions of barrels/day) 2.85 3.09 3.11 3.7 4.0 4.2 4.3 4.4
(In U.S. dollars, unless otherwise indicated)
Memorandum items:
Average exchange rate (Iranian rials per U.S. dollar)
24,770 26,492 ... … … … … …
End-of-period exchange rate (Iranian rials per U.S. dollar)
24,770 28,000 … … … … … …
Sources: Iranian authorities; and Fund staff estimates and projections.
1/ The Iranian fiscal year ends March 20.

ISLAMIC REPUBLIC OF IRAN
STAFF REPORT FOR THE 2015 ARTICLE IV CONSULTATION
KEY ISSUES
Context. After a 9 percent contraction over the previous two years, interim sanctions
relief and prudent policies eased constraints on trade and financial transactions,
improved economic activity, and lowered inflation in 2014/15. Although the decline in oil
prices has negatively affected economic activity in 2015/16, the comprehensive
agreement between Iran and the P5+1, if implemented successfully, should improve
Iran’s external environment and economic performance substantially going forward.
However, Iran faces multiple constraints to unleash its growth potential and to achieve
single-digit inflation sustainably. The economy’s dependency on hydrocarbons remains
high, the policy framework is not well-designed to respond to shocks, and structural
vulnerabilities abound. Corporate and bank balance sheets are weak, unemployment is
high, particularly among youth and women, and doing business is costly. Placing the
Iranian economy among the top emerging market economies over the next decades will
require comprehensive reforms.
Focus of the consultation: (i) sustain the progress made toward stabilizing
macroeconomic conditions; (ii) enhance the policy framework, (iii) repair corporate and
bank balance sheets; and (iv) strengthen growth potential and inclusive growth.
Key policy recommendations: (i) remain focused on disinflation through prudent fiscal
policy and greater operational autonomy of the central bank; (ii) replenish fiscal buffers
to better respond to shocks, while bringing a medium-term perspective to fiscal policy
formulation; (iii) enhance the transparency and communications of monetary policy
goals; (iv) strengthen the prudential and supervisory framework for the financial sector
and proceed with banks’ restructuring, resolution of nonperforming loans, and
strengthening the AML/CFT framework; and (v) advance reforms to boost productivity
and reduce the cost of doing business to foster employment and private-sector
development.
November 18, 2015
ISLAMIC REPUBLIC OF IRAN
2 INTERNATIONAL MONETARY FUND
Approved By Aasim M. Husain and
Taline Koranchelian
Discussions took place in Tehran during September 19–30, 2015. Staff
representatives comprised M. Cerisola (head), O. Basdevant,
R. Blotevogel (all MCD), C. El Khoury, and H. Pham (LEG). Mr. Husain
(MCD) and Mr. Mojarrad (OED) also participated in some of the
discussions. The mission met with Central Bank Governor (CBI) Seif,
as well other senior government officials and private sector
representatives. A. Sadeghi, M. Orihuela-Quintanilla, and N. Cayo
assisted in the preparation of the report.
CONTENTS
CONTEXT_________________________________________________________________________________________ 4
MACRO-FINANCIAL DEVELOPMENTS, OUTLOOK, RISKS AND SPILLOVERS __________________ 5
A. Recent Macro-Financial Developments and Outlook ___________________________________________ 5
B. Risks and Spillovers ___________________________________________________________________________ 10
POLICY DISCUSSIONS _________________________________________________________________________ 12
A. The Macro Policy Setting in a Post-Sanction Economy with Lower Oil Prices __________________ 12
B. The Policy Framework _________________________________________________________________________ 15
C. Unlocking Balance Sheets: an Immediate Priority to Support Growth _________________________ 17
D. Structural Reforms: A more Efficient and Inclusive Economy __________________________________ 19
OTHER ISSUES _________________________________________________________________________________ 21
STAFF APPRAISAL _____________________________________________________________________________ 21
BOXES
1. The Package of Economic Stimulus _____________________________________________________________ 7
2. The Current State of the Economy and the Growth Outlook ____________________________________ 9
3. Iran’s Employment Challenge and Sectoral Growth Pattern ___________________________________ 20
FIGURES
1. Business Environment Indicators, 2010/11–2014/15 ___________________________________________ 25
2. Macroeconomic Indicators, 2010/11–2014/15 _________________________________________________ 26
3. Macroeconomic and Price Developments, 2010/11–2014/15 __________________________________ 27
4. Fiscal Developments and Outlook, 2013/14–2020/21 _________________________________________ 28
5. Monetary Indicators, 2002/03–2014/15 _______________________________________________________ 29
6. A Broad Look at Liquidity and Indebtedness Across Sectors 2012–15 _________________________ 30
7. Financial Sector Indicators, 2008/09–2014/15 _________________________________________________ 31
8. An Illustrative Model Simulations (G20MOD) __________________________________________________ 32

ISLAMIC REPUBLIC OF IRAN
INTERNATIONAL MONETARY FUND 3
TABLES
1. Selected Macroeconomic Indicators, 2013/14–2020/21 _______________________________________ 33
2. Balance of Payments, 2013/14–2020/21 _______________________________________________________ 34
3. Statement of Government Operations, 2013/14–2020/21 _____________________________________ 35
4. Statement of Government Operations, 2013/14–2020/21 _____________________________________ 36
5. Monetary Survey, 2013/14–2020/21 ___________________________________________________________ 37
6. Medium-Term Scenario, 2013/14–2020/21 ____________________________________________________ 38
7. Vulnerability Indicators, 2010/11–2014/15 ____________________________________________________ 39
APPENDICES
I. Fiscal and External Debt Sustainability _________________________________________________________ 40
II. External Sustainability Assessment for Iran ____________________________________________________ 43
ISLAMIC REPUBLIC OF IRAN
4 INTERNATIONAL MONETARY FUND
CONTEXT
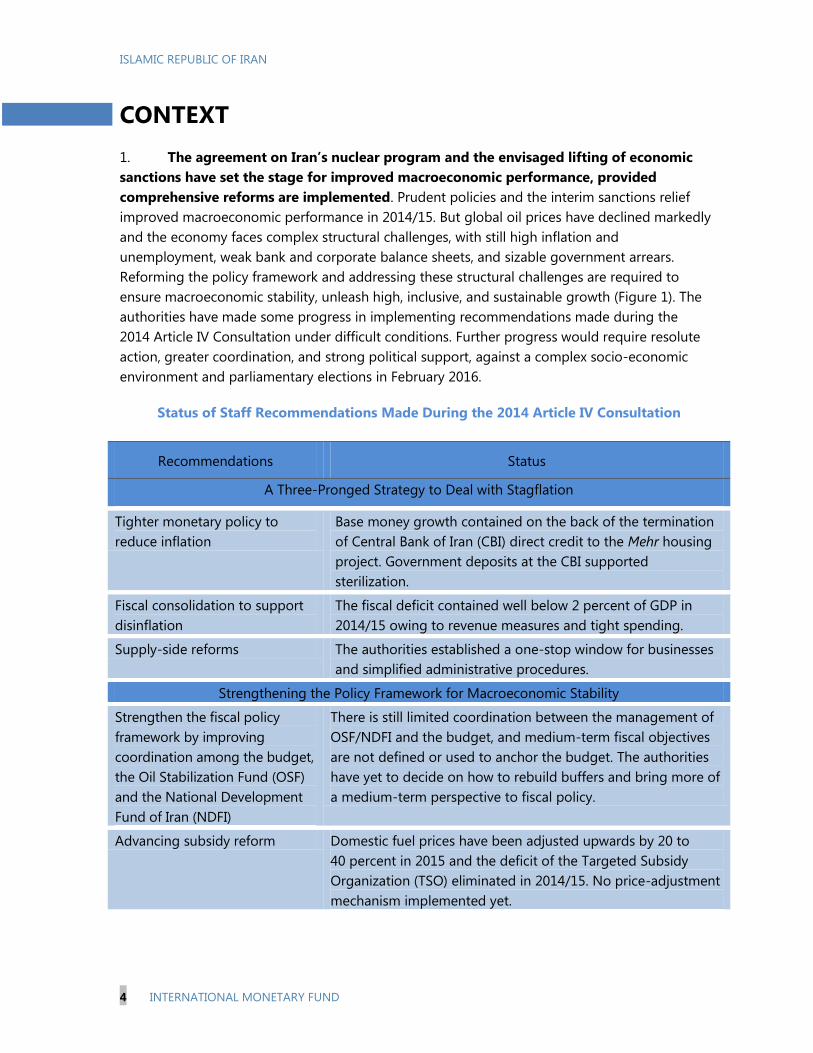
1. The agreement on Iran’s nuclear program and the envisaged lifting of economic
sanctions have set the stage for improved macroeconomic performance, provided
comprehensive reforms are implemented. Prudent policies and the interim sanctions relief
improved macroeconomic performance in 2014/15. But global oil prices have declined markedly
and the economy faces complex structural challenges, with still high inflation and
unemployment, weak bank and corporate balance sheets, and sizable government arrears.
Reforming the policy framework and addressing these structural challenges are required to
ensure macroeconomic stability, unleash high, inclusive, and sustainable growth (Figure 1). The
authorities have made some progress in implementing recommendations made during the
2014 Article IV Consultation under difficult conditions. Further progress would require resolute
action, greater coordination, and strong political support, against a complex socio-economic
environment and parliamentary elections in February 2016.
Status of Staff Recommendations Made During the 2014 Article IV Consultation
Recommendations Status
A Three-Pronged Strategy to Deal with Stagflation
Tighter monetary policy to
reduce inflation
Base money growth contained on the back of the termination
of Central Bank of Iran (CBI) direct credit to the Mehr housing
project. Government deposits at the CBI supported
sterilization.
Fiscal consolidation to support
disinflation
The fiscal deficit contained well below 2 percent of GDP in
2014/15 owing to revenue measures and tight spending.
Supply-side reforms The authorities established a one-stop window for businesses
and simplified administrative procedures.
Strengthening the Policy Framework for Macroeconomic Stability
Strengthen the fiscal policy
framework by improving
coordination among the budget,
the Oil Stabilization Fund (OSF)
and the National Development
Fund of Iran (NDFI)
There is still limited coordination between the management of
OSF/NDFI and the budget, and medium-term fiscal objectives
are not defined or used to anchor the budget. The authorities
have yet to decide on how to rebuild buffers and bring more of
a medium-term perspective to fiscal policy.
Advancing subsidy reform Domestic fuel prices have been adjusted upwards by 20 to
40 percent in 2015 and the deficit of the Targeted Subsidy
Organization (TSO) eliminated in 2014/15. No price-adjustment
mechanism implemented yet.

ISLAMIC REPUBLIC OF IRAN
INTERNATIONAL MONETARY FUND 5
Recommendations Status
Strengthen price stability
through improvements in
monetary policy and the
exchange rate
No change to the legal framework underpinning monetary
policy. Several imports shifted from the official to the bureau
market, and Fund TA has been provided on exchange rate
unification.
Reforms to Promote Jobs and Growth
Improving the business climate
and address high
unemployment
The cost of doing business and unemployment remain high.
Address banking sector
vulnerabilities
Following Fund TA, the authorities have taken steps to
improve banking sector surveillance. They are also preparing a
strategy to deal with nonperforming loans (NPLs) and banking
sector reform.
Strengthening the AML/CFT
framework
CFT draft bill still pending.
Source: IMF staff.
MACRO-FINANCIAL DEVELOPMENTS, OUTLOOK,
RISKS AND SPILLOVERS
A. Recent Macro-Financial Developments and Outlook
2. After growing 3 percent in 2014/15, economic activity is poised for a significant
slowdown in 2015/16.1 The easing of trade and financial sanctions associated with the
November 2013 interim agreement with the P5+1 provided a significant, but short-lived, impulse
to the economy (Tables 1 and 2). The sharp decline in global oil prices, tight balance sheets, and
postponed consumption and investment decisions ahead of the expected lifting of economic
sanctions, have significantly slowed economic activity since the fourth quarter of 2014/15. Key
sectors in the economy, such as manufacturing and construction, have contracted in the first
quarter of 2015/16 (Figure 2). As a result, real GDP growth is projected to be between
0.5 and -0.5 percent in 2015/16, depending on the timing of the expected lifting of economic
sanctions. Twelve-month inflation has declined to around 12 percent in recent months, largely
reflecting lower food and beverage inflation, and is expected to rebound slightly to 14 percent
by year-end, as the temporary effect of lower food prices wanes. (Figure 3).
1 The Iranian calendar and fiscal years end on March 20
th.
ISLAMIC REPUBLIC OF IRAN
6 INTERNATIONAL MONETARY FUND
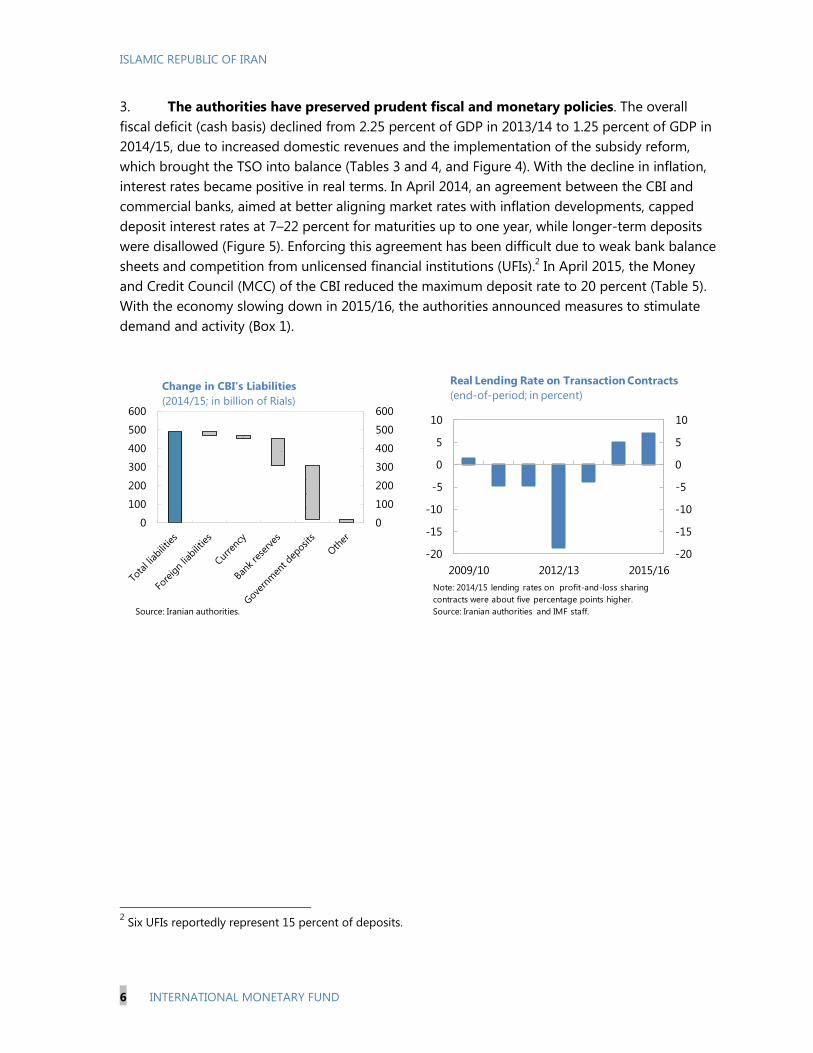
3. The authorities have preserved prudent fiscal and monetary policies. The overall
fiscal deficit (cash basis) declined from 2.25 percent of GDP in 2013/14 to 1.25 percent of GDP in
2014/15, due to increased domestic revenues and the implementation of the subsidy reform,
which brought the TSO into balance (Tables 3 and 4, and Figure 4). With the decline in inflation,
interest rates became positive in real terms. In April 2014, an agreement between the CBI and
commercial banks, aimed at better aligning market rates with inflation developments, capped
deposit interest rates at 7–22 percent for maturities up to one year, while longer-term deposits
were disallowed (Figure 5). Enforcing this agreement has been difficult due to weak bank balance
sheets and competition from unlicensed financial institutions (UFIs).2 In April 2015, the Money
and Credit Council (MCC) of the CBI reduced the maximum deposit rate to 20 percent (Table 5).
With the economy slowing down in 2015/16, the authorities announced measures to stimulate
demand and activity (Box 1).
2 Six UFIs reportedly represent 15 percent of deposits.
0
100
200
300
400
500
600
0
100
200
300
400
500
600
Change in CBI's Liabilities
(2014/15; in billion of Rials)
Source: Iranian authorities.
-20
-15
-10
-5
0
5
10
-20
-15
-10
-5
0
5
10
2009/10 2012/13 2015/16
Note: 2014/15 lending rates on profit-and-loss sharing
contracts were about five percentage points higher.
Source: Iranian authorities and IMF staff.
Real Lending Rate on Transaction Contracts
(end-of-period; in percent)

ISLAMIC REPUBLIC OF IRAN
INTERNATIONAL MONETARY FUND 7
Box 1. Islamic Republic of Iran: The Package of Economic Stimulus
In mid-October, the authorities announced a series of measures that will be implemented to
stimulate demand. Given the tight budget condition and the commitment to sustaining fiscal
consolidation, most of the announced measures relate to monetary policy, to improving access to finance,
and to easing “financial bottlenecks.” Specifically:
Monetary policy. The CBI will supply resources in the interbank market to reduce the interbank rate and
ease the tight liquidity conditions for some banks, and lower the cost of funding. The CBI would also
reduce statutory reserve requirements for commercial banks from 13 percent to 10, differentiated by
banks based on risk management, asset quality, and discipline. The MCC is considering to lower one-year
deposit rates from 20 to 18 percent by late November.
Access to finance. The CBI will instruct and provide sales revenue-backed funding to banks to grant
facilities for the acquisition of durable consumer goods, such as automobiles. It will also provide incentives
to extend the repayment and maturity of new facilities. It would also support some specific non-oil exports
through the provision of $200 million in foreign exchange deposits at the Export Development Bank.
Financial bottlenecks. Continue to improve banks’ balance sheets and capitalization through sales of
assets and shares; advancing with the regulation of unlicensed financial institutions; developing a public
debt market by securitizing government debt through the issuance of Sukuk and other Islamic debt
instruments; and facilitating the use of letters of credit.
Staff estimates that a 1 percentage point reduction in statutory requirements for all banks would increase
M2 by 4–5 percent. The impact of monetary and credit policies on economic activity is constrained by high
inventories, low capacity utilization, and uncertainties ahead of the expected lifting of economic sanctions.
4. The foreign exchange market has remained stable. In the year to mid-October
2015/16, the rial depreciated by about 13 percent against the U.S. dollar in the official market,
while the bureau market rate depreciated by about
7 percent. Given the strength of the U.S. dollar and
high domestic inflation, the rial has appreciated by
about 12 percent on a real effective basis over the
past year. Following the interim sanctions relief in
late 2013, the CBI has reduced import queues,
gradually shifted some import categories to the
bureau market, and took regulatory steps to
strengthen its operational framework (Table 5).3 The
premium between the official and bureau exchange
rates stabilized at 10–15 percent over the past
several months, rising toward 18 percent following
the announcement of package of economic stimulus.
3 Iran was able to drawdown about $700 million per month from its frozen foreign assets from international
current payments.
0
5
10
15
20
25
30
35
40
0
5
10
15
20
25
30
35
40
Jan-2014 Jun-2014 Nov-2014 Apr-2015 Sep-2015
Premium in the Bureau Foreign
Exchange Market
(in percent of official rate)
Source: Iranian authorities.

ISLAMIC REPUBLIC OF IRAN
8 INTERNATIONAL MONETARY FUND
5. Structural weaknesses have become pressing. Many large corporations have
faced tight liquidity, lower equity prices, and pressures to reduce their leverage (Figure 6). Bank
credit growth to the private sector has slowed to 15 percent (year-on-year) in July 2015/16, while
bank credit to the public sector grew by 25 percent. Reported NPLs have remained high (at
12 percent of gross loans). Several weak state-owned banks have increasingly relied on the CBI’s
liquidity assistance, while the share of equity in banks’ funding has dropped (Figure 7). The
government accumulated arrears to suppliers over the past two years, which contributed to the
rise in NPLs and also to higher bank credit to the government, as some contractors discounted
government obligations with banks. As of June 2015, under- and unemployment rates remained
high, at 9.2 percent and 10.8 percent, respectively.
6. In spite of lower global oil prices, near- and medium-term prospects are brighter.
Higher oil production and exports on account of sanctions relief, lower costs for trade and
financial transactions, and restored access to foreign assets, would be expected to lift real GDP
growth to about 4–5.5 percent in 2016/17–
2017/18.4 A significant part of this growth
would be the result of higher oil
production, which could range from at
least 0.6 millions of barrels per day (mbpd)
to an official estimate of 1 mbpd. Lower
trade and financial transaction costs would
account for 0.75–1 percentage point of
growth. Real GDP growth would then
stabilize at around 4 percent annually over
the next several years. Much of the
acceleration in growth would depend on
the spillovers from higher oil production to
the rest of the economy and on addressing
structural weaknesses—on the policy framework, taxation, and bank balance sheets––that should
help productivity growth to gradually return to its long-run average (Box 2). Higher oil revenue
and lower cost of trade and financial transactions, and capital inflows could lead to appreciation
pressures on the real exchange rate. Continued gradual fiscal consolidation and prudent
monetary policy, anchored by the authorities’ goal of achieving single-digit inflation by end-
2016/17, can mitigate these upward pressures and thereby preserve competitiveness (Table 6
and Figure 8).
4 The amount of foreign assets that would become available for payment purposes is uncertain. Some of the
CBI’s foreign exchange assets are encumbered and/or illiquid, as they act as collateral for investments.
0
1
2
3
4
5
6
7
0
1
2
3
4
5
6
7
2016 2017 2018 2019 2020
Catch up to trend TFP
Lower cost of trade
Oil production growth
Total GDP growth
Simulated GDP Growth
(in percent)
Source: IMF staff calculations.

ISLAMIC REPUBLIC OF IRAN
INTERNATIONAL MONETARY FUND 9
Box 2. The Current State of the Economy and the Growth Outlook
The Joint Comprehensive Plan of Action (JCPOA) between
the Islamic Republic of Iran and the P5+1 comes after
several difficult years for the Iranian economy. The
economic sanctions imposed in 2012 led to a sharp
contraction in economic activity, as well as higher inflation and
unemployment. Over the previous decade, Iran had achieved
significant convergence in per-capita income, mostly led by
factor accumulation. TFP had decelerated substantially from
the mid-2000s reflecting structural weaknesses in the
economy (see 2014 Article IV Report).
Much of the contraction in the economy was due to sharp
drops in oil production and non-oil productivity. Oil
production and total factor productivity (TFP) in the non-oil
economy had already been on a stagnant/declining trend
prior to the intensification of sanctions in 2012. The
intensification of sanctions pushed TFP growth into negative
territory and led to sharp contractions in production and
exports in the hydrocarbon sector.
The expected lifting of economic sanctions paves the way
for an improved economic outlook. Higher oil output would bring spillovers to the rest of the economy
and account for the bulk of the projected pick-up in activity
in 2016/17 and 2017/18. In addition, lower trade and financial
transaction costs could add about 0.75–1 percentage points
to growth. With sanctions to be lifted, the non-oil economy
should gradually improve its efficiency. In the near term,
factor accumulation should contribute about half to non-oil
GDP growth in the earlier years, which is projected to pick up
gradually toward its historic average growth of 3 percent by
2020.
The growth outlook is subject to large uncertainties. The
path of oil production and exports in the years ahead depends on Iran’s capacity to re-activate shut oil wells,
regain market share, and mobilize foreign investment and technological expertise. In addition, the expected
recovery in non-oil productivity growth could be impaired if balance sheet vulnerabilities in the corporate
and banking sectors are not addressed.
-2
-1
0
1
2
3
4
5
6
-2
-1
0
1
2
3
4
5
6
1990 1994 1998 2002 2006 2010 2014 2018
TFP Trend Growth in Non-oil, 1990-2020
Historic trend Forecast
Sources: Iranian authorities and Fund staff estimates.
Average
0.0
0.5
1.0
1.5
2.0
2.5
3.0
3.5
4.0
4.5
5.0
0.0
0.5
1.0
1.5
2.0
2.5
3.0
3.5
4.0
4.5
5.0
1990 1993 1996 1999 2002 2005 2008 2011
Exports Production
Crude Oil Production and Exports
(1990-2013; in million barrels per day)
Sources: EIA and OPEC.
-8
-6
-4
-2
0
2
4
6
8
-8
-6
-4
-2
0
2
4
6
8
2009/10 2011/12 2013/14 2015/16 2017/18 2019/20
Contributions to Real GDP Growth
(In percentage points)
Non-oil
Oil
Total
Sources: Iranian authorities and Fund staff estimates.

ISLAMIC REPUBLIC OF IRAN
10 INTERNATIONAL MONETARY FUND
B. Risks and Spillovers
7. Risks are significant and weighted to the downside. On the external side, uncertainties
associated with the post-sanctions regime and with risks of AML/CFT counter-measures could
constrain foreign direct investment and capital inflows. Iran’s full return to the oil market could
bring oil prices down further, and force additional fiscal adjustment, with some negative impact
on growth. Domestically, lack of progress with policy framework and structural reforms, including
on bank and corporate balance sheets, would reduce prospects for safeguarding macroeconomic
stability and fostering inclusive growth (Table 7). A faster recovery in oil production and exports,
along with strong foreign direct investment and broader structural reforms, could result in higher
growth over the medium term.
8. The global and regional implications of sanctions relief will be felt mainly through
oil prices and trade. The expected increase in oil supply from Iran would put downward
pressure on global prices, by an estimated $5–$15 per barrel, boosting global GDP by an
estimated 0.3 percentage point. While part of this impact may be already discounted in futures
markets, a further decline could materialize when Iran’s exports rise, depending on how other
OPEC producers react. The potential for Iran to increase its non-oil trade is also large, with
estimates from a gravity model suggesting that Iran’s exports, at about 20 percent of GDP, are
less than half of their potential.5
5 For more on the regional implications, please refer to Chapter 5 of the Regional Economic Outlook for Middle
East and Asia, October 2015. Available via the Internet:
http://www.imf.org/external/pubs/ft/reo/2015/mcd/eng/mreo1015.htm
Est. Proj. Proj. Proj. Proj. Proj. Proj.
2013/14 2017/18 2018/19 2019/20 2020/21
Real nonoil GDP growth (percent) -1.1 2.8 -0.1 2.8 3.4 4.3 4.6 4.6
CPI inflation (end of period) 19.7 16.2 14.0 9.0 7.5 5.0 5.0 5.0
Non-oil net lending/borrowing (percent of non-oil GDP) -10.6 -8.2 -7.2 -7.1 -6.9 -6.7 -6.5 -6.3
Current account balance (percent of GDP at market prices) 7.8 4.1 1.3 2.1 2.6 2.8 2.4 2.2
WEO Oil Price adjusted for Iranian year (per barrel) 103.7 83.3 50.7 52.9 57.6 61.0 62.6 63.0
Crude oil exports (millions of barrels/day) 1.13 1.16 1.24 1.81 2.13 2.22 2.29 2.38
Crude oil production (millions of barrels/day) 2.85 3.09 3.11 3.7 4.0 4.2 4.3 4.4
Sources: Iranian authorities; and Fund staff estimates and projections.
1/ The Iranian fiscal year ends March 20.
Medium-Term Baseline Scenario, 2013/14–2020/21 1/
2014/15 2015/16 2016/17

ISLAMIC REPUBLIC OF IRAN
INTERNATIONAL MONETARY FUND 11
Risk Assessment Matrix 1/
Source of Risks Relative
Likelihood Potential impact
Spillover Risks
Risk to energy prices: High
A decline of $10 per barrel would put pressure on the fiscal
balance by about 1 percent of GDP, and on the trade balance by
about 1.75 percent of GDP. It could reduce private investment
because of adverse impact on expectations and perceived
increased credit risks. Persistent lower prices would also put
pressure on the exchange rate and warrant further fiscal
adjustment over the medium term.
Increased volatility due to
uncertainty about oil prices. Medium
Persistently low prices. Medium
Heightened risk of fragmentation/state
failure/security dislocation in the Middle
East, leading to a sharp rise in oil prices,
with negative spillovers.
Medium
Medium
Higher oil prices would improve Iran’s external and fiscal
positions with the reverse magnitude mentioned above.
However, an economic slowdown in the world economy and
potential disruptions in the region would imply adverse
spillovers to Iran.
Growth in China
Weak medium-term growth
Sharp slowdown in 2015–16
Medium
Low
Medium
While China accounts for about 40 percent of Iranian oil exports
since mid-2012, the expected lifting of economic should allow
Iran to replace Chinese import demand with exports to other
destinations. Non-oil exports could be more significantly
affected.
Domestic Risks
Intensification of weaknesses in bank
and corporate sector balance sheets High
High
Cash flow problems in the corporate sector would further impair
the financial health of Iranian banks. Pressures for the CBI to
ease monetary policy to avoid bankruptcies may undermine the
CBI’s commitment to price stability.
Uncertainties related to the
implementation of the nuclear-deal and
post-sanctions “snapback provisions.”
Medium
High
Growth would be negatively affected by the re-imposition of
sanctions, and related lower direct investment and capital
inflows.
Delayed structural reforms to buttress
economic growth, improve governance,
and reduce unemployment
Medium
High
A further delay in structural reforms could reduce growth
prospects and limit progress in reducing the high
unemployment rate.
Continued procyclical policies and
limited progress in strengthening the
monetary and policy frameworks
High
Medium
Without fiscal and monetary policy reform there is a risk of
continued procyclical policies, persistent inflation, real exchange
rate appreciation, and eroding competitiveness.
Source: IMF staff.
1 The Risk Assessment Matrix (RAM) shows events that could materially alter the baseline path (the scenario most likely to
materialize in the view of IMF staff). The relative likelihood of risks listed is the staff’s subjective assessment of the risks
surrounding the baseline (“low” is meant to indicate a probability below 10 percent, “medium” a probability between 10 and
30 percent, and “high” a probability between 30 and 50 percent). The RAM reflects staff views on the source of risks and overall
level of concern as of the time of discussions with the authorities. Non-mutually exclusive risks may interact and materialize jointly.
ISLAMIC REPUBLIC OF IRAN
12 INTERNATIONAL MONETARY FUND
POLICY DISCUSSIONS
Discussions focused on policies and reforms needed to sustain progress toward macroeconomic
stability in a lower oil price environment, to strengthen corporate and bank balance sheets, and to
promote high and sustainable growth to reduce unemployment, particularly among youth and
women.
A. The Macro Policy Setting in a Post-Sanction Economy with Lower Oil
Prices
9. The authorities remain committed to pursuing sound macroeconomic policies but
acknowledged rising pressures to ease the policy stance. The slowing of the economy, high
real interest rates, stagnant credit, and the weak state of the corporate and banking sectors,
exacerbated by the sharp decline in global oil prices, have intensified pressures to ease the
stance of policies ahead of the expected lifting of sanctions in late 2015/16 or soon after. The
authorities expect that the lifting of sanctions would provide a better environment to sustain
sound macroeconomic policies and advance needed reforms. In the meantime, they stressed that
fiscal consolidation would remain the backbone of macroeconomic stability and saw a need for
monetary policy to stimulate economic activity.
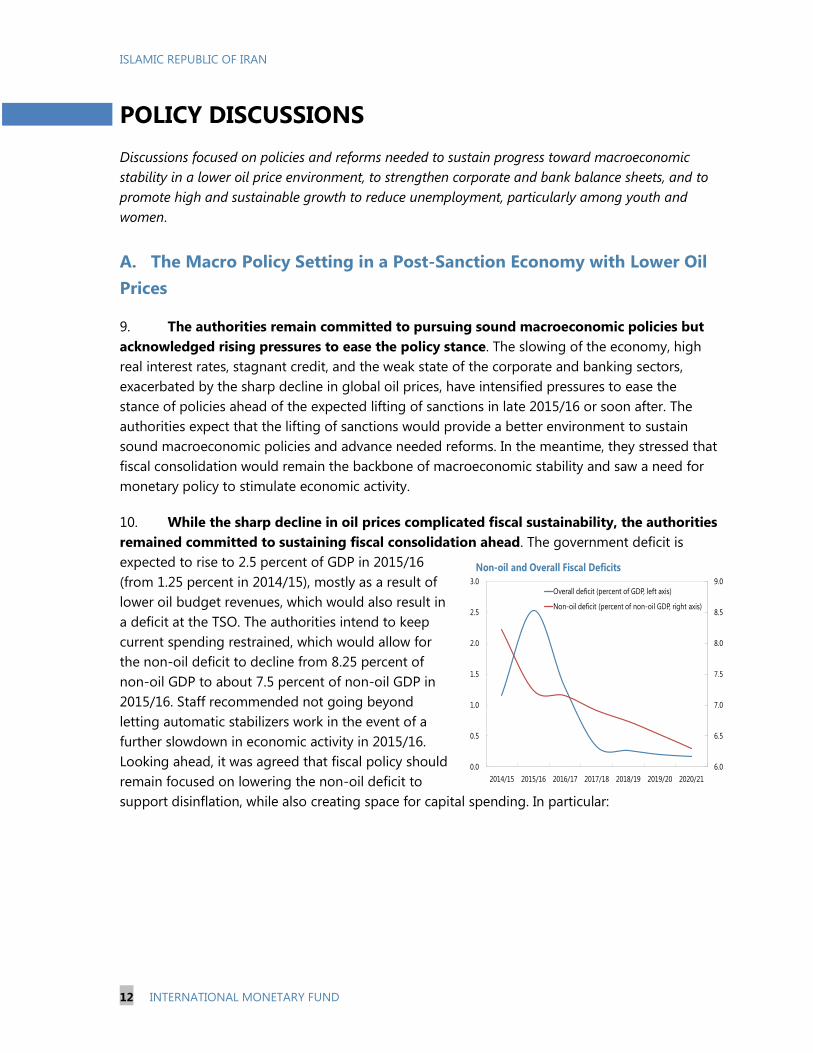
10. While the sharp decline in oil prices complicated fiscal sustainability, the authorities
remained committed to sustaining fiscal consolidation ahead. The government deficit is
expected to rise to 2.5 percent of GDP in 2015/16
(from 1.25 percent in 2014/15), mostly as a result of
lower oil budget revenues, which would also result in
a deficit at the TSO. The authorities intend to keep
current spending restrained, which would allow for
the non-oil deficit to decline from 8.25 percent of
non-oil GDP to about 7.5 percent of non-oil GDP in
2015/16. Staff recommended not going beyond
letting automatic stabilizers work in the event of a
further slowdown in economic activity in 2015/16.
Looking ahead, it was agreed that fiscal policy should
remain focused on lowering the non-oil deficit to
support disinflation, while also creating space for capital spending. In particular:
6.0
6.5
7.0
7.5
8.0
8.5
9.0
0.0
0.5
1.0
1.5
2.0
2.5
3.0
2014/15 2015/16 2016/17 2017/18 2018/19 2019/20 2020/21
Overall deficit (percent of GDP, left axis)
Non-oil deficit (percent of non-oil GDP, right axis)
Non-oil and Overall Fiscal Deficits
ISLAMIC REPUBLIC OF IRAN
INTERNATIONAL MONETARY FUND 13
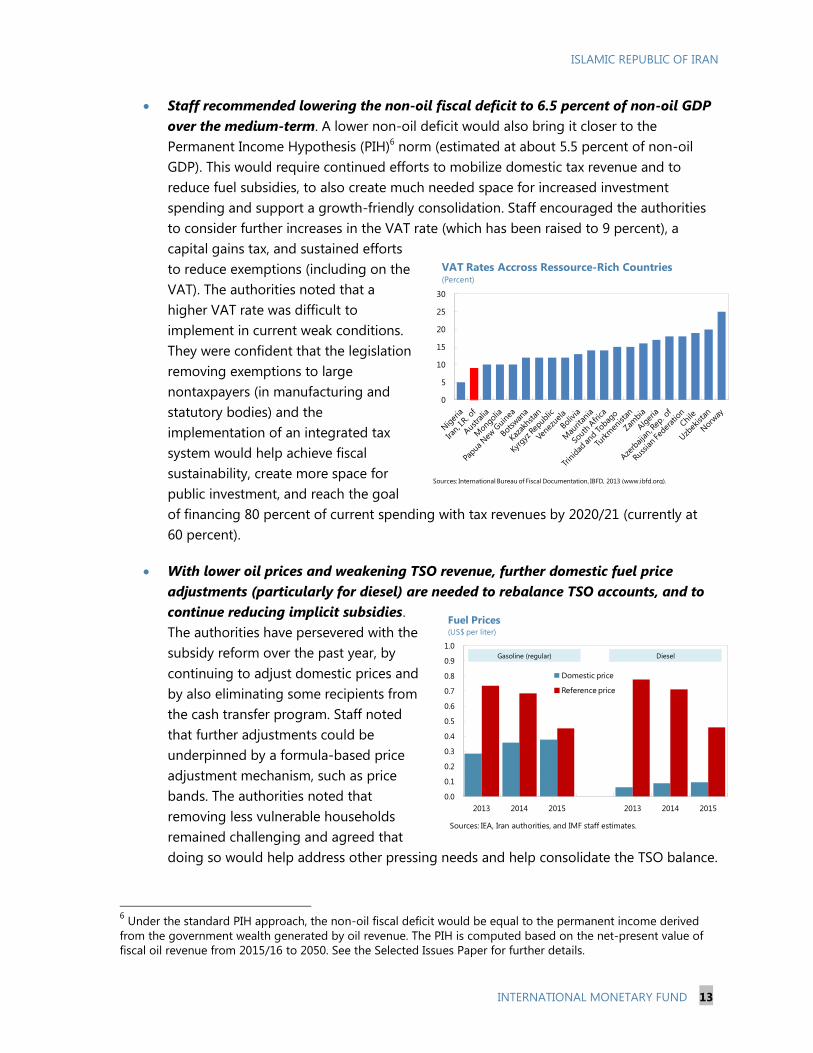
Staff recommended lowering the non-oil fiscal deficit to 6.5 percent of non-oil GDP
over the medium-term. A lower non-oil deficit would also bring it closer to the
Permanent Income Hypothesis (PIH)6 norm (estimated at about 5.5 percent of non-oil
GDP). This would require continued efforts to mobilize domestic tax revenue and to
reduce fuel subsidies, to also create much needed space for increased investment
spending and support a growth-friendly consolidation. Staff encouraged the authorities
to consider further increases in the VAT rate (which has been raised to 9 percent), a
capital gains tax, and sustained efforts
to reduce exemptions (including on the
VAT). The authorities noted that a
higher VAT rate was difficult to
implement in current weak conditions.
They were confident that the legislation
removing exemptions to large
nontaxpayers (in manufacturing and
statutory bodies) and the
implementation of an integrated tax
system would help achieve fiscal
sustainability, create more space for
public investment, and reach the goal
of financing 80 percent of current spending with tax revenues by 2020/21 (currently at
60 percent).
With lower oil prices and weakening TSO revenue, further domestic fuel price
adjustments (particularly for diesel) are needed to rebalance TSO accounts, and to
continue reducing implicit subsidies.
The authorities have persevered with the
subsidy reform over the past year, by
continuing to adjust domestic prices and
by also eliminating some recipients from
the cash transfer program. Staff noted
that further adjustments could be
underpinned by a formula-based price
adjustment mechanism, such as price
bands. The authorities noted that
removing less vulnerable households
remained challenging and agreed that
doing so would help address other pressing needs and help consolidate the TSO balance.
6 Under the standard PIH approach, the non-oil fiscal deficit would be equal to the permanent income derived
from the government wealth generated by oil revenue. The PIH is computed based on the net-present value of
fiscal oil revenue from 2015/16 to 2050. See the Selected Issues Paper for further details.
0.0
0.1
0.2
0.3
0.4
0.5
0.6
0.7
0.8
0.9
1.0
2013 2014 2015 2013 2014 2015
Domestic price
Reference price
Fuel Prices(US$ per liter)
Sources: IEA, Iran authorities, and IMF staff estimates.
Gasoline (regular) Diesel
0
5
10
15
20
25
30
VAT Rates Accross Ressource-Rich Countries(Percent)
Sources: International Bureau of Fiscal Documentation, IBFD, 2013 (www.ibfd.org).

ISLAMIC REPUBLIC OF IRAN
14 INTERNATIONAL MONETARY FUND
11. The authorities underscored the need for monetary policy to provide stimulus to
economic activity in the near term without jeopardizing disinflation. With inflation declining
further this year and a benign outlook, they felt that some temporary relief to the economy was
needed ahead of the expected lifting of economic sanctions. They noted that the complex
difficulties experienced in the financial system, reflected by high nonperforming loans and
competition from unlicensed financial institutions (UFIs), have brought real interest rates to very
high levels that threaten macroeconomic stability. Therefore, they saw a need to continue to
intervene in setting market interest rates and were considering implementing a package of
measures to support demand and economic activity, most notably by lowering reserve
requirements. In particular:
Staff encouraged the CBI to remain focused on lowering inflation. Staff cautioned
that it was too early to assess whether the underlying inflation dynamics and its outlook
had sufficiently changed to warrant an easing of monetary policy. Staff also stressed that
real interest rates needed to remain positive for disinflation and lowering them
sustainably required an urgent and steadfast restructuring of nonperforming loans and
banks more broadly. Staff cautioned that the authorities’ plans to ease monetary
conditions brought risks to the exchange rate and inflation and, if implemented, needed
to be done gradually and contingent on the inflation outlook. The authorities were
confident that their policy package would be implemented prudently and would not
jeopardize their gradual disinflation strategy. Additional steps to anchor inflation
expectations, including by announcing broad money and inflation targets for 2016/17,
would also assist in the disinflation efforts. CBI senior officials saw some merits in
announcing targets in the near future and stressed the need to have better tools to
support them.
0
5
10
15
20
25
0
5
10
15
20
25
Jun-14 Sep-14 Dec-14 Mar-15 Jun-15 Sep-15
Others Housing
Food Headline
Source: Iranian authorities and Fund staff calculations.
CPI Inflation
(3-month moving average; year-on-year; in percent)
0
5
10
15
20
25
0
5
10
15
20
25
Jun-14 Sep-14 Dec-14 Mar-15 Jun-15 Sep-15
Consumer Price Inflation
(year-on-year; in percent)
CPI: Overall CPI: Goods
CPI: Services
Source: Fund staff calculations.

ISLAMIC REPUBLIC OF IRAN
INTERNATIONAL MONETARY FUND 15
Dealing with UFIs was also viewed as essential to lowering real interest rates. Staff
noted that the caps on deposit and lending interest rates were, in some instances,
proving ineffective and, when effective, contributing to disintermediation, given the
active role by UFIs in attracting deposits. The authorities noted that problems in one
large UFI had discouraged disintermediation but noted that, given the long-standing
presence of these institutions and financial stability risks, bringing them into the
prudential supervisory framework was essential but still politically challenging. In
addition, conducting on-site audits of all UFIs and penalizing licensed banks that
provided UFIs operational support are also difficult to implement, but it was agreed that
there was some scope to further encourage depositors to switch to licensed banks,
including by taxing earnings on their deposits at UFIs. Staff emphasized that, with
progress in restructuring nonperforming loans, market-determined interest rates would
better reflect liquidity and risks across banks and thwart competition from UFIs.
12. The authorities reiterated their commitment to unifying the foreign exchange
market and to preserving a competitive real exchange rate. They noted that it would be
easier to proceed with unification and to return to a managed float once sanctions were lifted.
They are committed to implementing these measures by no later than September 2016. They
also stressed the need to preserve flexibility and sound policies, given high inflation differentials
and external risks. While the uncertainties beleaguering Iran’s external environment cloud the
assessment of the exchange rate, the authorities and staff agreed that the official exchange rate
seems overvalued. In staff’s view, the bureau exchange rate, which is about 10–15 percent more
depreciated, appears better aligned with post-sanctions fundamentals (Appendix II).
B. The Policy Framework
13. The authorities recognize the need for the policy framework to be able to respond
to shocks preemptively and counter-cyclically. Iran has saved part of its past oil revenue, but
lacks formal buffers to protect the budget against oil price shocks—the Oil Stabilization Fund
(OSF) has no resources and the National Development Fund of Iran (NDFI) cannot lend to the
government. Fiscal policy lacks a medium-term perspective, with limited quantification of fiscal
objectives and links with inflation and sustainable use of oil resources. Monetary policy had
consistently prioritized output growth over price stability and would also benefit from greater
transparency and communication.
14. The authorities seek to strengthen the CBI’s mandate on price stability. They have
presented to the government a new Money and Banking law that would strengthen the CBI’s
legal mandate on price stability and increase the role of technical experts in the decision-making
process. Staff encouraged the authorities to issue a statement on the longer run goals and
strategy for monetary policy, broadly similar to those of many advanced economy central banks.
Such a statement would also better explain the tradeoffs and limitations inherent in monetary
policy and the CBI’s response to shocks. The authorities could also look for ways to strengthen
communication and transparency, including by publishing a monetary policy report.

ISLAMIC REPUBLIC OF IRAN
16 INTERNATIONAL MONETARY FUND
15. The authorities agreed on the need for fiscal policy to be formulated within a
medium-term framework, with increased buffers and improved transparency. They were
hopeful to develop a medium-term framework by improving the links between annual budgets
and their 5-year development plans. They also saw merits in reinstating buffers, although they
have yet to agree on how best to do it. Staff noted the need for oil revenues to continue
supporting the budget in the coming years and the opportunity to also allocate instead a small
portion of oil revenues to the OSF, subject to clear rules and accountability.7 Discussions with
senior government officials also revealed some consensus on articulating annual budgets around
medium-term goals and having adequate fiscal buffers to smooth expenditure. While work on
strengthening the framework for the NDFI continues, staff encouraged the authorities to clarify
its intergenerational and developmental goals, with clear targets and greater transparency,
including on its domestic lending and foreign investment policy.
7 The general guidelines of the Sixth Five-Year Development plan stipulate the allocation of a third of oil revenues
to the NDFI over the next five years, starting in 2016/17. For 2015/16, the allocation to the NDFI was reduced to
20 percent. No allocation to the OSF is envisaged under the guidelines.
14
15
16
17
18
19
20
21
22
23
24
0
1000
2000
3000
4000
5000
6000
7000
8000
2000 2002 2004 2006 2008 2010
Copper price (in USD)
Source: Fund staff calculations.
Chile: Government Spending and Copper Prices
(three-year moving average)
14
15
16
17
18
19
20
21
22
23
0
10
20
30
40
50
60
70
80
90
2000 2002 2004 2006 2008 2010
Oil price (in USD)
Source: Fund staff calculations.
Iran: Government Spending and Oil Prices
(three-year moving average)

ISLAMIC REPUBLIC OF IRAN
INTERNATIONAL MONETARY FUND 17
C. Unlocking Balance Sheets: an Immediate Priority to Support Growth
16. The complexity and severity of the
challenges facing the banking system require
immediate action. There was agreement that
these challenges were largely a legacy of past
policies and external shocks. Banks are under-
capitalized and asset quality is weak, with high
nonperforming loans and low provisioning, and
wanting risk management systems. Staff also
noted that the financial difficulties among key
shareholders, as private banks tend to be part of
business conglomerates, was an important
challenge for the CBI’s prudential supervisory
duties and for resolving nonperforming loans
and recapitalizing banks.
17. The authorities acknowledged the severity of the challenges and the need for
comprehensive reforms. The authorities emphasized that there is strong political support to
advance reforms and are working on a strategy to reform the financial sector. They explained
that an initial financial health check of banks had been finalized, suggesting substantially higher
levels of NPLs, and they expect to initiate a more detailed assessment of the largest banks soon.
As a condition to approve banks’ full-year financial results, the CBI has mandated higher
provisions and restricted dividend payments to protect bank capital. The authorities intend to
submit soon an amendment to the Money and Banking law for Parliamentary approval that
would strengthen the CBI’s supervisory framework and help in supporting an overhaul of the
financial system.
18. The authorities and staff discussed several critical areas as part of their strategy to
reform the financial system. While the authorities saw a need to prioritize efforts in
strengthening supervision and restructuring banks, they agreed that advancing simultaneously
on all these areas was important to achieve lasting improvements. In particular:
Supervision. It is essential that the new banking law substantially strengthens the CBI’s
enforcement powers for supervision, bank resolution, and for dealing with UFIs. Within
the existing legal mandate, the authorities saw scope to further improve the coordination
between on- and off-site supervision, strengthen follow-up, and scale back noncore
supervisory work. In moving towards risk-based supervision, the authorities aim to
refocus on-site inspections on governance and risk management and address problems
in supervisory data submissions.
Restructuring NPLs. Many successful episodes of bank restructuring in other countries
have involved the establishment of a centralized asset management company (AMC) that
Public
Special-
izedPartly
Private
Private
0
5
10
15
20
25
0 4 8 12 16
No
np
erf
orm
ing
Lo
ans/
Gro
ss L
oans
Capital Adequacy Ratio
Jun-14
Mar-11
Banking Sector: Financial Soundness Indicators
(March 2011 - June 2014; in percent)
Source: Iranian authorities.

ISLAMIC REPUBLIC OF IRAN
18 INTERNATIONAL MONETARY FUND
could better deal with common debtors and avoid asset fire sales. Alternatively, a more
mixed-approach involving private bank-operated AMCs with potential private/foreign
participation could be a promising strategy for some better managed private banks. The
authorities have yet to agree on a strategy and observed that the tight budgetary
situation could constrain the funding of an AMC.
Provisioning and capital. The authorities intend to continue pressing banks to increase
provisioning, based on realistic collateral valuations. Staff underscored the need for
undercapitalized banks to expeditiously present recapitalization plans with clear
timetables and be disallowed from paying dividends. These efforts should be facilitated
by strictly enforcing loan classification standards. Enhancing tax incentives for
provisioning loans of all vintages and imposing time limits to write-off nonperforming
loans can also help accelerate NPL resolution.
Reforming banks. They need to be put on a sound commercial footing, so as for any
recapitalization and resolution of NPLs to yield lasting improvements. The authorities
agreed, noting that addressing shortcomings in risk management and governance was
also critical. They also agreed that the elimination of government-mandated credit
policies would help avoid a repeat of the many vulnerabilities present in the system.
19. The authorities viewed the securitization of government arrears and debt as an
important reform to make banks’ balance sheet more liquid. Government arrears, mostly
linked to suppliers and guarantees on infrastructure projects, were affecting banks’ balance
sheets and crowding out private-sector credit. The authorities were finalizing an inventory of all
government arrears and a strategy to clear them with marketable securities. A pilot in October,
involving the issuance of about 60 billion rials (about 0.5 percent of GDP) of securities to
contractors was successful, with market conditions determining the yield. Staff recommended
continued issuance of government securities at marketable terms, to repay or restructure these
arrears, supported by a public issuance schedule. Staff also noted that the strategy needs to
balance the inflationary implications of clearing arrears with cash with the potential pressure on
market yields that could undermine the existing caps on banks’ interest rates. A market for these
securities would enhance the liquidity management toolkit of banks and the CBI, and help
develop domestic capital markets.
20. Bolstering the AML/CFT framework would facilitate the re-integration of the
domestic financial system into the global economy, lower transaction costs, and reduce the
size of the informal sector. It will also help better detection of illegal proceeds, including those
related to tax evasion and corruption. Staff urged the authorities to adopt a comprehensive
CFT law that properly criminalizes terrorist financing (TF) and contains mechanisms for the
implementation of United Nations Security Council Resolutions related to terrorism and TF. The
authorities expressed commitment to advancing reforms to the AML/CFT framework. They have
requested a Fund assessment of the AML/CFT regime against the FATF standard, which they

ISLAMIC REPUBLIC OF IRAN
INTERNATIONAL MONETARY FUND 19
intend to use for joining the Eurasian AML/CFT group. Staff encouraged the authorities to
conduct a national risk assessment and move towards risk-based AML/CFT supervision.
D. Structural Reforms: A more Efficient and Inclusive Economy
21. The authorities and staff agreed that higher growth
and reforms are critical to lowering unemployment.
Absorbing the large number of currently unemployed and future
entrants to the labor market, notably youth and women, will
require boosting productivity growth and other reforms to
facilitate new jobs (Box 3). Addressing high underemployment
and unemployment requires further development of the private
sector, by bolstering private ownership and control, which in turn
requires investment in human capital and infrastructure. Several
issues were discussed:
Fostering greater youth and female employment.
Some specific measures could be targeted to arrest low
participation and employment. Expanding child care in-
work facilities for women and/or ensuring that adequate
financial incentives are effectively provided in their
absence is important. Reducing payroll taxes for youth
and women would promote employment, which could be
limited in duration or compensated with other
indirect taxes to preserve budget-neutrality.
These measures could be supported by
establishing cost-effective skill-matching and
training programs, for example along the lines
of several programs in Europe and in the region.
Unemployment insurance benefits are large, as
they could exceed four years, and could be
reassessed.
Greater efficiency and innovation to unlock
productivity gains. There was agreement on the
benefits of accelerating privatization and WTO accession. Discussions with private sector
representatives revealed a need to reduce the cost of doing business, by improving
governance, the rule of law, and transparency. Increasing competition and efficiency in
key sectors of the economy, including through subsidy reform and the restructuring of
the energy-intensive corporate sector, would be important steps forward.
Stage I
(Factor Driven)
Transition
Stage II
(Efficiency)
Transition
Stage III
(Innovation)
■ India■Pakistan■Tajikistan■Yemen
■ Iran■Algeria■
Azerbaijan
■ Libya■Saudi Arabia■Venezuela
■Egypt■Georgia■ Jordan■Morocco
■Tunisia
■Bahrain■Chile■ Lebanon■Oman
■Mexico■UAE■Kazakhstan
■Australia■Norway■Qatar
Source: The Global Competitiveness Report, 2014-15
0
10
20
30
40
50
60
70
Total Female Male Total Female Male Total Female Male
Participation rate Unemployment rate Youth unemployment
Sources: Iran authorities.
Employment Survey, June 2015(Percent)

ISLAMIC REPUBLIC OF IRAN
20 INTERNATIONAL MONETARY FUND
Box 3. Iran’s Employment Challenge and Sectoral Growth Pattern
Unemployment is bound to rise unless growth accelerates or the job-intensity of growth improves
significantly. Iran’s labor force comprised 24 million people at end-2014: 21.5 million employed and
2.5 million unemployed, corresponding to an unemployment rate of 9.5 percent. Because of Iran’s large
student population, the labor force will grow by about
2.5 percent per year in the next five years, equivalent to about
3 million job market entrants.
Iran’s economic sectors have, overall, displayed only a
weak tendency to create jobs. The empirical (arch) elasticity
of employment for Iran’s economy from 1990–2011 was
0.3, relatively low compared to other emerging market
economies such as Brazil and Lebanon. Large industry sectors,
such as the oil and mining, are capital-intensive and can only
employ a limited number of workers. The labor-intensive
agricultural sector has underdone structural change, with a shrinking share of employment as workers search
for better careers in other sectors. Other sectors such as construction and transportation have exhibited the
largest employment sensitivity to growth, accounting for more than half of all jobs created. Job creation in
services, the largest sector in the economy, has been weak, with a below-average employment elasticity.
Simulations reinforce the need to boost growth and enhance job creation. In an optimistic scenario, the
combination of high growth rates following sanctions relief and reforms to boost job creation in six job-
generating sectors (manufacturing, transportation,
communications, utilities, construction, and services; oil, mining,
and agriculture would add no additional jobs) would bring
down the unemployment rate to single digits. If, on the other
hand, growth were to disappoint at an average of 2.5 percent
and sectoral employment elasticities in six sectors at their
historical averages, the unemployment rate would rise to
16 percent over the medium term. Finally, the baseline scenario
with high growth following sanctions relief and unchanged
employment elasticities would still see unemployment rising to
14 percent.
The sectoral pattern of growth will also determine the prospects for sufficient job creation. The
construction sector absorbed more than a third of all new labor over the past two decades. Accordingly, the
best-case scenario projects that the construction sector will add another 1 million new jobs by 2020,
accounting for a quarter of the employment increase. However, construction has traditionally not been well
suited for Iran’s skilled and well-educated student population, which will make up the bulk of future labor
market entrants. Employment growth in sectors better suited for high skilled workers—such as professional
services, IT, and communication—is the key to addressing the employment challenge in Iran. Accelerating
employment creation in these sectors will require comprehensive labor, product, and capital market reforms,
which will boost productivity growth and increase the sectoral elasticity of labor demand.
5%
10%
15%
20%
5%
10%
15%
20%
2014 2015 2016 2017 2018 2019 2020
Pessimistic: growth = 2.5% and sectoral
elasticities at historic averageBaseline: growth = 5% and sectoral
elasticities at historic averageOptimistic: growth = 5% and sectoral
elasticities at twice historic average
Unemployment Rate Projections
(In percent of total labor force)
Source: IMF staff calculations.
-0.4
-0.2
0.0
0.2
0.4
0.6
0.8
1.0
1.2
-0.4
-0.2
0.0
0.2
0.4
0.6
0.8
1.0
1.2
To
tal
No
n-o
il
Ag
ric
Oil
Man
uf
Min
ing
Tra
ns
Co
mm
Utl
Co
ns
Serv
Employment Elasticities, 1990–2011
Sources: Iranian authorities and Fund staff calculations.

ISLAMIC REPUBLIC OF IRAN
INTERNATIONAL MONETARY FUND 21
OTHER ISSUES
22. Staff noted that broader data provision and dissemination could strengthen the depth
and quality of surveillance. A broader range of economic indicators and reporting on policy
outcomes at a higher frequency, such as on fiscal-related data, economic activity, and the labor
market would be especially useful. Staff welcomed the authorities’ efforts to strengthen national
accounts statistics, with support from Fund TA. The authorities were still working on the
reconciliation of external (technical) arrears and their repayment modalities.
23. The current exchange rate regime continues to give rise to several multiple currency
practices and an exchange restriction subject to Fund approval under Article VIII, Section 2(a).
The continuing legal existence of both the official and bureau markets with their respective
exchange rates, which differ by more than two percent, gives rise to both a multiple currency
practice and an exchange restriction.8 Two other multiple currency practices are in place, which arise
from the differences of more than two percent between the current official rates and the preferential
rates for certain imports for which foreign exchange payment commitments were made through
letters of credits or bank drafts prior to March 21, 2002 and July 24, 2012.9 The authorities’ recent
clarification of foreign investors’ right under the Foreign Investment Promotion and Protection Act
to obtain foreign exchange for profit transfers and for making other investment-related current
international payments removed the previously identified exchange restriction relating to this act.
STAFF APPRAISAL
24. The agreement on Iran’s nuclear program and the envisaged lifting of economic
sanctions bring a unique opportunity to build on and broaden the achievements of the past
two years. Prudent policies have allowed the economy to return to positive growth last year and to
significantly reduce inflation. The authorities have also regained stability in the foreign exchange
market and advanced with subsidy reform. These are commendable efforts.
25. But the economy faces severe and complex challenges that require resolute policy
action and comprehensive reforms. The sharp decline in global oil prices has cooled off the
momentum in economic activity. The corporate sector confronts weak demand with large
inventories and low capacity utilization. The banking system faces high nonperforming assets that
have resulted in unsustainably high real interest rates, which jeopardize future growth and
8 Based on staff’s recent assessment, the previously identified exchange restriction due to the limitations on the
availability of foreign exchange for travel and studies abroad as well as for the payment for imports based on priority
lists is considered to be subsumed into this multiple currency practice and exchange restriction arising from the more
than two percent deviation between the official and bureau market rates.
9 The former MCP was previously identified and will be phased out once commitments under the pre-March 2002
letters of credit mature. The latter was identified recently and the authorities are committed to eliminate them by
end-September 2016.

ISLAMIC REPUBLIC OF IRAN
22 INTERNATIONAL MONETARY FUND
employment. Arrears accumulated by the public sector over the past two years compound these
problems. As of December 2014, the under- and unemployed represented almost 20 percent of the
labor force. The complexity and extent of the challenges require strong political leadership and
support that translates into decisive and coordinated action ahead of the expected lifting of
economic sanctions.
26. The economy is weak at present but prospects for 2016/17 are brighter. The economy is
expected to stagnate in 2015/16 and twelve-month inflation is expected to remain close to
14 percent by year-end. The envisaged lifting of economic sanctions would lift real GDP growth to
about 4–5½ percent next year. This acceleration will also depend on the spillovers from higher oil
production to the rest of the economy. Continued gradual fiscal consolidation and prudent
monetary policy, anchored by the authorities’ desire to sustain gradual disinflation is needed to
mitigate upward pressures on the real exchange rate.
27. Staff urges the authorities to keep the focus on disinflation by striving to achieve
single digit inflation by end-2016/17. The commitment to and success in lowering inflation has
been beneficial to the economy and has also exposed some structural weaknesses in the banking
sector. The high levels of interest rates in real terms require a steadfast restructuring of
nonperforming loans and banks in general, as well as promptly dealing with unlicensed financial
institutions. The recent package of stimulus measures needs to be implemented cautiously, as it is
still uncertain whether the underlying inflation dynamics and their outlook have sufficiently changed
to warrant a substantial easing of monetary policy. The authorities could take advantage of the
package to announce broad money and inflation objectives for 2016/17, to better anchor
expectations toward achieving single-digit inflation.
28. Staff commends the authorities for their commitment to fiscal consolidation. The
progress in broadening the tax base, increasing the VAT rate, stepping up tax administration efforts,
and enacting tax legislation that simplifies direct taxation and removes exemptions to some large
non-taxpayers is particularly noteworthy. The authorities have also advanced subsidy reform under
difficult conditions. Bringing the non-oil fiscal deficit closer to its long-run sustainable level over the
medium term remains an important goal to support disinflation. To achieve this goal, additional
revenue-enhancing measures are needed. These measures would also allow for increasing
infrastructure spending in support of employment and growth. Further adjustment in domestic fuel
prices is needed, which could be formula-based, such as a price-band mechanism. With prospects
for a deficit in the Targeted Subsidy Organization, continuing to remove less vulnerable households
from the cash transfer program remains a priority.

ISLAMIC REPUBLIC OF IRAN
INTERNATIONAL MONETARY FUND 23
29. The policy framework needs to be able to respond more effectively to shocks. A more
effective policy framework would require bringing more of a medium-term perspective to fiscal
policy formulation, targeting the non-oil balance, and rebuilding buffers and enhancing
transparency. Fiscal buffers are needed, which could be put in place by replenishing the Oil
Stabilization Fund and by temporarily reducing the share of oil revenues allocated to the National
Development Fund of Iran. This latter fund should better define its lending and investment goals,
and achieve the levels of accountability and transparency of international peers. Enhancing the price
stability mandate of the Central Bank of Iran would make it more effective operationally, which
should be supported by greater communication and transparency.
30. Staff welcomes the steps taken by the authorities to address the many challenges in
the financial system but reforms need to proceed faster. The initial financial health check of the
banking system and the draft bills to strengthen the frameworks for prudential supervision and
monetary policy are important steps. The authorities have also started to work on measures to
address the linkages between government arrears to suppliers, nonperforming loans, and public
debt to banks. However, these steps have not helped restore banks’ profitability and asset quality.
A decision needs to be made on how to restructure banks and promote a sustainable
recapitalization. An integral element of the reform will be a strategy for resolving nonperforming
assets, restructuring banks and corporates, and empowering the Central Bank of Iran’s supervisory
framework. Staff acknowledges that these reforms take considerable time to design and implement,
and therefore urges the authorities to begin financial sector reform ahead of the envisaged lifting
of sanctions. There is also a need to bolster the AML/CFT framework to facilitate the re-integration
of the domestic financial system into the global economy.
31. Addressing the challenges in the labor market will require higher growth and reforms.
The authorities could adopt a holistic approach to improving living standards for the population.
Reducing underemployment and unemployment issues requires further development of the private
sector, more efficiency and innovation to unlock productivity gains, and greater transparency and
accountability. There is a need to foster youth and female employment, by expanding childcare in-
work facilities, potentially by reducing payroll taxes in a budget-neutral manner, and by
implementing cost-effective skill-matching and training programs. With comprehensive reforms
implemented, the expected lifting of sanctions should have a significant impact on confidence and
investment and place the economy on a higher growth trajectory.
32. The authorities’ commitment to unify the foreign exchange market by end-September
2016 is welcome. While the external environment clouds the assessment of the exchange rate, staff
considers the bureau exchange rate better aligned with post-sanctions fundamentals than the
official rate. Preserving flexibility and sound policies is essential given high inflation differentials and
other risks to the outlook. Staff recommends Executive Board approval of the retention of the
multiple currency practice and exchange restriction arising from the two percent deviation between
the official and bureau exchange rates, since they are maintained for balance of payments reasons,
are non-discriminatory, and are temporary in light of the authorities’ commitment to unify the
exchange rate regime by end-September 2016. Staff also recommends Executive Board approval

ISLAMIC REPUBLIC OF IRAN
24 INTERNATIONAL MONETARY FUND
of the retention of the two multiple currency practices relating to the use of preferential exchange
rates for certain imports, as referred to in paragraph 23 through end-September 2016. These
measures are not maintained for balance of payments reasons, do not impede balance of payments
adjustment, and do not discriminate among members or harm the interests of other members.
33. The authorities could continue broadening data provision and dissemination. Staff
welcomes the authorities’ efforts to strengthen national accounts statistics, with support from Fund
TA, and encourages the authorities to broaden the reporting and dissemination of official statistics.
34. It is recommended that the next Article IV consultation takes place on the standard 12-
month cycle.

ISLAMIC REPUBLIC OF IRAN
INTERNATIONAL MONETARY FUND 25
Figure 1. Islamic Republic of Iran: Business Environment Indicators, 2010/11–2014/15
40
45
50
55
60
65
70
40
45
50
55
60
65
70
2010-11 2011-12 2012-13 2013-14 2014-15
Evolution of the Business Environment
(Higher = Better)
Global Competitiveness Index
Ease of Doing Business
Iran
MEN
A-O
E (avg
)
EM
-10 (avg
) 1/
Iran
MEN
A-O
E (avg
)
EM
-10 (avg
) 1/
0
10
20
30
40
50
60
70
80
90
0
10
20
30
40
50
60
70
80
90Iran (2013), comparator
changes over 2014, accumulated
Doing Business Global Competitiveness Index
Business Environment in International Perspective
(Higher = better)
0
5
10
15
20
25
30
35
40
0
2
4
6
8
10
12
14
16
Iran MENA-OE (avg) EM-10 (avg) 1/
Unemployment Rate (LHS)
Nominal GDP per capita (RHS)
Unemployment and Nominal GDP per capita, 2014
(LHS: percent; RHS: thousands of U.S. dollars)
0
20
40
60
80
100
0
20
40
60
80
100
Macroeconomic
environment
Goods market
efficiency
Labor market
efficiency
Deterioration in Competitiveness (GCI)
(Index out of 7, rescaled to 100)
2012/13 2013/14 2014/15
0
5
10
15
20
25
30
0
5
10
15
20
25
30
Access to
financing
Policy
instability
Inflation Inefficient
government
bureaucracy
Inadequate
supply of
infrastructure
Main Constraints to Growth 2/
(Lower = better)
2012/13 2013/14 2014/15
0
10
20
30
40
50
60
70
0
10
20
30
40
50
60
70
Burden of
government
regulation
Transparency of
government
policymaking
Strength of
auditing &
reporting
standards
Efficiency of
corporate boards
GCI - First Pillar Basic Requirements
(Ranking, scaled to 100; higher = better)
Iran MENA-OE (avg) EM-10 (avg) 1/
Source: World Bank Doing Business; World Economic Forum Global COmpetitiveness; IMF WEO; IMF REO; and IMF staff
calculations.
1/ Includes Brazil, Chile, China, India, Mexico, Russia, South Africa, South Korea, Thailand, and Turkey..
2/ Each bar shows the percent of survey respondents who feel the particular issue in question is the most problematic for
doing business in Iran.
While there have been some recent improvements, the
business environment remains difficult ....
.... the Iranian economy continues to lag other oil-
exporting countries and emerging markets
The economy faces high unemployment relative to its per
capita income and comparator countries.
Progress with policy stability has been surpassed by other
structural problems ...
... that offers opportunities for significant productivity
gains.
While macroeconomic conditions have improved, the
efficiency of goods and labor markets has been stagnant.

ISLAMIC REPUBLIC OF IRAN
26 INTERNATIONAL MONETARY FUND
Figure 2. Islamic Republic of Iran: Macroeconomic Indicators, 2010/11–2014/15
-20
-15
-10
-5
0
5
10
-20
-15
-10
-5
0
5
10
Mar-12 Sep-12 Mar-13 Sep-13 Mar-14 Sep-14 Mar-15
Real GDP Growth
(Percent)
QoQ
YoY
QoQ, Annualized
-10
-8
-6
-4
-2
0
2
4
6
8
10
-10
-8
-6
-4
-2
0
2
4
6
8
10
2010/11 2011/12 2012/13 2013/14 2014/15
Contribution to GDP grwoth
(Percent)
Others Construction
Agriculture Services
Mfg & Mining Oil
GDP growth
Since mid-2013 investment has picked up along with
private consumption.
The fiscal position has been strengthened.
... and the impact has been particularly pronounced in oil and
manufacturing.
-40
-20
0
20
40
-40
-20
0
20
40
Mar-12 Sep-12 Mar-13 Sep-13 Mar-14 Sep-14 Mar-15
Demand Components Growth
(YoY, percent)
gross fixed capital formation
private consumption
public consumption
-3
-2
-1
0
1
2
3
-30
-20
-10
0
10
20
30
2011/12 2012/13 2013/14 2014/15
Fiscal Balance
(Percent of GDP)
Non-oil Revenue Total Expenditure
Oil Revenue Overall Bal. (RHS)
The recovery in non-oil GDP grwth has helped contain
unemployment.
The current account surplus has stablized and gross foreign
assets continued to grow.
Growth has rebounded following the interim easing of
economic sanctions ...
82
84
86
88
90
92
-6
-4
-2
0
2
4
6
Mar-12 Sep-12 Mar-13 Sep-13 Mar-14 Sep-14 Mar-15
Unemployment and Non-Oil Growth
(Percent)
Nonhydrocarbon GDP Growth (LHS)
Employment Rate (RHS)
0
2
4
6
8
10
12
14
16
80
90
100
110
120
130
140
2011/12 2012/13 2013/14 2014/15
Current Account Balance (RHS)
Gross Official Foreign Assets (LHS)
Current Account Balance and Gross Official Foreign Assets
(Percent of GDP, and Millions of U.S. dollars, respectively)
Source: Iranian authorities; and IMF staff calculations.

ISLAMIC REPUBLIC OF IRAN
INTERNATIONAL MONETARY FUND 27
Figure 3. Islamic Republic of Iran: Macroeconomic and Price Developments, 2010/11–2014/15
... and supporting disinflation broadly ....12-month inflation has stablized at around
15 percent, helped by food disinflation ...
0
10
20
30
40
50
60
70
0
10
20
30
40
50
60
70
Jan
-10
Jul-
10
Jan
-11
Jul-
11
Jan
-12
Jul-
12
Jan
-13
Jul-
13
Jan
-14
Jul-
14
Jan
-15
Jul-
15
Consumer Inflation
(YoY, percent)
CPI: Goods
CPI: Services
0
10
20
30
40
50
60
70
80
90
0
10
20
30
40
50
60
70
80
90
Jan
-10
Jul-
10
Jan
-11
Jul-
11
Jan
-12
Jul-
12
Jan
-13
Jul-
13
Jan
-14
Jul-
14
Jan
-15
Jul-
15
Consumer Inflation
(YoY, percent)
CPI (Overall)
Housing, Water, Electricity, Gas & Fuels
Food and Beverages
The foreign exchange market has remained stable with the
premium narrowing toward 10 percent.
A sharp deceleration in producer prices has also contributed
...
-20
0
20
40
60
80
-20
0
20
40
60
80
Jan
-10
Jul-
10
Jan
-11
Jul-
11
Jan
-12
Jul-
12
Jan
-13
Jul-
13
Jan
-14
Jul-
14
Jan
-15
Jul-
15
Producer Inflation
(YoY, percent)
PPI (Overall) AgricultureManufacturing Services
10000
15000
20000
25000
30000
35000
40000
45000
10000
15000
20000
25000
30000
35000
40000
45000
Jan
-10
Jul-
10
Jan
-11
Jul-
11
Jan
-12
Jul-
12
Jan
-13
Jul-
13
Jan
-14
Jul-
14
Jan
-15
Jul-
15
Exchange Rates
(I.R. rials per U.S. dollars)
Parallel
market rate
CBI Official
rate
... and notwithstanding the significant adjustments in domestic
energy prices since 2014.
Difficult conditions in the housing market has also helped
contain inflation.
-20
-10
0
10
20
30
40
50
-20
-10
0
10
20
30
40
50
Jan
-10
Jul-
10
Jan
-11
Jul-
11
Jan
-12
Jul-
12
Jan
-13
Jul-
13
Jan
-14
Jul-
14
Jan
-15
Jul-
15
Housing sector inflation
(YoY, percent)
Maintenance and Repair
Rentals for Housing, Urban
Rentals for Housing, Capital
Source: IEA, Iranian authorities; and IMF staff calculations.
0.0
0.2
0.4
0.6
0.8
1.0
2013 2014 2015 2013 2014 2015
Domestic price
Reference price
Fuel Prices
(US$ per liter)
Gasoline (regular) Diesel

ISLAMIC REPUBLIC OF IRAN
28 INTERNATIONAL MONETARY FUND
Figure 4. Islamic Republic of Iran: Fiscal Developments and Outlook, 2013/14–2020/21
Sources: Iran authorities, and IMF staff estimates and projections.
30
35
40
45
50
55
60
65
70
30
40
50
60
70
80
90
100
110
2013/14 2015/16 2017/18 2019/20
Oil prices (US$, left axis)
Share of oil revenue allocated to the
budget (percent, right axis)
Parameters Affecting Budget Share in Oil Revenue
30
35
40
45
50
55
60
65
70
75
0
2
4
6
8
10
12
2013/14 2015/16 2017/18 2019/20
Investment (left axis)
Oil revenue (left axis)
Investment to oil revenue ratio (percent,
right axis)
Investment and Oil Revenue
(Percent of GDP unless otherwise indicated)
30
35
40
45
50
55
60
65
70
0
5
10
15
20
25
2013/14 2015/16 2017/18 2019/20
Tax revenue
Expense
Tax revenue to expense
ratio (right axis)
Expenditure and Tax Revenue
(Percent of GDP unless otherwise indicated)
0
5
10
15
20
25
30
35
40
6
7
8
9
10
11
2013/14 2015/16 2017/18 2019/20
Nonoil fiscal deficit (left axis)
Inflation (right axis)
Nonoil Fiscal Deficit and Inflation
(Percent of nonoil GDP, and percent, respectively)
-3.0
-2.0
-1.0
0.0
1.0
10
12
14
16
18
20
22
2014/15 2016/17 2018/19 2020/21
Total revenue (left axis)
Expenditure (left axis)
Overal fiscal balance (right axis)
Overal Budget
(Percent of GDP )
Oil revenue has been negatively affected by lower oil
prices and a declining share allocated to the budget.
The authorities have stepped up efforts to raise
domestic revenue to finance recurrent spending.
higher tax revenue will allow for investment spending
to be largely financed by oil revenue.
Reducing the nonoil fiscal deficit will be essential to
achieve the authorities' single-digit inflation objective...
... with the overal fiscal deficit stabilizing close to 0. Public debt is still low and should decline as arrears
are settled.
0
5
10
15
20
25
2014/15 2016/17 2018/19 2020/21
Public Debt
(Percent of GDP)

ISLAMIC REPUBLIC OF IRAN
INTERNATIONAL MONETARY FUND 29
Figure 5. Islamic Republic of Iran: Monetary Indicators, 2002/03–2014/15
... as banks struggled to find sufficient credit-worthy customers
in times of high inflation.
The economy has deleveraged in recent years ...
40
50
60
70
80
90
100
110
120
40
50
60
70
80
90
100
110
120
2002/03 2006/07 2010/11 2014/15
Private-sector Credit
(Percent of nonoil GDP)
-30
-20
-10
0
10
20
30
40
50
60
-30
-20
-10
0
10
20
30
40
50
60
Jun-2011 Jun-2012 Jun-2013 Jun-2014 Jun-2015
Private-sector Credit Growth
(YoY, percent)
Inflation (end-of-period)
Real growth
0
10
20
30
40
50
60
70
80
0
10
20
30
40
50
60
70
Jun-2011 Jun-2012 Jun-2013 Jun-2014 Jun-2015
Private-sector Credit Growth
(YoY, percent)
Comm. banks
Specialized banks
Private banks
0
10
20
30
40
50
60
0
10
20
30
40
50
60
Jun-2011 Jun-2012 Jun-2013 Jun-2014 Jun-2015
Banks' Credit Growth
(YoY, percent)
Private-sector credit
Public-sector credit
... partly because banks rebalanced their portfolios towards
government credit.
The slowdown in private-sector credit was broad based and
includes the private banks ...
... leading to liquidity pressures of some banks that relied on
sight deposits for funding.
M1 growth has slowed down and money demand is shifting
toward M2 ...
-30
-20
-10
0
10
20
30
40
50
-10
0
10
20
30
40
50
60
Jun-2011 Jun-2012 Jun-2013 Jun-2014 Jun-2015
Money and Credit Growth
(YoY, percent)
Real deposit rate (RHS)
M1
M2
-80
-60
-40
-20
0
20
40
60
80
100
120
-80
-60
-40
-20
0
20
40
60
80
100
120
Jun-2011 Jun-2012 Jun-2013 Jun-2014 Jun-2015
Banks' Credit and Excess Reserve Growth
(YoY, percent)
Excess reserves
Borrowing from CBI
Source: Iranian authorities; and IMF staff calculations.

ISLAMIC REPUBLIC OF IRAN
30 INTERNATIONAL MONETARY FUND
Figure 6. Islamic Republic of Iran: A Broad Look at Liquidity and Indebtedness
Across Sectors, 2012–15
Oil and gas companies have been able to bring their
leverage back to pre-sanction levels ...
... while telecom companies' liquidity remains tight.
The interim agreement in November 2013 brought some relief to several sectors of the economy ...
Automobile and metal companies continue to face relatively high indebtedness, relative to their pre-sanction levels, and tight lquidity
relative to other companies over the past two years...
Source: IMF Staff calculations based on TSE companies' financial statements available in the TSE website. (http://codal.ir/)
1/ the sample includes top 30 companies in Tehran Stock Exchange, according to their market capitalization values.
2/ The three periods, i.e., Sanction, Pre-Sanction, and Post-Sanction, are: Pre-Sanction: fiscal year ending in March-June 2012;
Sanction: fiscal year ending in June–December 2013; Post-Sanction: fiscal year ending in March–June 2015.
3/ Quick Ratio is defined as the ratio of Short-Term Liquid Assets to Current Liabilities.
Pre-S
S
Post-S
0.00
0.07
0.14
0.21
0.00 0.84 1.68 2.52
Qu
ick
Rati
o
Debt-to-Equity Ratio
Oil, Gas, & Petrochemicals
Pre-S
SPost-S
0.00
0.07
0.14
0.00 0.84 1.68 2.52 3.36 4.20 5.04
Qu
ick
Rati
o
Debt-to-Equity Ratio
Auto Industries
While other sectors, such as investment companies and engineering services, have seen their indebtedness and liquidity rise.
Pre-S
S
Post-S
0.00
0.07
0.14
0.21
0.00 0.84 1.68 2.52
Qu
ick
Rati
o
Debt-to-Equity Ratio
Other Industries
Pre-S
S
Post-S
0.00
0.07
0.14
0.00 0.84 1.68 2.52
Qu
ick
rati
o
Debt-to-Equity Ratio
Telecom Industries
Overall Average Quick Ratio
Ove
rall A
vera
ge D
E R
atio
Pre-S
S
Post-S
0.00
0.07
0.14
0.21
0.28
0.35
0.00 0.84 1.68 2.52
Qu
ick
Rati
o
Debt-to-Equity Ratio
Basic Metals

ISLAMIC REPUBLIC OF IRAN
INTERNATIONAL MONETARY FUND 31
Figure 7. Islamic Republic of Iran: Financial Sector Indicators, 2008/09–2014/15
0
5
10
15
20
25
0
5
10
15
20
25
2008/09 2010/11 2012/13 2014-Jun
Capital Adequacy Ratio
(Percent)
State-owned (commercial)
State-owned (specialized)
Partly private
Private
Capitalization levels vary considerably among banks... Non-performing loans are also high, particularly for
private banks
... with overall provisioning low, especially for private
banks.
The stock market has been less buoyant over the past
year.
Source: Tehran Stock Exchange; Central Bank of Iran; and IMF staff calculations.
1/ In counterclockwise order, the four quadrants represent the following scenarios: (i)positive growth for both
periods.; (ii)positive growth for recent period, negative growth for past period.;(iii) negative growth for both
periods.; and (iv) negative growth for recent period, positive growth for past period.
2/ Growth rates are computed using the parallel market exchange rate. We then take the geometric average of the
YoY growth rates for the given period.
0
10
20
30
40
0
10
20
30
40
2008/09 2010/11 2012/13 2014-Jun
Nonperforming Loans/Gross Loans
(Percent)
State-owned (commercial)
State-owned (specialized)Partly private
Private
0
20
40
60
80
100
0
20
40
60
80
100
2008/09 2010/11 2012/13 2014-Jun
Provisions/Nonperforming Loans
(Percent)
State-owned (commercial)
State-owned (specialized)
Partly private
Private
-50
0
50
100
150
200
-50
0
50
100
150
200
Jan-
12
Jul-
12
Jan-
13
Jul-
13
Jan-
14
Jul-
14
Jan-
15
Jul-
15
Tehran Stock Exchange
(YoY, percent)
Industrial Index
Financial Index
TEPIX
1
23
4
567
89
10
11
1213
1415
16
17
1819
20
21
22
2324
25
26
27
2829
30
31
32
333435
-200
-100
0
100
200
300
400
500
600
-100 -50 0 50 100
TSE Sector Indeces 1/ 2/
Avg % growth of sector, Jul'12 - Dec'12
Avg
% g
row
th o
f sec
tor,
Jul'1
3 -
Nov
'13
Most sectors that had been negatively affected by the
intensification of sanctions...
... have been recovering since the interim nuclear
deal.
1
2
3
4
5
6
7
8
9
1011
12
13
14
15
16
17
18
19 20
21
22 23
24
25
26
27
28
29
30
31
32
33
34
35
-40
-20
0
20
40
60
80
100
120
140
160
-200 0 200 400 600
TSE Sector Indeces 1/ 2/
Avg % growth of sector, Jul'13 - Nov'13
Avg
% g
row
th o
f sec
tor,
Dec
'13
-Ju
n'15
1 - Chemicals & By-products (22.9%)
2 - Basic Metals (14.7%)
3 - Monetary Intermediation (11.3%)
4 - Refined Petrol. Products (10.8%)
5 - Metal Ores Mining (9.0%)
6 - Diversified Industrials (7.8%)
7 - Post and Telecomm. (4.2%)
8 - Cement, Lime & Plaster (3.1%)
9 - Investment Companies (2.4%)
10 - Motor Vehicles (2.3%)
11 - Technical & Engineering Services (2.0%)
12 - Pharmaceuticals (1.9%)
25 - Financial Leasing (0.2%)
26 - Ceramic and Tiles (0.2%)
27 - Medical and Precision Instruments (0.1%)
28 - Paper and Byproducts (<0.1%)
29 - Radio, TV and Comm. Equipment (<0.1%)
30 - Tanning and Dressing of Leather (<0.1%)
31 - Agriculture (<0.1%)
32 - Textiles (<0.1%)
33 - Coal and Lignite Mining (<0.1%)
34 - Publishing and Printing of Media (<0.1%)
35 - Wood and Byproducts (<0.1%)
36 - Other Mining (<0.1%)
13 - Food Products (1.6%)
14 - Computer and Related Activities (1.0%)
15 - Real Estate and Construction (0.8%)
16 - Transportation and Storage (0.6%)
17 - Oil and Gas Extraction (0.5%)
18 - Insurance and Pension (0.5%)
19 - Electric Machinery (0.4%)
20 - Rubber and Plastic Products (0.4%)
21 - Sugar and Byproducts (0.4%)
22 - Machinery and Equipment (0.4%)
23 - Other Non-metal Mineral Products (0.3%)
24 - Fabricated Metal Products (0.3%)
The data labels in the bubble charts represent the rank of each sector in terms of market capitalization. Below see the
corresponding sectors and percent market share (July 2013). The dimensions of the bubbles are relative (approximately) to
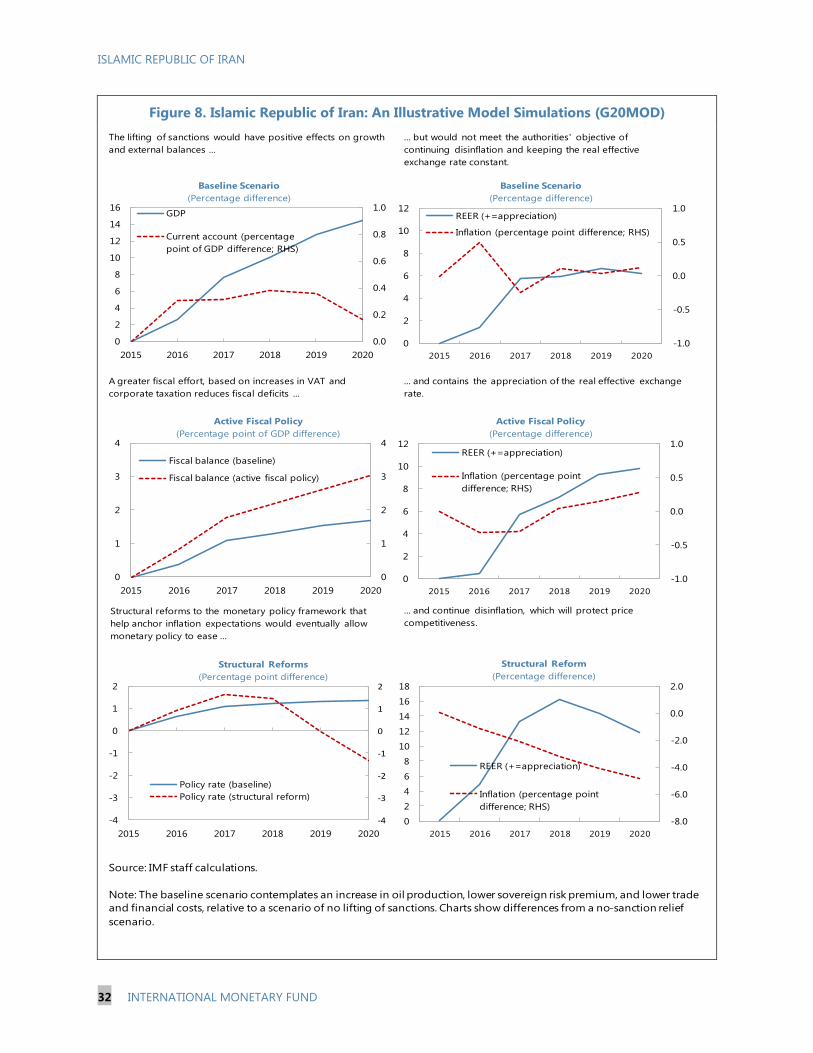
ISLAMIC REPUBLIC OF IRAN
32 INTERNATIONAL MONETARY FUND
Figure 8. Islamic Republic of Iran: An Illustrative Model Simulations (G20MOD)
... but would not meet the authorities' objective of
continuing disinflation and keeping the real effective
exchange rate constant.
The lifting of sanctions would have positive effects on growth
and external balances ...
0.0
0.2
0.4
0.6
0.8
1.0
0
2
4
6
8
10
12
14
16
2015 2016 2017 2018 2019 2020
Baseline Scenario
(Percentage difference)
GDP
Current account (percentage
point of GDP difference; RHS)
-1.0
-0.5
0.0
0.5
1.0
0
2
4
6
8
10
12
2015 2016 2017 2018 2019 2020
Baseline Scenario
(Percentage difference)
REER (+=appreciation)
Inflation (percentage point difference; RHS)
... and contains the appreciation of the real effective exchange
rate.
A greater fiscal effort, based on increases in VAT and
corporate taxation reduces fiscal deficits ...
... and continue disinflation, which will protect price
competitiveness.
Structural reforms to the monetary policy framework that
help anchor inflation expectations would eventually allow
monetary policy to ease ...
Source: IMF staff calculations.
Note: The baseline scenario contemplates an increase in oil production, lower sovereign risk premium, and lower trade
and financial costs, relative to a scenario of no lifting of sanctions. Charts show differences from a no-sanction relief
scenario.
0
1
2
3
4
0
1
2
3
4
2015 2016 2017 2018 2019 2020
Active Fiscal Policy
(Percentage point of GDP difference)
Fiscal balance (baseline)
Fiscal balance (active fiscal policy)
-1.0
-0.5
0.0
0.5
1.0
0
2
4
6
8
10
12
2015 2016 2017 2018 2019 2020
Active Fiscal Policy
(Percentage difference)
REER (+=appreciation)
Inflation (percentage point
difference; RHS)
-4
-3
-2
-1
0
1
2
-4
-3
-2
-1
0
1
2
2015 2016 2017 2018 2019 2020
Structural Reforms
(Percentage point difference)
Policy rate (baseline)
Policy rate (structural reform)
-8.0
-6.0
-4.0
-2.0
0.0
2.0
0
2
4
6
8
10
12
14
16
18
2015 2016 2017 2018 2019 2020
Structural Reform
(Percentage difference)
REER (+=appreciation)
Inflation (percentage point
difference; RHS)

ISLAMIC REPUBLIC OF IRAN
INTERNATIONAL MONETARY FUND 33
Table 1. Islamic Republic of Iran: Selected Macroeconomic Indicators, 2013/14–2020/211/
Est. Proj. Proj. Proj. Proj. Proj. Proj.
2013/14 2017/18 2018/19 2019/20 2020/21
National accounts
Nominal GDP at market prices (in billions of Iranian rials) 9,421,216 11,033,666 11,992,122 14,042,908 15,934,661 17,694,609 19,371,763 21,150,347
Real GDP at factor cost -1.9 3.0 0.0 4.3 4.0 4.1 4.4 4.4
Real oil and gas GDP -8.9 4.8 0.5 16.9 8.8 2.9 2.5 2.5
Real nonoil GDP -1.1 2.8 -0.1 2.8 3.4 4.3 4.6 4.6
CPI inflation (average) 34.7 15.5 15.1 11.5 8.3 6.3 5.0 5.0
CPI inflation (end of period) 19.7 16.2 14.0 9.0 7.5 5.0 5.0 5.0
GDP deflator at factor cost 34.3 12.2 8.7 12.3 9.1 6.6 4.9 4.6
Unemployment rate (in percent of labor force) 10.4 10.6 11.9 12.5 12.6 12.4 12.2 11.9
Budgetary operations
Revenue 14.1 14.6 13.2 14.5 15.5 15.4 15.4 15.4
Taxes 5.2 6.4 6.8 7.2 7.6 7.7 7.9 8.1
Other revenue 8.8 8.1 6.4 7.3 7.9 7.7 7.6 7.3
Of which : oil revenue 6.5 5.7 3.9 4.9 5.6 5.5 5.4 5.2
Expenditure 15.0 15.7 15.4 15.9 15.8 15.7 15.6 15.6
Expense 12.7 13.0 12.8 12.7 12.5 12.3 12.2 11.9
Net acquisition of nonfinancial assets 2.3 2.7 2.7 3.2 3.3 3.4 3.5 3.7
Net lending/borrowing (overall balance) -2.2 -1.2 -2.5 -1.3 -0.3 -0.3 -0.2 -0.2
Net lending/borrowing (budget) -0.9 -1.2 -2.2 -1.3 -0.3 -0.3 -0.2 -0.2
Balance of Targeted Subsidy Organization -1.3 0.0 -0.3 0.0 0.0 0.0 0.0 0.0
Non-oil net lending/borrowing (in percent of non-oil GDP) -10.6 -8.2 -7.2 -7.1 -6.9 -6.7 -6.5 -6.3
Financial assets -0.5 -1.0 -1.1 -0.5 0.4 0.4 -0.1 0.0
Liabilities 1.7 0.2 1.4 0.9 0.7 0.7 0.1 0.1
Monetary sector
Net foreign assets 131.0 1.3 31.2 15.0 14.6 11.8 10.5 9.5
Net domestic assets -5.4 43.4 8.2 18.0 14.7 14.3 14.8 15.3
Credit to the private sector in rials 30.7 16.7 17.3 18.2 17.5 16.0 15.7 14.5
Base money 18.8 14.5 21.0 18.2 15.4 13.7 13.1 12.8
Narrow money (M1) 8.1 1.6 10.5 13.7 14.3 11.7 12.7 12.8
Broad money (M2) 39.5 22.4 20.0 17.1 15.4 13.7 13.1 12.8
External sector
Current account balance 26.5 15.9 4.5 8.5 11.7 13.2 12.5 12.1
In percent of GDP at market prices 7.8 4.1 1.3 2.1 2.6 2.8 2.4 2.2
Exports of goods and services 100.1 93.9 74.3 90.5 104.0 111.9 117.8 124.4
Imports of goods and services -75.2 -80.1 -72.5 -85.9 -97.5 -104.6 -111.1 -118.1
External and publicly guaranteed debt 6.7 5.1 8.9 10.7 13.3 15.9 18.7 21.8
Of which: short-term debt 0.8 0.4 4.6 6.2 7.8 9.3 10.7 12.2
Gross official assets/reserves 117.6 126.2 128.9 142.1 159.9 179.3 198.2 217.2
Oil and gas sector
Total oil and gas exports (billions) 64.9 55.4 35.3 48.6 59.8 65.3 68.6 71.2
WEO Oil Price adjusted for Iranian year (per barrel) 103.7 83.3 50.7 52.9 57.6 61.0 62.6 63.0
Average oil export price (per barrel) 101.1 79.1 49.7 52.9 57.6 61.0 62.6 63.0
Crude oil exports (in millions of barrels/day) 1.13 1.16 1.24 1.81 2.13 2.22 2.29 2.38
Crude oil production (in millions of barrels/day) 2.85 3.09 3.11 3.7 4.0 4.2 4.3 4.4
Memorandum items:
Average exchange rate (Iranian rials per U.S. dollar) 24,770 26,492 … … … … … …
End-of-period exchange rate (Iranian rials per U.S. dollar) 24,770 28,000 … … … … … …
Sources: Iranian authorities; and Fund staff estimates and projections.
1/ The Iranian fiscal year ends March 20.
2014/15 2015/16 2016/17
(Annual change, in percent, unless otherwise indicated)
(In percent of GDP)
(Annual change in percent, unless otherwise indicated)
(In billions of U.S. dollars, unless otherwise indicated)
(In U.S. dollars, unless otherwise indicated)

ISLAMIC REPUBLIC OF IRAN
34 INTERNATIONAL MONETARY FUND
Table 2. Islamic Republic of Iran: Balance of Payments, 2013/14–2020/211/
(Millions of U.S. dollars, unless otherwise indicated)
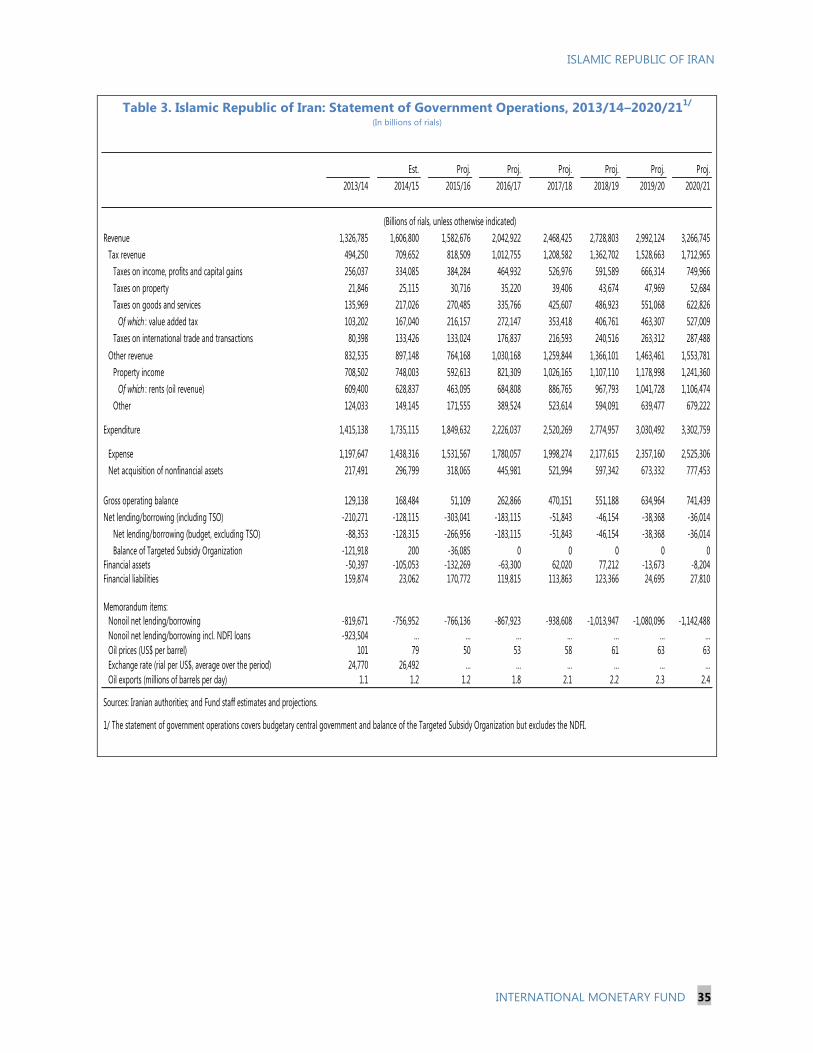
ISLAMIC REPUBLIC OF IRAN
INTERNATIONAL MONETARY FUND 35
Table 3. Islamic Republic of Iran: Statement of Government Operations, 2013/14–2020/211/
(In billions of rials)
Est. Proj. Proj. Proj. Proj. Proj. Proj.
2018/19 2019/20 2020/21
Revenue 1,326,785 1,606,800 1,582,676 2,042,922 2,468,425 2,728,803 2,992,124 3,266,745
Tax revenue 494,250 709,652 818,509 1,012,755 1,208,582 1,362,702 1,528,663 1,712,965
Taxes on income, profits and capital gains 256,037 334,085 384,284 464,932 526,976 591,589 666,314 749,966
Taxes on property 21,846 25,115 30,716 35,220 39,406 43,674 47,969 52,684
Taxes on goods and services 135,969 217,026 270,485 335,766 425,607 486,923 551,068 622,826
Of which : value added tax 103,202 167,040 216,157 272,147 353,418 406,761 463,307 527,009
Taxes on international trade and transactions 80,398 133,426 133,024 176,837 216,593 240,516 263,312 287,488
Other revenue 832,535 897,148 764,168 1,030,168 1,259,844 1,366,101 1,463,461 1,553,781
Property income 708,502 748,003 592,613 821,309 1,026,165 1,107,110 1,178,998 1,241,360
Of which : rents (oil revenue) 609,400 628,837 463,095 684,808 886,765 967,793 1,041,728 1,106,474
Other 124,033 149,145 171,555 389,524 523,614 594,091 639,477 679,222
Expenditure 1,415,138 1,735,115 1,849,632 2,226,037 2,520,269 2,774,957 3,030,492 3,302,759
Expense 1,197,647 1,438,316 1,531,567 1,780,057 1,998,274 2,177,615 2,357,160 2,525,306
Net acquisition of nonfinancial assets 217,491 296,799 318,065 445,981 521,994 597,342 673,332 777,453
Gross operating balance 129,138 168,484 51,109 262,866 470,151 551,188 634,964 741,439
Net lending/borrowing (including TSO) -210,271 -128,115 -303,041 -183,115 -51,843 -46,154 -38,368 -36,014
Net lending/borrowing (budget, excluding TSO) -88,353 -128,315 -266,956 -183,115 -51,843 -46,154 -38,368 -36,014
Balance of Targeted Subsidy Organization -121,918 200 -36,085 0 0 0 0 0
Financial assets -50,397 -105,053 -132,269 -63,300 62,020 77,212 -13,673 -8,204
Financial liabilities 159,874 23,062 170,772 119,815 113,863 123,366 24,695 27,810
Memorandum items:
Nonoil net lending/borrowing -819,671 -756,952 -766,136 -867,923 -938,608 -1,013,947 -1,080,096 -1,142,488
Nonoil net lending/borrowing incl. NDFI loans -923,504 … … … … … … …
Oil prices (US$ per barrel) 101 79 50 53 58 61 63 63
Exchange rate (rial per US$, average over the period) 24,770 26,492 … … … … … …
Oil exports (millions of barrels per day) 1.1 1.2 1.2 1.8 2.1 2.2 2.3 2.4
Sources: Iranian authorities; and Fund staff estimates and projections.
2013/14 2014/15 2015/16 2016/17 2017/18
(Billions of rials, unless otherwise indicated)
1/ The statement of government operations covers budgetary central government and balance of the Targeted Subsidy Organization but excludes the NDFI.

ISLAMIC REPUBLIC OF IRAN
36 INTERNATIONAL MONETARY FUND
Table 4. Islamic Republic of Iran: Statement of Government Operations, 2013/14–2020/21

ISLAMIC REPUBLIC OF IRAN
INTERNATIONAL MONETARY FUND 37
Table 5. Islamic Republic of Iran: Monetary Survey, 2013/14–2020/211/
(Billions of rials, unless otherwise indicated)

ISLAMIC REPUBLIC OF IRAN
38 INTERNATIONAL MONETARY FUND
Table 6. Islamic Republic of Iran: Medium-Term Scenario, 2013/14–2020/211/
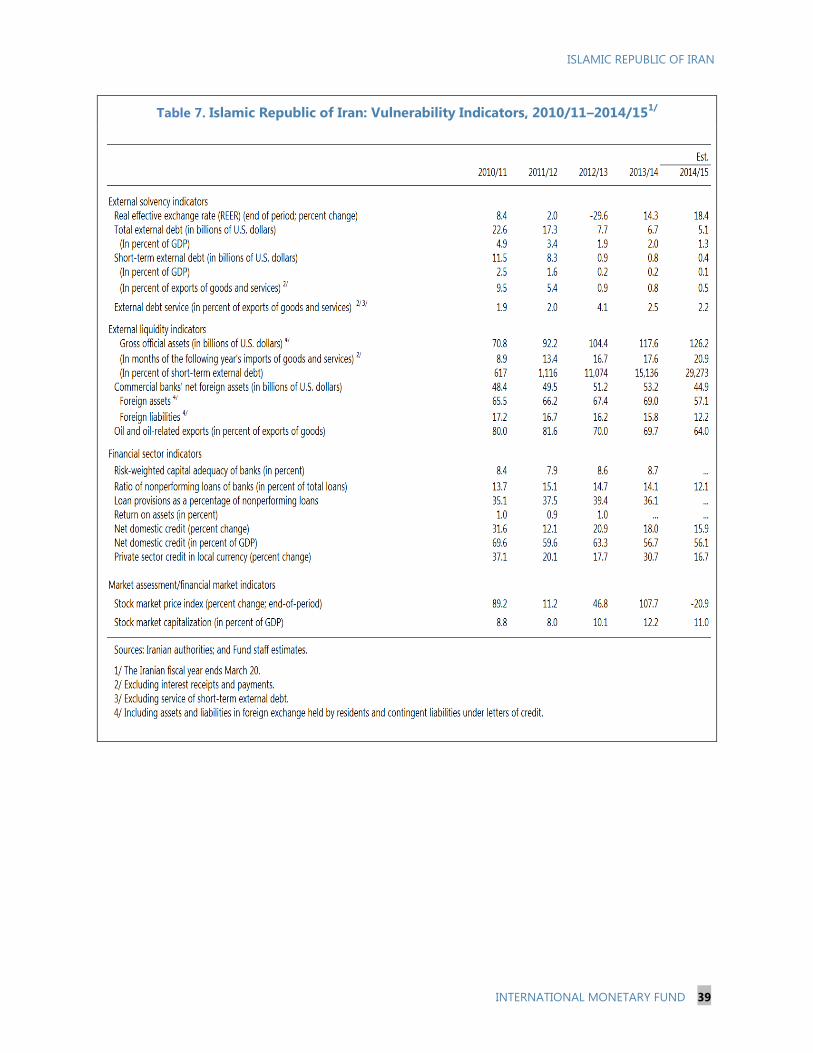
ISLAMIC REPUBLIC OF IRAN
INTERNATIONAL MONETARY FUND 39
Table 7. Islamic Republic of Iran: Vulnerability Indicators, 2010/11–2014/151/

ISLAMIC REPUBLIC OF IRAN
40 INTERNATIONAL MONETARY FUND
Appendix I. Fiscal and External Debt Sustainability
As of August 30, 20132/
2013 2014 2015 2016 2017 2018 2019 2020 Sovereign Spreads
Nominal gross public debt 12.2 15.4 15.9 16.1 14.8 14.1 13.7 12.9 12.3 EMBIG (bp) 3/ n.a.
Public gross financing needs -2.1 0.9 1.2 3.9 2.7 0.6 1.7 1.0 1.2 5Y CDS (bp) n.a.
Real GDP growth (in percent) 3.4 -1.9 4.3 0.0 4.3 4.0 4.2 4.4 4.4 Ratings Foreign Local
Inflation (GDP deflator, in percent) 17.6 34.3 12.2 8.7 12.3 9.1 6.6 4.9 4.6 Moody's n.a. n.a.
Nominal GDP growth (in percent) 21.6 31.8 17.1 8.7 17.1 13.5 11.0 9.5 9.2 S&Ps n.a. n.a.
Effective interest rate (in percent) 4/ 1.6 0.7 0.7 0.8 4.8 7.7 7.8 9.0 9.1 Fitch n.a. n.a.
2013 2014 2015 2016 2017 2018 2019 2020 cumulative
Change in gross public sector debt -0.2 -1.4 0.5 0.1 -1.3 -0.7 -0.4 -0.7 -0.7 -3.7
Identified debt-creating flows -4.9 -3.2 -2.1 -0.1 -1.4 -1.4 -1.0 -0.8 -0.7 -5.3
Primary deficit -2.2 0.9 1.1 1.9 0.8 -0.4 -0.5 -0.6 -0.7 0.6
Primary (noninterest) revenue and grants22.1 14.1 14.6 13.2 14.5 15.5 15.4 15.4 15.4 89.5
Primary (noninterest) expenditure 19.9 14.9 15.6 15.1 15.3 15.1 15.0 14.8 14.8 90.1
Automatic debt dynamics 5/
-1.9 -3.1 -2.0 -1.1 -1.7 -0.8 -0.4 -0.1 0.0 -4.1
Interest rate/growth differential 6/
-2.1 -4.0 -2.2 -1.1 -1.7 -0.8 -0.4 -0.1 0.0 -4.1
Of which: real interest rate -1.7 -4.2 -1.6 -1.1 -1.1 -0.2 0.1 0.5 0.5 -1.4
Of which: real GDP growth -0.4 0.2 -0.6 0.0 -0.6 -0.5 -0.5 -0.5 -0.5 -2.7
Exchange rate depreciation 7/
0.1 0.9 0.2 … … … … … … …
Other identified debt-creating flows -0.8 -1.0 -1.2 -0.9 -0.5 -0.2 -0.1 -0.1 0.0 -1.8
Privatization (negative) -0.8 -1.0 -1.2 -0.9 -0.5 -0.2 -0.1 -0.1 0.0 -1.8
Contingent liabilities 0.0 0.0 0.0 0.0 0.0 0.0 0.0 0.0 0.0 0.0
Please specify (2) (e.g., ESM and Euroarea loans)0.0 0.0 0.0 0.0 0.0 0.0 0.0 0.0 0.0 0.0
Residual, including asset changes 8/
4.7 1.8 2.6 0.2 0.1 0.7 0.6 0.0 0.0 1.6
Source: IMF staff.
1/ Public sector is defined as general government.
2/ Based on available data.
3/ Long-term bond spread over German bonds.
4/ Defined as interest payments divided by debt stock (excluding guarantees) at the end of previous year.
5/ Derived as [(r - π(1+g) - g + ae(1+r)]/(1+g+π+gπ)) times previous period debt ratio, with r = interest rate; π = growth rate of GDP deflator; g = real GDP growth rate;
a = share of foreign-currency denominated debt; and e = nominal exchange rate depreciation (measured by increase in local currency value of U.S. dollar).
6/ The real interest rate contribution is derived from the numerator in footnote 5 as r - π (1+g) and the real growth contribution as -g.
7/ The exchange rate contribution is derived from the numerator in footnote 5 as ae(1+r).
8/ Includes asset changes and interest revenues (if any). For projections, includes exchange rate changes during the projection period.
9/ Assumes that key variables (real GDP growth, real interest rate, and other identified debt-creating flows) remain at the level of the last projection year.
Iran, Islamic Republic of Public Sector Debt Sustainability Analysis (DSA) - Baseline Scenario
-0.1
balance 9/
primary
(In percent of GDP unless otherwise indicated)
Debt, Economic and Market Indicators 1/
2004-2012
Actual
Projections
Contribution to Changes in Public Debt
Projections
2004-2012
Actual
debt-stabilizing
-15
-10
-5
0
5
10
15
2004 2005 2006 2007 2008 2009 2010 2011 2012 2013 2014 2015 2016 2017 2018 2019 2020
Debt-Creating Flows
Primary deficit Real GDP growth Real interest rate
Exchange rate depreciation Other debt-creating flows Residual
Change in gross public sector debt
projection
(in percent of GDP)
-7
-6
-5
-4
-3
-2
-1
0
1
2
3
cumulative

Projections
2010 2011 2012 2013 2014 2015 2016 2017 2018 2019 2020 Debt-stabilizing
non-interest
current account 6/
Baseline: External debt 4.9 3.4 1.9 2.0 1.6 2.7 3.0 3.5 3.8 4.2 4.5 -0.6
Change in external debt -0.5 -1.5 -1.5 0.1 -0.4 1.1 0.4 0.4 0.4 0.3 0.3
Identified external debt-creating flows (4+8+9) -6.7 -11.9 -6.0 -6.8 -4.3 -0.4 -2.1 -3.0 -3.4 -3.8 -4.4
Current account deficit, excluding interest payments -6.2 -11.7 -6.0 -8.1 -4.4 -0.8 -1.9 -2.6 -2.8 -3.3 -3.9
Deficit in balance of goods and services -5.8 -11.3 -5.4 -7.3 -3.7 -0.5 -1.2 -1.6 -1.7 -1.4 -1.3
Exports 26.3 29.9 25.6 29.4 24.6 20.5 23.8 25.5 25.5 25.0 24.6
Imports 20.6 18.5 20.2 22.1 20.9 20.0 22.6 23.9 23.8 23.6 23.3
Net non-debt creating capital inflows (negative) 0.0 0.5 0.0 -0.1 0.0 0.0 -0.5 -0.8 -1.1 -1.1 -1.1
Automatic debt dynamics 1/ -0.5 -0.7 0.1 1.4 0.1 0.4 0.3 0.4 0.5 0.6 0.6
Contribution from nominal interest rate 0.3 0.1 0.2 0.3 0.2 0.4 0.5 0.6 0.7 0.7 0.8
Contribution from real GDP growth -0.3 -0.2 0.2 0.1 -0.1 0.0 -0.1 -0.1 -0.1 -0.2 -0.2
Contribution from price and exchange rate changes 2/ -0.5 -0.7 -0.3 0.9 -0.1 ... ... ... ... ... ...
Residual, incl. change in gross foreign assets (2-3) 3/ 6.2 10.4 4.5 6.8 3.9 1.6 2.5 3.4 3.8 4.1 4.7
External debt-to-exports ratio (in percent) 18.5 11.3 7.4 6.7 6.3 13.1 12.8 13.6 15.0 16.6 18.2
Gross external financing need (in billions of US dollars) 4/ -17.0 -45.4 -11.9 -23.3 -13.4 0.6 0.9 -0.7 0.0 -0.7 -2.6
in percent of GDP -3.7 -8.8 -2.9 -6.8 -3.5 10-Year 10-Year 0.2 0.2 -0.2 0.0 -0.2 -0.5
Scenario with key variables at their historical averages 5/ 2.7 -2.2 -6.0 -9.4 -12.6 -15.2 0.4
Historical Standard
Key Macroeconomic Assumptions Underlying Baseline Average Deviation
Real GDP growth (in percent) 6.6 3.7 -6.6 -1.9 4.3 2.8 4.5 0.0 4.3 4.0 4.2 4.4 4.4
GDP deflator in US dollars (change in percent) 9.7 17.3 10.6 -33.5 4.9 7.0 15.5 -5.5 0.5 3.3 3.2 2.9 2.9
Nominal external interest rate (in percent) 5.8 3.4 6.2 12.1 12.4 7.4 2.8 23.1 17.7 19.6 20.2 20.2 19.5
Growth of exports (US dollar terms, in percent) 26.4 25.9 -32.2 -4.0 -5.9 9.0 22.7 -21.1 21.8 15.0 7.5 5.3 5.7
Growth of imports (US dollar terms, in percent) 9.3 0.0 -13.6 -8.8 6.6 5.6 11.2 -9.5 18.4 13.5 7.3 6.2 6.3
Current account balance, excluding interest payments 6.2 11.7 6.0 8.1 4.4 7.2 2.7 0.8 1.9 2.6 2.8 3.3 3.9
Net non-debt creating capital inflows 0.0 -0.5 0.0 0.1 0.0 0.0 0.3 0.0 0.5 0.8 1.1 1.1 1.1
3/ For projection, line includes the impact of price and exchange rate changes.
4/ Defined as current account deficit, plus amortization on medium- and long-term debt, plus short-term debt at end of previous period.
5/ The key variables include real GDP growth; nominal interest rate; dollar deflator growth; and both non-interest current account and non-debt inflows in percent of GDP.
6/ Long-run, constant balance that stabilizes the debt ratio assuming that key variables (real GDP growth, nominal interest rate, dollar deflator growth, and non-debt inflows in percent of GDP) remain at their levels of the last projection year.
Actual
Islamic Republic of Iran: External Debt Sustainability Framework, 2010–20
(In percent of GDP, unless otherwise indicated)
2/ The contribution from price and exchange rate changes is defined as [-r(1+g) + ea(1+r)]/(1+g+r+gr) times previous period debt stock. r increases with an appreciating domestic currency (e > 0) and rising inflation (based on GDP deflator).
1/ Derived as [r - g - r(1+g) + ea(1+r)]/(1+g+r+gr) times previous period debt stock, with r = nominal effective interest rate on external debt; r = change in domestic GDP deflator in US dollar terms, g = real GDP growth rate, e = nominal appreciation (increase in dollar value of
domestic currency), and a = share of domestic-currency denominated debt in total external debt.
INTER
NA
TIO
NA
L MO
NETA
RY F
UN
D
41
ISLA
MIC
REP
UB
LIC O
F IR
AN

ISLAMIC REPUBLIC OF IRAN
42 INTERNATIONAL MONETARY FUND
i-rate shock 5
Baseline4
0
5
10
15
20
25
30
2010 2012 2014 2016 2018 2020
Interest rate shock (in percent)
Islamic Republic of Iran: External Debt Sustainability: Bound Tests 1/ 2/
(External debt in percent of GDP)
Sources: International Monetary Fund, Country desk data, and staff estimates.
1/ Shaded areas represent actual data. Individual shocks are permanent one-half standard deviation shocks. Figures in the boxes represent average projections for the respective variables in the baseline and scenario being presented. Ten-year historical average for the variable is also shown. 2/ For historical scenarios, the historical averages are calculated over the ten-year period, and the information is used to project debt dynamics five years ahead.3/ Permanent 1/4 standard deviation shocks applied to real interest rate, growth rate, and current account balance.4/ One-time real depreciation of 30 percent occurs in 2010.
Historical -15
Baseline4
-10
-5
0
5
-40
-20
0
20
40
60
80
100
2010 2012 2014 2016 2018 2020
Baseline and historical scenarios
CA shock
13
Baseline4
0
5
10
15
20
25
30
2010 2012 2014 2016 2018 2020
Combined
shock
10
Baseline4
0
5
10
15
20
25
30
2010 2012 2014 2016 2018 2020
Combined shock 3/
30 %
depreciatio
n7
Baseline4
0
5
10
15
20
25
30
2010 2012 2014 2016 2018 2020
Real depreciation shock 4/
Gross financing need under
baseline
(right scale)
Non-interest current account shock
(in percent of GDP)
Growth
shock
6
Baseline
4
0
5
10
15
20
25
30
2010 2012 2014 2016 2018 2020
Baseline:
Scenario:
Historical:
19.4
20.9
7.4
Baseline:
Scenario:
Historical:
4.2
2.0
2.8
Baseline:
Scenario:
Historical:
2.9
1.6
7.2
Growth shock
(in percent per year)

ISLAMIC REPUBLIC OF IRAN
INTERNATIONAL MONETARY FUND 43
Appendix II. External Sustainability Assessment for Iran
External Sector Vulnerabilities
Overall assessment: Iran’s
external position has been
resilient in recent years. If removal
of sanctions proceeds, current
account surpluses and access to
reserves should improve. Lower
oil prices pose risks, including to
exchange rate stability.
Background. Iran’s external surpluses declined due to international
restrictions on oil exports. The ensuing sharp real depreciation led to a
significant compression of imports and a cumulative 9 percent decline in
output.
Potential policy responses. Fiscal consolidation and a tight monetary policy
stance will help to protect macroeconomic stability. The (official) real
exchange rate has climbed back towards pre-crisis levels and appears
overvalued. But uncertainties over Iran’s external environment cloud the
assessment.
Current account: declining
surpluses
Background. Current account surpluses have shrunk from 11 percent in
2011/12 to 4 percent in 2014/15 due to the sanctions-related decline in oil
export volumes. Import compression and rising non-oil exports have
cushioned the decline.
Assessment. The current account remains in surplus. Further increase in
non-oil exports will be crucial to reduce Iran’s dependency on oil revenue
and provide buffers against external shocks.
Real exchange rate:
overvaluation amid large
uncertainties
Background. Iran has a dual exchange rate system: an official appreciated
rate for imports of select priority goods, and a bureau market-determined
rate for all other current account transactions. Uncertainty over Iran’s
external environment has led to bouts of volatility in the parallel rate.
Assessment. Two of the three CGER methods suggest that the official
exchange rate is overvalued. With the expected improvement in Iran’s
external environment, the bureau real exchange rate seems better aligned
with fundamentals.
Capital and financial account:
insignificant
Background. Iran’s economy has been largely cut off from international
financial markets due to international sanctions. External debt is less than 2
percent of GDP. FDI and portfolio inflows are insignificant.
Assessment. The balance of the capital account is small and has only a
marginal impact on Iran’s external assessment.
FX assets/reserves: large but not
fully accessible
Background. Iran’s foreign exchange assets/reserves stood at $127 billion at
end-2014/15, equivalent to 20 months of imports. A significant share of the
stock of reserve remains inaccessible due to sanctions. Technical external
arrears have emerged because of Iran’s difficulty in executing payments.
Assessment. The level of gross foreign exchange assets appears
comfortable.
Foreign assets and liabilities
position: no detailed information
available
Background. Gross external debt is low at below 2 percent of GDP. Foreign
assets of the banking system, including the CBI, are equivalent to about 50
percent of GDP. However, a non-negligible share of foreign assets is
encumbered and therefore not available for payment purposes, even after
the relief of sanctions.
Assessment. Iran appears to have a large positive IIP, but the lack of
information on corporate and households net foreign asset holdings adds
uncertainty to this assessment.
Source: IMF staff.

ISLAMIC REPUBLIC OF IRAN
44 INTERNATIONAL MONETARY FUND
1. Iran’s current account surplus has declined markedly in recent years amid a
deteriorating external environment. Oil export receipts have declined by over 60 percent since
mid-2012, reflecting the large decline in volumes and more recently the sharp drop in oil prices.
Non-oil exports, on the other hand, have risen from 5 percent to 8 percent of GDP, precipitated by
the real depreciation in 2012. Imports have declined by about $12 billion
(3 percent of GDP) as a result of higher costs of conducting international business and the real
depreciation. Overall, the current account surplus declined from 12 percent of GDP in 2011/12 to
just over 4 percent of GDP in 2014/15.
2. External buffers appear comfortable. Gross foreign exchange assets stood at $126 billion,
equivalent to 18 months of imports and 70 percent of broad money, at end-March 2015. However,
difficulties in accessing the international payment system and making payments in convertible
currencies following the intensification of international sanctions in 2012 have affected the liquidity
and currency composition of foreign assets.
3. After a sharp depreciation in 2012, Iran’s
real effective exchange rate has since regained
more than half of the decline. The Iranian
authorities operate a two-tiered exchange rate
system. Imports of a few basic necessities such a
medicine and food staples can be imported at the
official exchange rate, which the CBI determines and
supplies with Iran’s oil exports receipts. Importers of
all other goods buy their foreign exchange in the
bureau market, which is supplied mostly from non-oil
exports. Since March 2014, the official rate has
depreciated 18 percent against the U.S. dollar.
However, because of U.S. dollar strength, the rial
appreciated by 5 percent against the euro, for example, over the same time period. In addition,
inflation differentials between Iran and its trading partners have remained high, although there is
some uncertainty about the exact differential—the measured 12 percentage points are likely to be
an upper bound as Iran’s trade has recently shifted towards countries with slightly higher inflation
rates (China and India). With this caveat in mind, these developments imply that the rial on a real
effective basis has appreciated about 15 percent since March 2014. The appreciation is more
pronounced when examining the bureau rate, as the rial was resilient in that market at a time of
growing optimism about the nuclear negotiations between Iran and the P5+1.
4. Models based on high-frequency data suggest that the official exchange rate remains
stronger than its estimated equilibrium level on a real effective basis. Likewise, the
macroeconomic balance approach for estimating current account norms of oil exporters also
suggest that Iran’s medium-term current account is slightly below its equilibrium level. In contrast,
the external sustainability approach does not indicate a misalignment. However, the result of no
misalignment hinges on the assumption of unified official and bureau market exchange rates. The
40
60
80
100
120
140
40
60
80
100
120
140
Aug-2003 Aug-2007 Aug-2011 Aug-2015
Real Effective Exchange Rates (Index 100=2005)
REER (official)
REER (parallel)
Source: IMF staff calculations.

ISLAMIC REPUBLIC OF IRAN
INTERNATIONAL MONETARY FUND 45
uncertainty about the timing of implementation of the JCPOA between Iran and the P5+1 and its
repercussions on Iran’s external environment complicates estimates of current account norms and
equilibrium exchange rate levels, clouding the assessment of the exchange rate.
5. The equilibrium real effective exchange rate approach analyzes the relationship
between Iran’s official exchange rate and economic fundamentals. Using monthly data, a vector
error-correction model is used to estimate the long-run relationship between Iran’s real effective
exchange rate (REER) and oil prices and oil export volumes. Given observed values of the
fundamentals, the model predicts an equilibrium level of the REER in every period. In addition, the
model can break down movements in the equilibrium into changes in the fundamentals.
6. The equilibrium approach suggests that the overvaluation of the official real effective
exchange rate persisted over the past year. The misalignment, based on high frequency data, has
widened significantly since the devaluation in September 2012, which restored equilibrium at that
time. The rial has continuously appreciated in real terms since the devaluation, mainly driven by high
inflation differentials. The equilibrium rate, in contrast, has eased further due to lower international
oil prices. Oil export volumes, the other determinant of the equilibrium, have stabilized at around
1.3 mbpd amid the interim agreement with the P5+1. These oil export volumes are well below pre-
sanction levels. The model therefore suggests that economic fundamentals would have called for a
depreciation of the real effective exchange rate; instead the rial appreciated on a real effective basis
(see above). However, were oil export levels to return to the pre-crisis average of 2007–10, the gap
between the equilibrium and actual REER would narrow significantly.
7. The external sustainability approach suggests no current account misalignment. In
Bems and de Carvalho Filho’s (2009) methodology, Iran’s current account norms are very close to its
underlying current account in the medium term. Their approach is specifically designed for
estimating external sustainability in resource-intensive countries. Achieving sustainability implies
that import spending is no greater than the income stream derived from resource wealth. Applying
this approach to Iran requires two steps. First, to estimate Iran’s hydrocarbon wealth, staff assumes
-200
-150
-100
-50
0
50
100
150
200
-200
-150
-100
-50
0
50
100
150
200
Aug-05 Feb-08 Aug-10 Feb-13 Aug-15
Oil price Exports
Source: Fund staff calculations.
Contribution to Changes in EREER (official)
(Index numbers; cumulative from 2005)
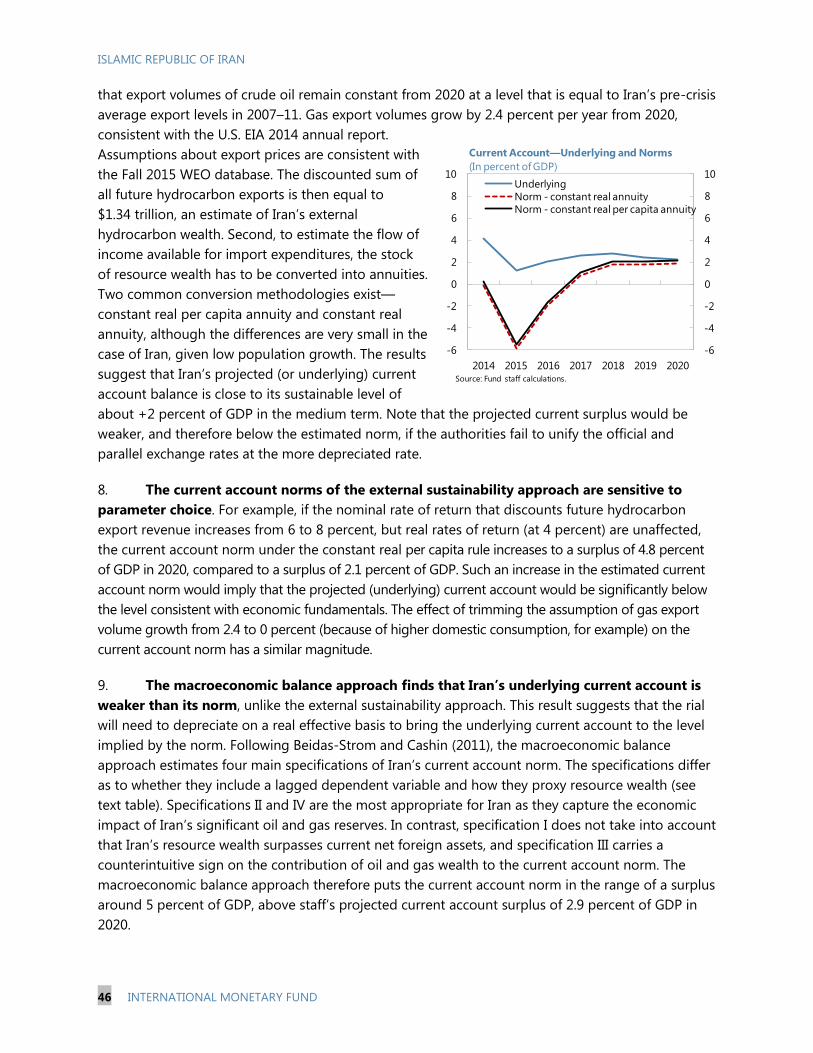
ISLAMIC REPUBLIC OF IRAN
46 INTERNATIONAL MONETARY FUND
that export volumes of crude oil remain constant from 2020 at a level that is equal to Iran’s pre-crisis
average export levels in 2007–11. Gas export volumes grow by 2.4 percent per year from 2020,
consistent with the U.S. EIA 2014 annual report.
Assumptions about export prices are consistent with
the Fall 2015 WEO database. The discounted sum of
all future hydrocarbon exports is then equal to
$1.34 trillion, an estimate of Iran’s external
hydrocarbon wealth. Second, to estimate the flow of
income available for import expenditures, the stock
of resource wealth has to be converted into annuities.
Two common conversion methodologies exist—
constant real per capita annuity and constant real
annuity, although the differences are very small in the
case of Iran, given low population growth. The results
suggest that Iran’s projected (or underlying) current
account balance is close to its sustainable level of
about +2 percent of GDP in the medium term. Note that the projected current surplus would be
weaker, and therefore below the estimated norm, if the authorities fail to unify the official and
parallel exchange rates at the more depreciated rate.
8. The current account norms of the external sustainability approach are sensitive to
parameter choice. For example, if the nominal rate of return that discounts future hydrocarbon
export revenue increases from 6 to 8 percent, but real rates of return (at 4 percent) are unaffected,
the current account norm under the constant real per capita rule increases to a surplus of 4.8 percent
of GDP in 2020, compared to a surplus of 2.1 percent of GDP. Such an increase in the estimated current
account norm would imply that the projected (underlying) current account would be significantly below
the level consistent with economic fundamentals. The effect of trimming the assumption of gas export
volume growth from 2.4 to 0 percent (because of higher domestic consumption, for example) on the
current account norm has a similar magnitude.
9. The macroeconomic balance approach finds that Iran’s underlying current account is
weaker than its norm, unlike the external sustainability approach. This result suggests that the rial
will need to depreciate on a real effective basis to bring the underlying current account to the level
implied by the norm. Following Beidas-Strom and Cashin (2011), the macroeconomic balance
approach estimates four main specifications of Iran’s current account norm. The specifications differ
as to whether they include a lagged dependent variable and how they proxy resource wealth (see
text table). Specifications II and IV are the most appropriate for Iran as they capture the economic
impact of Iran’s significant oil and gas reserves. In contrast, specification I does not take into account
that Iran’s resource wealth surpasses current net foreign assets, and specification III carries a
counterintuitive sign on the contribution of oil and gas wealth to the current account norm. The
macroeconomic balance approach therefore puts the current account norm in the range of a surplus
around 5 percent of GDP, above staff’s projected current account surplus of 2.9 percent of GDP in
2020.
-6
-4
-2
0
2
4
6
8
10
-6
-4
-2
0
2
4
6
8
10
2014 2015 2016 2017 2018 2019 2020
Current Account—Underlying and Norms
(In percent of GDP)
Underlying
Norm - constant real annuity
Norm - constant real per capita annuity
Source: Fund staff calculations.

ISLAMIC REPUBLIC OF IRAN
INTERNATIONAL MONETARY FUND 47
Current Account-GMM Estimation and Norm for Net-Oil Exporters: Iran 1/
(Dependent variable: current account balance, as a share of GDP)
10. The value of the rial in the bureau market provides another means of examining the
degree of exchange rate misalignment. The bureau market exchange rate is 10–15 percent
weaker than the official rate. However, the premium in the bureau market has shrunk significantly
from March last year, when it stood above 20 percent. Greater optimism about Iran’s economic
prospects has reportedly contained capital outflows and supported inflows through the bureau
market. If Iran and the P5+1 successfully implement the JCPOA, the CBI has indicated it will move
towards unifying the official and bureau market exchange. In an improved external environment
without restrictions on oil exports, such a depreciation could significantly narrow the estimated
overvaluation of the rial.
GMM Coefficients
Contribution to CA Norm1
GMM Coefficients
Contribution to CA norm1
GMM Coefficients
Contribution to CA Norm1
GMM Coefficients
Contribution to CA Norm1
Core CGER regressors Constant 0.039 3.9% 0.350 3.5% 0.043 4.3% 0.044 4.4% Lagged dependent 0.330 2.3% 0.383 2.6% Fiscal balance/Non-oil fiscal balance GDP 0.851 -2.6% 0.385 -2.0% 0.363 -1.8% 0.391 -2.0% Oil trade balance/GDP 0.454 3.0% 0.469 3.1% 0.459 3.0% Old age dependency -0.053 -0.4% -0.059 -0.4% -0.034 -0.2% -0.034 -0.2% Population growth -0.693 -0.9% -0.930 -1.2% -0.632 -0.8% -0.589 -0.8% NFA/GDP 0.023 0.9% 0.022 0.8% Relative income -0.017 -0.5% 0.044 1.2% 0.071 2.0% 0.073 2.0% Economic growth -0.053 -0.1% -0.069 -0.1% -0.064 -0.1% -0.056 -0.1%
Net oil-exporter specific regressors Oil wealth 0.000 0.6% 0.001 1.8% 0.000 -1.2% Degree of maturity in oil production 0.160 2.9% 0.170 -3.1%
Additional regressors REER growth 0.073 0.2% Terms of trade growth 4.269 -0.8%
Estimated current account norm (2020) 2.0% 5.4% 11.1% 4.7% Average current account norm
1/ Methodology based on Beidas-Strom and Cashin, 2011, "Are Middle Eastern Current Account Imbalances Excessive?", IMF Working Paper 11/195.
Specification I Specification II Specification III Specification IV
5.1%


ISLAMIC REPUBLIC OF IRAN
STAFF REPORT FOR THE 2015 ARTICLE IV
CONSULTATION—INFORMATIONAL ANNEX
Approved By
Middle East and Central Asia Department
(In Consultation with Other Departments)
FUND RELATIONS ________________________________________________________________________ 2
RELATIONS WITH THE WORLD BANK ___________________________________________________ 5
STATISTICAL ISSUES _____________________________________________________________________ 6
CONTENTS
November 18, 2015

ISLAMIC REPUBLIC OF IRAN
2 INTERNATIONAL MONETARY FUND
FUND RELATIONS
(As of September 30, 2015)
Membership Status:
Date of membership: December 29, 1945
Status: Article VIII
General Resources Account
SDR Million Percent Quota
Quota 1,497.20 100.00
Fund Holdings of Currency 1,497.23 100.00
Reserve Tranche Position 0.01 0.00
SDR Department
SDR Million Percent Allocation
Net cumulative allocation 1,426.06 100.00
Holdings 1,536.62 107.75
Outstanding Purchases and Loans: None
Latest Financial Arrangements
Type
Date of
Arrangement Expiration Date
Amount Approved
(SDR Million)
Amount Drawn
(SDR Million)
Stand-by
Oct 10, 1960
Mar 20, 1962
35.00
22.50
Stand-by May 18, 1956 Nov 17, 1956 17.50 17.50
Projected Payments to the Fund1
(SDR million; based on existing use of resources and present holdings of SDRs)
Forthcoming
2015 2016 2017 2018 2019
Principal
Charges/Interest 0.02 0.02 0.02 0.02
Total 0.02 0.02 0.02 0.02
1 When a member has overdue financial obligations outstanding for more than three months, the amount of
such arrears will be shown in this section.

ISLAMIC REPUBLIC OF IRAN
INTERNATIONAL MONETARY FUND 3
Implementation of HIPC Initiative: Not Applicable
Implementation of Multilateral Debt Relief Initiative (MDRI): Not Applicable
Implementation of Catastrophe Containment and Relief (CCR)
As of February 4, 2015, the Post-Catastrophe Debt Relief Trust has been transformed to the
Catastrophe Containment and Relief (CCR) Trust.
Exchange System
The official exchange rate’s de jure classification is a managed float. De facto, however, it has
followed a crawl-like arrangement since March 2014, depreciating about one percent per month
against the U.S. dollar. The bureau market has displayed greater flexibility as it is largely market-
determined. With effect from September 6, 2004, the Islamic Republic of Iran accepted the
obligations under Article VIII, Sections 2, 3, and 4 of the Fund’s Articles of Agreement. Iran maintains
multiple currency practices and an exchange restriction subject to Fund jurisdiction under Article
VIII, Sections 2(a) and 3:
A Multiple currency practice, which also gives rise to an exchange restriction, arises from the
establishment of an official exchange rate for use in some exchange transactions, which in practice
differs by more than two percent from the rate used by foreign exchange bureaus.
A Multiple currency practice arises from the budget subsidies for foreign exchange purchases in
connection with payments of certain letters of credit opened prior to March 21, 2002 under the
previous multiple exchange rate system.
A Multiple currency practice arises from the differences of more than two percent between the
current official rate and the preferential rates for certain imports for which foreign exchange payment
commitments were made through letters of credits or bank drafts prior to July 24, 2012.
Last Article IV Consultation
The last Article IV consultation was concluded by the Executive Board on March 28, 2014.
Technical Assistance
Since FY 2009, Iran received the following technical assistance:

ISLAMIC REPUBLIC OF IRAN
4 INTERNATIONAL MONETARY FUND
Department Date Purpose
FAD FY 2009 Tax administration and VAT
FY 2010 Tax policy
FY 2010 Tax Administration—Risk Management and Audit
FY 2011 Tax Administration
FY 2013 Tax Administration
FY 2014 Tax Administration
FY 2016 Public Financial Management
LEG FY 2009 Anti-Money Laundering/Combating Financing of Terrorism regulations
FY 2015 Anti-Money Laundering/Combating Financing of Terrorism regulations
MCM FY 2010 Macrofinancial Policies and Financial Stability (with MCD and LEG)
FY 2015 Banking Supervision
FY 2015 Exchange Rate Unification
FY 2016 Monetary Policy Instruments
STA FY 2011 GDDS: Metadata Development
FY 2016 National Accounts

ISLAMIC REPUBLIC OF IRAN
INTERNATIONAL MONETARY FUND 5
RELATIONS WITH THE WORLD BANK GROUP
The World Bank Group has no program in the Islamic Republic of Iran. The last Interim Assistance
Strategy covered FY2002-2005, and the last IBRD project closed in 2012. IFC has no exposure to the
Islamic Republic of Iran. MIGA issued two guarantees in 2005, and no guarantees have been
provided since then. Iran is currently a member of the Bank in good standing and is a donor to
IDA16.
The Bank is in the process of preparing an Economic Monitoring Note that reviews recent economic
developments and assesses the economic outlook with a focus on oil and gas exports and the
financial sector.
ISLAMIC REPUBLIC OF IRAN
6 INTERNATIONAL MONETARY FUND
STATISTICAL ISSUES
Assessment of Data Adequacy for Surveillance
General
Data provision has shortcomings, although it is broadly adequate for surveillance. However, the
data tends to be reported with significant delays, notwithstanding recent improvement in
timeliness.
The Central Bank of Iran (CBI) disseminates key statistical aggregates in its quarterly Economic
Trends, also available at http://www.cbi.ir/default_en.aspx.
National Accounts and Labor Markets
National accounts statistics are broadly sound and released in a timely manner. There is scope
for further progress, especially by extending the use annual surveys to all activities to ease data
compilation. Also, the CBI and the Statistical Center of Iran (SCI) could make further progress to
review and unify their respective GDP estimates. The Fund delivered TA in 2015 to assist the
authorities to improve their national accounts statistics, advising strengthened cooperation
between the CBI and SCI, and making specific recommendations to improve data compilation
quality.
Data on labor force and unemployment are published regularly.
Price Statistics
Price statistics are methodologically sound and released in a timely manner. The official labor
market statistics are released by the SCI, and are based on the definitions by the International
Labor Organization (ILO). The data is based on an urban and rural population sample of about
60,000 households, and the threshold for considering a person employed is to have worked at
least one hour during the reference week. Labor market statistics, however, could benefit from
further improvement, particularly with regard to hours worked and wage data.
Government Finance Statistics
Government finance statistics only cover the central government. They are not released on a
regular basis. Efforts are currently being made to improve the quality of data, by strengthening
Treasury functions. Data are then expected to be updated and released on a regular basis. The
Ministry of Finance has started to collect data on public debt to improve the quality of debt
statistics. Higher frequency data on central government debt is derived from the monetary
survey.
Data are compiled in accordance with the Government Finance Statistics Manual 2001
(GFSM2001) for central government operations. There is scope to improve coverage of fiscal
reporting on general government by including the nonfinancial public corporations sector data,
as well as other public agencies such as the National Development Fund of Iran, the Oil
Stabilization Fund, and the Targeted Subsidy Organization.
The authorities plan to move from cash to accrual accounting in the context of their broad
reform of their public financial management system, for which they have received Fund TA.
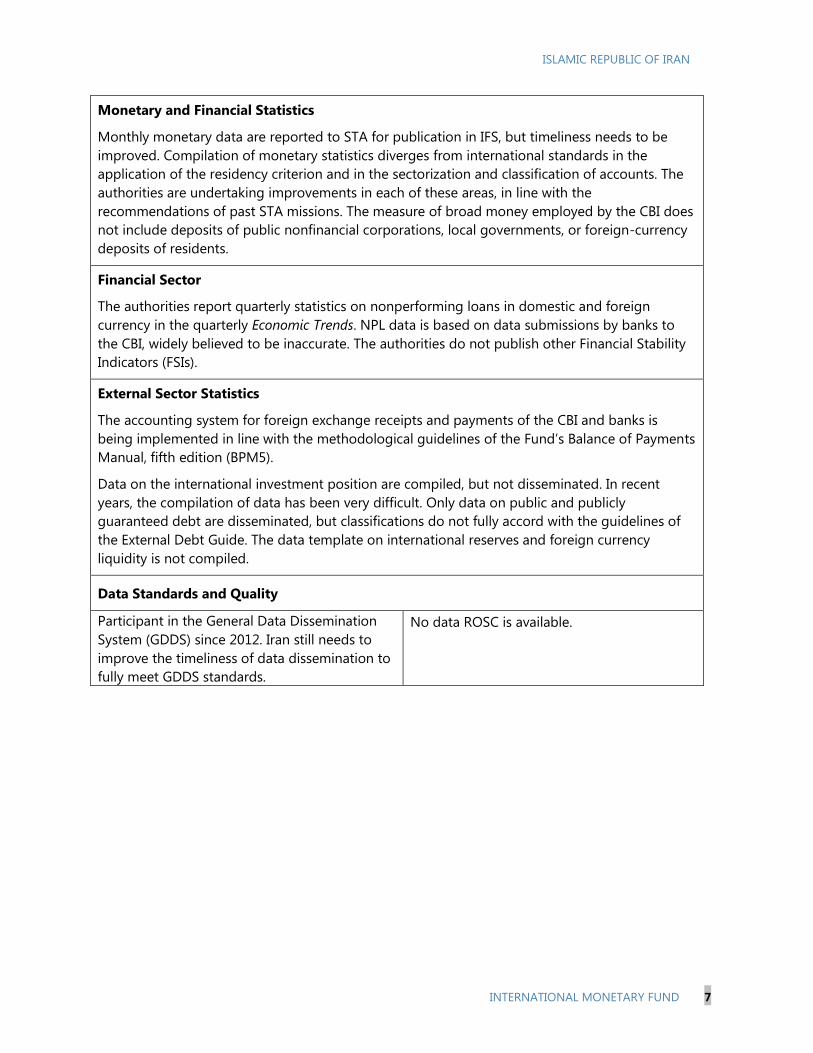
ISLAMIC REPUBLIC OF IRAN
INTERNATIONAL MONETARY FUND 7
Monetary and Financial Statistics
Monthly monetary data are reported to STA for publication in IFS, but timeliness needs to be
improved. Compilation of monetary statistics diverges from international standards in the
application of the residency criterion and in the sectorization and classification of accounts. The
authorities are undertaking improvements in each of these areas, in line with the
recommendations of past STA missions. The measure of broad money employed by the CBI does
not include deposits of public nonfinancial corporations, local governments, or foreign-currency
deposits of residents.
Financial Sector
The authorities report quarterly statistics on nonperforming loans in domestic and foreign
currency in the quarterly Economic Trends. NPL data is based on data submissions by banks to
the CBI, widely believed to be inaccurate. The authorities do not publish other Financial Stability
Indicators (FSIs).
External Sector Statistics
The accounting system for foreign exchange receipts and payments of the CBI and banks is
being implemented in line with the methodological guidelines of the Fund’s Balance of Payments
Manual, fifth edition (BPM5).
Data on the international investment position are compiled, but not disseminated. In recent
years, the compilation of data has been very difficult. Only data on public and publicly
guaranteed debt are disseminated, but classifications do not fully accord with the guidelines of
the External Debt Guide. The data template on international reserves and foreign currency
liquidity is not compiled.
Data Standards and Quality
Participant in the General Data Dissemination
System (GDDS) since 2012. Iran still needs to
improve the timeliness of data dissemination to
fully meet GDDS standards.
No data ROSC is available.
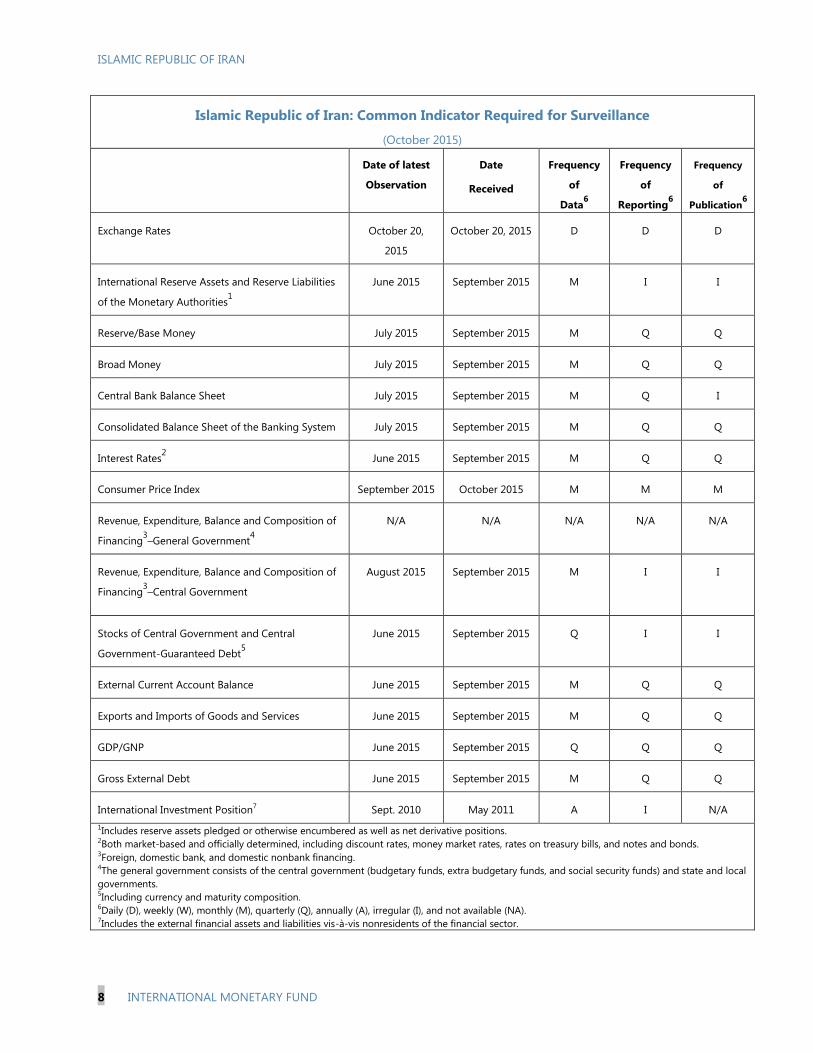
ISLAMIC REPUBLIC OF IRAN
8 INTERNATIONAL MONETARY FUND
Islamic Republic of Iran: Common Indicator Required for Surveillance
(October 2015)
Date of latest
Observation
Date
Received
Frequency
of
Data6
Frequency
of
Reporting6
Frequency
of
Publication6
Exchange Rates October 20,
2015
October 20, 2015 D D D
International Reserve Assets and Reserve Liabilities
of the Monetary Authorities1
June 2015 September 2015 M I I
Reserve/Base Money July 2015 September 2015 M Q Q
Broad Money July 2015 September 2015 M Q Q
Central Bank Balance Sheet July 2015 September 2015 M Q I
Consolidated Balance Sheet of the Banking System July 2015 September 2015 M Q Q
Interest Rates2
June 2015 September 2015 M Q Q
Consumer Price Index September 2015 October 2015 M M M
Revenue, Expenditure, Balance and Composition of
Financing3–General Government
4
N/A N/A N/A N/A N/A
Revenue, Expenditure, Balance and Composition of
Financing3–Central Government
August 2015 September 2015 M I I
Stocks of Central Government and Central
Government-Guaranteed Debt5
June 2015 September 2015 Q I I
External Current Account Balance June 2015 September 2015 M Q Q
Exports and Imports of Goods and Services June 2015 September 2015 M Q Q
GDP/GNP June 2015 September 2015 Q Q Q
Gross External Debt
June 2015 September 2015 M Q Q
International Investment Position7 Sept. 2010 May 2011 A I N/A
1Includes reserve assets pledged or otherwise encumbered as well as net derivative positions. 2Both market-based and officially determined, including discount rates, money market rates, rates on treasury bills, and notes and bonds. 3Foreign, domestic bank, and domestic nonbank financing. 4The general government consists of the central government (budgetary funds, extra budgetary funds, and social security funds) and state and local
governments. 5Including currency and maturity composition. 6Daily (D), weekly (W), monthly (M), quarterly (Q), annually (A), irregular (I), and not available (NA). 7Includes the external financial assets and liabilities vis-à-vis nonresidents of the financial sector.

Statement by Jafar Mojarrad, Executive Director for the Islamic Republic of Iran
December 7, 2015
My authorities thank staff for its candid discussions and hard work in preparing this year’s
Article IV Consultation report and Selected Issues Paper, which provide a thorough
assessment of Islamic Republic of Iran’s recent economic developments and achievements,
as well as policy options available to meet future challenges. They appreciate Fund’s policy
advice and technical assistance to support their efforts in safeguarding macroeconomic
stability, strengthening the financial sector, and advancing structural reforms to enhance
inclusive growth. My authorities are in broad agreement with staff analysis and policy
recommendations, and look forward to continued close dialogue and engagement with the
Fund in the period ahead.
Overview
Since taking office in August 2013, the current administration has firmly moved in the
direction of easing external constraints and addressing the many economic, financial, and
social challenges ahead through sound macroeconomic, financial, and structural policies.
These, together with the signing of the Joint Comprehensive Plan of Action (JCPOA)
between Iran and the P5+1 in July 2015 have helped restore macroeconomic stability, bolster
public confidence, and improve investment and growth prospects. Notwithstanding lower
global oil prices, the prospective lifting of economic sanctions in the coming months has set
the stage for improved macroeconomic performance on account of expected higher oil
production and exports, lower costs for trade and financial transactions, and restored access
to Iran’s frozen foreign assets.
The successful implementation of the JCPOA would also entail positive spillovers to the
region and the rest of the world through increased global oil supply and new trade and
investment opportunities. The October 2015 Regional Economic Outlook for the Middle East
and Central Asia estimates a cumulative 15 percent increase in Iran’s real GDP during the
next 5 years relative to a baseline scenario of sustained sanctions, and substantial gains for
Iran’s regional trading partners. Iran’s full return to the global oil market, and its further
integration into the global economy, are estimated to lift global GDP growth by about
0.25 percent over the medium term, given the size of its economy (1.5 percent of global
GDP), and its large oil and gas reserves (4th
and 2nd
largest in the world, respectively).

2
Recent Economic Developments and Outlook
After a cumulative contraction of around 9 percent over 2012/13–2013/14, growth rebounded
to 3 percent in 2014/15. Average CPI inflation declined sharply from 35 to 15 percent,
making interest rates positive in real terms, while unemployment remained below 11 percent.
The overall fiscal deficit narrowed, reflecting increased domestic revenue and the
implementation of the subsidy reform, and public debt remained low at around 15 percent of
GDP. The external current account remained in surplus, albeit lower than in the previous
year, and the exchange rate was relatively stable.
Notwithstanding continued prudent policies, the sharp decline in global oil prices and a wait-
and-see attitude on the part of consumers and investors have weakened the growth
momentum in 2015/16. Real GDP is projected to stagnate, with contraction in manufacturing
and construction weighing down on overall economic activity. Consistent with the Central
Bank of Iran (CBI)’s effort to contain the growth of base money, year-on-year inflation has
lately declined to 10 percent, raising expectations for an average CPI inflation of 13 percent
in 2015/16.
My authoritries are aware of the downside risks to the near- and medium-term outlook and
are determined to continue their efforts to preserve macroeconomic stability and address
structural issues. They recognize the need to strengthen the policy framework and garner
public and political support for their reform agenda. They attach high priority to supporting
growth and job creation, containing inflation, unifying the exchange rate, rebuilding fiscal
buffers and improving fiscal management, repairing corporate and bank balance sheets, and
advancing structural reforms to bolster productivity and resilience to external shocks,
including by reducing the economy’s dependence on hydrocarbons. Barring materialization
of some of the downside risks highlighted in the report, the authorities believe that the
sustained implementation of reforms could raise growth over the medium-term significantly
beyond staff projections, including from higher oil output, lower cost of trade and financial
transactions, and increased capital inflows and FDI.
The Economic Stimulus Package
To stimulate demand and activity, the authorities have recently announced a series of
measures within the interim package of economic stimulus for the next six months. As
documented in Box 1 of the staff report, reflecting the authorities’ commitment to fiscal
consolidation, most of the announced measures relate to monetary policy, to improving
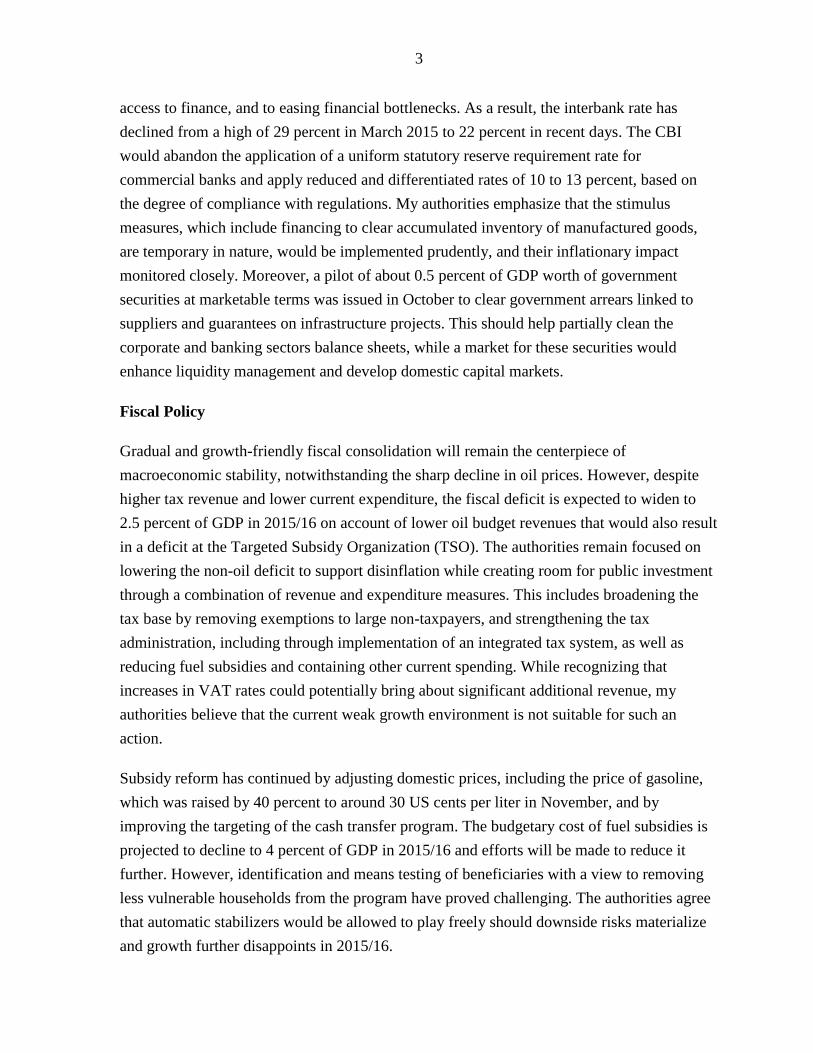
3
access to finance, and to easing financial bottlenecks. As a result, the interbank rate has
declined from a high of 29 percent in March 2015 to 22 percent in recent days. The CBI
would abandon the application of a uniform statutory reserve requirement rate for
commercial banks and apply reduced and differentiated rates of 10 to 13 percent, based on
the degree of compliance with regulations. My authorities emphasize that the stimulus
measures, which include financing to clear accumulated inventory of manufactured goods,
are temporary in nature, would be implemented prudently, and their inflationary impact
monitored closely. Moreover, a pilot of about 0.5 percent of GDP worth of government
securities at marketable terms was issued in October to clear government arrears linked to
suppliers and guarantees on infrastructure projects. This should help partially clean the
corporate and banking sectors balance sheets, while a market for these securities would
enhance liquidity management and develop domestic capital markets.
Fiscal Policy
Gradual and growth-friendly fiscal consolidation will remain the centerpiece of
macroeconomic stability, notwithstanding the sharp decline in oil prices. However, despite
higher tax revenue and lower current expenditure, the fiscal deficit is expected to widen to
2.5 percent of GDP in 2015/16 on account of lower oil budget revenues that would also result
in a deficit at the Targeted Subsidy Organization (TSO). The authorities remain focused on
lowering the non-oil deficit to support disinflation while creating room for public investment
through a combination of revenue and expenditure measures. This includes broadening the
tax base by removing exemptions to large non-taxpayers, and strengthening the tax
administration, including through implementation of an integrated tax system, as well as
reducing fuel subsidies and containing other current spending. While recognizing that
increases in VAT rates could potentially bring about significant additional revenue, my
authorities believe that the current weak growth environment is not suitable for such an
action.
Subsidy reform has continued by adjusting domestic prices, including the price of gasoline,
which was raised by 40 percent to around 30 US cents per liter in November, and by
improving the targeting of the cash transfer program. The budgetary cost of fuel subsidies is
projected to decline to 4 percent of GDP in 2015/16 and efforts will be made to reduce it
further. However, identification and means testing of beneficiaries with a view to removing
less vulnerable households from the program have proved challenging. The authorities agree
that automatic stabilizers would be allowed to play freely should downside risks materialize
and growth further disappoints in 2015/16.

4
My authorities agree on the need to better articulate annual budgets around medium-term
goals specified within the 5-year development plans, and build adequate fiscal buffers to
smooth expenditure. They are working to improve public financial management, as well as
strengthen the framework for the National Development Fund (NDF) to which a third of oil
revenue would be allocated over the next 5 years. While no allocation to the Oil Stabilization
Fund (OSF) is envisaged under the 6th
Five-Year Development Plan general guidelines, my
authorities take note of staff recommendation to reinstate and replenish the OSF, and
introduce fiscal rules built around a comprehensive medium-term fiscal framework targeting
the non-oil balance. A debt management unit within the treasury was also established in early
2015 to identify all government debt and help incorporate debt sustainability risks into a
medium-term fiscal strategy.
Monetary and Exchange Rate Policies
Monetary policy is guided by the disinflation strategy which seeks to achieve single-digit
inflation by end 2016/17. While prioritizing price stability over output growth, my authorities
are of the view that some temporary relief to the economy is needed at present, given
sluggish growth, better-than-expected inflation outturns, benign inflation outlook, and tight
fiscal stance. They are specifically concerned that the high level of real interest rates
stemming from high NPLs and competition from unlicensed financial institutions (UFIs)
could pose a threat to growth and financial stability. Accordingly, steps are being taken by
the CBI to ease the tight liquidity conditions for banks, including by supplying resources in
the interbank market and reducing statutory reserve requirements. The authorities expect that
these steps would encourage lower levels of interest rates to prevail in the market. They note
staff’s views on the uncertainty in the underlying inflation dynamics and outlook, but are
confident that prudent implementation of their policy package would support growth while
helping their gradual disinflation strategy. The authorities also find merit in anchoring
inflation expectations, including by announcing broad money and inflation targets for
2016/17.
Institutional reforms of the monetary policy framework would help refocus CBI’s legal
mandate on price stability and entrench macroeconomic stability. The draft Money and
Banking law presented to the government would strengthen the decision making process and
enhance the CBI’s operational autonomy. The authorities remain open to examining all
feasible options in this area, including ways to strengthen communication and transparency.

5
Notwithstanding relative calm in the foreign exchange market, difficulties in accessing
foreign exchange have kept the bureau market rate at a large premium over the official
exchange rate. My authorities remain committed to unifying the exchange rate and are ready
to proceed with unification and returning to a managed float regime once account
relationships with foreign correspondent banks are reestablished and full access to
international reserves restored. Notwithstanding uncertainties over the external environment
which complicate the assessment, they share the view that the official exchange rate appears
somewhat overvalued.
Financial Sector
The banking system faces several challenges that are a legacy of past distortive credit
policies, weak risk management, inadequate supervision, compounded by external shocks.
Recognizing the important challenges and the need for comprehensive reform, my authorities
are determined to strengthen supervision, promote bank restructuring and recapitalization,
accelerate NPL resolution, and restore banks’ profitability. The initial study on financial
health of banks has been carried out, and a more detailed assessment of the largest banks is to
follow. Higher provisions have been mandated, and dividend payments have been restricted
to protect bank capital. While there is scope for improved supervision under the existing
legal mandate, enactment of the planned new banking law would substantially enhance CBI’s
enforcement powers and extend them to all banks and UFIs. My authorities also remain
committed to bolstering the AML/CFT framework, including by joining the Eurasian
AML/CFT group, to help the domestic financial system reintegrate to the global economy,
and will seek Fund assessment in this area.
Structural Reforms
Higher, more sustainable and inclusive growth, and lower unemployment require wide-
ranging structural reforms to tap Iran’s economic potential. The authorities share the view
that reforms should focus on fostering competition and unlocking productivity gains by
enhancing the functioning of the labor, product, and capital markets, restructuring the
energy-intensive corporate sector, improving the business climate, and further developing the
private sector. Lowering unemployment, including by boosting the job-intensity of growth
and increasing the sectoral elasticity of labor demand, remains a key objective of the
authorities’ medium-term strategy in the face of a growing labor force. My authorities take
note of staff view that increased employment, including for women, could be promoted by
expanding childcare in-work facilities, reducing payroll taxes for youth and women, and

6
establishing skill-matching and training programs. Strengthening the price signal in the
product markets would also increase investment in high-productivity sectors and companies.
The authorities have taken various initiatives to streamline administrative procedures, reduce
the cost of doing business, and promote privatization. They also agree that there is scope to
lift sectoral productivity through FDI and the ensuing transfer of modern technologies.
Conclusion
The agreement on Iran’s nuclear program would create an opportunity to build on and
broaden the achievements of the past two years. While my authorities work for the successful
implementation of the JCPOA, they realize that the road towards achieving development
objectives and economic prosperity will be long and arduous. They remain determined to
persevere with sound macroeconomic and structural policies to realize the goal of becoming
one of the fastest-growing emerging economies over the next decade.