IMF Country Report No. 15/243 THE FORMER YUGOSLAV REPUBLIC ... · imf country report no. 15/243 the...
38
© 2015 International Monetary Fund IMF Country Report No. 15/243 THE FORMER YUGOSLAV REPUBLIC OF MACEDONIA SELECTED ISSUES This Selected Issues paper on the Former Yugoslav Republic of Macedonia was prepared by a staff team of the International Monetary Fund as background documentation for the periodic consultation with the member country. It is based on the information available at the time it was completed on August 10, 2015. Copies of this report are available to the public from International Monetary Fund Publication Services PO Box 92780 Washington, D.C. 20090 Telephone: (202) 623-7430 Fax: (202) 623-7201 E-mail: [email protected] Web: http://www.imf.org Price: $18.00 per printed copy International Monetary Fund Washington, D.C. September 2015
Transcript of IMF Country Report No. 15/243 THE FORMER YUGOSLAV REPUBLIC ... · imf country report no. 15/243 the...
© 2015 International Monetary Fund
IMF Country Report No. 15/243
THE FORMER YUGOSLAV REPUBLIC OF MACEDONIA SELECTED ISSUES
This Selected Issues paper on the Former Yugoslav Republic of Macedonia was prepared
by a staff team of the International Monetary Fund as background documentation for the
periodic consultation with the member country. It is based on the information available
at the time it was completed on August 10, 2015.
Copies of this report are available to the public from
International Monetary Fund Publication Services
PO Box 92780 Washington, D.C. 20090
Telephone: (202) 623-7430 Fax: (202) 623-7201
E-mail: [email protected] Web: http://www.imf.org
Price: $18.00 per printed copy
International Monetary Fund
Washington, D.C.
September 2015
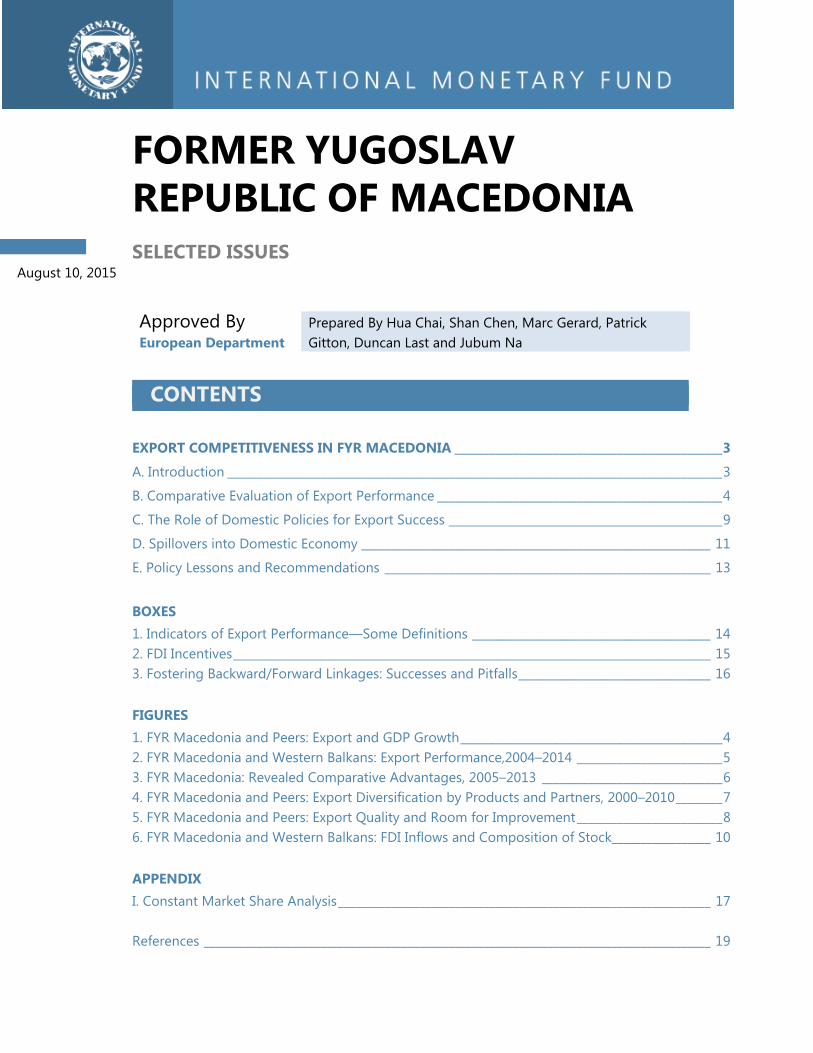
FORMER YUGOSLAV REPUBLIC OF MACEDONIA SELECTED ISSUES
Approved ByEuropean Department
Prepared By Hua Chai, Shan Chen, Marc Gerard, Patrick Gitton, Duncan Last and Jubum Na
EXPORT COMPETITIVENESS IN FYR MACEDONIA ______________________________________________ 3
A. Introduction _____________________________________________________________________________________ 3
B. Comparative Evaluation of Export Performance _________________________________________________ 4
C. The Role of Domestic Policies for Export Success _______________________________________________ 9
D. Spillovers into Domestic Economy ____________________________________________________________ 11
E. Policy Lessons and Recommendations ________________________________________________________ 13 BOXES 1. Indicators of Export Performance—Some Definitions _________________________________________ 14 2. FDI Incentives __________________________________________________________________________________ 15 3. Fostering Backward/Forward Linkages: Successes and Pitfalls _________________________________ 16 FIGURES 1. FYR Macedonia and Peers: Export and GDP Growth _____________________________________________ 4 2. FYR Macedonia and Western Balkans: Export Performance,2004–2014 _________________________ 5 3. FYR Macedonia: Revealed Comparative Advantages, 2005–2013 _______________________________ 6 4. FYR Macedonia and Peers: Export Diversification by Products and Partners, 2000–2010 ________ 7 5. FYR Macedonia and Peers: Export Quality and Room for Improvement _________________________ 8 6. FYR Macedonia and Western Balkans: FDI Inflows and Composition of Stock _________________ 10 APPENDIX I. Constant Market Share Analysis ________________________________________________________________ 17 References _______________________________________________________________________________________ 19
CONTENTS
August 10, 2015
FORMER YUGOSLAV REPUBLIC OF MACEDONIA
2 INTERNATIONAL MONETARY FUND
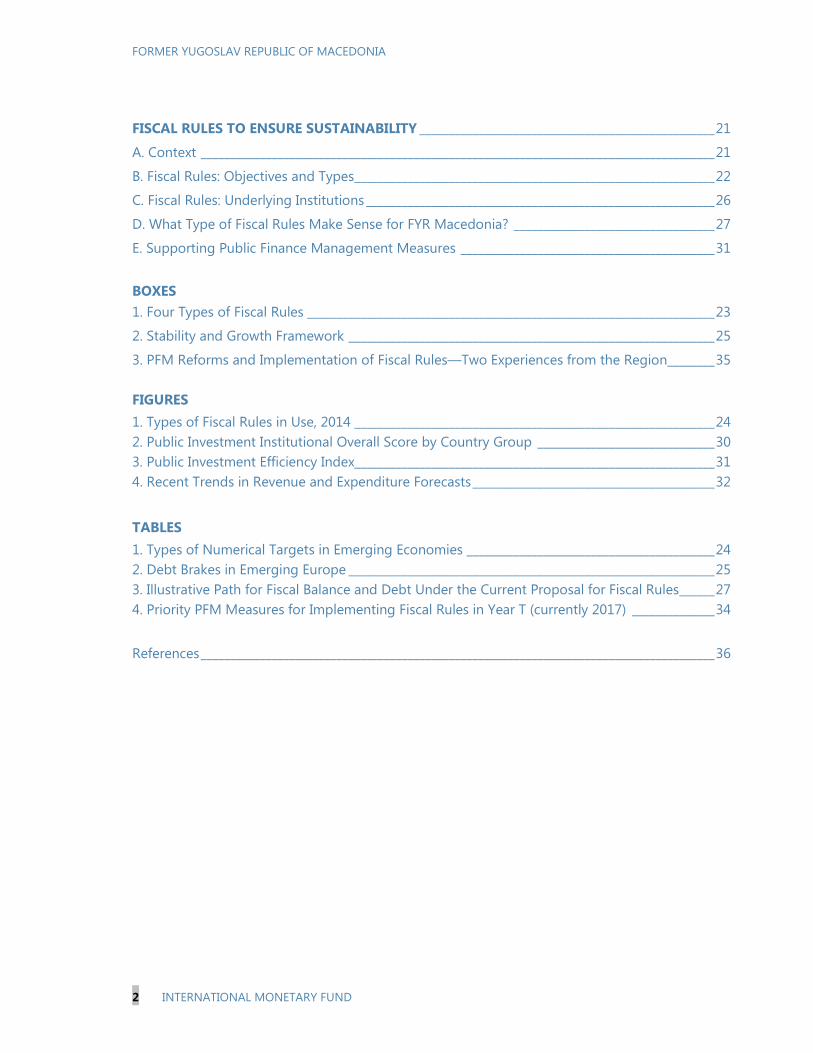
FISCAL RULES TO ENSURE SUSTAINABILITY __________________________________________________ 21
A. Context _______________________________________________________________________________________ 21
B. Fiscal Rules: Objectives and Types _____________________________________________________________ 22
C. Fiscal Rules: Underlying Institutions ___________________________________________________________ 26
D. What Type of Fiscal Rules Make Sense for FYR Macedonia? __________________________________ 27
E. Supporting Public Finance Management Measures ___________________________________________ 31
BOXES
1. Four Types of Fiscal Rules _____________________________________________________________________ 23
2. Stability and Growth Framework ______________________________________________________________ 25
3. PFM Reforms and Implementation of Fiscal Rules—Two Experiences from the Region ________ 35
FIGURES
1. Types of Fiscal Rules in Use, 2014 _____________________________________________________________ 24
2. Public Investment Institutional Overall Score by Country Group ______________________________ 30
3. Public Investment Efficiency Index_____________________________________________________________ 31
4. Recent Trends in Revenue and Expenditure Forecasts _________________________________________ 32
TABLES
1. Types of Numerical Targets in Emerging Economies __________________________________________ 24
2. Debt Brakes in Emerging Europe ______________________________________________________________ 25
3. Illustrative Path for Fiscal Balance and Debt Under the Current Proposal for Fiscal Rules ______ 27
4. Priority PFM Measures for Implementing Fiscal Rules in Year T (currently 2017) ______________ 34
References _______________________________________________________________________________________ 36
FORMER YUGOSLAV REPUBLIC OF MACEDONIA
INTERNATIONAL MONETARY FUND 3
EXPORT COMPETITIVENESS IN FYR MACEDONIA1
Export performance in FYR Macedonia has been strong over the last decade, critically
contributing to overall growth. Exports have been re-oriented towards new products with
higher technological content, allowing for the build-up of revealed comparative advantages in
these products. Our analysis based on Constant Market Share analysis shows that the overall
competitiveness gap of FYR Macedonia with respect to other emerging European countries has
narrowed.
There appears to be significant room for quality improvement, including for the most
successful export products. Also, while the contribution of exports to GDP growth has been
significant, spillover into the domestic tradable sector from the foreign investment led export
sector remains limited so far.
Despite a relatively low potential due to the small size of the economy, FYR Macedonia has
received significant FDI which has faciliated links with the European supply chains. Financial
incentives, competitive wages and improvements in business environment, have successfully
attracted FDI and contributed to FYR Macedonia’s export diversification. To further deepen
integration with European supply chains and foster backward linkages to the domestic
economy, better infrastructure as well as additional reforms to improve skills and operating
environment for the domestic private sector is needed.
A. Introduction
1. For a small open economy such as FYR Macedonia, improving export competitiveness
is critical to bolster economic growth and reduce unemployment. In the short to medium run,
an improved export performance is needed to strengthen the trade balance and reduce the
country’s dependence on remittances from migrant workers to raise national income. In the longer
run, technological and managerial spillovers typically associated with the establishment of foreign
exporting firms can be expected to foster backward linkages to local producers, thus promoting the
integration of the domestic tradable goods sector into global supply chains and supporting
sustainable growth. For these reasons, attracting foreign direct investment (FDI) and building up
export capacities have been the linchpin of the authorities’ economic policy over the last decade.
2. Strong export performance and economic convergence have gone hand in hand in
successful emerging European countries. Higher exports and trade openness have been
associated with better resource allocation and the development of a resilient tradable goods sectors
in the literature (see, e.g., Edwards, 1993), ultimately being conducive to higher standards of living.
This positive correlation between exports and real GDP per capita has held up in Central and Eastern
1 Prepared by Shan Chen, Marc Gerard and Patrick Gitton.
FORMER YUGOSLAV REPUBLIC OF MACEDONIA
4 INTERNATIONAL MONETARY FUND
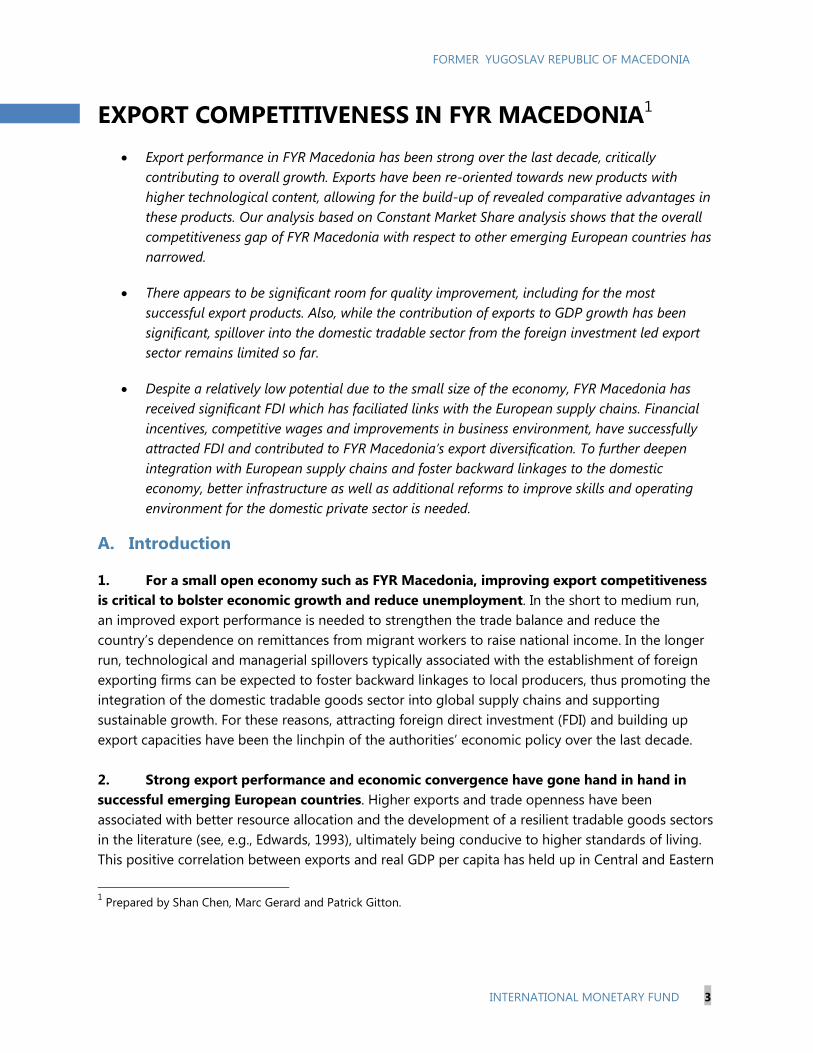
European Countries that are members of the European Union—henceforth New Member States
(NMS)—over the last decade (Figure 1). While the correlation appears weaker for some Balkan
economies, for FYR Macedonia, real GDP growth has been strongly associated with export growth
(Figure 1).
Figure 1. FYR Macedonia and Peers: Export and GDP Growth
3. Against this backdrop, this research aims at investigating FYR Macedonia’s export
performance relative to other Western Balkan (WB) countries and the NMS. In Section B, we
take stock of recent export performances relative to peers, by looking at export diversification,
revealed comparative advantages, export product quality, and the contribution of exports to the
domestic economy. Section C tries to identify contributing factors to competitiveness while Section
D focuses on the contribution of FDI to greater integration into global supply chains. The concluding
Section E offers policy advice to enhance the contribution of the domestic export sector to growth.
B. Comparative Evaluation of Export Performance
4. Since the mid-2000s, FYR Macedonia’s overall export performance has been better
than those observed in other Balkan countries. Exports of goods and services have represented
between 30 and 45 percent of nominal GDP, well above the shares prevailing in peer WB countries
(Figure 2). Such levels are broadly in line with those observed in more advanced Central and Eastern
European Countries such as the Czech Republic, the Slovak Republic and Hungary in the preceding
decade. Despite this higher base, export growth in FYR Macedonia has only fallen slightly short of
that in peer WB countries, and has proved resilient to the global financial crisis. The ability of
Sources: IMF, WEO; and IMF staff Calculations.
Albania
Bosnia and
Herzegovina
Bulgaria
Croatia
Czech
Republic
Estonia
Hungary
Latvia
Macedonia
Montenegro
Poland
Romania
Serbia
Slovakia
Slovenia
-40
-20
0
20
40
60
80
100
120
140
160
180
200
220
0 20 40 60 80
GDP per capita and Real export changes, 2004-2014
(Percent)
Real e
xpo
rts
Real GDP per capita
-20
-15
-10
-5
0
5
10
15
20
25
-2
-1
0
1
2
3
4
5
6
7
2005 2006 2007 2008 2009 2010 2011 2012 2013 2014
Real GDP growth
Real export growth (rhs)
FYR Macedonia: Real GDP and Real Export Growth, 2005-2014
(Percent)
FORMER YUGOSLAV REPUBLIC OF MACEDONIA
INTERNATIONAL MONETARY FUND 5
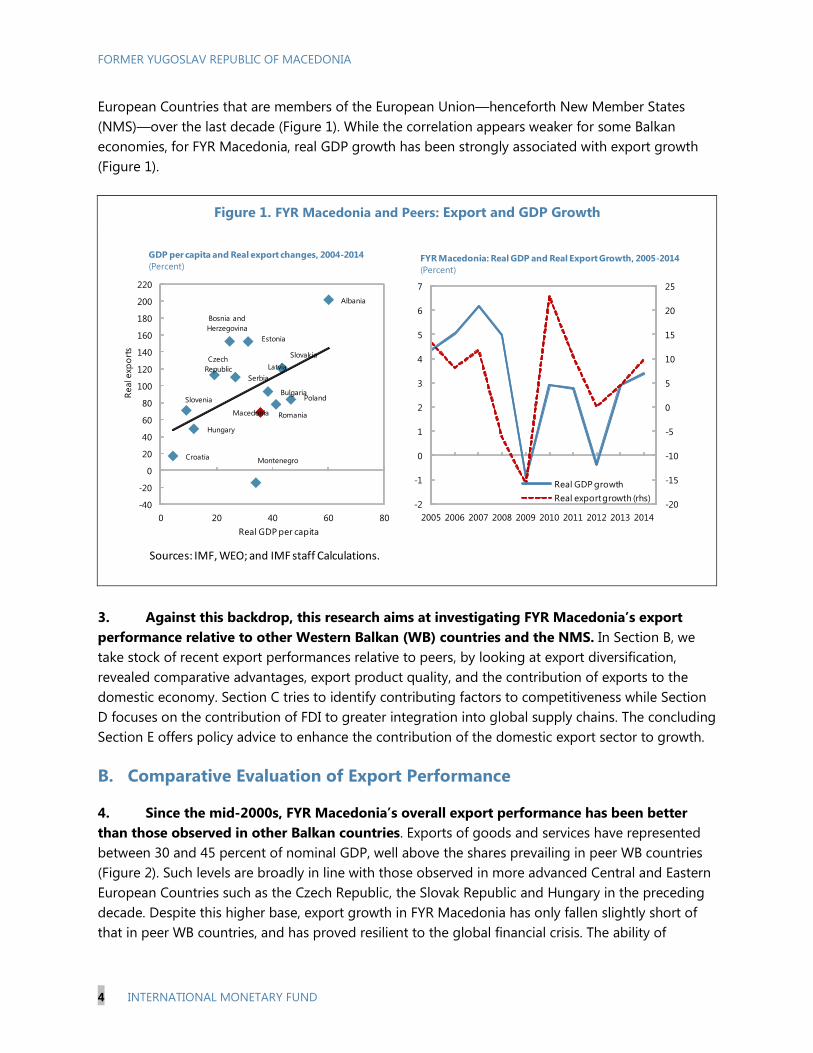
Macedonian exporters to maintain or even increase their positions during times of severe
contraction in trade flows has allowed for steady market share gains within the European Union, as
well as in the world.
Figure 2. FYR Macedonia and Western Balkans: Export Performance,2004–2014
5. Exports have contributed more to
GDP growth in FYR Macedonia than in other
Balkan countries. While net exports have been
a negative contributor to growth, notably due
to the high import content of new investments
and the importance of low-end assembly
production, exports have provided major
contributions to real growth, helping to pull the
economy out of the short-lived recession
experienced in 2012 in the wake of the global
financial crisis. Exports stemming from the
Technological Industrial Development Zones
Sources: IMF, DOTS; IMF, WEO; and IMF staff calculations.
0
10
20
30
40
50
60
2004 2006 2008 2010 2012 2014
Export Shares in GDP
(Percent)Albania
Bosnia and Herzegovina
CroatiaKosovo
MacedoniaMontenegro
50
100
150
200
250
300
350
2004 2006 2008 2010 2012 2014
Real Export Developments
(Index; 2004=100)
AlbaniaBosnia and HerzegovinaCroatiaMacedoniaMontenegroSerbia
50
75
100
125
150
175
200
2004 2006 2008 2010 2012 2014
Export Market Share Growth in the World
(Index; 2004=100)
Albania
Bosnia and Herzegovina
Macedonia
50
75
100
125
150
175
200
225
250
2004 2006 2008 2010 2012 2014
Export Market Share Growth in the EU
(Index; 2004= 100)
Albania
Bosnia and Herzegovina
Macedonia
-4
-2
0
2
4
6
8
2006 2008 2010 2012 2014
Western Balkans: Export Contribution to Growth, 2010-2014
(Percent)
Albania Bosnia and Herzegovina
Kosovo FYR Macedonia
Montenegro Serbia
Sources: IMF, WEO; and IMF Staff Calculations.
FORMER YUGOSLAV REPUBLIC OF MACEDONIA
6 INTERNATIONAL MONETARY FUND
(TIDZ) have been growing at double digits in the last few years, representing about 40 percent of
total exports in 2014.
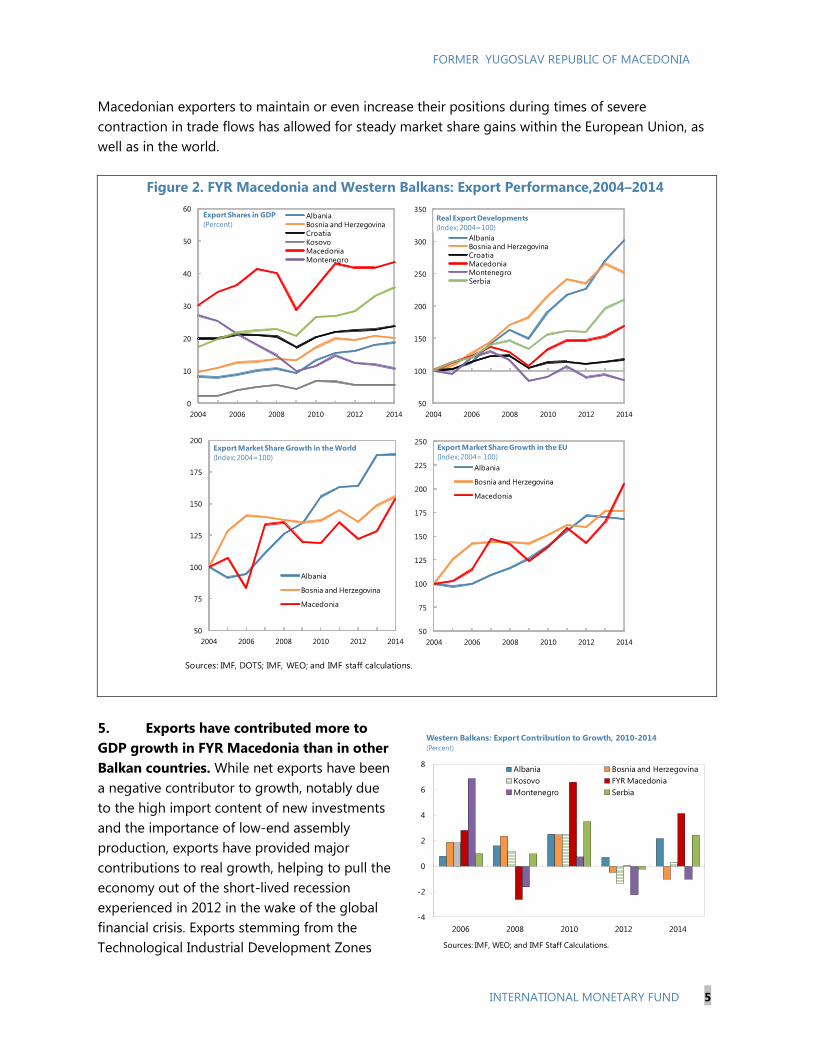
6. Reflecting developments in the TIDZ, FYR Macedonia has recently built up revealed
comparative advantage (RCA) in new products. Overall, the country’s main comparative
advantages remain in the production of intermediate and consumer goods (Figure 3). More recently,
RCA has diversified away from traditional product lines to more capital intensive goods. While
remaining highly competitive in the production of textiles, beverages, tobacco, and food products,
the country managed to dramatically push its advantage in chemical products.
Figure 3. FYR Macedonia: Revealed Comparative Advantages, 2005–2013
7. However, the diversification trend is less pronounced when compared to others in the
region. An analysis of export diversification by products and partners during the 2000s reveals the
following.
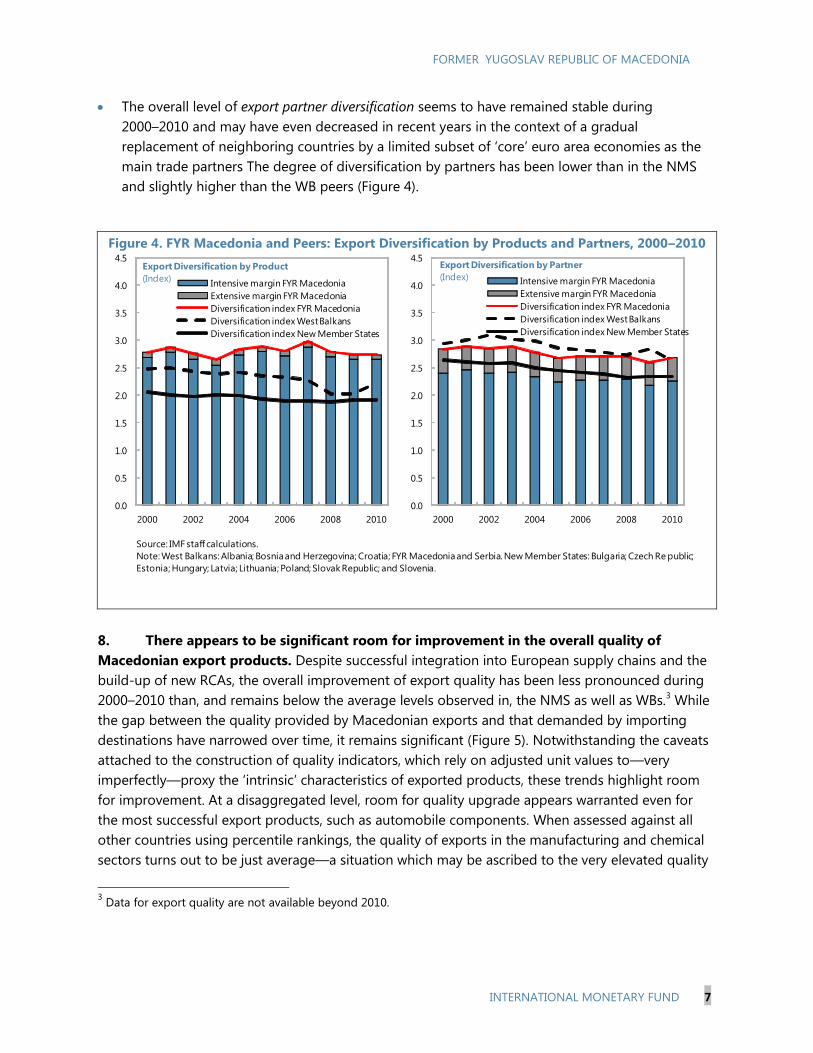
The overall level of export product diversification (which is demonstrated by the ‘intensive
margin’ in the concentration indicator in Figure 4)2 has remained below that of other WB
countries and the NMS until 2010—notwithstanding some improvement since 2008 , which
reflect progress regarding insertion into European supply chains.
2 See the box on export performance indicators for a description of the measurement metrics used in this section. A
higher value of the index indicates higher concentration of products/partners (hence less diversification). The data
are available only until 2010.
0.0
0.5
1.0
1.5
2.0
2.5
0.0
0.5
1.0
1.5
2.0
2.5
2005 2007 2009 2011 2013
Machinery and Transport
Manufactures
Electrical equipment
Chemicals
Revealed Comparative Advantages Relative to the
World For Selected Industrial Product Categories
(Percent)
0
1
2
3
4
5
6
7
8
0
1
2
3
4
5
6
7
8
2005 2007 2009 2011 2013
Food products
Textiles and clothing
Revealed Comparative Advantages Relative to the
World For Selected 'Traditional' Product Categories
(Percent)
Sources: World Bank WITS; and IMF staff calculations.
FORMER YUGOSLAV REPUBLIC OF MACEDONIA
INTERNATIONAL MONETARY FUND 7
The overall level of export partner diversification seems to have remained stable during
2000–2010 and may have even decreased in recent years in the context of a gradual
replacement of neighboring countries by a limited subset of ‘core’ euro area economies as the
main trade partners The degree of diversification by partners has been lower than in the NMS
and slightly higher than the WB peers (Figure 4).
Figure 4. FYR Macedonia and Peers: Export Diversification by Products and Partners, 2000–2010
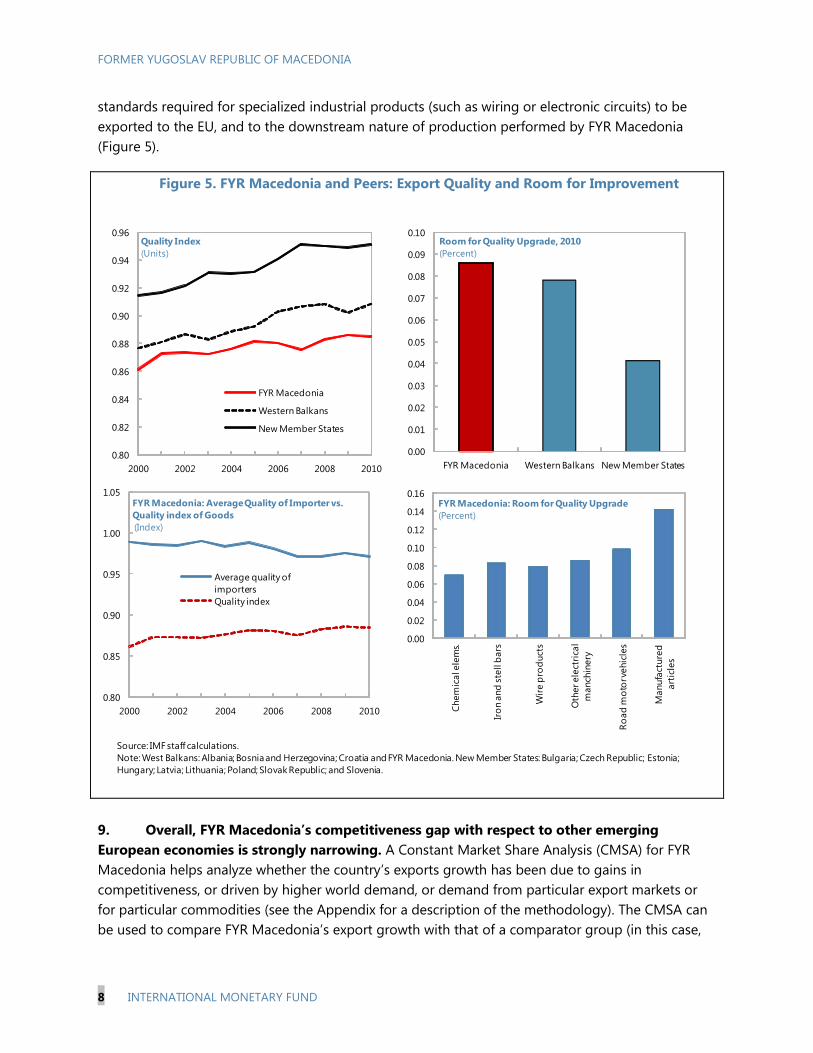
8. There appears to be significant room for improvement in the overall quality of
Macedonian export products. Despite successful integration into European supply chains and the
build-up of new RCAs, the overall improvement of export quality has been less pronounced during
2000–2010 than, and remains below the average levels observed in, the NMS as well as WBs.3 While
the gap between the quality provided by Macedonian exports and that demanded by importing
destinations have narrowed over time, it remains significant (Figure 5). Notwithstanding the caveats
attached to the construction of quality indicators, which rely on adjusted unit values to—very
imperfectly—proxy the ‘intrinsic’ characteristics of exported products, these trends highlight room
for improvement. At a disaggregated level, room for quality upgrade appears warranted even for
the most successful export products, such as automobile components. When assessed against all
other countries using percentile rankings, the quality of exports in the manufacturing and chemical
sectors turns out to be just average—a situation which may be ascribed to the very elevated quality
3 Data for export quality are not available beyond 2010.
0.0
0.5
1.0
1.5
2.0
2.5
3.0
3.5
4.0
4.5
2000 2002 2004 2006 2008 2010
Intensive margin FYR Macedonia
Extensive margin FYR Macedonia
Diversification index FYR Macedonia
Diversification index West Balkans
Diversification index New Member States
Export Diversification by Product
(Index)
0.0
0.5
1.0
1.5
2.0
2.5
3.0
3.5
4.0
4.5
2000 2002 2004 2006 2008 2010
Intensive margin FYR Macedonia
Extensive margin FYR Macedonia
Diversification index FYR Macedonia
Diversification index West Balkans
Diversification index New Member States
Export Diversification by Partner
(Index)
Source: IMF staff calculations.
Note: West Balkans: Albania; Bosnia and Herzegovina; Croatia; FYR Macedonia and Serbia. New Member States: Bulgaria; Czech Re public;
Estonia; Hungary; Latvia; Lithuania; Poland; Slovak Republic; and Slovenia.
FORMER YUGOSLAV REPUBLIC OF MACEDONIA
8 INTERNATIONAL MONETARY FUND
standards required for specialized industrial products (such as wiring or electronic circuits) to be
exported to the EU, and to the downstream nature of production performed by FYR Macedonia
(Figure 5).
Figure 5. FYR Macedonia and Peers: Export Quality and Room for Improvement
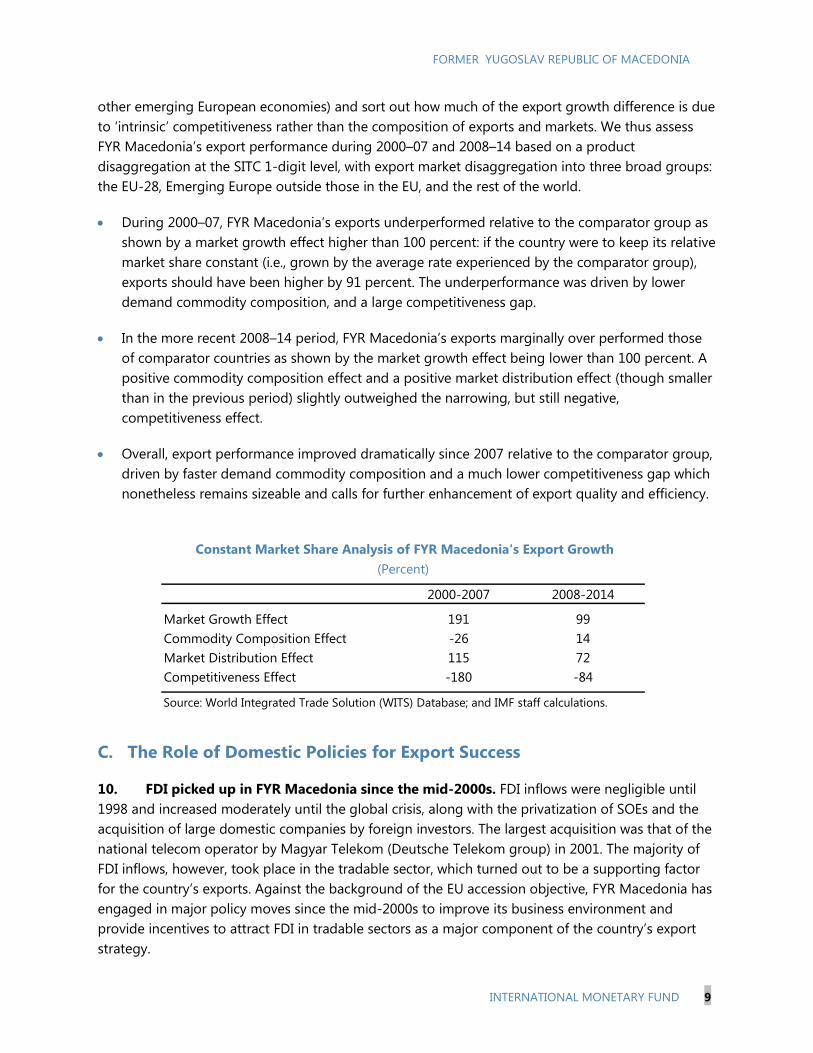
9. Overall, FYR Macedonia’s competitiveness gap with respect to other emerging
European economies is strongly narrowing. A Constant Market Share Analysis (CMSA) for FYR
Macedonia helps analyze whether the country’s exports growth has been due to gains in
competitiveness, or driven by higher world demand, or demand from particular export markets or
for particular commodities (see the Appendix for a description of the methodology). The CMSA can
be used to compare FYR Macedonia’s export growth with that of a comparator group (in this case,
0.80
0.82
0.84
0.86
0.88
0.90
0.92
0.94
0.96
2000 2002 2004 2006 2008 2010
FYR Macedonia
Western Balkans
New Member States
Quality Index
(Units)
0.00
0.01
0.02
0.03
0.04
0.05
0.06
0.07
0.08
0.09
0.10
FYR Macedonia Western Balkans New Member States
Room for Quality Upgrade, 2010
(Percent)
0.80
0.85
0.90
0.95
1.00
1.05
2000 2002 2004 2006 2008 2010
Average quality of
importers
Quality index
FYR Macedonia: Average Quality of Importer vs.
Quality index of Goods
(Index)
0.00
0.02
0.04
0.06
0.08
0.10
0.12
0.14
0.16
Chem
ical e
lem
s.
Iro
n a
nd
ste
ll b
ars
Wir
e p
rod
uct
s
Oth
er ele
ctri
cal
manch
inery
Ro
ad
mo
tor v
ehic
les
Manufa
cture
d
art
icle
s
FYR Macedonia: Room for Quality Upgrade
(Percent)
Source: IMF staff calculations.
Note: West Balkans: Albania; Bosnia and Herzegovina; Croatia and FYR Macedonia. New Member States: Bulgaria; Czech Republic; Estonia;
Hungary; Latvia; Lithuania; Poland; Slovak Republic; and Slovenia.
FO
RM
ER
YU
GO
SLA
V R
EP
UB
LIC O
F M
AC
ED
ON
IA
FORMER YUGOSLAV REPUBLIC OF MACEDONIA
INTERNATIONAL MONETARY FUND 9
2000-2007 2008-2014
Market Growth Effect 191 99
Commodity Composition Effect -26 14
Market Distribution Effect 115 72
Competitiveness Effect -180 -84
Source: World Integrated Trade Solution (WITS) Database; and IMF staff calculations.
Constant Market Share Analysis of FYR Macedonia's Export Growth
(Percent)
other emerging European economies) and sort out how much of the export growth difference is due
to ‘intrinsic’ competitiveness rather than the composition of exports and markets. We thus assess
FYR Macedonia’s export performance during 2000–07 and 2008–14 based on a product
disaggregation at the SITC 1-digit level, with export market disaggregation into three broad groups:
the EU-28, Emerging Europe outside those in the EU, and the rest of the world.
During 2000–07, FYR Macedonia’s exports underperformed relative to the comparator group as
shown by a market growth effect higher than 100 percent: if the country were to keep its relative
market share constant (i.e., grown by the average rate experienced by the comparator group),
exports should have been higher by 91 percent. The underperformance was driven by lower
demand commodity composition, and a large competitiveness gap.
In the more recent 2008–14 period, FYR Macedonia’s exports marginally over performed those
of comparator countries as shown by the market growth effect being lower than 100 percent. A
positive commodity composition effect and a positive market distribution effect (though smaller
than in the previous period) slightly outweighed the narrowing, but still negative,
competitiveness effect.
Overall, export performance improved dramatically since 2007 relative to the comparator group,
driven by faster demand commodity composition and a much lower competitiveness gap which
nonetheless remains sizeable and calls for further enhancement of export quality and efficiency.
C. The Role of Domestic Policies for Export Success
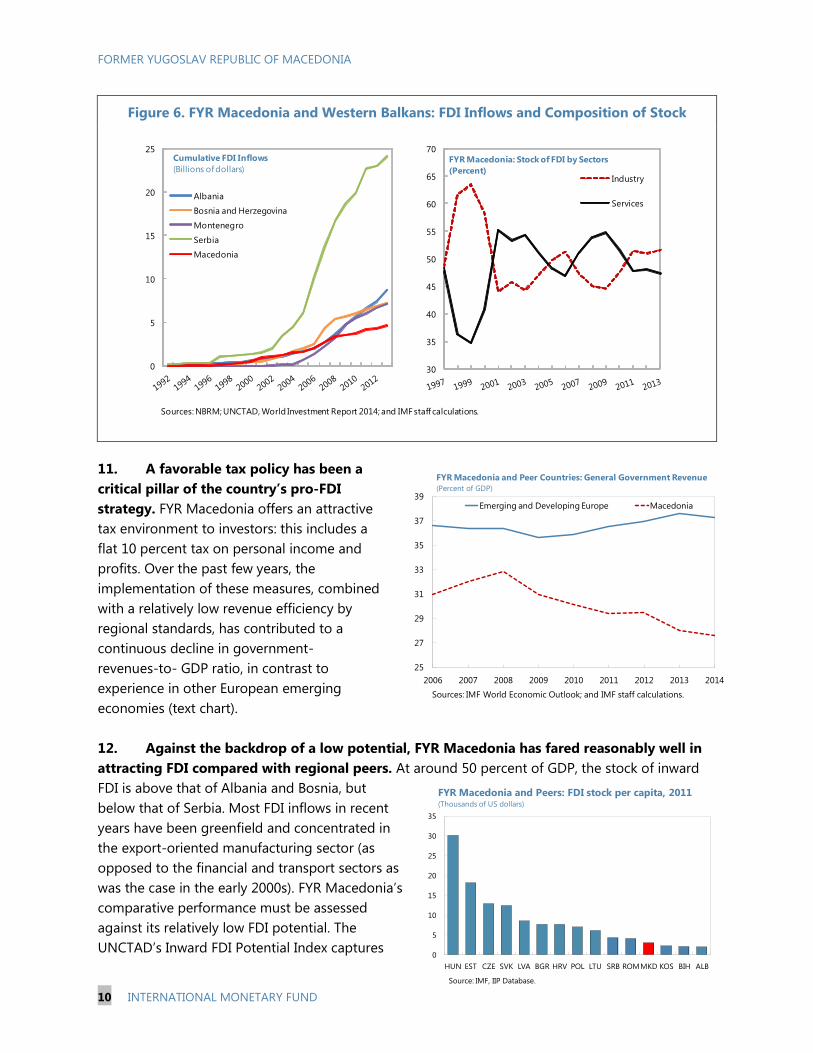
10. FDI picked up in FYR Macedonia since the mid-2000s. FDI inflows were negligible until
1998 and increased moderately until the global crisis, along with the privatization of SOEs and the
acquisition of large domestic companies by foreign investors. The largest acquisition was that of the
national telecom operator by Magyar Telekom (Deutsche Telekom group) in 2001. The majority of
FDI inflows, however, took place in the tradable sector, which turned out to be a supporting factor
for the country’s exports. Against the background of the EU accession objective, FYR Macedonia has
engaged in major policy moves since the mid-2000s to improve its business environment and
provide incentives to attract FDI in tradable sectors as a major component of the country’s export
strategy.
FORMER YUGOSLAV REPUBLIC OF MACEDONIA
10 INTERNATIONAL MONETARY FUND
Figure 6. FYR Macedonia and Western Balkans: FDI Inflows and Composition of Stock
11. A favorable tax policy has been a
critical pillar of the country’s pro-FDI
strategy. FYR Macedonia offers an attractive
tax environment to investors: this includes a
flat 10 percent tax on personal income and
profits. Over the past few years, the
implementation of these measures, combined
with a relatively low revenue efficiency by
regional standards, has contributed to a
continuous decline in government-
revenues-to- GDP ratio, in contrast to
experience in other European emerging
economies (text chart).
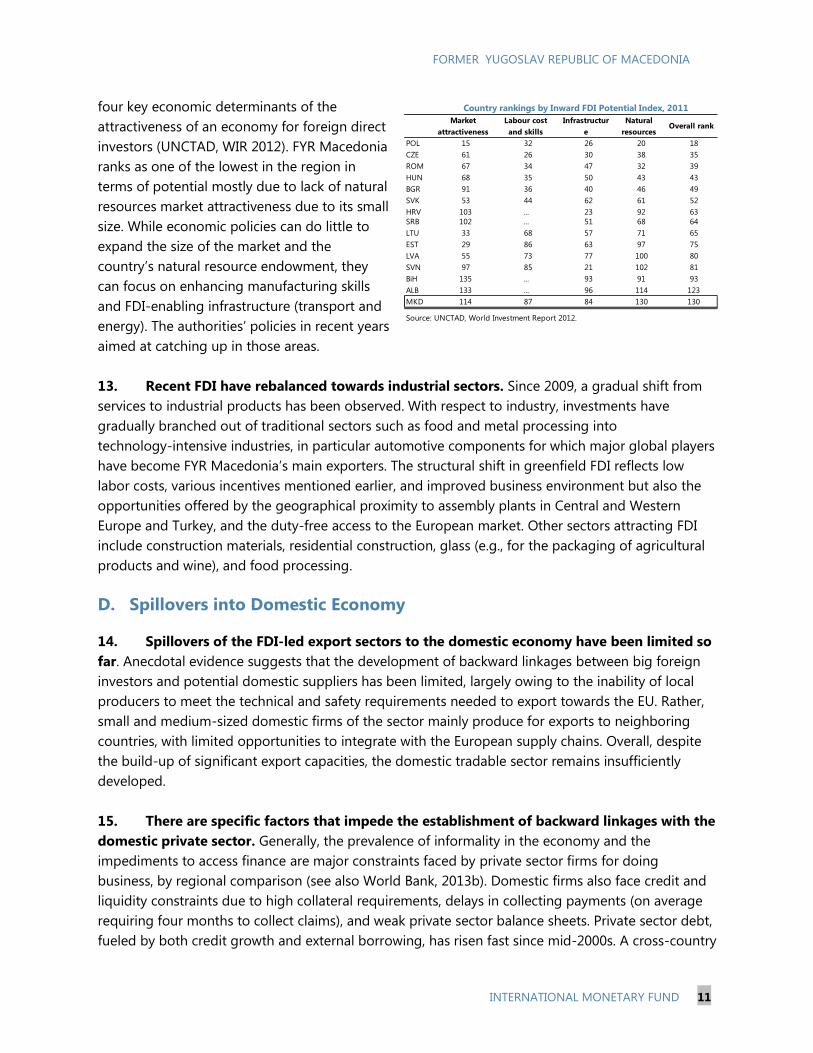
12. Against the backdrop of a low potential, FYR Macedonia has fared reasonably well in
attracting FDI compared with regional peers. At around 50 percent of GDP, the stock of inward
FDI is above that of Albania and Bosnia, but
below that of Serbia. Most FDI inflows in recent
years have been greenfield and concentrated in
the export-oriented manufacturing sector (as
opposed to the financial and transport sectors as
was the case in the early 2000s). FYR Macedonia’s
comparative performance must be assessed
against its relatively low FDI potential. The
UNCTAD’s Inward FDI Potential Index captures
30
35
40
45
50
55
60
65
70FYR Macedonia: Stock of FDI by Sectors
(Percent) Industry
Services
0
5
10
15
20
25Cumulative FDI Inflows
(Billions of dollars)
Albania
Bosnia and Herzegovina
Montenegro
Serbia
Macedonia
Sources: NBRM; UNCTAD, World Investment Report 2014; and IMF staff calculations.
25
27
29
31
33
35
37
39
2006 2007 2008 2009 2010 2011 2012 2013 2014
Emerging and Developing Europe Macedonia
Sources: IMF World Economic Outlook; and IMF staff calculations.
FYR Macedonia and Peer Countries: General Government Revenue
(Percent of GDP)
0
5
10
15
20
25
30
35
HUN EST CZE SVK LVA BGR HRV POL LTU SRB ROMMKD KOS BIH ALB
Source: IMF, IIP Database.
FYR Macedonia and Peers: FDI stock per capita, 2011(Thousands of US dollars)
FORMER YUGOSLAV REPUBLIC OF MACEDONIA
INTERNATIONAL MONETARY FUND 11
four key economic determinants of the
attractiveness of an economy for foreign direct
investors (UNCTAD, WIR 2012). FYR Macedonia
ranks as one of the lowest in the region in
terms of potential mostly due to lack of natural
resources market attractiveness due to its small
size. While economic policies can do little to
expand the size of the market and the
country’s natural resource endowment, they
can focus on enhancing manufacturing skills
and FDI-enabling infrastructure (transport and
energy). The authorities’ policies in recent years
aimed at catching up in those areas.
13. Recent FDI have rebalanced towards industrial sectors. Since 2009, a gradual shift from
services to industrial products has been observed. With respect to industry, investments have
gradually branched out of traditional sectors such as food and metal processing into
technology-intensive industries, in particular automotive components for which major global players
have become FYR Macedonia’s main exporters. The structural shift in greenfield FDI reflects low
labor costs, various incentives mentioned earlier, and improved business environment but also the
opportunities offered by the geographical proximity to assembly plants in Central and Western
Europe and Turkey, and the duty-free access to the European market. Other sectors attracting FDI
include construction materials, residential construction, glass (e.g., for the packaging of agricultural
products and wine), and food processing.
D. Spillovers into Domestic Economy
14. Spillovers of the FDI-led export sectors to the domestic economy have been limited so
far. Anecdotal evidence suggests that the development of backward linkages between big foreign
investors and potential domestic suppliers has been limited, largely owing to the inability of local
producers to meet the technical and safety requirements needed to export towards the EU. Rather,
small and medium-sized domestic firms of the sector mainly produce for exports to neighboring
countries, with limited opportunities to integrate with the European supply chains. Overall, despite
the build-up of significant export capacities, the domestic tradable sector remains insufficiently
developed.
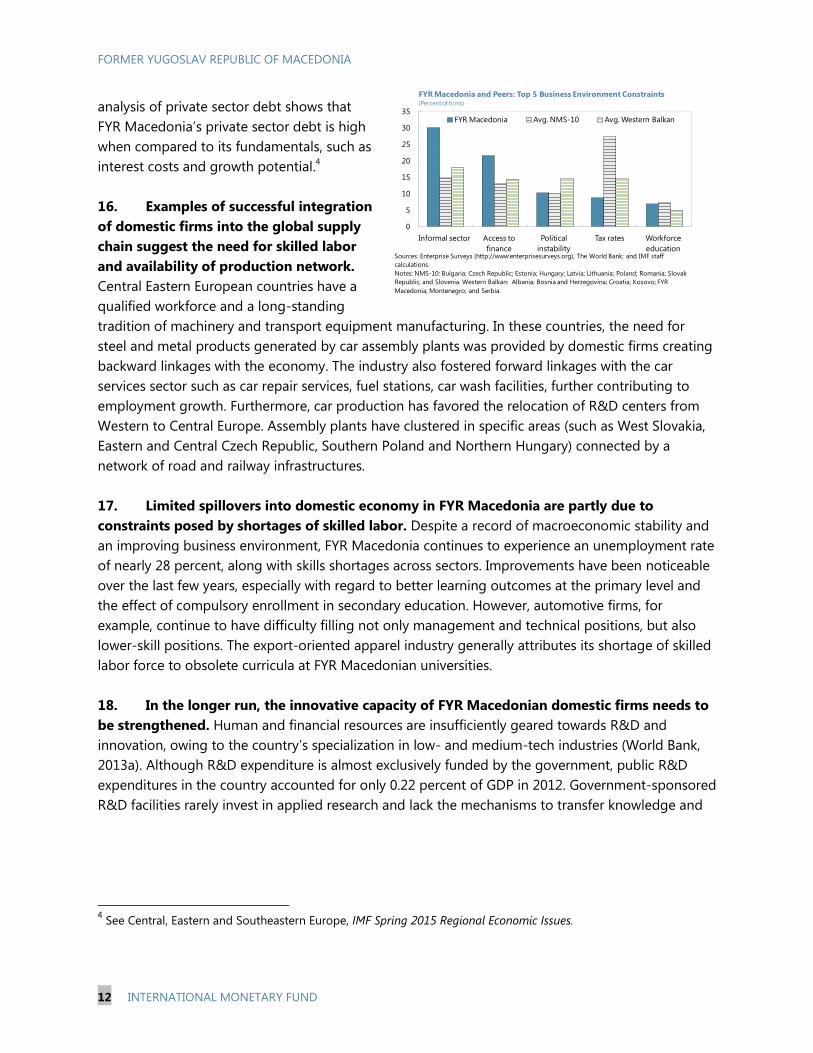
15. There are specific factors that impede the establishment of backward linkages with the
domestic private sector. Generally, the prevalence of informality in the economy and the
impediments to access finance are major constraints faced by private sector firms for doing
business, by regional comparison (see also World Bank, 2013b). Domestic firms also face credit and
liquidity constraints due to high collateral requirements, delays in collecting payments (on average
requiring four months to collect claims), and weak private sector balance sheets. Private sector debt,
fueled by both credit growth and external borrowing, has risen fast since mid-2000s. A cross-country
Market
attractiveness
Labour cost
and skills
Infrastructur
e
Natural
resourcesOverall rank
POL 15 32 26 20 18
CZE 61 26 30 38 35
ROM 67 34 47 32 39
HUN 68 35 50 43 43
BGR 91 36 40 46 49
SVK 53 44 62 61 52
HRV 103 … 23 92 63
SRB 102 … 51 68 64
LTU 33 68 57 71 65
EST 29 86 63 97 75
LVA 55 73 77 100 80
SVN 97 85 21 102 81
BiH 135 … 93 91 93
ALB 133 … 96 114 123
MKD 114 87 84 130 130
Source: UNCTAD, World Investment Report 2012.
Country rankings by Inward FDI Potential Index, 2011
FORMER YUGOSLAV REPUBLIC OF MACEDONIA
12 INTERNATIONAL MONETARY FUND
analysis of private sector debt shows that
FYR Macedonia’s private sector debt is high
when compared to its fundamentals, such as
interest costs and growth potential.4
16. Examples of successful integration
of domestic firms into the global supply
chain suggest the need for skilled labor
and availability of production network.
Central Eastern European countries have a
qualified workforce and a long-standing
tradition of machinery and transport equipment manufacturing. In these countries, the need for
steel and metal products generated by car assembly plants was provided by domestic firms creating
backward linkages with the economy. The industry also fostered forward linkages with the car
services sector such as car repair services, fuel stations, car wash facilities, further contributing to
employment growth. Furthermore, car production has favored the relocation of R&D centers from
Western to Central Europe. Assembly plants have clustered in specific areas (such as West Slovakia,
Eastern and Central Czech Republic, Southern Poland and Northern Hungary) connected by a
network of road and railway infrastructures.
17. Limited spillovers into domestic economy in FYR Macedonia are partly due to
constraints posed by shortages of skilled labor. Despite a record of macroeconomic stability and
an improving business environment, FYR Macedonia continues to experience an unemployment rate
of nearly 28 percent, along with skills shortages across sectors. Improvements have been noticeable
over the last few years, especially with regard to better learning outcomes at the primary level and
the effect of compulsory enrollment in secondary education. However, automotive firms, for
example, continue to have difficulty filling not only management and technical positions, but also
lower-skill positions. The export-oriented apparel industry generally attributes its shortage of skilled
labor force to obsolete curricula at FYR Macedonian universities.
18. In the longer run, the innovative capacity of FYR Macedonian domestic firms needs to
be strengthened. Human and financial resources are insufficiently geared towards R&D and
innovation, owing to the country’s specialization in low- and medium-tech industries (World Bank,
2013a). Although R&D expenditure is almost exclusively funded by the government, public R&D
expenditures in the country accounted for only 0.22 percent of GDP in 2012. Government-sponsored
R&D facilities rarely invest in applied research and lack the mechanisms to transfer knowledge and
4 See Central, Eastern and Southeastern Europe, IMF Spring 2015 Regional Economic Issues.
0
5
10
15
20
25
30
35
Informal sector Access to
finance
Political
instability
Tax rates Workforce
education
FYR Macedonia and Peers: Top 5 Business Environment Constraints(Percent of firms)
FYR Macedonia Avg. NMS-10 Avg. Western Balkan
Sources: Enterprise Surveys (http://www.enterprisesurveys.org), The World Bank; and IMF staff
calculations.
Notes: NMS-10: Bulgaria; Czech Republic; Estonia; Hungary; Latvia; Lithuania; Poland; Romania; Slovak
Republic; and Slovenia. Western Balkan: Albania; Bosnia and Herzegovina; Croatia; Kosovo; FYR
Macedonia; Montenegro; and Serbia.
FORMER YUGOSLAV REPUBLIC OF MACEDONIA
INTERNATIONAL MONETARY FUND 13
technologies to the private sector. Brain drain, particularly in technical and engineering occupations,
remains a major concern for the private sector and the scientific community.
E. Policy Lessons and Recommendations
19. FYR Macedonia’s strategic policy choices have borne fruit but not without costs. Tax
breaks and other incentives have attracted FDI, mostly in the tradable sector, leading to the
re-orientation of exports towards technology-intensive products, hence allowing for significant
market share gains and a strong contribution of exports to growth. This has also generated
employment. While an overall cost-benefit assessment remains to be done, this low tax environment
has contributed to a decline in revenues as a share of GDP and rising public sector indebtedness.
20. The climb ahead would be more challenging. Two issues signal the need for structural
reforms going forward. First, the room for fiscal incentives appears largely exhausted in light of low
revenue levels, including when compared with other emerging European countries which also
provide fiscal incentives to foreign investors. Hence, attracting additional FDI in the tradable sector
would require improvements in fundamentals such as labor skills and infrastructure. Second, further
reforms are needed to ease the operating environment for domestic private firms so as to
strengthen backward and forward linkages with foreign firms.
Easing access of the domestic corporate sector to formal finance remains critical. High
collateral requirement by banks is a problem for business development. Banks tend to not
lend on the basis of business models and cash flow projections, but rather based on physical
assets that can be pledged. Uneasy access to finance compounds the financial situation of
the private sector. Policy priorities to help alleviate this problem include addressing crisis
legacies of bad debts, and shortenings payment delays in the economy so as to ease
domestic firms’ liquidity constraints.
Boosting higher education and skills would help lift a major constraint. The significant
emigration of highly educated citizens holds back output potential. Replenishing the pool of
lost skills by ensuring attendance at, and high standards of, local schools and universities
would be critical. Technical and managerial skills such as business planning are key factors of
a country’s integration into global supply chains. A more systematic negotiation of
knowledge exchange and learning programs with incoming foreign investors would also
help.
Improving infrastructure is needed to improve connectivity with trading partners. The
scaling-up of public infrastructure, notably in the transport sector, is a welcome
development—provided it is assessed in a cost-benefit investment framework and remains
consistent with sustainable levels of public debt (see the next chapter: “FYR Macedonia:
Fiscal Rules To Ensure Sustainability”).
FORMER YUGOSLAV REPUBLIC OF MACEDONIA
14 INTERNATIONAL MONETARY FUND
Box 1. Indicators of Export Performance—Some Definitions
Export diversification by product or by partner is measured by the Theil index. The Theil index is a
statistics commonly used to measure inequality, which computes the ‘distance’ between some parameter
values and an ‘ideal’ egalitarian state where they would be the same for each member of a given
population—akin to alternative measures such as the Gini coefficient. Its formula is given by:
Where x is the parameter of interest (in this paper, the value of export lines or the relative importance of
export partners) and N is the total number of population members. A further decomposition of the index
allows to distinguish an intensive margin that reflects the degree of inequality prevailing between the shares of
existing parameter values (in our case, the value of active export lines or the importance of active trade
partners), and an extensive margin that reflects the increase in the number of parameter values (in our case, a
rising number of active export lines or of trading partners). In all cases, the higher the index, the more
concentrated the distribution of the parameter across the population, so that declining trends are indicative of
greater diversification. Thus, an increased dispersion in the value of already exported good categories would
be reflected in a decline in the intensive margin, while the addition of new categories to the exported
production would be indicated by a decline in the extensive margin; both developments would result in a
decrease of the overall index, pointing to increased diversification.
Export quality indexes are calculated as unit values adjusted for differences in production costs and for
the selection bias stemming from relative distance. Relying on an enriched version of the COMTRADE
database over the period 1962–2010, country-specific quality indexes are computed in three steps by Henn,
Papageorgiou and Spatafora (2013). First, unit values, i.e., the average trade prices for each product category
taken as a proxy for export quality, are regressed on some measure of unobservable quality, exporter income
per capita taken as a proxy for production costs, and distance between importers and exporters. Second, an
augmented gravity equation is estimated for each product line, where the exporter-specific quality parameter
estimated above interacted with the importer’s income per capita enters as an explanatory factor of import
quality, further to distance, and importer and exporter fixed effects. Third, the regression results are used to
calculate quality estimates for each product line. The indicator is available at different product classification
levels, with higher values indicating higher quality levels. The indicator of room for quality improvement can
subsequently be computed by reference to the average quality absorbed by a country’s importers. It is
important to note that the methodology improves on, but still relies on, unit values as an—imperfect—proxy
for export quality, thus reflecting the price valuation of goods on export markets rather than their ‘intrinsic’
characteristics.
Revealed comparative advantages measure the relative comparative advantages of countries for
various export lines as evidenced by trade flows. The index is constructed as the proportion of an export
product line in a country’s total exports to a specific destination country (in this paper, the EU) relative to the
average share of the same product line in the total exports to this destination country. A comparative
advantage is revealed ex post by trade flows if the index is above unity.
FORMER YUGOSLAV REPUBLIC OF MACEDONIA
INTERNATIONAL MONETARY FUND 15
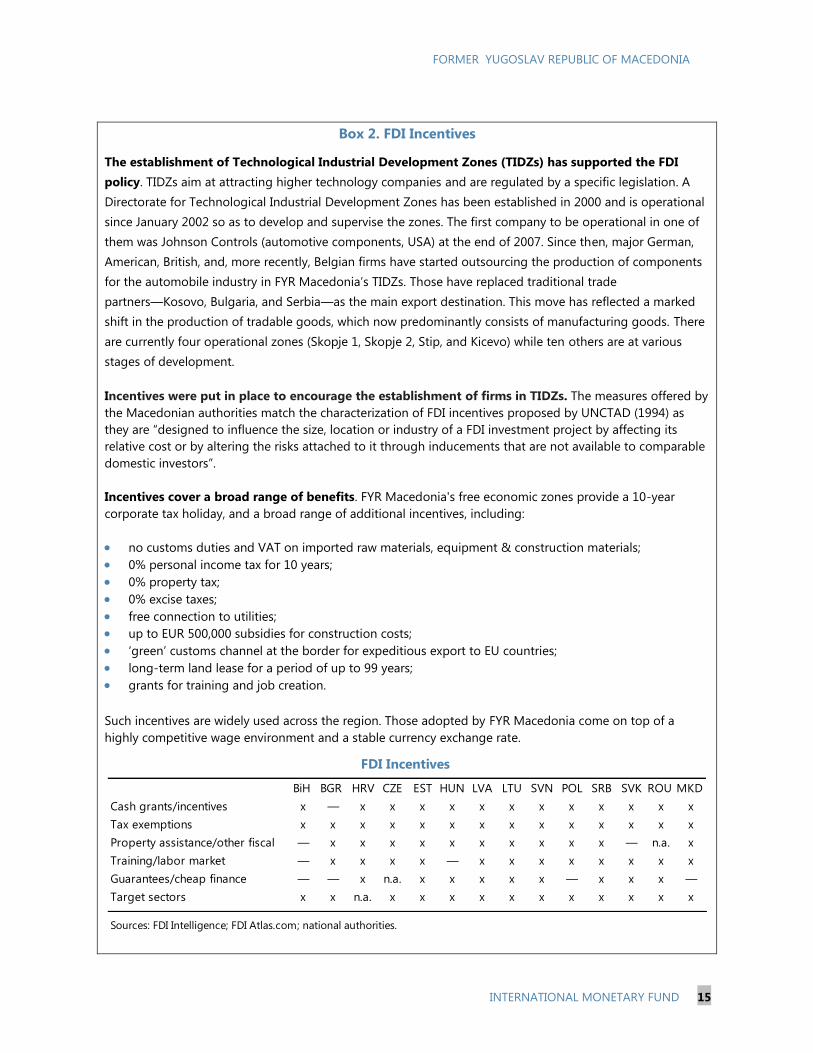
Box 2. FDI Incentives
The establishment of Technological Industrial Development Zones (TIDZs) has supported the FDI
policy. TIDZs aim at attracting higher technology companies and are regulated by a specific legislation. A
Directorate for Technological Industrial Development Zones has been established in 2000 and is operational
since January 2002 so as to develop and supervise the zones. The first company to be operational in one of
them was Johnson Controls (automotive components, USA) at the end of 2007. Since then, major German,
American, British, and, more recently, Belgian firms have started outsourcing the production of components
for the automobile industry in FYR Macedonia’s TIDZs. Those have replaced traditional trade
partners—Kosovo, Bulgaria, and Serbia—as the main export destination. This move has reflected a marked
shift in the production of tradable goods, which now predominantly consists of manufacturing goods. There
are currently four operational zones (Skopje 1, Skopje 2, Stip, and Kicevo) while ten others are at various
stages of development.
Incentives were put in place to encourage the establishment of firms in TIDZs. The measures offered by
the Macedonian authorities match the characterization of FDI incentives proposed by UNCTAD (1994) as
they are “designed to influence the size, location or industry of a FDI investment project by affecting its
relative cost or by altering the risks attached to it through inducements that are not available to comparable
domestic investors”.
Incentives cover a broad range of benefits. FYR Macedonia's free economic zones provide a 10-year
corporate tax holiday, and a broad range of additional incentives, including:
no customs duties and VAT on imported raw materials, equipment & construction materials;
0% personal income tax for 10 years;
0% property tax;
0% excise taxes;
free connection to utilities;
up to EUR 500,000 subsidies for construction costs;
‘green’ customs channel at the border for expeditious export to EU countries;
long-term land lease for a period of up to 99 years;
grants for training and job creation.
Such incentives are widely used across the region. Those adopted by FYR Macedonia come on top of a
highly competitive wage environment and a stable currency exchange rate.
BiH BGR HRV CZE EST HUN LVA LTU SVN POL SRB SVK ROU MKD
Cash grants/incentives x ― x x x x x x x x x x x x
Tax exemptions x x x x x x x x x x x x x x
Property assistance/other fiscal ― x x x x x x x x x x ― n.a. x
Training/labor market ― x x x x ― x x x x x x x x
Guarantees/cheap finance ― ― x n.a. x x x x x ― x x x ―
Target sectors x x n.a. x x x x x x x x x x x
Sources: FDI Intelligence; FDI Atlas.com; national authorities.
FDI Incentives
FORMER YUGOSLAV REPUBLIC OF MACEDONIA
16 INTERNATIONAL MONETARY FUND
Box 3. Fostering Backward/Forward Linkages: Successes and Pitfalls
Slovak Republic
The integration of Slovakia into the global supply chains (GSCs) has been exemplary.1 The degree of
openness of the economy, as measured by the sum of exports and imports of goods as a percent of GDP, has
grown steadily from around 100 percent at the end of the 1990s to more than 170 percent in 2014. This
expansion was supported by significant inflows of FDI and went hand in hand with a growing participation of
the Slovak economy in GSCs. The share of foreign inputs and domestically-produced inputs used in other
countries’ exports, which is a measure of a country’s participation in GSCs, increased from 50 percent in 1995
to 63 percent before the large trade collapse of 2008. Slovakia ranks second among OECD economies in
terms of being integrated into GSCs. The country’s participation in GSCs significantly changed the structure
of its exports, which shifted toward more knowledge-intensive sectors. For example, in the early 1990s,
Slovakia showed no revealed comparative advantage (RCA) in the transportation and electronic sectors,
which only started to emerge in 2007. Slovakia’s business cycle (exports and GDP) has become increasingly
synchronized with Germany’s: foreign value added from Germany in Slovakia’s exports has increased from
5 percent in 1995 to 9 percent in 2008. Moreover, about one-fourth of Slovakia’s exports to Germany are
re-exported to third countries.
Strong productivity growth and wage moderation played a critical role in Slovakia’s success. Triggered
by FDI, productivity growth has been generated by the migration of the workforce from agriculture to
high-growth manufacturing and services. Simultaneously, wages remained relatively lower than in other UE
countries, even when adjusted for differences in productivity. This advantage was combined with the
proximity of export markets, a favorable tax and business environment, and a qualified workforce having
expertise in the automobile industry.
The Dominican Republic
The Dominican Republic (DR) successfully established special economic zones (SEZs), but generated
weak backward linkages. With a program ongoing for more than 40 years, the country hosts world-class
special economic zones and industrial parks that attract investment in manufacturing or outsource
business-processing services. DR’s SEZ’s initially mostly established in the textile sector fuelled economic
growth during the 1990s. They were hit by the expiration of trade preferences in textiles in the 2000s, and
somewhat diversified. Based on WB-IFC Enterprise Surveys, Sanchez-Martin et al. (2015) find that
foreign-owned firms have traditionally developed few backward linkages with the rest of the economy.
Lessons to better integrate FDI and domestic firms. The authors suggest that the enabling environment
that has helped develop successful SEZs should also be implemented outside the zones. They recommend to
ease the business climate and to improve connectivity with the zones, including through the removal of
hurdles to trade with firms established in the zones. The study also highlights the risk of a migration of
domestic firms into SEZs, which entails potential high fiscal costs. It finally underlines the value of investing
in human resources so as to match the needs of foreign companies, especially those that produce
increasingly complex manufacturing processes beyond assembling activities. Absent such policies, domestic
exporters are likely to be confined to selling low value-added traditional products, while the more
sophisticated transformation processes take place in the special zones, thus reinforcing a dual economy with
limited positive externalities to domestic companies.
____________________ 1 This country case is analyzed in Slovak Republic, IMF Country Report No. 13/262, Box 2. See also IMF Country Report
No. 13/263 “The German-Central European Supply Chain—Cluster Report”.
FORMER YUGOSLAV REPUBLIC OF MACEDONIA
INTERNATIONAL MONETARY FUND 17
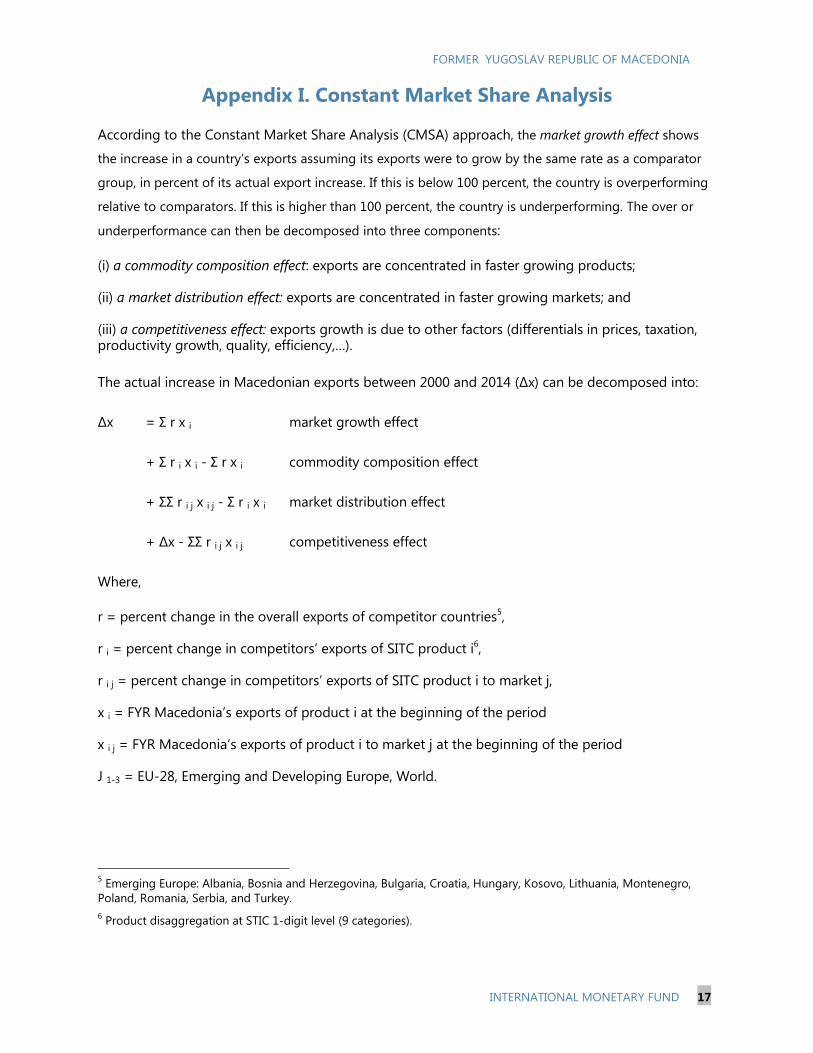
Appendix I. Constant Market Share Analysis
According to the Constant Market Share Analysis (CMSA) approach, the market growth effect shows
the increase in a country’s exports assuming its exports were to grow by the same rate as a comparator
group, in percent of its actual export increase. If this is below 100 percent, the country is overperforming
relative to comparators. If this is higher than 100 percent, the country is underperforming. The over or
underperformance can then be decomposed into three components:
(i) a commodity composition effect: exports are concentrated in faster growing products;
(ii) a market distribution effect: exports are concentrated in faster growing markets; and
(iii) a competitiveness effect: exports growth is due to other factors (differentials in prices, taxation, productivity growth, quality, efficiency,…).
The actual increase in Macedonian exports between 2000 and 2014 (Δx) can be decomposed into:
Δx = Σ r x i market growth effect
+ Σ r i x i - Σ r x i commodity composition effect
+ ΣΣ r i j x i j - Σ r i x i market distribution effect
+ Δx - ΣΣ r i j x i j competitiveness effect
Where,
r = percent change in the overall exports of competitor countries5,
r i = percent change in competitors’ exports of SITC product i6,
r i j = percent change in competitors’ exports of SITC product i to market j,
x i = FYR Macedonia’s exports of product i at the beginning of the period
x i j = FYR Macedonia’s exports of product i to market j at the beginning of the period
J 1-3 = EU-28, Emerging and Developing Europe, World.
5 Emerging Europe: Albania, Bosnia and Herzegovina, Bulgaria, Croatia, Hungary, Kosovo, Lithuania, Montenegro,
Poland, Romania, Serbia, and Turkey.
6 Product disaggregation at STIC 1-digit level (9 categories).
FO
RM
ER
YU
GO
SLA
V R
EP
UB
LIC O
F M
AC
ED
ON
IA
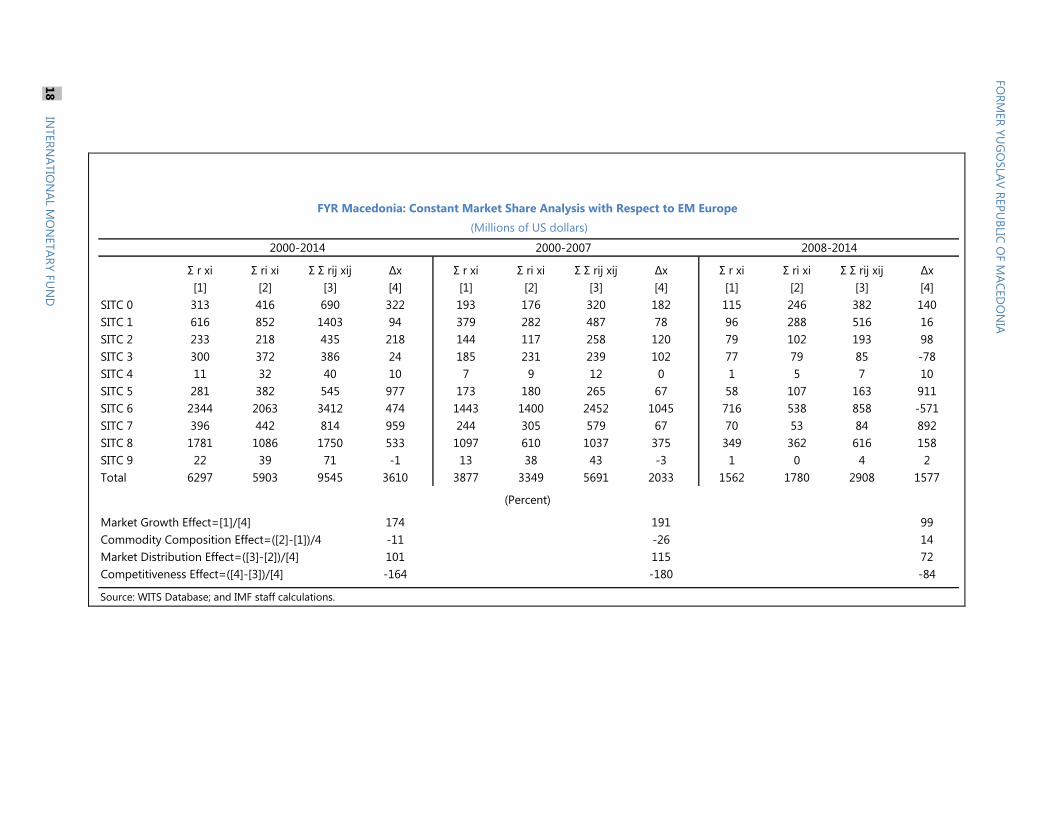
Σ r xi Σ ri xi Σ Σ rij xij Δx Σ r xi Σ ri xi Σ Σ rij xij Δx Σ r xi Σ ri xi Σ Σ rij xij Δx
[1] [2] [3] [4] [1] [2] [3] [4] [1] [2] [3] [4]
SITC 0 313 416 690 322 193 176 320 182 115 246 382 140
SITC 1 616 852 1403 94 379 282 487 78 96 288 516 16
SITC 2 233 218 435 218 144 117 258 120 79 102 193 98
SITC 3 300 372 386 24 185 231 239 102 77 79 85 -78
SITC 4 11 32 40 10 7 9 12 0 1 5 7 10
SITC 5 281 382 545 977 173 180 265 67 58 107 163 911
SITC 6 2344 2063 3412 474 1443 1400 2452 1045 716 538 858 -571
SITC 7 396 442 814 959 244 305 579 67 70 53 84 892
SITC 8 1781 1086 1750 533 1097 610 1037 375 349 362 616 158
SITC 9 22 39 71 -1 13 38 43 -3 1 0 4 2
Total 6297 5903 9545 3610 3877 3349 5691 2033 1562 1780 2908 1577
Market Growth Effect=[1]/[4] 174 191 99
Commodity Composition Effect=([2]-[1])/4 -11 -26 14
Market Distribution Effect=([3]-[2])/[4] 101 115 72
Competitiveness Effect=([4]-[3])/[4] -164 -180 -84
Source: WITS Database; and IMF staff calculations.
(Millions of US dollars)
2000-2014 2000-2007 2008-2014
FYR Macedonia: Constant Market Share Analysis with Respect to EM Europe
(Percent)
FO
RM
ER
YU
GO
SLA
V R
EP
UB
LIC O
F M
AC
ED
ON
IA
18
IN
TER
NA
TIO
NA
L MO
NETA
RY F
UN
D
FORMER YUGOSLAV REPUBLIC OF MACEDONIA
INTERNATIONAL MONETARY FUND 19
References
Cadot, O., C. Carrere, and V. Strauss-Kahn, 2011a, “Export Diversification: What’s Behind the Hump?”, The Review of Economics and Statistics, 93(2), pp.590–605, May.
———,2011b, “Trade diversification, Income, and Growth: What Do We Know? FERDI Working Papers 33, November.
European Bank for Reconstruction and Development, 2014, Transition Report (London: European Bank for Reconstruction and Development).
Edwards, S., 1993, “Openness, Trade Liberalization, and Growth in Developing Countries”, Journal of Economic Literature, Vol.31, No.3, pp.1358–1393, September.
Gutierrez, E., 2006, “Export Performance and External Competitiveness in the Former Yugoslav Republic of Macedonia”, IMF Working Paper 06/261 (Washington, D.C.).
Hausmann, R., J. Hwang, and D. Rodrik, 2005, “What you export matters”, NBER Working Paper 11905, December (Cambridge, MA).
Henn, C., C. Papageorgiou, and N. Spatafora, 2013, “Export Quality in Developing Countries”, IMF Working Paper 13/108, (Washington, D.C.).
International Monetary Fund, 2013, “Slovak Republic, 2013 Article IV Consultation”, IMF Country Report No. 13/262 (Washington, D.C.: International Monetary Fund).
———, 2013, “German-Central European Supply Chain—Cluster Report,” IMF Country Report No. 13/263 (Washington, D.C.: International Monetary Fund).
———, 2015a, “Central and Eastern Europe: New Member States (NMS) Policy Forum, 2014, Staff report on Cluster Consultations—Common Policy Frameworks and Challenges,” IMF Country Report No. 15/97 (Washington, D.C.: International Monetary Fund).
———,2015b, “Regional Economic Issues Special Report, The Western Balkans: 15 years of Economic Transition,” March (Washington, D.C.: International Monetary Fund).
Kovtun, D., A. Meyer Cirkel, Z. Murgasova, D. Smith, and S. Tambunlertchai, 2014, “Boosting Job Growth in the Western Balkans”, IMF Working Paper 14/16 (Washington, D.C.: International Monetary Fund).
Organization for Economic Co-operation and Development, 2008, “Defining and Strengthening Sector Specific Sources of Competitiveness in the Western Balkans―Recommendation for a Regional Strategy”, (Paris: OECD).
———,2013, “Trade in Intermediate Goods and International Supply Chains in CEFTA,” CEFTA Issues Paper 6.
Orszaghova, L., L. Savelin, and W. Shudel, 2013, “External Competitiveness of EU Candidate Countries,” ECB Occasional Paper 141 (Frankfurt: European Central Bank).
FORMER YUGOSLAV REPUBLIC OF MACEDONIA
20 INTERNATIONAL MONETARY FUND
Rahman, J., and T. Zhao, 2013, “Export Performance in Europe: What Do We Know from Supply Links?”, IMF Working Paper 13/62 (Washington, D.C.: International Monetary Fund).
Sánchez-Martin, M. E., J. De Piniés, and A. Kássia, 2015, “Measuring the Determinants of Backward Linkages from FDI in Developing Economies. Is It a Matter of Size?” World Bank Policy Research Working Paper 7185 (Washington, D.C.: World Bank).
Tuomi, K., 2012, “Review of Investment Incentives, Best Practice in Attracting Investment,” International Growth Center Working Paper (London).
United Nations Conference on Trade and Development (UNCTAD), 2012a, Investment Policy Review―The Former Yugoslav Republic of Macedonia (New York and Geneva).
———,2012b, “Towards a New Generation of Investment Policies”, World Investment Report 2012 (New York and Geneva).
———,2014, “Investing in the SDGs: An Action Plan”, World Investment Report 2014 (New York and Geneva).
World Bank, 2013a, “Western Balkans Regional R&D Strategy for Innovation”, World Bank Technical Assistance Project (P123211), Country Paper Series: Former Yugoslav Republic of Macedonia (Washington, D.C.: World Bank).
———,2013b, Global Financial Development Report 2014: Financial Inclusion (Washington, D.C.: World Bank).
———,2014, Second Programmatic Competitiveness Development Policy Operation―The Former Yugoslav Republic of Macedonia, Report No. 80756–MK (Washington, D.C.: World Bank).
———,2015, “How to sustain export dynamism by reducing duality in the Dominican Republic”, Dominican Republic Trade Competitiveness Diagnostic, Report No: AUS6804 (Washington, D.C.: World Bank).
FORMER YUGOSLAV REPUBLIC OF MACEDONIA
INTERNATIONAL MONETARY FUND 21
FISCAL RULES TO ENSURE SUSTAINABILITY 1
The public debt of FYR Macedonia has almost doubled since 2008 and is projected to reach
54 percent of GDP by 2020. While not excessively alarming, such level of public debt is elevated for a
country like FYR Macedonia, where fiscal policy serves as the main macroeconomic policy tool, a
significant part of public debt carries FX risks and long-term spending pressures are considerable.
Against this backdrop, the authorities’ intention to entrench fiscal sustainability using fiscal rules is a
step in the right direction.
This paper argues that the proposed debt ceiling at 60 percent of GDP is too high in the case of FYR
Macedonia and recommends a lower debt ceiling of 50 percent of GDP to ensure adequate fiscal
space. For this outcome, an upfront consolidation would be needed to reduce fiscal deficit to below
3 percent of GDP by 2017 in line with the authorities’ Medium-term Fiscal Strategy (MTFS) and
pursuing a primary balance path that would stabilize public debt by 2018.
In light of FYR Macedonia’s high infrastructure needs, an alternative to a lower operational threshold
could be combining a higher debt cap with debt brakes mechanism. While the higher debt limit
would be justified by the needed investment in infrastructure, any scaling up of public infrastructure
investment should be accompanied by measures to strengthen public investment management:
notably clear and transparent procedures to assess, prioritize, and monitor public investment projects.
Finally, given that effective implementation of fiscal rule requires supporting institutions in public
finance management, the paper recommends: (i) further development of the MTFS so that it can
more effectively guide the budget preparation process; (ii) enforcement of strict expenditure controls
as well as implementation of effective cash and debt management to ensure that the budget is
executed as planned; (iii) increased robustness of macroeconomic projections to prevent revenue
over-optimism; and (iv) strengthening both ex-ante and ex-post independent scrutiny including the
eventual establishment of a fiscal council.
A. Context
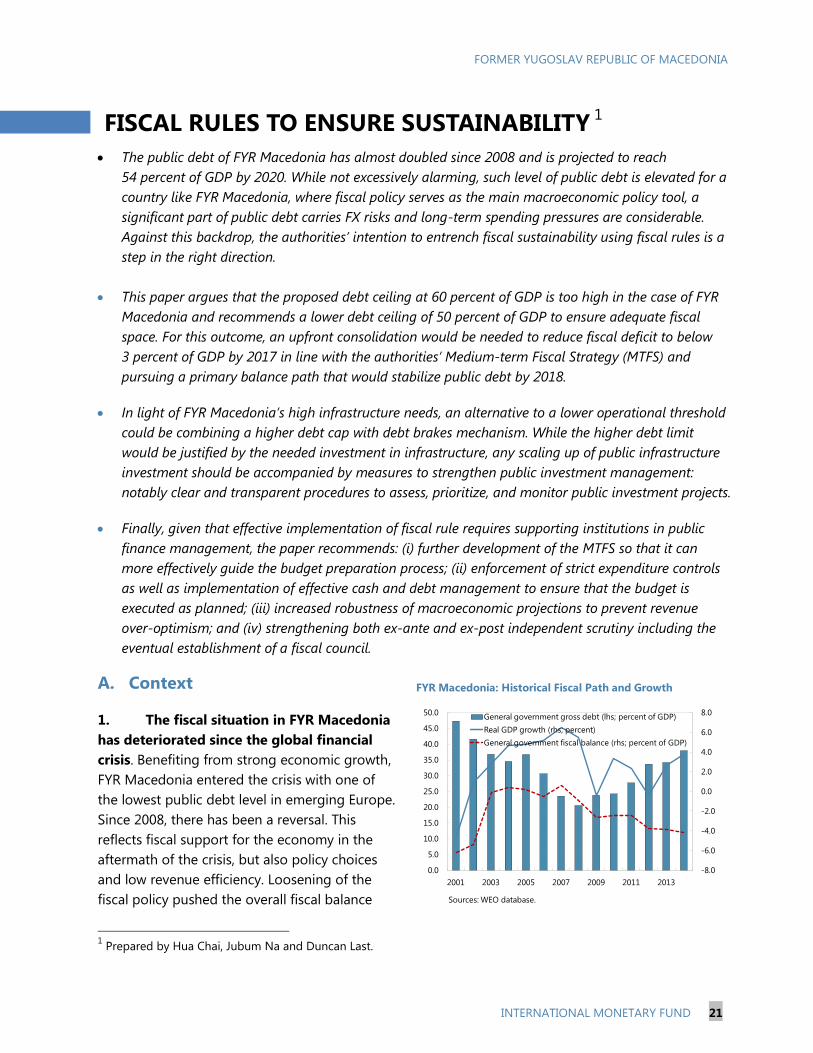
1. The fiscal situation in FYR Macedonia
has deteriorated since the global financial
crisis. Benefiting from strong economic growth,
FYR Macedonia entered the crisis with one of
the lowest public debt level in emerging Europe.
Since 2008, there has been a reversal. This
reflects fiscal support for the economy in the
aftermath of the crisis, but also policy choices
and low revenue efficiency. Loosening of the
fiscal policy pushed the overall fiscal balance
1 Prepared by Hua Chai, Jubum Na and Duncan Last.
-8.0
-6.0
-4.0
-2.0
0.0
2.0
4.0
6.0
8.0
0.0
5.0
10.0
15.0
20.0
25.0
30.0
35.0
40.0
45.0
50.0
2001 2003 2005 2007 2009 2011 2013
General government gross debt (lhs; percent of GDP)
Real GDP growth (rhs; percent)
General government fiscal balance (rhs; percent of GDP)
Sources: WEO database.
FYR Macedonia: Historical Fiscal Path and Growth
FORMER YUGOSLAV REPUBLIC OF MACEDONIA
22 INTERNATIONAL MONETARY FUND
into a deficit of 0.9 percent of GDP by end-2008 and the overall deficit increased to 2.5 percent of
GDP in 2011. The government’s renewed stimulus beginning in 2012 steadily increased the fiscal
deficit to 4.2 percent by 2014. As a result, public debt has risen from 23 percent of GDP in 2008, to
30 percent of GDP in 2011, and further to 44 percent in 2014. The projected debt path in the absence
of adequate measures shows that public debt would continue trending upward and reach 54 percent
of GDP by 2020.
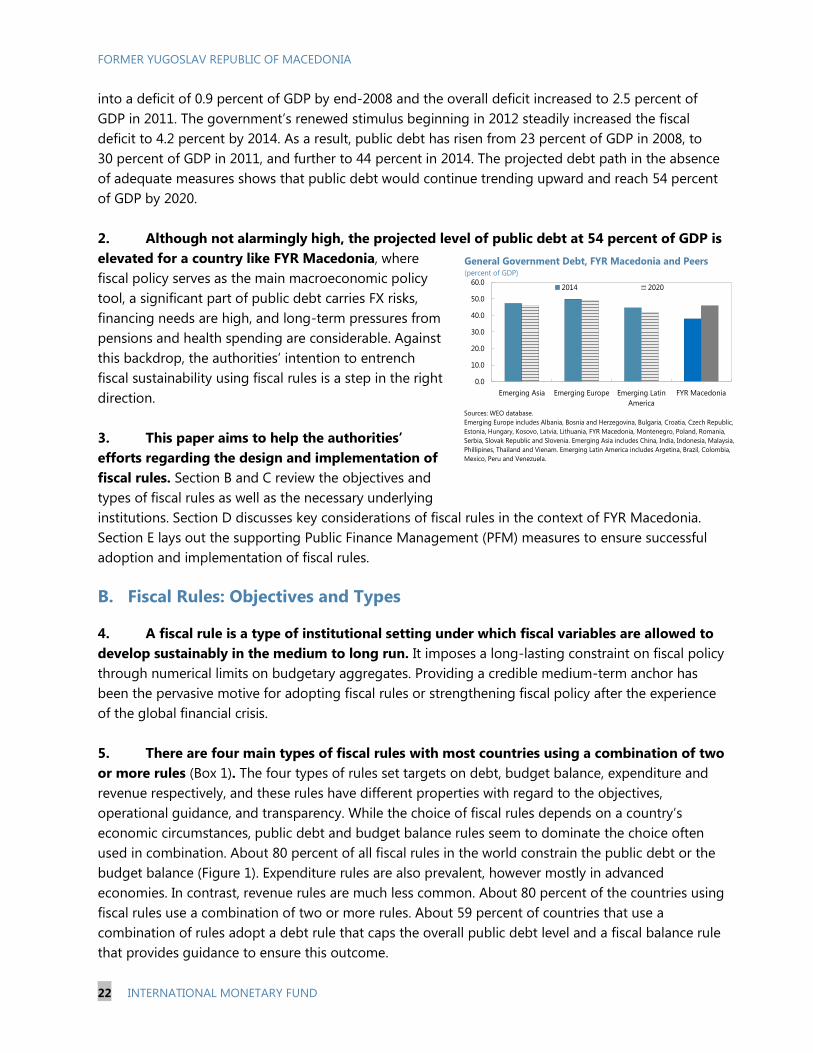
2. Although not alarmingly high, the projected level of public debt at 54 percent of GDP is
elevated for a country like FYR Macedonia, where
fiscal policy serves as the main macroeconomic policy
tool, a significant part of public debt carries FX risks,
financing needs are high, and long-term pressures from
pensions and health spending are considerable. Against
this backdrop, the authorities’ intention to entrench
fiscal sustainability using fiscal rules is a step in the right
direction.
3. This paper aims to help the authorities’
efforts regarding the design and implementation of
fiscal rules. Section B and C review the objectives and
types of fiscal rules as well as the necessary underlying
institutions. Section D discusses key considerations of fiscal rules in the context of FYR Macedonia.
Section E lays out the supporting Public Finance Management (PFM) measures to ensure successful
adoption and implementation of fiscal rules.
B. Fiscal Rules: Objectives and Types
4. A fiscal rule is a type of institutional setting under which fiscal variables are allowed to
develop sustainably in the medium to long run. It imposes a long-lasting constraint on fiscal policy
through numerical limits on budgetary aggregates. Providing a credible medium-term anchor has
been the pervasive motive for adopting fiscal rules or strengthening fiscal policy after the experience
of the global financial crisis.
5. There are four main types of fiscal rules with most countries using a combination of two
or more rules (Box 1). The four types of rules set targets on debt, budget balance, expenditure and
revenue respectively, and these rules have different properties with regard to the objectives,
operational guidance, and transparency. While the choice of fiscal rules depends on a country’s
economic circumstances, public debt and budget balance rules seem to dominate the choice often
used in combination. About 80 percent of all fiscal rules in the world constrain the public debt or the
budget balance (Figure 1). Expenditure rules are also prevalent, however mostly in advanced
economies. In contrast, revenue rules are much less common. About 80 percent of the countries using
fiscal rules use a combination of two or more rules. About 59 percent of countries that use a
combination of rules adopt a debt rule that caps the overall public debt level and a fiscal balance rule
that provides guidance to ensure this outcome.
0.0
10.0
20.0
30.0
40.0
50.0
60.0
Emerging Asia Emerging Europe Emerging Latin
America
FYR Macedonia
2014 2020
General Government Debt, FYR Macedonia and Peers (percent of GDP)
Sources: WEO database.
Emerging Europe includes Albania, Bosnia and Herzegovina, Bulgaria, Croatia, Czech Republic,
Estonia, Hungary, Kosovo, Latvia, Lithuania, FYR Macedonia, Montenegro, Poland, Romania,
Serbia, Slovak Republic and Slovenia. Emerging Asia includes China, India, Indonesia, Malaysia,
Phillipines, Thailand and Vienam. Emerging Latin America includes Argetina, Brazil, Colombia,
Mexico, Peru and Venezuela.
FORMER YUGOSLAV REPUBLIC OF MACEDONIA
INTERNATIONAL MONETARY FUND 23
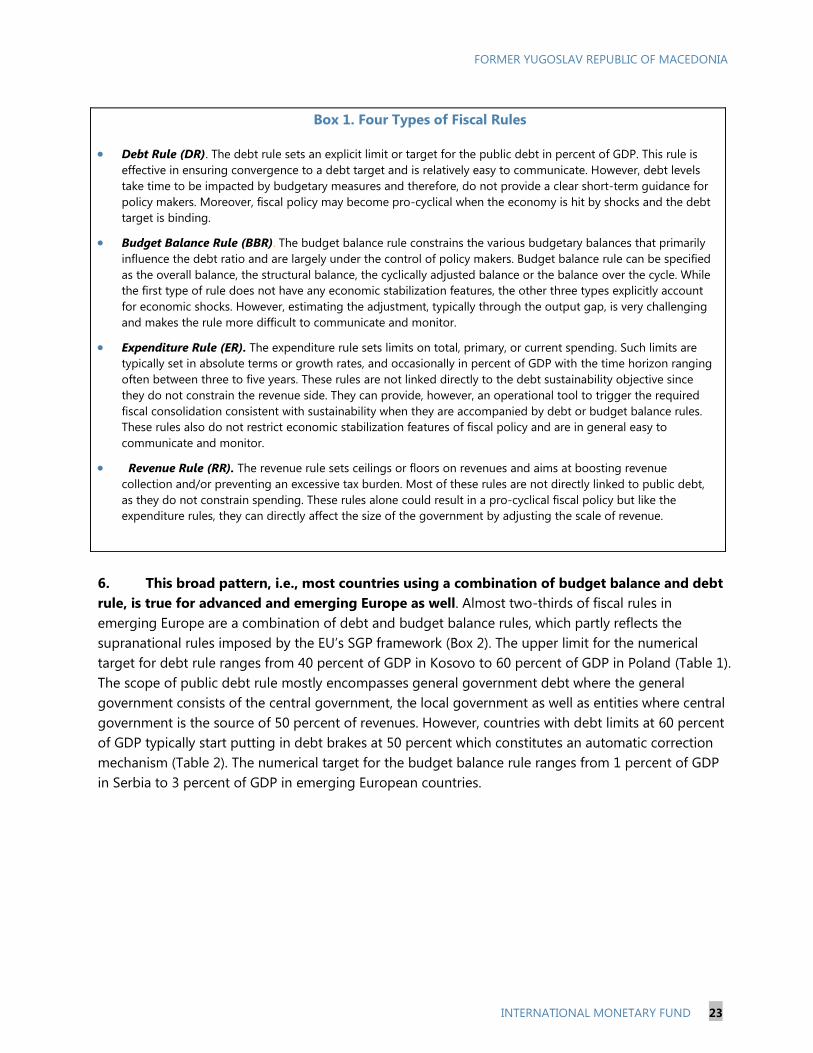
Box 1. Four Types of Fiscal Rules
Debt Rule (DR). The debt rule sets an explicit limit or target for the public debt in percent of GDP. This rule is
effective in ensuring convergence to a debt target and is relatively easy to communicate. However, debt levels
take time to be impacted by budgetary measures and therefore, do not provide a clear short-term guidance for
policy makers. Moreover, fiscal policy may become pro-cyclical when the economy is hit by shocks and the debt
target is binding.
Budget Balance Rule (BBR). The budget balance rule constrains the various budgetary balances that primarily
influence the debt ratio and are largely under the control of policy makers. Budget balance rule can be specified
as the overall balance, the structural balance, the cyclically adjusted balance or the balance over the cycle. While
the first type of rule does not have any economic stabilization features, the other three types explicitly account
for economic shocks. However, estimating the adjustment, typically through the output gap, is very challenging
and makes the rule more difficult to communicate and monitor.
Expenditure Rule (ER). The expenditure rule sets limits on total, primary, or current spending. Such limits are
typically set in absolute terms or growth rates, and occasionally in percent of GDP with the time horizon ranging
often between three to five years. These rules are not linked directly to the debt sustainability objective since
they do not constrain the revenue side. They can provide, however, an operational tool to trigger the required
fiscal consolidation consistent with sustainability when they are accompanied by debt or budget balance rules.
These rules also do not restrict economic stabilization features of fiscal policy and are in general easy to
communicate and monitor.
Revenue Rule (RR). The revenue rule sets ceilings or floors on revenues and aims at boosting revenue
collection and/or preventing an excessive tax burden. Most of these rules are not directly linked to public debt,
as they do not constrain spending. These rules alone could result in a pro-cyclical fiscal policy but like the
expenditure rules, they can directly affect the size of the government by adjusting the scale of revenue.
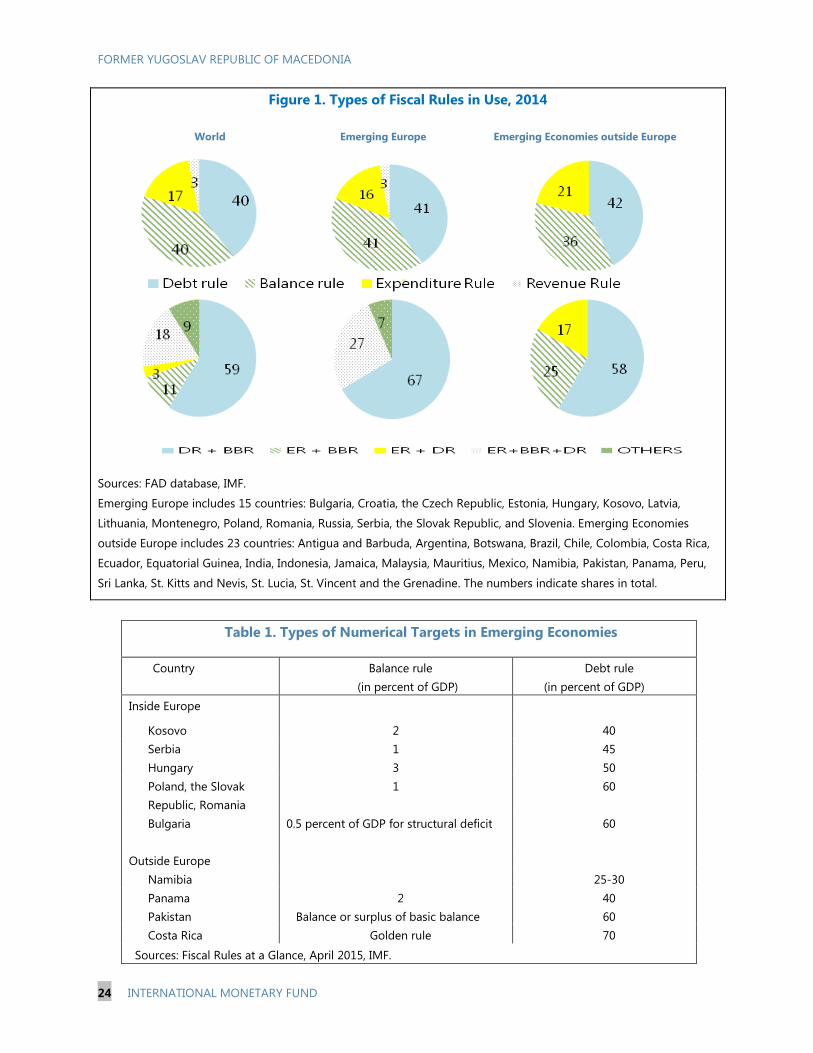
6. This broad pattern, i.e., most countries using a combination of budget balance and debt
rule, is true for advanced and emerging Europe as well. Almost two-thirds of fiscal rules in
emerging Europe are a combination of debt and budget balance rules, which partly reflects the
supranational rules imposed by the EU’s SGP framework (Box 2). The upper limit for the numerical
target for debt rule ranges from 40 percent of GDP in Kosovo to 60 percent of GDP in Poland (Table 1).
The scope of public debt rule mostly encompasses general government debt where the general
government consists of the central government, the local government as well as entities where central
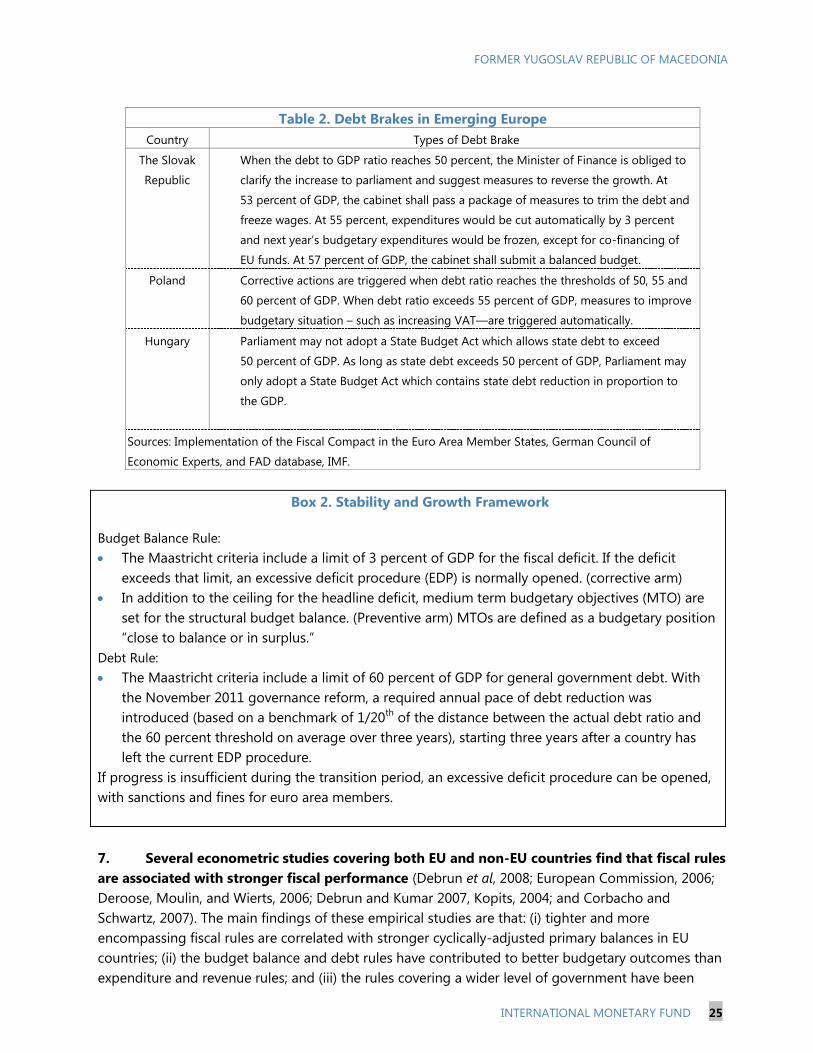
government is the source of 50 percent of revenues. However, countries with debt limits at 60 percent
of GDP typically start putting in debt brakes at 50 percent which constitutes an automatic correction
mechanism (Table 2). The numerical target for the budget balance rule ranges from 1 percent of GDP
in Serbia to 3 percent of GDP in emerging European countries.
FORMER YUGOSLAV REPUBLIC OF MACEDONIA
24 INTERNATIONAL MONETARY FUND
Figure 1. Types of Fiscal Rules in Use, 2014
World Emerging Europe Emerging Economies outside Europe
Sources: FAD database, IMF.
Emerging Europe includes 15 countries: Bulgaria, Croatia, the Czech Republic, Estonia, Hungary, Kosovo, Latvia,
Lithuania, Montenegro, Poland, Romania, Russia, Serbia, the Slovak Republic, and Slovenia. Emerging Economies
outside Europe includes 23 countries: Antigua and Barbuda, Argentina, Botswana, Brazil, Chile, Colombia, Costa Rica,
Ecuador, Equatorial Guinea, India, Indonesia, Jamaica, Malaysia, Mauritius, Mexico, Namibia, Pakistan, Panama, Peru,
Sri Lanka, St. Kitts and Nevis, St. Lucia, St. Vincent and the Grenadine. The numbers indicate shares in total.
Table 1. Types of Numerical Targets in Emerging Economies
Country Balance rule
(in percent of GDP)
Debt rule
(in percent of GDP)
Inside Europe
Kosovo 2 40
Serbia 1 45
Hungary 3 50
Poland, the Slovak
Republic, Romania
1 60
Bulgaria
0.5 percent of GDP for structural deficit
60
Outside Europe
Namibia 25-30
Panama 2 40
Pakistan Balance or surplus of basic balance 60
Costa Rica Golden rule 70
Sources: Fiscal Rules at a Glance, April 2015, IMF.
FORMER YUGOSLAV REPUBLIC OF MACEDONIA
INTERNATIONAL MONETARY FUND 25
Table 2. Debt Brakes in Emerging Europe
Country Types of Debt Brake
The Slovak
Republic
When the debt to GDP ratio reaches 50 percent, the Minister of Finance is obliged to
clarify the increase to parliament and suggest measures to reverse the growth. At
53 percent of GDP, the cabinet shall pass a package of measures to trim the debt and
freeze wages. At 55 percent, expenditures would be cut automatically by 3 percent
and next year’s budgetary expenditures would be frozen, except for co-financing of
EU funds. At 57 percent of GDP, the cabinet shall submit a balanced budget.
Poland Corrective actions are triggered when debt ratio reaches the thresholds of 50, 55 and
60 percent of GDP. When debt ratio exceeds 55 percent of GDP, measures to improve
budgetary situation – such as increasing VAT—are triggered automatically.
Hungary Parliament may not adopt a State Budget Act which allows state debt to exceed
50 percent of GDP. As long as state debt exceeds 50 percent of GDP, Parliament may
only adopt a State Budget Act which contains state debt reduction in proportion to
the GDP.
Sources: Implementation of the Fiscal Compact in the Euro Area Member States, German Council of
Economic Experts, and FAD database, IMF.
Box 2. Stability and Growth Framework
Budget Balance Rule:
The Maastricht criteria include a limit of 3 percent of GDP for the fiscal deficit. If the deficit
exceeds that limit, an excessive deficit procedure (EDP) is normally opened. (corrective arm)
In addition to the ceiling for the headline deficit, medium term budgetary objectives (MTO) are
set for the structural budget balance. (Preventive arm) MTOs are defined as a budgetary position
“close to balance or in surplus.”
Debt Rule:
The Maastricht criteria include a limit of 60 percent of GDP for general government debt. With
the November 2011 governance reform, a required annual pace of debt reduction was
introduced (based on a benchmark of 1/20th
of the distance between the actual debt ratio and
the 60 percent threshold on average over three years), starting three years after a country has
left the current EDP procedure.
If progress is insufficient during the transition period, an excessive deficit procedure can be opened,
with sanctions and fines for euro area members.
7. Several econometric studies covering both EU and non-EU countries find that fiscal rules
are associated with stronger fiscal performance (Debrun et al, 2008; European Commission, 2006;
Deroose, Moulin, and Wierts, 2006; Debrun and Kumar 2007, Kopits, 2004; and Corbacho and
Schwartz, 2007). The main findings of these empirical studies are that: (i) tighter and more
encompassing fiscal rules are correlated with stronger cyclically-adjusted primary balances in EU
countries; (ii) the budget balance and debt rules have contributed to better budgetary outcomes than
expenditure and revenue rules; and (iii) the rules covering a wider level of government have been
FORMER YUGOSLAV REPUBLIC OF MACEDONIA
26 INTERNATIONAL MONETARY FUND
associated with more fiscal discipline. Schaechter et al (2013) find that countries in the top quartile of
fiscal performance have at least two numerical rules in place and share many supporting institutional
features, such as an independent monitoring mechanism to ensure compliance and a broad coverage
encompassing the general government.
C. Fiscal Rules: Underlying Institutions
8. The success of fiscal rules largely depends on institutional settings and checks and
balances underpinning these rules. Typically, a number of institutional settings are put in place to
ensure proper implementation:
Legal basis: Rules enshrined in a higher level of legislation are more difficult to reverse and
therefore tend to be longer lasting since they are more difficult to modify even with a change of
government.
Top-down process: A top-down budgeting process, where the aggregate expenditure limit is
decided before the distribution of expenditures, and medium-term budget frameworks (MTBFs)
are useful to exercise a better control over public expenditure, thereby ensuring adherence to the
rule.
Fiscal Responsibility Law (FRL): Fiscal rules can be supported by FRLs, which typically set out
procedural and transparency responsibilities of the government towards the parliament.
Independent Body: Establishing independent bodies, such as independent fiscal councils, could
further enhance the credibility of fiscal rules. These bodies can provide an independent
assessment of the implementation of fiscal rules.
Enforcement: Enforcement and automatic correction mechanisms are critical to the success of the
fiscal rule. The use of automatic mechanisms to correct past deviations from the rule is a tool that
seeks to prevent deviations leading to a systematic debt buildup.
Escape clause: Escape clauses can provide the flexibility to deal with unforeseen and severe
events. These should clearly specify the circumstances where rules-based fiscal framework can be
temporarily suspended and include a limited range of factors that allow such escape clauses to be
triggered into legislation. There should also be clear guidelines on the interpretation and
determination of events, and the regime that applies in the interim, including specification on the
time path back to the rule.
Data availability: Reliable data availability and technical forecasting capacity is of importance to
ensure credibility, while budget reporting system and timely release of fiscal data are needed to
allow internal and external monitoring of the rule, thereby securing accountability.
9. Over the last decade, fiscal rules have become more comprehensive with a convergence
of design features between advanced and emerging economies. Supporting procedures such as
the monitoring of budget implementation by an independent body have become more widespread in
advanced and emerging economies, particularly after the recent global crisis. Other characteristics
FORMER YUGOSLAV REPUBLIC OF MACEDONIA
INTERNATIONAL MONETARY FUND 27
such as a strong legal basis and formal enforcement procedures have also become more common
across country groups.
D. What Type of Fiscal Rules Makes Sense for FYR Macedonia?
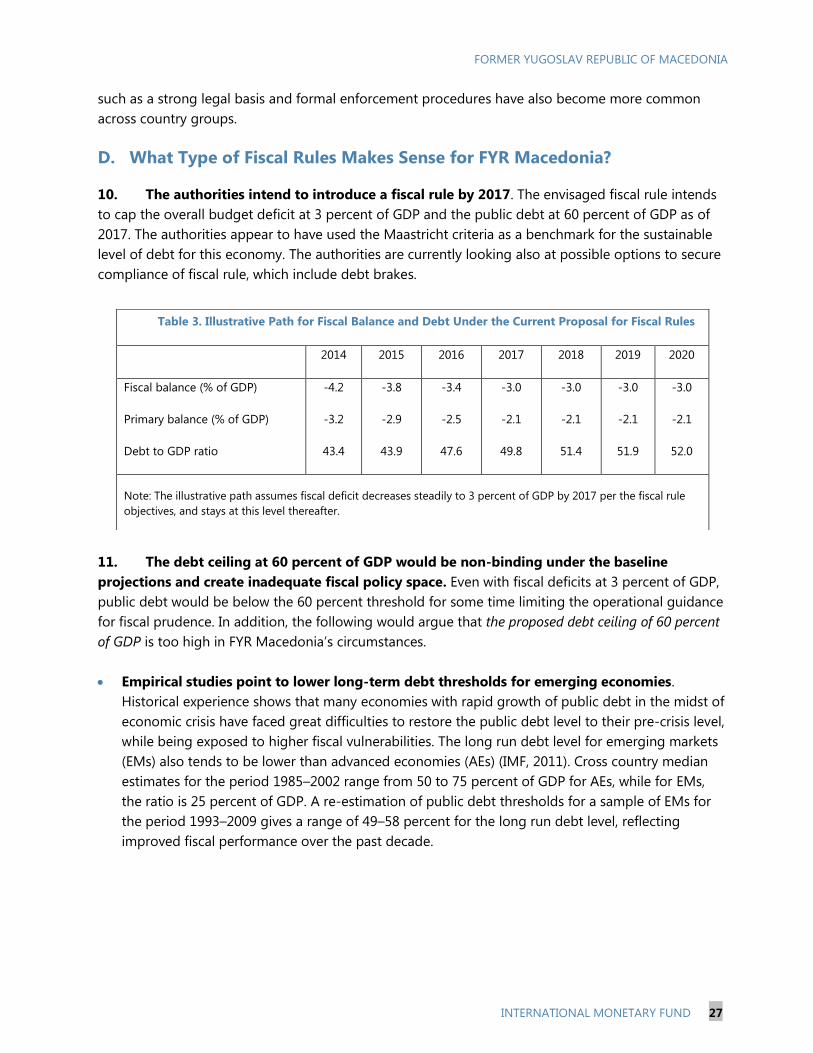
10. The authorities intend to introduce a fiscal rule by 2017. The envisaged fiscal rule intends
to cap the overall budget deficit at 3 percent of GDP and the public debt at 60 percent of GDP as of
2017. The authorities appear to have used the Maastricht criteria as a benchmark for the sustainable
level of debt for this economy. The authorities are currently looking also at possible options to secure
compliance of fiscal rule, which include debt brakes.
11. The debt ceiling at 60 percent of GDP would be non-binding under the baseline
projections and create inadequate fiscal policy space. Even with fiscal deficits at 3 percent of GDP,
public debt would be below the 60 percent threshold for some time limiting the operational guidance
for fiscal prudence. In addition, the following would argue that the proposed debt ceiling of 60 percent
of GDP is too high in FYR Macedonia’s circumstances.
Empirical studies point to lower long-term debt thresholds for emerging economies.
Historical experience shows that many economies with rapid growth of public debt in the midst of
economic crisis have faced great difficulties to restore the public debt level to their pre-crisis level,
while being exposed to higher fiscal vulnerabilities. The long run debt level for emerging markets
(EMs) also tends to be lower than advanced economies (AEs) (IMF, 2011). Cross country median
estimates for the period 1985–2002 range from 50 to 75 percent of GDP for AEs, while for EMs,
the ratio is 25 percent of GDP. A re-estimation of public debt thresholds for a sample of EMs for
the period 1993–2009 gives a range of 49–58 percent for the long run debt level, reflecting
improved fiscal performance over the past decade.
Table 3. Illustrative Path for Fiscal Balance and Debt Under the Current Proposal for Fiscal Rules
2014 2015 2016 2017 2018 2019 2020
Fiscal balance (% of GDP)
Primary balance (% of GDP)
Debt to GDP ratio
-4.2
-3.2
43.4
-3.8
-2.9
43.9
-3.4
-2.5
47.6
-3.0
-2.1
49.8
-3.0
-2.1
51.4
-3.0
-2.1
51.9
-3.0
-2.1
52.0
Note: The illustrative path assumes fiscal deficit decreases steadily to 3 percent of GDP by 2017 per the fiscal rule
objectives, and stays at this level thereafter.
FORMER YUGOSLAV REPUBLIC OF MACEDONIA
28 INTERNATIONAL MONETARY FUND
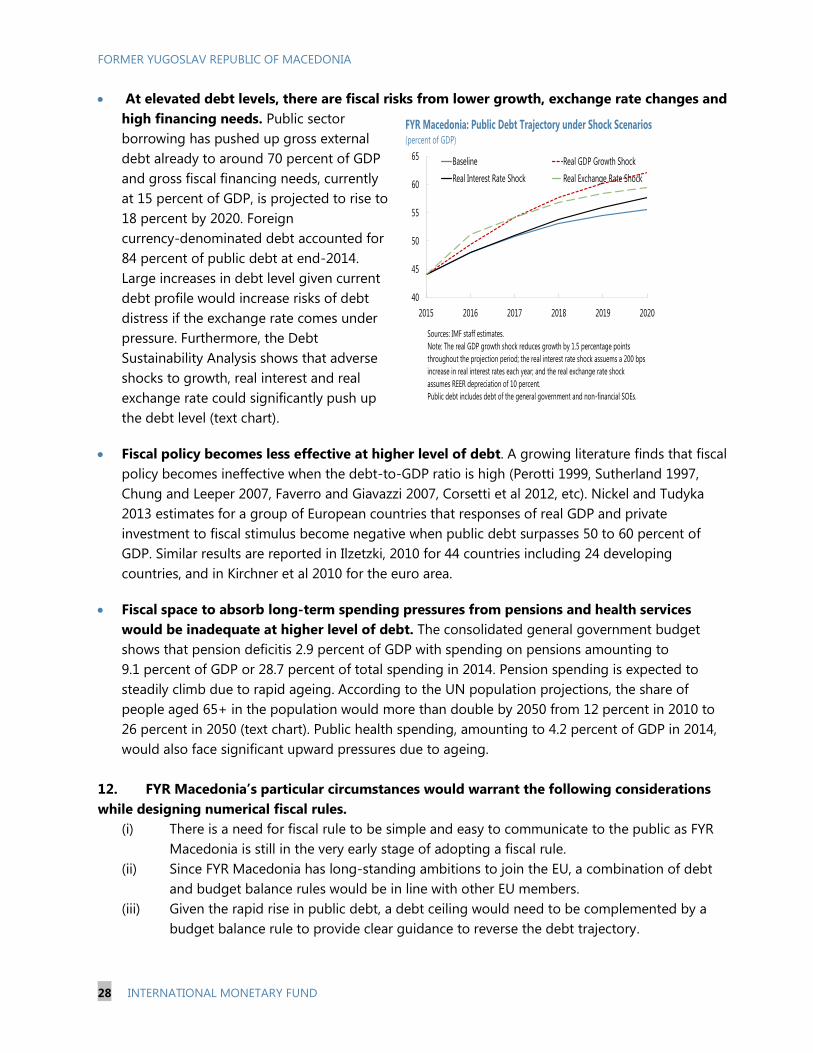
At elevated debt levels, there are fiscal risks from lower growth, exchange rate changes and
high financing needs. Public sector
borrowing has pushed up gross external
debt already to around 70 percent of GDP
and gross fiscal financing needs, currently
at 15 percent of GDP, is projected to rise to
18 percent by 2020. Foreign
currency-denominated debt accounted for
84 percent of public debt at end-2014.
Large increases in debt level given current
debt profile would increase risks of debt
distress if the exchange rate comes under
pressure. Furthermore, the Debt
Sustainability Analysis shows that adverse
shocks to growth, real interest and real
exchange rate could significantly push up
the debt level (text chart).
Fiscal policy becomes less effective at higher level of debt. A growing literature finds that fiscal
policy becomes ineffective when the debt-to-GDP ratio is high (Perotti 1999, Sutherland 1997,
Chung and Leeper 2007, Faverro and Giavazzi 2007, Corsetti et al 2012, etc). Nickel and Tudyka
2013 estimates for a group of European countries that responses of real GDP and private
investment to fiscal stimulus become negative when public debt surpasses 50 to 60 percent of
GDP. Similar results are reported in Ilzetzki, 2010 for 44 countries including 24 developing
countries, and in Kirchner et al 2010 for the euro area.
Fiscal space to absorb long-term spending pressures from pensions and health services
would be inadequate at higher level of debt. The consolidated general government budget
shows that pension deficitis 2.9 percent of GDP with spending on pensions amounting to
9.1 percent of GDP or 28.7 percent of total spending in 2014. Pension spending is expected to
steadily climb due to rapid ageing. According to the UN population projections, the share of
people aged 65+ in the population would more than double by 2050 from 12 percent in 2010 to
26 percent in 2050 (text chart). Public health spending, amounting to 4.2 percent of GDP in 2014,
would also face significant upward pressures due to ageing.
12. FYR Macedonia’s particular circumstances would warrant the following considerations
while designing numerical fiscal rules.
(i) There is a need for fiscal rule to be simple and easy to communicate to the public as FYR
Macedonia is still in the very early stage of adopting a fiscal rule.
(ii) Since FYR Macedonia has long-standing ambitions to join the EU, a combination of debt
and budget balance rules would be in line with other EU members.
(iii) Given the rapid rise in public debt, a debt ceiling would need to be complemented by a
budget balance rule to provide clear guidance to reverse the debt trajectory.
40
45
50
55
60
65
2015 2016 2017 2018 2019 2020
Baseline Real GDP Growth Shock
Real Interest Rate Shock Real Exchange Rate Shock
Sources: IMF staff estimates.
Note: The real GDP growth shock reduces growth by 1.5 percentage points
throughout the projection period; the real interest rate shock assuems a 200 bps
increase in real interest rates each year; and the real exchange rate shock
assumes REER depreciation of 10 percent.
Public debt includes debt of the general government and non-financial SOEs.
FYR Macedonia: Public Debt Trajectory under Shock Scenarios(percent of GDP)
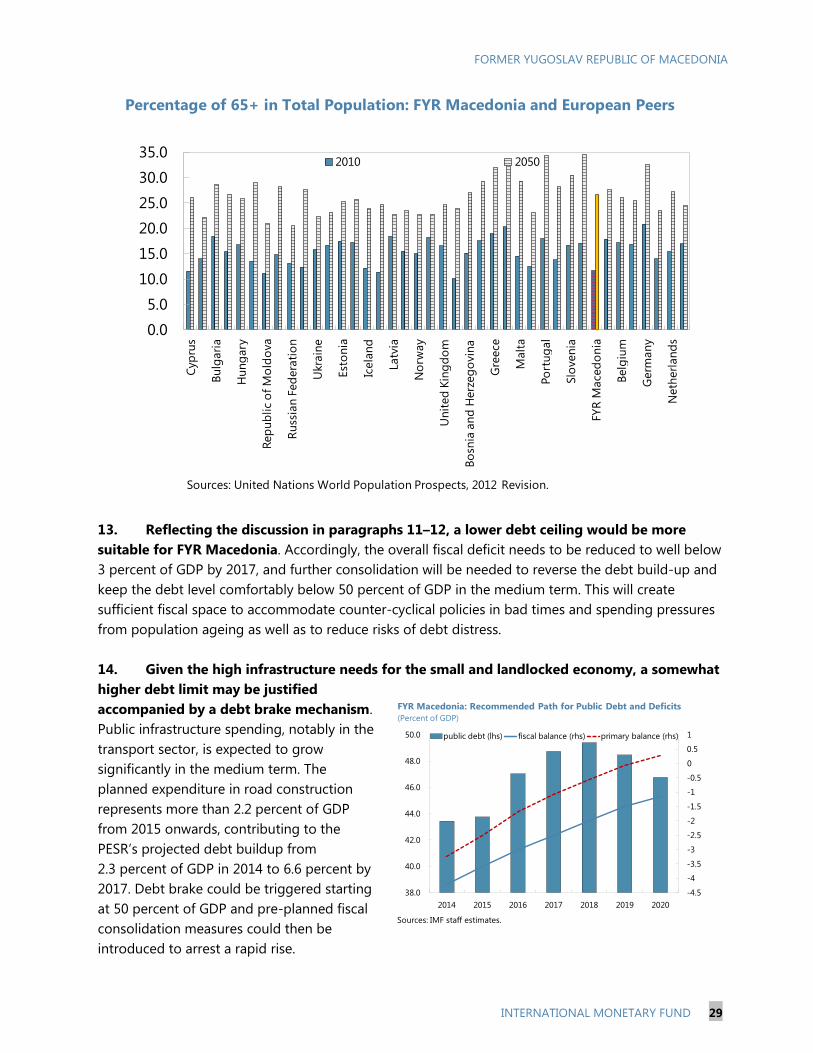
FORMER YUGOSLAV REPUBLIC OF MACEDONIA
INTERNATIONAL MONETARY FUND 29
13. Reflecting the discussion in paragraphs 11–12, a lower debt ceiling would be more
suitable for FYR Macedonia. Accordingly, the overall fiscal deficit needs to be reduced to well below
3 percent of GDP by 2017, and further consolidation will be needed to reverse the debt build-up and
keep the debt level comfortably below 50 percent of GDP in the medium term. This will create
sufficient fiscal space to accommodate counter-cyclical policies in bad times and spending pressures
from population ageing as well as to reduce risks of debt distress.
14. Given the high infrastructure needs for the small and landlocked economy, a somewhat
higher debt limit may be justified
accompanied by a debt brake mechanism.
Public infrastructure spending, notably in the
transport sector, is expected to grow
significantly in the medium term. The
planned expenditure in road construction
represents more than 2.2 percent of GDP
from 2015 onwards, contributing to the
PESR’s projected debt buildup from
2.3 percent of GDP in 2014 to 6.6 percent by
2017. Debt brake could be triggered starting
at 50 percent of GDP and pre-planned fiscal
consolidation measures could then be
introduced to arrest a rapid rise.
0.0
5.0
10.0
15.0
20.0
25.0
30.0
35.0
Cyp
rus
Bu
lgari
a
Hu
ng
ary
Rep
ub
lic o
f M
old
ova
Ru
ssia
n F
ed
era
tio
n
Ukra
ine
Est
on
ia
Icela
nd
Latv
ia
No
rway
Un
ited
Kin
gd
om
Bo
snia
an
d H
erz
eg
ovin
a
Gre
ece
Malt
a
Po
rtu
gal
Slo
ven
ia
FY
R M
aced
on
ia
Belg
ium
Germ
an
y
Neth
erl
an
ds
2010 2050
Sources: United Nations World Population Prospects, 2012 Revision.
Percentage of 65+ in Total Population: FYR Macedonia and European Peers
-4.5
-4
-3.5
-3
-2.5
-2
-1.5
-1
-0.5
0
0.5
1
38.0
40.0
42.0
44.0
46.0
48.0
50.0
2014 2015 2016 2017 2018 2019 2020
public debt (lhs) fiscal balance (rhs) primary balance (rhs)
FYR Macedonia: Recommended Path for Public Debt and Deficits
(Percent of GDP)
Sources: IMF staff estimates.
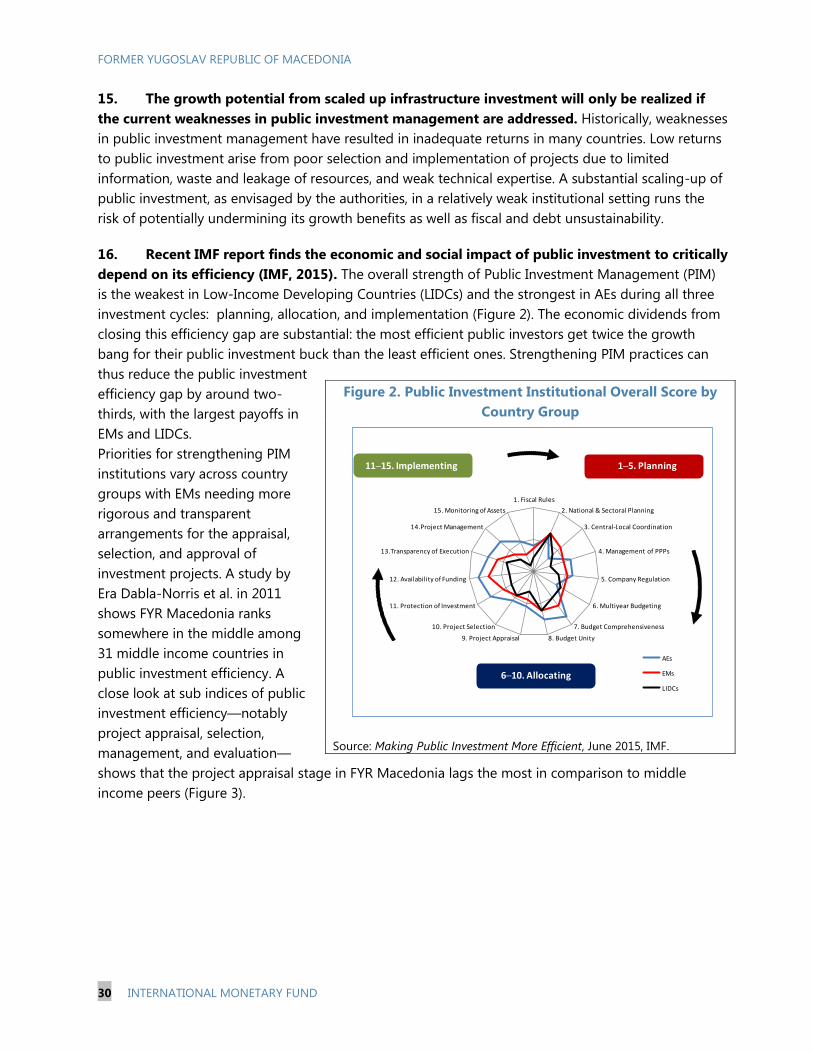
FORMER YUGOSLAV REPUBLIC OF MACEDONIA
30 INTERNATIONAL MONETARY FUND
15. The growth potential from scaled up infrastructure investment will only be realized if
the current weaknesses in public investment management are addressed. Historically, weaknesses
in public investment management have resulted in inadequate returns in many countries. Low returns
to public investment arise from poor selection and implementation of projects due to limited
information, waste and leakage of resources, and weak technical expertise. A substantial scaling-up of
public investment, as envisaged by the authorities, in a relatively weak institutional setting runs the
risk of potentially undermining its growth benefits as well as fiscal and debt unsustainability.
16. Recent IMF report finds the economic and social impact of public investment to critically
depend on its efficiency (IMF, 2015). The overall strength of Public Investment Management (PIM)
is the weakest in Low-Income Developing Countries (LIDCs) and the strongest in AEs during all three
investment cycles: planning, allocation, and implementation (Figure 2). The economic dividends from
closing this efficiency gap are substantial: the most efficient public investors get twice the growth
bang for their public investment buck than the least efficient ones. Strengthening PIM practices can
thus reduce the public investment
efficiency gap by around two-
thirds, with the largest payoffs in
EMs and LIDCs.
Priorities for strengthening PIM
institutions vary across country
groups with EMs needing more
rigorous and transparent
arrangements for the appraisal,
selection, and approval of
investment projects. A study by
Era Dabla-Norris et al. in 2011
shows FYR Macedonia ranks
somewhere in the middle among
31 middle income countries in
public investment efficiency. A
close look at sub indices of public
investment efficiency—notably
project appraisal, selection,
management, and evaluation—
shows that the project appraisal stage in FYR Macedonia lags the most in comparison to middle
income peers (Figure 3).
Figure 2. Public Investment Institutional Overall Score by
Country Group
Source: Making Public Investment More Efficient, June 2015, IMF.
1. Fiscal Rules
2. National & Sectoral Planning
3. Central-Local Coordination
4. Management of PPPs
5. Company Regulation
6. Multiyear Budgeting
7. Budget Comprehensiveness
8. Budget Unity9. Project Appraisal
10. Project Selection
11. Protection of Investment
12. Availability of Funding
13.Transparency of Execution
14.Project Management
15. Monitoring of Assets
AEs
EMs
LIDCs
11─15. Implementing 1─5. Planning
6─10. Allocating
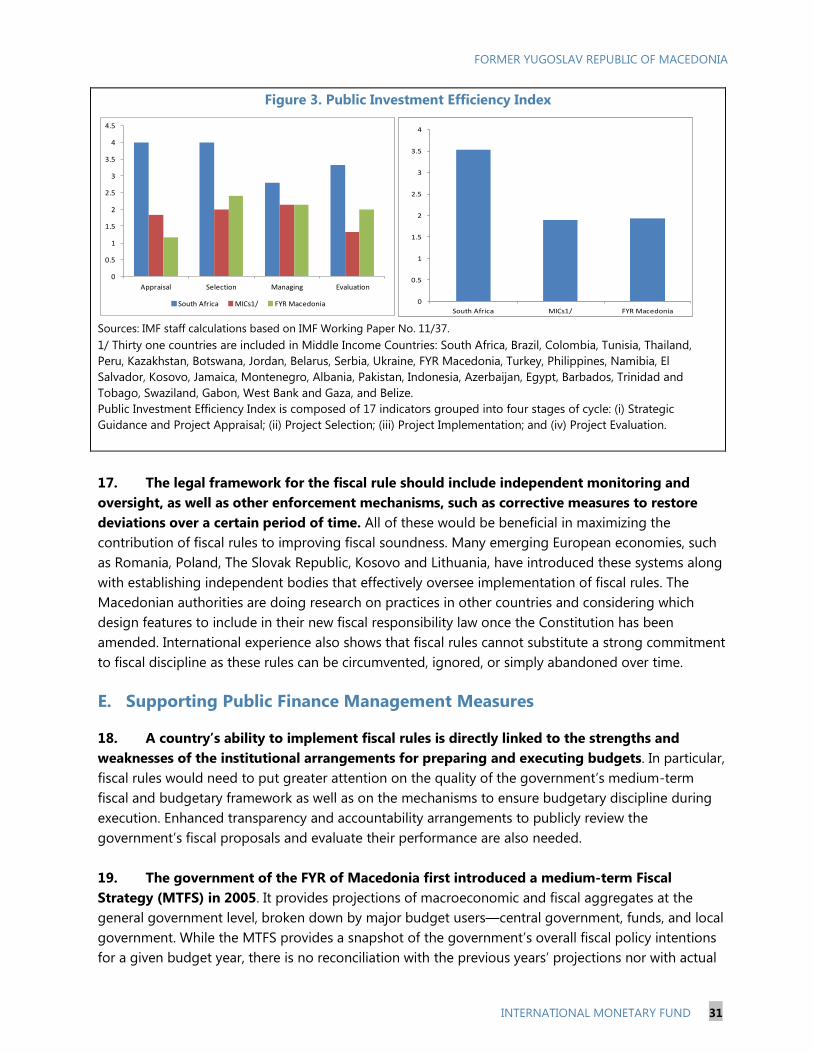
FORMER YUGOSLAV REPUBLIC OF MACEDONIA
INTERNATIONAL MONETARY FUND 31
Figure 3. Public Investment Efficiency Index
Sources: IMF staff calculations based on IMF Working Paper No. 11/37.
1/ Thirty one countries are included in Middle Income Countries: South Africa, Brazil, Colombia, Tunisia, Thailand,
Peru, Kazakhstan, Botswana, Jordan, Belarus, Serbia, Ukraine, FYR Macedonia, Turkey, Philippines, Namibia, El
Salvador, Kosovo, Jamaica, Montenegro, Albania, Pakistan, Indonesia, Azerbaijan, Egypt, Barbados, Trinidad and
Tobago, Swaziland, Gabon, West Bank and Gaza, and Belize.
Public Investment Efficiency Index is composed of 17 indicators grouped into four stages of cycle: (i) Strategic
Guidance and Project Appraisal; (ii) Project Selection; (iii) Project Implementation; and (iv) Project Evaluation.
17. The legal framework for the fiscal rule should include independent monitoring and
oversight, as well as other enforcement mechanisms, such as corrective measures to restore
deviations over a certain period of time. All of these would be beneficial in maximizing the
contribution of fiscal rules to improving fiscal soundness. Many emerging European economies, such
as Romania, Poland, The Slovak Republic, Kosovo and Lithuania, have introduced these systems along
with establishing independent bodies that effectively oversee implementation of fiscal rules. The
Macedonian authorities are doing research on practices in other countries and considering which
design features to include in their new fiscal responsibility law once the Constitution has been
amended. International experience also shows that fiscal rules cannot substitute a strong commitment
to fiscal discipline as these rules can be circumvented, ignored, or simply abandoned over time.
E. Supporting Public Finance Management Measures
18. A country’s ability to implement fiscal rules is directly linked to the strengths and
weaknesses of the institutional arrangements for preparing and executing budgets. In particular,
fiscal rules would need to put greater attention on the quality of the government’s medium-term
fiscal and budgetary framework as well as on the mechanisms to ensure budgetary discipline during
execution. Enhanced transparency and accountability arrangements to publicly review the
government’s fiscal proposals and evaluate their performance are also needed.
19. The government of the FYR of Macedonia first introduced a medium-term Fiscal
Strategy (MTFS) in 2005. It provides projections of macroeconomic and fiscal aggregates at the
general government level, broken down by major budget users—central government, funds, and local
government. While the MTFS provides a snapshot of the government’s overall fiscal policy intentions
for a given budget year, there is no reconciliation with the previous years’ projections nor with actual
0
0.5
1
1.5
2
2.5
3
3.5
4
4.5
Appraisal Selection Managing Evaluation
South Africa MICs1/ FYR Macedonia 0
0.5
1
1.5
2
2.5
3
3.5
4
South Africa MICs1/ FYR Macedonia
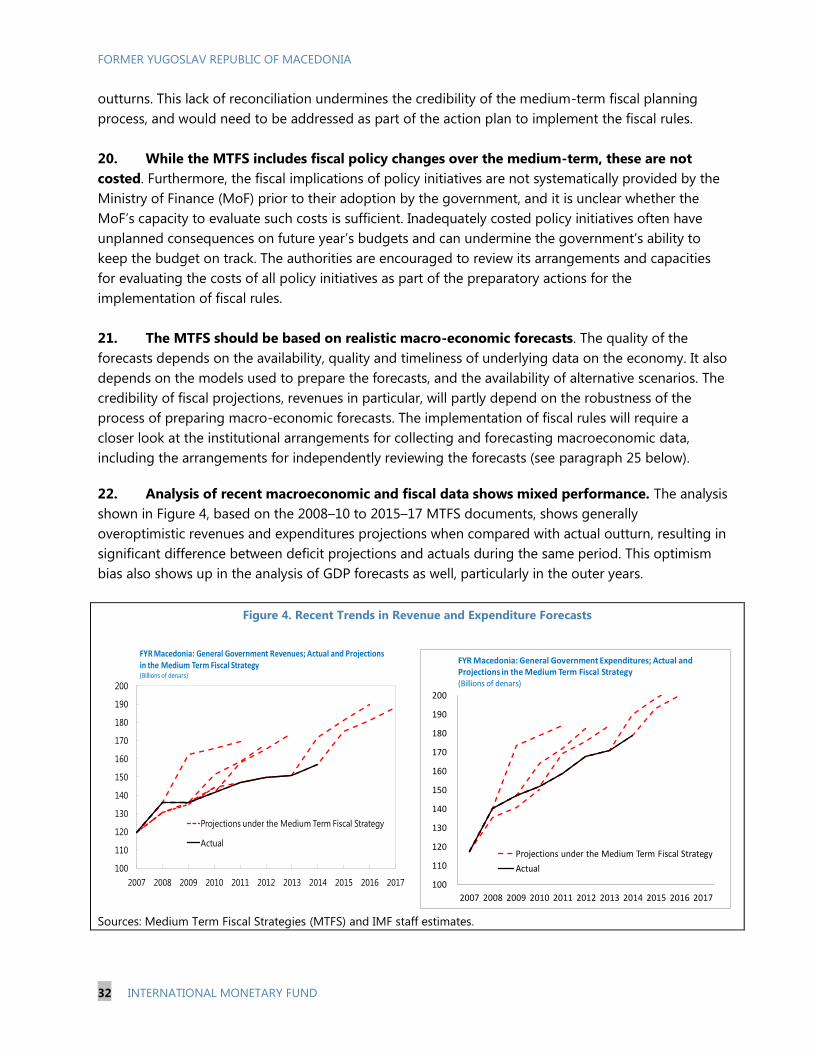
FORMER YUGOSLAV REPUBLIC OF MACEDONIA
32 INTERNATIONAL MONETARY FUND
outturns. This lack of reconciliation undermines the credibility of the medium-term fiscal planning
process, and would need to be addressed as part of the action plan to implement the fiscal rules.
20. While the MTFS includes fiscal policy changes over the medium-term, these are not
costed. Furthermore, the fiscal implications of policy initiatives are not systematically provided by the
Ministry of Finance (MoF) prior to their adoption by the government, and it is unclear whether the
MoF’s capacity to evaluate such costs is sufficient. Inadequately costed policy initiatives often have
unplanned consequences on future year’s budgets and can undermine the government’s ability to
keep the budget on track. The authorities are encouraged to review its arrangements and capacities
for evaluating the costs of all policy initiatives as part of the preparatory actions for the
implementation of fiscal rules.
21. The MTFS should be based on realistic macro-economic forecasts. The quality of the
forecasts depends on the availability, quality and timeliness of underlying data on the economy. It also
depends on the models used to prepare the forecasts, and the availability of alternative scenarios. The
credibility of fiscal projections, revenues in particular, will partly depend on the robustness of the
process of preparing macro-economic forecasts. The implementation of fiscal rules will require a
closer look at the institutional arrangements for collecting and forecasting macroeconomic data,
including the arrangements for independently reviewing the forecasts (see paragraph 25 below).
22. Analysis of recent macroeconomic and fiscal data shows mixed performance. The analysis
shown in Figure 4, based on the 2008–10 to 2015–17 MTFS documents, shows generally
overoptimistic revenues and expenditures projections when compared with actual outturn, resulting in
significant difference between deficit projections and actuals during the same period. This optimism
bias also shows up in the analysis of GDP forecasts as well, particularly in the outer years.
Figure 4. Recent Trends in Revenue and Expenditure Forecasts
Sources: Medium Term Fiscal Strategies (MTFS) and IMF staff estimates.
100
110
120
130
140
150
160
170
180
190
200
2007 2008 2009 2010 2011 2012 2013 2014 2015 2016 2017
FYR Macedonia: General Government Revenues; Actual and Projections in the Medium Term Fiscal Strategy(Billions of denars)
Projections under the Medium Term Fiscal Strategy
Actual
100
110
120
130
140
150
160
170
180
190
200
2007 2008 2009 2010 2011 2012 2013 2014 2015 2016 2017
FYR Macedonia: General Government Expenditures; Actual and Projections in the Medium Term Fiscal Strategy(Billions of denars)
Projections under the Medium Term Fiscal Strategy
Actual
FORMER YUGOSLAV REPUBLIC OF MACEDONIA
INTERNATIONAL MONETARY FUND 33
23. The MTFS does not include detailed medium-term budgetary estimates for central
government institution. Furthermore, the MTFS is often issued late in the year (September) and
therefore cannot effectively guide the budget preparation process. Despite this, the government does
issue spending limits along with its annual budget circular, although it is unclear to what degree line
ministries respect these limits in their budget submissions. The MTFS needs to be further developed
to qualify as a medium-term budgetary framework which effectively guides the budget preparation
process. In addition to the reconciliation mentioned above, these improvements include a more
detailed analysis of sectoral/ministerial budgets, separated between on-going policy and new
initiatives, identification of fiscal risks, and adoption of the MTFS by the government by midyear as
well as submission to the parliament at least for information. These improvements are also required
under the EU convergence program.
24. The current wording in the draft Constitutional amendment suggests that the deficit
rules will only apply to the central government, while the debt rules will apply to public debt,
defined as general government plus guaranteed debt of non-financial SOEs. Under the EU fiscal
framework, both rules apply to the general government, as defined in ESA2010. If possible the draft
Constitutional amendment should be changed to reflect this coverage, the alternative being to review
the regulatory arrangements for funds and local governments to ensure that they also adhere to the
fiscal rules. This is one of several aspects that will need to be included in the revisions to the public
financial management (PFM) legislation once the Constitution is amended.
25. Ensuring that budgets are executed as planned is essential to the effective
implementation of fiscal rules. This means strict expenditure controls, effective cash and debt
management, and timely and comprehensive reporting. The government’s recent record on arrears
raises questions as to the effectiveness of its expenditure controls. Addressing the underlying causes
of arrears and changing institutional behavior regarding arrears will be important measures to be
implemented prior to the adoption of the fiscal rules. In this regard, the recent improvements in
multiyear commitment controls would appear to have addressed the central government arrears
issues. Establishing proactive cash management that ensures that budget institutions are able to
spend according to their approved plans will be an important complement to the measures on arrears.
26. Finally, the credibility of medium-term budgeting based on fiscal rules depends on
effective external scrutiny. The ex-post scrutiny undertaken by the supreme audit institution is in
general focused on compliance issues, not on the evaluation of fiscal policies. For this new
institutional arrangements are required, equipped with macro economic capacities rather than
accounting ones. More and more countries are now establishing fiscal councils to perform the fiscal
policy evaluation task, both ex-ante and ex-post and consideration should be given to which model is
appropriate for FYR Macedonia. The establishment of a fiscal council will require new legislation,
which will need to be prepared and enacted prior to the implementation of the fiscal rules. However,
since the authorities are not convinced that a fiscal council would become beneficial at this time, they
could, instead consider strengthening their macroeconomic forecasting capacity by establishing an
autonomous professional institute to do the macroeconomic forecasts, following the example of other
countries in the region, notably Slovenia.
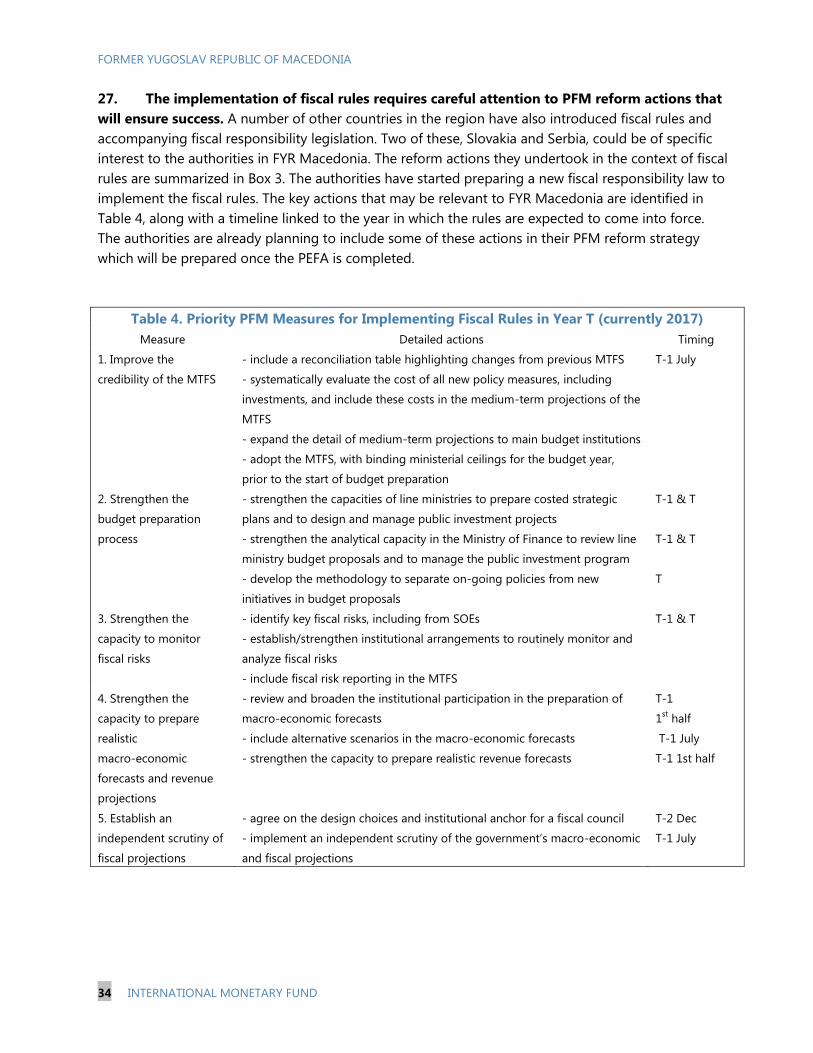
FORMER YUGOSLAV REPUBLIC OF MACEDONIA
34 INTERNATIONAL MONETARY FUND
27. The implementation of fiscal rules requires careful attention to PFM reform actions that
will ensure success. A number of other countries in the region have also introduced fiscal rules and
accompanying fiscal responsibility legislation. Two of these, Slovakia and Serbia, could be of specific
interest to the authorities in FYR Macedonia. The reform actions they undertook in the context of fiscal
rules are summarized in Box 3. The authorities have started preparing a new fiscal responsibility law to
implement the fiscal rules. The key actions that may be relevant to FYR Macedonia are identified in
Table 4, along with a timeline linked to the year in which the rules are expected to come into force.
The authorities are already planning to include some of these actions in their PFM reform strategy
which will be prepared once the PEFA is completed.
Table 4. Priority PFM Measures for Implementing Fiscal Rules in Year T (currently 2017)
Measure Detailed actions Timing
1. Improve the
credibility of the MTFS
- include a reconciliation table highlighting changes from previous MTFS
- systematically evaluate the cost of all new policy measures, including
investments, and include these costs in the medium-term projections of the
MTFS
- expand the detail of medium-term projections to main budget institutions
- adopt the MTFS, with binding ministerial ceilings for the budget year,
prior to the start of budget preparation
T-1 July
2. Strengthen the
budget preparation
process
- strengthen the capacities of line ministries to prepare costed strategic
plans and to design and manage public investment projects
- strengthen the analytical capacity in the Ministry of Finance to review line
ministry budget proposals and to manage the public investment program
- develop the methodology to separate on-going policies from new
initiatives in budget proposals
T-1 & T
T-1 & T
T
3. Strengthen the
capacity to monitor
fiscal risks
- identify key fiscal risks, including from SOEs
- establish/strengthen institutional arrangements to routinely monitor and
analyze fiscal risks
- include fiscal risk reporting in the MTFS
T-1 & T
4. Strengthen the
capacity to prepare
realistic
macro-economic
forecasts and revenue
projections
- review and broaden the institutional participation in the preparation of
macro-economic forecasts
- include alternative scenarios in the macro-economic forecasts
- strengthen the capacity to prepare realistic revenue forecasts
T-1
1st half
T-1 July
T-1 1st half
5. Establish an
independent scrutiny of
fiscal projections
- agree on the design choices and institutional anchor for a fiscal council
- implement an independent scrutiny of the government’s macro-economic
and fiscal projections
T-2 Dec
T-1 July
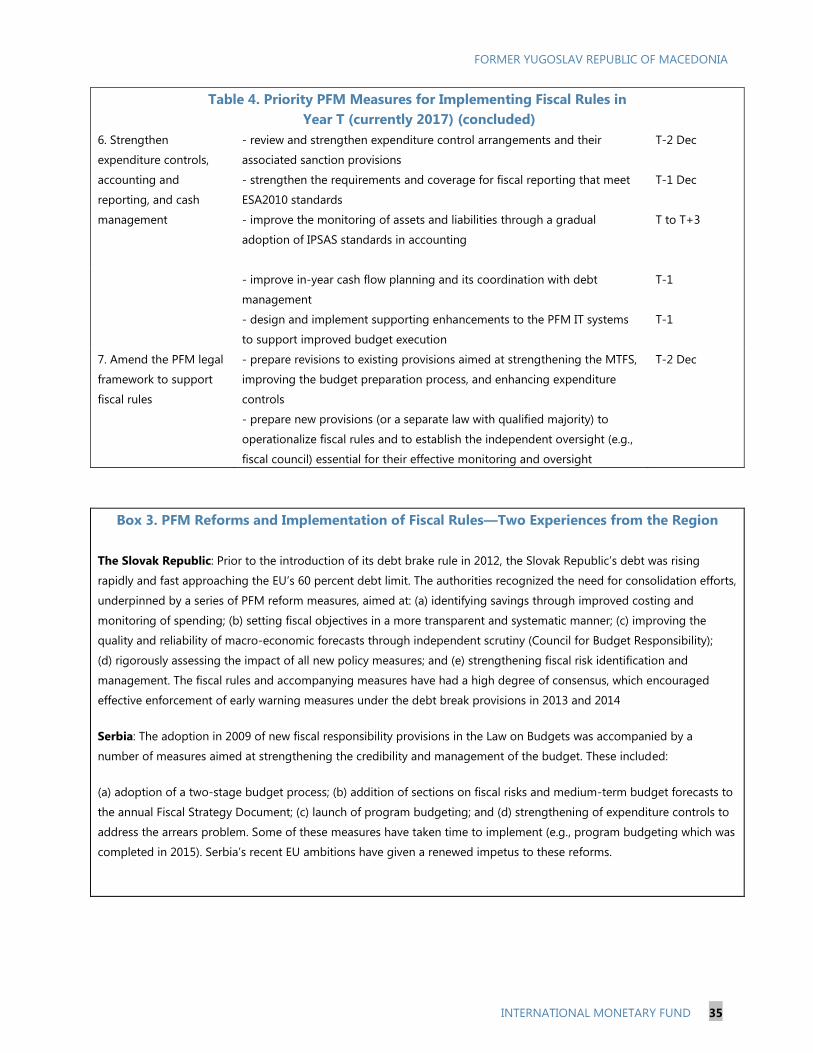
FORMER YUGOSLAV REPUBLIC OF MACEDONIA
INTERNATIONAL MONETARY FUND 35
Table 4. Priority PFM Measures for Implementing Fiscal Rules in
Year T (currently 2017) (concluded)
6. Strengthen
expenditure controls,
accounting and
reporting, and cash
management
- review and strengthen expenditure control arrangements and their
associated sanction provisions
- strengthen the requirements and coverage for fiscal reporting that meet
ESA2010 standards
- improve the monitoring of assets and liabilities through a gradual
adoption of IPSAS standards in accounting
T-2 Dec
T-1 Dec
T to T+3
- improve in-year cash flow planning and its coordination with debt
management
- design and implement supporting enhancements to the PFM IT systems
to support improved budget execution
T-1
T-1
7. Amend the PFM legal
framework to support
fiscal rules
- prepare revisions to existing provisions aimed at strengthening the MTFS,
improving the budget preparation process, and enhancing expenditure
controls
- prepare new provisions (or a separate law with qualified majority) to
operationalize fiscal rules and to establish the independent oversight (e.g.,
fiscal council) essential for their effective monitoring and oversight
T-2 Dec
Box 3. PFM Reforms and Implementation of Fiscal Rules—Two Experiences from the Region
The Slovak Republic: Prior to the introduction of its debt brake rule in 2012, the Slovak Republic’s debt was rising
rapidly and fast approaching the EU’s 60 percent debt limit. The authorities recognized the need for consolidation efforts,
underpinned by a series of PFM reform measures, aimed at: (a) identifying savings through improved costing and
monitoring of spending; (b) setting fiscal objectives in a more transparent and systematic manner; (c) improving the
quality and reliability of macro-economic forecasts through independent scrutiny (Council for Budget Responsibility);
(d) rigorously assessing the impact of all new policy measures; and (e) strengthening fiscal risk identification and
management. The fiscal rules and accompanying measures have had a high degree of consensus, which encouraged
effective enforcement of early warning measures under the debt break provisions in 2013 and 2014
Serbia: The adoption in 2009 of new fiscal responsibility provisions in the Law on Budgets was accompanied by a
number of measures aimed at strengthening the credibility and management of the budget. These included:
(a) adoption of a two-stage budget process; (b) addition of sections on fiscal risks and medium-term budget forecasts to
the annual Fiscal Strategy Document; (c) launch of program budgeting; and (d) strengthening of expenditure controls to
address the arrears problem. Some of these measures have taken time to implement (e.g., program budgeting which was
completed in 2015). Serbia’s recent EU ambitions have given a renewed impetus to these reforms.
FORMER YUGOSLAV REPUBLIC OF MACEDONIA
36 INTERNATIONAL MONETARY FUND
References
Burret Heiko T. and Jan Schnellenbach, 2014, “ Implementation of the Fiscal Compact in the Euro Area Member States”, German Council Working Paper.
Chung, Hess and Eric M. Leeper, 2007, “What Has Financed Government Debt?”, NBER Working Paper
No. 13425. Corbacho, A. and G. Schwartz, 2007, “Fiscal Responsibility Laws,” in: Ter-Minassian, T.and M. S. Kumar
(eds.), Promoting Fiscal Discipline (Washington, DC: International Monetary Fund). Dabla-Norris, Era, Jim Brumby, Annette Kyobe, Zac Mills, and Chris Papageorgiou, 2011, “ Investing in
Public Investment: An Index of Public Investment Efficiency”, IMF Working Paper. Debrun, X., L. Moulin, A. Turrini, J. Ayuso-i-Casals and M. S. Kumar, 2008, “Tied to the Mast? National
Fiscal Rules in the European Union,” Economic Policy. Debrun, X. and M. S. Kumar, 2007, “Fiscal Rules, Fiscal Councils and All That: Commitment Devices,
Signaling Tools or Smokescreens?” in: Banca d’Italia (eds.) Fiscal Policy: Current Issues and Challenges.
Deroose, S., L. Moulin, and P. Wierts, 2006, “National Expenditure Rules and Expenditure Outcomes:
Empirical Evidence for EU Member States,” Wirtschaftspolitische Blaetter. European Commission, Public Finance Report in EMU—2006, European Economy No. 3/2006,
(Brussels: European Commission). FAD and SPR, 2011, “Modernizing the Framework for Fiscal Policy and Public Debt Sustainability
Analysis”, IMF. Favero, Carlo and Francesco Giavazzi, 2007, “Debt and Effects of Fiscal Policy”, NBER Working Paper
No. 12822. International Monetary Fund, 2015, “Making Public Investment—More Efficient”, IMF Report. Ilzetzki, Ethan, Enrique G. Mendoza and Carlos A. Vegh, 2010, “How Big (Small?) Are Fiscal
Multipliers?”, NBER Working Paper No. 16479. Kirchner, Markus, Jacopo Cimadomo and Sebastian Hauptmeier, 2010, “Transmission of Government
Spending Shocks in the Euro Area: Time Variation and Driving Forces”, ECB Working Paper No. 1219.
Kopits, G., 2004, “Overview of Fiscal Policy Rules in Emerging Markets,” in: Kopits, G. (ed.) Rules-Based
Fiscal Policy in Emerging Markets. Background, Analysis, and Prospects. M. Cangiano, T. Curristine, M. Lazare, April 2013, “Public Financial Management and its Emerging
Architecture”, IMF. Nickel, Christiane and Andreas Tudyka, 2013, “Fiscal Stimulus in Times of High Debt Reconsidering
Multipliers and Twin Deficits”, ECB Working Paper. Perottie, Robert, 1999, “Fiscal Policy in Good Times and Bad”, The Quarterly Journal of Economics
114(4), 1399–1436.

FORMER YUGOSLAV REPUBLIC OF MACEDONIA
INTERNATIONAL MONETARY FUND 37
Schaechter, Andrea, Tidiane Kinda, Nina Budina, and Anke Weber, 2013, “ Fiscal Rules in Response to the Crisis-Toward the “Next-Generation” Rules. A New Dataset”, IMF Working Paper.
Sutherland, Allan, 1997, “Fiscal Crises and Aggregate Demand: Can High Public Debt Reverse the
Effects of Fiscal Policy?” Journal of Public Economics 65(2), 147–162. World Bank Group, 2014, “Country Partnership Strategy For FYR Macedonia For the period of
FY2015–FY2018”.